fort worth central city stormwater management planning · background the central city ... a...
TRANSCRIPT

1 Project Engineer. Freese and Nichols, Inc., 4055 International Plaza, Suite 200, Fort Worth, TX 76109, Phone: 817-735-7300, Fax: 817-735-7491, [email protected]
2 Project Manager. Freese and Nichols, Inc., 4055 International Plaza, Suite 200, Fort Worth, TX 76109, Phone: 817-735-7300, Fax: 817-735-7491, [email protected]
1
Fort Worth Central City Stormwater Management Planning
Scott K. Hubley, EIT, CFM 1 and Kelly D. Dillard, PE, CFM 2 ABSTRACT
The Trinity River Vision Central City project consists of constructing a bypass channel for flood control near the confluence of the West and Clear Forks of the Trinity River in downtown Fort Worth, Texas. In addition to flood control, the project is expected to have important aesthetic, ecological and economic benefits for the Trinity River and surrounding community. The project will “invite” the community back to the river and will require a significant investment in public infrastructure to support construction of the bypass channel. These improvements include new bridges and relocated utilities to support creation of a river through what is now commercial development on dry land.
The surrounding closed storm drainage system has a unique relationship to the bypass channel, creating challenges and opportunities for providing stormwater solutions during and after construction of the bypass channel. This paper will give an overview of the municipal stormwater management considerations for the closed-system storm drainage related to the bypass channel. It will also provide an in-depth look at the first phase of the project which investigated the current conditions of drainage in the area. With much of the stormwater infrastructure dating to the 1950s and earlier, the system is currently significantly undersized. Infoworks SD was utilized to prepare a fully dynamic, 2D hydraulic model to the inlet level for the entire storm drainage system. Background
The Central City study area is located at the confluence of the Clear Fork and West Fork
of the Trinity River in the heart of Fort Worth in Tarrant County, Texas. The Central City study area is bounded generally by the Fort Worth Stockyards to the North, University Drive to the West, I-30 to the South, and I-35 to the East. A vicinity map for the study area is shown in Figure 1. An overall project layout map showing the major project components is shown in Figure 2.
The Fort Worth Central City (FWCC) project is implemented by the Trinity River Vision
Authority (TRVA). The TRVA is a cooperative partnership with membership representing Tarrant Regional Water District, City of Fort Worth, Tarrant County, and Streams and Valleys, Inc. The TRVA also works cooperatively with the United States Army Corps of Engineers

(USACE) and the Texas Department of Transportation (TXDOT). The purpose of the FWCC project is summarized on the TRVA website as follows:
The public improvements of this project - sometimes referred to as the "Central
City Project" - include flood protection and related infrastructure. The U.S. Army Corps of Engineers has identified this area as "at risk" due to an aging levee system that was designed for a population of the 1960s. Technology has changed substantially since the levees were erected in the 1940s and a bypass channel is now the preferred method of urban flood control.
The flood control project is the catalyst for Trinity Uptown. Because of it, an exciting new addition to the waterfront will be a mile-and-a-half-long bypass channel running parallel to the Fort Worth & Western Railroad tracks and connecting the river west of North Main to south of White Settlement. This new bypass channel will allow the inadequate levees to come down, providing modern, efficient flood protection for the area, and making the river accessible for recreation. Numerous trails and open spaces will accompany the channel. Dam and isolation gates will allow the existing river to function as a calm, constant-level body of water that can be enjoyed year-round. The other tremendous addition is a small urban lake at the confluence of the Clear and West forks that will support a variety of boating and water activities.
Improved roads and bridges will provide access to the area; upgraded utilities will improve the existing infrastructure; and ecosystem enhancement will restore balance after decades of industrial use. (TRVA 2009)
Stormwater Management Planning
This paper documents the hydrologic and hydraulic study of the municipal storm
drainage system performed for the TRVA Fort Worth Central City (FWCC) project. This phase of the study investigated the current conditions of the drainage in the project vicinity. The next phases of the project will investigate the necessary storm drainage improvements required to support the construction of the bypass channel and bridges. The bridges currently proposed for construction prior to construction of the Bypass Channel include Henderson Street, White Settlement Road and Main Street. The construction of the bridges, channel, and gates for the Central City project is scheduled to be completed in 2020.
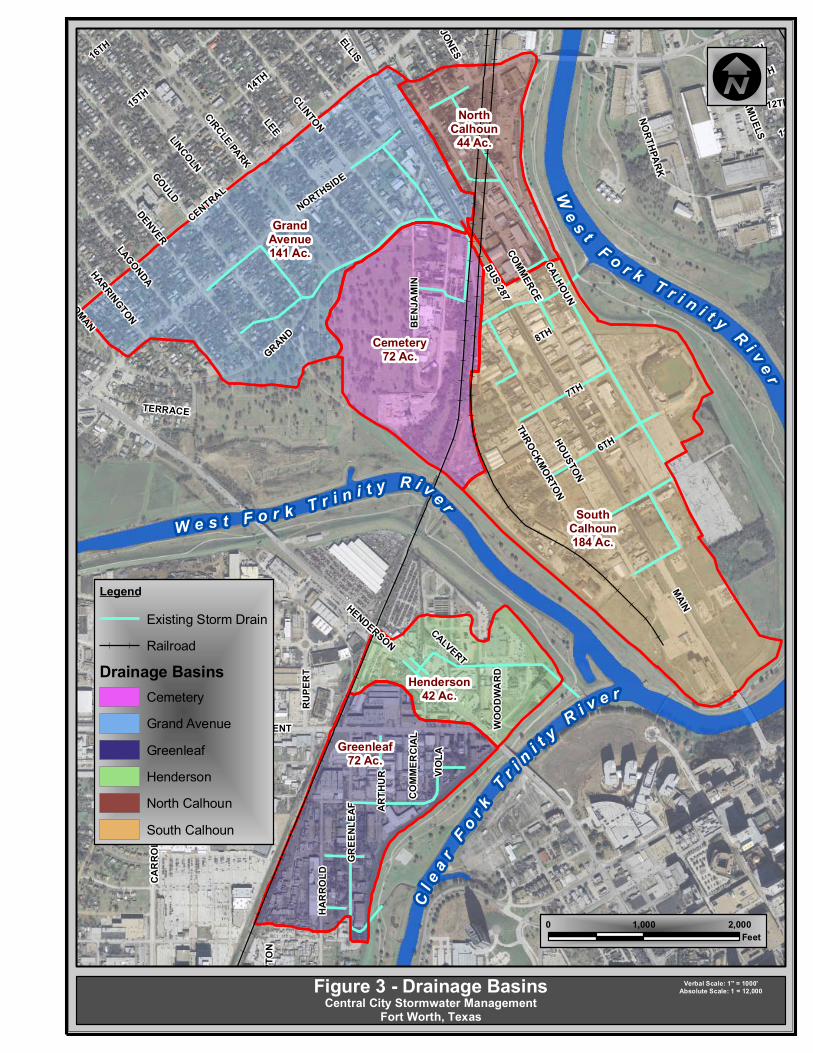
Three major storm sewer systems were identified for study during this phase: the
Greenleaf system, the Henderson system, and the North Main Street system. The North Main Street system can be further divided into the Grand Avenue system, the South Calhoun system, the North Calhoun system, and the Cemetery system. Figure 3 shows these systems and their contributing drainage areas.
Hydrologic and hydraulic modeling was performed using the software program Infoworks SD version 9.5, by Wallingford Software. The City of Fort Worth (the City) has adopted Infoworks SD as the standard modeling software for watershed studies conducted on behalf of the City. Infoworks SD is a fully dynamic simulation engine integrated with a two-dimensional (2D) engine that accurately models overland flow patterns concurrent with closed pipe hydraulics. Hydrologic computations were also performed within Infoworks SD.
2
The creation of a detailed hydrologic and hydraulic model provides the City of Fort
Worth with a valuable planning tool that will be used throughout the planning and design process to assess existing, interim and future drainage conditions in the project vicinity.
Data Sources
Multiple data sources were used to compile an accurate model of the existing storm sewer
system. Each element within the Infoworks SD model was flagged by data source to help track the model building process while also indicating a level of confidence for each element. Extensive field survey of the existing storm sewer system was performed for the project area. The field survey provided horizontal and vertical location data for all storm sewer manholes and outfalls, flowlines and opening lengths for all inlets, size and type of all storm sewer lines, and sketches and electronic photographs at the surface along the corridor of each system. In addition, detailed 1-ft aerial topography was provided to the project team members by the USACE.
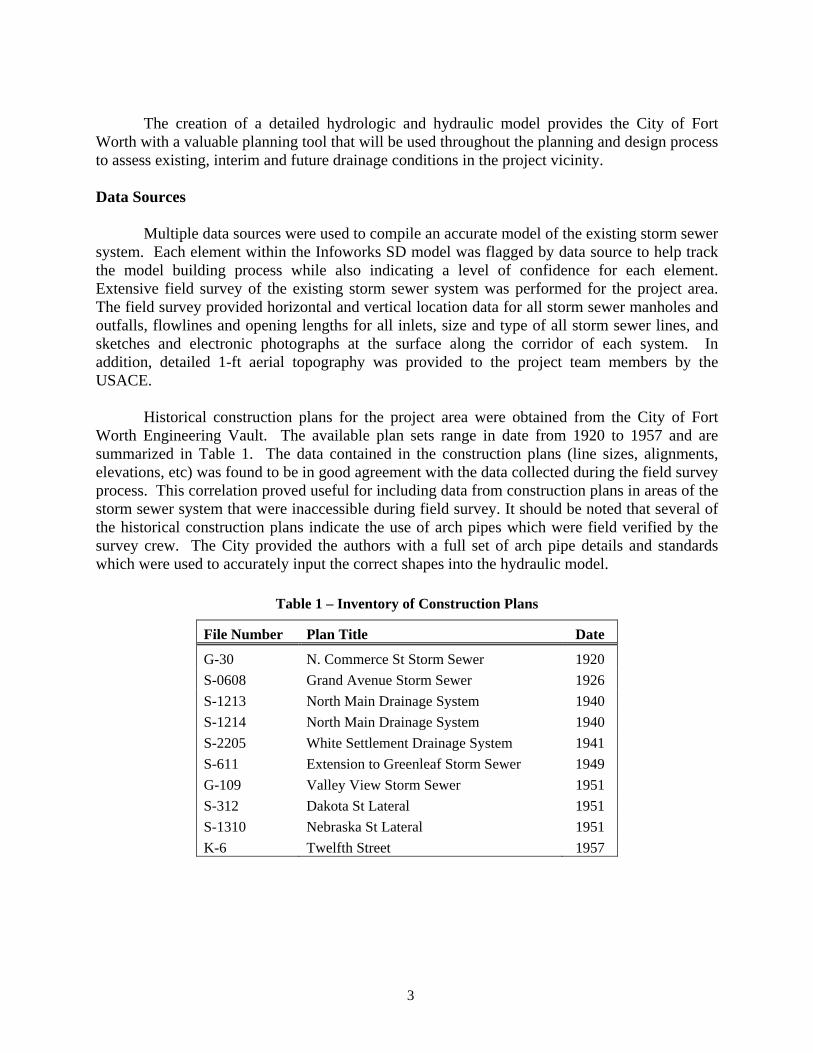
Historical construction plans for the project area were obtained from the City of Fort
Worth Engineering Vault. The available plan sets range in date from 1920 to 1957 and are summarized in Table 1. The data contained in the construction plans (line sizes, alignments, elevations, etc) was found to be in good agreement with the data collected during the field survey process. This correlation proved useful for including data from construction plans in areas of the storm sewer system that were inaccessible during field survey. It should be noted that several of the historical construction plans indicate the use of arch pipes which were field verified by the survey crew. The City provided the authors with a full set of arch pipe details and standards which were used to accurately input the correct shapes into the hydraulic model.
Table 1 – Inventory of Construction Plans
File Number Plan Title Date
G-30 N. Commerce St Storm Sewer 1920 S-0608 Grand Avenue Storm Sewer 1926 S-1213 North Main Drainage System 1940 S-1214 North Main Drainage System 1940 S-2205 White Settlement Drainage System 1941 S-611 Extension to Greenleaf Storm Sewer 1949 G-109 Valley View Storm Sewer 1951 S-312 Dakota St Lateral 1951 S-1310 Nebraska St Lateral 1951 K-6 Twelfth Street 1957
3

Hydrology
Precipitation depths were defined according to the Fort Worth Storm Water Design Manual. 24-hr synthetic design storms were calculated for the 2-, 5-, 10-, 25-, and 100-year events (50-, 20-, 10-, 4- and 1-percent probability recurrence interval storms, respectively).
Drainage areas were delineated to each inlet based on the 1-ft topography data provided
by the USACE. A total of 267 subcatchments were delineated. The total drainage areas for each major drainage system are summarized in Table 2 and shown in Figure 3. The Greenleaf and Henderson systems outfall into the Clear Fork of the Trinity River immediately upstream of the confluence with the West Fork. The North Main Street system outfalls into the West Fork of the Trinity River immediately downstream of TRWD channel dam across from the TRWD offices, approximately 2200 feet south of Northside Drive. TRWD is the official entity responsible for operation and maintenance of all facilities within the Fort Worth Floodway Project, including the municipal stormwater outfall structures (USACE 1970). The corresponding TRWD identifiers for each drainage area outfall structure are also shown in Table 2.
Table 2 – Major Drainage Systems
System TRWD Outfall No.
Drainage Area (Ac)
Greenleaf 24c 72 Henderson 25c 42 Main Street 26w 441
South Calhoun 26w 184 North Calhoun 26w 44 Grand Ave 26w 141 Cemetery 26w 72
Runoff hydrographs for each subcatchment were calculated in Infoworks SD using the
SWMM hydrologic methodology for fully-developed watershed conditions. The SWMM methodology is a routing method for determining the hydrograph shape of the runoff. The SWMM routing model consists of a non-linear reservoir but is often described as a “bucket with a hole in it.” Precipitation enters the “bucket” and exits through the “hole” over time according a modified version of the Manning’s equation. The runoff method does account for the attenuation of flow as it moves across the land surface. (Rossman 2008)
Loss calculations were performed according to SCS Curve Number Runoff method.
Composite soil curve numbers were calculated based on “Open Space, Good Condition,” and impervious values were assigned according to the City of Fort Worth developed conditions land use zoning file (GIS shapefile) provided by the City. Routing was performed by the SWMM methodology with a Manning’s n value of 0.03 for pervious areas, and 0.011 for impervious areas. The catchment width was defined as the catchment area divided by the catchment length. The catchment length was defined as the longest overland flowpath in each catchment.
4

In order to replicate the SWMM hydrology within Infoworks SD, FNI created two runoff
surfaces for the model. The first runoff surface was impervious and used a fixed runoff percentage of 100% meaning that no loss calculations were performed. This represents the SWMM assumption that impervious area is directly connected to the drainage system without incurring any initial losses. The second runoff surface was the pervious area which used curve numbers for the loss calculations and SWMM routing. The loss and transform calculations were then performed on each runoff surface and then combined to obtain a total runoff hydrograph for each subcatchment.
Hydraulics
Dynamic storm sewer and overland flow routing were performed within Infoworks SD.
A two-dimensional (2D) mesh was created from the 1-ft topographic information provided by the USACE. Building footprints are built into the mesh and are represented as voids where water is not allowed to flow. The dynamic routing allows for variation in system discharges over time to more accurately represent system discharges. Because the study area is extremely flat and experiences routine widespread flooding, 2D routing of the overland flow was considered necessary.
The hydraulic model consists of 621 nodes and 615 links. Subcatchments drain to 2D
nodes which are connected to the drainage system via weir links to represent inlets. The weirs within Infoworks SD have a “ceiling” that triggers the calculation to switch to an orifice equation when flow reaches a given elevation, which provides an accurate representation of the inlet capacity which can vary throughout the course of a storm. The 2D nodes are the connection between the 1D hydraulic model (underground pipe system) and the 2D hydraulic model (overland flow). Water is able to flow in and out of 2D nodes over time as the capacity in the underground pipe system allows.
Most of the storm drain systems in this project are located in low-lying areas on the
landward side of the Trinity River Levees. Thus, all the drainage system outfalls are located above the conservation level of the river, but below flood levels. To prevent flooding of the storm drain systems during high-flow events on the Trinity, each existing storm sewer system has an iron flapgate at the river outfall that prevents backflow from the river into the storm sewer system. These flapgates create additional headlosses in the storm sewer because of their significant weight. These headlosses were modeled within Infoworks SD with the standard flap valve network element. The headloss results for this element were reviewed and were found to be consistent with manufacturer’s recommendations for estimating headlosses.
The hydrograph-based (dynamic) storm sewer analysis, in which flow varies over time,
required consideration of a stage hydrograph each outfall location. A stage hydrograph is simply a time-varying water surface elevation at the downstream end of the system. The ideal source for a stage hydrograph for hypothetical storm events would be an unsteady hydraulic model of the channel at the storm sewer outfall location. However, such a model of the Trinity River was not available for this project at this time. To compensate, a stage hydrograph was approximated from the steady-state hydraulic model and its accompanying hydrologic model. The first step in
5

the process was to extract a rating curve for elevation versus discharge from the hydraulic model. Then, a dummy reservoir without storage was inserted into the hydrologic model at the point of interest. The rating curve from the hydraulic model was used as the outlet control for the dummy reservoir. As flows passed through the dummy reservoir, the hydrologic model matched each discharge to an elevation. The resulting pool elevation of the dummy reservoir was a good approximation of the river level over time at the point of interest.
Stage hydrographs were approximated by FNI for the 2-, 5-, 10-, and 100-year events
along the Trinity River. The 25- and 50-year events were interpolated because they were not included in the HEC-1 model. The hydrologic model was titled “Trinity River HEC-1 Model, Future Conditions – 2050 Urbanization,” dated January 2008. The hydraulic model was the HEC-RAS model of the Trinity River titled “Fort Worth Central City Project,” dated February 2008. Both models were provided by the USACE. Current Conditions Results
Hydraulic simulations were performed for the 2-, 5-, 10-, 25-, 50-, and 100-year events. These analyses indicate that the existing storm sewer system in the study area is severely undersized for current land use conditions and City of Fort Worth design criteria. This result is not unexpected given the ages of the systems analyzed (many are over 60 years old) and reported experiences of flooding during frequent rain events. Widespread flooding is expected for storms as frequent as a 2-year storm event. Inundation maps for the 2-year and 100-year storm events are shown in Figures 4 and 5, respectively. Because many of the systems experience flooding in the more frequent storms, this discussion focuses primarily on the 2-year event.
The Greenleaf basin is generally bounded by Henderson Street to the north, the Clear
Fork of the Trinity River to the east, the Fort Worth and Western Railroad (FWWRR) to the west, and 5th Street to the south. The basin is very flat with an average elevation of approximately 538’ and not more than a 5-foot variation in natural ground throughout the basin, based on the 1-foot contour data provided by USACE and confirmed by field visits. The land use is characterized by commercial and light industrial areas. The Greenleaf trunk line extends from its “fish hook” outfall in the Clear Fork of the Trinity River, north along Greenleaf Street and then extends along Kansas and Arthur Streets. Laterals along Dakota and Nebraska Streets help drain the basin. The model indicates that the trunk line performs adequately during the 2-year event. However, flooding is experienced along Viola, Austin, and Harrold Streets in the 2-year event as well as the following intersections: Greenleaf Street and Kansas Street; Arthur Street and White Settlement Road; and Kansas Street and Commercial Street. The depths of flooding range from only a few inches to nearly 1 foot on White Settlement Road.
The Henderson basin is generally bounded by Henderson Street to the south and the
FWWRR to the west and the West and Clear Forks of the Trinity River. Elevations in this basin range from 532’ to 540’. The land use is characterized by commercial and light industrial areas. The Henderson trunk line extends from its outfall in the Clear Fork of the Trinity River west along Calvert Street to Henderson Street. Flooding is experienced in the Henderson basin during the 2-year event at the low point on Henderson Street, the intersection of Woodward and Calvert,
6

as well as the low areas on the Fort Worth Police Academy property. Flooding depths range from a few inches up to 1 foot on Henderson Street.
The South Calhoun basin is generally bounded by 8th Street to the north, the FWWRR to
the northwest, and the West Fork of the Trinity River to the east, south and west. Elevations in the basin range from 530’ to 540’. The land use is characterized by commercial and light industrial areas. The South Calhoun trunk line runs north along Calhoun Street to 8th street where it joins the remainder of the North Main system before outfalling into the West Fork of the Trinity River. Laterals along 4th Street, 5th Street, 6th Street, and 7th Street serve the majority of the drainage basin. The model indicates that flooding is experienced in the 2-year event along Houston, Throckmorton, 4th, 5th, 6th, and 7th Streets as well as in the LaGrave Field parking lots. In general, the flooding is more severe in the upstream portions of this drainage system. Flooding depths range from a few inches to over 1 foot in some areas.
The North Calhoun basin is generally bounded by 8th Street to the south, the West Fork of
the Trinity River to the east, North Main Street to the west, and Northside Drive to the north. The FWWRR bisects the basin as it runs from southwest to northeast. Elevations in the basin are somewhat higher and more varied, ranging from 530’ to 558’. The land use is characterized by commercial and light industrial areas in the lower basin, but includes some residential development in the upper reaches of the basin. The North Calhoun trunk line runs south along Calhoun Street to 8th Street where it joins the remainder of the North Main system before outfalling into the West Fork of the Trinity River. The model indicates widespread flooding during the 2-year event, primarily upstream of the FWWRR. Flooding depths range from a few inches to nearly 2 feet.
The Grand Avenue system is generally bounded by Central Avenue to the north, Grand
Avenue to the south and west, and North Main Street to the east. Elevations in this basin are much higher, ranging from 538’ to 610’. The land use is characterized primarily by single family residential areas. The Grand Avenue system runs along Grand Avenue and then outfalls into an open channel adjacent to the FWWRR. It then passes through culverts under the FWWRR and enters the North Main system via an open culvert headwall. The model indicates flooding along Grand Avenue, Northside Drive, and North Houston, Lincoln, Denver, and Gould Streets. Flooding depths range from a few inches to nearly 1.5 feet in some areas in a 2-year event.
The Cemetery basin is generally bounded by the FWWRR to the east, the West Fork of
the Trinity River to the south, Grand Avenue to the north, and a natural ridge that runs through the Oakwood Cemetery to the west. Elevations in this basin range from 532’ to 574’. The land use is split between light industrial and open space (cemetery). The basin drains primarily overland, joins the Grand Avenue flow at the east edge of the basin, then passes through culverts under the FWWRR and enters the North Main system. The model indicates that flooding is experienced during the 2-year event along Benjamin and Houston Streets as well as the low areas adjacent to the FWWRR.
7

8
Future Plans
Efforts are currently underway to assess the impacts of the bridge and channel construction on the stormwater management facilities in the project area. Several of the drainage areas will be bisected by the project components which will require the construction of new storm drain lines and outfalls. It is anticipated the much of the widespread flooding will be alleviated with the construction of the project components and associated storm drainage improvements. The dynamic models will be used to determine the system-wide impact of each phase of the project as it is being constructed. Continued maintenance of the model once initial projects are in place will also allow the City to determine impacts of future improvements in the project area. Discussion and Conclusion
This paper has documented the hydrologic and hydraulic study that was performed for the municipal storm drainage system in support of the TRVA Fort Worth Central City (FWCC) project. Several data sources including extensive field survey and historical construction plans were utilized to build a hydrologic and hydraulic model of the existing drainage system. The dynamic storm sewer model begins with precipitation input and ends with hydraulic routing of stormwater runoff. Advanced two-dimensional hydraulic routing was used to model the overland flow in the project area. Results of dynamic modeling for the existing storm drain systems in the Central City area revealed aging pipes that are significantly undersized. As a result, much of the project area experiences widespread flooding in even very frequent return-event storms. It is anticipated the much of the widespread flooding will be alleviated with the construction of the project components and associated storm drainage improvements. The creation of a detailed hydrologic and hydraulic model provides the City of Fort Worth with a valuable planning tool that will be used throughout the planning and design process to assess existing, interim and future drainage conditions in the project vicinity. References Rossman, Lewis A. Storm Water Management Model User’s Manual, Version 5.0. United
States Environmental Protection Agency. 2008. TRVA. Trinity River Vision Website. www.trinityrivervision.org. Accessed February 2009. USACE. Fort Worth Floodway, Trinity River, Texas; Operation and Maintenance Manual.
United States Army Corps of Engineers, Fort Worth District. 1970. Wallingford Sofware Ltd. Infoworks SD Help Files. 2008.

West ForkTrinity River
West ForkTrinity River
Clear ForkTrinity River
GrapevineLake
LakeLewisville
BenbrookLake Joe
PoolLake
LakeWorth
LakeArlington
EagleMountainLake
ProjectArea
Figure 1 - Vicinity MapCentral City Stormwater Management
Fort Worth, Texas
I
0 10,560 21,120Feet

NORTHPAR
KGREENLEAF
FOCH
TERRACE
CALVERT
COMMERCE
BENJAMIN
CULLEN
COMMERCIAL
VIOLA
DENVER
11TH
CALHOUN
SHAMROCK
TILLAR
HOMAN
ARTHUR
14TH
LEE
12TH
10TH
GOULD
RUPERT
ADOLPH
MAIN
8TH
HARRINGTON
HOUSTON
CIRCLEPARK
6TH
7TH
ELLIS
CLINTON
CARROLL
VACEK
LAGONDA
16TH
GRAND
15TH
JONES
HENDERSON
NORTHSIDE
STAYTON
HARROLD
THROCKM
ORTON
WOODWARD
13TH
BUS287
CENTRAL
LINCOLN
SAMUELS
WHITE SETTLEMENT
WHITMORE
WEISENBERGER
14TH
Trinity PointIsolation Gate
TRWDIsolationGate
Clear ForkIsolation Gate
SamuelsAve Dam
White SettlementBridge
HendersonStreet Bridge
Main StreetBridge
BypassChannel
W e s t F o r kT r i n i
t y R i ve r
We s t F o r k
T r i ni t y
Ri ver
Cl e
arFor k
Tr ini ty
R iv er
Legend
Dam
Gates
Bridges
Bypass Channel
Figure 2 - Project Overview MapCentral City Stormwater Management
Fort Worth, Texas
I
Verbal Scale: 1" = 1500'Absolute Scale: 1 = 18,000
0 750 1,500Feet
NORTHPA
RK
GREENLEAF
FOCH
TERRACE
CALVERT
COMMERCE
BENJAMIN
CULLEN
COMMERCIAL
VIOLA
DENVER
11
CALHOUN
SHAMROCK
TILLAR
HOMAN
ARTHUR
14TH
LEE
12TH
1
GOULD
RUPERT
ADOLPH
MAIN
8TH
HARRINGTON
HOUSTO
N
CIRCLEPARK
6TH
7TH
ELLIS
CLINTON
CARROLL
VACEK
LAGONDA
16TH
GRAND
15TH
JONES
HENDERSON
NORTHSIDE
YTON
HARROLD
THROCKMORTON
WOODWARD
13TH
BUS287
CENTRAL
LINCOLN
SAMUELS
WHITE SETTLEMENT
WHITMORE
WEISENBERGER
14TH
W e s t F o r kT r i n
i t y R i v e r
Wes t
F o r kT r i n i t y
R
i ver
Cl earFor k
Tr i
n it y
R iv e r
GrandAvenue141 Ac.
Cemetery72 Ac.
Greenleaf72 Ac.
Henderson42 Ac.
SouthCalhoun184 Ac.
NorthCalhoun44 Ac.
Legend
Existing Storm Drain
Railroad
Drainage BasinsCemetery
Grand Avenue
Greenleaf
Henderson
North Calhoun
South Calhoun
Figure 3 - Drainage BasinsCentral City Stormwater Management
Fort Worth, Texas
I
Verbal Scale: 1" = 1000'Absolute Scale: 1 = 12,000
0 1,000 2,000Feet

NORTH
PARKDR
CONGRESSST
CALHOUN
ST
HOUSTO
NST
VACEK
ST
HOUSTO
NST
BENJAMINST
FOREST
PARKBLVD
JACKSBOROHWY
JONES
ST
COMMERCIALST
LAGONDAAVE
HOUSTONST
CLINTONAVE
VIOL A
ST
ARTHURS T
LINCOLNAVE
FRANKLIN ST
CIRCLEPARK
BLVD
ELLISAVE
RUPERTST
12TH ST
HARROLD
ST GREENLEAFST
AUSTINST
GRANDAVE
HOUSTONST
DENVERAVE
CALHOUN
ST
LEEAVE
8THST
CHERRYST
9THST
6THST
11TH ST
2ND ST
1STST
LEXINGTONST
WHITMORE ST
4THST
WEISENBERGER ST
3RDST
SHAMROCK AVE
CULLEN ST
TILLAR ST
THROCKM
ORTONST
MAIN
ST
14THST
PEACH ST
MILLS
ST
NORTHSIDE
DR
TAYLORST
GOULDAVE
GRANDAVE
SAMUELS
AVE
5THST
THROCKMORTON
ST
CENTRAL AVE
WOODWARDST
WHITE SETTLEMENT RD
4THST
CALVERT ST
COMMERCE
ST
PURCEYST
VALLEY
ST
BELKNAP ST
HENDERSONST
Wes t
F o r kT r i n i t y
R
i ver
W e s t F o rk T r i n
i t y Ri v e r
Cl earFor k
Tr in i
t yR iv er
Legend
Inundation DepthsDepth
< 0.5 ft
0.5 ft - 1 ft
1 ft - 2 ft
> 2 ft
I
0 600 1,200Feet
Figure 4 - 2-yr Inundation MapCentral City Stormwater Management
Fort Worth, Texas
Verbal Scale: 1" = 600'Absolute Scale: 1 = 7200

NORTH
PARKDR
CONGRESSST
CALHOUN
ST
HOUSTO
NST
VACEK
ST
HOUSTO
NST
BENJAMINST
FOREST
PARKBLVD
JACKSBOROHWY
JONES
ST
COMMERCIALST
LAGONDAAVE
HOUSTONST
CLINTONAVE
VIOL A
ST
ARTHURS T
LINCOLNAVE
FRANKLIN ST
CIRCLEPARK
BLVD
ELLISAVE
RUPERTST
12TH ST
HARROLD
ST GREENLEAFST
AUSTINST
GRANDAVE
HOUSTONST
DENVERAVE
CALHOUN
ST
LEEAVE
8THST
CHERRYST
9THST
6THST
11TH ST
2ND ST
1STST
LEXINGTONST
WHITMORE ST
4THST
WEISENBERGER ST
3RDST
SHAMROCK AVE
CULLEN ST
TILLAR ST
THROCKM
ORTONST
MAIN
ST
14THST
PEACH ST
MILLS
ST
NORTHSIDE
DR
TAYLORST
GOULDAVE
GRANDAVE
SAMUELS
AVE
5THST
THROCKMORTON
ST
CENTRAL AVE
WOODWARDST
WHITE SETTLEMENT RD
4THST
CALVERT ST
COMMERCE
ST
PURCEYST
VALLEY
ST
BELKNAP ST
HENDERSONST
Wes t
F o r kT r i n i t y
R
i ver
W e s t F o rk T r i n
i t y Ri v e r
Cl earFor k
Tr in i
t yR iv er
Legend
Inundation DepthsDepth
< 0.5 ft
0.5 ft - 1 ft
1 ft - 2 ft
> 2 ft
I
0 600 1,200Feet
Figure 5 - 100-yr Inundation MapCentral City Stormwater Management
Fort Worth, Texas
Verbal Scale: 1" = 600'Absolute Scale: 1 = 7200