fort bend county hurricane harvey impacts · hurricane harvey / fort bend county impacts ... day 1...
TRANSCRIPT
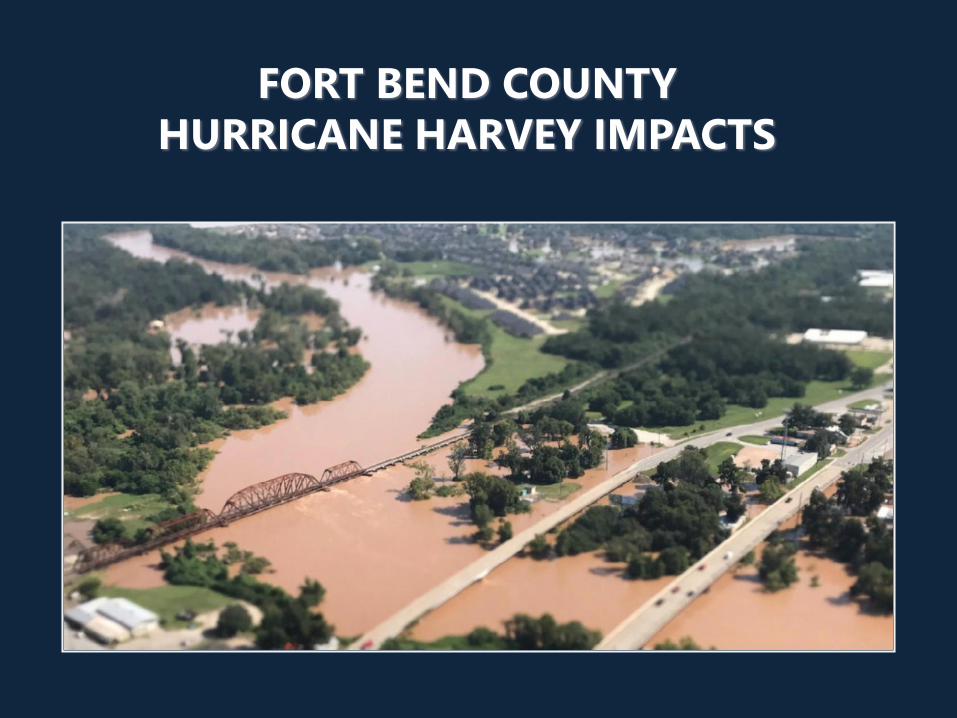
FORT BEND COUNTY
HURRICANE HARVEY IMPACTS

Hurricane Harvey / Fort Bend County Impacts
Estimated % FBC Land Area Inundated by Floodwater: 20%
Total Estimated Residents Impacted : 200,000
FBC Emergency Operations Total Phone Calls: 25,564
Total Number of Rescues : 9,945
Fatalities Reported within Fort Bend County: 3
Number of Homes Damaged: 6,824
Source: Fort Bend County Office of Emergency Management, 10/27/17

Public Transportation Impacts
Damages to Public Transportation Buildings: NONE
Damages to Public Transportation Buses: NONE
Total Number of buses/drivers staged at Peak: 80
Est. Direct Participation Rescues : 2,000
Transportation Employees with personal Damages: 31
Number of Days Activated at EOC: 8
Post Harvey Transit Ridership Trip Increase: 11%

IT’S THE SAME AND ITS DIFFERENT
Readiness NIMS/ EOC Plans (Annex S)ExercisesSituational AwarenessExperience (Go-Kit, Process)After Action Review
Planning Notification –Staff/ContractorsEquipment/Staffing IDEvent Specific ToolsEvent Action PlanDaily Action Plan
Response Deployment - Implement the PlanRespond to Situational issues
Recovery Assess Public NeedAssess Staff/Contractor NeedsImplement Recovery PlanAfter Action Review
PLANNING TOOLS
NATIONAL WEATHER SERVICE
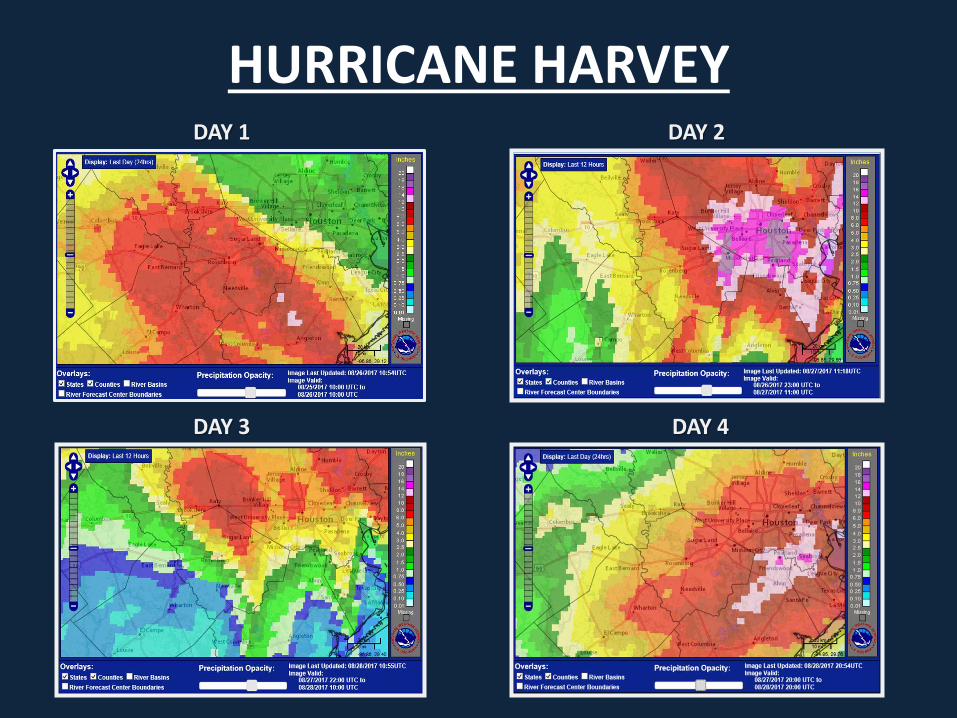
HURRICANE HARVEYDAY 1 DAY 2
DAY 3 DAY 4

HURRICANE HARVEY

PLANNING TOOLS
DRAINAGE, LEVY, ARMY CORP

Stage/Flow Measurement Locations:
FBCDD
Field
Measurements
USGS
Gage
Bryan
Hempstead
San Felipe
Richmond
Rosharon
FM1093FM1489
FM723I-69

FBCDD Field Measurements
4 Additional Bridge Locations to Supplement USGS/NWS Forecast Data
Appx. 3-Hours between Measurements
Field Measurements relayed to FBCEOC
Input into Spreadsheet and Emailed to WGRFC
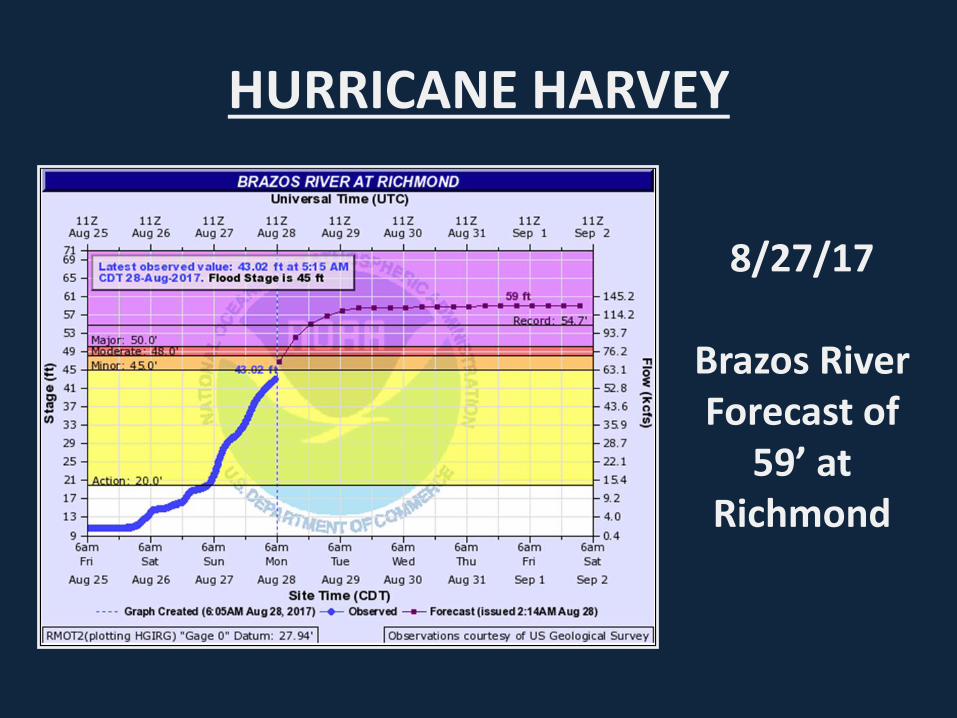
HURRICANE HARVEY
8/27/17
Brazos River Forecast of
59’ at Richmond

PLANNING TOOLS
LOCAL

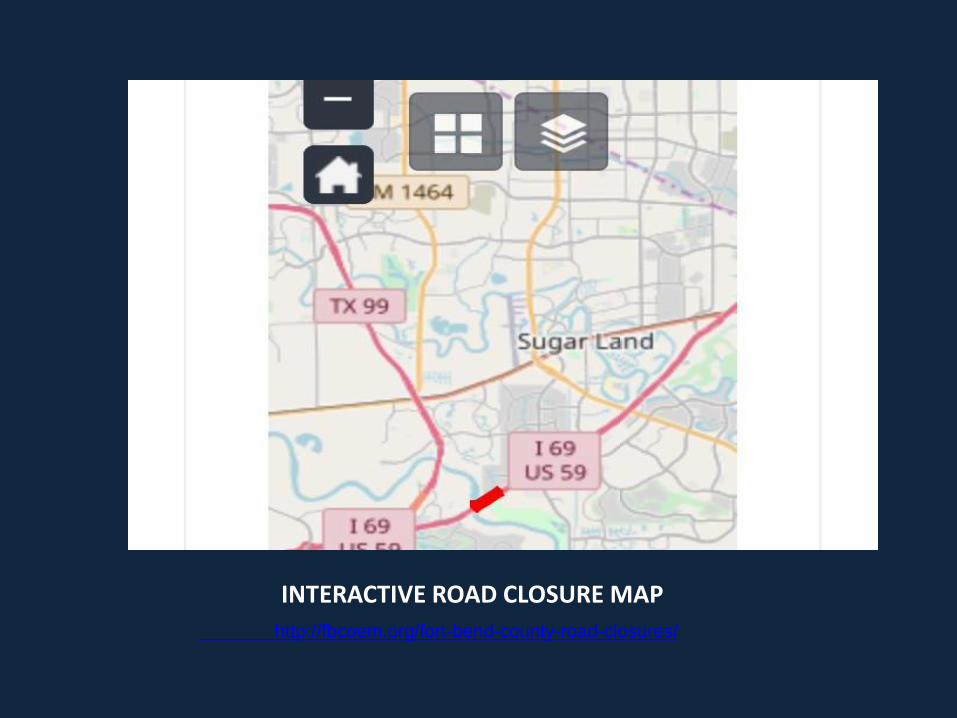
INTERACTIVE ROAD CLOSURE MAP
http://fbcoem.org/fort-bend-county-road-closures/
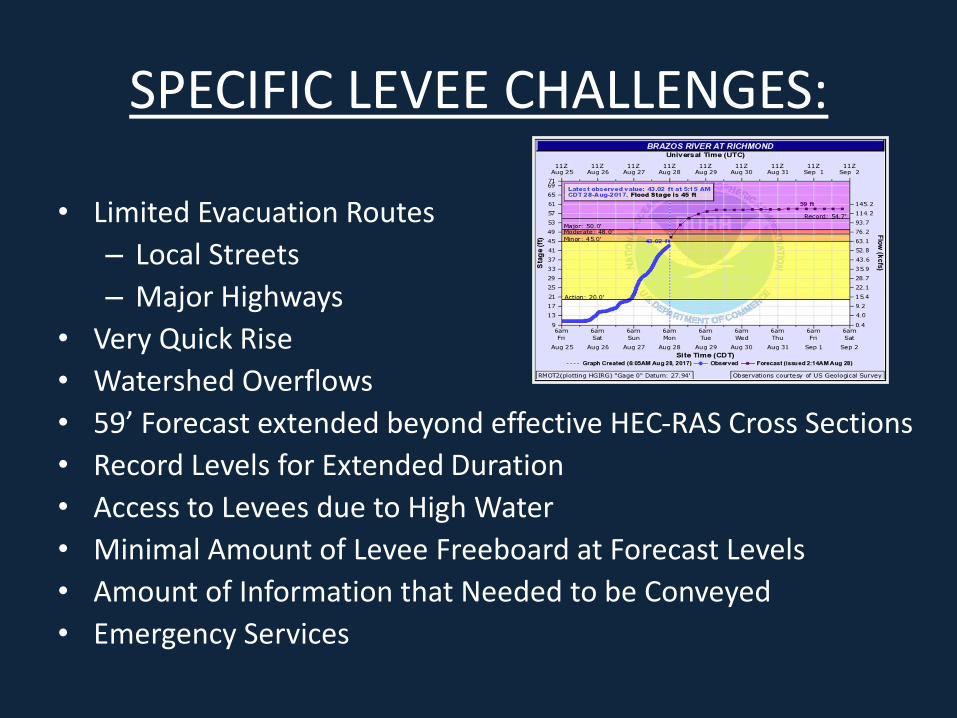
SPECIFIC LEVEE CHALLENGES:
• Limited Evacuation Routes
– Local Streets
– Major Highways
• Very Quick Rise
• Watershed Overflows
• 59’ Forecast extended beyond effective HEC-RAS Cross Sections
• Record Levels for Extended Duration
• Access to Levees due to High Water
• Minimal Amount of Levee Freeboard at Forecast Levels
• Amount of Information that Needed to be Conveyed
• Emergency Services
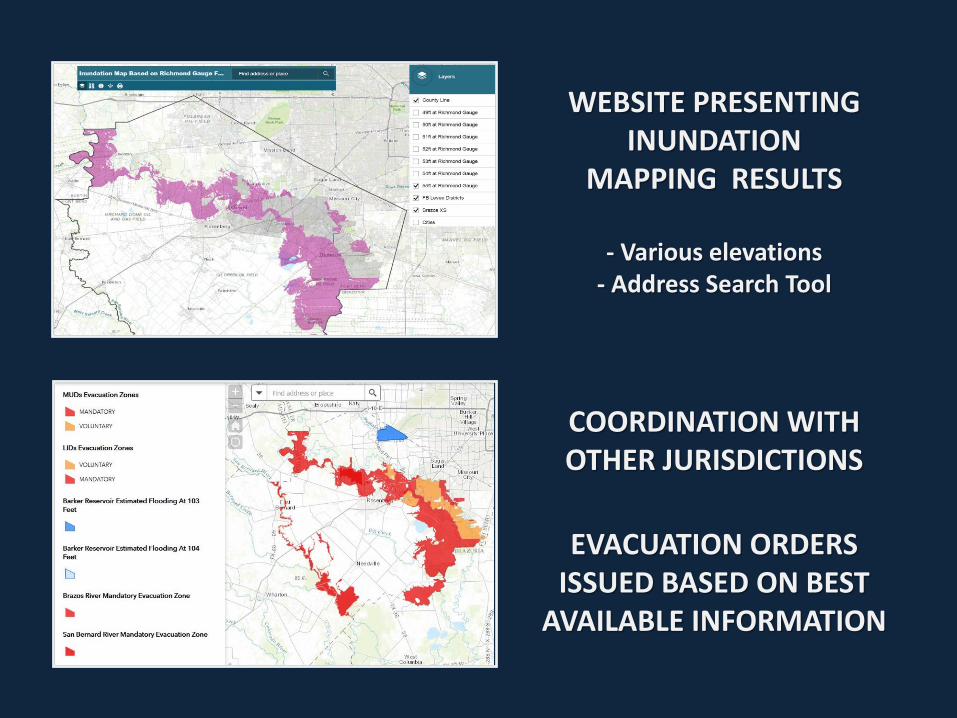
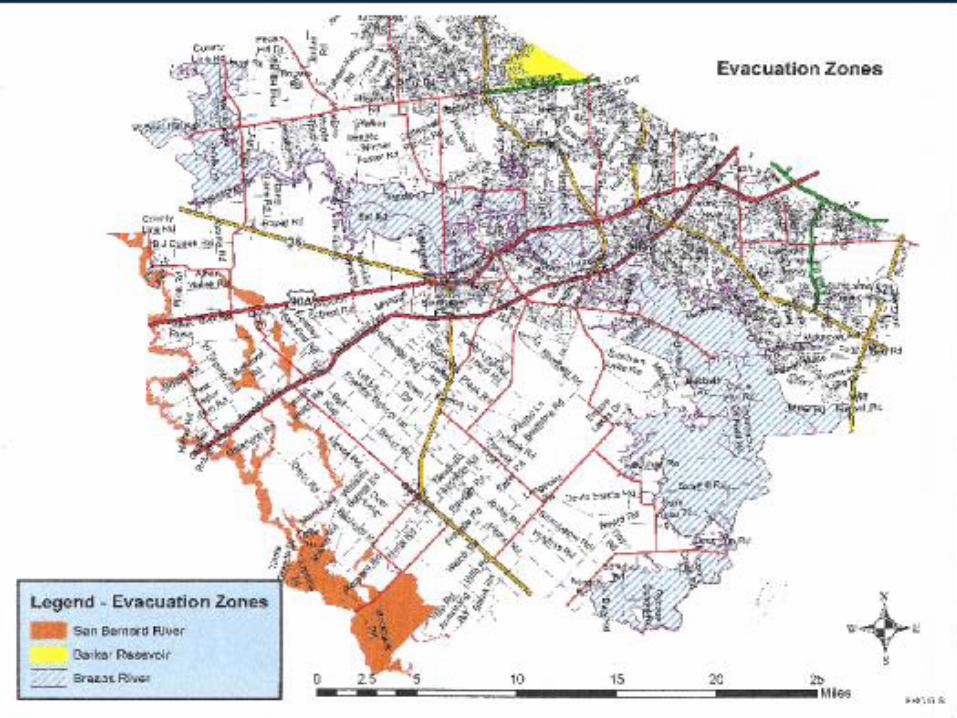
WEBSITE PRESENTING INUNDATION
MAPPING RESULTS
- Various elevations- Address Search Tool
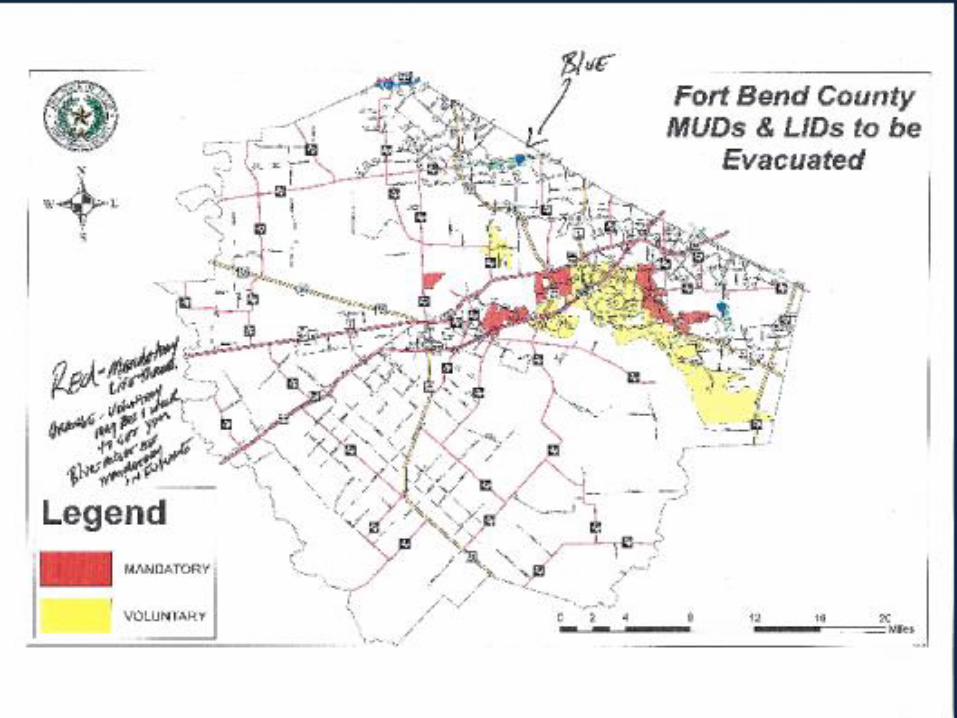
COORDINATION WITH OTHER JURISDICTIONS
EVACUATION ORDERS ISSUED BASED ON BEST
AVAILABLE INFORMATION

Brazos at RichmondPeak Elevation
55.19’ on Friday, Sept. 1st at
1:00AM
Highest Elevation since May 1915
(102 Years)
Brazos at Richmond
USGS Field Measurement Comparison
NO. Date Gage Height Flow
1053 June 1, 2016 54.64' 106000 cfs
1066 August 31, 2017 54.97' 124000 cfs

Lessons Learned:
Importance of Conveying
Information to Public
Mass Communication
Social Media
GIS – Maps
Working with Other Jurisdictions
Proactive Training/Exercises
Beforehand

“Harvey is head and shoulders above all other multi-day rain events that have ever occurred in
the continental United States”
- Texas State Climatologist John Nielsen Gammon
Total 5-day rainfall averaged over 10,000 square miles (records for entire United States)
1. 34.72″ Harvey 20172. 21.39″ Texas 18993. 20.50″ Beulah 19674. 18.37″ Louisiana 19405. 18.06″ Texas 1994
After all damage totals come in Hurricane Harvey is expected to be 1st or 2nd
costliest natural disaster in United States history.