formulating pricing and loss allocation methodology for ... - puneet chitkara - cercs...formulating...
TRANSCRIPT

Formulating Pricing and Loss Allocation Methodology for
Inter-State Transmission in India
Department of Industrial and Management EngineeringIndian Institute of Technology Kanpur
3rd Capacity Building Programme for Officers of Electricity Regulatory Commissions
23 – 28 August, 2010
Forum of Regulators
Puneet ChitkaraMercados, EMI
CONTENTS
? Background – Need for Change in Transmission Pricing Framework in India
? Process Adopted and Initial Approach Paper ? Comments received from Stakeholders? Final Methodology Proposed? Results for 2008-09 and 2011-12? Benefits of the proposed methodology for the principal
stakeholders ? Regulations proposed? Implementation Mechanisms and Transition process

BACKGROUND – THE NEED FOR CHANGE
Need for Change
? Evolution of the Indian Grid – No longer an agglomeration of “Regional Grids”
? Evolution of Markets – Need for a pricing mechanism that facilitates open access and competition and yet reflects the tru e cost of resources utilized

Transmission System Development in India
Source: Empowering India through integrated grid operation: A Case Study, Narsimhan, Vyas and Chandra, Available: http://www.nrldc.org/docs/EmpoweringIndiathroughIntegratedGridOperation-SRN.pdf
The Power System in India is therefore no more a loose agglomeration of Regional Networks – It is a National Integrated Network and needs a transmission pricing mechanism which matches the technical developments and facilitates unfettered and seamless trade across the nation on the national transmission network.
Transmission System Development in India …(2)
? Electricity grids in India were developed on the concept of Regional self sufficiency
? The regional grids in mid 1980s had limited power interchanges at interregional level in radial mode
? In 2002 the interconnection between East and North was done through radial operation of 400 kV double circuit Biharshariff –Sarnath line.
? The east and the west systems were synchronized in 2003 with the help of 400 kV double circuit Raipur – Rourkela and 220 kV triple circuits of Budhipadar – Korba.
? Inter-regional HVDC back-to back links at Gazuwaka (East and South) and Pusauli (East and North) were commissioned which provided asynchronous interconnection between the regional grids.
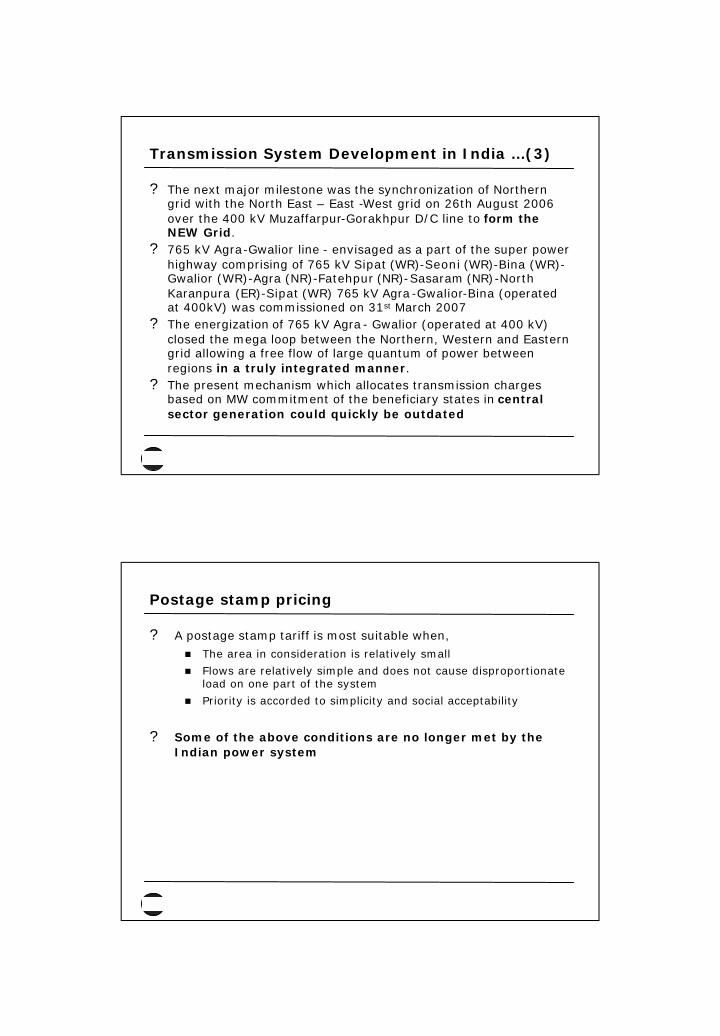
Transmission System Development in India …(3)
? The next major milestone was the synchronization of Northern grid with the North East – East -West grid on 26th August 2006 over the 400 kV Muzaffarpur-Gorakhpur D/C line to form the NEW Grid.
? 765 kV Agra-Gwalior line - envisaged as a part of the super power highway comprising of 765 kV Sipat (WR)-Seoni (WR)-Bina (WR)-Gwalior (WR)-Agra (NR)-Fatehpur (NR)-Sasaram (NR)-North Karanpura (ER)-Sipat (WR) 765 kV Agra -Gwalior-Bina (operated at 400kV) was commissioned on 31st March 2007
? The energization of 765 kV Agra - Gwalior (operated at 400 kV) closed the mega loop between the Northern, Western and Eastern grid allowing a free flow of large quantum of power between regions in a truly integrated manner.
? The present mechanism which allocates transmission charges based on MW commitment of the beneficiary states in central sector generation could quickly be outdated
Postage stamp pricing
? A postage stamp tariff is most suitable when,n The area in consideration is relatively small
n Flows are relatively simple and does not cause disproportionate load on one part of the system
n Priority is accorded to simplicity and social acceptability
? Some of the above conditions are no longer met by the Indian power system

Performance of Existing Transmission Pricing Mechanisms on “integrated grid”– An Example
Loss 4%
Exporting Region-
NER
Loss 4%
Importing Region - NR Pooling stn.
TC=33.71
Loss 4%
400 km ~ 20 ps/kwh.Loss2%
Rs. 3 per kwh
Intermediate Region - ER
TC=19.85
De - Pooling stn.TC=20.10
100 km ~ 10 ps/kwh.Loss2%
• Cost of delivery – Cost at Generator Terminals – 300 ps/kwh– Transmission costs to load centre – 103 ps/kwh– Cost of losses – 53.06 ps/kwh– Final costs – 456.06 ps/kwh
• In an integrated grid, these prices do not reflect the cost ofresources utilized – power flows through displacement
• Postage Stamp mechanism makes NER power uncompetitivefor sale in NR by artificially increasing the transmissioncharges
• Hence the need to ensure a fairer allocation
Some of the issues go beyond the pancaking of thenetworks
1. A deeper network ensures greater reliability and lower reserves – many users benefit. Why should the costs be allocatedexclusively to direct users?
2. In a large region, the usage is not uniform. UP is verydifferently placed from Punjab
3. It is not just a matter of inter-regional lines. Regional lines andeven state lines are a part of the meshed network
4. The power market demands some flexibility of destination. Pricing and contract structures need to permit this
5. Free rider problem with ST transactions unless rules are amended
6. New capacity creation and effective congestion management isimpaired by the present framework

FINAL METHODOLOGY ADOPTED
Hybrid Method
Rationale for each step is explained in the following slides …

Development of the Full Grid for each Network Condition
? The transmission assets are used differently by various transmission customers based on seasons of the year and by time of use
? Utilization by each transmission customer, therefore, must be captured for each season as well as peak and other than peak condition
? The Base Data for 2008-09 was taken from actual EMS data available from the NLDC for the various network conditions
? For 2011-12 the network data was finalised by the CTU
Network Truncation …(1)
? The mandate was to allocate ARR of the transmission assets owned by ISTS licensees
? Consideration of assets owned only by the ISTS licensees leads to formation of Islands in the network
? Connection of these islands through selected lines for the purposes of load flow convergence has commercial implications for various stakeholders – therefore a need for a consistent policy in this regard. Two options:n Consider the entire networkn Consider the network where most of the assets are owned by ISTS
licensees – i.e. consider 765 kV and 400 kV transmission system (except for NER where assets of 132 kV are considered) – because at these voltage levels most of the assets are owned by the ISTSlicensees
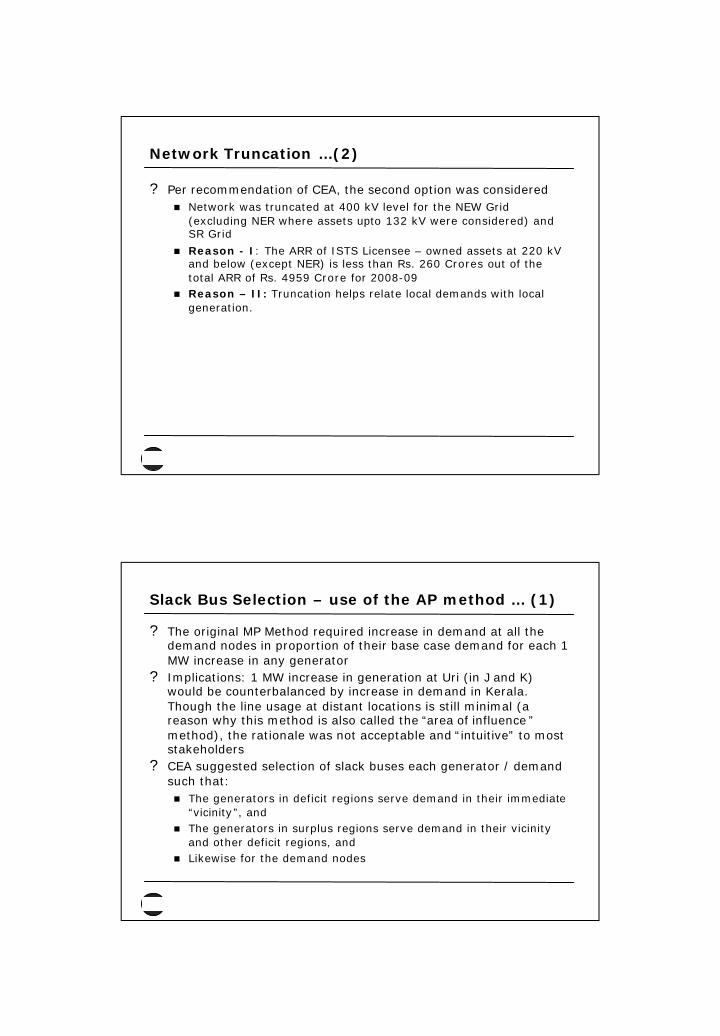
Network Truncation …(2)
? Per recommendation of CEA, the second option was consideredn Network was truncated at 400 kV level for the NEW Grid
(excluding NER where assets upto 132 kV were considered) and SR Grid
n Reason - I: The ARR of ISTS Licensee – owned assets at 220 kV and below (except NER) is less than Rs. 260 Crores out of the total ARR of Rs. 4959 Crore for 2008-09
n Reason – II: Truncation helps relate local demands with local generation.
Slack Bus Selection – use of the AP method … (1)
? The original MP Method required increase in demand at all the demand nodes in proportion of their base case demand for each 1 MW increase in any generator
? Implications: 1 MW increase in generation at Uri (in J and K) would be counterbalanced by increase in demand in Kerala. Though the line usage at distant locations is still minimal (a reason why this method is also called the “area of influence ”method), the rationale was not acceptable and “intuitive” to most stakeholders
? CEA suggested selection of slack buses each generator / demand such that:n The generators in deficit regions serve demand in their immediate
“vicinity”, andn The generators in surplus regions serve demand in their vicinity
and other deficit regions, and n Likewise for the demand nodes

Slack Bus Selection – use of the AP method … (2)
? AP Method selects sink buses for each generator based on the principle of proportionate tracing, e.g. for TAPS (in Maharashtra, which is a net importing state, but this plant also supplies to Gujarat), the slack buses aren VAPI, KALWA, KHARGAR (3% weight), LONI, KARAD (0.5%
weight), BABLESHWAR, PADGHE, KOLHAPUR, AURANGABAD, MAPUSA (0.2% weight), BOISAR (44.5%), NAGOTHANE
n These sub-stations can be correlated with the physical network for better appreciation
Slack Bus Selection – use of the AP method … (3)
? Similarly, for Generators such as Singrauli (NTPC), the slack buses for Summer Peak are spread far and wide, n e.g., FATEHABAD, DEHAR,BHIWANI, HISAR, KISHENPUR, MOGA,
PANIPAT, BAWANA, BAMNOLI, MERTA, KANKROLI,HERAPURA, JODHPUR, AGRAUP, UNNAO, BARELI, RISHIKESH, GORAKHPUR, LUCKNOW, MURADABAD, MUZAFARNAGAR, MURADNAGAR, KASHIPUR, ANPARA, OBRA, SARNATH, AZAMGARH, SULTANPUR, MAU, WAGORA, ABDULAPUR, NALAGARH, KAITHAL, MEERUT, AMRITSAR, LUDHIANA, JALANDHAR, BALABGARH, BHIWADI, MALERKOTLA, MAHARANIBAGH, BASSI, BAHADURGARH, MANDOLA, GNOIDA, PATIALA, MANPURI,ALAHABAD
? It may be appreciated that the slack buses for Singrauli in Monsoon Peak Condition do not extend to Abdullapur, Nalagarh, Dehar etc. because in this season, Himachal Pradesh is a surplus and exporting state

MP Method for line utilization and charging …(1)
? Why not AP Method for line Utilization and Charging also?n AP Method traces power from source to sink. However when
power is injected at a node, lines (other than those on the tracing path) also get affected – which are not captured by the AP method
n The MP method closely mirrors the laws of physics. According to ETSO:w The AP method is based on an arbitrary assumption that contradicts the
laws of physics. AP is based on the arbitrary assumption that the power flow arriving at one node must be shared between the local load and the exiting flows in the other lines at that node. Moreover, AP assumes that the sharing is in proportion of local loads and exiting flows. This assumption is not physical: many other solutions are possible and would lead to different responsibilities of generators and loads and to different compensations. In particular, according to physical laws, an increment in the flow in a line entering one node would be distributed among all other lines at that node and not only those with exiting flows.
n MP has been implemented in various countries, experience with AP is significantly lesser
MP Method for line utilization and charging …(2)
? AP Method allocates transmission charges to either generators ordemand nodes – allocation between generators and demands is decided exogenously and is hence arbitrary and distorts locationalsignal
? The only significant criticism of the MP method – regarding selection of slack bus – is taken care of by exploiting the strength of the AP method

Creation of Zones
? The nodal allocators have been “zoned” in consultation with CEA for 2008-09. Criteria used:n Geographical contiguityn State Boundaries for large states (charges for small states have
been aggregated or combined with neighbouring states)n Electrical contiguity
? For the current network, NEW Grid and SR charges have been computed separately
? Costs and losses apportioned separately? For the 2011-12 network the results have been derived in
conjunction with the CTU
RESULTS OF 2008-09 and 2011-12

Results of the Hybrid Method for 2008-09 and 2011-12 – Generation Access Charges – NEW Grid
2011-12 2008-09
ZonesRs Lakh / MW / Annum Ps/kWh
Rs Lakh / MW / Annum Ps/kWh
Bhutan 10.31 11.77 12.56 14.34Bihar-KH 9.84 11.23 13.06 14.91CHTIS-KOR 7.64 8.72 10.15 11.59CHTIS-OTHER 10.41 11.88 12.97 14.81Delhi, HR, Raj, UP-W 2.09 2.38 2.98 3.40GUJ 3.63 4.15 4.25 4.85HP-CHM 5.06 5.78 10.77 12.30HP-DH 4.49 5.12 4.89 5.58HP-NJB 8.51 9.72 13.87 15.83JandK 4.78 5.46 6.88 7.85
Results of the Hybrid Method for 2008-09 and 2011-12 – Generation Access Charges – NEW Grid
2011-12 2008-09
ZonesRs Lakh / MW / Annum Ps/kWh
Rs Lakh / MW / Annum Ps/kWh
Jharkhand 8.66 9.88 15.51 17.70Maha 2.65 3.02 2.90 3.32MP 7.70 8.79 9.45 10.79NER 7.18 8.19 8.25 9.42
Orissa-STR 9.01 10.29ORISSA 3.74 4.27 4.85 5.54Sikkim 15.14 17.28 17.75 20.27UK 4.78 5.46 5.92 6.76UP-E&C 6.72 7.67 8.71 9.95UP-W 1.67 1.91 2.98 3.40WB-BFP 6.71 7.66 8.72 9.95

Results of the Hybrid Method for 2008-09 and 2011-12 – Generation Access Charges – SR Grid
2011-12 2008-09Rs Lakh / MW / Annum Ps / kWh
Rs Lakh / MW / Annum Ps / kWh
AP - OTHER Total 1.69 1.93 2.80 3.20
AP E&C Total 3.43 3.91 7.93 9.05KAR - OTHER Total 3.76 4.29 4.40 5.03
KAR-KTB Total 3.76 4.29 7.27 8.30
TN-N Total 1.43 1.64 3.79 4.32
TN-S Total 4.54 5.19 10.84 12.38
Kerala 2.99 3.41 7.32 8.35
Results of the Hybrid Method for 2008-09 and 2011-12 – Demand Access Charges – NEW Grid
2011-12 2008-09
ZoneRs Lakh / MW / Annum Ps / kWh Rs Lakh / MW Ps/kWh
Bihar 6.63 7.57 8.84 10.09
Chattisgarh 3.50 4.00 4.39 5.01
Delhi 5.87 6.70 10.20 11.65
Goa 10.50 11.98 8.37 9.56
Gujarat 5.60 6.39 6.98 7.97
Haryana 5.75 6.56 11.80 13.47Himachal Pradesh 4.41 5.03 8.13 9.28
JandK 5.46 6.23 13.75 15.70
Jharkhand 4.23 4.83 7.69 8.77

Results of the Hybrid Method for 2008-09 and 2011-12 – Demand Access Charges – NEW Grid
2011-12 2008-09
ZoneRs Lakh / MW / Annum Ps / kWh Rs Lakh / MW Ps/kWh
Maharashtra 4.87 5.56 6.75 7.71Madhya Pradesh 8.47 9.67 11.55 13.19
NER 14.36 16.39 12.85 14.67
Orissa 5.16 5.89 3.78 4.32
Punjab 11.06 12.62 16.81 19.19
Rajasthan 9.98 11.39 9.65 11.02
Uttarakhand 5.98 6.83 7.39 8.43
Uttar Pradesh 5.63 6.42 7.43 8.49
West Bengal 2.19 2.51 3.24 3.69
Results of the Hybrid Method for 2008-09 and 2011-12 – Demand Access Charges – SR Grid
2011-12 2008-09Rs Lakh / MW / Annum Ps / kWh
Rs Lakh / MW / Annum Ps / kWh
Andhra Pradesh 4.81 5.49 8.54 9.75
Karnataka 5.67 6.47 8.23 9.4
Kerala 7.89 9.00 15.78 18.02
Tamil Nadu 4.33 4.94 13.15 15.01
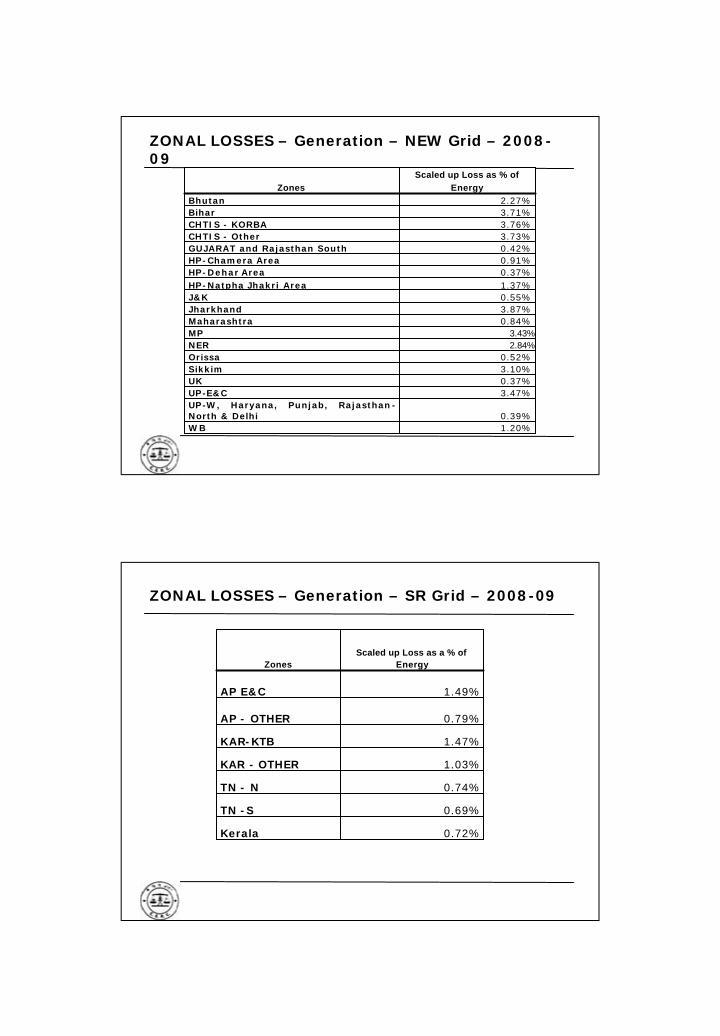
ZONAL LOSSES – Generation – NEW Grid – 2008-09
ZonesScaled up Loss as % of
EnergyBhutan 2.27%Bihar 3.71%CHTIS - KORBA 3.76%CHTIS - Other 3.73%GUJARAT and Rajasthan South 0.42%HP-Chamera Area 0.91%HP-Dehar Area 0.37%HP-Natpha Jhakri Area 1.37%J&K 0.55%Jharkhand 3.87%Maharashtra 0.84%MP 3.43%NER 2.84%Orissa 0.52%Sikkim 3.10%UK 0.37%UP-E&C 3.47%UP-W, Haryana, Punjab, Rajasthan-North & Delhi 0.39%WB 1.20%
ZONAL LOSSES – Generation – SR Grid – 2008-09
ZonesScaled up Loss as a % of
Energy
AP E&C 1.49%
AP - OTHER 0.79%
KAR-KTB 1.47%
KAR - OTHER 1.03%
TN - N 0.74%
TN -S 0.69%
Kerala 0.72%

ZONAL LOSSES - Demand – NEW Grid – 2008-09
States Loss as a % of energyBhutan 0.28%Bihar 1.68%Chattisgarh 1.56%Delhi 4.11%Goa 1.03%Guj 1.60%Haryana 3.71%HP 1.16%JandK 2.62%Jharkhand 1.34%Maha 2.00%MP 3.53%NER 2.72%Orissa 0.63%Punjab 4.15%Rajasthan 3.12%UK 5.47%UP 3.19%West Bengal and Sikkim 0.46%
ZONAL LOSSES – Demand – SR Grid – 2008-09`
Zones Loss as a % of Energy
Andhra Pradesh 2.04%
Karnataka 1.33%
Kerala 6.81%
Tamil Nadu 5.30%

Generation Access Charges – NEW Grid – Some Specific Observations
? Transmission System associated with Naptha Jhakri gets utilized better because of New Generation at Karcham Wangto – results in lower charges per MW in that Zone
? Transmission Charges in J and K decline because of better utilization of the ATS of Uri, where Uri-II is added
? More than 2000 MW is added in Jharkhand at Maithan and Kodarma – which results is lower transmission charges
? A new zone for Sterlite power plant had to be created in 2011-12 because this plant is expected to supply outside through the ATSbeing constructed for it. The charge is therefore higher at thisnode as compared to the other nodes in Orissa.
? Generation access charges in Sikkim decline because of capacity additions expected on the Tista
? Transmission access charges in UP -W decline because of further capacity addition at Dadri (Ext. U 5,6)
Demand Access Charges - NEW Grid – Some Specific Observations
? Most of the states where demand access charges are declining – e.g., Delhi (because of Bawana (1500 MW)), Haryana and Punjab (Jhajjar (1500 MW), Hisar TPS(1200 MW)), Himachal Pradesh (Karcham Wangto, Parbati, Budhil, Allain Duhangan, Malana II) are states with more generation expected

Generation Access Charges – SR Grid – Some Specific Observations
? AP E&C: New generation at Gautami, Konaseema, Kothagudem, Kondapalli have been added over and above 2008-09 scenario. This brings in extra generation (summer peak: 6295 MW in 2011-12 against 2383.6 MW in summer peak of 2008-09). Since these stations are close to existing pooling points, corresponding transmission capacity addition is less and the existing gets utilized well. This causes a decrease in the charge.
? Tamil Nadu - North: In 2011-12 new power plants at Vallur, North Chennai, and Mettur have been added. Generation increases from 1182.86 MW in summer peak in 2008-09 to 4270 MW in 2011-12. These power plants are close to load centres, the corresponding transmission investment is less and the per unit transmission charges decline.
? Tamil Nadu - South: New generators are added at Kudankulam. This leads to increase in generation to 2090 MW in summer peak in 2011-12 from 473 MW 2008-09.
Demand Access Charges – SR Grid – Some SpecifcObservations
? Kerala: Three more demand nodes are connected by 400 kV lines in 2011-12: Kozhikode, Cochin and Chulliar. The total demand at the 400 kV nodes increases to 1588 MW in 2011-12 from 805 MW in 2008-09. Further, the existing node at Trivandrum is being fed from Tirunelveli (in TN), which is being fed by new generation at Kudankulam. Thus there is new generation close to demand nodes here also
? Tamil Nadu: The decline in rates is due to increase in generation -as indicated above in Tamil Nadu- North and Tamil Nadu – South.

Transition to the POC Charge Methodology
? Chargesn 50% of the ATC of the ISTS Licensees will be recovered based on
the POC charges and the balance 50% will be recovered based on the Uniform Charges (separate postage stamp rates for NEW and SR Grid)
n For medium term / short term transactions the POC charges will be applicable in full
? Lossesn Total losses in the NEW grid and SR grid will be computed as per
the existing methodologyn 50% of the losses will be allocated to beneficiary states based on
the POC loss allocators computed using the Hybrid Method and thebalance 50% losses will be allocated uniformly according to the existing methodology
n For the medium term / short term transactions the POC loss allocators will be applied
BENEFITS OF THE PROPOSED METHODOLOGY

Benefits of the proposed POC methodology
? The charges are therefore indicated to provide a signal:n If demand charges are high in a zone – it would be advantageous
to add generation there (after considering the trade-off between cost of fuel transportation and transmission of electricity)
n If the generation charges are high in a particular region and there is adequate transmission capability, adding generation there will reduce transmission charges
n If the generation charges are high in a particular region and transmission system is operating close to capability, adding generation there may increase transmission charges
n Demand access charges in the vicinity of a generation hub are low (provided the demand nodes are connected directly with the generation hubs)
n A commercial contract which is against the direction of physicalflow of power will invite lower transmission charges – e.g. commercial contract between a plant in UP-West / Delhi and Maharashtra – such a contract will be against the direction of flow
Benefits of the proposed POC methodology …(2)
? At present the transmission investments are faced with the uncertainty in generation and also the cumbersome process of getting the BPTAs signed by all the expected beneficiaries of the transmission system
? Under the proposed mechanism all the Designated ISTS Customers (DICs) are default signatories to the Connection and Use of System Agreement (CUSA), which also requires these DICs to pay the point of connection charge
? This commercial arrangement is also expected to facilitate financial closure of transmission investments
? Efficient network development will lead to the greater network efficiencies and hence lesser costs on the aggregate for the users

Benefits of the proposed POC methodology …(3)
? Facilitates integration of electricity markets, enhances open access and competition by obviating the need for pancaking of transmission charges
? The need for arbitrary distinction and determination of charges for Long term, Medium term and Short Term open access is obviated by the new transmission pricing mechanism.
? The National Electricity Policy requires the transmission charges to reflect network utilization. The Point of Connection tariffs arebased on load flow analysis and capture utilization of each network element by all the customers.
? The distinction between generation and demand customers provides siting signals to generators. The current decision of generators is based on just the fuel transportation costs.
Benefits of the proposed POC methodology …(3)
? The proposed framework will greatly facilitate fair and transparent competition for case-1 bids. Under the current methodology, the case-1 bid processes are severely distorted because of pancaking, and this results in pit head / hydro plants not being competitive for inter-regional bids. The impact of pancaking is further amplified in such bid processes because of application of escalation factors to transmission charges over a 25 year period. The proposed methodology will remove such difficulty
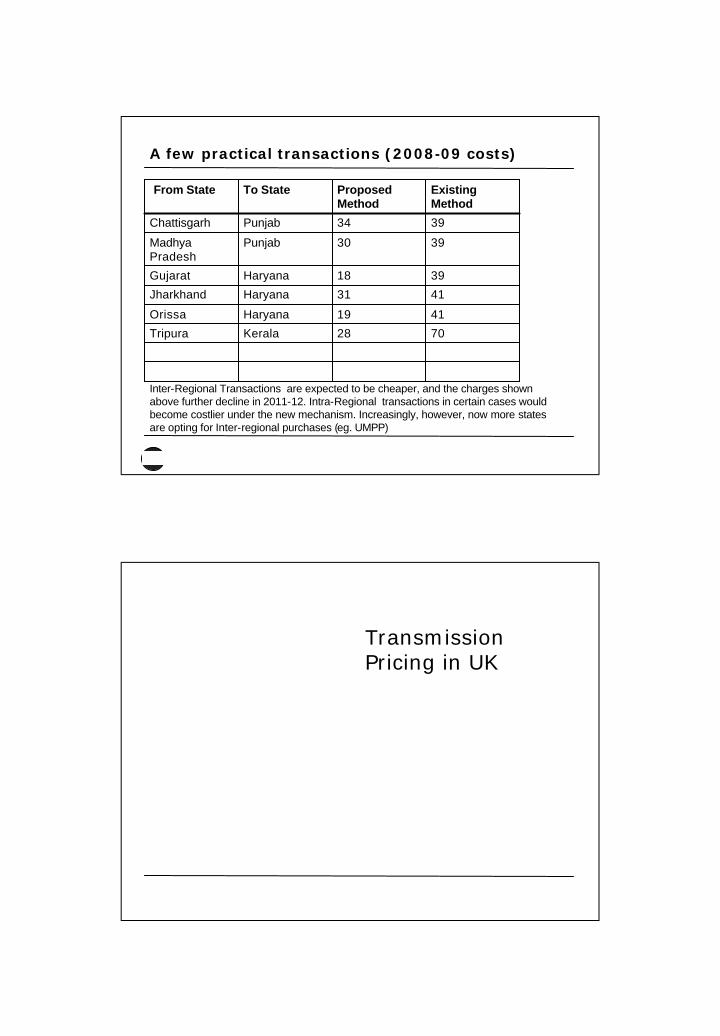
A few practical transactions (2008-09 costs)
From State To State Proposed Method
Existing Method
Chattisgarh Punjab 34 39
Madhya Pradesh
Punjab 30 39
Gujarat Haryana 18 39
Jharkhand Haryana 31 41
Orissa Haryana 19 41
Tripura Kerala 28 70
Inter-Regional Transactions are expected to be cheaper, and the charges shown above further decline in 2011-12. Intra-Regional transactions in certain cases would become costlier under the new mechanism. Increasingly, however, now more states are opting for Inter-regional purchases (eg. UMPP)
Transmission Pricing in UK

Transmission Pricing Framework
? Assets of National Grid are apportioned to one of two charging categories -
w transmission Network Use of System charges and w Connection charges.
? The apportionment methodology between Connection and Transmission Network Use of System used by National Grid is on a shallow basis

Transmission Network Use of System Charges
• TNoUS has two components
– A locationally varying element derived from the DCLF ICRP transport model to reflect the costs of capital investment in, and the maintenance and operation of, a transmission system to provide bulk transport of power to and from different locations.
– Secondly, a non-locationally varying element related to the provision of residual revenue recovery. The combination of both these elements forms the TNUoS tariff.
Incremental Cost Reflective Pricing Model
• The DCLF ICRP transport model calculates
– the marginal costs of investment in the transmission system which would be required as a consequence of an increase in demand or generation at each connection point or node on the transmission system, based on a study of peak conditions on the transmission system.
– One measure of the investment costs is in terms of MWkm. This is the concept that ICRP uses to calculate marginal costs of investment. Hence, marginal costs are estimated initially in terms of increases or decreases in units of kilometres (km) of the transmission system for a 1 MW injection to the system.

Inputs to the ICRP Model
? Nodal generation information ? Nodal demand information ? Transmission circuits between these nodes ? The associated lengths of these routes, the proportion of
which is overhead line or cable and the respective voltage level
w The ratio of each of 132kV overhead line, 132kV cable, 275kV overhead line, 275kV cable and 400kV cable to 400kV overhead line costs to give circuit expansion factors
? Identification of a reference node
Model Output
? The model calculates for a given injection of 1MW of generation at each node, with a corresponding 1MW offtake (demand) at the reference node, the increase or decrease in total MWkm of the whole network.
? Given the assumption of a 1MW injection, for simplicity the marginal costs are expressed solely in km.
? The marginal km cost for demand at each node is then equal and opposite to, the nodal marginal km for generation.
? The marginal km costs can be positive or negative depending on the impact the injection of 1MW of generation has on the total circuit km.

Calculation of Zonal Marginal km
? Number of generation zones is 20
? Demand zone boundaries have been fixed and relate to the Grid Supply Point (GSP) Groups used for energy market settlement purposes.
? The nodal marginal km are amalgamated into zones by weighting them by their relevant generation or demand capacity.
Determination of Generation Zones
? Zones should contain relevant nodes whose marginal costs are all within +/-£1.00/kW (nominal prices) across the zone.
? The nodes within zones should be geographically and electrically proximate.
? Relevant nodes are considered to be those with generation connected to them as these are the only ones, which contribute to the calculation of the zonal generation tariff.

Zonal Marginal kms for Generation
? The zonal marginal km are converted into costs and hence a tariff by multiplying by the Expansion Constant and the Locational Security Factor
? For Generation the zonal marginal km (ZMkm) are simply multiplied by the expansion constant and the locational security factor to give the initial transport tariff
Zonal Marginal kms for demand
? For demand the zonal marginal km (ZMkm) are simply multiplied by the expansion constant and the locationalsecurity factor to give the initial transport tariff:
? These initial transport tariffs are multiplied by the expected metered triad demand and generation capacity to gain an estimate of the initial revenue recovery.
Split between generation and demand charges
? The Initial Transport Revenue Recovery figures above such that the 'correct' split of revenue between generation and demand is obtained. This has been determined to be 27:73 by the Authority for generation and demand respectively.
Residual Tariff
? The revenue forecast to be recovered from the corrected transport tariffs will not equate to the total revenue target.
? To ensure adequate revenue recovery, a constant non-locational Residual Tariff for generation and demand is calculated, which includes infrastructure substation asset costs.
w It is added to the corrected transport tariffs so that the correct generation/ demand revenue split is maintained and the total revenue recovery is achieved.

Final £/kW Tariff
? The final TNoUS tariff is the sum of the Locational and the non-locational residual component.
? If the Final demand TNUoS Tariff results in a negative number then this is collared to £0/kW with the resultant non-recovered revenue smeared over the remaining demand zones.
Factors that affect locational TNUoS tariff
? The factors which will affect the level of TNUoS charges from year to year include
w the forecast level of peak demand on the system,w the Price Control formula (including the effect of any
under/over recovery from the previous year), w the expansion constant, w the locational security factor, w changes in the transmission network and changes in the pattern
of generation capacity and demand.

Transmission Pricing in Australia
Transmission Services in Australia
There are three kinds of transmission services provided under the National Electricity Rules:
• Prescribed transmission services – these services are subject to revenue cap regulation by the Australian Energy Regulator (AER) and are defined as shared transmission network services, connection services provided to distribution or other regulated networks, and grandfathered prescribed connection services provided to generators and high voltage customers
• Negotiated transmission services – these are connection services provided to a generator or transmission customer, or a group of generators or transmission customers, and shared transmission services provided to customers where the service exceeds standard network performance requirements.
• Non-regulated (contestable) transmission services – these are services that the transmission coampany is not obliged to provide and which are capable of being provided on a contestable basis by a range of suppliers. Commercial terms and conditions are negotiated between the parties for the provision of these services.

Prescribed Transmission Services
? Prescribed transmission services are regulated according to the Revenue Cap mechanism with maximum allowed revenue sliding on a scale of performance outcomes.
? The allocation to various customers is done on the principle based on cost causation. Cost causation is determined both directly in case of radial transmission components and using load flow analysis in case of common network resources.
Components of Prescribed Transmission Services
? Annual Aggregate Revenue Requirements (AARRs) are recovered from the transmission charges for following categories of transmission services:
n Prescribed Entry Servicen Prescribed Exit Servicesn Prescribed Transmission use of system
servicesn Prescribed Common transmission
services

Cost Allocation to various prescribed services
• Assets are allocated between prescribed entry services, prescribed exit services, prescribed TOUS services and prescribed common services based on Optimized Replacement Cost (ORC)of Assets.
– The optimised replacement cost of the asset is the cost of meeting the current (and projected future) supply needs with the most technically efficient design and configuration of the asset based on the existing system configuration
• Attributable cost shares are determined based on assets allocated to each type of prescribed transmission service.
• Next step is to allocate the AARR to each service. This results in Aggregate Service Revenue Requirement (ASRR) for each service.
– AARR is multiplied by the Attributable cost share to determine Annual Service Revenue Requirement.
Prescribed Transmission Service Price
? Prescribed Entry Service
n The ASRR for prescribed entry services is allocated to each transmission network connection point in accordance with the attributable connection point cost share.
? Prescribed Exit Service
n The ASRR for prescribed exit services is allocated to each transmission network connection point in accordance with the attributable connection point cost share.

Prescribed TUOS Service Price
? The prescribed TOUS services ASRR is recovered from:
n Prescribed TOUS services (LocationalComponent), andn Prescribed TOUS services (adjusted
non-locational component).
Determination of Prescribed TUOS LocationalCharge
• For allocation of the locational component, proportionate use of the shared network is computed using the modified Cost Reflective Network Pricing (modified CRNP) model. This model requires the following inputs:– An electrical (load flow) model of the network– A cost model of the network (cost allocation
methodology)– An appropriate set of load/generation patterns.
• The modified CRNP model uses TPRICE model to compute the utilization factors of each network pricing branch over a range of operating conditions. Utilization factors are based on maximum flow on each network component.

The TPRICE Model
• T-price requires significant work to establish all of the inputs and to run the model. However, in summary:
– Electrical configuration and parameters of the network are established
– Interval demand data is assembled for every node.
– Load flow analysis is carried out so that all of the network element costs are allocated to each zone substation based on usage of those network elements. This process derives an annual cost for each node.
– The costs at each node are then converted to prices by assigning a maximum demand to each node and using that demand to calculate a price in terms of $/kW/annum.
Summary of Prescribed TOUS Charges

Negotiated Transmission service… (1)
• The pricing of negotiated transmission services is guided by the following:
– The price for a negotiated transmission service must reflect the costs that the transmission service provider has incurred, or incurs, in providing that service.
– The price for a negotiated transmission service must be at least equal to the avoided cost of providing that service but no more than the cost of providing it on a stand-alone basis.
• If the negotiated transmission service is a shared transmission service that:
– exceeds any network performance requirements which it is required to meet under any relevant electricity legislation, or
– exceeds the network performance requirements,Then the difference between the price for that service and the price for the shared transmission service which meets network performance requirements must reflect the transmission service provider’s incremental cost of providing that service.
Negotiated Transmission Service… (2)
• If the negotiated transmission service is the provision of a shared transmission service that does not meet or exceed the network performance requirements,
– the difference between the price for that service and the price for the shared transmission service which meets, but does not exceed, the network performance requirements should reflect the amount of the transmission service provider’s avoided cost of providing that service.
• The price for a negotiated transmission service must be the same for all transmission network users unless there is a material difference in the costs of providing the negotiated transmission service to different transmission network users or classes of transmission network users.
• The price for a negotiated transmission service must be subject to adjustment over time to the extent that the assets used to provide that service are subsequently used to provide services to another person, in which case such adjustment must reflect the extent to which the costs of that asset is being recovered through charges to that other person.
• The price for a negotiated transmission service must be such as to enable the transmission service provider to recover the efficient costs of complying with all regulatory obligations associated with the provision of the negotiated transmission service.

Non-regulated (contesteable) Transmission Services
• These services do not need to be justified under the code.
• The owners of a non-regulated network service do not receive fixed, annual revenue for their investment as determined by the regulator. The owners of a non-regulated network service can earn revenue by direct participation in the competitive power market, bidding ‘transport’ capacity in much the same manner as generator bids ‘generation’ capacity.
• An example of this in Australia is the Queensland-New South Wales interconnection.
• To qualify as a regulated service, these projects need to pass a “regulatory test”.
Thank You