form sop-0402-07, revision 10 · the second part of question 02.02.05-16 inquired about water level...
TRANSCRIPT

ISSUE SUMMARY Form SOP-0402-07, Revision 10
DESIGN CONTROL SUMMARY CLIENT: PSEG Power LLC UNIT NO.: N/A PAGE NO.: 1
PROJECT NAME: PSEG Site ESPA
PROJECT NO.: 12380-019 IS&L NUCLEAR QA PROGRAM
CALC. NO .. : 2014-06517 APPLICABLE [8J YES 0 NO
TITLE: Analysis of RAI-67 QuesUons on HEC-RAS
EQUIPMENT NO.: N/A
IDENTIFICATION OF PAGES ADDEDIREVISED/SUPERSEDEDNOIDED & REVIEW METHOD
INPUTS/ ASSUMPTIONS [8J VERIFIED
0 UNVERIFIED
REVIEW METHOD: Detailed REV.: 0
STATUS: [8J APPROVED o SUPERSEDED BY CALCULATION NO. OVOID DATE FOR REV.: 8/19/2014
PREPARER: r~~;~AIP DATE: 8/19/2014
David Harris/Atkins
REVIEWER: pdi/~
1 . V DATE: 8/19/2014
Harshal Desai/Atkins
APPROVER: ~ DATE: 8/19/2014
Paul Jensen/Atkins
S&L Nikhil PatellS&L MM fvf~ DATE: 8/19/2014
ACCEPTANCE:
IDENTIFICATION OF PAGES ADDEDIREVISED/SUPERSEDEDNOIDED & REVIEW METHOD
REVIEW METHOD:
STATUS: o APPROVED
PRE PARER:
REVIEWER:
APPROVER:
SOP040207.DOC Rev. Date: 05-19-2014 Eft. Date: 02-01-2013
o SUPERSEDED BY CALCULATION NO. OVOID
NOTE: PRINT AND SIGN IN THE SIGNATURE AREAS
Page 1 of 1
INPUTS/ ASSUMPTIONS
0 VERIFIED
0 UNVERIFIED
REV.:
DATE FOR REV.:
DATE:
DATE:
DATE:
I


PSEG Power LLC Calc. No. 2014-06517, Revision 0 PSEG Site ESPA Project No. 12380-019 Analysis of RAI-67 Questions on HEC-RAS Page 2 of 14
Table of Contents
Page
LIST OF ACRONYMS .................................................................................................................4�
1.� PURPOSE AND SCOPE ........................................................................................................5�
2.� DESIGN INPUTS ...................................................................................................................5�
3.� ASSUMPTIONS .....................................................................................................................5�
4.� METHODOLOGY AND ACCEPTANCE CRITERIA .........................................................6�
4.1� Concerns with Method for Modeling Bridge Approaches ............................................... 6�
4.2� Steps to Minimize Model Instabilities ............................................................................. 6�
4.3� Model Versions ................................................................................................................ 8�
5.� CALCULATIONS ..................................................................................................................8�
5.1� Concerns with the Method for Modeling Bridge Approaches ......................................... 8�
5.2� Steps to Minimize Model Instabilities ............................................................................. 8�
5.3� Model Versions ................................................................................................................ 9�
6.� RESULTS AND CONCLUSIONS ......................................................................................12�
6.1� Concerns with Method for Modeling Bridge Approaches ............................................. 12�
6.2� Steps to Minimize Model Instabilities ........................................................................... 12�
6.3� Model Versions .............................................................................................................. 13�
7.� REFERENCES .....................................................................................................................14�

PSEG Power LLC Calc. No. 2014-06517, Revision 0 PSEG Site ESPA Project No. 12380-019 Analysis of RAI-67 Questions on HEC-RAS Page 3 of 14
ATTACHMENTS No. of Pages
A Verification & Validation of Duplicate Results Used in the HEC-RAS Model Analysis for RAI 67 02.02.05-16 AND 17 3
B Electronic Files for Model Input and Output for Sensitivity Runs 1
C Verification of Atkins HEC-RAS Version 4.1 Results on S&L Validated HEC-RAS 4.1 Program 5
LIST OF FIGURES Page
Figure 1� Model Water Surface Profile for June 29 1900 Showing Bridge Locations and Water Level Oscillations .......................................................................................................... 7�
Figure 2� Sensitivity Runs for Oscillations at 26JUN2006 at time 1900 ............................................ 10�Figure 3� Sensitivity Runs for Oscillations at 26JUN2006 at time 1830 ............................................ 11�
LIST OF TABLES Page
Table 1 – Effects of Adding Actual Bridge Approaches to Model ......................................................... 12�Table 2 – Effects of Numerical Instability Runs at the Project Site ........................................................ 13�Table 3 – Water Surface Elevation Comparison between HEC-RAS V4.0 and V4.1 ........................... 14�

PSEG Power LLC Calc. No. 2014-06517, Revision 0 PSEG Site ESPA Project No. 12380-019 Analysis of RAI-67 Questions on HEC-RAS Page 4 of 14
LIST OF ACRONYMS ESPA Early Site Permit Application
HEC Hydrologic Engineering Center, USACE
HEC-RAS Hydrologic Engineering Center-River Analysis System
NAVD88 North American Vertical Datum 1988
NRC Nuclear Regulatory Commission
PMH Probable Maximum Hurricane
SSAR Site Safety Analysis Report
SWL Still Water Levels
V&V Verification and Validation

PSEG Power LLC Calc. No. 2014-06517, Revision 0 PSEG Site ESPA Project No. 12380-019 Analysis of RAI-67 Questions on HEC-RAS Page 5 of 14
1. PURPOSE AND SCOPE
In evaluating flooding at PSEG’s ESP site, a HEC-RAS model was employed to simulate propagation of a probable maximum hurricane (PMH) surge up Delaware Bay (Reference 1). In the Nuclear Regulatory Commission’s (NRC) review of that analysis, Requests for Additional Information Number 67 (Reference 2) was produced. Two of the requests dealt with the HEC-RAS modeling. The purpose and scope of this document is to provide the detailed technical support for assessing and answering questions 02.02.05-16 and 02.02.05-17 in RAI-67.
Question 02.02.05-16 is a two-part question. The first part of the question inquired about the technique used to model two bridges upstream of the site. The second part of the question inquired about the potential numerical stability of the model upstream of the bridges for a 2-hour time period from 29JUN2006 17:30 to 29JUN2006 19:30. These questions are addressed in Sections 4.1 and 4.2 below. An additional and similar question was posed regarding the model calibration run (Plan:Surge_calibration_1933). This is addressed in Section 6.2.
In question 02.02.05-17 the NRC inquired about the difference between the original HEC-RAS model version V4.0 and a more recent HEC-RAS model V4.1 released after the study was originally finalized. The Verification and Validation (V&V) was originally performed with V4.1 and that version is employed in this analysis. As discussed below, there is no significant difference in the results between V4.0 and V4.1.
2. DESIGN INPUTS
The key design inputs to the process include the HEC-RAS model input and output files used in the original calculation (Reference 1) and technical information provided by the HEC on dealing with model stability problems (Reference 3).
3. ASSUMPTIONS
It is assumed that the model results obtained in the original analysis (Reference 1) provide appropriate analytical results. Attachment A provides documentation that the input and output files in Reference 1 are duplicated exactly using the project computer. Attachment B provides the electronic files for the HEC-RAS sensitivity runs performed in this analysis, using V4.1. Attachment C provides the overall V&V for the calculation using V4.1.

PSEG Power LLC Calc. No. 2014-06517, Revision 0 PSEG Site ESPA Project No. 12380-019 Analysis of RAI-67 Questions on HEC-RAS Page 6 of 14
4. METHODOLOGY AND ACCEPTANCE CRITERIA
Once it was documented (Attachment A) that the original model results were duplicated on the project computer (Hewlett Packard (HP), EliteBook, with 8.00 GB RAM, 64-bit operating system, on full computer name: LUS290706.wsatkins.com. running a processor, Intel® Core™ i7-2620M CPU @2.70GHz.), the specific questions could be addressed. The sections below describe the methodology.
4.1 Concerns with Method for Modeling Bridge Approaches
The first part of question 02.02.05-16 inquired about the modeling technique used for the bridge approach embankments in HEC-RAS. Figure 1 shows the model profile used in the RAI and the location of the two bridges. The original model used ineffective flow area to represent the approach embankments, but it did not explicitly key in the embankment into the data editor. To assess the effects of this modeling technique, the model was modified to include approximations of the bridge approach embankments, in order to gauge the sensitivity of the modeling results to the two procedures.
There are no acceptance criteria for this calculation.
4.2 Steps to Minimize Model Instabilities
The second part of question 02.02.05-16 inquired about water level oscillations, which appear to indicate model instabilities. These oscillations in the water surface elevation at time 1900 can be seen on Figure 1. The RAI also noted similar oscillations further downstream at time 1830 and a sharp change in elevation at the model boundary (0–10,000 feet) at time 1730. Much of the focus of this analysis is on the larger oscillations at time 1900. The sharp elevation change at the model downstream boundary was observed consistently during the rapid increase in the boundary condition elevation.
As noted in Reference 3, stability issues are not uncommon when performing unsteady flow analyses. A common unsteady application for HEC-RAS is to analyze flooding from a dam break, and oscillations associated with sharp changes in flow are common. For this surge propagation analysis there was no strong indication of a stability warning or concern. For example, the modeled water surface calculation tolerance was set to 0.02 foot, and only six cross sections, all well upstream of the site, failed to converge to within the specified tolerance (within the specified maximum number of iterations). Of the cross sections that did not converge to within 0.02 foot, the greatest difference was only 0.05 foot. The model was modified by varying a number of parameters recommended by the HEC (Reference 3) to minimize potential

PSEG Power LLC PSEG Site ESPA Analysis of RAI-67 Questions on HEC-RAS
Calc, No, 2014-06517, Revision 0 Project No, 12380-019
Page 7 of 14
-,,-,::-_ . . -. -- .. -. '-"-'
Figure 1. Model Water Surface Profile for June 291900 Showing Bridge Locations and Water Level Oscillations

PSEG Power LLC Calc. No. 2014-06517, Revision 0 PSEG Site ESPA Project No. 12380-019 Analysis of RAI-67 Questions on HEC-RAS Page 8 of 14
instability problems. The effect of varying these parameters was assessed to determine the relation between the observed oscillations and a level of instability that could affect model results.
There are no acceptance criteria for this calculation.
4.3 Model Versions
Question 02.02.05-17 inquired about the difference between the HEC-RAS model version 4.0 and the latest version 4.1. The PMH model run was compared between HEC-RAS version 4.0 and 4.1.
There are no acceptance criteria for these calculations.
5. CALCULATIONS
5.1 Concerns with the Method for Modeling Bridge Approaches
The NRC staff requested a discussion and justification of the model setup applied to represent the bridge approaches at the Delaware Memorial Bridge (~17.5 miles upstream of site) and Commodore Barry Bridge (~30 miles upstream). It was first verified that the original model had represented the bridge approaches with “ineffective flow area.” A sensitivity analysis was performed to determine the effects that modeling the bridge embankment differently might make on the results. The geometry file was modified to include the approximate bridge approaches using rough estimates based on available information. The difference between the original and alternative modeling method of representing the bridge approaches were then compared. The results are tabulated and discussed in Section 6.1.
5.2 Steps to Minimize Model Instabilities
A sensitivity analysis was performed to assess the potential significance of the oscillating water surface profile for the PMH surge run (between 29JUN2006 17:30 to 29JUN2006 19:30). Using guidance provided by the HEC (Reference 3), various modeling parameters were adjusted to assess their effect. All modeling scenarios were based on the HEC-RAS plan modeling run called “PMH_R28_T26_25YR_FLD_DYNAMIC” (this was the same modeling plan run used to establish the peak water surface elevation used for regulatory purposes).
The following four sensitivity runs were made:
1) Reduce the computational time step from 30 seconds to 5 seconds

PSEG Power LLC Calc. No. 2014-06517, Revision 0 PSEG Site ESPA Project No. 12380-019 Analysis of RAI-67 Questions on HEC-RAS Page 9 of 14
2) Set Theta coefficient = 1.0, (changed from 0.6 in PMH run). The Theta coefficient is a weighting factor applied in the model finite difference calculations.
3) An Adjusted Options and Tolerances, that included keeping Theta = 1.0, increasing the maximum number of warm up time steps from 20 to 40, combined with adjusting Theta during the warm up period from 0.6 to 1.0.
4) Add interpolated cross-sections every 2,000 feet from river station 56.8 miles (300,000 feet) to the most upstream cross section
Figure 2 illustrates the resulting water surface profiles for the PMH run and the sensitivity runs at the location where the numeric instability was noted at time step 26JUN2006 1900. The base or PMH run with no adjustments is shown with the dark dashed line. It was found that run 3), adding warm up modifications to run 2), was not significantly different from run 2. Accordingly, the two runs are labeled as one line (Theta=1 + Warm Up).
From Figure 2, it can be seen the sensitivity run “Interpolated Cross Sections,” oscillates markedly less than the base PMH run. The runs Theta=1+Warm Up also reduces oscillation at most locations but not as much as the added cross-sections. Interestingly, shortening the computational time step from 30 to 5 seconds actually increases the oscillations.
Figure 3 shows the water surface profiles at time 1830, to address the RAI comment on oscillations further downstream at 340,000 feet. Similar results were obtained: additional cross-sections has the largest reduction, followed by Theta=1 + Warm Up, and reduced time step increasing oscillations. Tabular results were also produced to assess the effects of these sensitivity runs at the PSEG site for the peak water surface elevation, as discussed in more detail below in Section 6.2, the effect in the peak water surface elevation at the PSEG site is negligible.
5.3 Model Versions
As noted in the RAI -17, the NRC acknowledged that no differences were seen between HEC-RAS V4.0 used in the original calculation and V4.1 with regards to bridge crossing results. The NRC requested a discussion of the V4.0 results compared to the latest version to confirm there is no effect of the different model version on the peak water level at the site. To address this question, it was first confirmed that V4.1 is the latest version available as of July 2014. Next, the PMH model files were run in both model versions V4.0 and V4.1, and the modeling results were then compared so as to confirm that there were no significant differences between the two model versions, as tabulated in Section 6.3.

PSEG Power LLC PSEG Site ESPA Analys is of RAI-67 Questions on HEC-RAS
Calc. No. 2014-06517, Revis ion 0 Project No. 12380-019
Page 10 of 14
Qj '0 0 ~ .21 'S til -g I
1
~ iI
1 Q)
(ij 3 til Qj Cl
o o en ~
II Q)
E F
Figure 2. Sensitivity Runs for Oscillations at 26JUN2006 at Time 1900
0
~
E. CI)
" co
~ as ]i c 'ii • co co 2 U co
~ 0 0 0
8 •

PSEG Power LLC PSEG Site ESPA Analysis of RAI-67 Questions on HEC-RAS
Calc. No. 2014-06517, Revision 0 Project No. 12380-019
Page 11 of 14
Q)
E E .Q '5 tU U >-I «; > a: ; ~ (I) 0
II (1)
E i=
g " u
" 01 'iii is 'ii " " 01 .t: u " ~
Figure 3. Sensitivity Runs for Oscillations at 26JUN2006 at time 1830

PSEG Power LLC Calc. No. 2014-06517, Revision 0 PSEG Site ESPA Project No. 12380-019 Analysis of RAI-67 Questions on HEC-RAS Page 12 of 14
6. RESULTS AND CONCLUSIONS
6.1 Concerns with Method for Modeling Bridge Approaches
To address the effects of modeling the bridge approaches, the HEC-RAS geometry file was modified to include approximations of the bridge roadway embankments. Table 1 presents the resulting peak water surface elevation and peak flow resulting at the three river stations (52, 50.8, and 50.36 miles) that cross through the PSEG site. From this table it can be seen that there is a very slight increase (0.01 foot) in the peak water elevation at the site. This slight increase probably results because the bridge approach embankments act as a slightly more effective barrier to upstream movement of the storm surge and therefore produce a slightly greater backwater effect at the PSEG site. There are also small and insignificant differences in the flow past the site. These results show the original HEC-RAS approach to modeling the bridge embankments at the Delaware Memorial Bridge and Commodore Barry Bridge are appropriate for the PMH storm surge event, and no changes to the HEC-RAS model or resultant water surface elevations are required.
Table 1 – Effects of Adding Actual Bridge Approaches to Model
River Sta (mile) Plan
Model Results % Difference
Q Total W.S. Elev. Q Total W.S. Elev.
(cfs) (feet NAVD) (cfs) (foot)
52 Original Run -2859915 16.19
0.22 0.06 Modified for Bridge Embankment -2853571 16.20
50.8 Original Run -2886137 16.16
0.18 0.06 Modified for Bridge Embankment -2880970 16.17
50.36 Original Run -3134544 16.13
0.10 0.06 Modified for Bridge Embankment -3131386 16.14
6.2 Steps to Minimize Model Instabilities
The sensitivity runs described in Section 5.2 have the effect of either decreasing or increasing the magnitude of the oscillations flagged in the RAI that occur early in the simulation. The peak water surface elevations at the PSEG site occurs later in the simulation. These are summarized in Table 2 to show the effect that might be realized if modifications were made to reduce the oscillations. From Table 2, it can be seen that the sensitivity runs to reduce the oscillations have very little effect on the model peak elevation results. The measures that reduce the size of oscillations (added cross-sections and Theta=1+Warm-up) cause small reductions in peak elevation. The reduced time step measure that increased oscillations produces some very small
PSEG Power LLC Calc. No. 2014-06517, Revision 0 PSEG Site ESPA Project No. 12380-019 Analysis of RAI-67 Questions on HEC-RAS Page 13 of 14
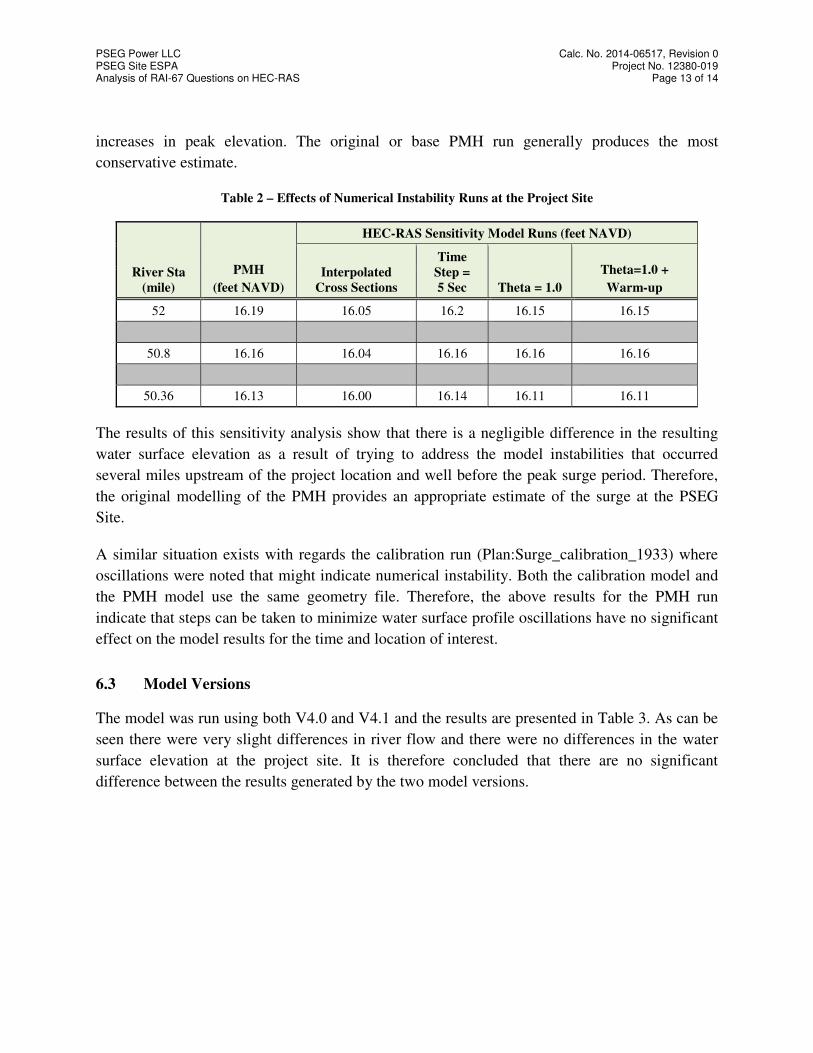
increases in peak elevation. The original or base PMH run generally produces the most conservative estimate.
Table 2 – Effects of Numerical Instability Runs at the Project Site
River Sta (mile)
PMH (feet NAVD)
HEC-RAS Sensitivity Model Runs (feet NAVD)
Interpolated Cross Sections
Time Step = 5 Sec Theta = 1.0
Theta=1.0 + Warm-up
52 16.19 16.05 16.2 16.15 16.15
50.8 16.16 16.04 16.16 16.16 16.16
50.36 16.13 16.00 16.14 16.11 16.11
The results of this sensitivity analysis show that there is a negligible difference in the resulting water surface elevation as a result of trying to address the model instabilities that occurred several miles upstream of the project location and well before the peak surge period. Therefore, the original modelling of the PMH provides an appropriate estimate of the surge at the PSEG Site.
A similar situation exists with regards the calibration run (Plan:Surge_calibration_1933) where oscillations were noted that might indicate numerical instability. Both the calibration model and the PMH model use the same geometry file. Therefore, the above results for the PMH run indicate that steps can be taken to minimize water surface profile oscillations have no significant effect on the model results for the time and location of interest.
6.3 Model Versions
The model was run using both V4.0 and V4.1 and the results are presented in Table 3. As can be seen there were very slight differences in river flow and there were no differences in the water surface elevation at the project site. It is therefore concluded that there are no significant difference between the results generated by the two model versions.

PSEG Power LLC Calc. No. 2014-06517, Revision 0 PSEG Site ESPA Project No. 12380-019 Analysis of RAI-67 Questions on HEC-RAS Page 14 of 14
Table 3 – Water Surface Elevation Comparison between HEC-RAS V4.0 and V4.1
Model Version Q Total W.S. Elev.
River Sta. (cfs) % Difference (feet) Version 4.0
50.36 -3134544
< 0.0001% 16.13
Version 4.1 -3134545 16.13 Version 4.0
50.8 -2886137
< 0.0001% 16.16
Version 4.1 -2886136 16.16 Version 4.0
52 -2859915
< 0.0001% 16.19
Version 4.1 -2859914 16.19
7. REFERENCES
1. Probable Maximum Storm Surge Calculation. MACTEC Calculation 2251-ESP-HY-245. Revision 3, 12/9/11
2. RAI-67, Review Section 02.04.05. Docket No. 52.043. Probable Maximum Surge and Seiche Flooding. NRC Ascension Number ML12303A012.
3. Brunner, G.W. Common Model Stability Problems When Performing an Unsteady Flow Analysis. USACE Hydrologic Engineering Center. Guidance Information on the National Weather Service website. http://www.nws.noaa.gov/oh/hrl/modelcalibration/6.%20% 20Hydraulic%20Model%20Calibration/4.1%20L-11%20CommonModelStabilityProblems InUnsteady%20FlowAnalysis.pdf

PSEG Power LLC Calc. No. 2014-06517, Revision 0 PSEG Site ESPA Project No. 12380-019 Analysis of RAI-67 Questions on HEC-RAS Attachment A: Page 1 of 3
ATTACHMENT A
VERIFICATION & VALIDATION OF DUPLICATE RESULTS USED IN THE HEC-RAS MODEL ANALYSIS FOR RAI 67 02.02.05-16 AND 17
1.0 Purpose and Scope
In order to ensure consistency in modeling results between previously submitted modeling efforts and the modeling analysis presented in this document, it is necessary to ensure that modeling output can be reproduced on the study engineer’s computer and verified identical to the modeling results submitted by MACTEC using HEC-RAS V4.0. In this calculation, S&L performed a V&V analysis using V4.1. V&V of this RAI-67 study is performed using V4.1 and is described in Attachment C.
2.0 Input for the V&V Process
The results from previous modeling runs were stored in the HEC-RAS modeling received by Atkins. Therefore, the output file for the peak water surface estimate was printed out for the PMH plan run “PMH_R28_T26_25YR_FLD_DYNAMIC”. In order to allow the regulatory HEC-RAS model to run on Atkins computers, changes had to be made to reference the correct flow input and boundary conditions HEC-DSS files (also provided in the data DVD). Once the directory references were updated for the Atkins network directory, the model was run on a computer at the Atkins office. The resulting output from the simulation made on the Atkins computer was compared to the output file stored in the original PMH run, and the modeling results were found to be duplicated between the Atkins duplicate model run, and the output file received with the original PMH model run.
Additionally, Atkins reran all runs with V4.1 and provided the input/output files to S&L.S&L then reran all simulations on the S&L computer and compared to the Atkins results. The files are included in Attachment B.
3.0 Assumptions
The model is validated by comparing peak water flow, water surface elevations, energy grades, top widths, and Froude number at all of the modeled river cross sections stations.
4.0 Methodology and Acceptance Criteria
The computer system used herein for all model execution was a Hewlett Packard (HP), EliteBook, with 8.00 GB RAM, 64-bit operating system, on full computer name: LUS290706.wsatkins.com. Running of a processor, Intel® Core™ i7-2620M CPU @2.70GHz.

PSEG Power LLC Calc. No. 2014-06517, Revision 0 PSEG Site ESPA Project No. 12380-019 Analysis of RAI-67 Questions on HEC-RAS Attachment A: Page 2 of 3
The acceptance criterion for this verification was that the computed peak water flow, water surface elevations, energy grades, top widths, and Froude number at all of the modeled river cross sections stations were the same between the duplicate model run generated by Atkins and the original modeling results.
5.0 Calculations
No calculations were necessary for this effort in verifying duplicate modeling results.
6.0 Results and Conclusions
Attachment A-1 provides the digital files that demonstrate the input and output files for all model runs using V4.1 are identical for the Atkins and S&L computer used in the original V&V analysis.

PSEG Power LLC Calc. No. 2014-06517, Revision 0 PSEG Site ESPA Project No. 12380-019 Analysis of RAI-67 Questions on HEC-RAS Attachment A: Page 3 of 3
ATTACHMENT A-1
VALIDATION DUPLICATE MODELING RESULTS FOR MACTEC SIMULATIONS USING V4.0
Electronic files for validating the original MACTEC model results using V4.0 on the Atkins computer.

PSEG Power LLC Calc. No. 2014-06517, Revision 0 PSEG Site ESPA Project No. 12380-019 Analysis of RAI-67 Questions on HEC-RAS Attachment B: Page 1 of 1
ATTACHMENT-B
HEC-RAS MODEL INPUT AND OUTPUT ELECTRONIC FILES FOR SENSITIVITY RUNS
Model input and output files corresponding to the various HEC-RAS sensitivity analysis simulations are provided herein in electronic format.


PSEG Power LLC Calc. No. 2014-06517, Revision 0 PSEG Site ESPA Project No. 12380-019 Analysis of RAI-67 Questions on HEC-RAS Attachment C: Page 2 of 5
program (Program No. 03.7.710-4.1 with Status O). HEC-RAS version 4.1 program was rerun using Atkins provided input and model files on S&L PC #ZD9375. Atkins output files were transmitted to S&L through email. The electronic files of Atkins input output and modelare presented in Attachment B. The electronic files for input, output and model used for S&L HEC-RAS program run are presented in Appendix C-2.
4.2 Acceptance Criteria
Water levels computed using HEC-RAS Version 4.1 on Atkins computers shall be identical to water levels computed using S&L V&Ved HEC-RAS Version 4.1 program runs performed on S&L PC.
5.0 Computer Programs
HEC-RAS Version 4.1 S&L Verified and Validated program (Program No. 03.7.710-4.1 with Status O).
6.0 Calculations
There are six plans identified in the main HEC-RAS model files for the Atkins program runs which are used by Atkins. These plans along with the purpose identified in main document are listed in Table C-1.
Table C-1: List of Plans used by Atkins HEC-RAS Version 4.1 Runs
# Plan Name in the HEC-RAS model file Purpose Identified in the Main Document
of this Attachment
1 PMH_R28_T26_25YR_FLD_DYNAMIC Original Model from MACTEC
2 PMH_R28_T26_25YR_FLD_DYNAMIC Bridge Aprx Effect of adding actual bridge approaches to original model
3 PMH_R28_T26_25YR_FLD_DYNAMIC Interp XSEC Effect of interpolated cross section
4 PMH_R28_T26_25YR_FLD_DYNAMIC 5 sec TS Run with time step of 5 seconds
5 PMH_R28_T26_25YR_FLD_DYNAMIC Theta eq 1 Run with parameter Theta = 1.0
6 PMH_R28_T26_25YR_FLD_ Opt Tollernce Adjusted calculation options and tolerance
The electronic model and input files transmitted from Atkins to S&L are presented in Attachment B of the main document. The output report files (with extension .REP) for the above plan files transmitted from Atkins to S&L are presented in Attachment B. S&L performed HEC-RAS Version 4.1 runs on S&L PC # ZD9375 and output with similar options used by Atkins were generated with similar file names preceded with “SNL-” word for the file name. The electronic input, output and model files used by S&L are presented in Appendix C-2.

PSEG Power LLC Calc. No. 2014-06517, Revision 0 PSEG Site ESPA Project No. 12380-019 Analysis of RAI-67 Questions on HEC-RAS Attachment C: Page 3 of 5
The output files from Atkins runs and the output files from S&L runs were printed and manually compared. By manual comparisons of Standard Table 1 from Atkins output with S&L output, it was found that all values such as, total discharge, water surface elevation, energy elevation, energy slope, channel velocity, flow area, top width, and Froude numbers are identical in both outputs. Comparison of the water levels used in the main document between Atkins and S&L runs for six plans are presented in Attachment B.
Table C-2: Comparison of the Water Levels (ft. NAVD) Computed Using Atkins and S&L HEC-RAS Version 4.1 Runs
Plan Name & Table # in main
document
River Sta – Mile 52 River Sta – Mile 50.8 River Sta – Mile 50.36
Atkins S&L Atkins S&L Atkins S&L
Original Model 16.19 16.19 16.16 16.16 16.13 16.13
Effect of adding approaches
16.20 16.20 16.17 16.17 16.14 16.14
Interpolated cross section
16.05 16.05 16.04 16.04 16.00 16.00
Time step of 5 seconds
16.20 16.20 16.16 16.16 16.14 16.14
Run with Theta = 1.0
16.15 16.15 16.16 16.16 16.11 16.11
Adjusted options and tolerance
16.15 16.15 16.16 16.16 16.11 16.11
7.0 Results and Conclusions
As discussed in the computation section, all output files transmitted from Atkins generated from HEC-RAS Version 4.1 on Atkins computer are identical to output files from S&L runs of HEC-RAS Version 4.1 on S&L PC # ZD9375. It can be concluded that all results presented in the main document based on HEC-RAS Version 4.1 performed on Atkins computer are identical to the results produced using S&L Verified and Validated HEC-RAS Version 4.1 program run on S&L PC.
8.0 Limitations
None
9.0 References
None

PSEG Power LLC Calc. No. 2014-06517, Revision 0 PSEG Site ESPA Project No. 12380-019 Analysis of RAI-67 Questions on HEC-RAS Attachment C: Page 4 of 5
APPENDIX C-1
ELECTRONIC PDF FILE OF ATKINS TRANSMITTAL OF MODEL FILES

PSEG Power LLC Calc. No. 2014-06517, Revision 0 PSEG Site ESPA Project No. 12380-019 Analysis of RAI-67 Questions on HEC-RAS Attachment C: Page 5 of 5
APPENDIX C-2
ELECTRONIC INPUT, OUTPUT, AND MODEL FILES OF THE HEC-RAS PROGRAM RUNS PERFORMED BY S&L