form follows data the symbiosis between design & information...
TRANSCRIPT
Form Follows Data The Symbiosis between Design & Information Visualization
VANDE MOERE Andrew Key Centre of Design Computing & Cognition School of Architecture, Design Science & Planning University of Sydney
Keywords: information aesthetics, information visualization, design, information architecture
Abstract: This paper analyzes the relationships between creative design and the field of information visualization, with a focus on historical connotations and newest developments that show great potential. Examples show how designers often employ information visualization as a creative concept capable of significantly determining the design outcome, and vice versa, how information visualization can be enhanced by exploring interdisciplinary concepts, such as design cognition, user engagement, aesthetics and art. Some of the earliest symbiotic dependencies are explained and demonstrated, including the first conceptual cyberspace and information architecture definitions. This analysis proves that it is useful to consider the role of creative design when developing effective data representations. Vice versa, it is also demonstrated how designers should be more aware of the basic principles and newest developments in information visualization. Finally, several interdisciplinary disciplines are described that show great symbiotic potential in the near future, especially in the fields of ambient displays, informative art and location-based information awareness.
1 INTRODUCTION
Several research approaches demonstrate the close but complex relationships between the disciplines of design and information visualization. On one side, some novel information visualization techniques are emerging that seem to be significantly influenced by creative design, either by artists that attempt to penetrate the field, or by visualization researchers that assimilate insights from related disciplines such as design cognition and art. On the other side, artists and designers increasingly incorporate information collections in their works, as data representations are transformed into new media art, presentation tools and even physical architecture. Accordingly, this paper investigates several directions that demonstrate highly symbiotic dependencies. This research does not attempt to be exhaustive, but instead concentrates on historical connotations and newest developments that show great promise and potential. Notably, this paper solely focuses on the graphical representation of abstract data. This drastically differs from the notion of design visualization, which mainly deals with the exact simulation of

CAADFutures 2005 Full Paper Submission: A Formatting Guideline
2
real-world artefacts. In particular, this paper will demonstrate how creative information visualization is generally more concerned with the emotional state and the engagement of users, using insights of human cognition and perception, rather than to concentrate on task metrics or performance issues.
1.1 Information Visualization
Visualization, the representation of data graphically rather than textually, uses the high-bandwidth human perceptual and cognitive capabilities to detect patterns and draw interferences from visual form. Information visualization has emerged over the past fifteen years as a distinct academic field that is inspired by the fields of computer science, psychology, semiotics, graphic design, cartography and art. Information visualization (also coined ‘infovis’) merges and addresses various research topics, which all circle around the same problem: the use of visual metaphors for representing the structure of and the relationships within abstract datasets and the interaction paradigms that enable effective navigation inside the resulting representations. Abstract data is characterized by its lack of a natural notion of position in space, and its visualization examples include financial models, textual analysis, transaction data, network traffic simulations and digital libraries. Information visualization thus clearly differs from (scientific) visualization of physical data, which implicitly carries the spatial lay-out that can be simulated by graphical reproduction, such as geographic lay-outs, architectural plans or medical imaging. As the data is non-spatial and lacks natural representation, the challenge for information visualization is thus “…how to invent new visual metaphors for presenting information and developing ways to manipulate these metaphors to make sense of the information” (Eick 2001), clearly a creative design question.
1.2 Cyberspace
The original cyberspace concept can be considered as the early predecessor of the symbiosis between design and information visualization. Due to its rapid success throughout many disciplines, the concept of cyberspace became linked to many other imaginative synonyms such as the metaverse, dataspace, matrix, electropolis, cyburbia and cybertecture, rendering the actual term technically unimportant. During the conceptual rise of the cyberspace phenomenon, many researchers were convinced that the field of architecture and design, with its vast expertise in areas such as space perception, history and function organization, was the ideal professional and academic field to conceive cyberspace according to cultural and public needs. So-called cyberspace architects, schooled both in art and computer sciences, were destined to develop virtual, social spaces in which humans could meet, work and play. Notably, the first cyberspace definition foresaw that these cyberspace architects were not solely responsible for the static lay-out, appearance, functionalities or three-dimensional design of the virtual worlds. Instead, early cyberspace explorers (Benedikt 1991, Negroponte 1996) described these designers as creative software architects that program sophisticated software simulation
3
algorithms, capable of translating any abstract data, and all interactions with it, into interpretable visual forms. As the virtual worlds were completely built-up out of data, they thus created ‘inhabitable information visualizations’. In fact, the earliest cyberspace definition mentions the most fundamental principles of information visualization, such as the believable mathematical translation of data into graphical counterparts, the generation of meaningful data clusters and the metaphors required to interact with it: “Cyberspace, a consensual hallucination, experienced daily by billions of legitimate operators, in every nation, by children being taught mathematical concepts. A graphic representation of data abstracted from the banks of every computer in the human system. Unthinkable complexity. Lines of light ranged in the nonspace of the mind, clusters and constellations of data. ....” (Gibson 1984, 67). Obviously, this cyberspace definition can be interpreted as a predecessor of imaginary, user-engaging information visualization: an immersive environment consisting of experiential data structures, offering users a believable, comprehensible model for interactive data and information-organizing aesthetics.
2 INFORMATION VISUALIZATION IN DESIGN
2.1 Presentation & Analysis
One of the earliest stages of a traditional design process consists of preparation, investigation and analysis, in which the designer typically locates relevant data and facts to have a better overview of the design problem and to frame possible end solutions. Often, the resulting data collection contains information in different media types, and includes many contextual parameters that surround the design question. Some designers use this dataset to analyze special features or explore possible remarkable relationships that might be hidden within, to determine and contextualize design decisions. As shown in Figure 1, typical examples include site investigations, in which several abstract features (activities, flows, planning restrictions, etc.) are traced, recorded and interpreted, or electronic project management environments, which enable the organization of document collections (timelines, reports, images, etc.). Often, these datasets become visually represented using the core principles of information visualization, as the goals closely overlap. Many of these design-oriented representations differ from traditional information visualization approaches in the careful attention on visual design and aesthetical quality, the exploration of new visual and interaction metaphors, or the careful attention to user engagement.
2.2 Information Architecture
Since the first use of the term ‘architecture of information’ in 1976 by Richard Saul Wurman at the national conference of the American Institute of Architects (AIA), many conceptual connections between architecture, design and information handling have emerged. Currently, information architecture mainly denotes a professional

CAADFutures 2005 Full Paper Submission: A Formatting Guideline
field that deals with the functional, technical and content specifications of multimedia applications such as websites and information interfaces. It conceptually differs from information design as it focuses on structural rather than presentation issues, although both fields attempt to communicate complex ideas with clarity, precision and efficiency. Consequently, the popular definition of information architecture neglects the architectural meaning in the classical sense, which points to the skilful designer of social spaces who received a background in theory, history and functionality of issues such as presentation, interaction and form interpretation. However, some computer-literate architects still consider the term information architecture to denote the usage of ‘architectural principles’ to design and structure data in such a way that the retrieval and exploration of information becomes more effective (Engeli 2001). Notably, this definition comes close to both that of information visualization, and the analysis/presentation applications and goals mentioned in Section 2.1, although takes into account spatial architectural design knowledge, instead of focusing on task efficiency and algorithmic optimization.
Figure 1. Infovis for design presentation & analysis. Left: programmatic site
analysis (van Berkel and Bos 1999), right: project management (Stouffs 2001).
2.3 Physical Design
Architects have to be competent in both structuring buildings and preparing effective presentations of space, so that people are able to experience the carefully designed qualities of well-considered architectural compositions. Both physical architecture and information architecture have the wish to create liveable, workable and attractive environments. Both fields consider all functional requirements, often referred to as constraints, which a design has to fulfil. These are collected into a so-called program, a term that started to play an important role in the architectural movement towards functionalism, following Louis Henry Sullivan’s concept of ‘form follows function’ and Le Corbusier’s comparison of a house with ‘a machine for living’. Just like architects have to be aware of the occupant’s needs, organize those needs in a coherent pattern, and design a space that meets these expectations, information architects gather, organize and present information to serve a well-defined purpose. Consequently, information architecture is not that different in that respect: it addresses the structural organization and effective presentation of data into valuable and meaningful information. Similar to the original cyberspace definition, this implies that information is considered to be a raw material and the
4

only reality is a virtual one, turning the computer into an instrument, infrastructure and design environment. Next to physical reality and time, information can be declared the 5th dimension of architecture, consisting of architectural knowledge, building regulations, design information and sensory data (Schmitt 1999). Architecture is then considered as a synonym of structure, and information architecture as the field that organizes and presents the ordered, accumulated data. Consequently, one can imagine the concept of ‘form follows data’, or the use of bits as virtual bricks, not only in the context of exploring formalistic data-mapping principles, but also to detect and aesthetically translate inherent structures hidden inside abstract datasets, and to learn the qualities of new visual languages that represent these.
The concept of ‘forms follows data’ can even be uncovered within physically built architecture, demonstrating how far information visualization can influence both the concept and formality of inhabitable designs. Examples include, next to information-displaying dynamic facades, displays, billboards and lighting effects found within modern buildings, van Berkel and Bos’ Moebius House and MvRdV’s Dutch Pavilion at the World Expo 2000, both depicted in Figure 2. Both buildings are examples how analytical data can be literally translated into an architectural program and interesting formality, shaping perpetual daily activities, or layering the essential features of a country as a human-scale information visualization.
Figure 2. Real-world buildings as information visualizations. Left: Moebius
House (van Berkel and Bos 1999), right: Dutch Pavilion (MVRDV)
3 DESIGN IN INFORMATION VISUALIZATION
Currently, most information visualization research efforts are mainly focused on task metrics measurements, usability enhancements and organization algorithms for massive amounts of raw data. As research increasingly dealt with such efficiency and convenience considerations, assimilation of insights taken from other disciplines, such as interaction design, art and computer graphics seem to have been neglected. However, this section will demonstrate how design is slowly but increasingly influencing significant aspects of information visualization, and demonstrates how spatial designers can apply their knowledge and experience to create engaging, aesthetic and meaningful data representations.
5

CAADFutures 2005 Full Paper Submission: A Formatting Guideline
3.1 Design Cognition
Figure 3. Design cognition in infovis. Left: paint-inspired color mixing (Gosset
and Chen 2004), right: art-inspired weather chart (Healey and Enns 2002).
Some information visualization researchers attempt to incorporate insights from design-oriented cognitive studies to enhance the effectiveness of specific data representation techniques. For instance, Gosset and Chen (2004) developed a novel colour compositing technique that makes colour blending more intuitively understandable for chart-based visualizations (Figure 3). As most visual designers might notice, and although no real acknowledgements are mentioned, their contributions seem to be, maybe unconsciously, influenced by advancements from colour theory and human visual perception. Other researchers strongly believe that effectiveness and aesthetics may not be as independent as they initially seem. Healey et al. (2002) have investigated artistic insights from disciplines such as human psychophysics, art theory and history to learn how people perceive the world, and how artistic designers capture people’s attention by evoking emotional responses. As a result, they propose effective and engaging weather data visualizations (Figure 3) that vary along an emotional dimension while tracing the changes in effectiveness to represent data.
3.2 Design Metaphor
Figure 4. The city as a data mapping metaphor. Left: file system representation
(Russo Dos Santos et al. 2000), right: Data Town (Maas and MvRdV 1999)
Metaphors in visualizations are used to help user understand systems in term of
6
concepts they already know, appealing to initial familiarity and experience. Spatial metaphors try to exploit the unique human ability to organize objects in space, using spatial cognition and perception. Since long, visualization experts have incorporated known theories of space perception and way-finding to present users with data representations that attempt to be immediately understandable and easy to navigate. Accordingly, many data representations are known that use a city structure to spatially organize data, made by both visualization researchers as well as designers, such as Cybernet’s file system representation or MvRdV’s Data Town (Figure 4).
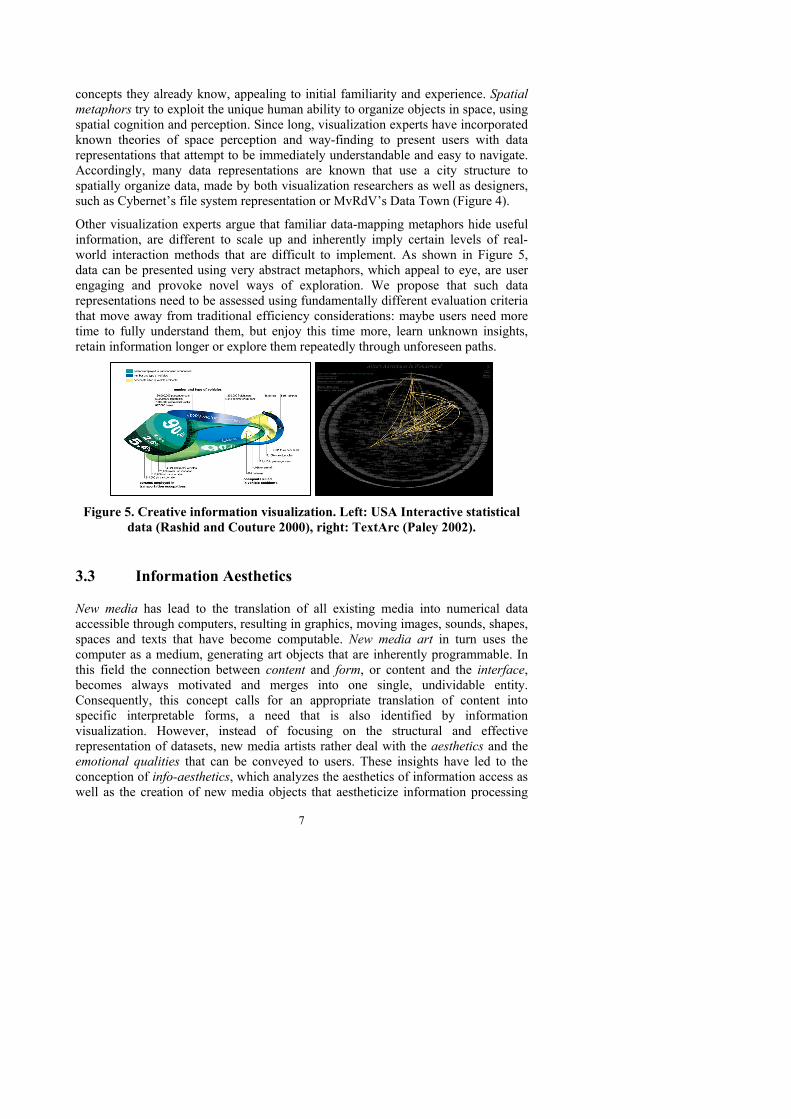
Other visualization experts argue that familiar data-mapping metaphors hide useful information, are different to scale up and inherently imply certain levels of real-world interaction methods that are difficult to implement. As shown in Figure 5, data can be presented using very abstract metaphors, which appeal to eye, are user engaging and provoke novel ways of exploration. We propose that such data representations need to be assessed using fundamentally different evaluation criteria that move away from traditional efficiency considerations: maybe users need more time to fully understand them, but enjoy this time more, learn unknown insights, retain information longer or explore them repeatedly through unforeseen paths.
Figure 5. Creative information visualization. Left: USA Interactive statistical
data (Rashid and Couture 2000), right: TextArc (Paley 2002).
3.3 Information Aesthetics
New media has lead to the translation of all existing media into numerical data accessible through computers, resulting in graphics, moving images, sounds, shapes, spaces and texts that have become computable. New media art in turn uses the computer as a medium, generating art objects that are inherently programmable. In this field the connection between content and form, or content and the interface, becomes always motivated and merges into one single, undividable entity. Consequently, this concept calls for an appropriate translation of content into specific interpretable forms, a need that is also identified by information visualization. However, instead of focusing on the structural and effective representation of datasets, new media artists rather deal with the aesthetics and the emotional qualities that can be conveyed to users. These insights have led to the conception of info-aesthetics, which analyzes the aesthetics of information access as well as the creation of new media objects that aestheticize information processing
7

CAADFutures 2005 Full Paper Submission: A Formatting Guideline
(Manovich 2001). Info-aesthetics even considers existing computer interfaces, often not designed by artists or interaction experts, as true forms of art, calling them the modernistic, monumental artefacts of the contemporary information society. This concept suggests that a specific form of aesthetics exists in everyday information tools and interfaces. More importantly, it argues that computer applications employed in industry and science, such as simulation, visualization and databases, are new cultural forms of the information society. Accordingly, we would propose that these software tools should not only be designed by interaction engineers and software experts, but that designers are required to create novel forms of information art, that appeal also to user engagement and aesthetics and provoke long and enjoyable usages, rather than to focus solely on task metrics and effectiveness.
3.4 Informative Art & Ambient Displays
The informative art movement consists of specially designed, computer-augmented or -amplified, works of art that are not only aesthetical objects but also information displays, in as much as they dynamically reflect information about their environment (Redström et al. 2000). The employed visual metaphors typically include the manipulation of known art styles or works of art, mapping parts or properties of the composition to different sources of data, and letting it change over time. In a similar way, the concept of ambient displays ports information visualization to the built environment. Ambient displays are abstract and aesthetic displays portraying non-critical information in the periphery of a user’s attention. Following the concept of morphing architectural spaces and surfaces into interactive ‘interfaces’, such displays are capable to present information within a space through subtle changes in light, sound and movement, which can be processed in the background of awareness (Ishii and Ullmer 1997). Consequently, this research ports several aspects of information visualization into new realms of design, hereby incorporating the concepts of aesthetics, architectural space experience and multimodal interaction metaphors. Similarly, Figure 6 shows wind-generating pinwheels that represent flows of electronic data in blows of wind, and a projected ‘wallpaper’ that is both a public, aesthetic painting as well as a slowly changing representation of activity levels captured by non-intrusive microphones.
Figure 6. Ambient infovis. Left: Phinweels (Dahley et al. 1998), right: Activity
Wallpaper (Skog 2004)
8
9
4 FUTURE
A general tendency exists to combine newest computer science technologies, such as virtual reality, tangible interfaces, or computer vision techniques, for creative design processes, or to combine aspects of user engagement and user experience, as seen in game and multimedia design, with modern software applications. However, mainly due out of a strong focus on task effectiveness considerations and the multitude of unpredictable influential factors when employing cutting-edge technology, information visualization has been assimilating these insights remarkably slowly. Nevertheless, in the information society of today, users tend to enter the digital realm either for social activities or to perform some sorts of information processing, and this over longer periods of time, requiring new forms of information architecture design. In addition, we can perceive a current trend in portable input and output devices that trace, store and make users aware of a rich set of informational sources. So-called ubiquitous computing is moving into the direction of location-based information awareness, so that users can both access and author dynamic datasets based upon a geographical context through several electronic media. Many people are unaware of these invisible, but ever-present abstract data layers that trace our everyday presence in several dimensions, including shopping habits, communication and transportation activities or even our emotional states. It is only a question of time before other design research fields, such as urban planning, want to visually represent and analyze this location-based knowledge by adding user experiential and sensor-tracked datasets to their otherwise lifeless and static urban models. On a smaller scale, as an increasing number of non-intrusive input devices are installed in our everyday world, even rooms are becoming aware of people’s presence, wishes, demands and activities. Building automation services enable spaces to react to dynamic, physical conditions or external data sources in real time. Currently, these interactions are typically programmed by engineers, and imply simple action-reaction rules, such as the control of lights, security or climate control: what would be possible if these tools are offered to designers, concerned with the emotional state of people? Consequently, as the built environment and our physical body are converted into information interfaces, designers are becoming the ideal experts to interpret the collection of spatial, abstract datasets and to develop suitable data representation metaphors that create ambient, spatial and inhabitable experiences.
5 DISCUSSION
This paper has collected several contemporary movements in which design influences information visualization, or vice versa, in which data representation significantly determines conceptual design. We have demonstrated that design is starting to force information visualization approaches to consider interdisciplinary issues, such as the engagement and mental immersion of users, the use of design cognition insights and the role of aesthetics in the effectiveness of data representations. Vice versa, the design field should be more aware of the principles and developments in information visualization, as these would significantly render

CAADFutures 2005 Full Paper Submission: A Formatting Guideline
10
them more effective. Evidently, more research is required to detect and predict how theories, historical analysis and experiences taken from artistic disciplines such as design can support further developments in the field of information visualization.
REFERENCES
Benedikt, M., 1991. Cyberspace: First Steps. MIT Press, London. Dahley, A., Wisneski, C., Ishii, H., 1998. Water Lamp and Pinwheels: Ambient
Projection of Digital Information into Architectural Space, Conference on Human Factors and Computing Systems (CHI'98), ACM, pp.269-270.
Eick, S.G., 2001. Visualizing Online Activity. Communications of the ACM 44 (8), 45-50.
Engeli, M., 2001. Bits and Spaces: Architecture and Computing for Physical, Virtual, Hybrid Realms 33 - Projects by Architecture and Caad, Eth Zurich. Birkhauser, Basel.
Gibson, W., 1984. Neuromancer. Ace Books. Gosset, N., Chen, B., 2004. Paint Inspired Color Mixing and Compositing for
Visualization, IEEE Information Visualization (Infovis 2004), IEEE, pp.113-117.
Healey, C.G., Enns, J.T., 2002. Perception and Painting: A Search for Effective, Engaging Visualizations. IEEE Computer Graphics & Applications 22 (2), 10-15.
Ishii, H., Ullmer, B., 1997. Tangible Bits: Towards Seamless Interfaces between People, Conference on Human Factors in Computing Systems (CHI'97), ACM, pp.234-241.
Maas, W., MvRdV, 1999. Metacity / Datatown. 010 Publishers, Rotterdam. Manovich, L., 2001. Information and Form. http://www.manovich.net/ia/. Negroponte, N., 1996. Being Digital. Knopf, New York. Paley, W.B., 2002. Textarc. http://www.textarc.org/. Rashid, H., Couture, L.A., 2000. USA Interactive. In: Wurman, S.R. (Ed.),
Understanding. Ted Conferences, pp.324. Redström, J., Skog, T., Hallnäs, L., 2000. Informative Art: Using Amplified
Artworks as Information Displays, Designing Augmented Reality Environments (DARE 2000), ACM Press, pp.103-114.
Russo Dos Santos, C., Gross, P., Abel, P., Loisel, D., Trichaud, N., Paris, J.P., 2000. Mapping Information onto 3d Virtual Worlds, International Conference on Information Visualisation (IV2000), pp.379-388.
Schmitt, G.N., 1999. Information Architecture Basis and Future of Caad. Birkhäuser, Basel.
Skog, T., 2004. Activity Wallpaper: Ambient Visualization of Activity Information (Poster), Proceedings from Designing Interactive Systems (DIS), ACM.
Stouffs, R., 2001. Visualizing Information Structures and Its Impact on Project Teams: An Information Architecture for the Virtual Aec Company. Building Research & Information 29 (3), 218-232.
van Berkel, B., Bos, C., 1999. Move - UN Studio. Architectura & Natura.