forex medium-term outlook · medium-term forex outlook m2 izuho bank ltd
TRANSCRIPT

Forex Medium-Term Outlook
28 September 2018
Mizuho Bank, Ltd. Forex Department
Medium-Term Forex Outlook Mizuho Bank Ltd. 1
【Contents】 Overview of Outlook ・・・・・・・・・・・・・・・・・・・・・・・・・・・・・・・P. 2 USD/JPY Outlook –Why is the Deadlock Continuing? The Reason Behind a Deadlock in the Forex Markets – The Result of Avoiding Emerging Economies ・ ・ ・・・・ ・ ・・・・ ・ ・・・・ ・ ・・・・ ・ ・・ ・ ・・ ・ ・・ ・ P. 3 Potential Seeds of the Next Crisis Drawing Attention 10 Years Since the Collapse of Lehman Brothers – Credit to the Private Sector, Emerging Economies, and Corporate Sector may be Key・・・・・・・・・・・・・・・・・・・・・・・・・・・・・・・・・・・・・・P. 4 The Current State and Future Direction of U.S.-China Trade War – Will the U.S. not Learn Until it Suffers a Splash-Back?・・・・・・・・・・・・・・・・・・・・・・・・・・・・・・P. 6 U.S. Monetary Policies Now and Going Froward – Turning Point in Sight・・・・・・・・・・P. 7 Risks to the Main Scenario – Reconsidering the Question of Overkill ・・・・・・・・・・・ P. 9 EUR Outlook – Pipe Dream of Making EUR the Leading International Key Currency ECB monetary policies now and going forward – Hints Regarding Reinvestment Policies and Response to EUR Appreciation・・・・・・・・・・・・・・・・・・・・・・・・・・P. 13 Pipe Dream of Making EUR the Leading International Key Currency – Juncker’s State of the Union Address・・・・・・・・・・・・・・・・・・・・・・・・・・・・・・・・・・・・P. 17

Medium-Term Forex Outlook Mizuho Bank Ltd. 2
Overview of Outlook USD/JPY strengthened in September, but I would not go so far as to say that the deadlock has been broken. In the forex markets, a larger trend of selling emerging currencies and buying key currencies has been continuing, and USD, JPY, and EUR are all strong on an effective basis. The present situation can, therefore, be summed up by saying that selling trends are focused mainly on emerging currencies with no clear balance of power among developed currencies. Having said that, the protectionist stance of the U.S. is intensifying, with the possibility of sanctions against China in terms of import value. So far, we have been hearing that “the trade wars, though widely reported, have had very little real impact,” but we may now be entering a phase when that cliché no longer holds true. Trade frictions essentially cause bond prices to strengthen and share prices to weaken, and if the current situation deteriorates, the markets will certainly fall back on this natural response. Meanwhile, some insist that there is no need to be concerned about the Fed’s policy operations for reasons including that the effective short-term interest rate remains lower than the potential growth rate. However, even if the U.S. economy can withstand the Fed’s rate hikes, emerging economies may not be able to similarly withstand them. It must not be forgotten that the Federal Fund rate is ultimately the cost of capital for the world at large. The reason we have been seeing such turmoil in emerging markets since early this year is because of the continued rate hikes in the U.S. Ironically, so long as the robustness of the U.S. economy prompts the Fed to raise its interest rates, emerging economies will suffer, and my basic understanding is that the Fed cannot afford to ignore this situation beyond a certain point. EUR has been strong through September. In the early days of the Turkish currency crisis, EUR was sold, but now, effective EUR strength is rather being boosted by TRY-selling and EUR-buying pressures. In fact, it is only against the other key currencies (USD and JPY) that EUR has weakened since the beginning of the year – it has appreciated against all the other currencies. Having said that, there are many potential pitfalls ahead for the currency during the current forecasting period. The political uncertainties in Italy remain unresolved and will unavoidably come to the fore in October. Even more precarious is the fate of the UK’s Brexit (leaving EU) negotiations. Going by some of the media reports leaking out, even UK Prime Minister Theresa May seems to be giving up. A cliff-edge Brexit, which had until now been considered a tail risk, is increasingly seeming likely. Will the ECB be able to continue with its policy normalization in a matter-of-fact way under such circumstances? I think that a rate hike during the current forecasting period is unlikely, as is an acceleration in EUR appreciation. However, the currency may maintain its strength thanks to USD weakening. Summary Table of Forecasts
USD/JPY 104.64 ~ 113.57 108 ~ 115 105 ~ 112 103 ~ 110 100 ~ 108 100 ~ 108
EUR/USD 1.1300 ~ 1.2556 1.14 ~ 1.19 1.13 ~ 1.20 1.13 ~ 1.20 1.14 ~ 1.21 1.14 ~ 1.21
EUR/JPY 124.62 ~ 137.51 127 ~ 134 124 ~ 131 121 ~ 128 118 ~ 128 118 ~ 128
2018 2019
(103)
Jan - Sep (actual) Oct-Dec Jan-Mar Apr-Jun Jul-Sep Oct-Dec
(113.57) (110) (109) (107) (105)
(121)
(1.1641) (1.17) (1.16) (1.16) (1.17) (1.17)
(132.21) (129) (126) (124) (123)(Notes) 1. Actual results released around 10am TKY time on 28 Sep 2018. 2. Source by Bloomberg 3. Forecasts in parentheses are quarter-end levels Exchange Rate Trends & Forecasts
70
80
90
100
110
120
130
09/3Q 10/3Q 11/3Q 12/3Q 13/3Q 14/3Q 15/3Q 16/3Q 17/3Q 18/3Q 19/3Q
USD/JPY

Medium-Term Forex Outlook Mizuho Bank Ltd. 3
1.0
1.1
1.2
1.3
1.4
1.5
1.6
09/3Q 10/3Q 11/3Q 12/3Q 13/3Q 14/3Q 15/3Q 16/3Q 17/3Q 18/3Q 19/3Q
EUR/USD
85
95
105
115
125
135
145
155
09/3Q 10/3Q 11/3Q 12/3Q 13/3Q 14/3Q 15/3Q 16/3Q 17/3Q 18/3Q 19/3Q
EUR/JPY
USD/JPY Outlook – Why is the Deadlock Continuing? The Reason Behind a Deadlock in the Forex Markets – The Result of Avoiding Emerging Economies A Clear Pattern of Avoiding Emerging Currencies For most of the current year, key currency exchange rates have been in a deadlock. The graph plots the nominal effective exchange rate (NEER) trends of the various key currencies. As one can see, USD underwent significant adjustment last year by weakening across the board, but most of that adjustment has been reversed this year. In fact, this effective underlying strength is not just limited to USD but applies also to JPY and EUR, which have also been strengthening. As I have repeatedly emphasized in past issues of this report, so long as the federal funds (FF) rate, which functions as the cost of capital for the world at large, continues to be raised, and given that the Fed has additionally started reducing the size of its balance sheet, capital will inevitably flow out of relatively risky asset markets going forward. These include emerging economy markets and corporate bond markets – in the case of the latter, the credit spread has been expanding since early this year even in the U.S. Naturally, key currencies like EUR and JPY do not fall into the category of “relatively risky asset markets.” As the graph above shows, although USD has been appreciating much faster than rest since early this year, EUR and JPY have not been depreciating either. For instance, although EUR has depreciated by 3.5% compared with USD this year (as of August 31), its NEER has, in fact, increased by 3.5%. Why is this? Obviously because the impact of EUR being bought against other currencies outweighs the impact of EUR being sold off against USD. The table to the right analyzes the various factors behind EUR’s NEER in terms of the level of contribution from each currency. To be sure, EUR has depreciated against USD, which has one of the highest shares, and a -0.5 pp decrease in NEER can be attributed to USD for the period of the chart. On the other hand, EUR has appreciated significantly compared with TRY and other Eastern European currencies, resulting in an overall increase in its NEER. In particular, EUR’s appreciation against TRY is so significant as to more than cancel out its depreciation against USD by a wide margin, underscoring the typical pattern of a key currency being shored up by capital outflow from an emerging country. Although there are some exceptions in the form of Asian currencies supported by strong current account surpluses, there is now a clear market trend toward shifting capital away from emerging currencies and into the currencies of advanced economies.
70
80
90
100
110
120
130
140
2013 2014 2015 2016 2017 2018
(JAN 2013=100)
(Source)BIS (Note) Broad base
NEERCNH EUR JPYUSD GBP JAN 2013=100
Up↑
NEER↓
Down
Country Share USD vs . each ccy(%) JAN-AUG 2018
Contribution(%pts)
US 13.2 3.5 -0.5China 17.9 -1.5 0.3
UK 9.9 -0.1 0.0Japan 5.2 5.0 -0.3
Poland 5.0 -2.6 0.1Sweden 3.5 -7.5 0.3Russia 3.4 -11.7 0.4Turkey 3.0 -39.9 1.2
S.Korea 2.8 -0.5 0.0Hungary 2.3 -4.8 0.1
India 2.3 -6.9 0.2Others 31.6 - 1.7
EUR NEERJAN-AUG 2018
- 3.5 3.5
(Source)BIS & Bloomberg. (Notes) NEER: Broad bas eCurrency rate of change: 29DEC2017-31AUG2018
EUR NEER JAN-JUL 2018

Medium-Term Forex Outlook Mizuho Bank Ltd. 4
The Reason Behind a Deadlock in the Forex Markets The situation described above is probably one of the reasons why the key currencies have been in a deadlock in the forex markets this year. While no clear sense of direction is emerging in currency pairs that involve two advanced currencies, a clear bias is visible in transactions involving one advanced currency and one emerging currency. In other words, in the rush to sell emerging currencies, there has emerged no clear balance of power among the advanced currencies. Of course, a part of the reason for this situation may be the continuing “Goldilocks” state (low inflation, high growth) of the U.S. economy, which is fundamentally unconducive to volatility in the markets. However, the fact remains that the plight of emerging economies is drawing much more attention than the fate of major currency pairs such as USD/JPY or EUR/USD at this moment. And it seems very likely that this plight of emerging economies will continue so long as the Fed continues to raise its rates and the gap between U.S. and emerging country interest rates continues to shrink. In fact, precisely because of this, it is quite logical for capital to drain out of emerging economies (see figure). Is the Current Situation Reminiscent of 2006 or Early 2007? The main question, however, is – how long can the Fed afford to ignore this problem and continue policy normalization? If domestic inflationary pressures in the U.S. were too high to overlook, then it would make sense for the Fed to continue its policy normalization process with no thought for other economies. However, things are not that dire in the U.S. Ordinarily, the trigger for the Fed to switch policy direction would be predictions of a U.S. economic slowdown, but if things continue the way they are going, turmoil in emerging markets may end up acting as the trigger this time. It is my basic understanding that a clear sense of direction will emerge in key currency exchange rates when the Fed changes its policy direction – specifically, when the situation becomes such that the “next move” is not expected to be “a rate hike.” So far, thanks to domestic and overseas economies holding firm in the face of U.S. interest rate hikes, no major crisis has erupted, but there are already signs of some economies being unable to withstand the pressures of U.S. rate hikes. The current situation is reminiscent of the highly extolled period of “great calm” during 2006 and early 2007, which was soon followed by a severe phase of adjustment. Potential Seeds of the Next Crisis Drawing Attention 10 Years Since the Collapse of Lehman Brothers – Credit to the Private Sector, Emerging Economies, and Corporate Sector may be Key Seeds of the Next Crisis are Everywhere September marked the 10th year since the collapse of Lehman Brothers, which invited a number of debates regarding “seeds” of the next crisis. Any number of things could potentially be the “seeds” of the next crisis, but the accumulation of credit to the non-financial private sector (hereafter: credit to the private sector) is of particular concern. China, Hong Kong, Canada, and France are among some of the specific names of countries/regions coming up in this context. It is interesting in this context to ask whether the excessively indebted entity is an advanced or developing country/region or the corporate or household sector. In the following sections, I would like to take a look at the current state and future outlook of global credit to the private sector in order to understand where the seeds of the next financial crisis could lie. Rise in Credit to the Private Sector Led by Emerging Economies Let us begin with the conclusion – it is emerging rather than developed economies that are drawing the most attention in the context of an increase in credit to the private sector. In past issues of this report, I focused on the problem of the German current account surplus imbalance and the associated soaring of the country’s asset prices. On a global level, the clearest change that can be observed since the 2008 financial crisis has been an increase in credit to the private sector in emerging countries. This is very obvious from the graph to the right. Credit to the private sector (as a percentage of GDP) in developed countries has remained level before and since the crisis,
3.0
3.5
4.0
4.5
5.0
5.5
6.0
6.5
7.0
0.0
1.0
2.0
3.0
4.0
5.0
6.0
7.0
8.0
9.0
10.0
14 15 16 17 18(Source)Bloomberg
US & EM excl China 10yr yield & interest rate gap
UST & interest rate gap (right axis)
EM 10yr yield
US 10yr yield
(%) (%pt)
Profitable investment to USD assets has improved relatively
40
60
80
100
120
140
160
180
200
00 01 02 03 04 05 06 07 08 09 10 11 12 13 14 15 16 17
(% vs GDP)
(Source)BIS, Datastream
Credit to private non-financial sector (Global, developed countries & emerging countries)
Global Developed countries Emerging countries

Medium-Term Forex Outlook Mizuho Bank Ltd. 5
but in emerging countries, it has nearly doubled from 77% of GDP before the crisis (in September 2008) to around 144% of GDP (as of December 2017). As is widely known, the central banks of Japan, Europe, and the U.S. implemented unrestrained monetary easing following the crisis, causing low interest rates to take root as a trend globally, lowering the barriers to fund procurement, and helping whet consumption and investment appetites. This was quite inevitable, given expanding liquidity on top of the fact that emerging economies are the frontiers of the global economy. Combine excess liquidity with the myth of emerging economies being growth markets, plus the “animal spirit” of the search for yield, and the result is an expansion in credit to the private sector as a percentage of GDP in emerging economies to levels not very different from those in advanced economies. Especially of Concern is Credit to the Corporate Sector in Emerging Countries Another question that arises when we talk about credit to the private sector (called “non-financial private sector” in the statistics) is whether corporate or the household sector is the bigger problem. For instance, following the subprime mortgage crisis and the collapse of Lehman Brothers, the excessive debts of the household sector in the U.S. economy became a problem. On the other hand, it was the excessive debts of the corporate sector that were the problem following the collapse of the bubble in Japan in the 1990s. When the household sector is burdened by excessive debts, the real economy begins to crumble starting with important GDP components such as personal consumption and housing investment, which eventually affect the corporate sector too. Meanwhile, when excessive corporate sector debts are the problem, fixed investments are the first casualty, but the effects spill over into employment and wages, which then affect the household sector. Regardless of which sector the problem begins with, the outcome is never good because the economy is interconnected. Still, it is useful to know where the problem originated. To answer the question posed at the beginning of this paragraph, the problem this time is led by the corporate sector. Due to limitations of available data, we do not have sector-wise credit information for emerging economies (and for the world including these economies) from before 2008, but it is easy to guess that the recent pace of increase in credit to the corporate sector is probably far from ordinary when seen in historical terms (see graph). Abnormal Growth in Credit to the Corporate Sector in Hong Kong The implications remain the same even when the information is categorized by country/region. As I pointed out in last month’s issue of this report, in the case of China and Hong Kong, while there is certainly some increase in credit to the household sector, the rise in credit to the corporate sector is much more conspicuous (see graph). The figures for Hong Kong, which show an around 100 pp increase compared with September 2008, especially stand out. Of course, Hong Kong, being an international financial center, is a bit special and should not be compared simplistically with other regions, but opinion is bound to be divided on whether this level of increase in credit to the corporate sector can be considered healthy. As mentioned above, excessive corporate sector debt was seen as a problem in Japan following the collapse of the bubble, but the peak level of debt seen at that time was 147.6% at the end of December 1993. In this context, it must be noted that debt levels as of the end of December 2017 were 160.3% in China, 232.3% in Hong Kong, 114.0% in Canada, and 133.8% in France – levels either close to or greatly surpassing those in Japan during the 1990s. When one remembers that the excessive debts in the Japanese corporate sector turned into bad loans, directly affecting the financial system and resulting in the “lost two decades” due to the time and effort taken to clean them up, it is not far-fetched to believe that the excessive corporate sector debts in some of the above countries could become the seeds of the next crisis. Incidentally, even though the pace of increase in credit to the corporate sector is higher in emerging countries overall, there are some emerging countries in which the pace of increase in credit to the household sector is higher than that to the corporate sector – like South Korea, for instance, where the household sector is of greater concern than the corporate sector. At any rate, with the Fed (as of the moment) going ahead with rate hikes without a thought for overseas economic conditions and the ECB set to join it next year, the financing environment for emerging economies is bound to deteriorate. I believe that an adjustment in this expansion of credit to the private sector (the corporate sector in
50
60
70
80
90
100
110
00 01 02 03 04 05 06 07 08 09 10 11 12 13 14 15 16 17 18
(% vs GDP)
(Source)BIS
Credit to corporate sector (% vs GDP)
Global Developed countries Emerging countries
-20
0
20
40
60
80
100
120
Global Developedcountries
Emergingcountries
China HK Canada France
(%pts vs GDP)
(Source)BIS
Credit to private corporate & household sector("Dec2017"-"SEP2008")
Corporate sector
Household sector

Medium-Term Forex Outlook Mizuho Bank Ltd. 6
particular) globally could become a trigger for the next crisis. Following the collapse of Lehman Brothers, the financial markets were activated and able to recover by catching on to the myth of growth in emerging markets. Given that, it is truly frightening to think of the possibility of emerging economies going into stagnation for a protracted period. The Current State and Future Direction of U.S.-China Trade War – Will the U.S. not Learn Until it Suffers a Splash-Back? A Change in Strategy to Comprehensive Tariffs All at Once The trade war between the U.S. and China seems finally about to begin in real earnest, but the financial markets are still showing no signs of concern, with JPY continuing to depreciate and share prices continuing to strengthen in Japan. U.S. interest rates are also continuing to rise, and the mood in the financial markets seems to suggest that a trade war between the U.S. and China is nothing to worry about. I find it extremely discomfiting, however, that there is a predominant mood of risk preference in the markets even as the U.S. prepares to impose an over 20% tariff on imports from China. I would like to provide an overview of the situation in this section. On September 17, the administration of U.S. President Donald Trump announced that it would impose an additional 10% tariff on USD 200 billion worth of imports from China under Section 301 of the Trade Act of 1974 starting September 24, and this tariff has indeed gone into effect as of the time of writing this report. Some media reports are calling this the third phase of tariffs, continuing on from the July 6 tariff on USD 16 billion worth of imports and August 23 tariff on USD 34 billion worth of imports, but going by what President Trump originally said – that there would be three phases of tariffs, starting with a 25% tariff on USD 50 billion worth of imports, an additional 10% tariff on USD 200 billion worth of imports should China retaliate, and a further 10% tariff on USD 200 billion worth of imports if the retaliation continued – the additional tariffs imposed on September 24 appear to be the second phase. It would appear that because the first phase, which was imposed in piecemeal fashion in the hope that China would meet the U.S. halfway, did not go as expected, a much more comprehensive tariff was imposed all at once in the second phase (from here onward, I shall refer to the recent additional tariff on USD 200 billion worth of imports as the “second phase.”) Further, the tariff rate related to this second phase will reportedly be 10% for the rest of this year but raised to 25% in January 2019. This appears to be a strategy aimed at eliciting a concession from China by implementing a piecemeal increase in the tariff rate rather than on the value of goods imported. At any rate, approximately USD 250 billion of imports, an amount equivalent to half the total U.S. imports from China in 2017 (≈ USD 506.3 billion), will soon be subject to punitive tariffs. As usual, China immediately responded with retaliatory measures, imposing a tariff on USD 60 billion worth of liquefied natural gas (LNG) imports from the U.S. starting the same day (September 24). President Trump has already declared that any retaliation from China would invite tariffs on a further USD 267 billion worth of imports, which is a slight increase in the value from the originally planned USD 200 billion worth of imports. In other words, the intention seems to be to slap tariffs on the entire value of imports from China, and the details of this third phase are also likely to emerge in the coming days. Punitive tariffs on China, which were applied to a mere USD 50 billion worth of imports three months ago, have been expanded to cover a significantly higher value of imports in no time, but the financial markets appear unable to comprehend the seriousness of the situation. Splash-Back Inevitable for the U.S. Notwithstanding the declaration that tariffs will apply to the full value of imports from China, it is also being said that certain products belonging to U.S. technology giants will be exempted. Perhaps unintentionally, this reveals the authorities’ concerns of a “splash-back” from their own hardline stance. Of the various products that the U.S. imports from China, the largest shares go to “mobile phones and others” (13.9%), “computers” (9.0%), “communications equipment” (6.6%), and “computer peripherals” (6.3%), and imports from China account for over 40% to under 70% of the total U.S. imports of these products (see figure). Naturally, expanding the range of products subject to tariffs will result in the prices of these products going up. It will be interesting to see whether the year-end sales seasons in the U.S. are affected by this. Even just based on such points, the current mood of risk preference seems rather hard to explain.
66.1% 66.0%
45.1%53.2%
74.3%
48.1%
78.0%
0.0%
10.0%
20.0%
30.0%
40.0%
50.0%
60.0%
70.0%
80.0%
90.0%
(Source) BEA (Note) The share of imports from China within the total imports of each product from around the world
US import from China by items in 2017

Medium-Term Forex Outlook Mizuho Bank Ltd. 7
IMF’s Analysis vs. the Financial Markets The IMF analyzed the effects of a trade war and released a report on it in July, which drew wide attention. Technically, the report, titled “The Global Impact of Escalating Trade Actions,” was an Annex to the “G20 Surveillance Note,” which was the discussion memorandum for the G20 meeting of finance ministers and central bank governors held in Buenos Aires on July 21-22. As widely reported, the report predicted that the U.S. would be the hardest hit “in the most severe” scenario, estimating a -0.8% drop in GDP during the first year. Apart from this, the global GDP was estimated to fall by -0.4%, emerging economies in Asia were calculated to see a -0.7% decline, Japan and Central and South American nations were expected to see a -0.6% decline, while the euro area was expected to see a -0.3% decline in GDP. Incidentally, the caveat “in the most severe scenario” indicates that other scenarios exist, and in fact, the IMF outlined four different scenarios – Scenario 1 (adopted tariffs), Scenario 2 (additional tariffs), Scenario 3 (car tariffs), and Scenario 4 (confidence shock). Specifically, Scenario 1 assumes higher tariffs on U.S. imports of steel (25%) and aluminum (10%), a 25% 301 tariff on USD50 billion worth of U.S. imports from China (the first phase), and retaliation from China through the imposition of a 25% tariff on USD 50 billion worth of imports from the U.S. Scenario 2 assumes an additional 10% tariff on USD 200 billion worth of U.S. imports from China (the second phase) with retaliation of equivalent size from China. Scenario 3 assumes an additional 25% tariff on U.S. imports of vehicles with retaliation from all affected regions on an equivalent amount of U.S. exports. Scenario 4 assumes significant damage to corporate confidence due to concerns over a trade war, resulting in a global decline in investment appetite. Note that the simulations assume that the aforementioned additional tariffs will be implemented permanently. The simulated situation gets increasingly severe as we progress from Scenario 1 to Scenario 4, but it must be noted that we are already at Scenario 2. Or rather, we may be between Scenarios 2 and 3, considering that the second phase tariff rate may be raised to 25% early next year and that the extra tariffs are hinted at possibly being extended to an additional USD 267 billion worth of imports from China. As per the IMF simulation, only the U.S. will suffer losses in every scenario, with regions including the euro area and Japan rather profiting from the troubled situation up to Scenario 3 (compared with the baseline scenario). This is as it should be. As it is the U.S. that is taking the fight to various countries, it is only natural that the U.S. economy will face retaliation from various sides and (at least as per the simulation) suffer the largest negative effects (the report calls this the “hub and spoke” nature of mutually enforced tariffs). In other words, it would be poetic justice and well-deserved punishment. However, the financial markets tell an entirely different story. The Fed is the only central bank raising rates, U.S. interest rates are rising, and U.S. shares are the only ones doing well (see graph). Market participants are left standing on the brink, wondering whether to believe the IMF or the markets, which are reflecting a reality that is in complete contrast with the IMF analysis. I would personally like to believe that the IMF’s reading of the situation is correct. In a blogpost, IMF Managing Director Christine Lagarde warned that “while all countries will ultimately be worse off in a trade conflict, the US economy is especially vulnerable because so much of its global trade will be subject to retaliatory measures.” This seems to be the most straightforward and accurate view of the current situation. If additional tariffs are imposed on USD 200 billion worth of products and expanded to a further USD 267 billion worth, the damage is bound to be reflected in U.S. economic indicators. If anything can cause the Trump administration to repent and backtrack from its increasingly protectionist stance, it is this kind of “splash-back.” But perhaps the recent trade frictions between the U.S. and China go beyond a simple ideological battle between protectionism vs. free markets; perhaps they have to do with a struggle for hegemony in the high-tech industry. If so, the retaliatory battles could continue despite splash backs. It is extremely difficult to understand the optimism in the financial markets under these circumstances, but the fact remains that market trends have remained robust for a long time, showing absolutely no concern for the consequences of a trade war. I think it is important not to be swayed by these trends in preparing my outlook. U.S. Monetary Policies Now and Going Froward – Turning Point in Sight Turning Point in Sight As expected, the FF rate was raised by 0.25 pp from 1.75-2.00% to 2.00-2.25% at the September 25-26 FOMC meeting. According to the dot plot (interest rate projections) by Committee members, the median of projections involves one more rate hike this year, three rate hikes in 2019, and one in 2020. 2021 was newly included in the chart this time, but zero rate hikes were indicated for it. The deletion of the line “The stance of monetary policy
-25
-20
-15
-10
-5
0
5
10
15
18/01 18/02 18/03 18/04 18/05 18/06 18/07 18/08 18/09
(Changing ratio %)
(Source)Bloomberg
Major stock index US(NY Dow)
Japan(Nikkei)
China(SSEComposite)
S. Korea(KOSPI)
Germany(DAX)
UK(FTSE100)
Brazil(IBOV)
HK(Hang Seng)
China
US

Medium-Term Forex Outlook Mizuho Bank Ltd. 8
remains accommodative” from the FOMC statement drew attention, but even this revision is as expected given the hint of an end to rate hikes in the dot plot. In fact, there has not been that much of a reaction to this in terms of forex or interest rate movements. Some interpret the removal of the said line dovishly, as a notification of an end to rate hikes, but as I will explain later, the neutral interest rate indicated this time was 3.00%, and rate hikes are very likely to continue inching up to this level in 2019. It seems unreasonable to interpret the current policy stance as dovishly inclined. Having said that, it is true that a turning point may be in sight. For the first time since the collapse of Lehman Brothers in September 2008, the FF rate has clearly surpassed 2%, which certainly seems like an important milestone. An Assumption that Held True for the Past Five Years has Changed Fed Chair Jerome Powell himself stated that the removal of the line “The stance of monetary policy remains accommodative” does not indicate any particular change in monetary stance, so it is probably not a big deal. What is worth paying attention to is the policy stance from 2020 onward as estimated by the position of the dots on the dot plot. If the recently released dot plot is interpreted in a straightforward manner, there will be one rate hike in December 2018, three rate hikes in 2019, and one in 2020, with the status quo being retained in 2021. Of course, the dots for 2020 and beyond are dispersed quite widely and should be interpreted with caution, but it is easy to guess that most members are expecting to see an increase in the FF rate to the level of the neutral interest rate by 2019 and then to wait and watch. As one can tell at a glance, the 3.625% rate has received six votes (the most votes) in 2020, but the 3.375% rate has received the most votes (three votes) in 2021 even though 3.875% and 4.125% also received some votes. Although uncertainties rise as we go into 2021 and beyond, it seems likely that 2020 will be an important year, with the mood of the Committee changing once it has achieved its critical goal of policy normalization. Over the past five years since the “Bernanke shock,” the financial markets have assumed that the next move by the Fed will be a rate hike. Regardless of what risk-off event has arisen, the markets have never predicted a suspension of rate hikes, even though they have at times predicted a delay in rate hikes. Neither Brexit nor the election of President Trump were enough to reverse the policy normalization process. In that sense, it is rather significant that the recent dot plot has clearly indicated the end point of rate hikes – the importance of this in the medium to long term should not be underestimated. Interest rate hike vs. domestic economy, emerging country economies, and domestic politics According to the latest staff forecast, the core PCE deflator outlook is “2.0% → 2.1% → 2.1%” during the 2018-2020 period, and the newly added figure for 2021 is also 2.1%. These figures are basically unchanged from those in the June staff forecast. One gets a clear sense that the FOMC’s view is that interest rate hikes up to the neutral interest rate level will not have an impact on the fundamental inflation trend (see table). As discussed in the main scenario risks section below, many observers believe that, because real short-term interest rates (such as real 2-year interest rates) are currently below the potential growth rate, there will not be an economic slowdown despite multiple interest rate hikes. In fact, given the current robustness of economic conditions, it is inevitable there will be increasing support for this view. This view is focused exclusively on rate hikes’ impact on the U.S. economy, however, and does not give due consideration to the issue of emerging country turmoil, which has been recognized as a problem since early this year. Chairman Powell admitted at the press conference that the turmoil in emerging economies affects the U.S. economy and that U.S. interest rate hikes have promoted the depreciation of emerging countries’ currencies, but he also took the stance that, since the currency depreciation effect is impacting only some emerging countries, it should not affect the Fed’s monetary policy operations. The longer that the rate hike route is followed in response to robust conditions in the U.S. economy, the more difficulties emerging countries will face, however, and this situation will not change fundamentally going forward. There is clearly cause for concern about whether the process of hiking interest rates to the neutral rate level can be completed without causing extremely serious turmoil in emerging economies.
2.375
3.125
3.375 3.375
3.000
1.50
2.00
2.50
3.00
3.50
4.00
4.50(%)
(Source)FRB
FOMC policy members interest rates forecast(Median as of SEP2018)
2018 2019 2020 Long term2021
FRB economic outlook (multiple forecast, %, as of SEP 2018)2018 2019 2020 2021 Long term
Rea l GDP Growth rate 3.0~3.2 2.4~2.7 1.8~2.1 1.6~2.0 1.8~2.0as of JUN (2.7~3.0) (2.2~2.6) (1.8~2.0) n.a. (1.8~2.0)
Unemployment rate 3.7 3.4~3.6 3.4~3.8 3.5~4.0 4.3~4.6as of JUN (3.6~3.7) (3.4~3.5) (3.4~3.7) n.a. (4.3~4.7)
PCE inflation ra te 2.0~2.1 2.0~2.1 2.1~2.2 2.0~2.2 2.0as of JUN (2.0~2.1) (2.0~2.2) (2.1~2.2) n.a. (2.0)
Core PCE inflation rate 1.9~2.0 2.0~2.1 2.1~2.2 2.0~2.2as of JUN (1.9~2.0) (2.0~2.2) (2.1~2.2) n.a.
(Source)FRB
Medium-Term Forex Outlook Mizuho Bank Ltd. 9
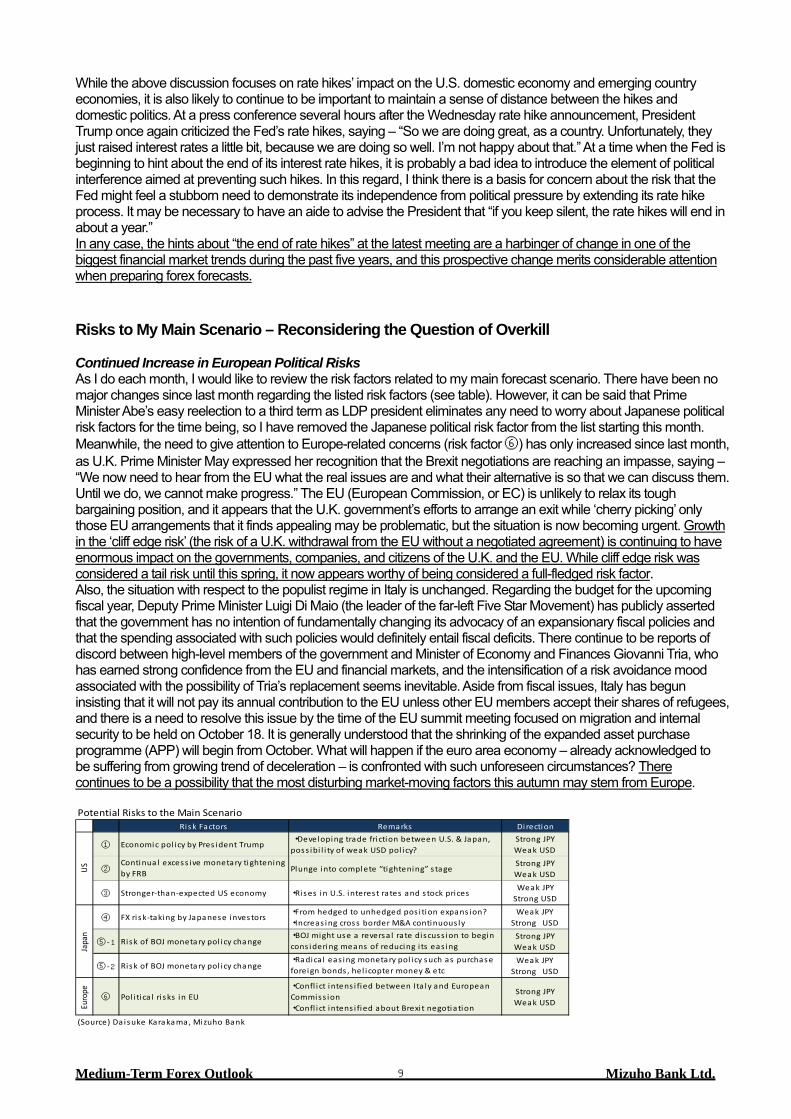
While the above discussion focuses on rate hikes’ impact on the U.S. domestic economy and emerging country economies, it is also likely to continue to be important to maintain a sense of distance between the hikes and domestic politics. At a press conference several hours after the Wednesday rate hike announcement, President Trump once again criticized the Fed’s rate hikes, saying – “So we are doing great, as a country. Unfortunately, they just raised interest rates a little bit, because we are doing so well. I’m not happy about that.” At a time when the Fed is beginning to hint about the end of its interest rate hikes, it is probably a bad idea to introduce the element of political interference aimed at preventing such hikes. In this regard, I think there is a basis for concern about the risk that the Fed might feel a stubborn need to demonstrate its independence from political pressure by extending its rate hike process. It may be necessary to have an aide to advise the President that “if you keep silent, the rate hikes will end in about a year.” In any case, the hints about “the end of rate hikes” at the latest meeting are a harbinger of change in one of the biggest financial market trends during the past five years, and this prospective change merits considerable attention when preparing forex forecasts. Risks to My Main Scenario – Reconsidering the Question of Overkill Continued Increase in European Political Risks As I do each month, I would like to review the risk factors related to my main forecast scenario. There have been no major changes since last month regarding the listed risk factors (see table). However, it can be said that Prime Minister Abe’s easy reelection to a third term as LDP president eliminates any need to worry about Japanese political risk factors for the time being, so I have removed the Japanese political risk factor from the list starting this month. Meanwhile, the need to give attention to Europe-related concerns (risk factor ⑥) has only increased since last month, as U.K. Prime Minister May expressed her recognition that the Brexit negotiations are reaching an impasse, saying – “We now need to hear from the EU what the real issues are and what their alternative is so that we can discuss them. Until we do, we cannot make progress.” The EU (European Commission, or EC) is unlikely to relax its tough bargaining position, and it appears that the U.K. government’s efforts to arrange an exit while ‘cherry picking’ only those EU arrangements that it finds appealing may be problematic, but the situation is now becoming urgent. Growth in the ‘cliff edge risk’ (the risk of a U.K. withdrawal from the EU without a negotiated agreement) is continuing to have enormous impact on the governments, companies, and citizens of the U.K. and the EU. While cliff edge risk was considered a tail risk until this spring, it now appears worthy of being considered a full-fledged risk factor. Also, the situation with respect to the populist regime in Italy is unchanged. Regarding the budget for the upcoming fiscal year, Deputy Prime Minister Luigi Di Maio (the leader of the far-left Five Star Movement) has publicly asserted that the government has no intention of fundamentally changing its advocacy of an expansionary fiscal policies and that the spending associated with such policies would definitely entail fiscal deficits. There continue to be reports of discord between high-level members of the government and Minister of Economy and Finances Giovanni Tria, who has earned strong confidence from the EU and financial markets, and the intensification of a risk avoidance mood associated with the possibility of Tria’s replacement seems inevitable. Aside from fiscal issues, Italy has begun insisting that it will not pay its annual contribution to the EU unless other EU members accept their shares of refugees, and there is a need to resolve this issue by the time of the EU summit meeting focused on migration and internal security to be held on October 18. It is generally understood that the shrinking of the expanded asset purchase programme (APP) will begin from October. What will happen if the euro area economy – already acknowledged to be suffering from growing trend of deceleration – is confronted with such unforeseen circumstances? There continues to be a possibility that the most disturbing market-moving factors this autumn may stem from Europe.
Risk Factors Remarks Di rection
① Economic pol icy by Pres ident Trump ・Developing trade friction between U.S. & Japan,poss ibi l i ty of weak USD pol icy?
Strong JPYWeak USD
②Continua l excess ive monetary tighteningby FRB Plunge into complete “tightening” s tage
Strong JPYWeak USD
③ Stronger-than-expected US economy ・Rises in U.S. interest rates and s tock pricesWeak JPY
Strong USD
④ FX risk-taking by Japanese investors・From hedged to unhedged pos i tion expans ion?・Increas ing cross border M&A continuous ly
Weak JPYStrong USD
⑤-1 Risk of BOJ monetary pol icy change・BOJ might use a reversa l ra te discuss ion to begincons idering means of reducing i ts eas ing
Strong JPYWeak USD
⑤-2 Risk of BOJ monetary pol icy change・Radica l eas ing monetary pol icy such as purchaseforeign bonds , hel icopter money & etc
Weak JPYStrong USD
Euro
pe
⑥ Pol i tica l ri sks in EU・Confl i ct intens i fied between Ita ly and EuropeanCommiss ion・Confl i ct intens i fied about Brexi t negotia tion
Strong JPYWeak USD
(Source) Da isuke Karakama, Mizuho Bank
Potential Risks to the Main Scenario
USJa
pan

Medium-Term Forex Outlook Mizuho Bank Ltd. 10
No Longer Possible to Say Tariffs “Much Less Disruptive than Headlines Would Suggest” In addition, the risks related to risk factor ① are growing day by day. Having already placed supplementary 25% tariffs on USD50 billion of Chinese goods based on Section 301 of the Trade Act of 1974, the Trump Administration moved on September 24 to slap supplementary 10% tariffs on an additional USD200 billion of Chinese goods. This means that half of U.S. imports from China are now subject to sanctions. In response, China has canceled trade talks with the United States and is taking retaliatory measures. Prominent figures on both sides have been saying that the U.S. - China trade war’s macroeconomic impact will prove to be less significant than media reports suggest, but it can probably be assumed that such commenters are in situations that compel them to say that. An IMF report released in July forecasts that a worst-case scenario, in which all tariff threats and retaliation measures are implemented and corporate proclivities to consume and invest are reduced, may slow growth in global GDP. Some observers have pointed out that the IMF simulations do not consider supply chain disruption risks, so there is a potential danger that the situation may deteriorate to a degree greater than that suggested by the IMF. Although they had not yet been imposed at the time this article was written, the United States has threatened to place supplementary tariffs on USD267 billion of imports from China and a 25% tariff on all imported cars, including those imported from China. In the case that all these tariffs are imposed, it will no longer be possible to say that they are “much less disruptive than headlines would suggest”. While the direction of the Japan-U.S. “free, fair and reciprocal” (FFR) trade dialogue has been attracting attention with respect to its effect on USD/JPY, the Japan-U.S. Summit meeting concluded on September 26 provides for the start of Japan-U.S. Trade Agreement on Goods (TAG) negotiations, and it has been announced that the U.S. would refrain from imposing new tariffs on Japanese motor vehicles while the TAG talks are under way. However, as U.S. currency and trade policies are largely determined by President Trump, who regularly makes unexpected remarks, it is crucial to give due attention to this risk situation in the course of preparing forex forecasts. Perspectives on Overkill Risk How should we thinking about the risks related to risk factors ② and ③? It seems that there are many observers suggesting there is no need for serious concern about negative term premiums stemming from yield curve flattening and the potential for yield curve inversion, the continued low level of real short-term interest rates below the potential growth rate, and other such worrisome situations. It is true that, after recognizing that interest rates are still low with respect to the United States’ underlying strength (potential growth rate), the yield curve’s shape is not very important. As the graph shows, at the time of the IT bubble collapse around 2000 and when the financial bubble collapsed in 2006-7, the yield curve had flattened to the point of yield inversion, but in both cases real short-term interest rates exceeded the potential growth rate, so the situations could be characterized as overkill situations (graph portions surrounded by dotted lines). It can be argued that those situations promoted recessions and along with policy shifts on the part of the Fed. The logic so far can be said to be very persuasive. Nonetheless, there are two other situations that must be pointed out; (A) that the current inflation rate rise is reflecting the impact of a crude oil price rise (hence the concern that real interest rates are actually at high levels), and (B) the quite separate issue of whether emerging countries can cope with higher U.S. interest rates or not. At the time of this article was written, the North Sea Brent crude oil price had surpassed USD80/barrel, its highest level since November 2014. This reflects the impact of a lack of a rush by OPEC and non-OPEC major oil-producing countries to increase their production owing to political considerations. Meanwhile, the U.S. average hourly wage remains 3% below the level last year, and although it is firm, there are no signs of an accelerating rise. Given that the U.S. unemployment rate has fallen below 4%, the average hourly wage might be considered somewhat unsatisfactory. It is debatable whether it is proper to calculate real interest rates based on a robust inflation trend associated with such situations. Moreover, point (B) is of particular importance. Since U.S. interest rates determine the global cost of capital, considerations of whether the United States can cope with sustained interest rate hikes must be supplemented with considerations of whether emerging countries can bear such hikes. Given that turbulence associated with emerging countries has already become the biggest theme in financial markets since early this year, the United States should consider limiting the extent of its interest rate hikes even when it deems that its own economy has the excess capacity needed to cope with them. As noted in risk factor ③, if emphasis is placed on the fact that “interest rates are still low with respect to the United States’ underlying strength (potential growth rate)”, there is a possibility that U.S. economic expansion and interest rate hikes will coexist and the trend of U.S. stock price increases will also prove persistent. This is a risk scenario completely at odds with this article’s forecasting assumptions, and I believe it is the JPY depreciation risk factor meriting the greatest concern at this point.
-4
-3
-2
-1
0
1
2
3
4
5
00 01 02 03 04 05 06 07 08 09 10 11 12 13 14 15 16 17 18 19
(Dollar)
(Source)Bloomberg (Note) 10yr, 2yr were made real by PCE integrated deflator
US real long term & short term interest rates and potential growth rate
Real 10yrReal 2yrPotential growth rate (trial calculation by CBO)
CBO forecast

Medium-Term Forex Outlook Mizuho Bank Ltd. 11
Risk that the End of Overriding Emphasis on Boosting Inflation Could Elicit Turmoil With respect to Japan, it continues to be impossible to exclude the possibility that the BOJ might shift toward policy normalization (risk factor ⑤-1). At a Liberal Democratic Party presidential election debate session on September 14, Prime Minister Abe said – “I don't think at all that we should carry on with [large-scale monetary easing] forever. I'd like to set a path [for the exit] within my tenure.” – and this unusually clear-cut statement attracted considerable attention1. In addition, at a press conference after the September 18 Cabinet meeting, Finance Minister Taro Aso seemed to defend the prime minister’s remarks while revealing some of the inner workings of the government, stating with respect to the “2% in 2 years” inflation target set when BOJ Governor Kuroda began his first five-year term in April 2013 that – “The ‘within two years’ aspect of the goal was unrealistic, and we both [the government and the BOJ] recognized that.” Since the two most important people in the current administration are talking about similar things at a similar time, it is probably reasonable to assume that the overriding emphasis on boosting inflation that has been maintained over the past five years is coming to an end. It can be surmised that the government’s real goal is to find a way to gradually decrease its distance from an exit strategy while striving to determine the optimal timing, but if the situation in the United States and the rest of the overseas economic environment is misjudged, there is a risk that moving toward an exit strategy could elicit fairly large margins of JPY appreciation and stock price decreases. The government and BOJ are seeking ‘normalization to a degree that does not elicit JPY appreciation’ and would consider any policy adjustments liable to spur JPY appreciation unacceptable, but it should be recognized that associated judgement errors have the potential to unintentionally bring about considerable disruption. Not Many JPY Depreciation Risks Worth Discussing As mentioned above regarding JPY depreciation risks, the greatest risk (risk factor ③) may be the stronger-than-expected economic conditions in the United States and the associated rises in U.S. interest rates and stock prices, and there is not so much that needs saying about other JPY depreciation risk factors. Albeit, as mentioned every month, there does exist a possibility that the external risk taking of Japanese institutional investors might promote JPY depreciation (risk factor ④). In fact, the JPY supply-demand environment continues to be not supportive of JPY appreciation. Calculated from balance of payments statistics, the JPY supply-demand balance for the first half of 2018 was a net sale of around JPY7,547.3 billion. Looking at semi-annual figures, one finds that this is the first net sale of JPY since the latter half of 2016, and this reflects the overall steadiness of USD/JPY, despite its numerous twists and turns, since 2017. This is a valid risk factor with respect to this article’s JPY appreciation forecast. However, because I am not confident in the sustainability of the FRB normalization processes, I do not believe there is a high likelihood that Japanese institutional investors will sustain their current trend regarding foreign securities investments. It is probably also worth mentioning the potential for the BOJ to introduce radical new easing methods, such as those involving foreign bond purchasing and helicopter money (risk factor ⑤-2), but decisions to utilize such methods would not be likely to be taken until after considerable progression of a JPY appreciation trend, so at this point they are not cause for much concern. Given the fact that President Trump is intensifying his protectionist policies and appears displeased with U.S. interest rate hikes (along with the associated USD appreciation trend), there are high political hurdles on the path to further easing on the part of the BOJ. Domestic and External Economic Conditions Will no Longer Justify Rate Hikes It continues to be the case that the Trump administration’s currency and trade policies may represent the biggest risk during the forecast period as a whole, and the adverse effects of U.S.-China trade frictions appear to have become too large to disregard. If U.S. tariffs are applied all imports from China, it will probably become impossible to insist that they are not exerting a harmful effect. In addition, the Europe-related political risks anticipated in the near future cannot be disregarded. Particularly important from the perspective of financial markets is the fact that Brexit cliff-edge risk – until recently considered no more than a tail risk – is now appearing increasingly likely to eventuate. It seems that the Italian political situation will also promote turbulence, and it will be important to closely monitor the political situation in Europe, as this autumn may be akin to the eye of a European typhoon.
1 Please refer to the September 20, 2018, issue of Mizuho Market Topic entitled “Prime Minister Abe’s announcement of withdrawal from relaxation – easier said than done.”
-40
-30
-20
-10
0
10
20
30(Tril yen)
(Source)INDB (Note)Subject: including insurers, pension funds & individuals, excluding deposit taking finance instructions & government
Primary supply-demand balance reflected on the balance of international payments
Inward security investmentOutward security investment (others)Direct investmentCurrent account balancePrimary supply-demand balance

Medium-Term Forex Outlook Mizuho Bank Ltd. 12
Of course there is a risk that the U.S. economy will maintain its robustness over the upcoming year as it has during the past year. In such a case, there is a possibility that the uptrend in U.S. interest rates and U.S. stock prices may proceed, exerting upward pressure on USD/JPY. But to what extent can one expect additional improvement in unemployment rates, which have already fallen below the 4% level? Moreover, even if the U.S. economy can cope with rising interest rates, the question of whether emerging countries – already showing signs of vulnerability – can deal with the associated challenges is another matter. I believe the most likely scenario during the upcoming years is that the Fed will become unable to justify a further gradual hiking of interest rates in light of conditions in the domestic and foreign economic environments, the FOMC will shift to a more-neutral stance, and the levels of U.S. interest rates and USD will recede. Given this outlook, my fundamental understanding is that there is no great need at this point to adjust the direction of trends forecast in the main scenario (JPY appreciation/USD depreciation).

Medium-Term Forex Outlook Mizuho Bank Ltd. 13
EUR Outlook – Pipe Dream of Making EUR the Leading International Key Currency ECB monetary policies now and going forward – Hints Regarding Reinvestment Policies and Response to EUR Appreciation Not All That Bullish Following the September ECB Governing Council meeting, the interest rates on the main refinancing operations (MROs; the ECB’s key interest rate), the marginal lending facility (which is the ceiling of market interest rates), and the deposit facility (which is the floor of market interest rates) were all kept unchanged at 0.00%, 0.25%, and -0.40%, respectively. This maintained the interest rate corridor (the difference between the ceiling and floor of market interest rates) at 0.65 pp. As for the expanded Asset Purchase Programme (APP), purchases will continue at a monthly pace of EUR 30 billion until the end of September, then be halved to EUR 15 billion/month for October-December, and be terminated by the end of the year. The language of the forward guidance, which temporarily caused confusion, was also kept unchanged at “We continue to expect them to remain at their present levels at least through the summer of 2019,” which the financial markets are interpreting to mean that rate hikes will take place in September 2019 at the earliest. EUR appreciated immediately following the meeting due to ECB President Mario Draghi’s bullish view of the economy, but Mr. Draghi’s tone in expressing this view was cautious, so there seems no need to make too much of it. As per the staff projections released this time, the euro area Harmonized Index of Consumer Prices (HICP) is expected to remain at the level of +1.7% for the 2018-2020 forecasting period, falling short of the target +2%. Mr. Draghi’s optimistic tone notwithstanding, the economic outlook itself remains level, with an equal balance of both upside and downside risks (although there is room for debate here, as I will explain later) – i.e., the scales have not tilted in favor of upside risks. ECB Attempts to Avoid Giving Hawkish Impression While Refusing to Protect Italy Going by the Q&A session, one got the impression that Mr. Draghi was worried about the markets considering the termination of the APP as directly translating to the end of monetary accommodation and/or the start of monetary tightening. The very first question, for instance, was about the fact that the APP remains open-ended and whether there was still scope for it to be extended. In response to this Mr. Draghi explained, “We anticipate that, subject to incoming data confirming our medium-term inflation outlook, we will then end net purchases,” hinting at the possibility of an expansion, which came as a surprise. He went on to emphasize, “But let me make clear that it’s – when we stop, this doesn’t mean that our monetary policy stops being accommodating. The amount of accommodation will remain very significant, through our reinvestment policy and through our forward guidance and interest rates.” The desperate attempt not to give an impression of hawkishness is obvious. Another reporter asked “Some people think that the end of QE will mean that Italy in particular will be abandoned, left alone to fight against attacks of speculators.” In response, Mr. Draghi said that the mandate of the ECB was not “to ensure that government deficits would be financed under all conditions. Our task is to pursue price stability,” indicating that the ECB had no intention of protecting Italy. Mr. Draghi cited a very clear example that the ECB had not been protecting “bankers’ profits or insurance companies’ profits.”
Reinvestment Policy Will be Discussed Before the Year-end Despite Mr. Draghi working hard not to give an impression of hawkishness, the fact remains that the net purchase of assets will end within the year, and there is naturally interest regarding the reduction of balance sheet size as the next step. In this regard, one of the questions was whether there was any discussion of a reinvestment policy. Mr. Draghi responded curtly saying, “we haven’t discussed it, we haven’t even discussed when we are going to discuss it.” (Incidentally, this was the same response he gave last time). However, he also said that he expected the matter to be discussed at one of the remaining two meetings (October and December) this year, and that the discussion would first take place at the level of the committees. It appears that instructions to draft a plan have already been issued. This is probably the only interesting takeaway from an otherwise uneventful meeting. There was another question about Operation Twist, regarding which Mr. Draghi repeated that it had not been discussed. However, he added, “even though we haven’t discussed, I believe the Governing Council would be pretty unanimous on that – is that the capital key will remain the guiding principle,” quashing rumors of the possibility of new allocation of purchases.
ECB staff outlook (Sep 2018) (%)2017 2018 2019 2020
HICP 1.5 1.6~1.8 1.1~2.3 0.9~2.5(Previous: JUN 2018) 1.5 (1.6~1.8) (1.0~2.4) (0.9~2.5)
Real GDP 2.5 1.8~2.2 1.0~2.6 0.6~2.8(Previous: JUN 2018) 2.5 (1.8~2.4) (0.9~2.9) (0.6~2.8)
(Source)ECB (Note) EURUSD is assumed to be 1.18 year 2018 and 1.14 year 2019-2020

Medium-Term Forex Outlook Mizuho Bank Ltd. 14
The Relationship Between Uncertainties in Emerging Economies and Tightening in Advanced Economies With the uncertain fate of emerging economies being the biggest concern at the moment, naturally, there were questions about its impact. The question was quite direct: “The currency crises in Argentina and Turkey seem to have contagion effects on other emerging markets. How much of a threat is that for the eurozone economy and the world economy?” It is natural that there would be concerns regarding the impact of the Turkish currency crisis on the ECB’s policy operation, given that the euro area is a major creditor of Turkey, and risks for major financial institutions in some euro member states has just gone up. In this context, the same reporter further asked, “The current problems in the emerging markets seem to be related at least partly also to the tightening of monetary policy in the U.S. and the withdrawal of liquidity. The ECB also anticipates to stop net purchases next year. What kind of risks do you expect when the two main central banks reduce liquidity?” The question addressed the crux of the current situation. As I have also repeatedly discussed in this report, one of the keys to understanding the current situation is to be aware of the irony that emerging economies will continue to suffer so long as the U.S. and European economies remain sound. It seems to me that in the not-too-distant future, the Fed and the ECB will have to take overseas economic conditions into account as a policy response variable. In response to the above question, Mr. Draghi accepted that the increased uncertainties in emerging economies was a risk factor for the international financial markets, but remarked that the spillovers from Turkey and Argentina to other countries have not been substantial. The ECB’s position in this regard seems to be that though there could be “individual situations of significant exposure to local crises,” the current situation has limited contagion in the aggregate with regard to Europe or the world. Mr. Draghi listed three sources of uncertainty for global output resulting from the monetary policies of advanced economies – (1) a change in conditions in emerging markets, (2) potential financial market volatility, and (3) rising protectionism. Of these, he categorized the last one as “the major source of uncertainty,” a position he has not changed since previously. Given that Mr. Draghi seems aware that the ECB’s policy operations could be a trigger for aggravating risk (1), I believe it will be important to monitor not just the Fed’s but also the ECB’s policies going forward.
Risk Balance Assessment and EUR Appreciation The introductory statement assesses the risks surrounding the euro area growth outlook as being “broadly balanced.” However, amid continued turmoil in emerging economies and U.S. protectionism, some are questioning whether this is really true. There were questions such as, “Did you discuss changing your policy message to say that the balance of risk was tilted to the downside?” and “I want to know if it was the view that was shared among the whole Governing Council, or were the members may be in favour of a more darker expression to take account the threats we know about.” Mr. Draghi answered by saying that “the assessment was shared by all governors.” He explained that though there were downside risks including uncertainties in emerging markets and rising protectionism, there were also upside risks such as the prospect of expansionary fiscal policies in several euro area countries, private consumption supported by strong employment and wages, and fixed investment supported by the accommodative financing conditions. It is true that domestic demand within the euro area is quite robust for the moment, so perhaps in terms of future uncertainties (i.e., risks), turmoil in emerging markets and protectionist U.S. policies are the bigger risks beyond control. Incidentally, I discussed on page 3 the fact that the crashing of TRY had boosted EUR’s nominal effective exchange rate (NEER), and a reporter asking about the aforementioned risk-balance pointed out the same thing. Specifically, having pointed out the rising NEER in the wake of TRY crashing, the questioner asked, “It seems to be some topic of concerns for some members of the Governing Council. Is it something that you discussed today?” This NEER-related situation has been summed up in the table on the page3. The downside pressure on EUR resulting from the currency being sold in exchange for USD and JPY since early this year has been cancelled out by the upside pressure on it as a result of being bought in exchange for TRY. In responding to this question, Mr. Draghi said, “When we say that the foreign demand is weaker for the euro area, and this may be due to the stronger exchange rate of the euro, we have to keep in mind that the depreciation of the Turkish lira actually accounts for much of that effect. That was the context in which we briefly discussed that,” adding the view that this was unlikely to have a spillover effect on the overall economy. Still, it is interesting to note that the issue had come up for discussion. As I already mentioned, so long as economic and financial conditions in Europe and the U.S. remain strong, funds are likely to continue draining out of emerging economies, and the currencies of these economies are likely to continue weakening. It will be interesting to see how long the economies implementing these policies (Europe and the U.S.) can withstand the resultant appreciation of their currencies.

Medium-Term Forex Outlook Mizuho Bank Ltd. 15
ECOFIN Focuses on Interest Rate Tolerance A paper written by Daniel Gros of the Centre for European Policy Studies (CEPS) and presented at the September 7 EU economics and finance ministers’ conference (the Economic and Financial Affairs Council, or ECOFIN) has attracted a significant amount of media reportage. The paper’s main thesis is that increasing interest rates appears to pose little risk of causing widespread financial market instability. In short, it suggests that hiking interest rates should not be problematic. The paper discusses concerns about the increasing momentum of rising asset prices and various other issues. Regarding the protraction of low interest levels, the paper states that – “a continuation of the ‘low for long’ scenario might, over time, lead to a build-up of vulnerabilities.” – and it is clear that Mr. Gross fundamentally inclined to support the BIS view2. The Shadow Banking Issue and Interest Rate Hikes In recent years, a surge in financing activities (so-called shadow banking) in Europe outside the framework of the existing, strictly regulated banking system has elicited concern, and the ECB has also from time to time been suggesting that there is a need for new regulations with respect to shadow banking. In this regard, if there is considerable concern that shadow banking growth may cause asset price overheating, it would be understandable if such concern were to become an incentive to expedite the hiking of interest rates. As shown in the graph, the balance of assets held by FVCs (financial vehicle corporations, or special purpose companies (SPCs) handling securities products) has been trending downward since the financial crisis, while the balance of assets held by OIFs (other investment funds, or funds investing in bonds, stocks, real estate, etc.) has shown considerable growth. The tightening of capital adequacy regulations is encouraging banks to limit the size of their balance sheets, which necessitates the restraint of the banks’ lending and other financing activities. For example, it appears that such activities as the securitization and marketing of loan assets have played a role in helping expand shadow banking. A surge in such activities has helped boost asset prices, which is why it seems plausible that there is a need to tighten the financial environment in order to stabilize the financial system going forward. In contrast to quite thorough nature of banking supervision, however, there remain many aspects of the overall situation regarding shadow banking that are opaque and not well understood. Regarding investment funds and similar entities, for example, the source of funds is not limited to such “financial professionals” as banks and securities companies but may be a business corporation or a specific fund. In addition, the operational scope of investment funds and similar entities is not necessarily clear. In the case that credit expansion stemming from shadow banking has grown so large that it cannot overlooked with respect to monetary policy management, then undertaking monetary tightening without an understanding of the actual situation may well entail considerable risks. 2 While the traditional Fed view is that – “Because bubbles cannot be foreseen in advance, the central bank should have only limited involvement with asset prices but strongly respond to the bursting of bubbles.” – the BIS view is that – “The central bank should undertake preventative policy management prior to bubble formation to prevent rapid surges in asset prices”. At present the FRB is showing strong signs of becoming more inclined to accept the BIS view.
0
2
4
6
8
10
12
14
16
10 11 12 13 14 15 16 17 18
(Source)ECB
Shadow banking in EU(Balance by each fund)
OIF(※1)
FVC(※2)
MMF
(Tril euro)
(Year)※1:Other Investment Fund:Bond, equity, real estate fund※2:Financial Vehicle Corporation:SPC specialized in securitized products

Medium-Term Forex Outlook Mizuho Bank Ltd. 16
Recognizing that “Germany is Special” The abovementioned paper submitted to ECOFIN also appears to note an aspect of rising asset prices that is cause for concern. As this article has pointed out repeatedly, there appears to have been an excessive asset price rise in Germany, and this presents the possibility that sharp adjustments will be required if the pace of interest rate hikes is not appropriate3. Disregarding this situation would be dangerous, and if one considers Germany alone, it may well be that there is truly a need for expeditious interest rate hikes. However, German asset price trends are quite different from those in the rest of the euro area, as can be seen in the graph (upper right). There is due cause for concern about how an ECB rate hike to address the German situation would affect peripheral euro area countries. Just as is the case regarding the abovementioned shadow banking situation, it seems that the difficulty of ECB normalization efforts will be further increased by the difficulty of accurately assessing the prospective effects of interest rate hikes. Germany’s distinctive asset price rise trend is also evident with respect to stock prices – the pace of increase in German stock prices is quite different from the pace of stock price increases in other countries (see graph on lower right). If the ECB were to undertake a policy adjustment based on a sense of crisis regarding the rise in asset prices, focusing on Germany as the standard case would risk subjecting other euro area countries to negative impacts. Blatant Political Intervention? Although it was a theoretical discussion, the fact that ECOFIN discussed the euro area’s capabilities for coping with interest rate hikes is somewhat disturbing. ECOFIN is a genuinely political entity in that, although the ECB president participates in official and informal ECOFIN meetings and the governors of the national central banks attend the informal ECOFIN Council meetings, the majority of official meeting attendees are the economics and finance ministers of individual EU countries. Therefore, it would seem that a bit more consideration should be given to the question of how appropriate it is for a political meeting to discuss “the impact of interest rate hikes on the euro area economy” – an issue that might ordinarily be deemed to fall exclusively within the ECB’s purview. As noted above, “monetary tightening tailored to conditions in Germany” could have negative impacts on other euro area countries, and a discussion of this issue at ECOFIN may cause representatives of those countries to present arguments against expediting interest rate hikes. For example, as mentioned in a Bloomberg article on this issue, France has a particularly high level of corporate debt compared to other euro area countries, there is concern that this may increase the French corporate sector’s vulnerability during a monetary policy tightening process (see graph). If ECOFIN provides a venue for such a country as France, which is quite influential within the euro area, to make suggestions about ECB policy management in a political setting, it will create considerable noise in financial markets. Although ECOFIN had not attracted much attention since the resolution of the debt crisis, it may well be worthwhile to pay close attention to its behavior going forward.
3 Please refer to the July 12, 2018, issue of Mizuho Market Topic entitled “The German housing market now and going forward – Overlooked ‘bubble potentials’” as well as the article entitled “German ‘bubble potentials’” that was posted on August 10, 2018, on the Toyo Keizai Online website.
0
50
100
150
200
250
00 02 04 06 08 10 12 14 16 18(Source)Bloomberg
EU major stock index
Euro・stocks50(Europe)FTSE100(UK)DAX(Germany)CAC40 index(France)FTSE MIB(Italy)
(Year 2000=100)
60
70
80
90
100
110
120
130
140
150
00 01 02 03 04 05 06 07 08 09 10 11 12 13 14 15 16 17 18
(MAR2007=100)
(Source) BIS(Note) All dwellings base but France is existing dwellings base
Residential housing prices in Euro-zone
Euro-zone GermanyFrance ItalySpain Standard (MAR 2007)US
20
40
60
80
100
120
140
00 01 02 03 04 05 06 07 08 09 10 11 12 13 14 15 16 17 18
(% vs GDP)
(Source)BIS
Credit to Non-financial sector (% vs GDP)
Euro zone Germany France Italy Spain

Medium-Term Forex Outlook Mizuho Bank Ltd. 17
Pipe Dream of Making EUR the Leading International Key Currency – Juncker’s State of the Union Address EC Chairman Juncker’s Blatant Sales Talk On September 12, European Commission (EC) Chairman Jean-Claude Juncker attracted considerable attention by suggesting in his State of the Union Address to the European Parliament that EUR should rival USD as a key reserve currency. The quotes from the address shown as bullet points below have been appearing prominently in media headlines. They are eye-catching statements from the head of the EU’s executive branch in that they greatly differ from the EC’s basic attitude toward EUR to date (that EUR is not a key international reserve currency, nor does the EU have the goal of making it one). By next year, we should also address the international role of the euro. The euro is 20 years young and has
already come a long way–despite its critics It is now the second most used currency in the world with 60 countries linking their currencies to the euro in one
way or another. But we must do more to allow our single currency to play its full role on the international scene. This is why, before the end of the year, the Commission will present initiatives to strengthen the international role
of the euro. The euro must become the face and the instrument of a new, more sovereign Europe. For this, we must first put our own house in order by strengthening our Economic and Monetary Union, as we have already started to do. Without this, we will lack the means to strengthen the international of role of the euro. We must complete our Economic and Monetary Union to make Europe and the euro stronger.
In any case, the speech clearly shows that the EC has come to be enthusiastic about doing something to strengthen “EUR’s international role”. Juncker also stated that – “It is absurd that Europe pays for 80 % of its energy import bill – worth 300 billion euro a year – in USDs when only roughly 2% of our energy imports come from the United States. It is absurd, ridiculous that European companies buy European planes in USD instead of euro.” While it may be that the Trump administration’s recent protectionist policies have played a role in inspiring this new approach, it seems to be unprecedented for the EC chairman to speak as a salesperson for EUR in this manner. Has the Objective Changed? Ten years ago, however, the EC issued a publication on the 10th anniversary of EUR’s introduction entitled “EMU@10 – Successes and challenges after ten years of Economic and Monetary Union”, and the publication includes a section entitled, “Trends in the international role of the euro”. I remember it well because I was one of the authors of this section. After objectively assessing EUR’s international position from such various perspectives as trade settlement currency and reserve currency usage, currency circulation amount, and forex trading share, we reached the modest conclusion that – “The rise of the euro as international financial currency, where on some measures it has already surpassed the USD, has been particularly impressive. In other functions, however, progress has been largely limited to certain regions with specific economic and political links to the EU, revealing a strong regional and institutional pattern in the internationalisation of the euro.” The section noted that – “The USD remains the first international currency in many areas – partly because of inertial forces that create a bias in favour of the incumbent international currency – but its dominance has declined partly owing to the creation of EUR.” – but described its fundamental view as – “On balance, there was a consensus that the euro would be well-received internationally but would emerge as international currency only gradually and not rival the USD’s dominant position.” Of course, it is not surprising that EU might change its goal regarding EUR, as ten years have passed since then and the leadership (EC Chairman) has also been replaced. In light of such events as the European debt crisis and Brexit, which appear to reflect a strengthening of centrifugal forces within the region, it may be that there is a desire to set a high goal designed to promote greater regional cohesion. Nonetheless, given the premise that the disparate fiscal policies of euro area countries make EU unlikely to be considered an optimal international currency, the dream of “EUR as the key international currency” is likely to be pie in the sky. In fact, it was precisely these disparate fiscal policies of euro area countries that made resolving the debt crisis require so much time and efforts, and it is for this reason that priority should be given to establishing such common regional schemes as a euro area treasury department, euro area budgets, and euro area bonds. Partly owing to the lack of progress toward establishing such schemes, EUR’s share of global currency trading has actually been declining over the past twenty years. A survey carried out once every three years by the Bank for International Settlements (BIS) found that, between 2001 and 2016, USD’s share of transactions has declined slightly, from
-4
-3
-2
-1
0
1
2
3
0
5
10
15
20
25
30
35
40
45
50
USD EU
R
JPY
GBP
AUD
CAD
CHF
CNY
SEK
NZD
MXN SG
D
HKD
NO
K
KRW
(% pts)(%)
(Source)BIS
Trading share by currencies(BIS survay 2001 vs. 2016)
2001(①) 2016(②) Changes (②-①)

Medium-Term Forex Outlook Mizuho Bank Ltd. 18
44.9% to 43.8%, but EUR’s share fell even further, from 19.0% to 15.3%. These transaction share drops reflect the increased shares of such currencies as RMB, AUD, and CAD, which have come to play more important roles as reserve currencies (see graph). It is clear from a glance at the graph that EUR is the currency whose market share has fallen the most over the past 15 years. Critical Perception as a Pipe Dream Of course, it may be that Juncker’s remarks were meant to suggest that efforts should be made to prevent the abovementioned trend from continuing over the long term. As stated in the remarks quoted on page 18, before the end of the year, the EC intends to present initiatives to strengthen EUR’s international role. EC Chairman Juncker is wholeheartedly resolved to increase regional cohesiveness, and one wonders what kind of actions the Juncker-led EC will take this year. This is an interesting situation to consider in the context of forecasting medium-to-long term EUR trends. On the other hand, it is also true that it is EUR itself that has been a main factor progressively weakening the fundamentals of the southern European countries’ economies, and there is a need for a bit more explanation of why it is thought that making EUR a key international currency will benefit the euro area economy. There will probably also be criticism questioning how the goal of making EUR a key international currency might relate to the immigrant/refugee issue, which is the biggest euro area problem at this time. In light of this, I think that Juncker’s recent remarks are likely to be generally considered articulations of pipe dreams that do not directly address the current situation in the euro area. In any case, the remarks seem unlikely to be a very effective means of countering the trend of increasing popular disillusionment and alienation from the EU.
Daisuke Karakama Chief Market Economist Forex Department Mizuho Bank, Ltd. Tel: +81-3-3242-7065 [email protected]
These materials and the content of any related presentation are confidential and proprietary and may not be passed on to any third party and are provided for informational purposes only. Assumptions have been made in the preparation of these materials and any such presentation and Mizuho Bank, Ltd. (“Mizuho”) does not guarantee completeness or accuracy of, and no reliance should be placed on, the contents of these materials or such presentation. Nothing in these materials or any related presentation constitutes an offer to buy or sell or trade and the terms of any transaction which may be finally agreed will be contained in the legal documentation for any such transaction, with such transaction being priced at market rates at the relevant time (the rates herein or in any related presentation being purely illustrative). (As a general rule you will not have a right to terminate early any transaction entered into – if you wish to do so, losses may be incurred by you.) These materials and any related presentation should not be considered an assertion by Mizuho of suitability for you of any transaction, scheme or product herein or therein. Mizuho has no duty to advise you on such suitability, nor to update these materials or contents of any related presentation. You must determine in your own judgment the potential risks involved in the transactions outlined herein or in any related presentation (taking professional financial, legal and tax and other advice) and whether or not you will enter into any transaction that may arise from these materials or related presentation. Nothing herein or in any related presentation should be construed as providing any projection, prediction or guarantee of performance or any financial, legal, tax, accounting or other advice. Mizuho shall have no liability for any losses you may incur as a result of relying on the information herein or in any related presentation. “MHBK provides this information for free. Please request for cancellation of subscription if you do not want to receive free-of-charge information from MHBK.”