forest visitor surveys 2006 summary report · events, embrace (bedgebury, 11th june), ub40 (dalby,...
TRANSCRIPT

FOREST VISITORSURVEYS
2006Summary Report
Jackie Watson/Neil GrantEconomics & StatisticsForestry CommissionDecember 2007
2
CONTENTS1. INTRODUCTION .............................................................................................................. 3
2. LOCAL VISITOR SURVEYS ........................................................................................... 4
2.1. SCOTLAND...................................................................................................................... 4EVENTS EVALUATION......................................................................................................... 4LAGGAN WOLFTRAX........................................................................................................... 52.2 ENGLAND ......................................................................................................................... 6MUSIC IN THE FOREST......................................................................................................... 6EAST ANGLIA, Thetford......................................................................................................... 7WESTONBIRT, National Arboreta .......................................................................................... 8WESTONBIRT, Visitor Play Survey 2006............................................................................... 9WESTONBIRT, Christmas Questionnaire.............................................................................. 10SOUTH WEST CYCLING ..................................................................................................... 112.3. WALES........................................................................................................................... 12COED Y CYMOEDD, Afan Forest Park................................................................................ 12
3. OTHER SURVEYS ........................................................................................................... 13
3.1. QUALITY OF EXPERIENCE SURVEYS .................................................................. 13DELAMERE FOREST ........................................................................................................... 13HAMSTERLEY FOREST ...................................................................................................... 14SHERWOOD PINES .............................................................................................................. 16GARWNANT FOREST.......................................................................................................... 17NANT YR ARIAN.................................................................................................................. 18NORTH WEST ENGLAND ................................................................................................... 19SOUTH WALES VALLEYS.................................................................................................. 203.2. SCOTLAND 'ALL FORESTS' VISITOR SURVEY (YEAR 2) ................................ 21YEAR 2 SUMMARY.............................................................................................................. 21SCOTTISH LOWLANDS....................................................................................................... 22MORAY FOREST DISTRICT ............................................................................................... 23LORNE FOREST DISTRICT................................................................................................. 24DORNOCH FOREST DISTRICT .......................................................................................... 25TAY FOREST DISTRICT ...................................................................................................... 26SUMMARY OF RESULTS BY FOREST DISTRICT........................................................... 273.3 SCOTTISH RECREATIONAL SURVEY 2005........................................................... 283.4 FOREST HOLIDAYS..................................................................................................... 29CAMPSITES ........................................................................................................................... 29CABINS .................................................................................................................................. 30
3
1. INTRODUCTIONBetween 1995 and 2001 the Forestry Commission co-ordinated a NationalProgramme of visitor surveys across Great Britain, focussing on larger sites, oftenwith visitor centres. In 2002, this programme ceased to operate. A new visitormonitoring system was piloted in 2002. This was aimed primarily at providing amore accurate estimate of the number of visits to woodland managed by the ForestryCommission, whilst continuing to gather information regarding the profile of visitors.New methods of measuring the quality of visitor experience were also researched.Quality of experience surveys began in England in 2003, with three or four sites beingmonitored each year. The 'All Forests' visitor monitoring surveys began operating inWales and Scotland in 2004, with results from the Welsh survey published in 2005;reports for the first and second years of Scotland All Forest survey have beenpublished; a report on the third year and a final report will be published in early 2008.
Local surveys to provide information on forest visitors are still carried out whenrequired by forest district management, for example, the surveys carried out atWestonbirt, detailed later in this report. These types of surveys address localmanagement issues, with questionnaires designed to obtain information that variesfrom site to site. Some surveys are targeted at specific events or visitors - for example,the Christmas survey at Westonbirt; other surveys are more general. Results should beinterpreted with caution when sample sizes are small.
Section 2 of this report gives the main findings from the local visitor surveys thatwere carried out in 2006 and details of others such as the survey of concert goers atour music in the forest events.
Section 3 gives details of other surveys carried out in 2006 that provide informationabout forest visitors. These include the 'All Forests' survey in Scotland, the 'Qualityof Experience' surveys at various sites in England, 'Forest Holidays' surveys, and theScottish Recreational survey.
For more information about this or other visitor survey work please contact ForestryCommission Statistics at the address below.
Contact:Economics & StatisticsForestry Commission231 Corstorphine RoadEdinburghEH12 7ATTel: 0131 314 6218Fax 0131 316 4344Email: [email protected]

4
2. LOCAL VISITOR SURVEYS
2.1. SCOTLAND
EVENTS EVALUATION
This Events survey took place between June – October 2006 at eight Forest Districts;Aberdeenshire, Ae, Cowal & Trossachs, Fort Augustus, Galloway, Lochaber, Morayand Scottish Lowlands. Various events took place some of which included 10,000steps, Den building, Bat watching, Photo workshops, Wildlife tours, Fungi day andvarious walks.
A total of 312 questionnaires were completed and the summary data collates the eightforest districts results together.
SummaryThe majority of visitors (98%) who had attended these events said they wouldrecommend the FCS event to family and friends. Almost all visitors were satisfiedwith the service provided by staff (99%). Three-quarters of visitors will be happy toreceive information about the event in the future.
Results
TotalNumber of completed questionnaires 312Visit details% who had attended one of our events before 33 % who attend an event more than once a year 38% who were aware of the Event’s guide 61% who had visited the FC website 19% who had seen the event advertised FCS event guide 24% who would recommend the FCS event to family and friends 98Ratings1
% satisfied with quality of information 100% satisfied with overall quality of event 100% satisfied with the service provided by our staff 100Future% who would like to receive information in the future 75% of preferred method to receive future information (Post / E-mail) 2 55/45
Timing of survey: June – October 2006Type of survey: Self-completion questionnaireTables: Events Evaluation Form Scotland FD
1 Satisfaction rating expressed as a proportion of those who rated the facility. Visitors are classed as satisfied ifthey give a rating of Excellent, Good, or OK.
2 Satisfaction ratings based only on those who responded.

5
LAGGAN WOLFTRAX
This report provides an evaluation of the Laggan Wolftrax development based atLaggan. Although the report was to evaluate the mountain bike facility it was agreedthat the report should also provide a profile of visitors to the walking and ponytrekking trails.
Summary
Nearly three-quarter of visitors rated the mountain bike trails as very good (73%) and(15%) good. The Red route trail and the Blue fun park trails proved very popular with90% and 84% respectively of visitors using them or going to. The development andpromotion of other activities such as walking and pony trails had positive feedbackand suggests a greater role for them in the future.
ResultsTotal
Face to Face interviews with Mountain Bikers 506Group details% of group in the majority were male 83% of most popular age group 31 – 45 years old 47Visit details% of visitors who became aware of mountain bike trails through word ofmouth
55
% of visitors using Red Route Trail 90% of visitors using Blue Fun Park 84% of visitors using Black Double Diamond Route 45% of visitors who visited at least 6 times or more in the last year 37% of visitors spending at least one night away from home 52% of visitors staying in youth hostel/backpackers accommodation orcampsites.
47
Face to Face interviews with Walkers 96Group details% of group in the majority were female 60% of group aged between 31 – 45 years old and 46 – 60 years old 39/39% of group walking dog 57Visit details% of visitors became aware of trails after seeing board or sign incarpark
40
% of visitors planned to spend between one and three hours walking 76% of visitors spending at least one night away from home 79% of visitors staying in self catering accommodation 43Ratings1
% of mountain bikers satisfied with cycling trails 100% of walkers satisfied with the walking trails 100Number of visitors satisfied with pony trekking trails 99
Timing of survey: July – August 2006Type of survey: Face to face surveys and Self-completionPublication: Laggan Wolftrax Evaluation Report
1 Satisfaction ratings based only on those who responded

6
2.2 ENGLAND
MUSIC IN THE FOREST
These were a series of concerts that took place at Forestry Commission sites acrossEngland during June and July 2006. Research was undertaken at three of theseevents, Embrace (Bedgebury, 11th June), UB40 (Dalby, 23rd June) and Jamie Cullum(Delamere, 21st July). A total of 1,073 interviews were completed with 374 atBedgebury, 344 at Dalby and 355 at Delamere. The results in the table below arecomparing each of the individual sites.
SUMMARY OF RESULTS
Bedgebury Dalby DelamereEmbrace UB40 Jamie Cullum
Sex Just over half of visitorswere female (55%).
Out of the three sites thehighest proportion of
female visitors came tothe UB40 concert (63%).
Almost three-fifths of visitorswere female (58%).
Age Youngest profile of agebracket
16-34 years old(66 %).
Older visitors between theages of 35-54 (63%).
Visitors were of mixed ageswith the highest proportion
aged 34 or under (53%).
Life Cycle Over half of respondents(54%) were in the Young
Independent lifecycle.
Just under half ofrespondents (45%) werein the Family lifecycle.
Respondents were slightlymore mixed with 40% ofrespondents being Young
Independents and 30% beingin the Families lifecycle.
Origin 55% came from Kent. 82% came fromYorkshire andHumberside.
63% North West England.
Type oftrip/Accommoda
tion
Over four-fifths were onday trips (88%), with veryfew on an overnight stay(11%) but of those who
did 28% stayed withfriends/relatives and 28%
stayed in a hotel.
Just over three-quarterswere local day-trippers
(76%) and about a quarterhad an overnight stay
(24%). Over half (51%)stayed in a caravan.
Over four-fifths had a tripfrom home (82%) while only18% had an overnight stay.Of these almost two-fifths
stayed in a hotel (37%) whileover a third stayed with
family and friends (35%)
Transport used Vast majority travel bycar/van (95%) and just
under half (48%) travelled25 miles or over to get to
the concert.
Majority travel by car/van(89%) with 7% travelling
by minibus or coach.Three-fifths (60%)
travelled between 25miles or over.
Only 5% came by train whilethe vast majority came by
car/van (87%). 14% travelledless than 5 miles while 47%travelled 25 miles or over.
Duration ofJourney
Average 1hr 15 mins. Average 1hr 22 mins. Average 1 hr 15 mins.
InformationSources
The largest amount ofrespondents (24%)
received an e-mail fromthe ticket agency while afifth (20%) heard from
family and friends.
The highest proportionsourced the information
from a Newspaper/magazine advert (36%)
Over a quarter (29%) ofrespondents had an e-mail
from the ticket agency with21% getting the information
on the site.
Overall 36% of respondents at all three sites had previously visited the sites before theconcerts. During previous visits over half (51%) of all respondents had come for awalk, 37% had attended a music event and 27% had come for a family day out.

7
EAST ANGLIA, Thetford
This survey took place at 15 sites in East Anglia Forest District over 26 fieldworkperiods in 2006; a total of 235 interviews were carried out.
SummaryThe majority of visitors travelled from home (86%) and of those that did not 31% hadcamped or stayed in a caravan.
ResultsTotal
Number of completed questionnaires 235Group composition% of senior citizens (aged 75+) 3% of senior citizens (aged 60 - 74) 21% of adults (aged 45 - 59) 39% of adults (aged 35 - 44) 33% of adults (aged 25 – 34) 20% of young adults (aged 16-24) 4% of children (aged <16) 21% of groups with dogs 42Trip Details% who travelled from home 86% who travelled less than 6 miles 23% whose main type of transport used was car / van 95Visit Details% of repeat visitors to same forest 77% who visit at least once a week 27% length of stay over an hour 46% who first found out about Thetford through friend or relation / hadalways known
18 / 34
Activities% whose main activity was dog walking / other walking 32 / 13% whose main activity was cycling 6% whose main activity was for fresh air / exercise 10% whose main reason for visiting was to relax and picnic 15
Timing of survey: 2006Type of survey: Self completion questionnairesTables only: Available by individual sites and as combined tables

8
WESTONBIRT, National Arboreta
Visitors to the National Arboretum were asked to complete a questionnaire from theend of May 2006 to the beginning of May 2007. The results from the 713questionnaires returned are summarised below.
SummaryOver half of groups (55%) took up to an hour to travel to Westonbirt with a further29% taking up to 2 hours. Just over one-fifth (21%) of groups were recommended byfriends or relations to visit Westonbirt a further 7% had previously attended an eventand thought they would come back. On the rating of enjoyment almost half of groupshad rated it very good (48%).
ResultsTotal
Number of completed questionnaires 713Group composition% of groups consisting of ages 75 and over 17% of groups consisting of ages 60-74 54% of groups consisting of ages 45-59 42% of groups consisting of ages 35-44 16% of groups consisting of ages <35 32Visitor details% of visitors who travelled up to 2 hours to get to the Arboretum 84% of visitors who visited the Arboretum for the first time 38% of visitors who visit the Arboretum Once a year/1–3 times a year 12/26% of visitors who were prompted to visited by Family or relations 21% whose main purpose for their visit was to see Famous Tree collection 53Ratings1 in term of Value for Money % satisfied with Admission Price 87% satisfied with Forest shop 95% satisfied with Plant centre 93% satisfied with the Maple restaurant 87% satisfied with the Courtyard cafe 85Ratings1 generally% satisfied with Roadsigns 96% satisfied with Parking 98% satisfied with Maples café 93% satisfied with Forest shop 99% satisfied with Staff/volunteers 99% satisfied with Toilets 94% satisfied with Directional signs on site 85% satisfied with Educational info on site 97% satisfied with Events 100% satisfied with Enjoyment 100% satisfied place for children 96% satisfied Suitability for special needs 96
Timing of survey: May 06 – May 07Type of survey: Self-completion questionnaire Tables only: Westonbirt Arboretum 2006
1 Satisfaction rating expressed as a proportion of those who rated the facility. Visitors are classed as satisfied ifthey give a rating of Very Good, Good or OK.

9
WESTONBIRT, Visitor Play Survey 2006
During the months of August – October the aim of this family play survey was totarget those groups with young dependants in an attempt to obtain information thatwill allow the FC to improve services to families visiting Westonbirt. A total of 149questionnaires were completed.
Summary77% of the groups interviewed said that they are always accompanied by youngpeople. 27% were on their first visit to Westonbirt. Nearly three-quarters (74%) ofgroups felt that nothing at Westonbirt prevented or hindered children’s play. 78% felt itwas very important or important to have opportunities for family interaction when visitingWestonbirt.
ResultsTotal
Number of completed questionnaires 149Use of Westonbirt% of respondents who are members of Friends of Westonbirt 54% of respondents visiting for first time 27% of groups containing at least one person aged 11-15 17% of groups containing at least one person aged 5-10 73% of groups containing at least one person aged under 5 50% of groups in which adolescents (11-15) always accompany adults toWestonbirt
71
% of groups in which young children (5-10) always accompany adults toWestonbirt
84
% of groups in which babies/toddlers (aged under 5) always accompanyadults to Westonbirt
77
Activities% of groups taking part in Informal nature play/Exploring walking 23/23% of groups taking part in Collecting natural materials 21% of groups taking part in Self led trails 16% of groups taking part in Led family activities or events 15% of groups Play using equipment taken from home 3% of groups whose visit resulted in further play at home 70Play% of groups who felt nothing at Westonbirt prevented/hindered play 74% of groups whose favourite play activity was Active Play 23Factors rated important in decision to take part in an activity 1% stating – importance of cost 50% stating - importance of ease of access 58% stating – importance of close to other amenities 65% stating – importance of first impressions 68% stating – importance of health and safety 67% stating - importance of opportunity for family interaction 81% stating - importance of opportunity to interact with other families 22% stating - importance of childcare/supervision provided 10% stating - importance of interests of your children 93% stating - importance of opportunity for new skills/learning 77Timing of survey: Aug 06 – Oct 06Type of survey: InterviewersTables only: Family Survey for Play, Westonbirt Arboretum 20061 Importance rating expressed as a proportion of those who rated the facility. Visitors are classed as believingfactor is important if they give a rating of Very important or Important.

10
WESTONBIRT, Christmas Questionnaire
These interviews were done in November/December 2006 to find out what visitors thoughtabout this event. 127 Questionnaires were completed.
Summary
32% of groups visiting this event contained a person who is a Friend of Westonbirt.In terms of Value for money and Enjoyment from this event 99% of groups thought itwas very good, good or ok. 71% of visitors found the Enchanted Wood event busybut ok.
ResultsTotal
Number of completed questionnaires 127Group Composition% of groups containing one male 53% of groups containing one female 46% of groups containing someone aged 75 and over 5% of groups containing someone aged 60 – 74 31% of groups containing someone aged 45 – 59 49% of groups containing someone aged 35 – 44 27% of groups containing someone aged 25 – 34 13% of groups containing someone aged 16 – 24 8% of groups containing someone aged 4 – 15 36% of groups containing someone aged under 4 24Visitor details% taken by groups to travel to Westonbirt (under an hour to an hourand a half travel)
88
% of groups saw the publicity by Banners on the roadside 12% of those in group that are members of FoW 32% of visitors that this was there first visit to Westonbirt 12% of visitors who visit between 1 – 3 times a year 39Ratings 1
% satisfied with the event in terms of - Value for money 100% satisfied with the event in terms of - Enjoyment 100Enchanted Wood Trail% of visitors who found the enchanted wood trail overcrowded 17% of visitors who found it busy but ok 71% of visitors who said that the overcrowding affected theirenjoyment of the event - a lot
5
% of visitors who said that the overcrowding affected theirenjoyment of the event - a little
71
% of visitors who took an hour or less to walk round the Enchanted Wood 73
Timing of survey: November/December 2006Type of survey: InterviewerTables: Christmas Questionnaire
1 Satisfaction rating expressed as a proportion of those who rated the facility. Visitors are classed as satisfied ifthey give a rating of Very Good, Good or OK.

11
SOUTH WEST CYCLING(developing off-road cycling in woodlands in the South West)
This study was brought about because of issues facing traditional forestry, with fallingtimber prices, less employment, reduced maintenance and lower harvesting rates.The study considers the economic and health benefits that can accrue from off-roadcycling in the South West. Over 200 woodland off-road cycling locations wereidentified in the South West so the report looked at the geographic hubs as well asalready clearly identifiable centres.
The consultation process identified 3 main themes relating to the region’s woods andforests. These are livelihoods (jobs and businesses) including tourism, quality of lifeincluding recreation and access and health and wellbeing and natural resources andthe environment.
The key finding of this report showed that there is considerable demand for woodlandcycling across the South West. The number of current woodland cycling trips acrossthe South West are estimated between 4 million and 8 million per annum. Of these,an estimated 1 million cycling trips are visitors to the region. The economic impact ofthis activity on the regional spend is between £81 million and £129 million perannum, supporting 1,300 to 2,000 full time equivalent jobs.
Development of new woodland off-road cycling facilities in the South West andacross the UK has revealed that the local population alone has the potential to makebetween 6.8 million and 10.5 million woodland cycling trips per annum.
It was suggested that the benefits of a new planned development of woodland cyclingwould:
• Provide regional economic benefits.• Bring benefits to woodland owners through a range of commercial opportunities
as well as delivering other benefits across a range of key strategic issues.• Address the health agenda and issues of social inclusion.• Help manage and control the environment impact of recreation on sensitive sites.
This report can be obtained as A Feasibility Study or Appendices, December 2006.

12
2.3. WALES
COED Y CYMOEDD, Afan Forest Park
This survey took place at three differing sites within Afan Forest Park in Coed yCymoedd Forest District and it is the fifth annual visitor survey out of a planned sixfor the area.
Between August 19th and September 9th, 403 face to face questionnaires werecompleted at the exits of Afan Forest Park Visitor Centre, Glyncorrwg Mountain BikeCentre and Rhyslyn Car Park. SummaryOver four-fifths of respondents (86%) did not consider visiting anywhere else thatday. Over two-thirds of respondents had visited Afan Forest Park before and of those9 out of 10 had visited within the past 2 years, 45 % of which had visited 6 or moretimes.
Visits by local residents have increased by 7% since last year, however visits byrespondents from 1 to 2+ hours drive time have decreased by the same amount. Themajority of visitors travelled to Afan Forest Park by car.
Mountain Biking continues to be the most popular reason for visiting with three-quarters of visits attributable to the sport. This has grown in comparison to last yearwhere just under half of visits were by mountain bikers.
Over half of visitors to Afan Forest Park stayed in the park for over 3 hours comparedto only a quarter in 2002.
Awareness of the Afan Forest Park website now stands at 44% and 4 out of 5 visitorsrated the signage and information as either very or fairly good.
Timing of survey: August – September 2006Type of survey: Face to Face questionnairePublication: Research Document

13
3. OTHER SURVEYS
3.1. QUALITY OF EXPERIENCE SURVEYS
DELAMERE FOREST
This survey took place at Delamere Forest between 26th July and 28th October 2006. Atotal of 269 people were interviewed and 40 self-completion questionnaires werereturned (25% of the 162 distributed).
SummaryThe majority of visitors to Delamere were in the Family and Empty Nester lifecyclegroups (77%), with those in the Family lifecycle likely to take part in walking andcycling while those in the Empty Nester lifecycle were likely to take part in hill-walking or rambling. Slightly over four-fifths of visitors were on a short trip of lessthan an hour from home (81%).
ResultsTotal
Number of interviews 269Visitor Profile% of senior citizens (aged 65+) 10% of adults aged 45-64 35% of adults aged 25-44 50% of young adults (aged 16-24) 6% of who were in the Family lifecycle group 39% of visitors in social grades ABC1 72Trip Details% who were from Crewe/Warrington 24 / 22% who were on a short day trip from home (less than 1 hour) 81% who were on a longer day trip from home (3 hours or more) 1% who were on an overnight stay away from home 1Visit Details% who had visited the forest before 80% who visited 1 to 3 times a month 33Average length of stay on site 2 hrs 22 mMost important aspects in decision to visit2
Feeling safe in the forest 4.24Clean toilets 4.18Being able to spend time with family and friends 4.13Aspects of visit given top satisfaction rating1, 2
Being able to get fit and healthy 4.11Value for money of your whole trip or day out 4.03Being able to enjoy scenery and views 3.99
Timing of survey: 26th July - 28th October 2006Type of survey: On-site interview, self-completion questionnairePublication: 'Monitoring the quality of experience in forests – Delamere'
1 Satisfaction ratings based only on those who responded.2 Ratings based a scale from 1 to 5; e.g. 5 extremely important, 4 very important, 3 fairly important, 2 fairly unimportant, 1 not at all important

14
HAMSTERLEY FOREST
This survey took place at Hamsterley Forest. A total of 267 people were interviewedand 62 self-completion questionnaires were returned (32% of the 191 distributed).
SummaryThe largest proportion of visitors to the Hamsterley Forest were in the Empty Nester(over 55, no children) and Family lifecycles and were taking part in walking while inthe forest. Visitors to Hamsterley tended to be on a repeat visit to the forest withthese visitors typically coming to the site once a month or less.
The most popular leisure activities undertaken in Hamsterley Forest by visitors werebeing able to walk without a dog, picnics and barbecues and cycling. The mostpopular aspects of visiting the forest, were the peace and tranquillity, scenery andbeautiful views. The average spend of visitors to the forest was £23.
ResultsTotal
Number of interviews 267Visitor Profile% of senior citizens (aged 65+) 11% of adults aged 45-64 33% of adults aged 25-44 50% of young adults (aged 16-24) 6% who were in the Family lifecycle group 43% of visitors in social grades ABC1 62Trip Details% who were from Darlington / Durham 43 / 12% who were on a short day trip from home (less than 1 hours) 64% who were on a longer day trip from home (3 hours or more) 2% who were on an overnight stay away from home 9Visit Details% of repeat visitors to same forest 78% who visited 1 to 3 times a month 28Average length of stay 2 hrs 53 mMost important aspects in decision to visit 2Feeling happy to leave car in the car park 4.24Clean toilets 4.18Feeling safe in the forest 4.13Aspects of visit given top satisfaction rating1, 2
Value for money of your whole trip or day out 4.20Enough car parking 4.20Being able to spend time with family and friends 4.19
Timing of survey: 26th July - 28th October 2006Type of survey: On-site interview, self-completion questionnairePublication: 'Monitoring the quality of experience in forests – Hamsterley
Forest'
1 Satisfaction ratings based only on those who responded.2 Ratings based a scale from 1 to 5; e.g. 5 extremely important, 4 very important, 3 fairly important, 2 fairly unimportant, 1 not at all important.

15

16
SHERWOOD PINES
This survey took place at Sherwood Pines Forest. A total of 303 people wereinterviewed between 26th July and 28th October and 63 self-completion questionnaireswere returned (30% of the 213 distributed).
SummaryThe largest proportion of visitors to Sherwood Pines were in the Family lifecyclegroup; these visitors were more likely than others to take part in a picnic and barbecuewhile on the site. Most visitors were on a short trip of less than an hour from homeespecially frequent visitors and dog walkers. Leisure activities in the forest includecycling, walking and visits to the café.
The most important aspects of visiting the forest was the feeling of being safe andbeing able to enjoy the scenery and views. Other influences in visiting the forest wasthe fact it was close to home and also the weather. The average spend of visitors tothe forest was £24.
ResultsTotal
Number of interviews / self complete questionnaires returned 303 Visitor Profile% of senior citizens (aged 65+) 8% of adults aged 45-64 25% of adults aged 25-44 57% of young adults (aged 16-24) 10% who were in the Family lifecycle group 49% of visitors in social grades ABC1 64Trip Details% who were from East Midlands / Nottingham 69 / 57% who were on a short day trip from home (less than 1 hours) 77% who were on a longer day trip from home (3 hours or more) 1% who were on holiday away from home 8Visit Details% of visitors who have visited before 69% who visited 1 to 3 times a month 24Average length of stay 2 hrs 47mMost important aspects in decision to visit 2Clean toilets 4.33Feeling happy to leave car in car park 4.29Feeling safe in the forest 4.28Aspects of visit given top satisfaction rating1,2 ‘Go Ape’ High Rope course 4.18Value for money of your whole trip or day out 4.15Being able to spend time with family and friends 4.11
Timing of survey: 26th July - 28th OctoberType of survey: On-site interview, self-completion questionnairePublication: 'Monitoring the quality of experience in forests – Sherwood
Pines Forest'
1 Satisfaction ratings based only on those who responded.2 Ratings based a scale from 1 to 5; e.g. 5 extremely important, 4 very important, 3 fairly important, 2 fairlyunimportant, 1 not at all important.

17
GARWNANT FOREST
This survey took place in Garwnant Forest and a total of 302 visitors wereinterviewed between 26th July and 28th October and 55 self completion questionnaireswere returned (26% of the 211 distributed).
Summary
The majorities of visitors were in the Empty Nester and Family lifecycles and livedlocally, travelling for less than an hour to reach the site. The leisure activities mostfrequently undertaken at Garwnant Forest include walking with and without a dog,hill walking or rambling and also visiting the café and forest shop. Important factors for visitors in their decision to visit the forest were feeling safe inthe wood, feeling happy to leave car in the car park and the clean toilets. Visitorswere most satisfied with being able to enjoy scenery and views and being able toenjoy time with family and friends. The average spend of visitors to the forest was£17.
ResultsTotal
Number of interviews 302Visitor Profile% senior citizens (aged 65+) 18% adults aged 45-64 41% adults aged 25-44 37% adults (aged 16-24) 5% who were in Family lifecycle group 42% who were in social grades ABC1 64Trip Details% who were from Cardiff area 56% who were on a short day trip from home (less than 1 hours) 60% who were on a longer day trip from home (3 hours or more) 8% who were on holiday away from home 17Visit Details% of visitors who have visited before 67% who visited 1 to 3 times a month 29Average length of stay 1 hrs 52mMost important aspects in decision to visit2
Clean toilets 4.07Being able to enjoy the scenery and views 4.00Feeling safe in the forest 3.97Aspects of visit given top satisfaction rating1,2
Being able to enjoy scenery and views 4.15Being able to spend time with family and friends 4.06Children’s play equipment 4.00
Timing of survey: 26th July and 28th October 2006Type of survey: On-site interview, self completion questionnairesPublication: 'Monitoring the quality of experience in forests – Garwnant
Forest’1 Satisfaction ratings based only on those who responded.2 Ratings based a scale from 1 to 5; e.g. 5 extremely important, 4 very important, 3 fairly important, 2 fairlyunimportant, 1 not at all important.

18
NANT YR ARIAN
This survey took place in Nant Yr Arian and a total of 294 visitors were interviewedbetween 26th July and 28th October and 79 self completion questionnaires werereturned (34% of the 235 distributed).
Summary
Visitors to Nant Yr Arian were predominantly in the Empty Nester Lifecycle group(aged 55 or over, no children). The leisure activities most frequently undertaken atNant Yr Arian were visiting the café, walking with and without a dog, visiting the RedKite viewing area and birdwatching. Important factors for visitors in their decision to visit the forest were being able toenjoy the scenery and views, feeling happy to leave car in the car park and the cleantoilets. What visitors were most satisfied about their visit to Nant Yr Arian was thevalue for money of the trip and being able to enjoy the scenery and the views as wellas the Red Kites. The average spend of visitors to the forest was £42. Results
TotalNumber of interviews 295Visitor Profile% senior citizens (aged 65+) 18% adults aged 45-64 41% adults aged 25-44 38% adults (aged 16-24) 3% who were in Family lifecycle group 30% who were in social grades ABC1 70Trip Details% who were from Shrewsbury area 26% who were on a short day trip from home (less than 1 hours) 22% who were on a longer day trip from home (3 hours or more) 9% who were on holiday away from home 48Visit Details% of visitors who have visited before 63% who visited 1 to 3 times a month 23Average length of stay 2 hrs 12mMost important aspects in decision to visit2
Being able to enjoy the scenery and views 4.26Clean toilets 4.24Feeling happy to leave your car in car park 4.04Aspects of visit given top satisfaction rating1,2
Value for money of your whole trip or day out 4.27Being able to enjoy scenery and views 4.25Red Kite hide 4.25
Timing of survey: 26th July and 28th October 2006Type of survey: On-site interview, self completion questionnairesPublication: 'Monitoring the quality of experience in forests - Nant Yr Arian’
1 Satisfaction ratings based only on those who responded.2 Ratings based a scale from 1 to 5; e.g. 5 extremely important, 4 very important, 3 fairly important, 2 fairlyunimportant, 1 not at all important.

19
NORTH WEST ENGLAND
This survey took place in the neighbourhoods within a mile of Moston Vale andColliers Wood Community Woodland areas in North West England. A total of 319visitors were interviewed in their homes between November and December 2006.
The objectives of this study were to find out about the recreational activitiesundertaken by members of these communities, levels of recreational use andawareness of local open spaces, motivations for and the barriers to using thecommunity woodland sites for recreation and to identify improvements which couldbe made.
The main reason preventing respondents from visiting forests was being “too busyworking or studying” whereas the main reason’s for respondents not visiting MostonVale or Colliers Wood was because they were not aware of places to visit.
Results1
Moston Vale Colliers Wood
Total Home Interviews 163 156Visitor profile% of Male / Female respondents 48/52 51/49% senior citizens (aged 65+) 17 19% adults aged 45-64 31 33% adults aged 25-44 38 37% adults (aged 16-24) 14 10% who were in Family lifecycle group 40 40% who were in social grades ABC1 18 55% who were in Full time employment 30 hours + 26 50Active outdoor pursuit 72 81% of respondents who do dog walking 26 33% of respondents who Walk over 2 miles + 20 28% of respondents who do cycling or mountain biking 12 19Passive outdoor pursuits 50 56% of respondents who visit parks and gardens 30 33% of respondents who visit the outdoors with children 23 20% of respondents who do sightseeing or touring (bycar)
13 30
% of respondents who bird-watching or nature studies 4 13Visits Details% who visited the site during the previous 12 months 11 12Of those who visited the site, % who visited at leastonce a month
56 85
Average visits per year 57 116Only those respondents who had visited before:Most important aspects in decision to visit 2
Convenient/close to where I live 4.17 3.94Feeling safe in the wood 4.12 4.32Timing of survey: November and December 2006Type of survey: In-home interviews (One adult per household)Publication: 'Monitoring the quality of experience in community forests – NW England’
1The report also separates the survey respondents in ‘outdoor users’ and ‘non-users’.2 Ratings based a scale from 1 to 5; e.g. 5 extremely important, 4 very important, 3 fairly important, 2 fairlyunimportant, 1 not at all important.

20
SOUTH WALES VALLEYS
This survey took place in the neighbourhoods of Briton Ferry, Tredegar and MountainAsh in the South Wales Valleys. A total of 502 visitors were interviewed in theirhomes between November and December 2006.
The objectives of this study were to find out about the recreational activitiesundertaken by members of these communities, levels of recreational use andawareness of local open spaces, motivations for the barriers to using the FCW sites forrecreation and to identify improvements which could be made.
Respondents were asked what generally prevented them from visiting forests; themain reasons given were “too busy working or studying”, “weather” and “poorhealth”.
Results1
Briton
Ferry
Tredegar
(St James
Woodland)
Mountain
Ash
Total Home Interviews 151 164 187Visitor profile% of Male / Female respondents 40/60 49/51 42/58% senior citizens (aged 65+) 22 20 25% adults aged 45-64 34 37 36% adults aged 25-44 38 35 29% adults (aged 16-24) 6 9 11% who were in Family lifecycle group 32 30 35% who were in social grades ABC1 34 35 21% who in full time employment 30 hours + 33 39 23Active outdoor pursuit 86 76 72% of dog walking 43 36 35% of who walk over 2 miles 39 27 25% of cycling or mountain biking 20 18 11Passive outdoor pursuits 63 63 52% of sightseeing/touring (by car) 36 32 30% of who visit parks/gardens 35 37 31% of who picnic/bbq and outdoor socialising 34 27 20% of who visit the outdoors with children 34 23 21Visits Details% who visited the site during the previous 12months
36 21 25
Of those who visited the site, % who visitedat least once a month
52 49 72
Average visits per year 60 45 106
Timing of survey: November and December 2006Type of survey: In-home interviews (One adult per household)Publication: 'Monitoring the quality of experience in community forests South Wales Valleys’.
1 The report also separates the survey respondents in ‘outdoor users’ and ‘non-users’.

21
3.2. SCOTLAND 'ALL FORESTS' VISITOR SURVEY(YEAR 2)This survey was commissioned by FC Scotland to monitor the number of visits totheir woodlands and to obtain visitor profiles. The survey takes place over a three-year period with five forest district being surveyed each year. A summary of theresults of the second year of the survey is presented below and on the followingpages. Monitoring took place at a sample of FCS woodlands (approximately 20% offorests in each forest district). Fieldwork was carried out between June 2005 and May2006 by TNS Travel & Tourism. A total of 1,130 interviews took place.
YEAR 2 SUMMARYAn estimated 2.4 million visits were made to the five forest districts surveyed in2005/6. The average group size was 1.9 people with 58% of visitors aged 25 - 59years old. Under a fifth (17%) of visitors were on overnight stays in the area spendingon average 8.2 nights in Scotland. 70% of visitors travelled less than 6 miles to thesite while 56% were dog walkers, and the average duration of visit was 1 hour and 17minutes.
ResultsTotal
Number of interviews 1 130Estimated number of visits (million) 2.4Estimated annual spending (£ million) 8.2Visitor profileAverage group size 1.9% of male 51% of senior citizens (aged 60+) 22% of adults aged 25-59 58% of young adults (aged 16-24) 4% of children (aged < 16) 16% of groups with at least 1 person with a disability 7Trip Details% on a local day trip who travelled less than 6 miles to the site 59% who travelled to the site by car/van 72% on an overnight stay in area 17Average length of stay in Scotland for overnight trips (nights) 8.2% of visitors from England / Overseas 9 / 1Visit Details% of repeat visitors to same forest 86% who visit at least once a day 25Average length of visit to forest 1 hr 17m% whose main activity was dog walking / other walking 56 / 28% whose main activity was Cycling / MTB on waymarked tracks 5Average expenditure per visit (£) 18
Timing of survey: June 2005 - May 2006Type of survey: Face to face interviews & visitor countingPublications: 'All Forests Visitor Monitoring: Survey of visitors to FC
Scotland woodlands 2005/6'Topics covered: Standard demographics and details of visit including length
of stay, activities, group size and expenditure.
22
SCOTTISH LOWLANDS
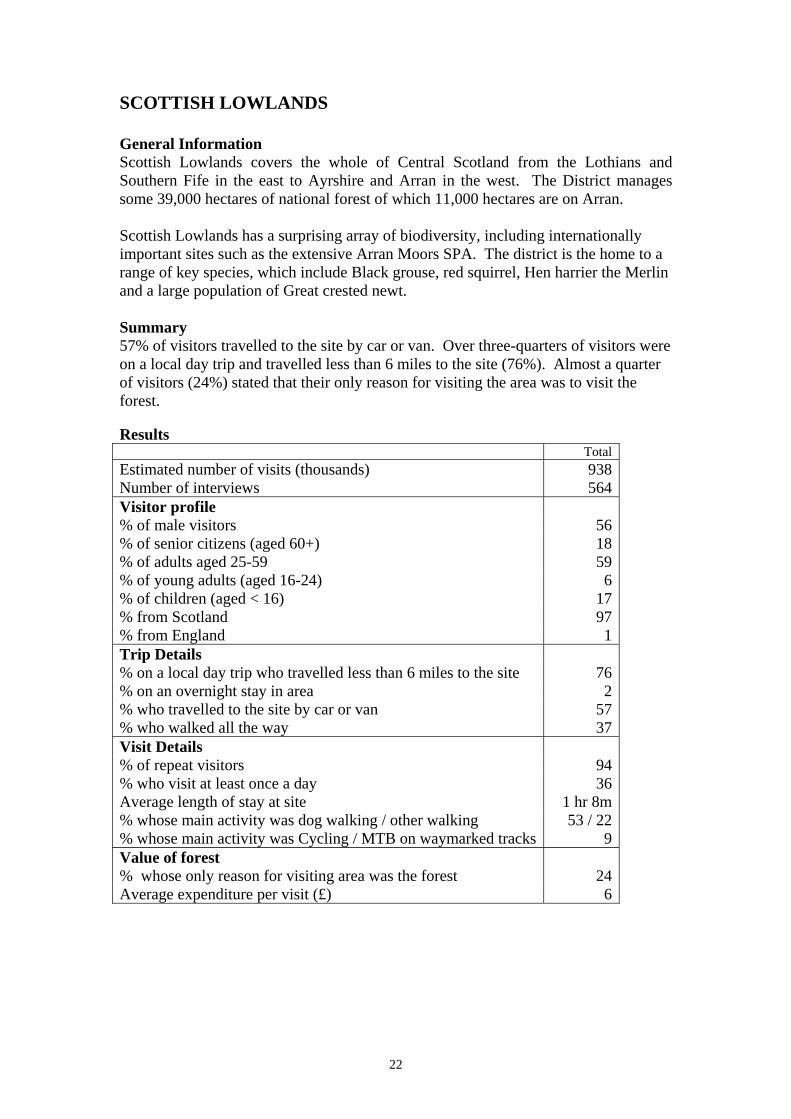
General InformationScottish Lowlands covers the whole of Central Scotland from the Lothians andSouthern Fife in the east to Ayrshire and Arran in the west. The District managessome 39,000 hectares of national forest of which 11,000 hectares are on Arran.
Scottish Lowlands has a surprising array of biodiversity, including internationallyimportant sites such as the extensive Arran Moors SPA. The district is the home to arange of key species, which include Black grouse, red squirrel, Hen harrier the Merlinand a large population of Great crested newt.
Summary57% of visitors travelled to the site by car or van. Over three-quarters of visitors wereon a local day trip and travelled less than 6 miles to the site (76%). Almost a quarterof visitors (24%) stated that their only reason for visiting the area was to visit theforest.
ResultsTotal
Estimated number of visits (thousands) 938Number of interviews 564Visitor profile% of male visitors 56% of senior citizens (aged 60+) 18% of adults aged 25-59 59% of young adults (aged 16-24) 6% of children (aged < 16) 17% from Scotland 97% from England 1Trip Details% on a local day trip who travelled less than 6 miles to the site 76% on an overnight stay in area 2% who travelled to the site by car or van 57% who walked all the way 37Visit Details% of repeat visitors 94% who visit at least once a day 36Average length of stay at site 1 hr 8m% whose main activity was dog walking / other walking 53 / 22% whose main activity was Cycling / MTB on waymarked tracks 9Value of forest% whose only reason for visiting area was the forest 24Average expenditure per visit (£) 6

23
MORAY FOREST DISTRICT
General InformationMoray Forest District manages 23,000 hectares of land and extends from the MorayFirth in the North to the Cairngorms National Park in the South.
The district is home to high proportions of the GB populations of red squirrel andCapercaille, with the woodlands being managed appropriately to benefit theseendangered species. All the forests in Moray are well used by local residents andvisitors but the coastal forests in particular play a significant role in recreation terms.Moray is well-wooded country and as such the timber industry is a significantemployer, both directly and in downstream elements.
SummaryMoray Forest District has a high proportion of regular, repeat visitors (94%) with 28%visiting every day. The vast majority of visitors to the forest used car/van as theirchosen mode of transport (87%).
ResultsTotal
Estimated number of visits (thousands) 360Number of interviews 156Visitor profile% of male visitors 46% of senior citizens (aged 60+) 16% of adults aged 25-59 63% of young adults (aged 16-24) 3% of children (aged < 16) 18% from Scotland 94% from England 3Trip Details% on a local day trip who travelled less than 6 miles to the site 72% on an overnight stay in area 6% who travelled to the site by car or van 87% who walked all the way 8Visit Details% of repeat visitors 94% who visit at least once a day 28Average length of stay at site 1hr 3m% whose main activity was dog walking / other walking 70 / 21% whose main activity was Cycling / MTB on waymarked tracks 3Value of forest% whose only reason for visiting area was the forest 12Average expenditure per visit (£) 25

24
LORNE FOREST DISTRICT
General InformationLorne Forest District lies in a scenic coastal area of Argyll. The forests arecharacterised by fine views in a spectacular mountain setting. The forests are wellknown for both their productive conifers and significant areas of native woodland.Landholding of the Forest District is 48,000 hectares of which 25,000 hectares areproductive conifer woodland. There are 29 varied and interesting recreation facilitieswithin the district, which include 75 km of walking trails and 178 km of cycle routes.
SummaryOver three-quarters of visitors travelled less than 6 miles to the site (78%) and justover three-fifths came by car / van (62%). Of the 5 sites surveyed Lorne had thehighest proportion of walkers without dogs 39% and also the highest proportion offirst time visitors 33%.
ResultsTotal
Estimated number of visits (thousands) 297Number of interviews 94Visitor profile% of male visitors 42% of senior citizens (aged 60+) 26% of adults aged 25-59 59% of young adults (aged 16-24) 3% of children (aged < 16) 12% from Scotland 66% from England 28Trip Details% on a local day trip who travelled less than 6 miles to the site 44% on an overnight stay in area 46% who travelled to the site by car / van 62% who walked all the way 37Visit Details% of repeat visitors 67% who visit at least once a day 20Average length of stay at site 1 hr 26m% whose main activity was dog walking / other walking 53 / 39% whose main activity was Cycling / MTB on waymarked tracks 1Value of forest% whose only reason for visiting area was the forest 6Average expenditure per visit (£) 34

25
DORNOCH FOREST DISTRICT
General InformationDornoch Forest District covers approximately 61,000 hectares of which 40,000 arecurrently under wooded cover. The district is the northern-most in Scotland andcovers the countries of Sutherland, Caithness and a large part of Easter Ross.
The Forest District aim is to practice sustainable multi-purpose forest managementand through which to deliver a wide range of public benefits.
SummaryJust under three-fifths of visitors were on a local day trip (56%) and out of the fivedistricts surveyed Dornoch had the largest proportion of parties containing children28%. The majority of visitors over four-fifths (82%) travelled by car/van.
ResultsTotal
Estimated number of visits (thousands) 119Number of interviews 98Visitor profile% of male visitors 51% of senior citizens (aged 60+) 20% of adults aged 25-59 50% of young adults (aged 16-24) 5% of children (aged < 16) 25% from Scotland 94% from England 2Trip Details% on a local day trip who travelled less than 6 miles to the site 56% on an overnight stay in area 14% who travelled to the site by car / van 82% who walked all the way 13Visit Details% of repeated visitors 87% who visit at least once a day 17Average length of stay at site 59 m% whose main activity was dog walking / other walking 58 / 22% whose main activity was Cycling / MTB on waymarked tracks 4Value of forest% whose only reason for visiting area was the forest 18Average expenditure per visit (£) 19

26
TAY FOREST DISTRICT
General InformationTay Forest District covers an area of some 38,000 hectares in Perth and KinrossAngus, Dundee and north-east Fife, from Rannoch Moor in the West to the North Seaand from Blair Atholl in the North to Kinross in the South. The majority of the forestdistrict is afforested with forest size ranging from less than 100 hectares to some5,000 hectares. There is major recreational usage, focussed on areas like Tay ForestPark, Kinnoull Hill Woodland Park, Tentsmuir and Glen Doll.
In total a population of some 2-3 million people live within 1 hours drive of theDistrict’s forests.
SummaryOver half of visitors (55%) were dog walkers and the average amount of time spend inthe forest was 1 hour 35 minutes the longest duration of visits out of the five districts.Over four-fifths of visitors used car/van as their preference of transport (86%).
ResultsTotal
Estimated number of visits (thousands) 717Number of interviews 218Visitor profile% of male visitors 50% of senior citizens (aged 60+) 26% of adults aged 25-59 55% of young adults (aged 16-24) 4% of children (aged < 16) 15% from Scotland 83% from England 14Trip Details% on a local day trip who travelled less than 6 miles to the site 39% on an overnight stay in area 30% who travelled to the site by car or van 86% who walked all the way 9Visit Details% of repeated visitors 79% who visit at least once a day 16Average length of stay at site 1 hr 35 m% whose main activity was dog walking / other walking 55 / 33% whose main activity was Cycling / MTB on waymarked tracks 3Value of forest% whose only reason for visiting area was the forest 16Average expenditure per visit (£) 23

27
SUMMARY OF RESULTS BY FOREST DISTRICT
Scottish Lowlands Moray Lorne Dornoch TayEstimated totalvisits
938,000 360,000 297,000 119,000 717,000
Sex Over half of visitorsare male (56%).
Fairly evenmale/female split.
Over half of visitorsare female (58%).
Even male/femalesplit.
Fairly evenmale/female split.
Age Highest proportionof those aged 16 to
34 years (21%)
Half aged 35 to 59(50%)
Half aged 35 to 59(50%) and a quarter60 or over (26%).Lowest proportion
with children(10%).
Largest proportionof parties containing
children (28%).
Over half aged 45or over (53%).
Type of trip Three quarters on alocal day trip
(76%). Very few onovernight trips
(2%).
Just under three-quarters on a local
day trip (72%).
Highest proportionon overnight trips
(46%). Nexthighest proportionon local day trip
(44%).
Just under three-fifths on local day
trip (56%).
Fairly even splitbetween local daytrips (39%), non-local day-trippers
(31%) and those onovernight trips
(30%).Travel to forest Just over three
quarters travellingless than 6 miles
(77%).
Just over threequarters travellingless than 6 miles
(77%).
Just over threequarters travellingless than 6 miles
(78%).
Most travelling lessthan 6 miles (62%)but 11% travelling
over 25 miles.
Over half travellingless than 6 miles(57%) but 14%
travelling over 25miles.
Transport used Just under threefifths travel by
car/van (57%) whileover a third walk
(37%).
The vast majoritytravel by car/van
(87%).
Just over three fifthstravel by car/van
(62%). Just over athird walk (37%).
The vast majoritytravel by car/van
(82%).
The vast majoritytravel by car/van
(86%).
Frequency of visits High proportion ofrepeat visitors
(94%). 36% visit atleast once a day.
High proportion ofrepeat visitors
(94%). 28% visit atleast once a day.
High proportion offirst time visitors
(33%).
Mix of first timevisitors (13%) andfrequent visitors
(17% daily).
Highest proportionof first time and
infrequent visitors.Lowest averagevisits per year.
Duration of visits Average 1 hr 8 mins Average 1 hr 3 mins Average 1 hr 26mins
Shortest duration ofvisit – 59mins
Longest duration ofvisit – 1 hr 35mins
Activitiesundertaken
Majority walkingwith or without a
dog (53% and 22%respectively).
Highest proportionof mountain bikers
(9%).
Majority walkingwith a dog (70%).
Highest proportionof walkers without a
dog (39%).
Majority walkingwith or without a
dog (58% and 22%respectively). Small
proportioncycling/mountain
biking (4%).
Majority walkingwith or without a
dog (55% and 33%respectively).
Expenditure per day £6 £25 £34 £19 £23

28
3.3 SCOTTISH RECREATIONAL SURVEY 2005
Questions were inserted into the Scottish Opinion Survey – a monthly Computeraided Personal Interview (CAPI) omnibus during the period January 2005 –December 2005.
SummaryA total of 12,219 questionnaires1 were completed from which it was estimated thatthere were 291 million visitors to Scottish forests during 2005. The estimated valueof recreational visits in 2005 is worth £4.8 billion. Most of the results shown belowrelate to all outdoor recreation visits, although we are able to extract information onwoodland visits.
ResultsTotal
Number of completed questionnaires 12,2192
% who visited outdoors for leisure and recreational activities in the last 12 months 75Trip Details% whose main destination was FC / FE managed woodland 7% whose main destination was woodland managed by others or unknown manager 6% whose visit included a visit to an FC / FE managed woodland 10% whose visit included a visit to a woodland managed by others or unknown manager 11% who travelled 5 miles or less to reach site 45% whose main means of transport used on last visit was car / on foot 56 / 35Visit Details% who were on their first visit / visit at least once or twice a month 10 / 53% who made visits to the outdoors up to 3 hours 59Activities% whose main activity was walking less than 2 miles / 2 - 8 miles during last visit 22 / 29% who were on a family outing during their last visit 20Scottish Outdoor Access Code% who had not heard about Scottish outside access code 56% who had not encountered any access problems on their last visit 82Economic Benefits% who spent something on their visit 49Average £ expenditure on visits including those who spent nothing 16
Timing of survey: January – December 2005Type of survey: In-home interviews conducted using CAPI hardwarePublication: TNS (2006). Scottish Recreation Survey: annual summary
report 2005. Scottish Natural Heritage Commissioned ReportNo. 183 (ROAME No. F02AA614/4).
Topics Covered: number, frequency and location of visits to the outdoors,activities, transport and distances travelled to visit, partycomposition, expenditure on visit, awareness andunderstanding of the SOAC and access to the countryside
1 In September 2005 changes were made to the first few questions in this survey. More details on the change andthe effect it may have had on the results are available in the report and in a forthcoming calibration report
2 More details of sample sizes are provided in the main survey report. Some questions were asked only to thoserespondents who had made a visit during the previous four weeks, and some questions were not asked each month.

29
3.4 FOREST HOLIDAYSCAMPSITES
This survey took place at 20 Forest Holidays campsites. The summary data belowcollates the results from all 20 campsites.
Summary11% of respondents spent 7 or more nights at the campsite and 33% had stayed in acaravan or motor home while 39 camped in a tent.
ResultsTotal
Number of completed questionnaires 3,889Visits% of repeat visitors to same campsite 61% who brought dogs with them (Roundhill only) 35% who heard about Forest Holidays through a recommendation 25% who heard about Forest Holidays through Forest Holidaywebsite
24
% who visited other Forest Holidays sites in last 2 years 40Campsite% staying in caravan / motor home 36 / 21% staying in tent 43% spending 7 or more nights at campsite 12% season ticket holders 2Campsite Ratings1
% satisfied with information at reception 98% satisfied with welcome from site staff 97% satisfied with availability of site staff during stay 98% satisfied with helpfulness of site staff 97% satisfied with cleanliness of site facilities 94
Timing of survey: April - October 2006Type of survey: Self-completion questionnaire
1 Satisfaction rating expressed as a proportion of those who rated the facility. Visitors are classed as satisfied ifthey rate a facility as Excellent, Good or OK.

30
CABINS
This survey took place at the three Forest Holidays cabin locations: Deerpark, Keldyand Strathyre. The summary data below collates the results from the three locations.
Summary100% of respondents were satisfied with the information they received from receptionand 99% of respondents were satisfied with the welcome received from the sitemanager. 99% were satisfied with the spaciousness of the cabin.
ResultsTotal
Number of completed questionnaires 538Visit Details% of repeat visitors to the same site 43% who would consider staying again 94Booking3
% satisfied with information provided at time of booking 93% satisfied with booking service 91Cabin Ratings3
% satisfied with double bedroom 97% satisfied with kitchen 97% satisfied with lounge 99% satisfied with shower room / toilet 91% satisfied with interior decor 98% satisfied with playloft / twin bedroom 97% satisfied with balcony 98% satisfied with spaciousness of cabin 99Other Ratings1
% satisfied with information available at reception 100% satisfied with information provided in their cabin 98% satisfied with cleanliness of cabin 97% satisfied with welcome from site manager 99% satisfied with contact with site manager 98 Activities% who had been walking 94% who had visited a historical/cultural attraction 23% who had been birdwatching 15% who had been cycling 35% who had visited FC visitor centre 13
Timing of survey: Summer 2006Type of survey: Self-completion questionnaire
1 Satisfaction rating expressed as a proportion of those who rated the facility. Visitors are classed as satisfied ifthey rate a facility as Excellent, Good or OK.