forest ecosystem processes at the watershed scale ...€¦ · forest ecosystem processes at the...
TRANSCRIPT

Forest ecosystem processes at the watershed scale: incorporating hill
slope hydrology
Lawrence E. Band, Pitma Patterson, Ramakrishna Nemani and Steven W. Running
Agricultural and Forest Meteorology 63: 93-126
Uttam Babu ShresthaMarch 30, 2010

Introduction
•RHESSys (Regional hydro ecological Simulation System•FOREST-BGC (Forest ecosystem Process Model)•TOPMODEL (Hydrological Model)
Model implementation on field siteSimulation resultsDiscussion and Conclusion
Outline

Broad Objective:To investigate the distributed feedbacks between ecological and hydrological fluxes and storage processes at the watershed.
Specific Objectives:•To calculate forest evapotranspiration (ET), canopy net photosynthesis (PSN).•To compute carbon and water budgets.•To observe the impact of lateral water redistribution processes (subsurface water flow) and the resulting patterns of available soil water on ET and PSN.•To compare the results of TOPMODEL and Bucket Model.
IntroductionThe spatial patterns of forest ecological and hydrological fluxes and storages in hilly terrain are largely dependent on topography

Automate the parameterization and simulate ecological and hydrological fluxes in watershed by combining information
drawn from digital terrain data, remote sensing, and digitized soil maps
Introduction
Forest Ecosystem Processes Model (FOREST-BGC)
Regional Hydro Ecological Simulation System (RHESSys)
Hydrological Model TOPMODEL
RS/GIS FRAMEWORK

•GIS-based, hydro-ecological modeling framework designed to simulate carbon, water, and nutrient fluxes at landscape level.
•Functional or statistical approach to model spatio-temporal interaction between climate and vegetation.
•Allows the use of remote sensing and GIS for spatially distributed parameterization.
•Combines both a set of physically based process models and a methodology for partitioning and parameterizing the landscape.
•It has Structural, Parameterization, Simulation, Visualizationcomponents.
What is RHESSys ?

http://fiesta.bren.ucsb.edu/~rhessys/about/about.html
RHESSys Framework

Climate
Vegetation
Topography
Soils
NWSGOES
TMMSSAVHRR
USGSDEMDMA
SCS
RadiationTemperatureHumidityRainfall
Biome TypeLeaf Area Index
ElevationAspectSlope
TextureDepthWater holding capacity
Drainage Area
Stream Network
Land Unit Extraction
Topgraphic-Soils Index
Registration
MT CLIM
FOREST-BGC
TOPMODEL
ET
PSN
DISCHARGE
Parameter Source Derived Inputs GIS Processing Parameter file
Cartridge
Distribution
Models Outputs
RHESSys Implementation Flow Diagram
What is RHESSys ?

Forest Ecosystem Processes Model (FOREST-BGC)•Stand level simulation model of carbon, water and nitrogen budgets.
•Calculate forest ET and PSN.

Hydrological Model (TOPMODEL)•Physically based, distributed watershed hydrological model.
•Simulate explicit groundwater/surface water interactions by predicting the movement of the water table.
•Use surface topography and soil information to simulate hydrologic fluxes of water (infiltration-excess overland flow, saturation overland flow, infiltration, exfiltration, subsurface flow, evapotranspiration, and channel routing) through a watershed.
•Locations with large upslope contribution areas and lower slope maintain higher TMI (soil moisture or soil water) than location with smaller contribution areas and steeper slope. Soil water affect transpiration and productivity.

TOPMODEL vs. BUCKET ModelBucket Model is used for soil water budget
Where,ΔSw = change in soil waterD = deep percolationM = snow meltP = precipitationIc = canopy interceptionIl = litter interceptionET = Evapotranspitation
Sw (Soil Water) > available soil water capacity (AWC, mm), runoffSw < = AWC, no runoff
Net Input to Soil Water Storage =
•Hydrology is restricted to vertical exchange•Doesn’t account soil water drainage•Appropriate for landscape without gradient
Where,S = measured as a depth below saturationS’=hillslope mean soil water deficitλ = mean value of TMIm = soil specific parameterTc = transitivity index of catchment
•Appropriate for landscape with gradient•Account for soil water drainage and soil transitivity (redistribution of soil water)
Topmodel is used to calculate local soil water deficit
Where,a = upslope contributing areaβ = slope or local gradientTi = local soil transitivityTc = transitivity index of catchment

Advantages of including TOPMODEL in RHESSys
•Provides lateral subsurface drainage of soil water.
•Provides realistic outflow hydrographs (high degree of physical realism) in watershed than bucket model (depletion of soil water is not incorporated).
•Allow the representation of important topographic controls on canopy processes and forest growth through the zonation of soil moisture deficits.
•Help to maintain the observed assemblages of terrain, soil, and vegetation.
•Area with larger a and lower tanβ has higher value of Sw that has impact on transpiration and productivity.
•This approach is very complementary to the conceptual level of FOREST-BGC model.

Precipitation: 850-2000mm, abundant snow prevents soils from freezing during winter.
Soil: Gravelly silty loam to extra gravelly silty loam or extra gravelly coarse sandy loam
Extreme event: 1988 Extreme drought (No data on snow cover)
Vegetation: Douglas fir (Pseudotsuga menzeisii), red cedar (Thuja plicata), larch (Larixoccidentalis), lodgepole pine (Pinus eontorta), subalpine fir (Abies lasiocarpa)and engelmann spruce (Picea englemannii). Crown Cover: 30- >70%
Hydrology: dependent on accumulated distributed of snowpack.
Field Site
Soup Creek Watershed on West
slope of Swan Mountain Range,
Montana, USA

Meteorological data: (Temperature (Max and Min), Precipitation (Daily), and snow
DEM: (30m interpolated from the digitized contours of the Thunderbolt Mountain 7.5 min USGS topographic quadrangle)
= delineate watershed = compute topographic soil moisture index (TMI)
Digitized soil maps = topographic soils index
Leaf Area Index (LAI): estimated by using an empirical correlation of Thematic Mapper Bands 3, 4 and 5 (630-690nm, 760-900nm, 1550-1750nm resp.) with field estimated LAI
Rooting zone ~ soil depth (max 2m)= calculate soil water storage in root zone for prediction of soil water potential Ψsoil & leaf water potential Ψleaf
Data Parameterization and Simulation

Evaporation Transpiration (ET)Bucket Model•The 15 cm bucket shows more severe moisture limitations than the 22 cm bucket.
•No spatial variation of soil moisture within hillslopes.
•The moisture limited ET continues through September, when rainfall adequately recharges the soil.
Topmodel•Redistributing soil water effect on topography can be seen in the variance of watershed ET.
•The lower interval values drain very rapidly (expand moisture stress and increase S’) while the higher values remain saturated.
All 4 versions of the simulations show nearly identical patterns and depths of watershed mean ET up to here
Simulation results

•The higher index value zones maintain a high level of ET through the drought and contribute an annual ET ~ 3 times ET of the lower index values.
•The spread of ET is determined by soil water recharge and site LAI (above 6.5 soil water isn’t limiting factor).
•Soil water redistribution prevents the impact of drought without the significant expansion of the saturation runoff pathway that will drain the hillslope soil water.
•In dry month, ET with lower m by TOPMODEL is 2X > than higher m and the 22cm bucket and ~6X than the 15cm bucket.
Cumulative ET for different topography-soils indices simulated for a lower elevation, south facing slope of Soup Creek

Sensitivity of annual ET and watershed runoff to the parameter m
•Distribution of soil moisture increases with m, the increase in run off production is balanced by decrease in average ET.
•Partition of precipitation in ET and run off production is very sensitive to the representation of soil properties and drainage pathways.
•ET is limited by temperature and radiation (north and south facing slope) at higher elevations all the time (June & September).
•Lower elevation have uniform ET in June but variations is high in September.

Impact of drought on ecosystem (Bucket vs. TOPMODEL)
Bucket Model,When bucket soil is depleted, soil water potential Ψsoil & leaf water potential Ψleaf drop vary rapidly increasing stomatal resistance.
TOPMODEL, Drop is restricted by lower value index intervals that close stomata restricting ET while higher index intervals are not stressed and still freely transpiring as higher value index interval remains saturated.

Simulated discharge differences (Bucket vs. TOPMODEL)
Compare the hydrographs producing each methodology.
Bucket Model,Soil water is greater than AWC, large outflows, the discharge series spiked in that day.
Soil water is lower than AWC, no outflows in that day, discharge discharge series dropped down. Unrealistic !
TOPMODELObserved discharge pattern is close to TOPMODEL
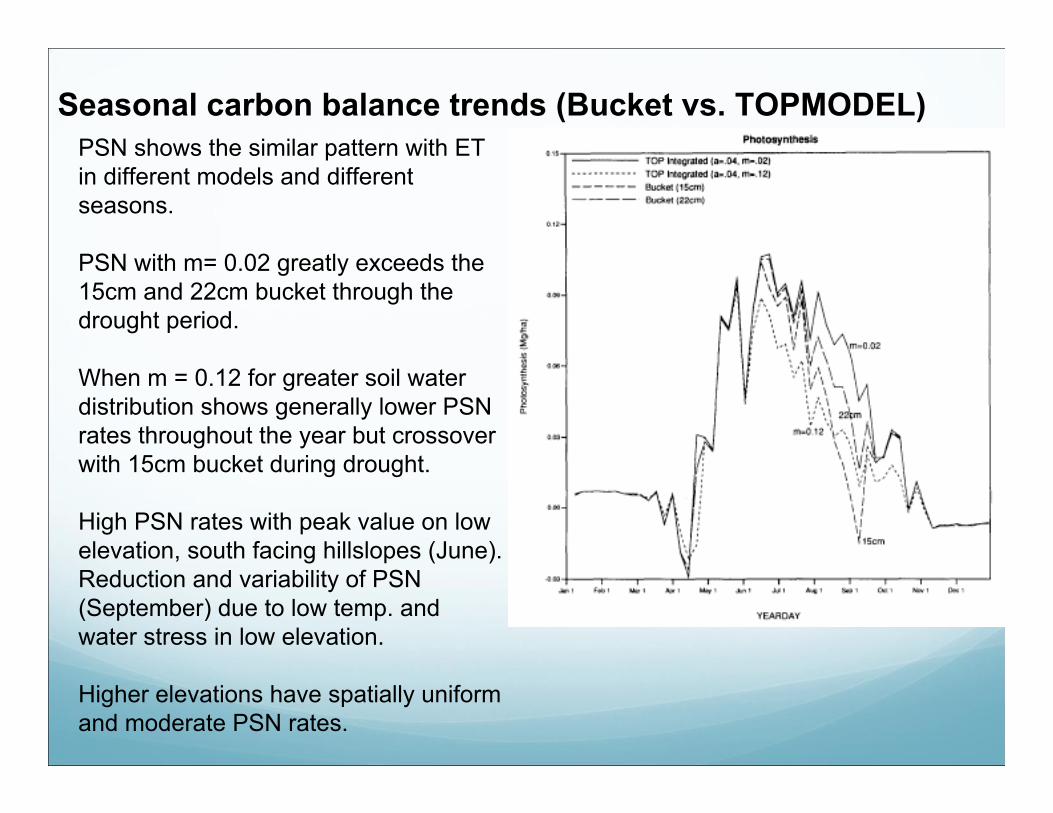
Seasonal carbon balance trends (Bucket vs. TOPMODEL)PSN shows the similar pattern with ET in different models and different seasons.
PSN with m= 0.02 greatly exceeds the 15cm and 22cm bucket through the drought period.
When m = 0.12 for greater soil water distribution shows generally lower PSN rates throughout the year but crossover with 15cm bucket during drought.
High PSN rates with peak value on low elevation, south facing hillslopes (June). Reduction and variability of PSN (September) due to low temp. and water stress in low elevation.
Higher elevations have spatially uniform and moderate PSN rates.

Discussion and Conclusion
Integration of the distributed soil water strategy (TOPMODEL) with FOREST-BGC yield better results in comparison with limited field data and Bucket model.
Degree of simulated water distribution cause significant differences in ET & PSN.This is due to a combination of the variable soil moisture patterns that develop within the hillslopes with TOP model along with the throughflow and runoff pathways.
TET and PSN in watershed is highly sensitive to soil moisture and canopy properties.
Combination of soil water recharge and high LAI can buffer the drought impact on areal ET and PSN rates.
Hydrograph produced by the bucket model is not useful for validation against gauged flow. TOPMODEL might not be suitable in flatter terrain.