foreign exchange risk management - bibsys · norges handelshØyskole foreign exchange risk...
TRANSCRIPT
Foreign exchange risk management
How are the largest non-financial companies in Norway managing
their foreign exchange rate exposure?
By: Krister Eriksen and Ola Wedøe
MSc Thesis, Major in Financial Economics
Supervisor: Associate Professor Carsten Bienz
This thesis was written as a part of the Master of Science in Economics and Business Administration program - Major in Financial Economics. Neither the institution, nor the advisor is responsible for the theories and methods used, or the results and conclusions drawn, through the approval of this thesis.
NORGES HANDELSHØYSKOLE
Bergen, June 2010

2
Abstract
The purpose of this thesis is to investigate how the largest non-financial companies in Norway
manage their foreign exchange rate exposure. This is investigated through the use of a survey
distributed to a sample the largest non-financial firms in Norway.
According to our results, the largest non-financial companies in Norway have a predefined strategy
for managing foreign exchange risk, which is defined by the board of directors or by the management
in the organisation. The companies’ main motivation for managing foreign exchange risk is to reduce
fluctuations in income, costs or cash flow, and short term derivatives are more commonly used than
derivatives with a long horizon. They also have a high degree of natural hedging, which is influenced
by the number of foreign subsidiaries and the number of countries they are spread across. Those
who only use operational hedging techniques have subsidiaries in more countries than those only
using financial derivatives and those using both. The companies in the shipping industry use more
types of derivatives than the other industries, while companies in the oil and gas industry use less.

3
Preface
This master thesis marks the closure of our two year masters degree in Financial Economics at
Norwegian School of Economics and Business Administration (NHH). The topic of the thesis is based
on our field of specialisation and interests, and we have chosen to study how the largest non-
financial companies in Norway are managing their foreign exchange exposure.
Working with this thesis has been both educational and interesting, providing us with insight and
knowledge that will surely be useful later on in our professional careers.
We would like to express our gratitude to Associate Professor (Dr. rer. pol.) Carsten Bienz for
valuable guidance and useful comments throughout the process. We would also like to thank the
respondents that despite their huge workload took the time to participate in our survey.
Bergen, June 2010
Krister Eriksen Ola Wedøe

4
Table of contents
1 Introduction 7
1.1 Topic of the thesis 7
1.2 The relevance of the thesis 7
1.3 Development in currency markets 8
1.4 Empirical literature review 11
1.5 Main problem formulation 18
2 Theoretical background 21
2.1 Foreign exchange exposure 21
2.2 Should foreign exchange rate exposure be hedged? 23
2.3 Optimal currency hedging 26
2.4 Financial and Operational hedging approaches 30
3 Data and methodology 34
3.1 Research methodology – theoretical framework 34
3.2 Methodology implementation 35
3.3 Survey response 39
3.4 Method of analysing 39
3.5 Descriptive statistics 44
4 Analysis 58
4.1 Hypotheses testing 58
5 Conclusion 77
5.1 Other interesting results from the survey 79
5.2 Limitations 80
5.3 Further research 82
References 83
Appendices 87

5
Appendix list
Appendix A: E-mail distributed to the respondents 87
Appendix B: The survey 89
Appendix C: The complete sample 99
Appendix D: Regression diagnostic tests 105
Figure list
Figure 1.1: Historical development of USD/NOK and EUR/NOK. 9
Figure 1.2: Development in EUR/NOK compared to a one-year projection made in the end of June 2008. 10
Figure 1.3: Development in EUR/NOK and a one-year projection made in the end of June 2009. 11
Figure 2.1: Conceptual comparison of transaction, economic, and translation exposure. 22
Figure 2.2: Impact of hedging on the expected Cash Flows of the firm. 24
Figure 3.1: Using “acprplot” in STATA to graph an augmented partial residual plot. 42
Figure 3.2: Searching for heterskedasticity and normalised regression residuals. 44
Figure 4.1: The companies’ main motivation for managing foreign exchange risk. 58
Figure 4.2: The level defining the strategy for managing foreign exchange rate exposure. 59
Figure 4.3: Typical maturity of currency derivatives. 61
Figure 4.4: The respondents’ share of income and costs in foreign currencies. 64
Figure 4.5: The distribution of the respondents’ share of income and costs in foreign currencies. 65
Figure 4.6: Comparing derivative usage in energy, commodities and shipping with other industries. 74

6
Table list
Table 3.1: Sample selection process. 36
Table 3.2: Survey response comparison. 39
Table 3.3: Descriptive statistics for the 2008 revenue of the companies (‘000 NOK). 45
Table 3.4: Company type and industry affiliation 45
Table 3.5: Foreign currency exposure and currency most exposed to. 46
Table 3.6: Number of foreign subsidiaries, including and excluding sales division, and countries. 47
Table 3.7: Share of income and costs in foreign currencies. 48
Table 3.8: Share of assets and debt in foreign currencies. 49
Table 3.9: Methods used to measure foreign exchange rate exposure. 50
Table 3.10: What level the strategy for managing foreign exchange exposure is defined. 50
Table 3.11: The financial crisis’ influence on the foreign exchange risk management. 51
Table 3.12: Hedging techniques used for managing foreign exchange rate exposure. 51
Table 3.13: The average maturity on the respondents’ derivatives. 52
Table 3.14: Main reason why the respondents do not use long term derivatives more frequently. 53
Table 3.15: The most important hedging approach. 53
Table 3.16: The main motivation for managing foreign exchange rate exposure. 54
Table 3.17: The main motivation for using operational techniques to manage foreign exchange rate exposure. 54
Table 3.18: The main motivation for using financial techniques to manage foreign exchange rate exposure. 55
Table 3.19: The main reason why the respondents do not manage their foreign exchange rate exposure. 56
Table 3.20: The main reason why the respondents do not use operational techniques to manage their foreign
exchange rate exposure. 56
Table 3.21: The main reason why the respondents do not use financial instruments to manage their foreign
exchange rate exposure. 57
Table 4.1: Hedging approaches vs. derivative maturity. Cross-tabulation. 62
Table 4.2: Degree of natural hedging, comparing income and costs. 63
Table 4.3: Degree of natural hedging, comparing assets and debt. 64
Table 4.4: The total number of foreign subsidiaries as dependent variable. Regression. 67
Table 4.5: The number of pure foreign sales divisions as dependent variable. Regression. 68
Table 4.6: The total number of countries the foreign subsidiaries is spread across as dependent variable.
Regression. 70
Table 4.7: The companies’ revenues in thousands as dependent variable. Regression. 72
Table 4.8: Hedging approaches vs. industry. Cross-tabulation. 74
Table 4.9: The number of types of derivatives used as dependent variable. Regression. 75

7
1 Introduction
This chapter will briefly present the topic, the relevance of the thesis and the development in the
currency markets. Lastly, former research is presented, and as a result of this the main problem
formulation and hypotheses are introduced.
1.1 Topic of the thesis The purpose of this thesis is to examine how the largest non-financial companies in Norway are
managing their foreign exchange rate exposure. This is done through the use of a survey sent out to a
sample consisting of the largest non-financial companies in Norway. The data is analysed empirically
in order to test a series of hypotheses, which will form the basis for answering the main problem
formulation. The thesis focuses on both operational (e.g. pricing, debt-financing or producing
abroad) and financial hedging (e.g. forward contracts or options).
1.2 The relevance of the thesis Previous studies on exchange risk have mostly been concentrated on financial hedging techniques,
valuing derivatives and mathematically optimising currency hedging. Less research has been devoted
to how the firms actually are managing their foreign exchange rate exposure. Because of this, the
topic is interesting to research more thoroughly.
There have previously been completed international surveys on this subject, focusing on other
countries and regions.1 In a Norwegian context, this is a field with very limited research, with the
exception of Børsum & Ødegaard (2005) who mainly focused on derivative usage. This thesis
explores the use of both financial derivatives and operational hedging among Norwegian firms, which
has never been done before. No research has been based on Norwegian data from the last five years,
and the topic is for that reason very interesting to study further. In addition, this thesis focuses on
the largest firms in Norway which is also something that has never been done before. This makes it
particularly interesting to focus on this group of companies.
Within corporate valuation theory, foreign exchange rate issues are often marginalised or neglected,
even though it can be a significant determinant for the valuation of a company.2 The subject is for
that reason also very interesting from a corporate valuation perspective, to see if currency
1 See e.g. Marshall (1999), Loderer & Pichler (2000), Pramborg (2004) and Hansen (2009).
2 See Damodaran (2002) or Koller, Goedhart & Wessels (2005) for more information about corporate valuation.

8
fluctuations are a considerable source of concern among the management in large non-financial
companies in Norway.
Norway has a small, open economy with a large raw material based export industry, spearheaded by
the oil- and fishing industries. Norway is also importing a lot of consumer goods like cars and
electronics, which makes the Norwegian economy and the firms operating in it very exposed to
foreign exchange risk. Currency risk is particularly important for Norwegian firms when considering
the fact that Norway is not a member of the European Union (EU), nor participating in the Euro-
monetary collaboration.
This thesis is first and foremost directed towards stakeholders in firms who are exposed to exchange
risk, and have to deal with this in their daily work life. It is also likely to be of academic interest to
investigate the foreign exchange risk and management among Norwegian firms more closely, and
whether they are taking this source of risk seriously and managing the risk properly. Currency
fluctuations is, as mentioned, often a neglected source of risk, therefore this thesis takes aim at
exploring this more closely by investigating how the largest non-financial companies in Norway are
managing their foreign exchange rate exposure.
The thesis is also of current interest due to increased volatility in the currency markets as a result of
the financial crisis (see the next subchapter), and the present economic turmoil among the PIGS-
countries. 3 Increased volatility translates to increased risk for the companies, making foreign
exchange risk management all the more important.
1.3 Development in currency markets The years before the financial crisis made its appearance and shook financial markets all over the
world, companies and investors tolerated high risk in their chase for high returns. Investments were
made in currencies with high interest rates and financed by loans in currencies with low interest
rates (Currency carry trade).4 The Euro (EUR) appreciated to all time high levels against US Dollars
(USD), Pound Sterling (GBP) and Norwegian Krone (NOK). As a consequence of the crisis, future
3 The term ”financial crisis” is referring to the global economic downturn that started in 2007.
http://www.worldbank.org/financialcrisis PIGS is an acronym referring to the economies of Portugal, Italy, Greece and Spain. 4 “A strategy in which an investor sells a certain currency with a relatively low interest rate and uses the funds
to purchase a different currency yielding a higher interest rate. A trader using this strategy attempts to capture the difference between the rates, which can often be substantial, depending on the amount of leverage used.” http://www.investopedia.com/terms/c/currencycarrytrade.asp
9
income and earnings got much more uncertain, forcing companies and investors to deal with more
extreme price movements than before. Their willingness to take on risks has decreased and made
them more focused on effective financial risk management. Along with awareness of the increased
risk, has also the importance of taking events with small probabilities into account become an even
more important issue on their agenda.
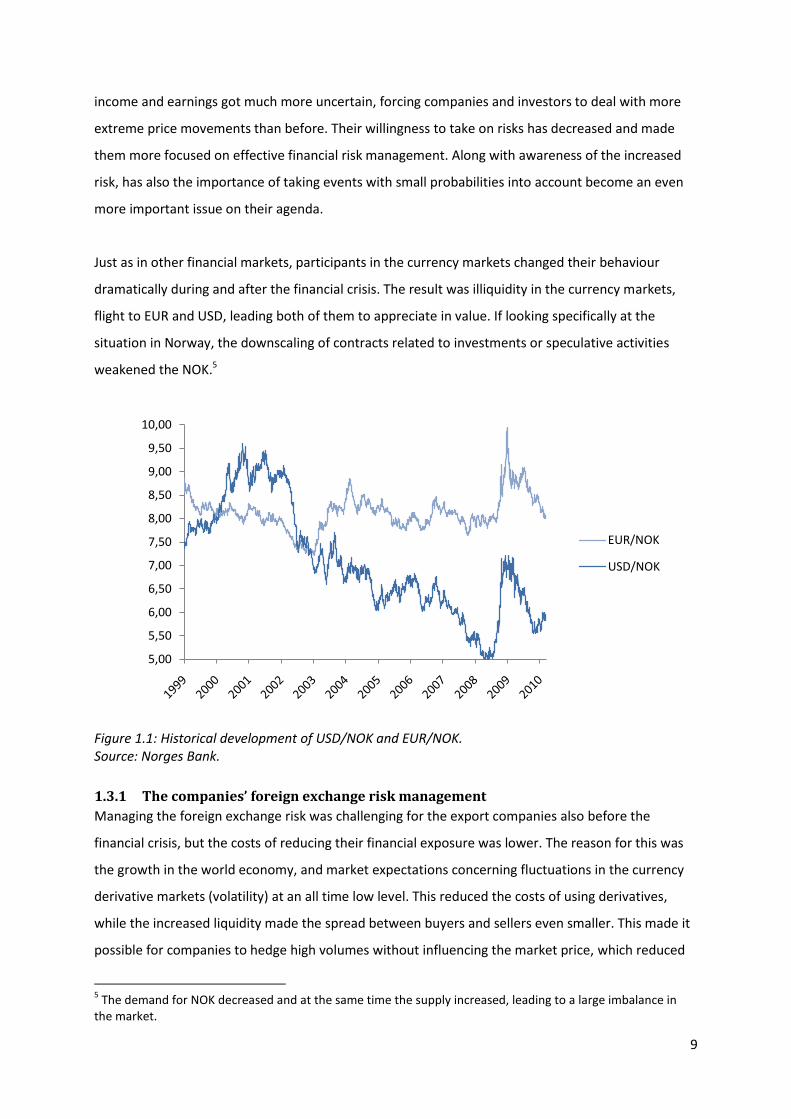
Just as in other financial markets, participants in the currency markets changed their behaviour
dramatically during and after the financial crisis. The result was illiquidity in the currency markets,
flight to EUR and USD, leading both of them to appreciate in value. If looking specifically at the
situation in Norway, the downscaling of contracts related to investments or speculative activities
weakened the NOK.5
Figure 1.1: Historical development of USD/NOK and EUR/NOK. Source: Norges Bank.
1.3.1 The companies’ foreign exchange risk management
Managing the foreign exchange risk was challenging for the export companies also before the
financial crisis, but the costs of reducing their financial exposure was lower. The reason for this was
the growth in the world economy, and market expectations concerning fluctuations in the currency
derivative markets (volatility) at an all time low level. This reduced the costs of using derivatives,
while the increased liquidity made the spread between buyers and sellers even smaller. This made it
possible for companies to hedge high volumes without influencing the market price, which reduced
5 The demand for NOK decreased and at the same time the supply increased, leading to a large imbalance in
the market.
5,00
5,50
6,00
6,50
7,00
7,50
8,00
8,50
9,00
9,50
10,00
EUR/NOK
USD/NOK

10
the costs of hedging and risk management even further. These costs increased significantly after the
financial crisis, and made hedging of future income more expensive.
As seen in figure 1.1, export companies with income in USD in Norway had a more challenging
environment than the ones with income in EUR. During a period of 18 months before the financial
crisis (from the 22nd of October 2006 to the 20th of April 2008), USD depreciated 27 per cent
compared to NOK (from NOK 6.78 to NOK 4.94). In the same period EUR to NOK was trading between
NOK 8.4970 and NOK 7.6250, corresponding to an appreciation of more than ten per cent. Because
of the relatively volatile USD/NOK compared to EUR/NOK, the main issues concerning exchange risk
management in Norway before the financial crisis was devoted to hedging USD, in case the USD/NOK
value would increase even further. This also led companies to move production out of the country,
lowering the costs and/or shifting the costs to USD. When the US Dollar value fell to a level not seen
since 1980, it was highly unexpected.
1.3.2 Comparing currency projections before and after the financial crisis
One of the methods for quantifying the currency risk is by looking at implied volatility. A relevant
measure for this volatility is found in traded currency options, where high volatility is unveiling great
uncertainty. As the volatility increases, so does the sample space which in probability theory typically
is illustrated with a confidence interval. The chart below show the development in EUR against NOK
compared to the projections one year ahead, made in the end of June 2008.
Figure 1.2: Development in EUR/NOK compared to a one-year projection made in the end of June 2008. Source: Saltvedt and Knutsen (2009).
11
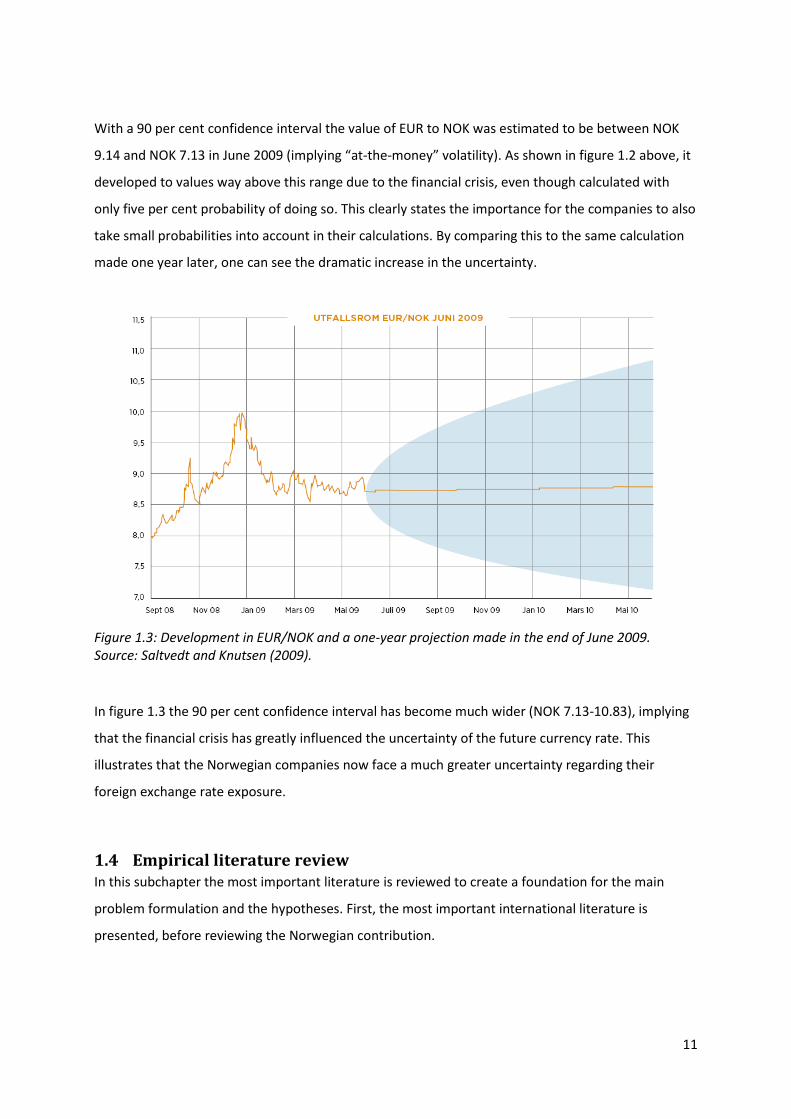
With a 90 per cent confidence interval the value of EUR to NOK was estimated to be between NOK
9.14 and NOK 7.13 in June 2009 (implying “at-the-money” volatility). As shown in figure 1.2 above, it
developed to values way above this range due to the financial crisis, even though calculated with
only five per cent probability of doing so. This clearly states the importance for the companies to also
take small probabilities into account in their calculations. By comparing this to the same calculation
made one year later, one can see the dramatic increase in the uncertainty.
Figure 1.3: Development in EUR/NOK and a one-year projection made in the end of June 2009. Source: Saltvedt and Knutsen (2009).
In figure 1.3 the 90 per cent confidence interval has become much wider (NOK 7.13-10.83), implying
that the financial crisis has greatly influenced the uncertainty of the future currency rate. This
illustrates that the Norwegian companies now face a much greater uncertainty regarding their
foreign exchange rate exposure.
1.4 Empirical literature review In this subchapter the most important literature is reviewed to create a foundation for the main
problem formulation and the hypotheses. First, the most important international literature is
presented, before reviewing the Norwegian contribution.

12
1.4.1 International literature
Early research in this area focused on determining if the companies’ value is influenced by foreign
exchange rate fluctuations. Being one of the first, Jorion (1990) examined the relationship between
stock returns and exchange rates, by performing an empirical analysis among US multinational
companies. He presented evidence showing that the relationship between stock returns (value) and
exchange rates differs systematically across multinational companies. The degree of foreign
exchange rate exposure on firm value was found to be positively related to the percentage of foreign
involvement. More specifically; the empirical evidence suggests that exchange rate fluctuations do
affect firm value. Research by Bodnar & Gentry (1993) and Choi & Prasad (1995) also supports this.
In a study conducted by Shin and Soenen (1998), they investigated whether US multinational
corporations are exposed to foreign exchange risk or not. They also investigated whether there is
difference in the foreign exchange rate exposure for large and small firms, and if industry
characteristics are a significant determinant. According to their results, there is empirical evidence
that the value of US multinational firms is significantly correlated with contemporaneous changes in
the value of the US dollar. The foreign exchange exposure was stable over the sample period from
1983 to 1994. Another interesting finding is the fact that especially small firms have a positive
significant foreign exchange rate exposure. This is supportive of the view that hedging is more
common in large firms, despite the good availability of hedging instruments. They also find that the
foreign exchange rate exposure is largely attributable to a few industries (e.g. electrical equipment
and primary metal).
Some research has also been executed to find out if the firms are aware of their currency risk. In a
study published in the Journal of Empirical Finance by Loderer and Pichler (2000), they explored the
currency risk management practices among Swiss industrial companies by distributing a survey. The
purpose of their study was to examine whether industrial firms quantify their risk profile and to what
extent they hedge against currency fluctuations. Their main conclusion is that the companies have
very little active evaluation of the foreign exchange rate exposure, and to a large extent is naturally
hedged.6 This is contradictive to what they expected; that the firms estimate the risk profile of firm
value (or at least of their operating cash flow) and hedge it with derivatives. According to their
conclusion, the firms do not think they need to know. This is puzzling, since knowing their risk profile
could help firms better to calibrate their risk management tools. Generally they find that the firms
fail to properly understand why currency risk reduces firm value and some even manage risk even
6 Natural hedging is having similar portions of income and costs, and assets and debt, in the same foreign
currency.

13
when it is unnecessary. One of their suggestions for further research is the firms overall approach to
risk management, namely, the reduction of economic exposure (long run) with operating hedging on
the one hand and the short-run hedging of transaction exposure with currency derivatives (financial
hedging) on the other. They propose a reason for this, and explain it with:
“Only the CEOs and the heads of the various divisions may have the integral view and the information
that CFOs and treasurers apparently lack. But the division heads may not have the tools or the
authority to manage currency risk other than with operating instruments. And the CEOs may not have
the incentives to manage currency risk more sensibly. Moreover, CEOs, like academics, may have only
a fuzzy notion of the benefits of currency risk management.”
In other words, the CFOs and treasurers may lack control over operational means, and the division
heads may lack control over financial means and derivatives. This may explain why they manage risk
even when it is not necessary. This implies that the currency risk management strategy should be set
and executed on top of the corporate hierarchy.
When researchers became more and more attentive of currency risk and how it affects the value of
companies, research has been more concentrated on dealing with this risk, focusing mainly on
derivatives. Allayannis and Ofek (1997) was one of the first to research whether firms use foreign
currency derivatives for hedging or for speculative purposes, using a sample of S&P 500 non-financial
firms. They found evidence that firms use currency derivatives for hedging and to reduce the foreign
exchange rate exposure that they face. This is supported by Carter et al. (2003).
Other studies have also concentrated on the use of financial hedging among firms. One of the
earliest and most quoted contributions in this field is the Wharton survey performed several years by
Bodnar et al. (1995, 1996 and 1998). They find that US non-financial firms most commonly use
foreign currency derivatives, followed by interest-rate, commodity and equity derivatives. They also
find that firms use derivatives mainly to reduce the volatility of the firm’s cash flow, and that
derivative usage is concentrated among the largest firms in the commodity and manufacturing
sector. This is also supported by Chowdhry & Howe (1999) who theoretically show that operational
hedging is less important for commodity based firms.
Based on a survey, Bodnar and Gebhardt (1999) present and compare the responses regarding
derivative usage among US and German non-financial firms. They investigated three classes of
derivative-hedging, namely foreign exchange risk, interest rate risk and commodity risk. Firms in both

14
countries use foreign currency derivatives most frequently followed closely by interest rate
derivatives, with commodity derivatives as a distant third. They also find that German firms are more
likely to use derivatives to manage risks from fluctuating financial prices than US firms. This is
explained by the fact that Germany is a smaller, more open economy, and as a result is more
exposed to financial price risk, especially foreign exchange rates. The general pattern of derivative
usage across industry and firm size is very comparable for the two countries. This suggests that the
determinants of derivative use are not so much driven by country-specific factors as economic
considerations like activities and firm characteristics. A result to note is that the percentage of firms
using derivatives increases with firm size. This is a common factor for firms in both countries. As for
the foreign exchange risk management and hedging horizon, firms that frequently hedge short-run
(less than one year) transactions are noticeably higher than the ones hedging long-run (more than
one year). This is also supported by Chowdhry and Howe (1999). According to the authors, this may
suggest that firms hedge long term currency risk with operational means and short term currency
risk with derivatives, and that these are complementary risk management strategies.
As researchers gained insight about derivative usage, research on the use of operational hedging
techniques has become increasingly important. Hommel (2002) have mathematically established that
operative hedging through the creation of operational flexibility represents a strategic complement
to any variance-minimising financial hedge. He shows that there exists a strategic complement
between financial and real option-based operative hedging. Given this, one should expect that firms
use both financial and operational hedging techniques. Empirical support is found by Carter et al.
(2003) and Hansen (2009) for US and Danish multinational companies, suggesting that operational
and financial hedges are complementary risk management strategies.
Pantzalis et al. (2001) examined the relationship between operational hedges and exchange rate
exposure among US multinational corporations. They measure exposure as the relation between
changes in the value of the dollar and stock returns using a time-series regression and controlling for
the overall direction of the market. Operational hedging is measured by breadth and depth,
suggesting that breadth (depth) should be associated with lower (higher) levels of exposure. Breadth
is proxied by the number of foreign countries in which the firm has subsidiaries and depth is proxied
by the number of foreign subsidiaries in the top two foreign countries. They find strong evidence of
their hypothesis, suggesting that firms with foreign operations concentrated in few geographic areas
(high depth) are more exposed to currency risk, as this makes them less diversified. On the other
hand, a firm that is spread out over many countries (high breadth) is able to reduce its exposure,
because it is in a better position to structure its operations so that exposures in different countries
15
cancel each other out. The firms’ ability to construct operational hedges effectively reduces exposure
to currency risk – implying that multinational corporations with large diversified networks will be
more successful in effectively managing operating exposure. These results hold after controlling for
factors like the use of financial derivatives, degree of foreign involvement, company size, firm risk
and industry diversification. Their findings are also supported by Carter et al. (2003).
One of the recent studies concentrating on operational hedging is a master thesis by Hansen (2009).
She surveyed Danish medium-sized non-financial, non-listed companies, to find the relationship
between operational and financial hedging. She analysed the results by means of regression in order
to find variables that are determinants of currency hedging activities. Her findings support the
hypothesis that operational and financial risk management is seen as being complements to each
other. Pricing strategy was the most popular hedging strategy used by the companies. The author
also found that the company specific factors “multi-nationality” and “foreign exposure” is significant
factors in explaining the importance and application of both financial and operational hedging
strategies. The size of the companies exhibited significance in explaining the importance and
application of financial hedging. This could be because of economies of scale and/or the fact that
large firms most likely have greater resources and therefore are better equipped to use financial
derivatives.
In a study Marshall (1999) performed a survey among UK, USA and Asia Pacific multinational
companies, to investigate differences in how the firms in the respective countries manage their
foreign exchange rate exposure. He finds a number of similarities, however, with some notable
variations between US and UK companies, and Asian Pacific companies. The firm’s main objective for
managing foreign exchange risk was to minimise fluctuations in cash flows and earnings. According to
his results, the Asian companies are more likely to use external instruments to hedge exchange risk,
than UK and US companies. His results also show that size and industry is a significant factor in
explaining the importance and use of currency hedging.
Pramborg (2004) sent out a survey to firms in Sweden and Korea and compared their use of hedging
techniques to manage foreign exchange risk. As found by Marshall (1999) in his study, there are
similarities between firms in the countries, but with notable exception; the aim of hedging activity
differed. Swedish firms favoured minimising fluctuations of earnings or protecting the appearance of
the balance sheet, while the Korean firms are focused more on minimising the fluctuations of cash-
flows. Also, the proportion of firms that used derivatives was significantly lower in the Korean than in
the Swedish sample, suggesting that the Korean derivative markets are not so easily accessible

16
because of strict government regulations and is also less sophisticated than the Swedish market. This
is contrary to what Marshall (1999) found in his research, where Asian firms tend to use more
derivatives than UK and US companies. This implies that Swedish firms have a relatively high
derivative usage. The Korean firms relied to a larger extent on alternative hedging methods such as
the use of foreign denominated debt.7
A number of studies concentrate on how to theoretically find the optimal currency hedging, but since
this is not directly relevant for the thesis’ main problem formulation, this will be reviewed in the
theory chapter.
1.4.2 Norwegian literature
Very little research on the subject has been done using Norwegian data. The main contribution is a
paper written by Børsum and Ødegaard from Norges Bank, published in “Penger og Kreditt” no. 1,
2005, with focus on derivatives among Norwegian non-financial companies in general. Because of the
study’s importance and relevance to our own study, the results are presented more thoroughly than
the previous international studies. It is interesting to compare these results with our own, which is
done in the analysis chapter.
Over one-third of the respondents had almost the same amount of income as costs in a foreign
currency. As the authors of the paper points out, this indicates that natural hedging is common
among Norwegian companies. The firms that have higher income than costs in another currency are
typically companies in the energy, industrial and fish industry. The respondents with the opposite
income/costs structure are mainly dealing with consumer and/or imported capital goods. When it
comes to assets and debt, more than two-third of the respondents answered that they have none or
very little of these in a foreign currency. Those who deviate from this result are typically shipping and
energy companies. In general also the assets and debt in a foreign currency seems to correspond to
each other, which again leads the authors to believe that natural hedging is common.
Moving on to derivatives, the most commonly used instrument among the Norwegian companies are
forward contracts. The least preferred instrument is options, while swaps are in between. It is also
clear that the companies are focusing their use of these instruments on transactions, and not so
much on assets. Another interesting result is that the use of derivatives decreases with the length of
the horizon, but increases with the size of the firm. The authors claim that the reasons for this could
7Also the article by Alkebäck & Hagelin (1999) focuses on the difference between cultures and countries,
looking at Swedish vs. New Zealand and US firms.

17
be that larger companies are more competent and have more resources and time to spare when
considering derivatives. At the same time they address that using invoices in their own local currency
(a type of operational hedging technique) are more usual among smaller companies. When reviewing
the maturity on the financial hedging, the companies in shipping and energy are the main user of
long term derivatives, while short term derivatives are used by everybody. The amount of income
versus the amount of costs in a foreign currency influence the use of derivatives, and it also influence
the share of total income that the firms hedge.
To summarise the hedging motives, 86 per cent of the respondents said that their goal was to reduce
the fluctuations in income and costs. Almost one-third also stated that they thought that these
fluctuations could result in liquidity problems. At the same time almost one-half of the companies
said that they saw the currency risk as relevant for the owners/investors (see the theory chapter for
more on this subject). This could also be the reason that 70 per cent stated that they had a
predefined strategy towards the currency risk, typically manifested by the board of directors.

18
1.5 Main problem formulation In the previous subchapters the empirical literature review was presented. Based on theory and
findings from this chapter, we have constructed the main problem formulation followed by the
hypotheses. The main problem formulation for this thesis is:
How are the largest non-financial companies in Norway managing their foreign exchange rate
exposure?
This is investigated through the use of data from an empirical survey among the 500 largest non-
financial companies in Norway.8 In order to answer the main problem formulation, a selection of
different hypotheses is tested, which provides important insights to answer the question above. The
hypotheses are mainly based on previous research.
1.5.1 Hypotheses
Hypothesis 1:
H2: The companies’ main motivation for managing foreign exchange risk is to reduce fluctuations in
income, costs or cash flow.
Several studies have shown that the main motivation for managing foreign exchange risk is to reduce
fluctuations in income, costs or cash flow (Marshall 1999, Bodnar et al. 1994, 1995 and 1998,
Pramborg 2004, Børsum & Ødegaard 2005).
Hypothesis 2:
H3: The companies have a predefined strategy for managing foreign exchange risk which is defined by
the board of directors or at corporate level in the organisation.
According to Børsum and Ødegaard (2005), the companies have a predefined strategy towards
currency risk, typically manifested by the board of directors. The risk management strategy should be
defined and executed at the top level of the corporate hierarchy, in order to attain an integrated and
complete risk management strategy (Loderer & Pichler 2000).
Hypothesis 3:
H4: Short term derivatives are more commonly used than long term derivatives.
According to previous research, the derivative usage is mostly concentrated on short term
derivatives (Børsum and Ødegaad 2005, Loderer and Pichler 2000, Chowdhry and Howe 1999,
Bodnar and Gebhardt 1999).
8 Size is measured by revenues in 2008, taken from http://www.norgesstorstebedrifter.no.
19
Hypothesis 4:
H5: Operational hedging strategies are more frequently combined with short term derivatives than
with long term derivatives.
Long term currency hedging is often done with operational means, while short term hedging is done
with derivatives (Bodnar and Gebhardt 1999), making them complimentary strategies (Hommel
2002, Carter et al. 2003 and Hansen 2009).
Hypothesis 5:
H6: There is a high degree of natural hedging among the companies.
According to Børsum and Ødegaard (2005) companies often have a similar portion of income and
costs, and assets and debt, in the same foreign currency. This suggests that natural hedging is
common. This is also supported by Loderer and Pichler (2000).
Hypothesis 6:
H7: The number of foreign subsidiaries, and the number of countries they are spread across,
influences the degree of natural hedging and the use of hedging approaches.
A large international network of subsidiaries provides the company with additional operational
flexibility, thus reducing the need for other hedging techniques. A company with a broad network
has the possibility to choose the location for its activities and optimise according to exchange rate
fluctuations. Companies with many subsidiaries in few countries are more exposed to foreign
exchange risk (as they are less diversified), consequently increasing the need for other hedging
techniques (Pantzalis et al. 2001, Hommel 2003, Hansen 2009).
Hypothesis 7:
H8: There is a positive and significant relationship between company size and the use of derivatives.
Larger companies are more likely to be active abroad and should therefore be more exposed to
foreign exchange risk. This increases the need for various hedging techniques to reduce the risk
profile of their foreign currency activities. There may also be economies of scale, as larger firms may
have greater resources to utilise the use of derivatives (Bodnar & Gebhardt 1999, Hansen 2009).
Hypothesis 8:
H9: Companies in energy, commodity and shipping industries are more sophisticated in their use of
derivatives than companies in other industries.

20
The term “sophisticated” is measured by a larger share of respondents using financial hedging
techniques, and at the same time using more types of derivatives. According to Børsum and
Ødegaard (2005) and Bodnar et al. (1995), financial hedging is more frequently used within energy,
commodity and shipping. Chowdhry & Howe (1999) also show theoretically that operational hedging
is less important for commodity based firms, thus one should expect that hedging with financial
means are more frequent.

21
2 Theoretical background
The previous chapter presented the background for our thesis, followed by an empirical literature
review and finally the main problem formulation and the hypotheses. This chapter will review the
theoretical aspect of foreign exchange risk management. In the first section foreign exchange
exposure is defined, followed by a discussion if, and by whom, this exposure should be hedged.
Subchapter 2.3 describes optimal currency hedging from an academic point of view, while
subchapter 2.4 reviews the different hedging approaches and tools available.
2.1 Foreign exchange exposure The need for foreign exchange risk management is caused by, as financial literature calls it,
companies’ foreign exchange exposure9. On that account, a definition of foreign exchange exposure
is necessary before the methods for managing foreign exchange risk can be discussed.
“Foreign exchange exposure is a measure of the potential for a firm’s profitability, cash flow, and
market value to change because of a change in exchange rates”.10
Assuming that the company is exposed to foreign exchange risk adds responsibility to the financial
manager. It requires him or her to measure this exposure, and maximise the profitability, net cash
flow and market value of the firm based on these measures. Foreign exchange rate exposure can be
measured in more than one way, and is usually divided into three main types: Transaction, economic,
and translation exposure.11 These types of exposure are illustrated in the figure below, followed by a
more detailed explanation. In addition, tax exposure is also occasionally discussed in financial
literature, but is only briefly mentioned in the following.
9 In this thesis, foreign exchange exposure is termed foreign exchange rate exposure.
10 Etteman, Stonehill and Moffett (2004, p. 197)
11 E.g. Marshall (1999), in addition to the footnote above

22
Figure 2.1: Conceptual comparison of transaction, economic, and translation exposure. Source: Etteman, Stonehill and Moffett (2004).
The transaction exposure is the changes in a company’s cash flows from existing contractual
obligations, as a result of fluctuations in foreign exchange rates. This exposure has a timeframe equal
to the horizon of the already established contractual agreements, and the cash flows only include
those determined in the contracts. The most typical issues in this case is the accounts receivables and
payables that is affected by changes in foreign exchange rates, but also investments and loans
denominated in foreign currency.
Moving on to the economic exposure (also known as operating, competitive or strategic exposure),
the horizon is undetermined. The relevant measure is now the change in the company’s present
value as a consequence of changes in all future operating cash flows caused by unexpected change in
exchange rates. Typically these changes influence future costs, prices and/or sales volume. The main
difference between transaction and operating exposure is that the first one only measures changes
in already contracted cash flows, while the latter focuses on changes in all expected future cash
flows.
The translation exposure (also known as accounting exposure) measures the impact of changes in
foreign exchange rates from an accounting point of view. These changes are formed from the
“translation” of e.g. subsidiaries’ financial statements in foreign currency, to the reporting currency
of the parent company. The tax exposure becomes an issue as the taxation varies from country to
country. This gives the financial manager the possibility to minimise the worldwide after-tax
consequences of foreign exchange losses, and to maximise after-tax gains.

23
From the survey conducted by Marshall (1999), among multinational companies in UK, USA and Asia
Pacific, the results show that the majority of the respondents in each region placed transaction risk
as the most important. This had no significant difference between the regions, the size of the
companies, the degree of internationalisation, or industry sector. What influenced the importance of
translation risk is mainly the relative strength of the currency of which the company reports their
financial statement in. Also the economic risk was considered important, but the companies gave this
less attention because it is difficult to quantify this exposure.
From a theoretical point of view, the operational exposure should be the most relevant for
companies exposed to foreign currencies, since it includes changes in all expected future cash flows.
Though, out in the real world this exposure seems difficult to measure, leaving transaction exposure
as the most common exposure to measure and manage.
2.2 Should foreign exchange rate exposure be hedged? Multinational companies are affected by several factors, among these changes in exchange rates,
interest rates, and commodity prices. A lot of the hedging techniques are similar for all of the above.
Foreign currency derivatives are more commonly used than both interest rate and commodity
derivatives, according to a survey on U.S. and German non-financial firms by Bodnar and Gebhardt
(1999). This confirms the relevance of this thesis and highlights the importance of focusing on
hedging foreign exchange risk. This being said, the impact that interest rates can have on the
exchange rates should not be neglected. This is briefly discussed in the next section concerning
optimal hedging. As the term hedging is quite wide, so is its definition:
“Hedging is the taking of a position, acquiring either a cash flow, an asset, or a contract that will rise
(fall) in value and offset a fall (rise) in the value of an existing position”.12
The main purpose for hedging foreign exchange rate exposure is to protect potential losses due to
changes in foreign currencies. This will, by definition, also eliminate the company from gaining value
if the opposite situation occurs, which raises the following question: Should foreign exchange rate
exposure be hedged?
12
Etteman, Stonehill and Moffett (2004, p.199)
24
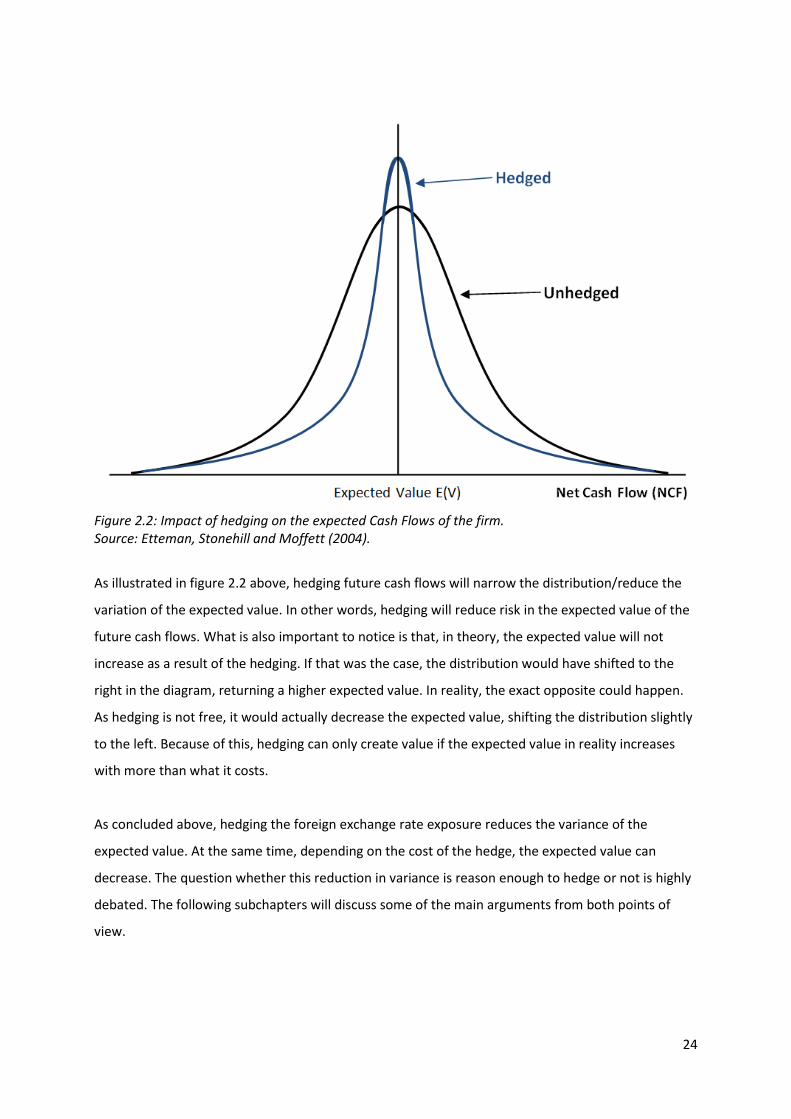
Figure 2.2: Impact of hedging on the expected Cash Flows of the firm. Source: Etteman, Stonehill and Moffett (2004).
As illustrated in figure 2.2 above, hedging future cash flows will narrow the distribution/reduce the
variation of the expected value. In other words, hedging will reduce risk in the expected value of the
future cash flows. What is also important to notice is that, in theory, the expected value will not
increase as a result of the hedging. If that was the case, the distribution would have shifted to the
right in the diagram, returning a higher expected value. In reality, the exact opposite could happen.
As hedging is not free, it would actually decrease the expected value, shifting the distribution slightly
to the left. Because of this, hedging can only create value if the expected value in reality increases
with more than what it costs.
As concluded above, hedging the foreign exchange rate exposure reduces the variance of the
expected value. At the same time, depending on the cost of the hedge, the expected value can
decrease. The question whether this reduction in variance is reason enough to hedge or not is highly
debated. The following subchapters will discuss some of the main arguments from both points of
view.

25
2.2.1 Is hedging the responsibility of the investor or the company?
The Capital Asset Pricing Model (CAPM) theory tells us that investors can diversify their investments,
making most of the company specific risk non-relevant.13 This only applies when the investors’
ownership in a company represent a small fraction of their total portfolio of stocks. This is one of the
main arguments stating that companies should leave the foreign exchange risk management to the
investors. There are two issues making this argument less reliable. First of all, in contradiction to the
CAPM theory, empirical studies have shown that most investors in fact do not diversify.14 According
to this, the foreign exchange risk hedging should often be the company’s responsibility. The second
reason why hedging of foreign exchange risk should be on the company’s agenda, can be explained
by where this specific risk origins. Fluctuations in currencies are connected to the country’s
macroeconomics, and have a tendency to be systematic. According to the CAPM theory, the only
relevant risk for the investor is what he or she is not capable of diversifying, namely the covariance
between the company and the market. Assuming that a change in a foreign exchange rate not only
affects the company’s cash flow, but also influences the country’s macroeconomics, the risk becomes
highly relevant for the domestic market as a whole. Looking directly at the CAPM equation the
exchange risk will influence the company’s beta, and as a result also the company’s value. This
implies that the foreign exchange risk can affect even a diversified investor, making hedging at the
company level highly relevant for both companies and investors.15 This argument will not hold under
the assumption that the investor is perfectly and globally diversified, but this is highly unrealistic.
Another relevant theory is the principal-agent problem.16 This theory explains the potential conflict
between investors’ and managers’ objectives. The investors are the principals and the managers their
agents. While investors want the managers to increase the value of the company, the managers
might have their own agenda to please. Within this theory it is claimed that the management are
more risk-averse than the investors.17 This is argued with the fact that the management have a high
share of their portfolio invested in the company (in the form of human capital), while the investor are
able to diversify the risk. In a foreign exchange risk perspective, this could lead the management to
hedge the risk, even when it is not necessary from an investor perspective. The costs of the hedging
could reduce the cash flow, something the investors might dislike as it at the same time reduces the
value of the company. But as concluded in the last paragraph, reducing the currency risk might
13
For more detailed information about the CAPM theory, see Bodie, Kane & Marcus (2005). 14
See e.g. Goetzmann & Kumar (2008), Villonga & Amit (2006) and Polkovnichenko (2005). 15
Børsum & Ødegaard (2005) and Loderer & Pichler (2000) 16
See e.g. Brealey, Myers & Allen (2008) 17
Etteman, Stonehill & Moffett (2004)

26
actually increase the company value according to the CAPM theory, even though the cash flow is
unchanged or slightly reduced.
As a final remark to this discussion, even though some claim that investors can see through the
currency risk and use it as a factor in their valuation, the company’s management has a better
position to evaluate the risk than the investors. No matter how much the company communicates
with the public; the management will often possess an advantage in their knowledge about the
company’s real risks and returns. It is also realistic to believe that markets are not in equilibrium as
many theories are based on, due to unexpected events and imperfections of both structural and
institutional character. This can put the management in the best position to both recognise and take
advantage of such disequilibrium conditions, through what Etteman, Stonehill and Moffett (2004)
calls selective hedging. Even though such strategies could lead the management to hedge for
speculative reasons, they are often in a better position to know the company’s real risk. This could be
an advantage when it comes to hedging decisions.
2.2.2 Summing up
As presented in this section of the thesis, foreign exchange risk management and hedging is widely
discussed both in financial journals and literature. This is also the reason why we focus on how the
largest companies in Norway actually manage their foreign exchange risk. How and who should be
responsible for hedging the foreign exchange rate exposure depends on both the investors and the
company, and also their risk awareness and risk aversion. A numerous amount of papers and text
books show how hedging should be done optimally, within complex models based on a lot of
assumptions. The next section of this chapter will discuss some of these theories, before moving on
to the main topic of this thesis; how are the largest non-financial companies in Norway actually
managing their foreign exchange rate exposure?
2.3 Optimal currency hedging A lot of the literature and articles in financial journals concerning currency risk hedging have been
dedicated to mathematically calculating optimal hedging strategies. Even though this is not the main
focus in this thesis, it is still relevant to review some of the theories and strategies, before presenting
the results from the survey.

27
2.3.1 The Currency Hedge Ratio
One of the most basic theories from international business literature is called the Currency Hedge
Ratio.18 The Currency Hedge Ratio, in this case termed beta (β), shows the percentage of the foreign
exchange rate exposure that should be hedged by financial instruments.
𝛃 =value of currency hedge
value of currency exposure
To find the optimal hedge ratio, a portfolio of two assets is considered: the exposure represented by
a spot asset and the financial instruments as a hedge asset. The goal of the portfolio is that if the
exchange rate movements lead to lost value (∆ spot), the loss is covered by an opposite change in the
hedge asset’s value (∆ futures). It is optimal to have a portfolio that for any given movement in the
exchange rate, ends up with a total change in the value equal to 0 (∆V = 0).
∆ 𝐩𝐨𝐬𝐢𝐭𝐢𝐨𝐧 𝐯𝐚𝐥𝐮𝐞 = ∆ spot − ∆ futures
To find the optimal currency hedge ratio it is possible to use the same technique as in Markowitz’
portfolio theory: Minimising the variance of the two assets, only in this case the variance at the end
of a period.19 The result gives us the percentage of the total exposure that should be hedged.
Etteman, Stonehill and Moffett (2004) show an example where a multinational firm is expecting a
payment denominated in a foreign currency at a future point of time (t1). The amount of the total
exposure that should be hedged must be determined now (t0). This gives us the following expected
value of the future payment:
𝐄 𝐗𝟏$ = X1 × E(S1)
where E(X1$) is the amount of expected value of the foreign currency payment at time 1 (in $)
X1 is the amount of the foreign currency to be received
E(S1) is the now unknown, but expected spot rate at time 1
Since the firm in the example does not know what the spot rate will be in the future, they form a
portfolio also including forward contracts to hedge the foreign exchange exposure. This will give
18
Etteman, Stonehill & Moffett (2004) 19
Bodie, Kane & Marcus (2005)
28
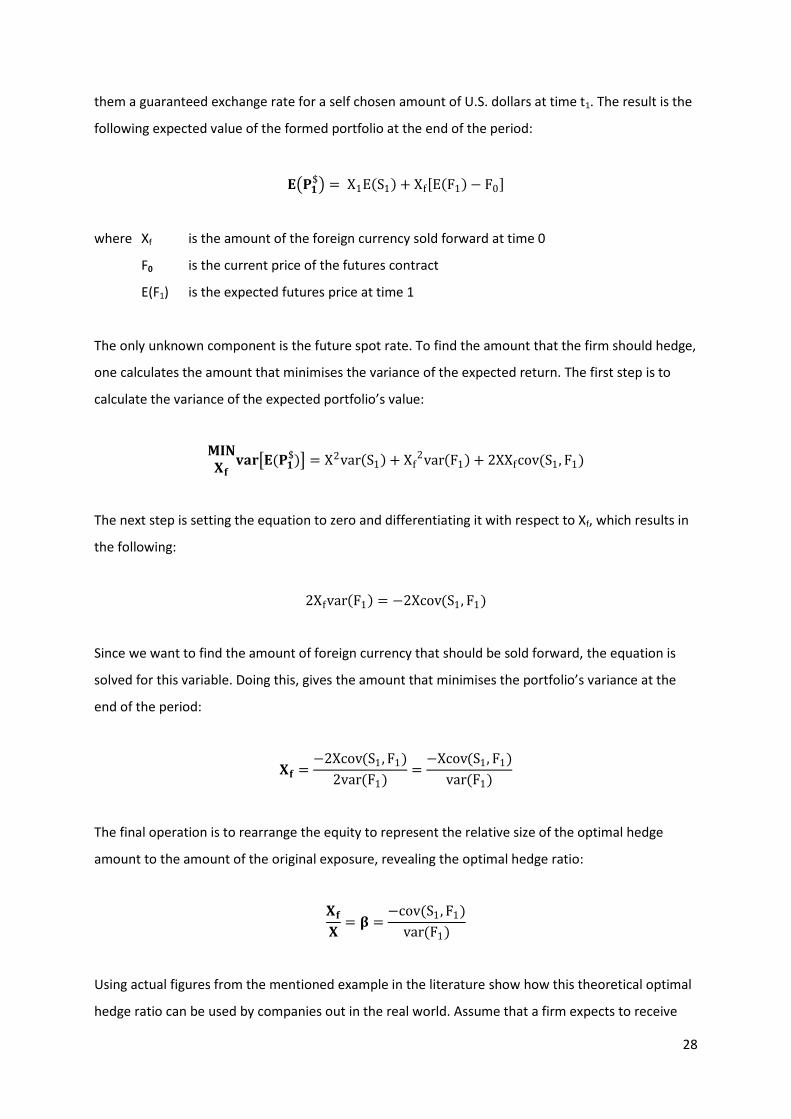
them a guaranteed exchange rate for a self chosen amount of U.S. dollars at time t1. The result is the
following expected value of the formed portfolio at the end of the period:
𝐄 𝐏𝟏$ = X1E S1 + Xf E F1 − F0
where Xf is the amount of the foreign currency sold forward at time 0
F0 is the current price of the futures contract
E(F1) is the expected futures price at time 1
The only unknown component is the future spot rate. To find the amount that the firm should hedge,
one calculates the amount that minimises the variance of the expected return. The first step is to
calculate the variance of the expected portfolio’s value:
𝐌𝐈𝐍𝐗𝐟
𝐯𝐚𝐫 𝐄(𝐏𝟏$) = X2var S1 + Xf
2var F1 + 2XXfcov(S1, F1)
The next step is setting the equation to zero and differentiating it with respect to Xf, which results in
the following:
2Xfvar F1 = −2Xcov(S1, F1)
Since we want to find the amount of foreign currency that should be sold forward, the equation is
solved for this variable. Doing this, gives the amount that minimises the portfolio’s variance at the
end of the period:
𝐗𝐟 =−2Xcov(S1 , F1)
2var(F1)=
−Xcov(S1, F1)
var(F1)
The final operation is to rearrange the equity to represent the relative size of the optimal hedge
amount to the amount of the original exposure, revealing the optimal hedge ratio:
𝐗𝐟
𝐗= 𝛃 =
−cov(S1 , F1)
var(F1)
Using actual figures from the mentioned example in the literature show how this theoretical optimal
hedge ratio can be used by companies out in the real world. Assume that a firm expects to receive

29
1 000 000 in 90 days in a foreign currency, and wants to how much of it they should hedge. The
variance of the 90-day forward is from market data known to be 0.005573, while the covariance
between the spot rate and the forward rate is 0.0054998. By inserting the figures into the optimal
hedge ratio the relative amount is discovered:
𝛃 =Xf
X=
−0.0054998
0.005573= −0.986865 = 𝟗𝟖. 𝟔𝟗 %
98.69 per cent of the total amount should be hedged, or sold forward, or 0.9868 x 1 000 000 = 986
865. Since the spot rate and the futures rate is not perfectly correlated, this makes the relative
amount to be hedged less than 1. Even though they are not perfectly correlated, they still give a
result close to hedging the whole amount. This is quite typical for most major currencies, returning
optimal hedge ratios mostly from 0.97 and up. For that reason, it is highly unlikely that the
companies in practice calculate the optimal hedge ratio, as they rather would hedge the whole
amount as if the beta was 1.
The currency hedge ratio is also the basis for several dynamic currency hedging models. These
models calculate a dynamic strategy for hedging foreign exchange risk, based on e.g. estimates of the
joint distribution of spot and futures currency returns (e.g. by using the GARCH model). This results in
a sequence of dynamic time-varying optimal hedge ratios, constructed upon the estimated
parameters of a conditional covariance matrix. This subject will not be discussed further in this thesis
but are widely discussed in financial literature.20
2.3.2 Adding the interest rate risk
The optimal hedge rate explained above is very simplified. Several more advanced models has been
constructed and published in financial journals, and one of those articles is written by Lioui and
Poncet (2002). In this article the authors add several assumptions regarding states, domestic and
foreign economy, exchange rate derivatives, the foreign investment, and portfolio strategies. The
result is a much more complex model with several components giving clear economic
interpretations. The details of this model will not be discussed, but some of the most interesting
results are commented.
By including variables like interest rate risk they discover that even though futures contracts are
known to be more difficult to price than forwards, the optimal strategy by using them is simpler.
20
Chakraborty & Barkoulas (1999), Poomimars, Cadle & Theobald (2003) and Chan (2008)

30
Since they are no longer assuming that financial markets across countries are complete, a problem
concerning that the interest rate risk cannot be perfectly hedged emerge. When hedging the
exposure with forward contracts the profits and losses up till the due date is locked in until the
maturity of the contract. Taking into account that these profits and losses should be discounted back
to the current date, reveals the interest rate risk. This affects the company since it now demands
additional hedging. If futures contracts are used, the market-to-market mechanism will eliminate this
risk as profits and losses is collected instantly. To sum up the findings, using futures instead of
forwards will eliminate the interest rate risk, which for risk averse companies is very valuable.
However, this is just two out of several other hedging approaches.
Further theoretical deduced models including a broader spectre of hedging tools, become more and
more complex and includes even stricter assumptions. Because of this, we have limited ourselves to
highlight some of the most popular hedging techniques from a more practical point of view. This is
done in the next section of this chapter.
2.4 Financial and Operational hedging approaches The previous sections discussed foreign exchange rate exposure, if this exposure should be hedged or
not, and at last how a theoretical approach to how the optimal hedging can be calculated. But if a
company has decided to hedge their foreign exchange rate exposure, what kind of techniques is
available? The following subchapters will take a closer look at some of the most popular hedging
techniques available, both financial instruments and operational approaches. After this is done, the
two methods are compared up against each other.
2.4.1 Financial approach
The financial approach mainly consists of financial instruments like futures or forward contracts,
swaps or options. These instruments allow the company to hedge positions that are exposed to
foreign exchange rates and, as mentioned earlier in the thesis, minimise the variance of future cash
flows. The optimal use of financial hedging can be found by solving a variance-minimisation problem
as shown in the previous section of this chapter. This could be used to increase expected value, but
this is only the case if the value of the hedging position is larger than what the instruments costs.
Before we discuss the use of financial derivatives any further, we will give a short description of the
instruments mentioned above.
A forward or futures contract is an agreement between two parties to buy or sell an asset at a
predefined point in time. For e.g. an export company these instruments are usually used to hedge a

31
cash flow in another currency expected to be received in the future. This lets the company know
exactly what amount they will receive, eliminating any fluctuations in the value of the cash flow. The
main difference between forward and futures contracts is that the latter is publicly traded in financial
markets and margined daily. A forward contract is a private agreement, with no transfers between
the parties before the maturity of the contract.
A swap is not very different from a forward or futures contract, but as the name reveals the parties
involved agrees to exchange something within a given timeframe. This is typically used to exchange a
stream of cash flow against another. In a currency hedging perspective a swap could, as an example,
be used to swap fixed interest rates on a loan in one currency with an identical loan in another
currency.
The last financial instrument described is an option. Also this derivative has many similarities with a
forward or futures contract, but with one big difference; at maturity of the contract, the option
holder has the right, but is not obligated to sell or buy the underlying asset. The agreement still
includes a specified price (called the strike price) and timeframe, but if the agreed price in the
contract is in the option holder’s disfavour he has the possibility to rather buy the asset spot.
Continuing the example with the export company, with an option the expected payment is secured
at a certain level. But if the currency at the maturity of the option trades at a more favourable price
spot than in the agreement, the company could increase its profit by selling the currency in the spot
market.
All of the descriptions above expose one great limitation concerning financial hedging instruments;
it’s time horizon. They can very well cover planned transactions and minimise short term risk, but
recalling operating exposure which includes all future cash flows, these instruments could fall a bit
short. On the other hand, this kind of hedging is easy to quantify, which makes it attractive to a
majority of foreign exchange rate exposed companies.21 Another downside when it comes to solely
using a financial approach is if a change in currencies alters the company’s competitive position or
leads to lost business opportunities, as this cannot be hedged with derivatives. This is where the
operational approach could be used as a complementary strategy.
2.4.2 Operational approach
The operational approach typically includes changing the localisation of production facilities, or
buying inputs and using suppliers from a foreign country so the costs will correspond to the same
21
Marshall (1999)
32
currency as the income. Having approximately the same amount of costs and income in the same
currency is also known as natural hedging. Other strategies could be changing prices as the currency
fluctuates, choosing and timing new markets segments, and adjusting the product mix. If the
company has foreign exchange rate exposed assets, it can neutralise this effect by raising a loan in
the same currency. This would also increase the costs in the foreign currency, at the same time
increasing the degree of natural hedging against income in that currency. Another well known
operational strategy is to invoice the customers in the company’s own currency, transferring the
exchange risk to the other party.
The main purpose of using operational hedging techniques is to minimise, and find the correct
response to, the total effect of all future changes in other currencies the company is exposed to.22
This could also include the effect of achieving extra profit when the foreign exchange rate changes in
a favourable matter.23
2.4.3 Financial versus operative hedging
Which of the two approaches that serve as the most important, depends on company specific
characteristics. Operational flexibility decides to which extent the company is able to use operational
techniques and at the same time the importance of these. Hommel (2003) found that by utilising a
real options framework, operative hedging through the creation of operational flexibility serves as a
complementary strategy to any variance-minimising financial hedge. Using a real options perspective
is a constructive way to value the flexibility, and has been the framework in a large amount of the
research on operational hedging. Hommel (2003) also states that operational flexibility creates an
asymmetric exposure profile, which as a result alters the composition of the financial hedge
portfolio. How much of each of the approaches that should be used will differ from company to
company, based on the amount of investments they have made in flexibility. Based on these
arguments, a pure exporting company’s most important approach is financial instruments. On the
contrary, a company with subsidiaries in different countries with different currencies should utilise
operational hedging e.g. through shifting production according to fluctuations in currencies. This
makes it possible not only to minimise the risk, but also benefit from developments in the foreign
currencies.
It is worth mentioning that researchers have different opinions on what conditions that makes an
operational approach relevant for a company. Chowdhry and Howe (1999) states that multinational
22
Glaum (1990) 23
Bartram, Dufey & Frenkel (2005)

33
firms will engage in operational hedging only when both exchange rate uncertainty and demand
uncertainty are present. They argue that exchange rate uncertainty cannot alone justify
delocalisation because it can be hedged with foreign exchange instruments. As the demand
uncertainty is lower in the short term, operational hedging is more important in the long run. Hau
(1999) on the other hand, claims that this conclusion is based on a model with assumptions that lack
proper microfoundations. By correcting the model he finds that demand uncertainty is not necessary
for a multinational firm to delocalise, and thereby use operational hedging.

34
3 Data and methodology
The previous chapter presented relevant foreign exchange risk theory and the different hedging
approaches available. This chapter will present methodology, the sample selection and the methods
used for analysis, before finally presenting descriptive statistics from the survey.
3.1 Research methodology – theoretical framework To execute an empirical study, a dataset is needed for analysis. To answer the hypotheses, we used a
survey to gather the data needed for the research ourselves. This is called primary data. The
alternative would have been use of secondary data, which is data collected by others, often for other
purposes. The main problem with secondary data is often limited availability for the data needed for
a given study.
There are two main types of previously research done in the field of foreign exchange risk
management. The first type is based on publicly available data about currency exposure and hedging,
like annual reports or databases (secondary data). The advantage with this method is elimination of
selection biases, and that data for the whole sample can be attained. The main problem with
secondary data is the availability. Very little research has been done in this field, concentrating on
Norwegian corporations, thus limiting the secondary data available.24 Also, the firms do not publish a
whole lot of information about their foreign exchange risk and hedging activities, if they choose to
publish anything at all. Annual reports for non-listed companies are often not available, and there are
different accounting standards that may influence how the firms report their currency exposure and
derivative usage. At best, there is some information in the financial statement notes in the public
traded firms. This limits the possibilities to access secondary data by observation.
The second type of research is based on surveys. The immediate advantage with this method is the
possibility to collect exactly the data needed for the study. This is called primary data, and is the main
method applied in this thesis. Generally, surveys allows for the use of more qualitative questions, like
motivations and thoughts. One of the main weaknesses with surveys based on voluntary
participation is the danger of selection biases (e.g. only the respondents that take interest in the
subject or have the time available, complete the survey).
24
The exception is Børsum and Ødegaard (2005), but the data is not publicly available.

35
There are some general points that have to be considered when using a standardised questionnaire.
Gripsrud and Olsson (2000) list some guidelines for question formulation, which was used when
making the questions. They are summarized in the list below.
1. Use easy and clear language. 2. Avoid leading questions. 3. Avoid implicit alternatives. 4. Avoid implicit assumptions. 5. Avoid generalisations. 6. Avoid iterative questions.
Gripsrud and Olsson (2000) also stress the importance of the survey layout and pre-testing the
questionnaire, in order to insure validity and reliability.
3.2 Methodology implementation
3.2.1 Target population definition
For the purpose of this study we have focused on the largest non-financial firms in Norway. There are
two main reasons for this. First, according to earlier international studies, larger firms are more likely
to be exposed to foreign exchange risk. Since this thesis aims to study how they are managing their
foreign exchange rate exposure, the firms in our sample should at least to some degree be exposed
to currency risk. Second, a study concentrating on the largest companies in Norway has never been
done before. This makes it particularly interesting to focus on this group of companies.
Financial companies are left out of the target population, since they often are both provider and
demander of hedging products. This is also done for the same reason in several earlier studies.25
3.2.2 Final sample used in the study
A list of the 500 largest Norwegian companies was used as a starting point for our sample in the
study. The list was provided to us by Norges Største Bedrifter, which is published by Findexia Forlag.26
This list displays the 500 largest companies in Norway, based on revenues from the 2008 financial
statements. The selection process is illustrated in table 3.1 below and explained in detail in the
following paragraphs.
25
Bodnar & Gebhardt (1999), Pramborg (2004), Børsum & Ødegaard (2005) and Hansen (2009) 26
Published annually since 1966. http://www.norgesstorstebedrifter.no and http://www.findexaforlag.no

36
Table 3.1: Sample selection process.
Step Action Number of companies included
Step 1 Restricting to the 500 largest companies. 500 Step 2 Excluding non-financial companies. 458 Step 3 Excluding companies with common corporate
management/duplicates 449
Step 4 Excluding companies without available contact information 438
Step 1: Restricting to the 500 largest companies.
The first step of the selection process was to limit our sample to the 500 largest companies in
Norway, ranked by their revenues in 2008. As mentioned above, this list was provided to us by
Norges Største Bedrifter.
Step 2: Excluding non-financial companies.
This was done because financial companies just as often are a provider as a demander of currency
derivatives. This makes the financial companies less relevant to compare with other industries.
Excluding all the non-financial companies, the sample was lowered to 458 companies.
Step 3: Excluding companies with common corporate management/duplicates.
To avoid sending out several identical surveys to the same person/company, the companies that
were duplicates or have common corporate management were excluded. This reduced the sample by
nine companies.
Step 4: Excluding companies without available contact information.
Some companies did not have accessible contact information. We strained ourselves trying to find
contact information to all the companies, searching the websites and other sources. But, for 11
companies this was not possible to attain, and therefore had to be excluded in the final sample.
As a result of the steps above, the final sample consisted of 438 companies. The analyses are based
on the 176 answers received from the final sample. The complete list of the 500 largest companies
can be found in appendix C.
3.2.3 Questionnaire design
As mentioned earlier, data on foreign exchange risk management among the (largest) firms in
Norway is not readily accessible in any official databases, or in the accounting reports. Therefore, to
collect the data needed to answer our hypotheses, we designed our own questionnaire. The
structure of the design was inspired by earlier empirical studies like the ones conducted by Marshall
37
(1999), Loderer and Pichler (2000), and in particular Børsum and Ødegaard (2005), before tailoring
the questionnaire to suit our requirements. This also gave us the opportunity to compare our results
with theirs. A complete version of the questionnaire is presented in appendix B.
Our questionnaire had to be designed in a way that would help us answer the hypotheses. To insure
the validity of the survey, a lot of time was used on previous research and theory before making the
questions. Even so, there is still a possibility that some of the respondents may have misunderstood
or had problems understanding some of the questions.
In order to achieve a highest possible response rate, a target response time of approximately five
minutes was set as an upper limit. This was also done to insure that the respondents would not get
tired or bored while answering the survey, and aborting before completing all the questions.
A “funnel approach” was used when designing the survey, starting with wide and general questions
before narrowing down to specifics. Questions about industry affiliation, and if they are a public
limited company, private limited company or in the government sector, got the respondents warmed
up before the more specific questions. Following the warm up questions the rest of the questions
were structured in a logical way, starting with questions about currency exposure, followed by
questions about hedging, before asking reasons for their earlier answers.
The questionnaire was also made with a dynamic approach, using routing of questions. This was
necessary to get the answers needed from our respondents and to insure that the respondents did
not have to answer any irrelevant questions. E.g. if the respondent answered “No” on the question if
the firm has any income, costs, assets or debt in another currency than NOK, then that firm is not
exposed to foreign exchange risk. It would then be irrelevant for the respondent to answer any
questions about currency hedging. In total the questionnaire consisted of between 3 and 17
questions, depending on previous answers.
All the questions in the survey were to the extent possible designed as closed-end questions, with
predefined alternatives. But, we also included an “other – please specify” alternative. This was done
to catch any potentially unforeseen alternatives. Some respondents might also be put-off if they
could not provide their best alternative, which in worst case could have lowered the survey response
rate. Predefined alternatives also make it possible to analyze the answers using statistical methods,
which was essential in order to test the hypotheses.

38
The questionnaire was written in Norwegian, and not English. This was a deliberate choice from our
side. Since the working language in most of the Norwegian companies is Norwegian, we feared that a
survey written in English could lower the response rate. Writing in Norwegian would also minimise
the risk of any misunderstandings on the respondent’s side, which could potentially lead to distorted
answers and lower the validity of the study.
3.2.4 Survey implementation
To create, distribute and manage this questionnaire an online survey service called Questback was
used.27 Questback allowed us to collect primary data in an easy and effective way. Additionally, it
provides quick response and the data is already converted into numerical form suitable for analysis.
To ensure that the respondents would understand the questions and the technical terms used, the
survey was distributed to a test-panel. The test-panel consisted of a heterogeneous group of people,
where some had experience with currency hedging from top-management level, others were NHH
master students, and some were employees not dealing with exchange risk at all. Still, all the
members in the test-panel had the basic qualifications necessary to answer the questions. This
ensured that our survey would be of a certain quality as well as comprehensible by most people in
our final sample.
E-mail was used to communicate with our respondents, and it was challenging and tedious to collect
and identify all the e-mail addresses since many of the company websites provide very little
information about this. We tried as far as possible to send the survey to an email with a specific
name behind it, believing it would give the best response rate. We also tried to the largest extent
possible to target the employees we thought would be best qualified to answer the survey,
preferably people with responsibility on a company-group level, like CFOs or CEOs. If people in the
top-management group could not be contacted, the survey was sent to an information manager, or
least preferably to a non-specific company mail address.
The survey was distributed on the 12th of March 2010. A reminder was sent out on the 13th of April
2010 to those who had not answered. The mail started with an introduction, describing the purpose
of the survey. We then presented some brief information about the survey, and attached a web-link
to the survey at the bottom. Brief instructions were also included on the first page in the
questionnaire. The e-mails and the questionnaire can be found in appendix A and B respectively.
27
http://www.questback.com

39
3.3 Survey response After sending out the initial survey and later a reminder to our sample selection of 438 firms, we
ended up with a total of 176 usable responses. This gave us a response rate of 40.2 %. This is a quite
satisfying response rate and higher than most comparable surveys. This is confirmed in table 3.2
below, showing that the average response rate was 31.3 % among other comparable surveys and
that only one survey achieved a higher response rate than ours.
Table 3.2: Survey response comparison.
Author(s) Response rate
Hansen, M.A., 2009 34.9 %
Børsum, Ø.G. & Ødegaard, B.A., 2005 36.9 %
Pramborg, B., 2004 26.0 %
Loderer, C. & Pichler, K., 2000 28.8 %
Alkebäck, P. & Hagelin, N., 1999 76.6 %
Bodnar, G.M. & Gebhardt, G., 1999 14.6 %
Marshall, A.P., 1999 30.0 %
Bodnar, G.M. et al., 1998 20.7 %
Bodnar, G.M. et al., 1996 17.5 %
Bodnar, G.M. et al., 1995 26.5 %
Average 31.3 %
Our survey 40.2 %
Even though a lot of time and resources was used to find contact information to the person best
suitable to answer the questionnaire, we did get a few e-mails from persons stating that they were
not the right person or not qualified to answer the survey. In those cases we were provided with
contact information to a more competent person. The few who chose to give us a reason why they
did not participate mostly stated that they principally do not participate in surveys.
3.4 Method of analysing In this thesis both cross-tabulation with Chi-square test and regression analysis is used to statistically
test several of the hypotheses from chapter 1.5. The remaining part of this chapter briefly presents
the theory and application of these statistical methods. This theory is taken from Gripsrud and
Olsson (2000), Thrane (2003) and Ringdal (2001). SPSS and STATA were used to perform the
statistical tests.
3.4.1 Variables
Measurements are usually divided into four different types of scales: nominal, ordinal, interval or
ratio variables.
- Nominal variables are variables with no natural order or ranking, e.g. industry or location.

40
- Ordinal variables are variables where one can rate the values, but not say anything about the
value compared to another. E.g. “greatly dislike, moderately dislike, indifferent, moderately
like, greatly like.”
- Interval variables are equally spaced variables, like temperature. The difference between 20
Celsius and 21 Celsius is taken to be the same as the difference between 40 Celsius and 41
Celsius. Interval variables do not have a true zero.
- Ratio variables are equally spaced variables, with a true zero point, e.g. sales or income.
In addition to these variables, some of the tests that are being performed in this thesis include
dummy variables. Dummy variables are variables that either have the value 0 or 1 to signal if a
characteristic is present or not. This variable type can also be computed based on other variables,
e.g. giving all the respondents who only use financial hedging techniques the value 1, while giving
both the ones only using operational hedging techniques, and the ones using both of these
techniques, the value 0. In the analysis, these variables will be denoted with their reference group.
3.4.2 Pearson’s Chi-square (χ2)-test
In market research the dependency and correlation between several variables is an important
subject. The chi-square test can be useful if one want to test for significant relations between
variables when the variables are nominal. This can be presented in a cross table. When the variables
are interval or ratio, regression analysis can be used (presented in next subchapter).
Chi-square measures the degree of deviation between a theoretical model and the observed data. If
there is no dependency between the variables in a cross table, the chi-square value will be closer to
zero. A high chi-square value signals big deviations between the expected theoretical model and the
results. The formula for chi-square (χ2) is given by:
𝜒2 = (𝑂 − 𝐸)2
𝐸
O is the observed frequencies in the sample and E is the expected frequencies from a theoretical
model with no dependency (or statistical independence) between two variables in a cross table. The
formula finds O and E for each cell in the cross table, and the squared difference (O – E)2. This result
is divided by the expected frequency (E). The sum of this calculation from all the cells in the cross
table gives the chi-square (χ2).

41
Because the chi-square value is not standardised and varies from zero to infinite (0 ≤ χ2 < ∞),
interpreting the value is not easy. This is solved by comparing the value to a chi-square distribution
and calculating a p-value. This reveals the level of significance. An important premise for the chi-
square test is that the number of observations is at least five in each cell in a cross-tabulation. 28
To test for significance a 90 per cent confidence interval is used. This means that one can with 90 per
cent degree of certainty say that the result is applicable for the entire population.
3.4.3 Regression analysis
Regression analysis is a quantitative method for analysing the relation between a dependent variable
and one or several independent variables. A bivariate regression-line in a general form is given by:
𝒀 = 𝛼 + 𝛽 𝑋 + 𝜀
where Y is the dependent variable, α is the constant, β is the regression coefficient of X and X is the
independent variable. The regression coefficient β is the slope of the equation, i.e. the given change
in Y, as a result of a one-unit change in X. ε represent the residual part, and is the part that cannot be
explained by the variables. To measure the explanatory power of the equation, R2 is used. A higher R2
means that the regression displays more explanatory power than a lower R2.
Regression analysis builds on the principle of ordinary least squares. This method aims to minimise
the distance from the different observations to the estimated regression-line. In other words; to find
the line that minimises the combined deviations from the observed values. 29 To test if our
regressions are significant, a 90 per cent confidence interval is used, like with the chi-square test.
This is lower than the more commonly used 95 per cent confidence interval, but this is done because
of a relatively low number of observations.30
3.4.4 Assumptions of the ordinary least squares regression model
The ordinary least squares regression model is according to Ringdal (2001) based on eight
assumptions, divided into three main categories: model specification, regression residuals, and
independent variables in multiple regressions. These will briefly be reviewed in this section, together
with some of the methods for testing if the assumptions hold.
28
For more detailed information about the chi-square test, see Gripsrud and Olsson (2000) pp. 223-227 or Ringdal (2001) pp. 324-340. 29
For more detailed information about regression analysis, see Thrane (2003) or Ringdal (2001). 30
http://www.kunnskapssenteret.com/articles/2654/1/Hypoteseproving/Hypoteseproving.html

42
Model specification
1. All relevant independent variables are included, while irrelevant independent variables are
excluded.
2. The relationship between the independent variables and the dependent variable are linear.
3. It is an additive model, meaning that there is no statistical interaction between the
independent variables.
Excluding relevant independent variables in a regression model could lead to results that wrongfully
attribute the common variance they share with other variables, to those included. This would also
inflate the residuals. Including irrelevant independent variables could lead to results that wrongfully
attribute common variance they share with other included variables, to the irrelevant ones. Both
cases would influence the estimates of the regression coefficients. Statistical techniques have been
used to test the model specification of the regression models in this thesis.31
The regression model would still make a straight line, even if the relationship between dependent
and independent variables is non-linear. This can lead to results showing relationships that in reality
do not exist. A reason for non-linearity could be that the variable has a skewed distribution. A way of
discovering this could be to look at scatter plots of the observations to see if there is a linear
relationship (see figure 3.1).
Figure 3.1: Using “acprplot” in STATA to graph an augmented partial residual plot.32
When it comes to the third assumption, statistical interaction can be built into the model manually.33
This can reveal how the interaction affects the results, to see if the difference is significant enough to
be considered.
31
In STATA, “linktest” could be used to test single-equation models, while “ovtest” performs a regression specification error test for excluded variables. 32
http://www.ats.ucla.edu/stat/stata/webbooks/reg/chapter2/statareg2.htm 33
Ringdal (2001)
43
Regression residuals
4. The residuals of all independent variables have the same variance (homoskedasticity).
Var εi = σ2.
5. The residuals are normally distributed. Ei~N 0, σ2 .
6. The residuals are uncorrelated with each other and the independent variables
(autocorrelation/serial correlation). Cov εi , εj = 0, Cov εi , Xi = 0.
7. The residuals are expected to have an average of zero. E εi = 0.
Of the assumptions concerning the regression residuals, testing for heteroskedasticity and if they are
normally distributed are often what gets the most consideration (assumption four and five). The first
are usually tested by reviewing scatter plots of the residuals of the regression versus the predicted
values. An indication of heteroskedasticity is seen if the pattern of the plots is wider towards the end
of the chart (see figure 3.2). This could also be statistically tested by using White’s or the Breusch-
Pagan test. To test if the residuals are normally distributed reviewing a histogram or kernel density
plot is used (see figure 3.2). Having heteroskedasticity or non-normalised residuals will not affect the
estimated coefficients, but will influence the results as it no longer is assured that the p-values for
the F-test and t-tests are valid. A way of dealing with heteroskedasticity is by running a regression
with robust standard errors (e.g. by using the Huber-White sandwich estimators). As this would help
minor concerns with heteroskedasticity, we will assume that this applies for our dataset and use
robust standard errors in the regressions in our analysis. Regarding the normal distribution of
residuals, this can be tested by visually reviewing the distribution (see figure 3.2). In reality the
ordinary least squares regression model only requires the residual to be identically and
independently distributed.32 Though, one should be are aware of that the absence of normal
distribution could make it hard to draw conclusions to the whole population.

44
Figure 3.2: Searching for heterskedasticity and normalised regression residuals, using “rvfplot” and “kdensity” in STATA.34
Assumption number six is only an issue when dealing with time series or in cases where the same
respondents are sampled repeatedly. Autocorrelation can be tested with the Durbin-Watson
statistic, but since this not relevant for the dataset in this thesis the test will not be performed.35
Independent variables in multiple regressions
8. The independent variables cannot be perfect correlated, both by pairs and group
(Multicollinearity).
A perfect linear relationship between the independent variables would lead to unstable estimation of
the regression’s coefficients and inflated standard errors. A common way to test for multicollinearity
is to calculate the variance inflation factor (vif) or the tolerance (1/vif). A vif above 10 or a tolerance
below 0.1 are seen as a signal that multicollinearity should be investigated further.
All the regression diagnostic tests can be found in appendix D. Before presenting the analyses and
testing the hypotheses, the dataset showing the respondents survey answers is reviewed. This is
done in the next sub-chapter.
3.5 Descriptive statistics This chapter presents detailed descriptive statistics for all the questions included in the distributed
survey. The purpose of this chapter is to allow for a better understanding of the achieved results and
provide the reader with additional background information about the foreign exchange risk
management of the largest non-financial companies in Norway. No results or conclusions are
34
http://www.ats.ucla.edu/stat/stata/webbooks/reg/chapter2/statareg2.htm 35
In STATA, “estat dwatson” performs a Durbin-Watson test.

45
presented in this chapter, but it gives an impartial presentation of the respondent’s answers. For all
questions the frequency is presented in addition to the corresponding percentage. Also included are
the respondents who chose to not answer the question. When it is possible the mean and median
values is presented.
3.5.1 Company characteristics
Table 3.3: Descriptive statistics for the 2008 revenue of the companies (‘000 NOK).
Variable Mean Std. Deviation Median Min. Max.
Revenues 9 259 860 50 450 415 2 266 298 983 542 656 000 000
Note. N = 176
The mean revenue of the companies in our survey was approximately NOK 9.26 billion in 2008, while
the standard deviation is 50.5 billion. The median value is NOK 2.27 billion. The lowest revenue is 983
million NOK, while the highest revenue is NOK 656 billion.
Table 3.4: Company type and industry affiliation
Variable Percentage Frequency
Company type Public limited company 18.8 33 Private limited company 71.6 126 Government sector 4.5 8 Not answered 5.1 9
Total 100 176
Industry Oil and gas 9.7 17 Energy, others 6.8 12 Supply 2.8 5 Shipping 4.5 8 Manufacturing /production 21.6 38 Fish industry 4.5 8 Other consumer goods 10.2 18 Capital goods 5.7 10 IT/telecom/media 6.3 11 Building/construction/real estate 8.0 14 Transportation 4.0 7 Government sector 3.4 6 Others 12.5 22
Total 100 176
Note. N = 176
As can be seen from the table above, the respondents of the survey are mainly private limited
companies, consisting of 71.6 per cent of the total. 18.8 per cent are public limited companies, while

46
4.5 per cent are a part of the government sector. More than 5 per cent of the companies chose to
leave this question unanswered.
Moving on to the industry distribution, “Manufacturing/production” with its 21.6 per cent contains
the largest share of respondents. “Other consumer goods” is the second largest category with 10.2
per cent of the respondents (excluding “Others”), consisting mainly of grocery corporations. Almost
as many is found in the oil and gas industry, counting 9.7 percent of the total. The rest of the
respondents are divided quite equally among the rest of the industries, with “Energy, others” and
“building/construction/real estate” as the leading industries with 6.8 and 8.0 per cent.
3.5.2 Foreign exchange rate exposure
Table 3.5: Foreign currency exposure and currency most exposed to.
Variable Percentage Frequency
Exposed to foreign currencies Yes 76.1 134 No 23.9 42
Total 100 176
The currency the companies are most exposed to Euro (EUR) 45.5 61 US Dollars (USD) 26.9 36 Pound sterling (GBP) 3.0 4 Nordic currencies (SEK, DKK, ISK) 15.7 21 Other 8.2 11 Not answered 0.7 1
Total 100 134
Note. N = 134 - 176
Over 75 per cent of the companies that answered the survey state that they are exposed to foreign
currencies. When asked about which currency they are most exposed to, 45.5 per cent answer Euro.
26.9 per cent have placed US Dollars as their most important currency, while 15.7 per cent are most
exposed to Nordic currencies. Only 3.0 per cent placed Pound sterling as the most important
currency, while almost all of the 8.2 per cent that has answered “Other” has listed several of the
mentioned currencies instead of placing one of them as the most important.

47
Table 3.6: Number of foreign subsidiaries, including and excluding sales division, and countries.
Variable Percentage Frequency
Number of foreign subsidiaries 0 43.3 58 1 7.5 10 2 3.7 5 3 3.7 5 4 3.7 5 5 3.0 4 6 - 10 7.5 10 11 - 20 9.0 12 More than 20 18.7 25
Total 100 134
Number of foreign subsidiaries excluding sales divisions 0 59.7 80 1 3.7 5 2 3.0 4 3 3.7 5 4 3.7 5 5 2.2 3 6 - 10 5.2 7 11 - 20 5.2 7 More than 20 4.5 6 Not answered 9.0 12
Total 100 134
Number of countries the subsidiaries are spread across 0 34.3 46 1 9.0 12 2 3.0 4 3 7.5 10 4 6.0 8 5 3.7 5 6 - 10 9.0 12 11 - 20 9.0 12 More than 20 8.2 11 Not answered 10.4 14
Total 100 134
Note. N = 134
When asked about foreign subsidiaries, more than 40 per cent of the respondents say that they do
not have any. When asked to exclude foreign subsidiaries that are strictly sales divisions, almost 60
per cent answer that they have none. When sales divisions are included, 7.5 per cent state that they
have one foreign subsidiary, while 2, 3, 4 and 5 subsidiaries all have between 3 and 4 per cent
responses each. Looking at the same number of subsidiaries when sales divisions are excluded, the
figures are much the same except now only 3.7 per cent state that they have one subsidiary and only
2.2 per cent has five. 18.7 per cent answers that they have more than 20 foreign subsidiaries
including sales divisions, while this number decreases to 4.5 per cent when excluding sales divisions.

48
It is also worth mentioning that when asked to subtract sales divisions 9.0 per cent leave the
question unanswered.
The amount of countries the foreign subsidiaries are spread across varies from respondent to
respondent. As the earlier table implies, the most frequent answer is zero, holding 34.3 per cent of
the respondents. The remaining respondents are almost evenly distributed among the rest of the
answer options. The number of companies answering between one and five countries is lower than
the number of respondents that answered six or more.
Table 3.7: Share of income and costs in foreign currencies.
Variable Percentage Frequency
Share of income in foreign currency 0 % 14.9 20 1 – 25 % 29.1 39 26 – 50 % 10.4 14 51 – 75 % 14.9 20 76 – 99 % 22.4 30 100 % 4.5 6 Not answered 3.7 5
Total 100 134
Share of costs in foreign currency 0 % 4.5 6 1 – 25 % 41.0 55 26 – 50 % 20.9 28 51 – 75 % 23.1 31 76 – 99 % 6.0 8 100 % 0.7 1 Not answered 3.7 5
Total 100 134
Note. N = 134
By reviewing what the companies answered on the question concerning share of income and costs in
foreign currencies, almost 15 per cent state that they do not have any income of that sort. In
comparison to this, only 4.5 per cent say that they do not have any costs in foreign currencies. 29.1
per cent answered that between 1 and 25 per cent of their total income is in another currency than
Norwegian Krone (NOK), while over 40 per cent claim that their share of costs in foreign currencies is
between those figures. Moving on, one can see that there are more respondents stating that the
share is between 51 and 75 per cent, than between 26 and 50 per cent, both in the case with income
and costs. When looking at the upper level of the share of income and costs in foreign currencies, we
can see from the table above that over 20 per cent of the respondents say that the share of income is
between 76 and 99 per cent. As for costs, only 6.0 per cent place themselves in that interval. 4.5 per

49
cent state that all of their income is in foreign currencies, while 0.7 of them have all of their costs in a
different currency than NOK.
Table 3.8: Share of assets and debt in foreign currencies.
Variable Percentage Frequency
Share of assets in foreign currency 0 % 26.9 36 1 – 25 % 36.6 49 26 – 50 % 9.0 12 51 – 75 % 12.7 17 76 – 99 % 6.0 8 100 % 1.5 2 Not answered 7.5 10
Total 100 134
Share of debt in foreign currency 0 % 28.4 38 1 – 25 % 30.6 41 26 – 50 % 9.0 12 51 – 75 % 9.7 13 76 – 99 % 10.4 14 100 % 3.0 4 Not answered 9.0 12
Total 100 134
Note. N = 134
When looking at the respondents’ assets and debt in foreign currencies, the most common answer is
a share of 0 or between 1 and 25 per cent. 26.9 per cent say that they do not have any assets in
foreign currencies, while 28.4 per cent say this about debt. 36.6 per cent answer that between 1 and
25 per cent of their total assets are valued in a different currency than NOK, and 30.6 per cent says
this about their share of debt. The distribution among the rest of the categories is quite equal to each
other. For assets, between 51 and 75 per cent is more common (12.7 per cent), as for debt, the
interval between 76 and 99 per cent reads a considerable higher frequency than assets (10.4 per
cent).

50
3.5.3 Corporate strategy
Table 3.9: Methods used to measure foreign exchange rate exposure.
Variable Percentage Frequency
Methods used to measure foreign exchange rate exposure Rough estimates 32.1 43 Cash Flow and/or Value at Risk 66.4 89 Scenario analysis 11.9 16 Stress analysis 7.5 10 No method 7.5 10 Other methods 11.2 15
Total checked values 183 Respondents that checked more than one option 38
Note. N = 134 Multiple selections are possible. Percentage based on frequency divided with total respondents, not total checked values.
Cash Flow and/or Value at Risk are the most common method used to measure foreign exchange
rate exposure among the respondents of our survey (66.4 per cent). The second most used method is
rough estimates counting more than 30 per cent of the respondents, while 11.9 per cent are using
scenario analysis. Both stress analysis and no method used have 7.5 per cent response and 11.2 per
cent answered “Other methods”. Examples from the latter are use of external consulting, that the
measuring takes place in the parent company outside of Norway, and more balance sheet related
measures. 38 respondents have checked more than one option.
Table 3.10: What level the strategy for managing foreign exchange exposure is defined.
Variable Percentage Frequency
At what level the strategy for managing foreign exchange rate exposure is predefined
Board of directors, general assembly etc. 52.2 70 Corporation level (CEO, CFO etc.) 36.6 49 Division level (Division manager etc.) 2.2 3 Employee level (controller etc.) 0.7 1 Has no predefined strategy 7.5 10 Not answered 0.7 1
Total 100 134
Note. N = 134
The most frequent answer among the respondents is that strategy for managing foreign exchange
rate exposure is predefined by the board of directors, general assembly etc. (52.2 per cent). 36.6 per
cent state that the strategy is predefined at corporate level. 7.5 per cent say that they do not have a
predefined strategy.
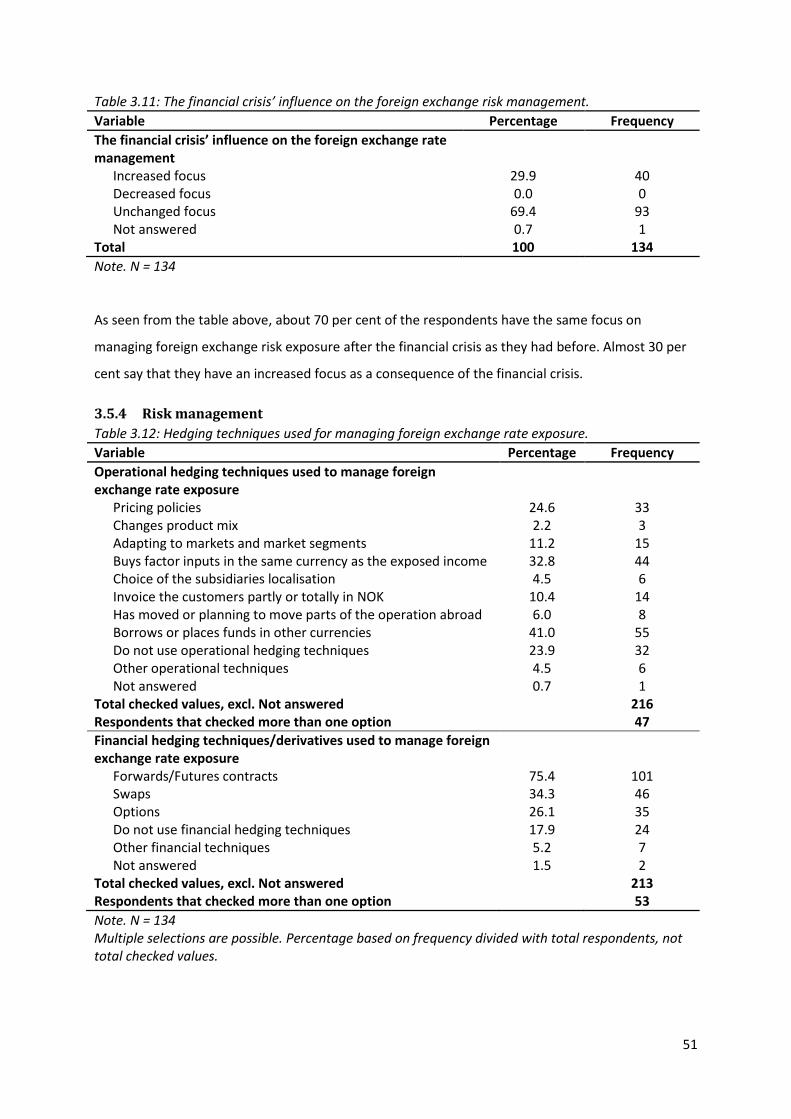
51
Table 3.11: The financial crisis’ influence on the foreign exchange risk management.
Variable Percentage Frequency
The financial crisis’ influence on the foreign exchange rate management
Increased focus 29.9 40 Decreased focus 0.0 0 Unchanged focus 69.4 93 Not answered 0.7 1
Total 100 134
Note. N = 134
As seen from the table above, about 70 per cent of the respondents have the same focus on
managing foreign exchange risk exposure after the financial crisis as they had before. Almost 30 per
cent say that they have an increased focus as a consequence of the financial crisis.
3.5.4 Risk management
Table 3.12: Hedging techniques used for managing foreign exchange rate exposure.
Variable Percentage Frequency
Operational hedging techniques used to manage foreign exchange rate exposure
Pricing policies 24.6 33 Changes product mix 2.2 3 Adapting to markets and market segments 11.2 15 Buys factor inputs in the same currency as the exposed income 32.8 44 Choice of the subsidiaries localisation 4.5 6 Invoice the customers partly or totally in NOK 10.4 14 Has moved or planning to move parts of the operation abroad 6.0 8 Borrows or places funds in other currencies 41.0 55 Do not use operational hedging techniques 23.9 32 Other operational techniques 4.5 6 Not answered 0.7 1
Total checked values, excl. Not answered 216 Respondents that checked more than one option 47
Financial hedging techniques/derivatives used to manage foreign exchange rate exposure
Forwards/Futures contracts 75.4 101 Swaps 34.3 46 Options 26.1 35 Do not use financial hedging techniques 17.9 24 Other financial techniques 5.2 7 Not answered 1.5 2
Total checked values, excl. Not answered 213 Respondents that checked more than one option 53
Note. N = 134 Multiple selections are possible. Percentage based on frequency divided with total respondents, not total checked values.

52
The most commonly used operational hedging technique among the respondents is to borrow or
place funds in other currencies (41.0 per cent). Buying factor inputs in the same currency as the
exposed income is the second most frequently selected technique, with 32.8 per cent. Pricing policies
is used by 24.6 per cent, which is almost the same share of respondents who claim to not use
operational hedging techniques at all (23.9 per cent). Adapting to markets and market segments, and
invoice the customers partly or fully in NOK, are both used by approximately 11 per cent. Among the
answers in “Other operational techniques” is making reservations about changes in currencies in
offers to foreign customers.
Forward and futures contracts are used by more than 75 per cent, while swaps are used by almost 35
per cent. Options are also widely used as more than one out of four (26.1 per cent) states that this is
a part of their financial hedging approach.
Table 3.13: The average maturity on the respondents’ derivatives.
Variable Percentage Frequency
The average maturity on the derivatives 0 – 6 months 33.3 36 6 – 12 months 37.0 40 Total short term 70.4 76 1 – 2 years 21.3 23 More than 2 years 6.5 7 Total long term 27.8 30 Not answered 1.9 2
Total 100 108
Note. N = 108 26 respondents did not receive this question due to their answers on the previous question (either said that they do not use financial instruments or left the question unanswered).
Over 70 per cent of the respondents that use financial instruments mostly buy derivatives with a
short horizon. 33.3 per cent of the total mostly buy derivatives with the length of zero to six months,
while 37 per cent choose a length between six and twelve months. 27.8 per cent say that they mainly
buy derivatives with a long term horizon, where a length of between one and two years is the most
common (21.3 per cent).

53
Table 3.14: Main reason why the respondents do not use long term derivatives more frequently.
Variable Percentage Frequency
The main reason why the firms do not use long term derivatives more frequently
Estimates of future cash flow is not good enough 21.1 16 Future transactions are hedged individually 32.9 25 Long term exposure is hedged with operational techniques 15.8 12 Fluctuations in currencies are irrelevant in the long run 2.6 2 It would demand too large positions 9.2 7 It would be too expensive 3.9 3 Other reasons 13.2 10 Not answered 1.3 1
Total 100 76
Note. N = 76 58 (26 + 32) respondents did not receive this question due to their answers on the previous question (either said that they do use long term derivatives or they left the question unanswered).
Most of the respondents do not use long term derivatives more frequently because they hedge
future transactions individually (32.9 per cent). 21.1 per cent said that this was based on problems
with estimating future cash flows. 15.8 per cent use operational techniques to manage currency
fluctuations in the long run, while 9.2 per cent claim that this would demand too large positions in
financial derivatives. The most frequently answer among other reasons is that only short term
exposure is relevant to hedge.
Table 3.15: The most important hedging approach.
Variable Percentage Frequency
Which of the two hedging approaches the respondents considers as the most important
Operational hedging techniques 26.1 24 Financial hedging techniques/derivatives 46.7 43 Equally important 27.2 25
Total 100 92
Note. N = 92 42 respondents did not receive this question since it is only relevant for those who answered that they use both operational and financial hedging techniques.
Almost half of the respondents who use both operational and financial hedging techniques consider
the financial approach as the most important. 26.1 per cent answered that the operational approach
is the most important, while 27.2 per cent consider both of them equally important.

54
3.5.5 Motivation
Table 3.16: The main motivation for managing foreign exchange rate exposure.
Variable Percentage Frequency
The main motivation for managing foreign exchange rate exposure Reduce fluctuations in income and costs in foreign currencies 51.1 47 Reduce fluctuations in cash flows in foreign currencies 19.6 18 Reduce the risk of financial distress 2.2 2 Reduce risk for the owners of the company 17.4 16 Simplify estimates in budgets and planning 1.1 1 Secure liquidity for future projects/investments 1.1 1 Exploit the company's expertise on foreign currencies 1.1 1 Exploit the differences in interest rates in different currencies 0.0 0 Follow the dominating strategy in the industry 1.1 1 Other motivations 5.4 5
Total 100 92
Note. N = 92 42 respondents did not receive this question since it is only relevant for those who answered that they use both operational and financial hedging techniques.
Half of the respondents who use both financial and operational hedging techniques stated that their
main motivation for managing foreign exchange rate exposure is to reduce fluctuations in income
and costs in foreign currencies. 19.6 per cent of the respondents stated that reducing fluctuations in
foreign currency cash flows as the most important reason, with 17.4 per cent answering that their
main motivation is to reduce risk for the company’s owners.
Table 3.17: The main motivation for using operational techniques to manage foreign exchange rate exposure.
Variable Percentage Frequency
The main motivation for using operational techniques to manage foreign exchange rate exposure
Reduce fluctuations in income and costs in foreign currencies 37.5 6 Reduce fluctuations in cash flows in foreign currencies 18.8 3 Reduce the risk of financial distress 12.5 2 Reduce risk for the owners of the company 0.0 0 Simplify estimates in budgets and planning 0.0 0 Secure liquidity for future projects/investments 0.0 0 Exploit the company's expertise on foreign currencies 0.0 0 Exploit the differences in interest rates in different currencies 0.0 0 Follow the dominating strategy in the industry 0.0 0 Other motivations 12.5 2 Not answered 18.5 3
Total 100 16
Note. N = 16 118 respondents did not receive this question since it is only relevant for those who answered that they only use operational hedging techniques.
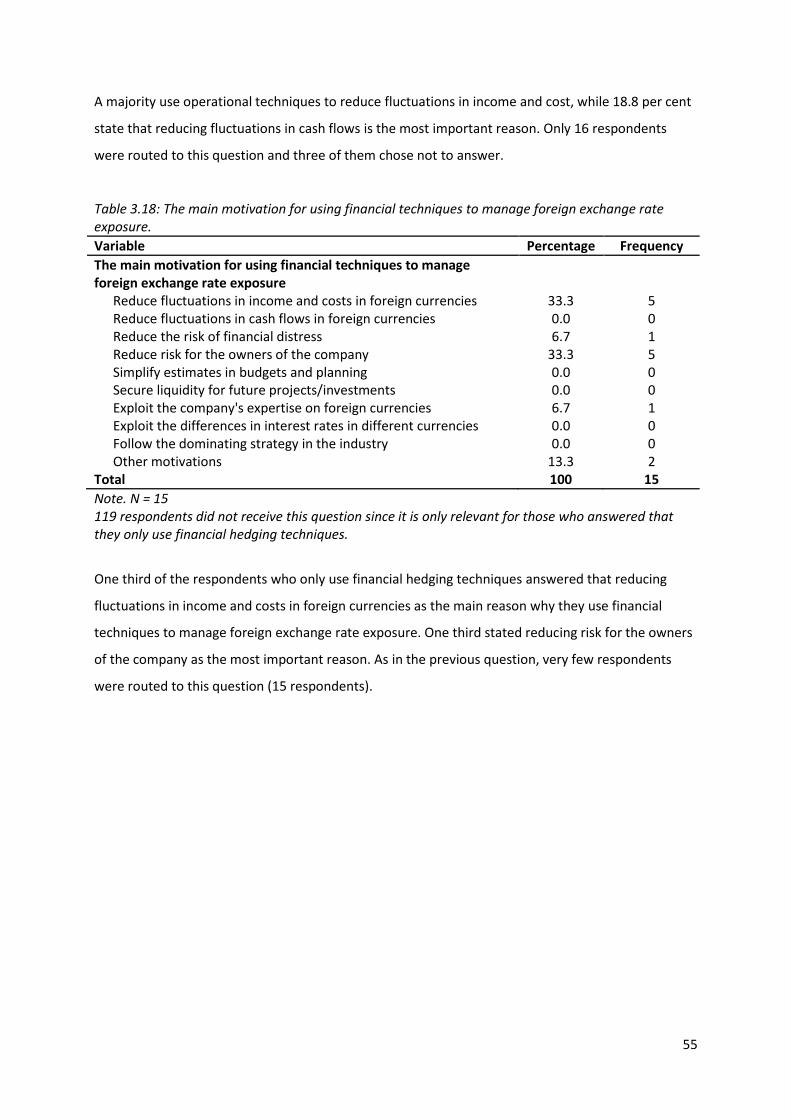
55
A majority use operational techniques to reduce fluctuations in income and cost, while 18.8 per cent
state that reducing fluctuations in cash flows is the most important reason. Only 16 respondents
were routed to this question and three of them chose not to answer.
Table 3.18: The main motivation for using financial techniques to manage foreign exchange rate exposure.
Variable Percentage Frequency
The main motivation for using financial techniques to manage foreign exchange rate exposure
Reduce fluctuations in income and costs in foreign currencies 33.3 5 Reduce fluctuations in cash flows in foreign currencies 0.0 0 Reduce the risk of financial distress 6.7 1 Reduce risk for the owners of the company 33.3 5 Simplify estimates in budgets and planning 0.0 0 Secure liquidity for future projects/investments 0.0 0 Exploit the company's expertise on foreign currencies 6.7 1 Exploit the differences in interest rates in different currencies 0.0 0 Follow the dominating strategy in the industry 0.0 0 Other motivations 13.3 2
Total 100 15
Note. N = 15 119 respondents did not receive this question since it is only relevant for those who answered that they only use financial hedging techniques.
One third of the respondents who only use financial hedging techniques answered that reducing
fluctuations in income and costs in foreign currencies as the main reason why they use financial
techniques to manage foreign exchange rate exposure. One third stated reducing risk for the owners
of the company as the most important reason. As in the previous question, very few respondents
were routed to this question (15 respondents).
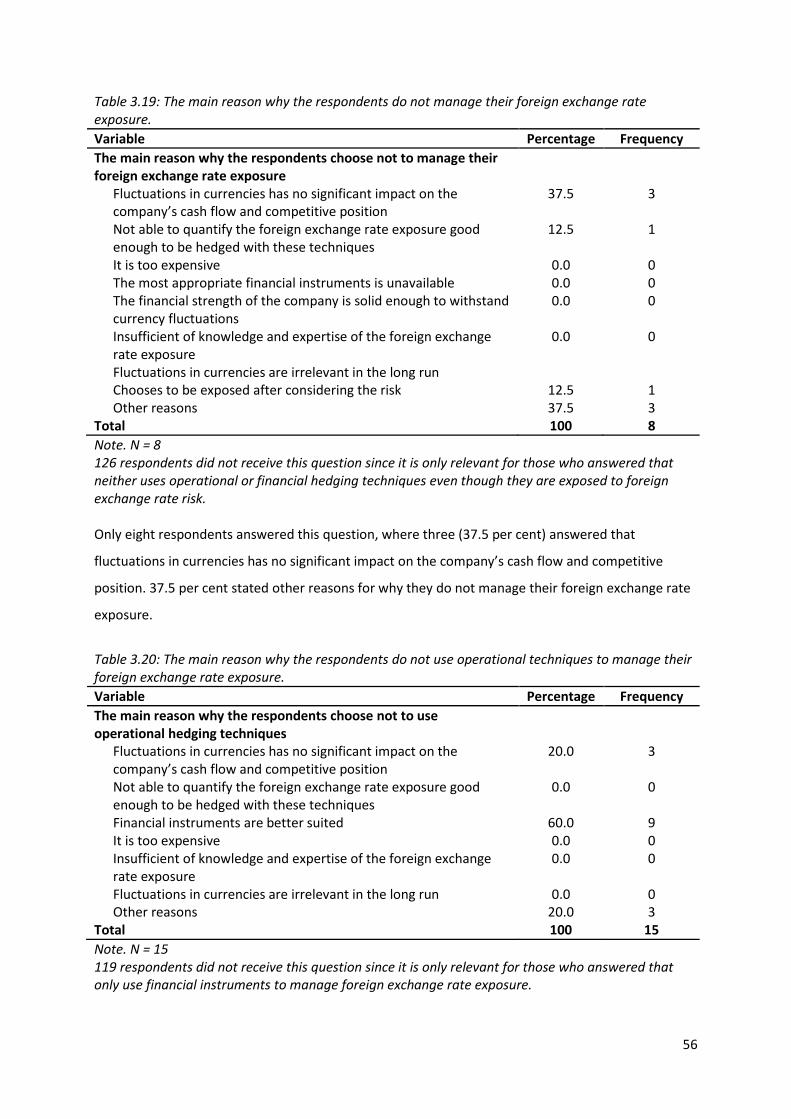
56
Table 3.19: The main reason why the respondents do not manage their foreign exchange rate exposure.
Variable Percentage Frequency
The main reason why the respondents choose not to manage their foreign exchange rate exposure
Fluctuations in currencies has no significant impact on the company’s cash flow and competitive position
37.5 3
Not able to quantify the foreign exchange rate exposure good enough to be hedged with these techniques
12.5 1
It is too expensive 0.0 0 The most appropriate financial instruments is unavailable 0.0 0 The financial strength of the company is solid enough to withstand currency fluctuations
0.0 0
Insufficient of knowledge and expertise of the foreign exchange rate exposure
0.0 0
Fluctuations in currencies are irrelevant in the long run Chooses to be exposed after considering the risk 12.5 1 Other reasons 37.5 3
Total 100 8
Note. N = 8 126 respondents did not receive this question since it is only relevant for those who answered that neither uses operational or financial hedging techniques even though they are exposed to foreign exchange rate risk. Only eight respondents answered this question, where three (37.5 per cent) answered that
fluctuations in currencies has no significant impact on the company’s cash flow and competitive
position. 37.5 per cent stated other reasons for why they do not manage their foreign exchange rate
exposure.
Table 3.20: The main reason why the respondents do not use operational techniques to manage their foreign exchange rate exposure.
Variable Percentage Frequency
The main reason why the respondents choose not to use operational hedging techniques
Fluctuations in currencies has no significant impact on the company’s cash flow and competitive position
20.0 3
Not able to quantify the foreign exchange rate exposure good enough to be hedged with these techniques
0.0 0
Financial instruments are better suited 60.0 9 It is too expensive 0.0 0 Insufficient of knowledge and expertise of the foreign exchange rate exposure
0.0 0
Fluctuations in currencies are irrelevant in the long run 0.0 0 Other reasons 20.0 3
Total 100 15
Note. N = 15 119 respondents did not receive this question since it is only relevant for those who answered that only use financial instruments to manage foreign exchange rate exposure.
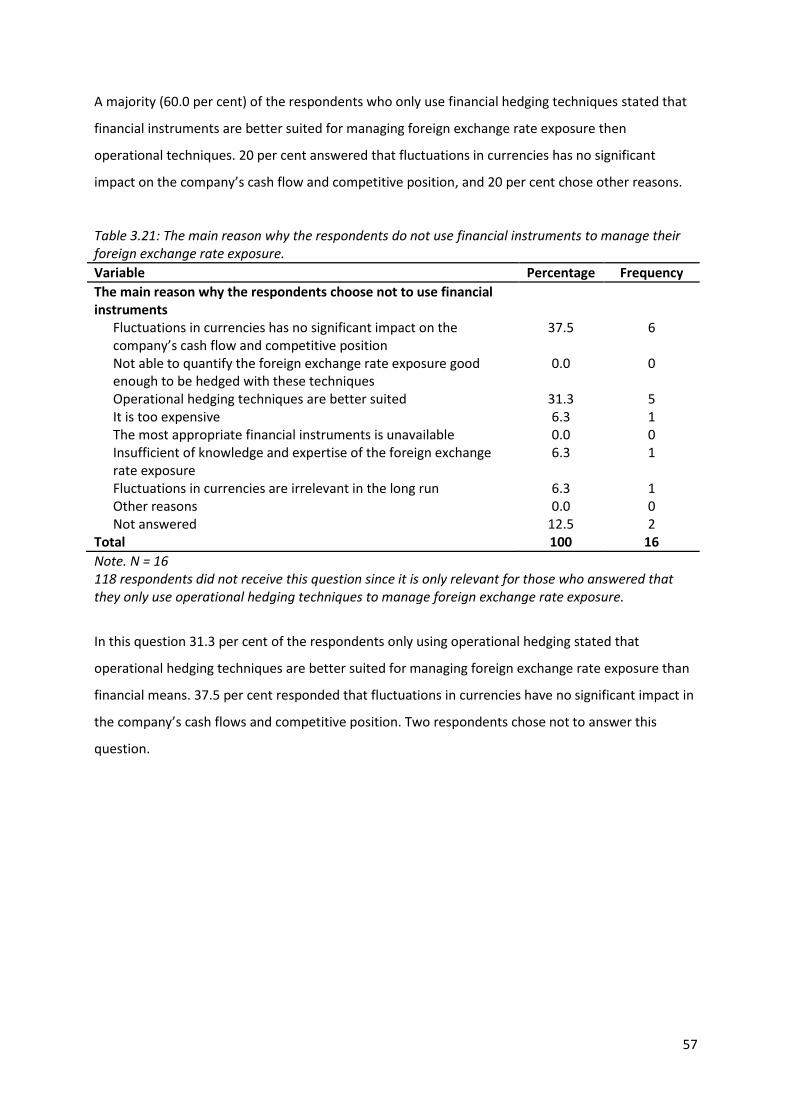
57
A majority (60.0 per cent) of the respondents who only use financial hedging techniques stated that
financial instruments are better suited for managing foreign exchange rate exposure then
operational techniques. 20 per cent answered that fluctuations in currencies has no significant
impact on the company’s cash flow and competitive position, and 20 per cent chose other reasons.
Table 3.21: The main reason why the respondents do not use financial instruments to manage their foreign exchange rate exposure.
Variable Percentage Frequency
The main reason why the respondents choose not to use financial instruments
Fluctuations in currencies has no significant impact on the company’s cash flow and competitive position
37.5 6
Not able to quantify the foreign exchange rate exposure good enough to be hedged with these techniques
0.0 0
Operational hedging techniques are better suited 31.3 5 It is too expensive 6.3 1 The most appropriate financial instruments is unavailable 0.0 0 Insufficient of knowledge and expertise of the foreign exchange rate exposure
6.3 1
Fluctuations in currencies are irrelevant in the long run 6.3 1 Other reasons 0.0 0 Not answered 12.5 2
Total 100 16
Note. N = 16 118 respondents did not receive this question since it is only relevant for those who answered that they only use operational hedging techniques to manage foreign exchange rate exposure.
In this question 31.3 per cent of the respondents only using operational hedging stated that
operational hedging techniques are better suited for managing foreign exchange rate exposure than
financial means. 37.5 per cent responded that fluctuations in currencies have no significant impact in
the company’s cash flows and competitive position. Two respondents chose not to answer this
question.

58
4 Analysis
In the prior chapters we have presented the background for the thesis, earlier research performed in
this field before, some theory surrounding the topic and the methodology used in the thesis. The
following will test each of the hypotheses presented in chapter 1.5, in order to answer the main
problem formulation. The hypotheses testing will be based on the answers from our survey, and
comparison of the results with earlier research.
4.1 Hypotheses testing
Hypothesis 1:
H2: The companies’ main motivation for managing foreign exchange risk is to reduce fluctuations in
income, costs or cash flow.
The respondents were asked directly about their motivation for managing foreign exchange risk in
the survey, by selecting their main motivation for managing foreign exchange risk. This hypothesis is
based on earlier studies by Bodnar et al. (1994, 1995 and 1998), Marshall (1999), Pramborg (2004)
and Børsum and Ødegaard (2005). The results are presented in figure 4.1 below.
Figure 4.1: The companies’ main motivation for managing foreign exchange risk.
120 companies are used as a basis for this analysis. The results from the survey show that 48.3 per
cent of the companies are managing foreign exchange risk with the main purpose of reducing
fluctuations in income or costs in foreign currencies. 17.5 per cent state that reducing fluctuations in
cash flows is their main motivation for managing foreign exchange risk. Combined, those two
alternatives make up over 65 per cent of the answers. This indicates that the largest Norwegian non-
48,3%
17,5%
4,2%
17,5%
1,7%
0,8%
1,7%
0,8%
7,5%
Reduce fluctuations in income or costs
Reduce fluctuations in cash flows
Reduce the risk for financial distress
Reduce the risk for the company owners
Simplify budgeting and planning
Guarantee liquidity to finance future projects
Expliot the company's expertise in exchange rates
Follow dominating practice in the industry
Other

59
financial companies have the same motivation for managing foreign exchange risk as companies in
other countries, and is also in line with what Børsum and Ødegaard (2005) found.36
Hypothesis conclusion
Based on the results above and results from earlier research, the hypothesis seems probable. A large
majority of the companies in the survey manage foreign exchange risk to reduce fluctuations in
income, costs or cash flow in foreign currencies. The hypothesis is accepted.
Hypothesis 2:
H3: The companies have a predefined strategy for managing foreign exchange risk which is defined by
the board of directors or at corporate level in the organisation.
To find out if the companies have a predefined strategy for managing foreign exchange risk, the
respondents were asked to choose the level in the corporate hierarchy that the predefined strategy
is defined, if they have a predefined strategy. The levels are divided into five categories, including a
category for those who do not have a predefined strategy. See figure 4.2 below for the distribution of
the respondents’ answers.
Figure 4.2: The level defining the strategy for managing foreign exchange rate exposure.
A clear majority of the firms in our sample have a predefined strategy. Out of 133 firms, only 7 per
cent do not have a predefined strategy for managing foreign exchange rate exposure. This is
considerably lower than what Børsum and Ødegaard (2005) found. This difference is likely to be
explained by our focus on the largest companies, whereas they focused on companies in all
36
Bodnar et al. (1994, 1995, 1998) and Pramborg (2004)
53 %
37 %
2 %1 % 7 %
Board of directors, general assembly etc.
Corporation level (CEO, CFO etc.)
Division level (Division manager etc.)
Employee level (controller etc.)
Has no predefined strategy

60
segments. It may also be explained by the financial crisis which to a large extent has increased the
respondents’ focus on risk management (see table 3.11, chapter 3.5). This implies that a number of
companies might have allocated resources to predefine a strategy for managing exchange risk. 90
per cent of the firms have a predefined strategy defined by either the board of directors (53 per cent)
or by the management at corporate level of the company (37 per cent). This is in line with Børsum
and Ødegaard’s (2005) results, namely that the companies have a predefined strategy towards
currency risk, typically manifested by the board of directors. It is also supported by Loderer and
Pichler’s (2000) presumptions, saying that the risk management strategy should be set and defined at
the top level of the corporate hierarchy. This should be done to ensure an optimal risk management
strategy and avoid complications between managers that do not have the integral overview needed
to manage the total risk exposure of the company properly.
Hypothesis conclusion
Based on the answers from the survey, a large majority of the largest Norwegian non-financial
companies have a predefined strategy for managing foreign exchange risk. This strategy is (with
hardly any exceptions) defined by the board of directors or by the management in the organisation.
The hypothesis is accepted.
Hypothesis 3:
H4: Short term derivatives are more commonly used than long term derivatives.
To see if short term derivatives are more frequently used than long term, the companies were asked
to state what the typical maturity on their currency derivatives is. In this thesis short term is defined
to be shorter than one year, while long term is one year or longer. The results are presented in figure
4.3 below.
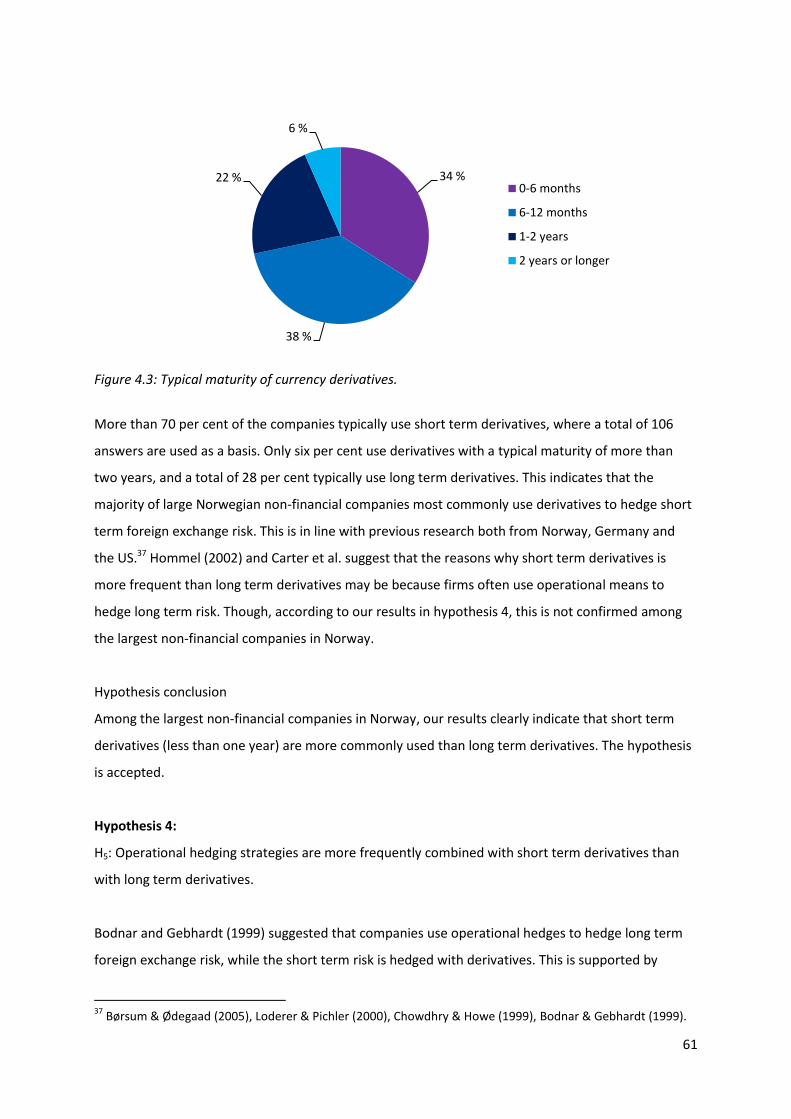
61
Figure 4.3: Typical maturity of currency derivatives.
More than 70 per cent of the companies typically use short term derivatives, where a total of 106
answers are used as a basis. Only six per cent use derivatives with a typical maturity of more than
two years, and a total of 28 per cent typically use long term derivatives. This indicates that the
majority of large Norwegian non-financial companies most commonly use derivatives to hedge short
term foreign exchange risk. This is in line with previous research both from Norway, Germany and
the US.37 Hommel (2002) and Carter et al. suggest that the reasons why short term derivatives is
more frequent than long term derivatives may be because firms often use operational means to
hedge long term risk. Though, according to our results in hypothesis 4, this is not confirmed among
the largest non-financial companies in Norway.
Hypothesis conclusion
Among the largest non-financial companies in Norway, our results clearly indicate that short term
derivatives (less than one year) are more commonly used than long term derivatives. The hypothesis
is accepted.
Hypothesis 4:
H5: Operational hedging strategies are more frequently combined with short term derivatives than
with long term derivatives.
Bodnar and Gebhardt (1999) suggested that companies use operational hedges to hedge long term
foreign exchange risk, while the short term risk is hedged with derivatives. This is supported by
37
Børsum & Ødegaad (2005), Loderer & Pichler (2000), Chowdhry & Howe (1999), Bodnar & Gebhardt (1999).
34 %
38 %
22 %
6 %
0-6 months
6-12 months
1-2 years
2 years or longer

62
Hommel (2002), Carter et al. (2003) and Hansen (2009), who in their research found these to be
complementary strategies. To test if this applies to the firms in our sample, the firms with only
financial hedging, and the firms with both operational hedging and financial hedging are cross-
tabulated against whether they use short term or long term derivatives. If the hypothesis is to be
accepted, one should expect that among the firms with only financial hedging, a larger share of the
firms mainly use long term derivatives, compared to the ones using both financial and operational
hedging. The results are presented in table 4.1 below.
Table 4.1: Hedging approaches vs. derivative maturity. Cross-tabulation.
Variable Short term Long term Total
Only financial hedging 19 5 24 Both financial and operational hedging 57 25 82
Total 76 30 106
χ2 = 0.853, DF = 1, P > 0.1
No more than five companies predominantly use derivatives with long term maturity and use only
financial hedging. Out of 24 firms, this group make up 20.8 per cent. Comparing with the other group
of companies that use both financial and operational hedging, there are 25 companies that mainly
use long term derivatives. Out of 82 firms they make up 30.5 per cent. This result is contradictory of
what one could expect and to what the previously mentioned researchers have found. At the same
time the chi-square test displays no significant results on a 90 per cent confidence level.
Hypothesis conclusion
Based on the analysis above, one cannot accept the hypothesis that operational hedging strategies
are more frequently combined with short term derivatives than with long term derivatives among
the largest non-financial companies in Norway. The hypothesis is rejected.
Hypothesis 5:
H6: There is a high degree of natural hedging among the companies.
The term natural hedging was defined earlier in the thesis. It describes the situation where the
company has almost the same share of income and costs, or assets and debt, in the same foreign
currencies. The result is that a change in one of these accounts would be cancelled by the same
change in the corresponding account, leaving the total exposure to foreign exchange risk closer to

63
zero. Both companies in Norway and the US have in earlier research been found to rely on natural
hedging.38
To structure our findings among the respondents the results are categorised in the following way:
- High degree of natural hedging. Approximately the same share of income and costs or assets
and debt in foreign currencies.
- Medium degree of natural hedging. The respondent selected one of the alternatives closest
to the first (e.g. 51 – 75 per cent of the income and 26 – 50 per cent of the costs are in a
foreign currency).
- Small degree of natural hedging. The respondent selected one of the second closest
alternatives to the first (e.g. 1 – 25 per cent and 51 – 75 per cent).
- Very small degree of natural hedging. The respondent still has both income and costs, or
assets and debt, in foreign currencies, but the shares are hardly corresponding.
Table 4.2: Degree of natural hedging, comparing income and costs.
Variable Percentage Frequency
Degree of natural hedging, comparing income and costs High degree 39.6 53 Medium degree 17.9 24 Small degree 9.7 13 Very small degree 9.0 12 Not at all (one of the inputs is 0 %) 17.9 24 Not relevant (Both of the inputs are 0 %) 0.7 1 Incomplete answer 2.2 3 Not answered 3.0 4
Total 100 134
Note. N = 134
As can be seen from table 4.2 above, almost 40 per cent of the respondents have a high degree of
natural hedging when income and costs in foreign currencies are compared. In total, more than 75
per cent of them are at some degree naturally hedged. To get a better view of the distribution of the
respondents, the results are also shown in figure 4.4 below.
38
Børsum & Ødegaard (2005) and Loderer & Pichler (2000).

64
Figure 4.4: The respondents’ share of income and costs in foreign currencies.
The diagram confirms that most of the respondents are naturally hedged, as they are centralised
along the line in the middle. Natural hedging considering assets and debt is presented in the next
table.
Table 4.3: Degree of natural hedging, comparing assets and debt.
Variable Percentage Frequency
Degree of natural hedging, comparing assets and debt High degree 44.8 59 Medium degree 6.7 9 Small degree 3.7 5 Very small degree 2.2 3 Not at all (one of the inputs is 0 %) 11.9 16 Not relevant (Both of the inputs are 0 %) 21.6 29 Incomplete answer 7.5 10 Not answered 1.5 2
Total 100 134
Note. N = 134
The degree of natural hedging is also tested with the share of assets, compared to the share of debt,
in foreign currencies. Almost 45 per cent have a high degree of natural hedging, while almost 60 per
cent in total are at some degree naturally hedged. It is also worth commenting that it is quite

65
common among the respondents to neither have assets of debt in other currencies, as this includes
over 20 per cent. Also these results are shown graphically in figure 4.5 below.
Figure 4.5: The distribution of the respondents’ share of income and costs in foreign currencies.
The diagram reveals the same result, showing an even smaller spread away from the line in the
middle than in the case with income compared to costs. It also reveals that it is slightly more
common to have debt than to place assets in foreign currencies.
Hypothesis conclusion
Both our own results and earlier studies conducted in Norway by Børsum and Ødegaard (2005), show
that Norwegian companies who are exposed to foreign currencies are to a large extend natural
hedged. This is also claimed for US multinational companies by Loderer and Pichler (2000). Based on
this we conclude that our sample of the largest non-financial companies in Norway have a high
degree of natural hedging. The hypothesis is accepted.
Hypothesis 6:
H7: The number of foreign subsidiaries, and the number of countries they are spread across,
influences the degree of natural hedging and the use of hedging approaches.

66
Earlier literature has shown that multinational companies’ foreign exchange rate exposure and
hedging approaches differ by the number of foreign subsidiaries, and the number of countries they
are spread across.39 To see if this is the case among the largest non-financial companies in Norway,
the respondents who are naturally hedged at any degree are compared with the ones who are not
naturally hedged at all. At the same time the respondents who are only using financial or operational
hedging techniques are compared to those who use both techniques. These effects are controlled by
also including company characteristics as size (determined by revenues), company type and industry.
The analysis is divided into three regressions, where the first includes the total number of foreign
subsidiaries as the dependent variable (table 4.4). In the second regression the number of pure sales
divisions is used as the dependent variable (table 4.5). The third and last regression has the number
of countries the subsidiaries are spread across as the dependent variable (table 4.6). The number of
included respondents in the three regressions is lower than in later regressions, due to the number
of respondents that neither have assets of debt in foreign currencies.
As the dependent variables are describing the number of subsidiaries and countries, the results can
be slightly defiant to interpret. These variables are not ratio variables, as the numbers above five are
categorized in three different groups; 6 – 10, 11 – 20, and More than 20. This means that the results
in the regressions should be seen as number of categories the variable is above or below the
reference group, and not the exact number of subsidiaries or countries. A regression value of 2.877
would therefore mean that the variable has a number of subsidiaries or countries in 2.877 categories
above the references group. The results from the first regression are presented in the table below.
39
Pantzalis et al. (2001), Hommel (2003) and Hansen (2009).

67
Table 4.4: The total number of foreign subsidiaries as dependent variable. Regression.
Independent variables Coeff. Std. error Income and costs naturally hedged(high, medium, small and very small degree)
a
Assets and debt naturally hedged (high, medium, small and very small degree) a
Hedging technique
b
Only using financial hedging techniques Only using operational hedging techniques
Revenues
c
Company type
d
Public limited company
Industry
e
Oil and gas Energy, others Supply Shipping Manufacturing/production Fish industry Other consumer goods Capital goods IT/telecom/media Building/construction/real estate Transportation
Constant
2.877*** 2.339**
0.576 0.970
0.001**
1.925**
-0.854 -3.771***
-1.713 0.732 0.858 -0.767 -0.232 -0.834 0.018 -1.364 -0.530
-0.265
(0.915) (0.894)
(1.068) (0.783)
(0.000)
(0.757)
(1.255) (1.237) (1.814) (1.323) (1.195) (1.715) (1.773) (1.523) (1.770) (1.771) (2.429)
(0.941)
N 86 R
2 0.42
Prob > F 0.000
Note. Regression with robust standard errors. a Reference group is “not naturally hedged”. Unanswered, not relevant and incomplete answers are excluded.
b Reference group is “using both hedging techniques”.
c Change in subsidiaries per 100 million NOK.
d Reference group is “Private limited companies” and “Government sector”.
e Reference group is “other industries”. “Government sector” is excluded (0 respondents only using financial hedging).
* p < 0.1 ** p < 0.05 *** p < 0.01
The results from the regression indicate that natural hedging of income and costs, and assets and
debt, in foreign currencies is affected by the respondent’s total number of foreign subsidiaries. The
respondents that have both income and costs in foreign currencies have answered a number of
subsidiaries that is 2.9 categories above those who lack natural hedging. This is also the case if the
respondents have both assets and debt in foreign currencies, as the naturally hedged respondents’
answer is 2.3 categories above the others. Both of these findings are significant, the first with a p-
value below 0.01 and the latter below 0.05. Also the size and type of company are significantly
affecting the number of subsidiaries, and even when controlling for industry in addition to these the
relation between the number of foreign subsidiaries and natural hedging is significant.
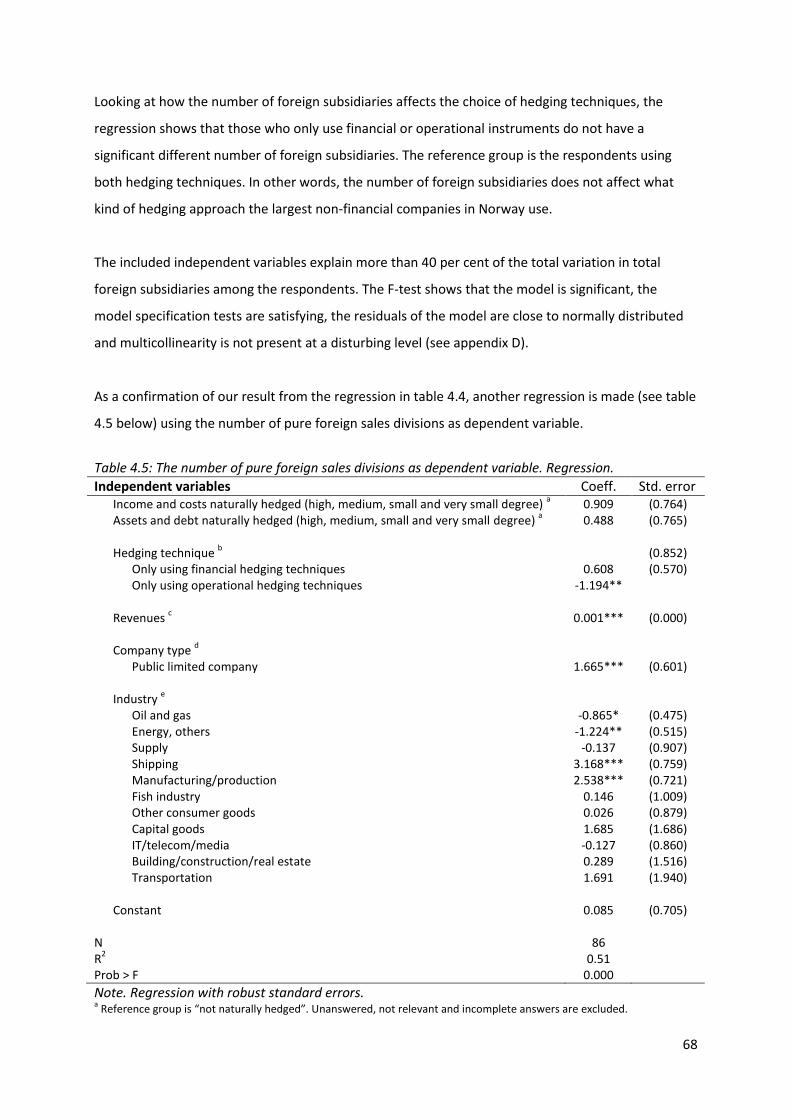
68
Looking at how the number of foreign subsidiaries affects the choice of hedging techniques, the
regression shows that those who only use financial or operational instruments do not have a
significant different number of foreign subsidiaries. The reference group is the respondents using
both hedging techniques. In other words, the number of foreign subsidiaries does not affect what
kind of hedging approach the largest non-financial companies in Norway use.
The included independent variables explain more than 40 per cent of the total variation in total
foreign subsidiaries among the respondents. The F-test shows that the model is significant, the
model specification tests are satisfying, the residuals of the model are close to normally distributed
and multicollinearity is not present at a disturbing level (see appendix D).
As a confirmation of our result from the regression in table 4.4, another regression is made (see table
4.5 below) using the number of pure foreign sales divisions as dependent variable.
Table 4.5: The number of pure foreign sales divisions as dependent variable. Regression.
Independent variables Coeff. Std. error Income and costs naturally hedged (high, medium, small and very small degree)
a
Assets and debt naturally hedged (high, medium, small and very small degree) a
Hedging technique
b
Only using financial hedging techniques Only using operational hedging techniques
Revenues
c
Company type
d
Public limited company
Industry
e
Oil and gas Energy, others Supply Shipping Manufacturing/production Fish industry Other consumer goods Capital goods IT/telecom/media Building/construction/real estate Transportation
Constant
0.909 0.488
0.608 -1.194**
0.001***
1.665***
-0.865* -1.224**
-0.137 3.168*** 2.538***
0.146 0.026 1.685 -0.127 0.289 1.691
0.085
(0.764) (0.765)
(0.852) (0.570)
(0.000)
(0.601)
(0.475) (0.515) (0.907) (0.759) (0.721) (1.009) (0.879) (1.686) (0.860) (1.516) (1.940)
(0.705)
N 86 R
2 0.51
Prob > F 0.000
Note. Regression with robust standard errors. a Reference group is “not naturally hedged”. Unanswered, not relevant and incomplete answers are excluded.

69
b Reference group is “using both hedging techniques”.
c Change in subsidiaries per 100 million NOK.
d Reference group is “Private limited companies” and “Government sector”.
e Reference group is “other industries”. “Government sector” is excluded (0 respondents only using financial hedging).
* p < 0.1 ** p < 0.05 *** p < 0.01
As pure sales divisions most likely generate only a small share of the total amount of costs, they
should not influence the companies’ degree of natural hedging. This is confirmed as those who are
naturally hedged with income and costs, and assets and debt, do not have a significant higher
number of pure sales divisions in foreign countries. What is worth noticing is that the respondents
only using operational hedging techniques has a significant lower number of pure sales divisions in
foreign countries than those using both. Also the size and type of company are significantly affecting
the number of foreign sales divisions, together with some of the industries.
These independent variables explain more than 50 per cent of the total variation in foreign sales
divisions among the respondents. The F-test confirms that the model is significant, and even though
the residuals of the regression are close to normally distributed and the level of multicollinearity is
satisfying, the model specification tests show signs of trouble (see appendix D). Based on this, the
results should be carefully handled.
The last regression in the analysis of this hypothesis uses the total number of countries the foreign
subsidiaries are spread across as dependent variable. The results from this regression are presented
in the table below.

70
Table 4.6: The total number of countries the foreign subsidiaries is spread across as dependent variable. Regression.
Independent variables Coeff. Std. error Income and costs naturally hedged(high, medium, small and very small degree)
a
Assets and debt naturally hedged (high, medium, small and very small degree) a
Hedging technique
b
Only using financial hedging techniques Only using operational hedging techniques
Revenues
c
Company type
d
Public limited company
Industry
e
Oil and gas Energy, others Supply Shipping Manufacturing/production Fish industry Other consumer goods Capital goods IT/telecom/media Building/construction/real estate Transportation
Constant
2.632*** 1.978**
1.158 1.014*
0.001***
1.758**
-1.002 -3.813***
-1.519 0.207 0.476 -1.829 -1.670 -1.739 0.379 -1.479 -0.929
-0.060
(0.724) (0.792)
(0.975) (0.580)
(0.000)
(0.710)
(1.157) (0.996) (1.966) (1.094) (1.104) (1.338) (1.420) (0.865) (1.321) (1.429) (2.368)
(0.799)
N 86 R
2 0.39
Prob > F 0.000
Note. Regression with robust standard errors. a Reference group is “not naturally hedged”. Unanswered, not relevant and incomplete answers are excluded.
b Reference group is “using both hedging techniques”.
c Change in subsidiaries per 100 million NOK.
d Reference group is “Private limited companies” and “Government sector”.
e Reference group is “other industries”. “Government sector” is excluded (0 respondents only using financial hedging).
* p < 0.1 ** p < 0.05 *** p < 0.01
The result from this regression is not very different from the first, as also the number of countries
affects the respondents natural hedging of income and costs, and assets and debt. The ones with
both income and costs in foreign currencies have answered a number of countries that is 2.632
categories above those who lack natural hedging. This is significant with a p-value below 0.01. The
answer of the respondents who have both assets and debt in foreign currencies is 1.978 categories
above those who are not naturally hedged, significant with a p-value below 0.05.
Those who only use operational hedging techniques have subsidiaries in a significant higher number
of countries than those using both (with a p-value below 0.1), while this is not the case with those

71
only using financial hedging. Lastly, also in this regression the size and type of company are
significantly affecting the number of subsidiaries
The included independent variables explain almost 40 per cent of the total variation in the number of
countries among the respondents. Also the F-test of this regression is significant, the model
specification tests are satisfying, the residuals of the model are close to normally distributed and
multicollinearity is not present at a disturbing level (see appendix D).
Hypothesis conclusion
The result from the three regressions on the previous pages show that the number of foreign
subsidiaries and the number of countries they are spread across influence if the respondents are
naturally hedged or not. These differences are all significant at a satisfactory level, and are also
confirmed by Pantzalis et al. (2001) for US multinational companies. When examining the type of
hedging approaches, our results show that the companies who only use operational hedging
techniques have foreign subsidiaries in more countries than the companies who only use financial
derivatives, or the ones using both (at a significant level). In the regression with the number of
foreign subsidiaries as the dependent variable, the type of hedging technique had no significant
effect. Based on this, the hypothesis is partly accepted.
Hypothesis 7:
H8: There is a positive and significant relationship between company size and the use of derivatives.
According to Bodnar and Gebhardt (1999), the size of the multinational companies in Germany and
the US affects their use of derivatives. Also Børsum and Ødegaard (2005) claim that larger companies
are more competent and have more resources and time to spare when considering derivatives. To
see if this also is the case for the largest non-financial companies in Norway, a regression placing the
respondents’ revenues as the dependent variable, and the type of hedging approach as the
independent variable, is performed. The results are also controlled for company type and industry.
The results can be viewed in table 4.7 below.
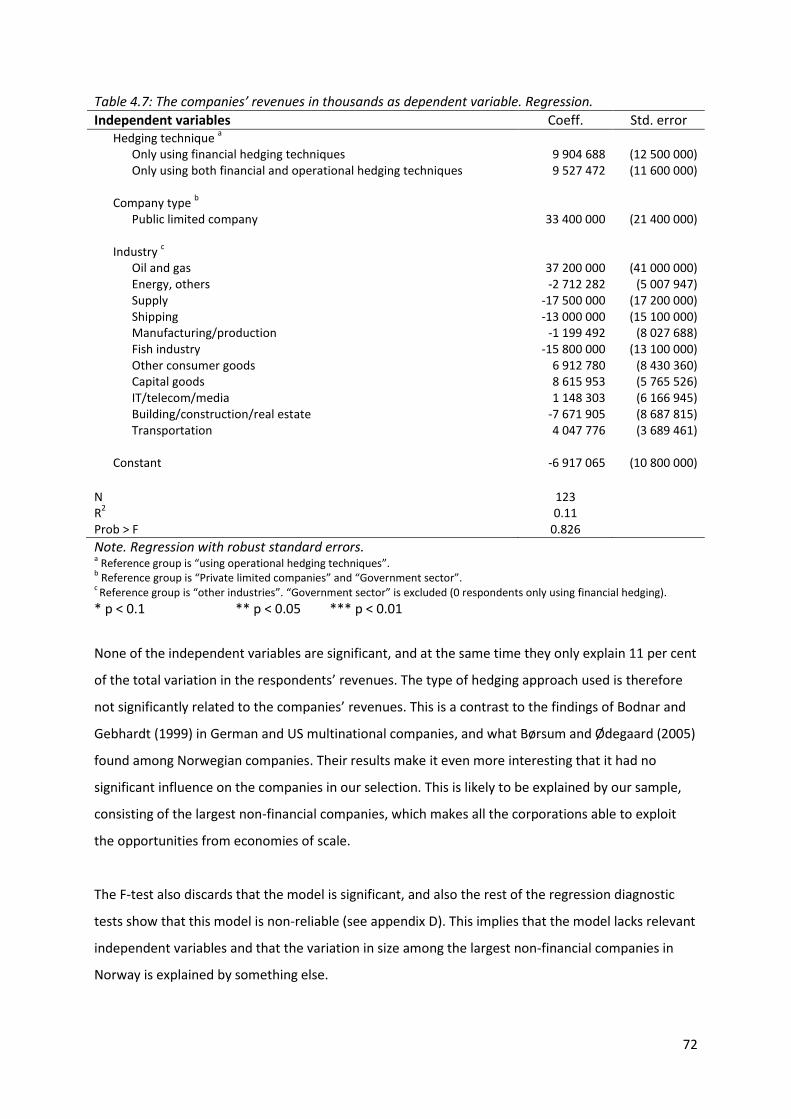
72
Table 4.7: The companies’ revenues in thousands as dependent variable. Regression.
Independent variables Coeff. Std. error Hedging technique
a
Only using financial hedging techniques Only using both financial and operational hedging techniques
Company type
b
Public limited company
Industry
c
Oil and gas Energy, others Supply Shipping Manufacturing/production Fish industry Other consumer goods Capital goods IT/telecom/media Building/construction/real estate Transportation
Constant
9 904 688 9 527 472
33 400 000
37 200 000 -2 712 282
-17 500 000 -13 000 000
-1 199 492 -15 800 000
6 912 780 8 615 953 1 148 303
-7 671 905 4 047 776
-6 917 065
(12 500 000) (11 600 000)
(21 400 000)
(41 000 000) (5 007 947)
(17 200 000) (15 100 000)
(8 027 688) (13 100 000)
(8 430 360) (5 765 526) (6 166 945) (8 687 815) (3 689 461)
(10 800 000)
N 123 R
2 0.11
Prob > F 0.826
Note. Regression with robust standard errors. a Reference group is “using operational hedging techniques”.
b Reference group is “Private limited companies” and “Government sector”.
c Reference group is “other industries”. “Government sector” is excluded (0 respondents only using financial hedging).
* p < 0.1 ** p < 0.05 *** p < 0.01
None of the independent variables are significant, and at the same time they only explain 11 per cent
of the total variation in the respondents’ revenues. The type of hedging approach used is therefore
not significantly related to the companies’ revenues. This is a contrast to the findings of Bodnar and
Gebhardt (1999) in German and US multinational companies, and what Børsum and Ødegaard (2005)
found among Norwegian companies. Their results make it even more interesting that it had no
significant influence on the companies in our selection. This is likely to be explained by our sample,
consisting of the largest non-financial companies, which makes all the corporations able to exploit
the opportunities from economies of scale.
The F-test also discards that the model is significant, and also the rest of the regression diagnostic
tests show that this model is non-reliable (see appendix D). This implies that the model lacks relevant
independent variables and that the variation in size among the largest non-financial companies in
Norway is explained by something else.

73
Hypothesis conclusion
Using the applied regression as foundation for the analysis of this hypothesis, the results clearly
indicate that there is no significant relation between the revenues of the largest non-financial
companies in Norway and the use of derivatives. Based on this, the hypothesis is rejected.
Hypothesis 8:
H9: Companies in energy, commodity and shipping industries are more sophisticated in their use of
derivatives than companies in other industries.
The term “sophisticated” is measured by a larger share of respondents using financial hedging
techniques, and at the same time using more types of derivatives. First we will perform a cross-
tabulation, comparing if the companies are using financial or operational hedging techniques solely,
or both of them combined, against if they are a part of energy, commodity and shipping industries or
not. Second, the regression analysis tests if the companies in energy, commodities and shipping
industries use more types of derivatives than the other industries.
Based on previous research from both Norway and other countries, the hypothesis implies that
companies in energy, commodities and shipping industries more commonly use financial derivatives,
and a combination of more types of these, than the other industries.40 This is tested through the use
of a cross-tabulation and reveals if there is any difference in hedging approaches. In the cross-
tabulation, the industries are categorised into two categories; energy, commodities and shipping,
and other industries.
40
Børsum & Ødegaard (2005), Bodnar et al. (1995) and Chowdhry & Howe (1999).

74
Table 4.8: Hedging approaches vs. industry. Cross-tabulation.
Variable
Other industries
Energy, commodities and shipping
Total
Only financial hedging 14 11 25 Only operational hedging 14 4 18 Both financial and operational hedging 58 25 83
Total 86 40 126
χ2 = 2.587, DF = 2, P > 0.1
Figure 4.6: Comparing derivative usage in energy, commodities and shipping with other industries.
Even though the cross-tabulation does not serve a very clear result, figure 4.7 shows that the largest
share in both categories are using both financial and operational hedging. In the reference category
including all other industries than energy, commodities and shipping, the number of respondents
that use either financial or operational hedging alone is exactly the same. They both consist of 16 per
cent of the total respondents in the category. Among the companies in energy, commodities and
shipping industries, the results are slightly different. Here only 10 per cent state that they only use
operational hedging techniques, while 28 per cent answered that they only use financial instruments.
Even so, the Chi-square test performed on the cross-tabulation discards the results as they are not
significant within a 90 per cent confidence level.
Moving on, the regression below tests if the companies in energy, commodities and shipping
industries use more types of derivatives than the other industries. The dependent variable is the
number of types of derivatives used, while industry is the independent variable, controlled for
company type and size. The results in this regression are also controlled for what currency the
respondents are most exposed to, due to their possible relation to the type of derivatives. The
reference group of the industry dummy variables are the industries excluded from the regression.
The reason for excluding all other industries is to show the effect of the energy, commodity and
shipping industries relative to all of them, and not only one.

75
Table 4.9: The number of types of derivatives used as dependent variable. Regression.
Independent variables Coeff. Std. error Industry
a
Oil and gas Energy, others Shipping Fish industry
Company type b
Public limited company
Revenues
c
Hedging technique
d
Only using financial hedging techniques Only using operational hedging techniques
Currency the respondents are the most exposed to
e
Euro Dollar Pound sterling Nordic currencies
Constant
-0.361* 0.046
1.426*** 0.272
0.029
-0.00013
1.214*** 1.455***
-0.097 0.106 -0.255 -0.056
0.287
(0.196) (0.311) (0.296) (0.331)
(0.186)
(0.000)
(0.231) (0.187)
(0.255) (0.277) (0.279) (0.315)
(0.276)
N 123 R
2 0.45
Prob > F 0.000
Note. Regression with robust standard errors. a
Reference group is all other industries than the ones included in the regression. b Reference group is “Private limited companies” and “Government sector”.
c Change in subsidiaries per 100 million NOK.
d Reference group is “only using operational hedging techniques”.
e Reference group is “other currencies”.
* p < 0.1 ** p < 0.05 *** p < 0.01
The results from the regression show that companies in the shipping industry use almost 1.5 more
types of derivatives than the industries that are excluded from the regression (significant with a p-
value below 0.01). Another interesting finding is that companies in the oil industry use fewer types of
derivatives than the reference group. The companies in other energy and fish industries do not use a
significantly different number of types of derivatives than the industries excluded from the
regression. The industry in the reference group that mainly affects these results is
manufacturing/production, due to the high number of respondents. These results are partly
confirming the results of energy and shipping companies found by Børsum and Ødegaard (2005), but
not the findings of Bodnar et al. (1995) and Chowdhry and Howe (1999) regarding US multinational
companies in the commodity industry.

76
The independent variables included in the regression explain 45 per cent of the total variation in the
dependent variable and the F-test of the model is significant. All of the regression diagnostic tests are
showing a satisfying result, though the test of normal distribution among the residuals shows a small
deviation from what is optimal (see appendix D).
Hypothesis conclusion
The result from the cross-tabulation do not show that there is a significant difference in the
derivatives usage among companies in energy, commodities and shipping industries (clustered
together), and the other industries in our selection. On the other hand, in the regression the
respondents in the shipping industry alone are using significantly more types of derivatives than the
reference group, while companies in the oil and gas industry use fewer. Based on this, the hypothesis
is partly accepted.
77
5 Conclusion
The purpose of this thesis was to investigate how the largest non-financial companies in Norway
manage their foreign exchange rate exposure. This was done through the use of a survey distributed
to the largest non-financial firms in Norway.
The results from the analysis clearly indicate that the largest non-financial companies in Norway have
a predefined strategy for managing foreign exchange risk, and that this strategy is defined at
corporate level or by the board of directors. This confirms what Loderer and Pichler (2000)
recommends, implying that only the CEOs and top level management have the integral view and the
information needed to optimise the risk management. Our results also show that the main
motivation for managing foreign exchange risk is to reduce fluctuations in income, costs or cash flow.
This is in line with previous international studies, and Børsum and Ødegaard (2005) who found that
86 per cent of the Norwegian companies in their survey had reducing fluctuations in income and
costs as their main goal.41
Short term derivatives (shorter than one year) are more commonly used than long term derivatives
among the respondents in our survey. This is in line with previous research both from Norway,
Germany and the US, which indicates that this applies for the largest non-financial companies in
Norway.42 The hypothesis regarding operational hedging strategies being more frequently combined
with short term derivatives than with long term derivatives was on the other hand rejected. This is a
contradiction to the results from Bodnar and Gebhardt’s (1999) research among US and German
non-financial firms. Our analysis leaves us unable to confirm that this is the case among the largest
non-financial companies in Norway.
The analysis confirms that natural hedging is common among the largest non-financial companies in
Norway. This tells us that the companies have almost the same share of income and costs, and/or
assets and debt, in the same foreign currencies. The result is expected, as this also was the case in
Børsum and Ødegaard (2005), and Loderer and Pichler’s (2000) studies of companies in Norway and
the US respectively. Our analysis also shows that the number of foreign subsidiaries, and the number
of countries they are spread across, influences natural hedging. This is also confirmed by Pantzalis et
al. (2001) for US multinational companies. When examining the type of hedging approaches, our
41
According to Bodnar et al. (1994, 1995, 1998) and Pramborg (2004), the companies in USA and Korea focuses on reducing volatility in cash flows, while companies in Sweden reduce fluctuations in income and costs. 42
Børsum & Ødegaad (2005), Loderer & Pichler (2000), Chowdhry & Howe (1999), Bodnar & Gebhardt (1999).

78
results show that the companies who only use operational hedging techniques have foreign
subsidiaries in more countries than the companies who only use financial derivatives, or the ones
using both.
There is no significant relation between the size of the company, measured by revenues, and the use
of derivatives among the largest non-financial companies in Norway. This is not in line with what
Bodnar and Gebhardt (1999) found among German and US multinational companies, and Børsum
and Ødegaard (2005) found among Norwegian companies. This is likely to be explained by our
sample, consisting of the largest non-financial companies, which probably makes all the corporations
able to exploit the opportunities from economies of scale. When looking at the variation in derivative
usage among the industries, our results show that shipping companies use more types of derivatives
than other industries. The companies in the oil and gas industry use significantly fewer types of
derivatives than the other industries (all though the difference is small). This was unexpected, as
Børsum and Ødegaard (2005) found that both oil and gas, and shipping industries were using more
derivatives with a longer horizon than other industries. Bodnar et al. (1994, 1995, 1998) and
Chowdhry and Howe (1999) also found that companies in the commodity industry use more
derivatives than other industries, but this is not significant in our analysis.
Answering the thesis’ main problem formulation, the largest non-financial companies in Norway have
a predefined strategy for managing foreign exchange risk, which is defined by the board of directors
or by the management in the organisation. The companies’ main motivation for managing foreign
exchange risk is to reduce fluctuations in income, costs or cash flow, and short term derivatives are
more commonly used than derivatives with a long horizon. They also have a high degree of natural
hedging, which is influenced by the number of foreign subsidiaries and the number of countries they
are spread across. Those who only use operational hedging techniques have subsidiaries in more
countries than those only using financial derivatives and those using both. The companies in the
shipping industry use more types of derivatives than the other industries, while companies in the oil
and gas industry use less.

79
5.1 Other interesting results from the survey In this subchapter we will list other interesting results from the survey, which is not tested with
hypotheses due to lack of previous empirical support. Even though these results are excluded from
the conclusion of the main problem formulation, they are still providing a broader understanding on
foreign exchange risk management among the largest non-financial companies in Norway.
Almost 25 per cent of the respondents in the survey stated that they are not exposed to foreign
currencies, even though they are among the largest non-financial companies in Norway.
The currency that most of the respondents are primarily exposed to is Euro, followed by US Dollars in
second and Nordic currencies (SEK, DKK and ISK) in third.
The most frequently used method to measure foreign exchange rate exposure among the
respondents is Cash Flow and/or Value at Risk analysis.
30 per cent of the respondents have increased their focus on foreign exchange rate management, as
a consequence of the financial crisis. The remaining companies have not changed their focus.
Borrowing or placing funds in other currencies is the most frequently used operational hedging
technique, followed by buying factor inputs in the same currency as the exposed income, and pricing
policies.
Forward/Futures contracts are the most frequently used financial hedging technique, followed by
swaps as the second and options as the third.
A majority of the respondents who use both operational and financial hedging techniques consider
the financial approach as the most important.
Short term derivatives are more frequently used among the respondents mainly because future
transactions are hedged individually.
80
5.2 Limitations In this study of foreign exchange risk management among the largest non-financial companies in
Norway, some delimitations have been set while some limitations have occurred.
First of all, the target sample was restricted to the 500 largest companies in Norway ranked by their
revenues in 2008.43 This was done deliberately, due to the fact that larger companies are more likely
to be exposed to foreign exchange risk, thus providing us with data about foreign exchange risk
management. Still, it can be questioned if the 500 largest companies in fact are representative of the
largest companies in Norway. Perhaps should even more (fewer) companies been included
(excluded) in the sample.
Contact information was attainable for the majority of the companies in the sample, but for some
firms the contact information was unavailable. It would also be optimal to get the e-mail addresses
to the person best suited to answer the survey. In regards to this, the answers of the survey may
have been influenced by the person answering the survey (CEO, CFO, Controller or information
director).
One drawback when sending out the survey to the large companies may be the danger that some of
them are not managing foreign exchange risk on a parent company level, but rather in the individual
subsidiaries. At the same time, the individual subsidiaries may not be large enough on their own to
be included in the sample. As a result of this, there is a risk that some companies have answered that
they are not exposed to foreign exchange risk, even though they are indirectly exposed via the
subsidiaries.
It should be mentioned that there is a small possibility that several questionnaires was sent out to
the same company. We did discover some duplicates (e.g. same company, but different names) in
the sample list, but a lot of time was used in order to eliminate this problem.
The questionnaire was written in Norwegian, and not English. This was a deliberate choice from our
side, to minimise the risk of any misunderstandings which could potentially lead to distorted answers
and lower the validity of the study. Even though we have tried to the largest extent possible to
eliminate any translation errors, it should be mentioned that some words and expressions might
43
http://www.norgesstorstebedrifter.no

81
have been slightly warped or lost in translation. Also, there is always a risk that some of the
respondents may have misunderstood or had problems understanding some of the questions.
Based on some of the answers, a few respondents seemed to have problems with understanding the
difference between operational and financial hedging. If we were to send out the survey again, we
would have defined the difference between operational and financial hedging more clearly in the
beginning of the questionnaire. This would have clarified any misunderstandings regarding those
expressions.
Another limitation is the choice of having interval variables in the question about number of foreign
subsidiaries and number of countries. This was done to ease the effort and time needed by the
respondents. In retrospect, the most favourable would have been ratio variables. This would made
interpretation of the results from the regression analysis more uncomplicated and intuitive.
When analysing the degree of natural hedging among the companies, we have looked at the share of
income vs. the share of costs, and the share of assets vs. the share of debt in foreign currency.
Theoretically, when e.g. the costs and income are denominated in the same currency, one of these
accounts would be cancelled by the same change in the corresponding account, leaving the total
exposure to foreign exchange risk closer to zero. One limitation regarding the question on this
subject is the possibility that the firms do not necessarily have the income and costs in the same
foreign currency. This may lead to slightly misleading results, because a firm may e.g. have income in
USD and costs in EUR.

82
5.3 Further research Further research beyond what is presented in this thesis is desirable, and may well provide additional
insight to the foreign exchange risk management of the largest non-financial companies in Norway.
A comparative study where a sample of small and/or medium sized companies is compared to the
sample of the largest firms may yield interesting results. It would be interesting to see if there are
any systematic differences in how large and smaller companies manage their foreign exchange rate
exposure.
A country comparison may also be interesting, distributing the survey to the largest non-financial
companies in other countries. This may provide country specific differences, and contribute to a
better understanding and interpretation of the results achieved in this thesis.
Another alternative is to repeat the survey sometime in the future, and test if there have been any
changes in methods or motivation. This will provide additional insight in the development of how the
companies are managing their foreign exchange rate exposure. Perhaps the continuing development
of financial derivative markets results in the companies shifting from operational hedges to more
financial hedges.
One possible study could be a more qualitative approach, using a sample of the firms and perform in-
depth interviews with the respondents. This opens the possibility for more qualitative questions, and
may provide additional insight about the thoughts and motivations behind the companies risk
management strategy and policy. This also allows for the possibility to clarify any misunderstandings
that may occur with the use of standardised questionnaires.
Another possible study could be based on the use of derivatives among Norwegian companies, e.g.
to compare derivative usage for hedging foreign exchange exposure, interest rate risk and
commodity risk up against each other, or to look more closely on currency hedging solely.
Information about this may be found in annual reports (at least for the public traded companies),
which could be used as a basis for a quantitative study, but in general, detailed data about this may
be hard to get.
If one could get data on the specific quantity of currency derivatives being used by each company,
this could be useful. This would provide the possibility to test derivative usage against firm size in
another fashion then what is done in this thesis and previous studies.

83
References
Alkebäck, P. & Hagelin, N., Derivative usage by nonfinancial firms in Sweden with an International
comparison. Journal of International Financial Management and Accounting, 10 (2), pp. 105-120.
Allayannis, G. & Ofek, E., 1997. Exchange rate exposure, hedging, and the use of foreign currency
derivatives. Working paper series 1998, NYU Stern: Department of Finance.
Bartram,S. Dufey, G. & Frenkel, M., 2005. A primer on the exposure of non-financial corporations to
foreign exchange rate risk. Journal of Multinational Finance Management, 15 (4), pp. 394-413.
Bodie, Z. Kane, A. & Marcus, A., 2005. Investments. 7th ed., New York: McGraw-Hill/Irwin.
Bodnar, G.M. & Gebhardt, G., 1999. Derivatives usage in risk management by U.S. and German non-
financial firms: A comparative survey. Journal of International Financial Management and
Accounting, 10 (3), pp. 153-187.
Bodnar, G.M. & Gentry, W.M., 1993. Exchange rate exposure and industry characteristics: Evidence
from Canada, Japan and the USA. Journal of International Money and Finance, 12 (1), pp. 29-45.
Bodnar, G.M. Hayt, G.S. & Marston, R.C., 1996. 1995 Wharton Survey of Derivatives Usage by U.S.
Non-Financial Firms. Financial Management, 25 (4), pp. 113-133.
Bodnar, G.M. Hayt, G.S. & Marston, R.C., 1998. 1998 Wharton Survey of Financial Risk Management
by US Non-Financial Firms. Financial Management, 27 (4), pp. 70-91.
Bodnar, G.M. Hayt, G.S. Marston, R.C. & Smithson, C.W., 1995. Wharton Survey of Derivatives Usage
by U.S. Non-Financial Firms. Financial Management, 24 (2), pp. 104-114.
Brealey, R.A. Myers, S.C & Allen, F., 2008. Principles of corporate finance. 9th ed., New York: McGraw-
Hill /Irwin.
Carter, D.A., Pantzalis, C. & Simkins, B.J., 2003. Asymmetric exposure to foreign-exchange risk:
Financial and real option hedges implemented by U.S. multinational corporations (February 14,
2003). Available at SSRN: http://ssrn.com/abstract=387082
Carter, D.A. Pantzalis, C. & Simkins, B.J., 2001. Firmwide risk management of foreign exchange
exposure by U.S. multinational corporations (January 8, 2001). Available at SSRN:
http://ssrn.com/abstract=255891
Chakraborty, A. & Barkoulas, J. T., 1999. Dynamic futures hedging in currency markets. The European
Journal of Finance, 5 (4), pp. 299-314.

84
Chan, W. H., 2008. Dynamic hedging with foreign currency futures in the presence of jumps. Studies
in Nonlinear Dynamics & Econometrics, 12 (2), pp. 1-23.
Choi, J.J. & Prasad, A.M., 1995. Exchange risk sensitivity and its determinants: A firm and industry
analysis of U.S. multinationals. Financial Management, 24 (3), pp. 77-88.
Chowdhry, B. & Howe, J.T.B., 1999. Corporate risk management for multinational corporations:
Financial and operational hedging policies. European Finance Review, 2 (2), pp. 229-246.
Damodaran, A., 2002. Investment valuation, 2nd ed., New York : John Wiley & Sons, Inc.
Etteman, D.K. Stonehill, A.I. & Moffet, M.H., 2004. Multinational Business Finance, 10th ed., Pearson
Education, Inc (Pearson Addison Wesley).
Glaum, M., 1990. Strategic management of exchange rate risks. Long Range Planning, 23 (4), pp. 65-
72.
Goetzman, W.N. & Kumar, A., 2008. Equity portfolio diversification. Review of Finance, 12 (3), pp.
433-463.
Gripsrud, G. & Olsson, U.H., 2000. Markedsanalyse, 2nd ed., Kristiansand: Høyskoleforlaget AS –
Norwegian Academic Press.
Hansen, M.A., 2009. An empirical study of strategic approaches to foreign exchange risk
management used by Danish medium-sized non-financial companies. Master thesis, Aarhus School of
Business, University of Aarhus.
Hardy, M.A., 1993. Regression with dummy variables. Sage University paper series in quantitative
applications in the social sciences. pp. 7-93. Newbury Park, CA: Sage.
Hau, H., 1999. Comment on ‘Corporate risk management for multinational corporations: Financial
and operational hedging policies’. European Finance Review, 2 (2), pp. 247-249.
Hommel, U., 2002. Financial versus operative hedging of currency risk. Global Finance Journal, 14 (1),
pp. 1-18.
Jorion, P., 1990. The exchange-rate exposure of U.S. multinationals. Journal of Business, 63 (3), pp.
331-345.
Koller, T. Goedhart, M. & Wessels, D., 2005. Valuation, 4th ed., Hoboken, New Jersey: John Wiley &
Sons, Inc.
Lioui, A. & Poncet, P., 2002. Optimal currency risk hedging. Journal of International Money and
Finance, 21 (2), pp. 241-264.

85
Loderer, C. & Pichler, K., 2000. Firms, du you know your currency risk exposure? Survey results.
Journal of Empirical Finance, 7 (3), pp. 317-344.
Marshall, A. P., 1999. Foreign exchange risk management in UK, USA and Asia Pacific multinational
companies. Journal of Multinational Financial Management, 10 (2), pp. 185-211.
Pantzalis, C., Simkins, B.J. & Laux, P.A., 2001. Operational hedges and the foreign exchange exposure
of U.S. multinational corporations. Journal of International Business Studies, 32 (4), pp. 793-812.
Polkovnichenko, V., 2005. Household portfolio diversification: A case for rank-dependent
preferences. Review of Financial Studies, 18 (4), pp. 1467-1502.
Poomimars, P., Cadle, J. & Theobald, M., 2003. Futures hedging using dynamic models of the
variance/covariance structure. Journal of Futures Markets, 23 (3), pp. 241-260.
Pramborg, B., 2004. Foreign exchange risk management by Swedish and Korean nonfinancial firms: A
comparative survey. Pacific-Basin Finance Journal, 13 (3), pp. 343-366.
Ringdal, K., 2001. Enhet og mangfold. 1st ed., Bergen: Fagbokforlaget.
Saltvedt, T.M. & Knudsen, N.K., 2009. Risikostyring – Før og etter finanskrisen. Magma, 08.2009, pp.
63-70.
Shin, H. & Soenen, L. 1998. Exposure to currency risk by US multinational corporations. Journal of
Multinational Financial Management, 9 (2), pp. 195-207.
Thrane, C. , 2003. Regresjonsanalyse i praksis. 1st ed., Kristiansand: Høyskoleforlaget.
Villonga, B. & Amit, R., 2006. How do family ownership, control and management affect firm value?
Journal of Financial Economics, 80 (2), pp. 385-417.
Internet references Findexia Forlag
http://www.findexaforlag.no
(Accessed February 9th 2010)
Investopedia: Currency carry trade
http://www.investopedia.com/terms/c/currencycarrytrade.asp
(Accessed April 15th 2010)
Kunnskapssenteret: Hypoteseprøving
http://www.kunnskapssenteret.com/articles/2654/1/Hypoteseproving/Hypoteseproving.html
(Accessed April 26th 2010)

86
Norges Bank
http://www.norges-bank.no
(Accessed Mars 15th 2010)
Norges Største Bedrifter
http://www.norgesstorstebedrifter.no
(Accessed February 9th 2010)
Questback
http://www.questback.com
(Accessed February 9th 2010)
Magma: Risikostyring – Før og etter finanskrisen
http://www.sivil.no/magma/2009/08/0111.html
(Accessed April 13th 2010)
Stata Web Books: Regression with Stata
http://www.ats.ucla.edu/stat/stata/webbooks/reg
(Accessed May 12th 2010)
World Bank
http://www.worldbank.org/financialcrisis
(Accessed April 15th 2010)
87
Appendices
Appendix A: E-mail distributed to the respondents First e-mail distributed to the respondents:
Hei,
Vi er to masterstudenter ved Norges Handelshøyskole (NHH), hvor vi for tiden skriver en avsluttende
masterutredning innenfor profilen finansiell økonomi. I den forbindelse håper vi at du finner tid til å
hjelpe oss med å svare på en kort, nettbasert undersøkelse om valutaeksponering og valutasikring.
Målet med oppgaven er å kartlegge valutaeksponering, samt sikring av valutarisiko blant de største
bedriftene i Norge. Dette emne er lite forsket på i norsk kontekst og derfor interessant å studere
grundigere. Dersom det er ønskelig vil et kort og informativt sammendrag hvor undersøkelsens
viktigste resultater inngår, være tilgjengelig gjennom å ta kontakt med en av undertegnede.
Undersøkelsen er beregnet til å ta maksimalt ca 5 minutter, og alle svar blir behandlet anonymt.
Vi setter stor pris på at du tar deg tid til å besvare undersøkelsen. Har du spørsmål, ikke nøl med å ta
kontakt.
På forhånd takk!
Med vennlig hilsen
Krister Eriksen – [email protected] – 415 12 959
Ola Wedøe – [email protected] – 977 97 564
Reminder distributed to the respondents:
Hei igjen, Vi har registrert at din bedrift ikke har besvart vår undersøkelse om valutaeksponering sendt ut for en måned siden. Vi har full forståelse for at din hverdag er hektisk, men håper likevel du vil hjelpe oss med å få en bedre forståelse for valutasikring i et norsk perspektiv.
OBS! Dersom din bedrift ikke er eksponert mot valuta vil vi sette stor pris på om du svarer dette i spørsmål tre. Spørreundersøkelsen vil deretter bli avsluttet. Som tidligere beskrevet er målet vårt med masterutredningen å kartlegge valutaeksponering, samt sikring av valutarisiko blant de største bedriftene i Norge. Det har tidligere vært lite forskning på dette blant norske bedrifter, som etter vår mening vil tilsi at ditt bidrag også vil være interessant utenfor rammene av en masterutredning. Dersom det er ønskelig vil et kort og informativt sammendrag hvor undersøkelsens viktigste resultater inngår, være tilgjengelig gjennom å ta kontakt med en av undertegnede.

88
Undersøkelsen er nettbasert, beregnet til å ta maksimalt ca 5 minutter, og alle svar blir behandlet anonymt. Vi setter stor pris på at du tar deg tid til å besvare undersøkelsen. Har du spørsmål, ikke nøl med å ta kontakt. På forhånd takk! Med vennlig hilsen Krister Eriksen – [email protected] – 415 12 959 Ola Wedøe – [email protected] – 977 97 564
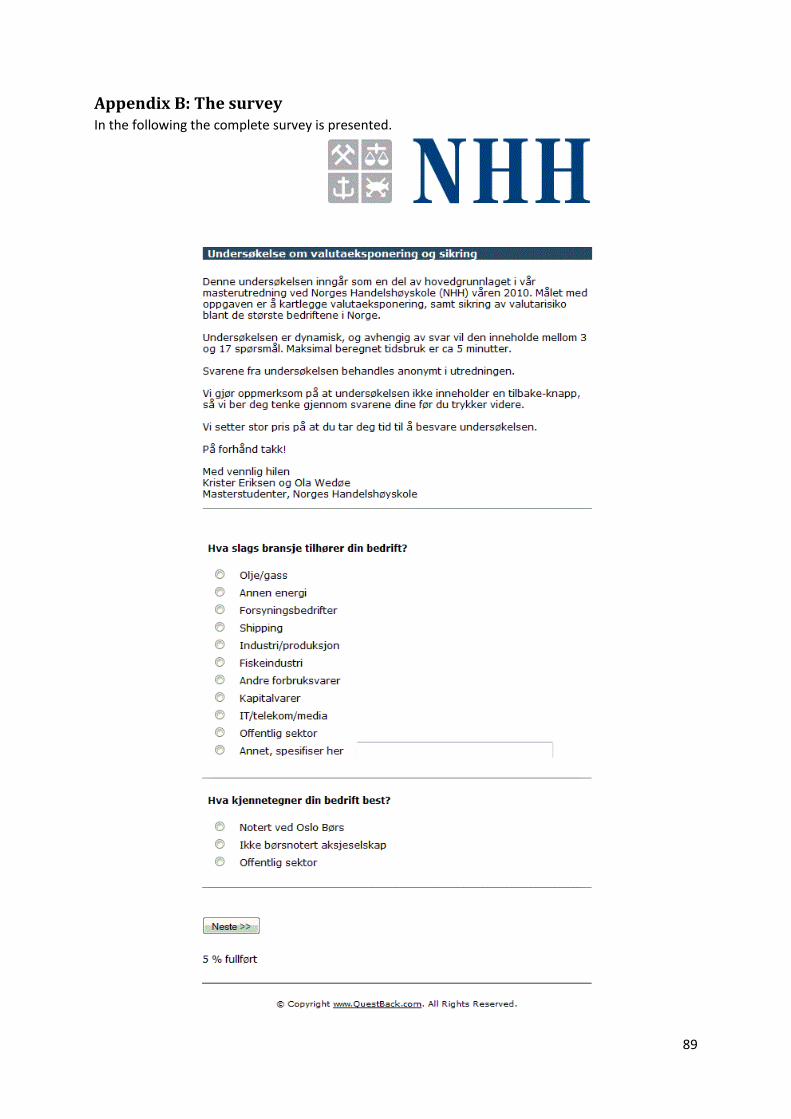
89
Appendix B: The survey In the following the complete survey is presented.
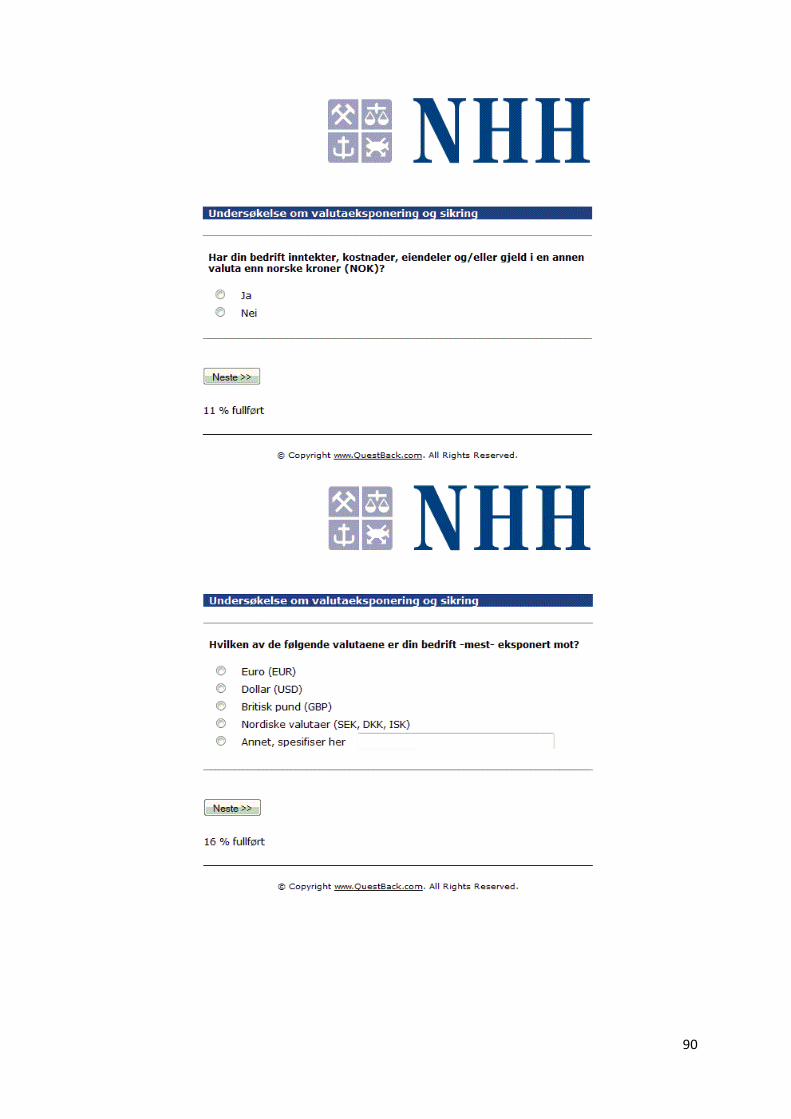
90

91

92

93

94
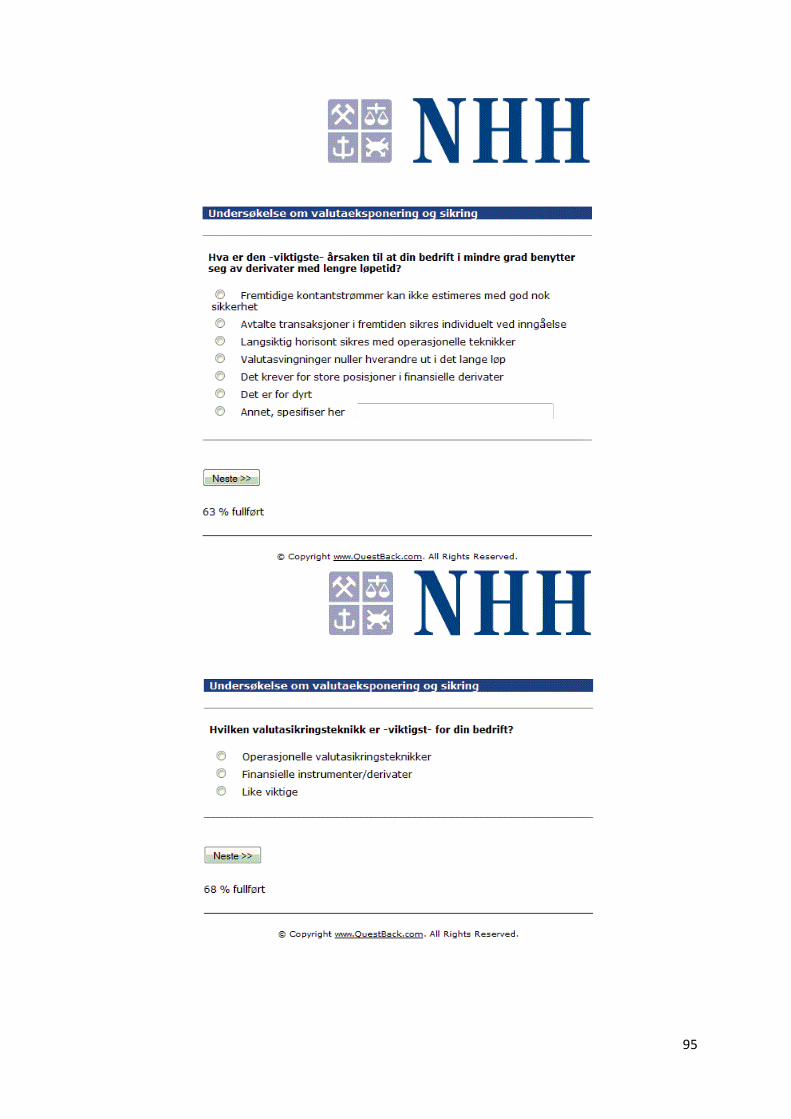
95

96

97

98

99
Appendix C: The complete sample # Company 1 Statoil ASA Hovedkontor
2 Telenor ASA Hovedkontor
3 Yara International ASA
4 Norsk Hydro ASA Konsern
5 ExxonMobil Exploration and Production Norway AS
6 Orkla ASA Hovedkontor
7 Aker Solutions ASA Konsern
8 Total E&P Norge AS Contracts
9 Helse Sør-Øst Rhf
10 Norgesgruppen ASA Hovedkontor
11 A/S Norske Shell Hovedkontor
12 Reitangruppen AS
13 ConocoPhillips Norge Konsern
14 DnB NOR ASA
15 Stx Europe AS
16 Nordea Bank Norge ASA Konsern
17 Storebrand ASA Hovedkontor
18 Coop Norge SA
19 Norske Skogindustrier ASA Hovedkontor
20 Coop Norge Handel AS Hovedkontor
21 Statkraft SF Konsern
22 Eni Norge AS
23 Vital Forsikring ASA
24 TINE BA Hovedkontor
25 Veidekke ASA Hovedkontor
26 Wilh. Wilhelmsen ASA
27 Helse Vest RHF
28 Ica Norge AS Hovedkontor
29 Nortura Sa
30 National Oilwell Norway AS
31 Gjensidige Forsikring BA Hovedkontor
32 Atea ASA Hovedkontor
33 MøllerGruppen AS
34 Schibsted ASA Konsern
35 Helse Midt-Norge RHF
36 Marine Harvest ASA
37 Petroleum Geo-Services ASA
38 Posten Norge AS
39 Eksportfinans ASA
40 SAS Scandinavian Airlines Norge AS
41 If Skadeforsikring Hovedkontor
42 Seadrill Norge AS
43 Scandinavian Bunkering AS
44 Helse Nord RHF
45 Kongsberg Gruppen ASA Hovedkontor
46 Hafslund ASA Hovedkontor
47 Rolls-Royce Marine AS Head Office
48 Norsk Tipping AS
49 Expert AS
50 Felleskjøpet Agri BA
51 Jotun AS Hovedkontor
52 Norges Statsbaner AS
53 Aktieselskapet Vinmonopolet
54 Cermaq ASA
55 Høegh Autoliners Shipping AS
56 Skanska Norge AS Hovedkontor
57 Det Norske Veritas Stiftelsen Hovedkontor
58 O. N. Sunde AS
59 Camillo Eitzen & Co ASA
60 Kommunalbanken AS
61 Elkem AS
62 Kongsberg Automotive Holding ASA
63 Laco AS
64 Odfjell Se
65 ABB AS Hovedkontor
66 Bonheur ASA
67 Torvald Klaveness Rederiaksjeselskapet
68 BP Norge AS
69 Renewable Energy Corporation ASA
70 ExxonMobil Production Norway Inc
71 Bama Gruppen AS
72 Varner-Gruppen AS Hovedkontor
73 Norsk Medisinaldepot AS Hovedkontor
74 Moelven Industrier ASA Hovedkontor
75 Aibel AS
76 NetCom AS
77 Ullevål universitetssykehus Hf
78 Kongsberg Automotive AS
79 Avinor AS
80 Agder Energi AS Konsern
81 Rikshospitalet Hf
82 Helse Bergen HF
83 Umoe Gruppen AS
84 Aker ASA
85 St Olavs Hospital Hf
86 Idemitsu Petroleum Norge AS
87 Uno-X Energi AS
88 Grieg Star Shipping AS
89 ISS Facility Services AS

100
90 Norwegian Air Shuttle ASA
91 Norges Råfisklag Hovedkontor
92 Lerøy Seafood Group ASA
93 Sparebanken Vest Hovedkontor
94 Sykehuset Innlandet Hf
95 NCC Construction AS Konsern
96 Eltek ASA Hovedkontor
97 AF Gruppen ASA Konsern
98 Optimera AS Hovedkontor
99 Fred Olsen Energy ASA
100 ErgoGroup AS Hovedkontor
101 Nexans Norway AS Hovedkontor
102 Brødrene Dahl AS Hovedkontor
103 Livsforsikringsselskapet Nordea Liv Norge AS Hovedkontor
104 SpareBank 1 Livsforsikring AS Hovedkontor
105 Siemens AS
106 Eramet Norway AS
107 Alcoa Norway ANS
108 Apotek 1 Norge AS
109 Dong E&P Norge AS
110 Den Norske Stats Husbank Hovedkontor
111 Rieber & Søn ASA Hovedkontor
112 Universitetssykehuset Nord-Norge HF
113 Ahlsell Norge AS Hovedkontor
114 A-pressen AS
115 Kverneland ASA
116 Choice Hotels Scandinavia AS
117 SpareBank 1 Nord-Norge Hovedkontor
118 Apokjeden Distribusjon AS
119 Tandberg ASA
120 Elkjøp Norge AS
121 Byggmakker Norge AS
122 Lyse Energi AS
123 Norsk Rikskringkasting AS Hovedkontor
124 Komplett ASA Hovedkontor
125 Statens Lånekasse for Utdanning Hovedkontor
126 Statnett SF
127 Enterprise Oil Norge AS
128 Toyota Norge AS
129 Tts Group ASA
130 GDF SUEZ E&P NORGE AS
131 Ineos Bamble AS
132 Bergenshalvøens Kommunale Kraftselskap AS Hovedkontor
133 Austevoll Seafood ASA
134 EDB Business Partner Norge AS
135 YIT AS
136 Helse Stavanger HF
137 KLP Kreditt AS
138 Scancem International ANS
139 Sørlandet sykehus HF
140 Halliburton AS
141 Schenker AS
142 Akershus Universitetssykehus Hf
143 Skretting AS
144 H & M Hennes & Mauritz AS Hovedkontor
145 Stiftelsen Norsk Rikstoto
146 Norsk Scania AS Hovedkontor
147 E- Co Energi AS
148 BN Bank ASA
149 GE Healthcare AS
150 Eidsiva Energi AS
151 Tomra Systems ASA
152 Sykehuset Østfold HF
153 Løvenskiold-Vækerø AS Hovedkontor
154 Baker Hughes Norge AS
155 Hess Norge AS
156 Fjordkraft AS
157 Siba Norge, Filial Av Siba Ab Sverige
158 Nord-Trøndelag Elektrisitetsverk (NTE) Hovedkontor
159 Store Norske Spitsbergen Kulkompani AS
160 WesternGeco AS
161 Alliance Unichem Norge AS
162 Acergy Norway AS
163 Veolia Miljø AS
164 Fokus Bank Hovedkontor
165 Ewos AS Hovedkontor
166 E A Smith AS Hovedkontor
167 TGS Nopec Geophysical Company ASA
168 Adecco Norge AS Hovedkontor
169 Jernia AS
170 Ulsmo AS
171 Tide ASA
172 Ferd Holding AS
173 Plantasjen ASA
174 Hafslund Nett AS
175 Nammo AS
176 Harald Sætre AS Rederiet
177 Fugro-Geoteam AS
178 Coop Trondheim og Omegn BA Hovedkontor
179 Sparebanken Hedmark Hovedkontor
180 Sør-Norge Aluminium AS
101
181 Sparebanken Møre Hovedkontor
182 Kleven Maritime AS
183 Bergen Bunkers AS
184 Visma AS
185 Hurtigruten ASA
186 Farstad Shipping ASA
187 Hafslund Strøm AS
188 Tele2 Norge AS
189 Bilia Personbil AS
190 Reinertsen AS
191 Kruse Smith Gruppen AS
192 E.ON Ruhrgas Norge AS
193 Aker Universitetssykehus Hf
194 E-CO Vannkraft AS
195 Scana Industrier ASA Hovedkontor
196 Wartsila Norway AS Hovedkontor
197 Sandnes Sparebank Hovedkontor
198 Norsk Stål AS Hovedkontor
199 Transocean Offshore (North Sea) Ltd
200 Widerøe's Flyveselskap AS
201 Hewlett-Packard Norge AS Hovedkontor
202 Fjord1 Nordvestlandske AS
203 Nordlandssykehuset HF
204 Statsbygg
205 TV 2 Gruppen AS
206 Aker Seafoods ASA Konsern
207 Tollpost Globe AS
208 Technip Norge AS
209 KB Gruppen Kongsvinger AS
210 Alliance Healthcare Norge AS
211 Subsea 7 Norway
212 SG Finans AS Hovedkontor
213 AS Agra Industrier
214 Ekornes ASA Hovedkontor
215 J E Ekornes AS
216 Sykehuset Buskerud Hf
217 Wenaasgruppen AS
218 Kruse Smith Entreprenør AS
219 SINTEF
220 Oslo Bolig og Sparelag Hovedkontor
221 AGR Group ASA
222 Saferoad AS
223 Gk Konsern AS
224 Onninen AS Hovedkontor
225 Kollektivtransportproduksjon AS
226 Elektroskandia Norge AS
227 Kleven Verft AS
228 SpareBank 1 SR-Bank Hovedkontor
229 Troms Kraft AS
230 Sparebanken Sør Hovedkontor
231 Bladcentralen ANS
232 Skjeggerød AS
233 Coca-Cola Drikker AS
234 Heidenreich Holding AS
235 Aegis Media Norge AS Hovedkontor
236 Carat Norge AS
237 Chr. Hansen AS Norsk avd. av utenlandsk foret
238 NordlandsBanken ASA Hovedkontor
239 M-I Swaco Norge AS
240 Sykehuset Telemark HF
241 I. K. Lykke AS Konsern
242 Coop Orkla Møre Sa
243 BKK Produksjon AS
244 Steen & Strøm AS
245 Mestergruppen AS Konsern
246 Vetco Gray Scandinavia AS
247 Relacom AS
248 Ving Norge AS
249 Peab Norge AS
250 Europris Holding AS
251 Rica Hotels AS
252 Kitron ASA
253 Olav Thon Eiendomsselskap ASA
254 Ikm Gruppen AS
255 Norway Pelagic ASA
256 Bauda AS Konsern
257 Helse Fonna HF
258 Solstad Offshore ASA
259 Sykehuset i Vestfold Hf
260 Johan G Olsen AS
261 Grieg Maturitas AS
262 Ford Motor Norge AS Konsern
263 Helse Sunnmøre HF
264 Laerdal Medical AS
265 Wallenius Wilhelmsen Logistics AS
266 Wilson ASA
267 Ulstein Verft AS Hovedkontor
268 Odim ASA
269 Torghatten ASA
270 Kraft Foods Norge AS Hovedkontor
271 Selvaag Gruppen AS
272 Nordic Paper AS
273 Felleskjøpet Rogaland Agder
274 GNT Norway AS
102
275 Helse Nord Trøndelag HF
276 Coop Hordaland BA
277 Nte Energi AS
278 Manpower AS Hovedkontor
279 Ventelo Bedrift AS
280 Cubus AS Hovedkontor
281 Sparebanken Pluss Hovedkontor
282 Fatland AS
283 Verdens Gang AS Hovedkontor
284 Solar Norge AS
285 Sykehuset Asker og Bærum Hf
286 Volvo Maskin AS Hovedkontor
287 Nordek AS
288 Norconsult Holding AS
289 Kuoni Scandinavia AB NUF
290 Helse Nordmøre og Romsdal HF
291 Sykehusapotekene Hf
292 Heimdal Gruppen AS
293 Handicare AS
294 Norwegian Property ASA
295 Kasu AS
296 Brødr. Sunde AS Hovedkontor
297 Framo Engineering AS
298 Denofa AS
299 Leonhard Nilsen & Sønner As
300 Byggma ASA
301 Havyard Leirvik AS Konsern
302 Salmar Processing AS
303 Heli-One Norway AS
304 Rezidor Hotels Norway AS
305 Sparebanken Sogn og Fjordane Hovedkontor
306 Gyldendal ASA
307 Grenland Group ASA
308 InfoCare AS
309 Pareto AS
310 Jackon Holding AS
311 Coop Nord BA Hovedkontor
312 Nergård AS
313 Seawell AS
314 Bjørge ASA Hovedkontor
315 Forbrukersamvirket Sør BA Hovedkontor
316 Salmar ASA
317 CargoNet AS Hovedkontor
318 Kavli Holding AS Hovedkontor
319 Volvo Personbiler Norge AS
320 Bankenes Betalingssentral AS
321 Star Tour AS Hovedkontor
322 BMW Norge AS
323 SAS Ground Services Norway AS
324 Glamox ASA Konsern
325 PriceWaterhouseCoopers AS
326 Nordea Eiendomskreditt AS Hovedkontor
327 Nycomed Pharma AS Hovedkontor
328 GC Rieber AS
329 Hent AS
330 Gard Marine & Energy Limited
331 Accenture AS
332 Esso Energi AS Konsern
333 Ernst & Young AS Hovedkontor
334 Fesil AS
335 Beerenberg Corp AS
336 T S Eiendom AS Konsern
337 T. Stangeland Maskin AS
338 Cappelen Damm AS
339 Norgesenergi AS
340 Bolig- og Næringskreditt AS Hovedkontor
341 Odfjell Drilling Management AS
342 Telefast AS
343 Umoe Ikt AS
344 Coop Økonom BA Hovedkontor
345 Johs. Rasmussen AS Hovedkontor
346 Grieg Seafood ASA
347 Knutsen Bøyelaster Vi KS
348 Electrolux Home Products Norway AS Hovedkontor
349 Alstom Norway AS
350 Södra Cell Tofte AS
351 Clas Ohlson AS
352 Eniro Norge AS Hovedkontor
353 DHL Express (Norway) AS
354 British American Tobacco Norway AS
355 Nordic Intertrade AS
356 Coop Vestfold og Telemark BA Hovedkontor
357 Bis Industrier AS
358 Peterson Linerboard AS Moss
359 Green Reefers ASA
360 AL Gartnerhallen Hovedkontor
361 Eidsiva Vannkraft AS
362 Brødrene Risa AS
363 Det Norske Diakonhjem
364 Skanem AS Hovedkontor
365 Aller Media AS Konsern
366 Lefdal Elektromarked AS
367 Energiselskapet Buskerud AS

103
368 Coop Vest BA
369 Euro Sko Norge AS
370 Wintershall Norge ASA
371 Dno International ASA
372 Rasmussengruppen AS
373 LeasePlan Norge AS
374 Jakob Hatteland Holding AS
375 Asko Nord AS
376 Roxar ASA
377 Helse Finnmark HF
378 Coop Haugaland BA Hovedkontor
379 Securitas AS
380 Kitron AS
381 Itegra AS
382 CHC Norway AS
383 Entra Eiendom AS
384 Norway Royal Salmon AS
385 Glava AS Hovedkontor
386 Agder Ops Vegselskap AS
387 Bkk Nett AS
388 Voice Norge AS
389 Arcus-gruppen AS
390 Spenncon AS Hovedkontor
391 Istad AS Hovedkontor
392 Pronova BioPharma Norge AS
393 Legula AS
394 West Contractors AS
395 GET AS
396 Coop Innlandet BA
397 Oceaneering AS
398 Scandinavian Business Seating Group AS
399 Jysk AS Hovedkontor
400 Abg Sundal Collier Holding ASA
401 Abg Sundal Collier Norge ASA
402 Nordfjord Kjøtt AS
403 HelgelandsKraft AS Hovedkontor
404 Hjemmet Mortensen AS Hovedkontor
405 Bonnier Publications International AS
406 ESS Support Services AS
407 Contiga AS Hovedkontor
408 Seaborn AS
409 Terina AS
410 Jm Byggholt AS Konsern
411 Bring Frigoscandia AS Hovedkontor
412 Neumann Bygg AS
413 Mccann Worldgroup AS
414 Pon Equipment AS Hovedkontor
415 Hansa Borg Bryggerier AS
416 Kuehne + Nagel AS
417 Solstad Rederi AS
418 Helgeland Sparebank Region Nord Hovedkontor
419 DSV Road AS Konsern
420 Viken Skog BA Konsern
421 General Motors Norge AS
422 Bergen Group Fosen Yard AS
423 Helgelandssykehuset HF
424 Øie AS
425 Ruukki Profiler AS
426 Norgros Handel AS
427 Protan AS Hovedkontor
428 Bautas AS
429 Fatland Ølen AS
430 Bw Offshore AS
431 Terra Gruppen AS
432 Lovisenberg Diakonale Sykehus AS
433 Heidenreich AS Hovedkontor
434 Diakonhjemmet Sykehus AS
435 Møller Bil Vest AS
436 Dresser-Rand AS
437 Mediaedge Cia Norway AS
438 Rutebileiernes Standardiseringsaksjeselskap Konsern
439 SCA Hygiene Products AS Hovedkontor
440 Capgemini Norge AS Hovedkontor
441 Oslo Børs Vps Holding ASA
442 Tieto Norway AS
443 Hamworthy Gas Systems AS
444 Tafjord Kraft AS
445 Saint-Gobain Byggevarer AS
446 Aker Reinertsen AS
447 Knutsen Shuttle Tankers Pool AS
448 Havila Shipping ASA
449 Kappahl AS
450 Norsildmel Innovation AS
451 AGA AS Hovedkontor
452 Apply Leirvik AS
453 Multiconsult AS Konsern
454 Eidsiva Marked AS
455 Macgregor Hydramarine AS
456 Xstrata Nikkelverk AS
457 Lindex AS Hovedkontor
458 Handelshøyskolen BI
459 A-K maskiner AS
460 Fjord1 Fylkesbaatane AS

104
461 Jordan AS Hovedkontor
462 Linstow AS
463 Pon Power AS Hovedkontor
464 North Cape Minerals AS
465 Vizada AS
466 Coop Sambo BA Hovedkontor
467 Bristow Norway AS
468 J. Martens AS
469 Shell International Pipelines Inc
470 Vakt Service AS
471 Chess Communication AS Hovedkontor
472 Reservoir Exploration Technology ASA
473 Stens Invest AS
474 Volvo Aero Norge AS
475 EuroPark AS
476 Boliden Odda AS Hovedkontor
477 Draka Norsk Kabel AS Hovedkontor
478 Bergene Holm AS
479 Ømf Holding AS
480 Eastern Bulk Carriers AS
481 Malermestrenes Andelslag Hovedkontor
482 MAN Last og Buss AS Hovedkontor
483 Würth Norge AS
484 Fujitsu Technology Solutions AS
485 Deepocean AS
486 Ge Vingmed Ultrasound AS
487 Network Norway AS
488 SpareBank 1 Buskerud-Vestfold Hovedkontor
489 Unicon AS Hovedkontor
490 Tdc AS
491 Nte Marked AS
492 Aspelin-Ramm Gruppen AS Konsern
493 Reitan Servicehandel Norge AS
494 Schneider Electric Norge AS
495 Diplom-Is AS Hovedkontor
496 Aktiv Kapital ASA
497 Lemminkäinen Norge AS Hovedkontor
498 Malthus AS Hovedkontor
499 Strøm Gundersen AS
500 DVB Bank SE Nordic Branch

105
Appendix D: Regression diagnostic tests
Hypothesis 6: Regression Ref. table 4.4
Ref. table 4.5
_cons -.2649277 .9408828 -0.28 0.779 -2.14243 1.612575 B_trans -.5295195 2.429449 -0.22 0.828 -5.37741 4.318371 B_bygganei -1.364075 1.771158 -0.77 0.444 -4.898366 2.170217 B_ITkommed .0176132 1.770196 0.01 0.992 -3.514758 3.549984 B_kap -.834233 1.523415 -0.55 0.586 -3.87416 2.205694 B_forbruk -.2319135 1.77345 -0.13 0.896 -3.770779 3.306952 B_fisk -.7670941 1.714609 -0.45 0.656 -4.188544 2.654356 B_indust .8583389 1.194603 0.72 0.475 -1.525455 3.242133 B_ship .7319137 1.323139 0.55 0.582 -1.908369 3.372196 B_forsyn -1.712882 1.813736 -0.94 0.348 -5.332136 1.906372 B_aneregy -3.770811 1.237266 -3.05 0.003 -6.239736 -1.301886 B_olje -.8544011 1.254982 -0.68 0.498 -3.358678 1.649876 kjen_bors 1.924724 .7569873 2.54 0.013 .4141791 3.435269 omsetn_100m .0006054 .0002369 2.56 0.013 .0001327 .0010781 ant_kunop .9702084 .783321 1.24 0.220 -.5928844 2.533301 ant_kunfin .5758984 1.067774 0.54 0.591 -1.554812 2.706609hyp7_eiegjld 2.338959 .8940048 2.62 0.011 .5550002 4.122918 hyp7_innt 2.876517 .9150859 3.14 0.002 1.050491 4.702542 Q5 Coef. Std. Err. t P>|t| [95% Conf. Interval] Robust
Root MSE = 2.839 R-squared = 0.4159 Prob > F = 0.0000 F( 17, 68) = 9.83Linear regression Number of obs = 86
_cons .0845366 .7054449 0.12 0.905 -1.323157 1.49223 B_trans 1.691287 1.939835 0.87 0.386 -2.179594 5.562168 B_bygganei .2891091 1.516062 0.19 0.849 -2.736146 3.314364 B_ITkommed -.1273483 .8598454 -0.15 0.883 -1.843143 1.588447 B_kap 1.685205 1.686058 1.00 0.321 -1.679271 5.049681 B_forbruk .025827 .8788779 0.03 0.977 -1.727947 1.7796 B_fisk .1462042 1.009119 0.14 0.885 -1.867461 2.15987 B_indust 2.538333 .7211875 3.52 0.001 1.099225 3.97744 B_ship 3.167801 .7594649 4.17 0.000 1.652313 4.68329 B_forsyn -.136938 .9074944 -0.15 0.881 -1.947815 1.673939 B_aneregy -1.224174 .515121 -2.38 0.020 -2.252082 -.1962658 B_olje -.86494 .47475 -1.82 0.073 -1.812289 .0824088 kjen_bors 1.665406 .6011429 2.77 0.007 .4658442 2.864968 omsetn_100m .0009375 .0002654 3.53 0.001 .0004078 .0014671 ant_kunop -1.19437 .5696175 -2.10 0.040 -2.331024 -.0577158 ant_kunfin .6078201 .8515688 0.71 0.478 -1.091459 2.307099hyp7_eiegjld .4882381 .7645673 0.64 0.525 -1.037432 2.013908 hyp7_innt .9089315 .7642162 1.19 0.238 -.6160382 2.433901 Q6 Coef. Std. Err. t P>|t| [95% Conf. Interval] Robust
Root MSE = 2.3313 R-squared = 0.5072 Prob > F = 0.0000 F( 17, 68) = 6.60Linear regression Number of obs = 86
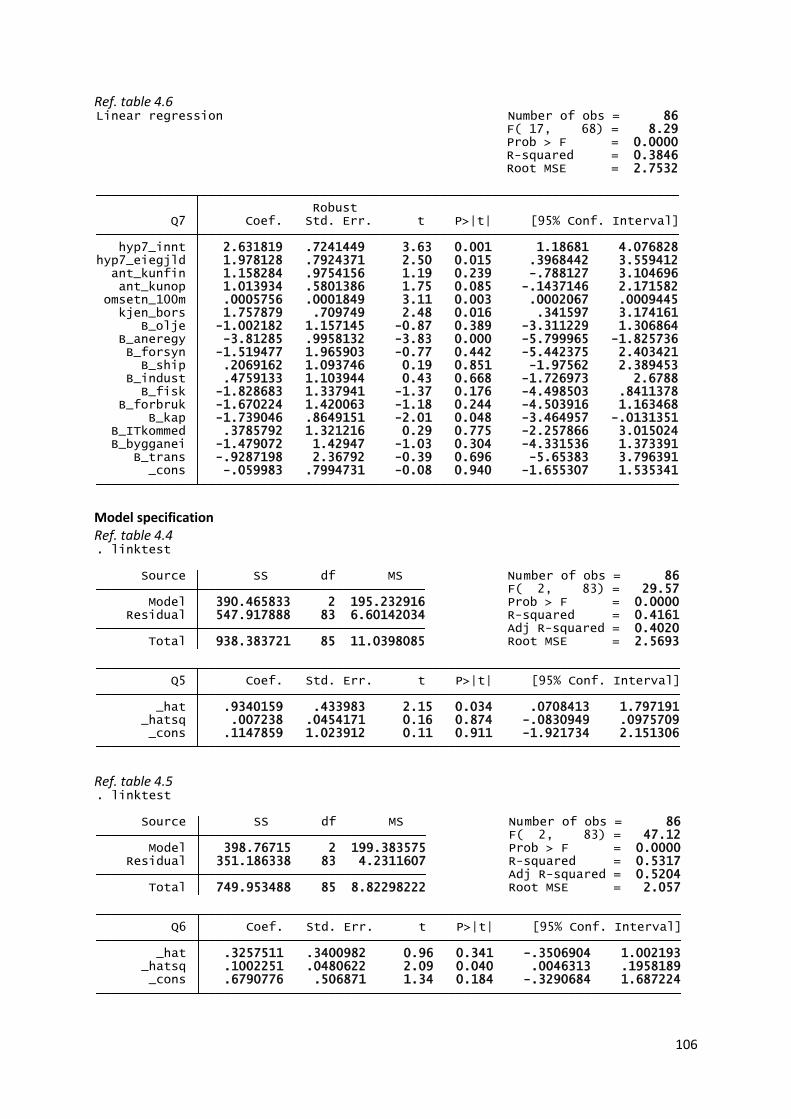
106
Ref. table 4.6
Model specification Ref. table 4.4
Ref. table 4.5
_cons -.059983 .7994731 -0.08 0.940 -1.655307 1.535341 B_trans -.9287198 2.36792 -0.39 0.696 -5.65383 3.796391 B_bygganei -1.479072 1.42947 -1.03 0.304 -4.331536 1.373391 B_ITkommed .3785792 1.321216 0.29 0.775 -2.257866 3.015024 B_kap -1.739046 .8649151 -2.01 0.048 -3.464957 -.0131351 B_forbruk -1.670224 1.420063 -1.18 0.244 -4.503916 1.163468 B_fisk -1.828683 1.337941 -1.37 0.176 -4.498503 .8411378 B_indust .4759133 1.103944 0.43 0.668 -1.726973 2.6788 B_ship .2069162 1.093746 0.19 0.851 -1.97562 2.389453 B_forsyn -1.519477 1.965903 -0.77 0.442 -5.442375 2.403421 B_aneregy -3.81285 .9958132 -3.83 0.000 -5.799965 -1.825736 B_olje -1.002182 1.157145 -0.87 0.389 -3.311229 1.306864 kjen_bors 1.757879 .709749 2.48 0.016 .341597 3.174161 omsetn_100m .0005756 .0001849 3.11 0.003 .0002067 .0009445 ant_kunop 1.013934 .5801386 1.75 0.085 -.1437146 2.171582 ant_kunfin 1.158284 .9754156 1.19 0.239 -.788127 3.104696hyp7_eiegjld 1.978128 .7924371 2.50 0.015 .3968442 3.559412 hyp7_innt 2.631819 .7241449 3.63 0.001 1.18681 4.076828 Q7 Coef. Std. Err. t P>|t| [95% Conf. Interval] Robust
Root MSE = 2.7532 R-squared = 0.3846 Prob > F = 0.0000 F( 17, 68) = 8.29Linear regression Number of obs = 86
_cons .1147859 1.023912 0.11 0.911 -1.921734 2.151306 _hatsq .007238 .0454171 0.16 0.874 -.0830949 .0975709 _hat .9340159 .433983 2.15 0.034 .0708413 1.797191 Q5 Coef. Std. Err. t P>|t| [95% Conf. Interval]
Total 938.383721 85 11.0398085 Root MSE = 2.5693 Adj R-squared = 0.4020 Residual 547.917888 83 6.60142034 R-squared = 0.4161 Model 390.465833 2 195.232916 Prob > F = 0.0000 F( 2, 83) = 29.57 Source SS df MS Number of obs = 86
. linktest
_cons .6790776 .506871 1.34 0.184 -.3290684 1.687224 _hatsq .1002251 .0480622 2.09 0.040 .0046313 .1958189 _hat .3257511 .3400982 0.96 0.341 -.3506904 1.002193 Q6 Coef. Std. Err. t P>|t| [95% Conf. Interval]
Total 749.953488 85 8.82298222 Root MSE = 2.057 Adj R-squared = 0.5204 Residual 351.186338 83 4.2311607 R-squared = 0.5317 Model 398.76715 2 199.383575 Prob > F = 0.0000 F( 2, 83) = 47.12 Source SS df MS Number of obs = 86
. linktest

107
Ref. table 4.6
Ref. table 4.4
Ref. table 4.5
Ref. table 4.6
Heteroskedasticity Ref. table 4.4
_cons -.0268159 1.009589 -0.03 0.979 -2.034848 1.981216 _hatsq -.0020409 .056678 -0.04 0.971 -.1147711 .1106893 _hat 1.016846 .487992 2.08 0.040 .0462491 1.987442 Q7 Coef. Std. Err. t P>|t| [95% Conf. Interval]
Total 837.488372 85 9.85280438 Root MSE = 2.492 Adj R-squared = 0.3697 Residual 515.420725 83 6.20988825 R-squared = 0.3846 Model 322.067647 2 161.033824 Prob > F = 0.0000 F( 2, 83) = 25.93 Source SS df MS Number of obs = 86
. linktest
Prob > F = 0.4516 F(3, 65) = 0.89 Ho: model has no omitted variablesRamsey RESET test using powers of the fitted values of Q5
. ovtest
Prob > F = 0.0165 F(3, 65) = 3.67 Ho: model has no omitted variablesRamsey RESET test using powers of the fitted values of Q6
. ovtest
Prob > F = 0.7484 F(3, 65) = 0.41 Ho: model has no omitted variablesRamsey RESET test using powers of the fitted values of Q7
. ovtest
Total 66.49 79 0.8412 Kurtosis 2.36 1 0.1245 Skewness 18.09 17 0.3834 Heteroskedasticity 46.04 61 0.9225 Source chi2 df p
Cameron & Trivedi's decomposition of IM-test
Prob > chi2 = 0.9225 chi2(61) = 46.04
against Ha: unrestricted heteroskedasticityWhite's test for Ho: homoskedasticity

108
Ref. table 4.5
Ref. table 4.6
Normality of the residuals Ref. table 4.4
Total 85.65 79 0.2851 Kurtosis 0.47 1 0.4949 Skewness 19.42 17 0.3051 Heteroskedasticity 65.77 61 0.3153 Source chi2 df p
Cameron & Trivedi's decomposition of IM-test
Prob > chi2 = 0.3153 chi2(61) = 65.77
against Ha: unrestricted heteroskedasticityWhite's test for Ho: homoskedasticity
Total 64.66 79 0.8778 Kurtosis 0.01 1 0.9235 Skewness 21.98 17 0.1856 Heteroskedasticity 42.67 61 0.9641 Source chi2 df p
Cameron & Trivedi's decomposition of IM-test
Prob > chi2 = 0.9641 chi2(61) = 42.67
against Ha: unrestricted heteroskedasticityWhite's test for Ho: homoskedasticity
0
.05
.1.1
5
Den
sity
-10 -5 0 5Residuals
Kernel density estimate
Normal density
kernel = epanechnikov, bandwidth = .94
Kernel density estimate
0.0
00
.25
0.5
00
.75
1.0
0
Norm
al F
[(hyp
7_
1-m
)/s]
0.00 0.25 0.50 0.75 1.00Empirical P[i] = i/(N+1)
-10
-50
5
Resid
uals
-5 0 5Inverse Normal

109
Ref. table 4.5
Ref. table 4.6
0
.05
.1.1
5.2
Den
sity
-5 0 5Residuals
Kernel density estimate
Normal density
kernel = epanechnikov, bandwidth = .67
Kernel density estimate
0.0
00
.25
0.5
00
.75
1.0
0
Norm
al F
[(hyp
7_
2-m
)/s]
0.00 0.25 0.50 0.75 1.00Empirical P[i] = i/(N+1)
-50
5
Resid
uals
-5 0 5Inverse Normal
0
.05
.1.1
5
Den
sity
-10 -5 0 5Residuals
Kernel density estimate
Normal density
kernel = epanechnikov, bandwidth = .91
Kernel density estimate
0.0
00
.25
0.5
00
.75
1.0
0
Norm
al F
[(hyp
7_
3-m
)/s]
0.00 0.25 0.50 0.75 1.00Empirical P[i] = i/(N+1)
-10
-50
5
Resid
uals
-5 0 5Inverse Normal

110
Multicollinearity Ref. table 4.4
Ref. table 4.5
Ref. table 4.6
Mean VIF 1.56 omsetn_100m 1.13 0.887318 ant_kunop 1.21 0.828039 B_forsyn 1.28 0.783911 hyp7_innt 1.30 0.769092 ant_kunfin 1.32 0.757845 kjen_bors 1.35 0.742053hyp7_eiegjld 1.35 0.741728 B_trans 1.36 0.733659 B_kap 1.40 0.715516 B_aneregy 1.43 0.698100 B_bygganei 1.47 0.678167 B_ITkommed 1.51 0.662220 B_forbruk 1.60 0.624591 B_fisk 1.66 0.603149 B_ship 1.84 0.544260 B_olje 2.35 0.426311 B_indust 3.00 0.332942 Variable VIF 1/VIF
. vif

111
Hypothesis 7 Regression
Model specification
_cons -6917065 1.08e+07 -0.64 0.523 -2.83e+07 1.45e+07 B_trans 4047776 3689461 1.10 0.275 -3265375 1.14e+07 B_bygganei -7671905 8687815 -0.88 0.379 -2.49e+07 9548852 B_ITkommed 1148303 6166945 0.19 0.853 -1.11e+07 1.34e+07 B_kap 8615953 5765526 1.49 0.138 -2812320 2.00e+07 B_forbruk 6912780 8430360 0.82 0.414 -9797656 2.36e+07 B_fisk -1.58e+07 1.31e+07 -1.21 0.229 -4.17e+07 1.01e+07 B_indust -1199492 8027688 -0.15 0.882 -1.71e+07 1.47e+07 B_ship -1.30e+07 1.51e+07 -0.87 0.389 -4.29e+07 1.68e+07 B_forsyn -1.75e+07 1.72e+07 -1.02 0.310 -5.16e+07 1.66e+07 B_aneregy -2712282 5007947 -0.54 0.589 -1.26e+07 7214337 B_olje 3.72e+07 4.10e+07 0.91 0.367 -4.41e+07 1.18e+08 kjen_bors 3.34e+07 2.14e+07 1.56 0.121 -8986328 7.59e+07 Ant_begge 9527472 1.16e+07 0.82 0.414 -1.35e+07 3.26e+07 ant_kunfin 9904688 1.25e+07 0.79 0.429 -1.48e+07 3.46e+07 Omsetning Coef. Std. Err. t P>|t| [95% Conf. Interval] Robust
Root MSE = 6.0e+07 R-squared = 0.1071 Prob > F = 0.8256 F( 14, 108) = 0.64Linear regression Number of obs = 123
_cons 2037823 5818015 0.35 0.727 -9481442 1.36e+07 _hatsq 3.50e-08 1.00e-08 3.49 0.001 1.52e-08 5.49e-08 _hat -.70505 .5490462 -1.28 0.202 -1.792123 .3820234 Omsetning Coef. Std. Err. t P>|t| [95% Conf. Interval]
Total 4.4182e+17 122 3.6215e+15 Root MSE = 5.5e+07 Adj R-squared = 0.1760 Residual 3.5809e+17 120 2.9841e+15 R-squared = 0.1895 Model 8.3727e+16 2 4.1864e+16 Prob > F = 0.0000 F( 2, 120) = 14.03 Source SS df MS Number of obs = 123
. linktest
. estat imtest, white
Prob > F = 0.0015 F(3, 105) = 5.52 Ho: model has no omitted variablesRamsey RESET test using powers of the fitted values of Omsetning
. ovtest

112
Heteroskedasticity
Normality of the residuals
Multicollinearity
Total . 55 . Kurtosis . 1 . Skewness . 14 . Heteroskedasticity 32.49 40 0.7946 Source chi2 df p
Cameron & Trivedi's decomposition of IM-test
Prob > chi2 = 0.7946 chi2(40) = 32.49
against Ha: unrestricted heteroskedasticityWhite's test for Ho: homoskedasticity
0
1.0
00
e-0
82
.000
e-0
83
.000
e-0
8D
en
sity
-2.000e+08 0 2.000e+08 4.000e+08 6.000e+08Residuals
Kernel density estimate
Normal density
kernel = epanechnikov, bandwidth = 5243511
Kernel density estimate
0.0
00
.25
0.5
00
.75
1.0
0
Norm
al F
[(hyp
8-m
)/s]
0.00 0.25 0.50 0.75 1.00Empirical P[i] = i/(N+1)
0.0
00
.25
0.5
00
.75
1.0
0
Norm
al F
[(hyp
8-m
)/s]
0.00 0.25 0.50 0.75 1.00Empirical P[i] = i/(N+1)
Mean VIF 1.66 B_forsyn 1.16 0.861916 kjen_bors 1.21 0.827314 B_trans 1.30 0.767180 B_forbruk 1.37 0.732232 B_kap 1.40 0.716358 B_ITkommed 1.41 0.710451 B_fisk 1.50 0.666412 B_ship 1.52 0.656898 B_bygganei 1.56 0.639745 B_aneregy 1.76 0.566625 B_olje 1.85 0.539457 Ant_begge 2.16 0.463066 ant_kunfin 2.33 0.429515 B_indust 2.68 0.373061 Variable VIF 1/VIF
. vif

113
Hypothesis 8 Regression
Model specification
Heteroskedasticity
_cons .2870547 .2759458 1.04 0.301 -.2598051 .8339144 nordisk -.0560436 .3148815 -0.18 0.859 -.6800649 .5679776 pund -.2553733 .2788027 -0.92 0.362 -.8078948 .2971482 dollar .1056769 .2770899 0.38 0.704 -.4434503 .6548041 euro -.096531 .2553011 -0.38 0.706 -.6024779 .4094159 Ant_begge 1.45458 .187098 7.77 0.000 1.083796 1.825365 ant_kunfin 1.214344 .230813 5.26 0.000 .7569269 1.671761 omsetn_100m -.00013 .0001131 -1.15 0.253 -.0003542 .0000941 kjen_bors .0288714 .1857093 0.16 0.877 -.3391608 .3969036 B_fisk .2718907 .3306005 0.82 0.413 -.3832819 .9270633 B_ship 1.42619 .2961284 4.82 0.000 .8393333 2.013047 B_aneregy .0459614 .3111331 0.15 0.883 -.5706314 .6625542 B_olje -.3606391 .1956182 -1.84 0.068 -.7483083 .0270302 fin Coef. Std. Err. t P>|t| [95% Conf. Interval] Robust
Root MSE = .7954 R-squared = 0.4509 Prob > F = 0.0000 F( 12, 110) = 15.63Linear regression Number of obs = 123
_cons .0189328 .2016028 0.09 0.925 -.3802267 .4180922 _hatsq .0134148 .0807293 0.17 0.868 -.1464236 .1732532 _hat .963091 .2438844 3.95 0.000 .480217 1.445965 fin Coef. Std. Err. t P>|t| [95% Conf. Interval]
Total 126.747967 122 1.03891777 Root MSE = .76145 Adj R-squared = 0.4419 Residual 69.5761751 120 .579801459 R-squared = 0.4511 Model 57.1717924 2 28.5858962 Prob > F = 0.0000 F( 2, 120) = 49.30 Source SS df MS Number of obs = 123
. linktest
Prob > F = 0.8720 F(3, 107) = 0.23 Ho: model has no omitted variablesRamsey RESET test using powers of the fitted values of fin
. ovtest
Total 50.25 63 0.8776 Kurtosis 0.12 1 0.7341 Skewness 18.35 12 0.1055 Heteroskedasticity 31.78 50 0.9792 Source chi2 df p
Cameron & Trivedi's decomposition of IM-test
Prob > chi2 = 0.9792 chi2(50) = 31.78
against Ha: unrestricted heteroskedasticityWhite's test for Ho: homoskedasticity
. estat imtest, white
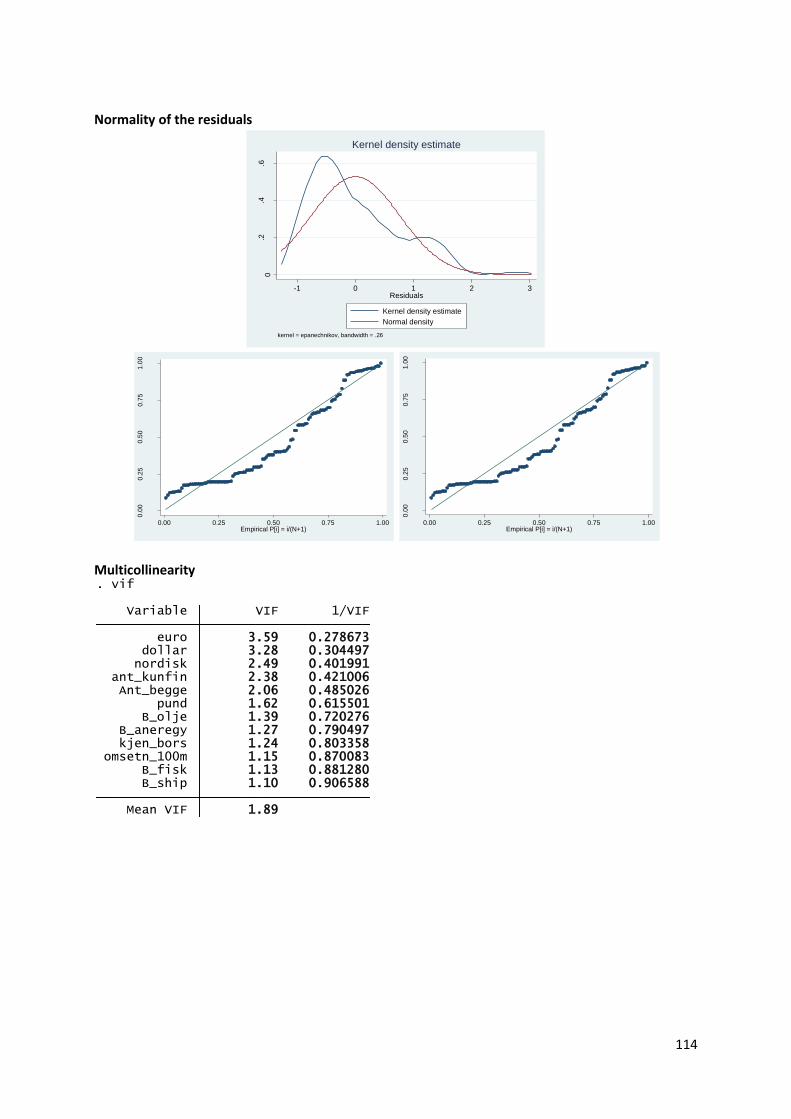
114
Normality of the residuals
Multicollinearity
0.2
.4.6
Den
sity
-1 0 1 2 3Residuals
Kernel density estimate
Normal density
kernel = epanechnikov, bandwidth = .26
Kernel density estimate0
.00
0.2
50
.50
0.7
51
.00
Norm
al F
[(hyp
9rr
-m)/
s]
0.00 0.25 0.50 0.75 1.00Empirical P[i] = i/(N+1)
0.0
00
.25
0.5
00
.75
1.0
0
Norm
al F
[(hyp
9rr
-m)/
s]
0.00 0.25 0.50 0.75 1.00Empirical P[i] = i/(N+1)
Mean VIF 1.89 B_ship 1.10 0.906588 B_fisk 1.13 0.881280 omsetn_100m 1.15 0.870083 kjen_bors 1.24 0.803358 B_aneregy 1.27 0.790497 B_olje 1.39 0.720276 pund 1.62 0.615501 Ant_begge 2.06 0.485026 ant_kunfin 2.38 0.421006 nordisk 2.49 0.401991 dollar 3.28 0.304497 euro 3.59 0.278673 Variable VIF 1/VIF
. vif