foreign exchange markets, intervention and … foreign exchange markets, intervention and exchange...
TRANSCRIPT

WP-2015-011
Foreign Exchange Markets, Intervention and Exchange Rate Regimes
Ashima Goyal
Indira Gandhi Institute of Development Research, MumbaiMay 2015
http://www.igidr.ac.in/pdf/publication/WP-2015-011.pdf

Foreign Exchange Markets, Intervention and Exchange Rate Regimes
Ashima GoyalIndira Gandhi Institute of Development Research (IGIDR)
General Arun Kumar Vaidya Marg Goregaon (E), Mumbai- 400065, INDIA
Email(corresponding author): [email protected]
AbstractWhile macroeconomic fundamentals determine the exchange rate at long horizons, there are substantial
and persistent deviations from these fundamentals. The market microstructure within which they
operate, macroeconomic fundamentals, and policies all affect foreign exchange (FX) markets. The
paper describes the institutional features of these markets, with special emphasis on the process of
liberalization and deepening in Indian FX markets, in the context of global integration. Since the
mechanics of FX trading affect exchange rates, they have implications for the appropriate exchange
rate regime. First, bounds on the volatility of the exchange rate can lower noise trading in FX markets,
decrease variance, improve fundamentals and give more monetary policy autonomy. Second, the
speculative demand curve is well behaved under strategic interaction between differentially informed
speculators and the Central Bank (CB) when there is greater uncertainty about fundamentals as in
emerging markets. So a diffuse target and strategic revelation of selected information can be expected to
be effective. Analysis of Indian experience confirms these research results. CB actions, including
intervention and signaling, have major effects.
Keywords: Foreign exchange markets; intervention; information; exchange rate bounds
JEL Code: F41, G15
Acknowledgements:
I thank Akash Baikar for research and Reshma Aguiar for secretarial assistance.

1
Foreign Exchange Markets, Intervention and Exchange Rate Regimes
1. Introduction
Rapid technological and regulatory changes are altering foreign exchange (FX)
markets profoundly, although special features of these markets are likely to survive.
Participant profile and behavior is also changing, as technology makes it easier for
small parties to access markets anytime and anywhere. The paper reviews these
changes, internationally and then domestically. Reforms in Indian markets offer a
good case study of the tensions between regulators, markets and technology. The
paper also draws out the implications for effective central bank (CB) interventions
and for exchange rate policy.
The current consensus from many empirical studies is while macro fundamentals
determine the exchange rate at long horizons, there are substantial and persistent
deviations largely unexplained by these fundamentals.
A literature on market microstructure of FX markets grew rapidly after seminal work
by Lyons (2001). This suggests the mechanics of FX trading has important short-run
effects on exchange rates. This is a departure from the traditional modeling strategy of
treating foreign exchange rates as a macroeconomic relative price. It also implies it is
not only public information which is relevant.
Survey data shows there is considerable heterogeneity in agents’ expectations of the
future exchange rate. Therefore private information, the transmission of this
information, and the relation between information flows plays a vital role. Proprietary
information is contained in order flows, which is the net of buyer-initiated and seller-
initiated orders. Although this is a variant of net demand, it is not necessarily equal to
zero in equilibrium. Each bank will have knowledge only of its own order flow, which
is used to update subjective estimates of the underlying value of the currency.
Order flow is a more precise proxy for expected future fundamentals, since it presents
a willingness to back one’s beliefs with real money. In specifications that include
macro fundamentals and order flow variables, Evans and Lyons (1999) find order

2
flow to be a significant determinant of the exchange rate. It performs better than both
standard macroeconomic variables, and random walk forecasts.
It follows foreign exchange markets are influenced by a combination of
macroeconomic and microeconomic variables. The market microstructure within
which they operate, macroeconomic fundamentals, and policies affect the decisions
micro market agents make. The Central Bank (CB) is a special kind of agent with
special powers and information. So its actions, including intervention and signaling,
also have major effects. The Indian experience confirms this.
Other participants in FX markets include banks, non-bank financial companies
(NBFCs), merchants and merchant-brokers. Large banks play the role of market
makers, accepting both buy and sell quotes. Merchant transactions were originally
restricted to trade and other retail transactions involving foreign currency, but now
generate many kinds of transactions due to risk management activities. Large and
sophisticated corporate treasuries now have multiple FX operations.
The structure of the paper is as follows: Section 2 discusses some institutional features
of foreign exchange markets, with a special sub-section and boxes on the process of
liberalization and deepening in Indian FX markets. Section 3 draws out implications
of varying trader information for exchange rate policy. Section 4 concludes. An
Appendix gives some derivations for the model used in Section 3.
2. Foreign Exchange Market: Institutional features
Compared to other financial markets, FX markets have unique features1. We briefly
describe their structure, composition, effects of change in technology and in
regulations, then draw out implications for their functioning.
Structure: They are the most liquid markets. Daily market turnover was $ 5.4 trillion
in 2013 (BIS 2013). But only about 5 percent of the very large turnover is actually due
to customer trade. Decentralized large volume markets with many physically
separated market makers, interact through the telephone or private networks, not in a
1 This section is largely based on material in Lyons (2001), Sarno and Taylor (2002), Sagar and Taylor
(2007), BIS triennial CB surveys and media reports.
3
centralized market like a stock market. Decentralization makes FX markets
fragmented and less transparent. There is no publicly announced price, and no law
requiring disclosure of trades. Each broker or market maker only knows own order
flows, with no incentive to share the information. Brokers normally accumulate a sub-
set of market makers’ limit orders, and quote the best buy and sell order from a ‘book’
they keep of such limit orders. A limit order is an offer to either buy or sell a certain
quantity of a currency at a certain bilateral exchange rate.
In a stock market clearing-house each party trades with it – doubling the number of
transactions. This is known as ‘novation’. The identity of the counter-party does not
matter since the clearing-house warranties the trade covering its risk through margin
payments and deposits. But in an FX market there are many market makers. Market
spreads can vary to cover the cost of market- making including counter-party risk2.
Even if the net position is close to zero, credit limits get filled up, unlike in a clearing
house, where only the net position is required for settlement.
Banks that are reporting dealers have to be the market makers in a decentralized
market since brokers cannot assess credit worthiness. Identity may be known only
after the deal. The direct FX market is double auction and open-bid. That is, two-way
prices on both bid and ask are announced to all agents in the market. The brokered
market is single auction and limit order. That is, prices are specified only to buy or
sell but not both. They are known only to the broker and the party making the offer.
Counterparties, instruments, currencies: Participants are heterogeneous with diverse
information sets and reaction speeds, so that profit opportunities can persist for
informed traders. Central banks have a special position. Although the interbank
market continued in 2013 to account for the majority of transactions (63%) this share
decreased since the nineties because of the rise of other financial institutions including
groups such as institutional investors, hedge funds (22%) and small non-reporting
banks (24%). Sudden shifts in positioning by large hedge funds that have the fastest
reaction speeds and operate with high leverage can magnify shocks to FX markets.
2 Counterparties made large losses as currency volatility spiked after Lehman fell in 2008. The risk to
market makers inventory caused spreads on quotes to increase from 4 to 16 pips. Trade froze for some
transactions.

4
They implement currency programs to secure a notional capital value that may be a
benchmark risk free rate.
As the corporate treasury and direct mobile trading FX market grew, traditional
brokers were by-passed. But prime brokerage relationships with their clients
dominated dealers’ trade (16%) with only 3.5% driven by trade with retail customers.
Corporate treasuries became sophisticated. Customers changed from passive price
takers with emphasis on financing and other banking services relating to foreign trade,
foreign investors, corporates availing foreign borrowing or involved in mergers and
acquisitions, etc. But the share of these non-financial customers in trading fell overall
to 9% in 2013
In April 2013 the US dollar as the dominant vehicle currency was on one side of 87%
of all trades. But renminbi became the 9th most traded currency as turnover grew
rapidly to $120bn. The financial centers UK (with 41%), US, Singapore and Japan
intermediated 71% of FX trading. Post GFC bank closures concentrated trading
increasingly in the large banks. The ten most active global traders accounted for 77%
of trading volume, of which the top three, Deutsche, Citi and Barclays, were at 40%,
according to the 2012 Euromoney FX survey.
OTC turnover at about 95% share continued to far exceed turnover on exchanges. In
2013 OTC FX swaps were the most actively traded at 42%, but forwards and options
slowed the most rapid growth.
Technology: Although new technologies are causing some change, the majority of
transactions continue to be bilateral, occurring in opaque markets without a physical
market place. Even so, electronic dealing and brokering systems, are giving some
amount of virtual centralization. Electronic Broking System (EBS) or Reuters D3000,
established in 1993, accounted for 85 percent of interbank trading by the 2000s.
Electronic systems allow netting, lower settlement and counterparty risk, and have
operational benefits such as reducing human error. They provide ex-ante anonymous
limit order bid ask pricing to dealers and have driven a large increase in liquidity and
reduction in transaction costs. CLS, the continuous link settlement system used by the

5
majority of the FX market, settles payment instructions relating to underlying FX
transactions in 17 major currencies, reducing settlement risk. The share of inter-dealer
trade (39%) fell as increasing concentration allowed dealers to match customer trade
on their own books, and investment in IT infrastructure for warehousing risk reduced
the need to offload inventory in the inter-dealer market.
Although voice trading dominates in customer trades, electronic portals are being
introduced here also. Electronic crossing networks (ECNs) that aggregate liquidity
pools received a fillip from the global financial crisis (GFC). As markets froze, they
were successful in finding liquidity where trade could occur without a large impact on
price. But electronic systems do not increase the transparency of the FX market since
system governing boards treat electronic order flow as strictly confidential. Therefore
information on order flow remains divided.
Regulation: It remains to be seen if the regulatory push towards greater transparency
after the GFC, which is shifting more over-the-counter (OTC) trade to exchanges,
causes a fundamental change. But even the US Dodd-Frank Act that sought to prevent
banks’ proprietary trading, has given exceptions for the spot FX market, thus
accepting that the FX market is different. Higher capital requirements and tighter
regulations are, however, reducing banks’ participation in all markets.
Despite magnified activity, currency markets remained largely stable during the
financial crisis of 2008, partly because risk management procedures had been
improved after earlier crises. Banks imposed position limits for individual traders, and
risk capital made available was a function of past performance. Incentives to take risk
were reduced because losses reduced traders’ risk capital while profits were shared
with the bank (Geithner, 2004).
But regulation has to continue to evolve in response to new types of malpractices.
Since banks often act as principal to a trade, they buy at the moment the client sells.
This conflict of interest gives them an incentive to move rates against their customers.
Such behavior is difficult in a transparent competitive market since customers getting
a poor rate would move elsewhere. But FX markets are not transparent and collusion
further removes such protection. In 2014 traders were caught fixing benchmark rates

6
to suit their own positions. Employees exchanged confidential client information with
rival firms in order to trigger orders against their own customers thus distorting the
market. In November regulators from the UK, Switzerland and the US imposed record
fines of USD 4.3bn on six large banks whose weak controls allowed these
malpractices. More fines followed.
Decentralized currency trading with huge volumes scattered across numerous
platforms makes it difficult to monitor and identify dubious trades. Solutions being
considered include extending the period during which the daily fixed rate is
established to make it harder to manipulate. Big data is being used in creative ways to
flag unusual activities. Fines reduce the financial incentive to cheat. They also create
pressure on management from bank shareholders. Values set by the top management
are also important. Traders caught are normally either dismissed or lose their bonus.
There are suggestions for higher penalties include the risk of a jail sentence. Solutions
therefore range from better monitoring and incentives to the role of values.
Functioning: More transparency could also be a possible solution. There is some rise
in this. More trading on exchanges creates price benchmarks. But is it possible to
change the decentralized largely OTC structure of the market with its huge trading
volumes? Or does it serve some purpose? Large temporary inventory imbalances
generate ‘hot potato’ trading as dealers iterate towards their optimal portfolios
although the share of such inter-dealer trade is falling, it remains very large. Market
makers and dealers do not want to carry inventory overnight—which carries inventory
risk—therefore they quote ask (buy) and bid (sell) spreads such as to get rid of stocks
in the day.
Trades are initiated based on macro data and differential order flow information, with
the aim of rebalancing portfolios. The information in the order flow sustains trade.
The transactions are not all speculative, or profit seeking. Although this market
structure raises the number of transactions, it is less prone to crashes. A centralized
system with too many informed traders would crash as liquidity dried up due to
7
homogeneous views, especially given the few prices quoted3. Compared to the large
number of quotes in a stock market, prices in an FX market refer only to a few
currency pairs, making the FX market more susceptible to herding and explaining its
differential structure.
2.1. Indian FX markets
Indian FX markets offer an interesting case study of the process of market
development. Intra-day trade was first permitted for banks in 1978, but the market
really grew after liberalization4, as the Sodhani Committee’s (1995) comprehensive
blueprint for reform was followed. The Tarapore Committee (2006) also made several
recommendations for these markets. Despite major changes in the expansion of
turnover and of instruments available for hedging they were still far behind
international markets. The advent of electronic trading and communication platforms,
reduced transaction costs and risks, and the profile of customers as capital flows
became the prime mover of exchange rates. Rising exchange rate volatility, with a
more open capital account, increased the necessity for hedging FX risks.
The average daily turnover in Indian OTC FX markets, which was about US $2.0
billion in 1998, grew to US $38 billion in 20075. Growth slowed after the GFC, but
even so by April 2010 the daily domestic OTC market turnover was $27b and the
futures market about $10b. So unlike the global average of 4% the Indian exchange
traded market was about 30% of the domestic market (Mecklai, 2010b). BIS measures
only OTC market turnover. The inter-bank to merchant turnover ratio halved from 5.2
during 1997-98 to 2.3 during 2007-08 reflecting the growing participation in the
merchant segment of the foreign exchange market. The spot market remained the
most important FX market segment accounting for above 50 per cent of the total
turnover. Its share also declined marginally due to a pick-up in the turnover in the
derivative segment. Even so, Indian derivative trading remained a small fraction of
that in other developing countries such as Mexico or South Korea. Short-term
3 For example Indian FX futures markets grew rapidly, after they were established, but were still thin.
If a large party came in on the buy side the sell side would dry up in anticipation of a price rise. 4 This section, unless explicitly mentioned, updates information in Goyal, Nair and Samantaraya (2009)
and Goyal (2015). 5 BIS (2007) notes this was the fastest rate of growth amongst all world FX markets, although the 72%
rate of growth of world FX market activity between 2004 and 2007 was also the fastest. In the next 3
years growth was 19% but rose to 35% over 2010-13.

8
instruments with maturities of less than one year dominated, and activity was
concentrated among a few non-public sector banks (IMF 2008).
------
Box 1: Deepening of Indian FX Markets
Table 1.1: Comparison of Indian and Australian FX Markets
Australia India
USD billion 2001 2007 2013 2001 2007 2013
Daily FX turnover Amount 54 (54) 176 (220)
182 (462)
3 (3) 38 (24) 31 (53)
% 3.2 4.1 2.7 0.2 0.9 0.5
Merchandise trade, daily average
0.02 1.1 1.7 0.4 1.5 2.8
FX inflow, daily average
0.02 0.07 0.14 0.02 0.26 0.16
Note: (1) Foreign inflows are measured as the current account deficit plus reserve gains. (2) Merchandise trade is
calculated as exports plus imports of goods and services (absolute values) (3) Domestic FX turnover is on net-
gross basis, (that is adjusted for local inter-dealer double counting by subtracting half of the turnover with
reporting local dealers). It includes spot, outright forwards and swap transactions. Global INR turnover is given
on a net-net basis in brackets. This adjusts for local and cross-border inter-dealer double counting by subtracting
half of the turnover with reporting dealers abroad. BIS (2013) warn turnover for years prior to 2013 may be
under-reported, especially for EMs.
Source: FX turnover calculated from the Bank for International Settlements, various years, for example, (BIS,
2007, Table E16, pp. 82, http://www.bis.org/publ/rpfxf07a.pdf), the International Financial Statistics (IMF,
various years).
Table 1.1 shows the rapid deepening of Indian FX markets, the rise in trade and
inflows which are dwarfed by the large turnover which itself still remains small even
in comparison a middle level developing country like Australia. Table 1.2 shows the
shares by types of agents and instruments, with domestic market data from the RBI,
and global INR trade (row 8 onwards) from the BIS. With deepening there is a sharp
fall in the share of CB transactions and some rise in derivative use although regulators
restraints slowed these after the Euro debt crisis of 2011, but only domestically. Cross
border transactions also rose. The share of derivatives is much higher in global INR
trade (row 15 Table 1.1) pointing to a large off-shore market. Daily global net-net
INR turnover is also higher than domestic FX market turnover (Table 1)

9
Table 1.2: Aspects of the Indian FX Market
US $ Billion FCY/INRa
2001-02 2006-07 2012-13
1 Total domestic spot turnover (sales + purchases) 446.1 1861.4 4525.2
2 Total CB intervention (sales + purchases) 38.6 26.8 29.9
3 2 as % of 1 8.7 1.5 0.7
4 Share of 1 due to interbank(%) 64.5 66.3 73.4
5 Share of 1 due to merchant(%) 35.6 33.7 26.6
6 Total forward as % of total spot 22.5 23.6 24.4
7 Total swap as % of total spotb 147.4 77.2 75.1
8 Global total INR spot (for April) (OTC)c 1.2 9.0 15.2
9 Share due to RDs (from CB survey) (%) 51.2 63.1 45.2
10 Share due to other financial insts. (%) 9.8 18.4 38.1
11 Share of non-financial insts.(%) 39.1 18.5 16.7
12 Share in total spot of local transactions(%) 94.1 77.2 66.9
13 Share in total spot of cross border tran.(%) 5.9 22.8 33.1
14 Total domestic FX derivatives as % of total spot
(net-gross) 116.8 137.5 102.1
15 Total global INR FX derivatives as % of total
spot (net-net) 110.9 134.5 246.5
Note: Items (1) to (7) were calculated from RBI bulletins. The data was collected for all the months in the given
years and summed up. Each year is taken from April to March. (8) to (15) are available in the Central Bank (CB)
Surveys (BIS) and refer to net-net daily averages added up across different participants for April 2001, 2007 and
2013 respectively. Items (9) to (13) and (15) are as percentage to (8), (14) is a percentage of spot in net-gross terms;
FCY: Foreign currency; INR: Indian rupees; RDs: Reporting dealers
a All transactions involve exposure to more than one currency.
b Excluding “tomorrow/next day” transactions
c A swap is considered to be a single transaction in that the two legs are not counted separately. Including
“tomorrow/next day” transactions
The percentage of intervention to interbank turnover fell from 13.4 in 2001-02 to 0.9
in 2006-07, but it was still large compared to mature economies. The Bank of Japan
intervened successfully in 2011 even with a percentage of 0.2. This is the annual
intervention percentage. The CB share can be much higher for daily intervention,
which tends to be concentrated on a few days. Since the inter-bank market remains a
large size of the total, the inter-bank share is not much higher than the percentage of
CB intervention to total turnover. CB intervention, however, affected only domestic
markets.
-----
Even so, the derivative segment of the FX market also evolved. Cross- currency
derivatives with the rupee as one leg were introduced, with some restrictions, in April
10
1997. Rupee-foreign exchange options were allowed in July 2003. Exchange traded
currency futures were started in 20086. The most widely used derivative instruments
were the forwards and foreign exchange swaps (rupee-dollar). As elsewhere, FX
transactions were mostly OTC structured by banks. But there was user demand for
liquid and transparent exchange traded hedging products, which are easier to regulate.
The non-deliverable forward (NDF) OTC market was growing because of large
capital and trade flows, restrictions on FIIs ability to hedge in domestic markets, and
larger spread between forward, futures and NDF markets. It began with diamond
traders using it for arbitrage. In 2008 the Indian forward market was fairly liquid up to
one year. The price movement in the near-term bucket reflected rupee liquidity in the
interbank market and overnight interest rates but the six-month and one-year rates
were determined also by expected future liquidity. Importers and exporters also
influenced the forward markets. Forward rates in a particular segment could differ
from other segments due to the excess supply/demand from importers/exporters in
that segment.
The Clearing Corporation of India Ltd. (CCIL) set up by the Reserve Bank of India
(RBI) in 2001 settled 90-95 percent of interbank rupee-dollar transactions. Foreign
exchange trades were settled through multilateral netting thus saving transaction cost.
All spot, cash, tom transactions and forward trades were guaranteed for settlement
from the trade date reducing foreign exchange settlement and counterparty risk. A
transparent FX dealing system, FX-Clear, of the CCIL launched in August 2003,
decreased settlement risk and gave netting and operational benefits. It facilitated inter-
bank trade through order matching and negotiation mode. Reuters platform was also
available. Swaps and options were essentially inter–bank transactions, and accounted
for about 50 percent of CCIL trade settlement (IMF, 2008).
The Reserve Bank moved gradually to eliminate restrictions on FX markets.
Historically, the availability of hedging tools against foreign exchange risk was
limited to entities with direct underlying foreign exchange exposures. However, with
a larger set of economic agents exposed to foreign exchange risk there was a shift to
6 In the absence of full rupee convertibility, a future contract could not result in the delivery of foreign
currency. It was netted out in rupees, reducing its usefulness for hedging.

11
the concept of "economic exposure", that is, the effect of exchange rates on a firm's
value. There were gradual steps to give greater flexibility to corporates for managing
their exposures. For example, it was proposed to permit agents to book forward
contracts without production of underlying documents up to an annual limit of US $
100,000, which could be freely cancelled and rebooked. Cancellation and rebooking
of forward contracts and swaps in India were regulated to reduce rupee volatility.
There were moves to allow banks to fix their own net open position limits (NOPL)
and AGL limits based on their risk appetite and ability to manage exposure, with
adequate prudential regulation and supervision to cover systemic risk and prevent
excessive leverage. By 2011, while banks boards set the NOPLs they had to be
approved by the RBI.
---
Box 2: The Process of Regulatory Change in India
FX market regulations followed a dynamic process driven by regulatory objectives of
market development with stability, demands from and requirements of markets. Some
examples of this dialectic are given below, over 2002-13, a period with major changes
in Indian FX markets.
Since 2002 persons resident in India were allowed to enter into forward contracts on
the basis of underlying exposures. Further, exporters and importers were allowed to
book forward contracts on the basis of declaration of exposures and based on past
performances, subject to specified conditions. Permissions were slowly expanded,
with the aim of enabling hedging through the reversal of a real transaction.
The annual Policy Statement for the Year 2007-08 (paras 142) provided greater
flexibility to the Small and Medium Enterprises (SME) sector and resident
individuals, further liberalization of the scope and range of forward contracts, to
facilitate such entities to hedge their foreign currency exposures on a dynamic basis.
There was a warning that authorized dealer (AD) Category – I bank should carry out
due diligence regarding “user appropriateness” and “suitability” of the forward
contracts to the SME customers.

12
NRIs could now book forward contracts without production of underlying documents
up to a limit of USD 100,000, based on self-declaration. These contracts would
normally be on a deliverable basis. However, in case of mismatches in cash flows or
other exigencies, the contracts booked under this facility could be cancelled and re-
booked. The notional value of the outstanding contracts was not to exceed USD
100,000 at any time. Further, the contracts were permitted for tenors of up to one year
only.
Source: RBI/2007-2008/, A. P. (DIR Series) Circular No. October 10, 2007
In an interview conducted in Sept. 2007, Mr. Bhaskar Panda – senior vice-president
and regional head – treasury advisory group – HDFC Bank, assessed the changes and
advocated further reform as follows:
Customized options have mostly evolved over the past 4-5 years after RBI
liberalized its norms. Earlier, a corporate could hedge its risk only for 3 years,
today they can hedge it for upto 10 years. But the value of the hedge is capped
upto the basis of last year’s turnover. Banks’ want this regulation be altered to
allow booking of forward contracts based on projected performances. Banks
mostly trade on Reuters terminal, CCIL and voice brokers. Technology has
made a big difference to the level of FX-dealing and has helped significantly
to increase volumes.
CCIL was guaranteeing forward trades from the date they entered the spot window.
But huge outstanding FX exposure and capital requirements still remained. Member
banks wanted CCIL to extend guarantee to these trades from trade date itself. This
would imply reduction in bilateral exposure between counter-party members; capital
adequacy and balance sheet disclosure would be required only of net exposure in
outstanding FX forward trades.
Source: Note on CCIL’s website, Sept. 2007
Despite the GFC, the process of deepening FX markets continued. In 2008/09 futures
were allowed and traded on exchanges.

13
Changes proposed in the draft guidelines announced in Paragraph 119 of the Second
Quarter Review of Monetary Policy for the Year 2009-10, Reserve Bank of India
included:
1. Importers and exporters with foreign currency exposures in trade transactions,
permitted to write covered call and put options both in foreign currency-rupee and
cross currency and also to receive premia.
2. AD Category I banks permitted to offer plain vanilla cross currency options to
persons residents in India (other than AD Category- I banks), who transform their
rupee liability into a foreign currency liability.
3. Given the facilities given in item 1 the facility of zero cost structures/cost
reduction structures was to be withdrawn, since these opaque structures were used for
speculation on rupee strengthening and imposed large losses on firms in 2008.
17 January 2012: Hedging commodity risk on international exchanges allowed for
listed companies through banks.
Reducing detailed oversight reduces transaction costs for firms, but the regulator has
to prevent systemic risk. Although the strategy was to move from micro controls to
regulating broad patterns, there was some back-tracking in times of high volatility.
FX markets had deepened and the variety of hedging instruments increased, but the
concern to increase the share of hedging transactions remained, as the assessment
below from a market participant demonstrates:
Daily volumes in the currency futures market crossed US$ 4 billion in just over a year
after the launch. But over 70% of the volume traded came from jobbers and day
traders. Open positions are an indicator of hedging. Banks and other players that
arbitrage the OTC market accounted for another 12-15%. So the open interest on the
market from hedgers and medium-term position-takers was only about 12-15%.
Compare this to the CME, where open interest averaged nearly 95% of a daily volume
of about $ 100 billion a day. For an emerging market currency like the Mexican peso,
greater hedging volume takes the ratio of open interest to volume to 300% (Mecklai

14
2010a). Since OTC transactions dominate, positions in futures markets alone are an
insufficient gauge of hedging. But Rathinam and Aurora (2011) in a study of the off
balance sheet activities of 15 Indian Scheduled Commercial Banks found that over 97
percent of notional amounts assigned to derivatives were for trading not for hedging.
Over 2011-13 there was some reversal in permissions due to global risk-off and
excess rupee volatility and FX markets shrank somewhat.
----
2.2. Types of intervention in FX markets
Although the stated position remained the RBI would act to prevent excess volatility,
markets were allowed to determine INR level and volatility subject to what remained
of capital controls that were being reduced under domestic and international pressure.
Intervention was temporarily suspended in 2007 at a time of strong inflows that made
sterilization difficult, but resumed to accumulate inflows from October as the market
stabilization bonds were negotiated for cost sharing with the government. The INR
had to depreciate during post-Lehman equity outflows in order for them to take a
write-down in asset values and share risk. The RBI did sell some reserves. Inflows
resumed quickly, however, and upto end 2011, were just adequate to finance the
CAD. So there was hardly any intervention in this period. This led to the market
misperception that the RBI was unable to intervene in FX markets, aided by
statements from the RBI about the large size of India’s FX liabilities and potential
capital movements relative to reserves. RBI communication was large-scale
intervention was not possible since reserves even at 300 billion now just covered
India’s international liabilities. Just as policy allowed more market determination of
the exchange rate becoming increasingly hands off, strong global risk-on risk-off in
the period after the GFC created perverse movements in the exchange rate.
As inflows slowed due to global risk aversion after the Euro-debt crisis, markets
shorted the rupee and it began to fall steeply, almost reaching 55. An environment of
low growth and a rising CAD added to the fragility of FX markets. Measures to
further liberalize inflows proved inadequate. So there was some reversal of
liberalization—restrictions were put on FX markets and intervention resumed. RBI

15
began to sell reserves in November 2011 as the INR spiraled downwards, and
imposed restrictions on markets.
Retrospective taxation in budget 2012, and the Fed’s taper announcement in May
2013, all led to outflows requiring RBI action7. Policy actions used included
administrative measures such as controls, market restrictions, intervention or buying
and selling in FX markets, signaling, and monetary policy measures such as the
classic interest rate defense. Thus it turned out there were many feasible actions.
Table 1, which lists the policy measures taken over 2010-2014, attempts to assess
their effectiveness by estimating this qualitative and quantitative impact on the
exchange rate, that is, did a measure reverse or add to existing market movements
and if so, by how much? The Table gives the basis points change in the INR/USD rate
in the week before and the week after a measure. A negative entry implies an
appreciation of the INR and a positive entry the reverse.
The Table indicates the most effective measure was the FX swap window8 announced
for oil marketing companies on 28th August 2013. Not only did the INR strengthen
substantially, but it reversed an existing depreciation. The peak value of INR/USD 68
was not regained. The rupee continued to appreciate after that, as other measures were
added to the swap window that remained open till end November. Measures that made
more FX available, such as the subsidy for banks foreign borrowing or easier ECB
also appreciated the INR. Restrictions on markets such as reducing position limits
worked only sometimes, and total bans were not effective (see also Section 2.3).
7 After zero intervention from January, monthly net purchases in USD million were 10678 over
2007:10 to 2008:10. This switched to net sales of 1505 over 2008:11 to 2009:4 as outflows intensified
under the GFC. Average intervention was near zero at monthly net purchases of 285 over 2009:05 to
2011:10. But 2011:10 to 2013:07 saw heavy monthly net sales of 8580. 8 By entering into fixed tenor sell/buy USD-INR swaps through designated banks, the RBI effectively
lent dollars against rupees with the transaction to be reversed in the future as the companies returned
the dollars.

16
Table 1: Policy measures over 2010–2014 and effect on rupee (+depre, -appre)
Date Change in
INR/USD
(week before)
Change in
INR/USD
(week after)
Policy action
28 December 2010 -0.21 0.03 RBI issues guidelines for OTC FX derivatives
and overseas hedging
1 Feb. 2011 0.11 -0.48 Derivatives guidelines applied
15 September 2011 1.82 1.83 Exchange earners foreign currency account
and residents foreign currency accounts-
liberalization
15 November 2011 1.19 1.54 Increase in ceiling rate on banks’ export credit
in foreign currency by 150 basis points
5 December 2011 -0.77 2.18 Speech reinforcing RBI’s hands-off policy
15 December 2011 2.79 -1.51 Bank net open position limits (NOPL)
reduced 75%; Free cancellation and
rebooking of FX forward contracts disallowed
21 May 2012 1.04 0.90 Netting of positions in currency futures/
options with OTC positions disallowed;
position limits of banks for currency futures
and options reduced
11 Sept. 2012 0.07 -1.18 ECB policy eased
13 May 2013 0.96 0.12 RBI restricts banks’ gold imports
22 May 2013 0.89 0.58 Bernanke says Fed may taper QE
20 June 2013 1.43 -0.001 Foreign banks open positions in USD/INR
reduced to almost zero
9 July 2013 0.93 -0.71 Any proprietary activity by banks in currency
futures banned
10 July 2013 0.72 -0.42 Public sector oil companies directed to buy
FX only from one bank (SBI)
23 July 2013 -0.36 1.43 Monetary tightening measures started from
July 9; reduced LAF limit to 0.5% of a bank’s
own NDTL; banks to maintain a daily
minimum CRR balance of 99%; MSF rate
raised to 10.25 and CMR moved up to it from
repo of 7.25.
28 August 2013 4.63 -2.32 FX swap window for oil companies (closed
end-November)
4 September 2013 1.36 -3.24 Window for the banks
to swap the fresh
FCNR(B) deposits
with RBI and increase
in Banks' overseas
borrowing limit with
option of swap with
RBI
18 September 2013 -1.07 -0.92 Fed refrains from QE taper, keeps bond
buying at USD85 Bn
11 November 2013 1.89 -0.74 Participation by SEBI registered FIIs, QFIs
long term investors in credit enhanced bonds
21 November 2013 -0.63 -0.80 Eased bank’s use of swaps in negotiation of
loans from international/multilateral financial
institutions.
28 January 2014 1.36 -0.54 Fed reduces QE
3 September 2014 0.12 0.37 Relaxation of External Commercial
Borrowings (ECB) limits
28 October 2014 -0.13 0.17 Fed ends QE
28 November 2014 -0.13 -0.05 Oil prices plummet as OPEC refuses to cut
production
Source: Updated from Goyal (2015)

17
Raising interest rates to defend the rupee in July 2013 was a total failure. The rupee
depreciated from around 60 in July to a low of 68 in August. The 3% rise in short-
term rates was aimed at retaining debt flows since zero open positions9 already
prevented domestic banks from speculating against the rupee. Ten per cent of the
USD 6.6 that had come in since 2011 left in June after the May taper-on
announcement. Higher short rates did not stop the outflows and by November 40%
had left. Already high interest rate spreads and long-term rates rose, hurting the
domestic recovery and domestic financial markets, where turnover fell further. Equity
inflows, however, continued positive and were a healthy USD 14bn over 2011-13.
Debt flows also revived by September 2013, after short term rates were normalized.
Of the approximately USD 50bn FII inflows over 2013 and 2014, debt inflows were
just a little over half.
Signals that the RBI was unable to intervene and the INR should be left to the markets
in 2011 had a large counter-productive impact. Well-designed signals had the desired
effect, as with the new RBI governor’s joining and speech on September 4, 2013,
announcing subsidies for banks raising FX deposits. Fed announcements also
impacted the INR. It appreciated after the US Fed’s 18th
September postponement of
the taper.
The lessons from this experience were the importance of designing policy in line with
the current state of capital account convertibility, restraints on debt flows, and
evolution of markets. Given India’s growth prospects and relatively greater reliance
on growth driven equity flows, the interest rate defense was counter-productive and
could have been avoided. The value of equity investors’ assets decreases with a sharp
depreciation, but an ineffective interest rate defense does not help existing equity
investors, even as reduced growth harms new entrants. Even debt flows respond to
risk premiums determined by overall macroeconomic stability, not just to narrow
interest differentials.
9 The net open position measures risks due to a banks’ mix of buy and sell positions in different
currencies. It is measured by the higher of net buy or net sell positions across all currencies. A zero
open position means a bank cannot have foreign currency assets exceed foreign currency liabilities in
its balance sheet or have an unsettled buy position in foreign currency. This reduces selling pressure on
the rupee coming from banks.

18
Under adverse expectation driven outflows the market demand and supply for FX will
not determine an exchange rate based on fundamentals. Smoothing lumpy foreign
currency demand in a thin and fragile FX market is important. Direct provision of FX
to oil marketing companies was first used in the mid-nineties10
. It is a useful way to
temporarily provide FX reserves to a fragile market without supporting departing
capital flows. It also encourages domestic entities to hedge. It showed there are
innovative ways of using reserves. Oil companies return the dollars lent and reserves
can be further built up during periods of excessive inflows. Although swaps add
exchange rate risk to the RBI’s balance sheet, it need not materialize over the short
life of the swap if markets are successfully calmed.
In general, intervention must not be one-sided and has to be strategic, drawing on CBs
superior aggregate market information. Timing is very important and must be based
on market intelligence covering net open positions, order flow, bid-ask spreads (when
one-sided positions dominate dealers withdraw from supplying liquidity and spreads
rise), turnover, and share of interbank trades. Emerging markets (EMs) typically have
less information and more uncertainty, so signaling can be effective. A variety of
signals can be used.
It is only if these polices are not effective that restricting markets may become
necessary. But that should be avoided, to the extent possible, since it has adverse side-
effects. Modeling strategic interaction between differentially informed speculators and
the Central Bank, with EM features included shows why types of intervention and
signaling that are not normally effective, may work in FX markets like those in
India11
. Section 3 shows why bounds on exchange rate volatility can reduce noise
trader entry poorly informed traders and thus improve policy autonomy. An EM is
likely to have a larger share of such traders.
Each party is assumed to make inferences based on the other’s behavior, under shocks
that affect information extraction. The speculative demand curve is downward sloping
in the spot rate and stable if there is greater uncertainty about fundamentals, or if
10
I thank Dr. Y.V. Reddy for this point. 11
This analysis is based on Goyal et. al. (2009).
19
speculators prior on the target and CB’s weight on the target are small. The first
normally holds in an EM, and the second and third hold if the target is diffuse. The
estimated speculative demand using data over 2002-08 was found to be downward
sloping. CB purchase of dollars tended to depreciate the domestic currency, and
reduced its volatility. Expectations were stabilizing and not perverse.
The results suggest a CB in an EM can optimally reveal some information, but should
not announce an explicit target, or reveal its trading tactics. There is a range of
possible signals. Greater uncertainty about fundamentals makes it more worthwhile
for the CB to reveal some information about an exchange rate target.
As the model implies, market microstructure variables were found to affect
intervention efficacy. Market microstructure variables such as merchant and dealer net
demand (order flow) and turnover variables affected the level and volatility of
exchange rates. Merchant turnover was a driving force, volatility and expected
volatility increased dealer turnover. It follows microstructure variables matter and
policy has a role in limiting volatility.
Anticipated intervention decreased turnover, so expectations from intervention were
stabilizing and not perverse. They dampened rupee volatility. Since markets form
expectations of intervention activity and respond strategically to it, more transparency
may reduce the scope for such arbitrage. Although more transparency could reduce
speculative positions, a diffuse target may work better. Estimated strategic market
behavior and model derivations both indicated intervention and signaling to be an
effective influence on exchange rates in the Indian context.
The interest rate differential had weak effects on the exchange rate but strong effects
on market turnover. With the extant level of controls, the effect of the interest rate on
the domestic cycle was stronger than its effect on the exchange rate. Given the
evidence of the impact of policy on markets, more transparent intervention may
effectively influence exchange rates in the Indian context, leaving interest rates free to
target the domestic cycle. Next we turn to examining the efficacy of market
restrictions in more detail.

20
2.3. Impact of measures on domestic markets
The repeated scams and financial mishaps of the nineties demonstrated the fragility of
a controlled system. Therefore financial reforms towards steady market deepening
were undertaken. But the global financial crisis demonstrated the wisdom of India’s
slow and steady approach to market liberalization, and the necessity of prudential
regulation to reduce risk-taking. Action on the INR was not, however, always
consistent with these lessons. Sometimes actions were too hasty and cautious steps
forward to deepen domestic markets were reversed, but did not always succeed in
reducing rupee volatility.
On December 15, 2011 the RBI reduced banks net open position limits (NOPL) by
75%. This forced MNCs banks to close their huge long USD positions. Bank boards
did not want to have to report a fine paid to RBI for non-compliance. On
representation the RBI clarified that genuine trade-based positions would be allowed.
They also cancelled rebooking of forwards (corporates were shifting hedging band to
55-60, paying the option fee of 2 percent). These measures to reduce speculation by
exporters and banks appreciated INR/USD from 54.2 to 52.7 (Table 1). The Rupee
was back at 50 within a month.
Adverse tax measures in the March 2012 budget triggered outflows again and the INR
again reached 55. Netting of positions in currency futures/ options with over-the-
counter (OTC) positions was disallowed and position limits of banks further reduced
in May 2012 but the next week saw the INR further depreciate by 0.90. Over June and
July 2013 foreign banks open positions in INR/ USD was reduced to almost zero and
any proprietary activity by banks in currency futures was banned, but depreciation
continued.

21
Figure 1: FX market turnover (USD billion)
Figure 1 shows various market restrictive measures reduced market turnover sharply
in the currency derivatives markets in exchanges, while total turnover including the
dominant over-the-counter (OTC) FX trading in banks also fell. This suggests the two
types of markets are complements rather than substitutes. Banks are some of the
largest traders on exchanges. Exchanges are thought to be dominated by speculative
position-taking since no real underlying is required unlike in the RBI regulated OTC
markets. But in FX markets worldwide portfolio rebalancing types of transactions
between market makers are normally much larger than those based on real exposures.
These allow banks, as well as small firms that may not get a good deal at banks, to
lay-off risks in futures markets. Futures markets are more transparent and equitable
but expectations are especially important in such markets and can lead to one-way
positions, so prudential regulations are important.
Table 2: Rise in cross border derivatives
Total Outright Forwards
Domestic: net-gross basis Global INR: net-net basis
$m
Cross
border %
% of
spot $m
Cross
border % % of spot
Apr-13 3,743 14.64 24.19 24,395 60.43 160.23
Apr-10 4,895 8.56 36.50 13,620 52.11 100.69 Note: Net-gross basis adjusts for local inter-dealer double counting. Net-net basis
adjusts for local and cross-border inter-dealer double counting. BIS (2013) warn
turnover for years prior to 2013 may be under-reported, especially for EMs.
0
20
40
60
80
100
120
140
160
180
0
200
400
600
800
1000
1200
1-J
an-1
0
1-M
ar-1
0
1-M
ay-1
0
1-J
ul-
10
1-S
ep-1
0
1-N
ov-
10
1-J
an-1
1
1-M
ar-1
1
1-M
ay-1
1
1-J
ul-
11
1-S
ep-1
1
1-N
ov-
11
1-J
an-1
2
1-M
ar-1
2
1-M
ay-1
2
1-J
ul-
12
1-S
ep-1
2
1-N
ov-
12
1-J
an-1
3
1-M
ar-1
3
1-M
ay-1
3
1-J
ul-
13
1-S
ep-1
3
Turn
ove
r at
exc
han
ges
Tota
l tu
rno
ver
Total turnover (left axis) Turnover at exchanges (right axis)
Dec 15 2011:
NOPL ; no rebooking of forwards
May 21 2012: No netting with OTC;
NOPL for futures & options
9-23 July 2013: Interest rate INR defence
Aug 12 2011: Transaction charges

22
The other effect of restrictions was offshore markets grew at the expense of domestic
markets. In more open regimes, restricting domestic markets encourages transactions
to migrate abroad. Though an accurate assessment of the volumes is difficult,
estimated daily INR NDF turnover was around US $ 100 million in 2003/2004 and
grew substantially since. By April 2013 it exceeded onshore trading12
. Onshore
market affects price discovery in INR NDF market. However, in volatile market
conditions NDF markets influence spot and forward onshore markets. A large spread
between INR NDF rate and INR futures/forward rate impacts the spot rates
significantly. The INR forward rate is influenced by the movement of INR NDF
futures and spot rates with some lag (Behera, 2011). Although such markets create
problems for policy, they normally wither away as domestic markets deepen (Ho and
McCauley, 2004).
Although they are difficult to measure precisely BIS (2010 Table E6, 2013 Table 6.3)
shows OTC INR turnover (net-gross basis) outside the country rose from 50% (20.8
USD bn) in 2010 to 59% (36.3USD bn) in 2013 of the total turnover. Table 4.2 shows
the sharp rise in INR forwards, which include NDF, between 2010 and 2013 when
domestic restrictions were imposed. The rise as well as much higher net-net compared
to net-gross value shows much of the growth was abroad13
. A rising share of the non-
deliverable forward market is against the objective of developing and deepening
domestic markets. Moreover, domestic regulators are unable to influence offshore
markets. Therefore using prudential regulations instead of forbidding transactions,
would also have the advantage of not driving markets overseas.
2.4. Encouraging hedging
A conviction of possible two-way movement of the exchange rate, large enough to
deliver a substantial loss to one-way bets is a pre-requisite for hedging or the laying
off of currency exposure. Despite deepening FX markets, the moderate two-way
movement within an implicit 5% band seen over 2004-06 was not sufficient to
overcome strong expectations of medium term appreciation given India’s high growth
12
Mecklai (2011) argues it had become higher even by 2011. 13
It is noteworthy that the relative size of forwards in net-net global GBP trade and net-gross trade in
UK is reversed for the deepest FX market, UK. In April 2013, the net-gross at USD 309bn was much
larger than net-net at USD 69 bn. FX trade in the UK is very large in currencies other than the GBP,
including the INR. It follows a large share of transactions involving the INR occur abroad. Relative
turnover sizes for other EMs are like that for India.
23
rate. In 2007, market expectations of the INR/USD rate had even reached 32. Many
corporates borrowed abroad based on such expectations, increasing currency risk.
Some had entered into so called hedging deals, which were actually bets on the value
of the Swiss Franc. With the volatility in currency markets and steep rupee
depreciation in 2008 many firms lost money. Many such deals, where Indian banks
were often a front for foreign banks, sidestepped existing rules that prevented leverage
or underlying risk that exceeded export income. Although firms were not allowed to
write options deals were structured so that in effect firms were writing options. The
deals were so complex that firms sometimes did not understand what risks they were
taking. After post GFC episodes of excess volatility, the rupee was managed and
stayed in a tight band of INR/USD 64-66 over September 2013-December 2014.
Since international interest rates were much lower than Indian rates firms were again
tempted into unhedged foreign borrowing, although such borrowing, for example,
through ECB, was capped. Even so, gross ECBs worth around USD 264.4 bn came in
from 2001 until Oct 2014. Refinancing takes up a large share14
. Not hedging is
dangerous since the bulk of the borrowing was by infrastructure firms that do not have
any natural hedge in the shape of exports.
Thus availability of more instruments, alone, only makes leveraged speculation, or
bets on future currency value, possible. Establishing inducement to hedge through
sufficient flexibility of the exchange rate, along with transparency, clarity and
information, and strategic use of controls, are more important (Shiller, 1993, Shefrin,
2002). Completing markets will not by itself reduce speculation. Incentives have to be
changed, and better information provided on fundamentals.
3. FX Markets and Policy
Well-designed signals can help use the structure of FX markets with varying trader
information levels to achieve policy objectives such as reducing exchange rate
volatility. An EM is likely to have a larger share of poorly informed traders.
Jeanne and Rose (2002) have a model with informed and noise traders (n) in an FX
market. The benefit of entry for noise traders rises with excess returns or risk, ρ, but
14
For example, of the USD 2.8bn that came in October 2014 28% was for refinancing.
24
falls with the variance of the spot rate, var (S). But both ρ and var (S) are functions of
n. A rise in n lowers ρ since a larger number of traders are demanding the currency
thus spreading risk; but raises var (S) since entry raises volatility and therefore risk.
Both reduce entry. But the rise in var (S) itself raises ρ, thus increasing entry. Noise
traders therefore have two counteracting roles. They both create risk and share risk,
making multiple equilibria possible.
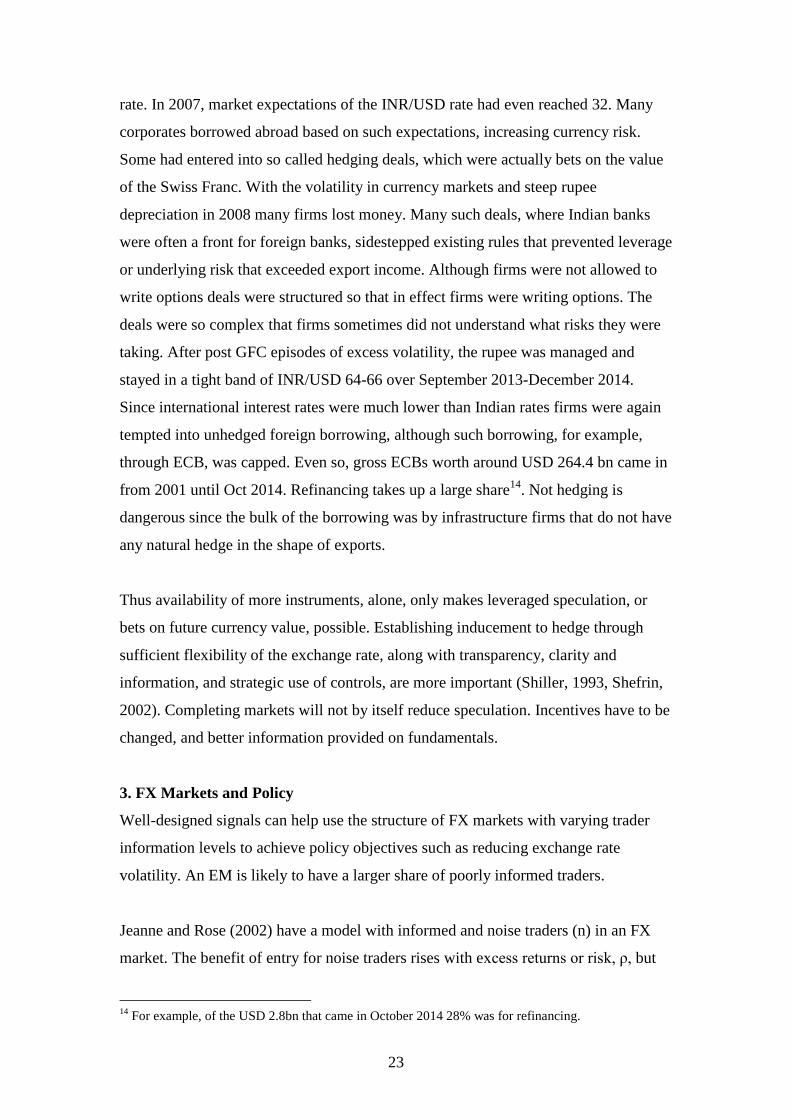
This can be shown in a simple diagrammatic device following Goyal (2006). G(n), the
function giving the returns to noise trader entry is graphed against n in Figure 4.3. The
two opposing effects of n on G(n) give the curve the shape shown in the Figure
(derived in the appendix). At low n G is high since var (S) is low. It falls as more n
share risk reducing ρ. But further entry creates risk raising var (S) and ρ. At high n G
rises again, as the rise in ρ dominates that in var (S).
The lowest dashed curve is the case where fundamentals are strong. Therefore excess
returns are so low that it is not worthwhile for any noise trader to enter. Point O is a
stable equilibrium, as is C’, on the upper dashed curve. On this curve, fundamentals
are so weak that all the noise traders enter. Multiple equilibria occur for intermediate
fundamentals when G(n) is such that it cuts the 45 line. These are equilibria since G
= n at these points. A is stable since for a small departure from A, net returns are such
as to bring entry back to n*. C is also stable. But B is unstable. Here the curve cuts the
A
B
C
O
C’ G(n)
n* n n
Figure 3: Entry of noise traders in FX
markets

25
45 line from below15
. So a small rise in n raises returns and induces more entry until
C is reached. A small fall in n reduces returns and entry until A is reached.
At C’ and C all noise traders enter. At A, var(S), and therefore entry n are all low; at
C var(S) and are both high and maximum entry n takes place. Between AB, since
G(n) < n, entry falls back to n* at A; between CB, since G(n) > n, entry rises and n
increases to n at C. Therefore O, A, C and C are stable equilibria, while B is
unstable. It follows exchange rate volatility can be low if fundamental variance is low,
but it can be either high or low for intermediate levels of fundamentals.
Monetary policy can improve welfare if it leads to the selection of low volatility
equilibria. It can do this by committing to var(S) v. Then fewer n enter, this
decreases var(S) leading to the selection of the low entry equilibrium A. This is a
policy free lunch since markets help monetary policy achieve the reduced volatility it
had committed to.
A stable exchange rate regime, where policy constrains var(S) to be less than or equal
to v, leads to lower entry of noise traders taking the economy to an equilibrium with
low exchange rate variance16
. Although there is a loss of monetary autonomy in
adopting the restriction on var(S), the loss is of second order, as the level of noise in
the economy is decreased. Monetary policy response function is constrained out of
equilibrium, but there is no sacrifice of monetary autonomy in equilibrium. In the post
GFC period Indian exchange rate volatility was allowed to rise too much, while there
were also periods when it was too low. Goyal and Arora (2012) give evidence CB
speeches affect the exchange rate but over the period signals were poorly used. Table
4.1 shows this in 2011 but indicates improvement in 2013.
4. Conclusion
15
The style of proof is similar to the well-known Keynesian cross where the aggregate demand line
cuts the 45 aggregate supply line from above in a stable equilibrium. The intuition is similar in the
fixed point theorems used in general equilibrium theory. The proof following Goyal (2006), a major
simplification of that used in Jeanne and Rose (2002), is given in the Appendix. 16
Such an induced entry of noise traders was illustrated by the large-scale shorting of the INR in
December 2011 after the CB’s communications were taken to imply it would not intervene to support
the rupee.

26
The paper gives an overview of international and Indian FX markets and discusses
market microstructure concepts such as ‘order flow’, bid-ask spreads, limit order,
novation, netting, settlement and counter-party risk, electronic broker and crossing
systems, inventory risk and ‘hot potato’ trading. It also records the very large size of
FX transactions and the growth and deepening of Indian FX markets aided by steady
regulatory changes. OTC and bilateral transactions dominate in FX markets, but it is
not yet clear if technological changes and the international post global crisis
regulatory emphasis on transparency will lead to more exchange trading. It may be
that FX markets are fundamentally different, with the bilateral market structure
essential for stability.
It also draws out the implications of structure for CB intervention, signaling, and
exchange rate policy especially in an EM. Committing to a low exchange rate
volatility regime provides something like a free lunch to monetary policy, because, as
the analysis in the last section showed, entry of noise traders is reduced leading to
lower volatility. In an EM there tends to be greater uncertainty about fundamentals.
This tends to make the speculative demand curve well behaved under strategic
interaction between differentially informed speculators and the Central Bank (CB). A
diffuse exchange rate target and strategic revelation of selected information can be
expected, therefore, to be effective. Indian experience supports these results.
Post GFC experience even delivers an effectiveness ranking of policy actions
influencing the exchange rate at the current state of capital account convertibility. The
most effective is to address fundamental weaknesses that can trigger adverse
expectations, but second, reserves and signaling can be used to smooth market
demand and supply keeping the exchange rate within bounds. The efficacy of
building-up reserves, using them in targeted intervention, and of credible
communication to markets was clearly demonstrated. Since capital flows do not
always match the net import gap, a CB should be ready to close any short-term
demand supply mismatch. Reserves can be built up again during periods of excessive
inflows.
Prudential measures such as reducing open positions worked better than a ban on a
market or a transaction-type. But it reverses attempts to deepen markets and leads to a

27
migration of activity abroad. If market restrictions become necessary, therefore, they
should be carefully targeted. Even if credit curbs are used they should apply only to
specific commodities such as gold imports. Since these administrative measures
reduce one-way positions, a general liquidity squeeze such as an interest rate defense
that hits other markets, should be avoided. EMs should continue the push for greater
global policy coordination and measures that reduce the financial over-leverage that
leads to capital flow volatility, even while developing regional safety nets.
References
Lyons, R.K. 2001. The Microstructure Approach to Exchange Rates, Cambridge,
MA: MIT Press.
BIS (Bank of International Settlements). 2013. ‘Triennial Central Bank Survey of
foreign exchange and derivatives market activity in 2013’. December, and earlier
reports. http://www.bis.org/publ/rpfx13.htm.
Caballero, R. and A. Krishnamurthy. 2004. ‘Smoothing sudden stops’. Journal of
Economic Theory. 2001 working paper version http://www.nber.org/papers/w8427
Geithner, T. J. 2004. ‘Hedge funds and their implications for the financial system’.
Federal Reserve Bank of New York. Available at
http://www.newyorkfed.org/newsevents/speeches/2004/gei041117.html
RBI. 1995. ‘Report of the expert group on foreign exchange markets in India’
(Sodhani Committee Report). June. Reserve Bank of India: Mumbai.
Tarapore, S.S. 2006. ‘Report of the committee on Fuller capital account
convertibility’. Reserve Bank of India: Mumbai
IMF. 2008. ‘India: selected issues’. IMF Country Report No. 08/52 January.
International Monetary Fund: Washington.
Hart, O.D. and D.M. Kreps. 1986. ‘Price destabilising speculation’. Journal of
Political Economy, 94 (5), pp: 927-952.
Burnside, C., M. Eichenbaum, S. Rebelo. 2001. ‘Hedging and financial fragility in
fixed exchange rate regimes’. European Economic Review, 45, pp: 1151-1193.
Jeanne, O., and A.K. Rose. 2002. ‘Noise trading and exchange rate regimes.’ The
Quarterly Journal of Economics, 117 (469), pp: 537-570.
Goyal, A. 2015. 'External Shocks', Chapter 3 in S. Mahendra Dev (ed.), India
Development Report 2015, New Delhi: IGIDR and Oxford University Press, pp. 36-
51. Earlier version available at http://www.igidr.ac.in/pdf/publication/WP-2014-
046.pdf.
28
Goyal, A. 2006. ‘Exchange rate regimes: middling through’. Global Economic
Review, 35 (2), pp: 153-176. June.
Goyal, A. and S. Arora. 2012. ‘The Indian Exchange Rate and Central Bank Action:
An EGARCH Analysis’, Journal of Asian Economics. 23(1), February, 2012.
Goyal, A., R. A. Nair and A. Samantaraya. 2009. ‘Monetary policy, forex markets,
and feedback under uncertainty in an opening economy’. Development Research
Group, Department of Economic Analysis and Policy, Mumbai, Study No. 32.
Available at http://rbidocs.rbi.org.in/rdocs/Publications/PDFs/DRGMP030909.pdf
Mecklai, J. 2010a. ‘Market Maniac: Bringing hedgers to the futures market, Business
Standard, January 8. Available at http://www.business-
standard.com/article/opinion/jamal-mecklai-bringing-hedgers-to-the-futures-market-
110010800002_1.html
Mecklai, J. 2010b. ‘Market Maniac: The OTC-FX market—Falling behind the curve’,
Business Standard, October 1. Available at http://www.business-
standard.com/article/opinion/jamal-mecklai-otc-fx-market-falling-behind-the-curve-
110100100093_1.html
Mecklai, J. 2011. ‘Market Maniac: Has RBI lost control of the rupee?’, Business
Standard, July 1. Available at http://www.business-
standard.com/article/opinion/jamal-mecklai-has-rbi-lost-control-of-the-rupee-
111070100044_1.html
Rathinam, F. X. and D. Arora. 2011. ‘OTC derivatives markets in India: recent
regulatory initiatives and open issues for market stability and development’.
Macroeconomics and Finance in Emerging Market Economies, 4 (2), pp: 235-261.
September. Available at
http://www.tandfonline.com/doi/pdf/10.1080/17520843.2011.580571.
Sager, M.J. and M. P. Taylor. 2006. ‘Under the microscope: the structure of the
foreign exchange market’. International Journal of Finance and Economics. 11, pp:
81-95.
Ma, G., C. Ho and R. N. McCauley. 2004. ‘The markets for non-deliverable forwards
in Asian currencies’. BIS Quarterly Review, pp: 81-94. June.- Not referred
Behera, H. 2011. ‘Onshore and offshore market for Indian rupee: recent evidence on
volatility and shock spillover’. Macroeconomics and Finance in Emerging Market
Economies, 4 (1), pp: 43-55.
Shefrin, H. 2002. Beyond Greed and Fear: Understanding Behavioral Finance and
the Psychology of Investing. Oxford: Oxford University Press. .- Not referred
Shiller, R.J. 1993. Creating Institutions for Managing Society’s Largest Economic
Risks, Clarendon Lectures in Economics, Clarendon Press: Oxford. .- Not referred
29
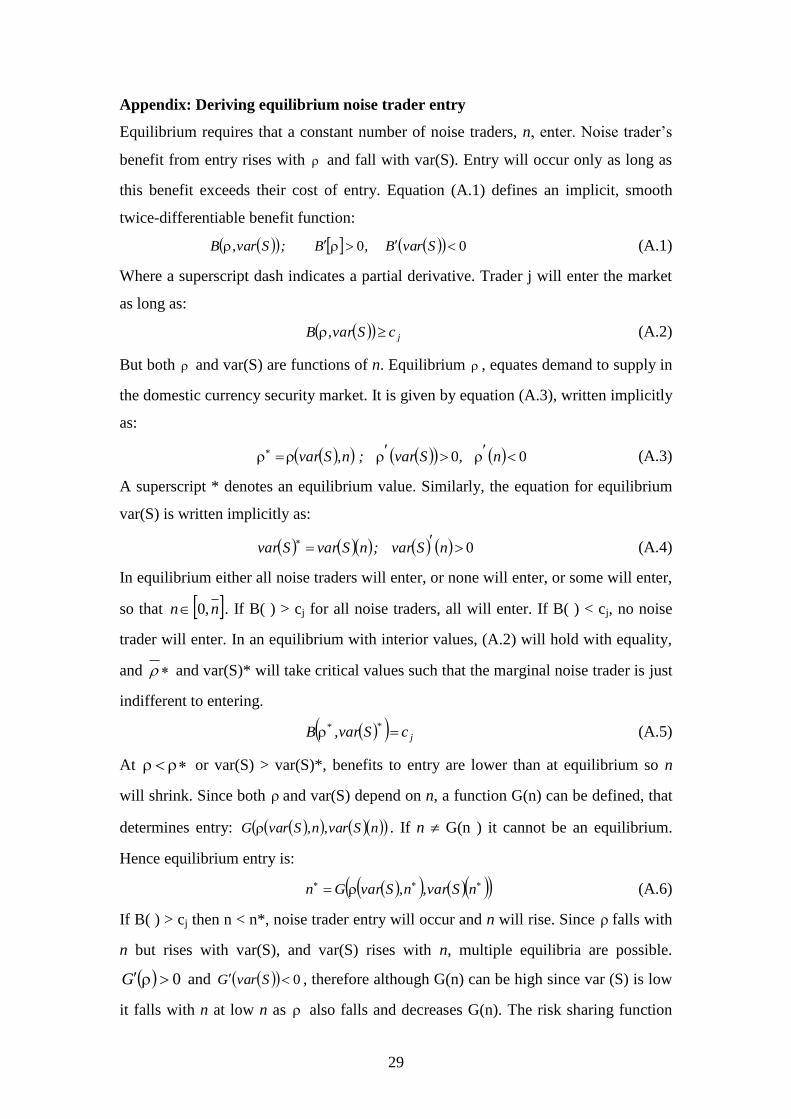
Appendix: Deriving equilibrium noise trader entry
Equilibrium requires that a constant number of noise traders, n, enter. Noise trader’s
benefit from entry rises with and fall with var(S). Entry will occur only as long as
this benefit exceeds their cost of entry. Equation (A.1) defines an implicit, smooth
twice-differentiable benefit function:
00 SvarB,B;Svar,B (A.1)
Where a superscript dash indicates a partial derivative. Trader j will enter the market
as long as:
jcSvar,B (A.2)
But both and var(S) are functions of n. Equilibrium , equates demand to supply in
the domestic currency security market. It is given by equation (A.3), written implicitly
as:
00 n,Svar;n,Svar (A.3)
A superscript * denotes an equilibrium value. Similarly, the equation for equilibrium
var(S) is written implicitly as:
0
nSvar;nSvarSvar (A.4)
In equilibrium either all noise traders will enter, or none will enter, or some will enter,
so that nn ,0 . If B( ) > cj for all noise traders, all will enter. If B( ) < cj, no noise
trader will enter. In an equilibrium with interior values, (A.2) will hold with equality,
and and var(S)* will take critical values such that the marginal noise trader is just
indifferent to entering.
j
** cSvar,B (A.5)
At or var(S) > var(S)*, benefits to entry are lower than at equilibrium so n
will shrink. Since both and var(S) depend on n, a function G(n) can be defined, that
determines entry: nSvar,n,SvarG . If n G(n ) it cannot be an equilibrium.
Hence equilibrium entry is:
nSvar,n,SvarGn (A.6)
If B( ) > cj then n < n*, noise trader entry will occur and n will rise. Since falls with
n but rises with var(S), and var(S) rises with n, multiple equilibria are possible.
0G and 0 SvarG , therefore although G(n) can be high since var (S) is low
it falls with n at low n as also falls and decreases G(n). The risk sharing function

30
dominates. But at high n, the positive effect of n on var(S) and therefore on will
dominate—will rise as risk rises. Hence G(n) will also rise with n at high n.
Therefore equilibria are possible both at low and at high n. Either a few or a large
number of noise traders will enter the FX market. But, in each equilibrium n takes a
fixed value, given by the function G(n). Noise traders create risk so var(S) rises and
falls with their entry (n). But also rises with var(S), since they also share the risk
they themselves create.