foreign direct investment in the united states tables direct investment in the united states tables...
TRANSCRIPT

Foreign Direct Investment in the United States Tables Detailed Historical-Cost Positions and
Related Financial Transactions and Income Flows
The statistics on foreign direct investment in the United States, or inward direct investment, for 2014– 2016 are presented in the following tables. The statis-tics on inward direct investment position and related financial transactions and income flows are presented
General Notes to the Tables ● Detail may not add to totals because of rounding. ● An asterisk “(*)” indicates a nonzero value between
–$500,000 and $500,000, between –0.5 percent and 0.5 percent, or a reinvestment ratio greater than zero but less than 0.005.
● A “(D)” indicates that the data in the cell have been suppressed to avoid the disclosure of data of indi-vidual companies.
● The European Union (28) includes Austria, Bel-gium, Bulgaria, Croatia, Cyprus, the Czech Repub-lic, Denmark, Estonia, Finland, France, Germany,
in tables 1–17. The statistics in tables 3–17 for 1980 –2016 are avail-able in interactive tables on the Bureau of Economic Analysis Web site.
Greece, Hungary, Ireland, Italy, Latvia, Lithuania, Luxembourg, Malta, the Netherlands, Poland, Por-tugal, Romania, Slovakia, Slovenia, Spain, Sweden, and the United Kingdom.
● OPEC (Organization of Petroleum Exporting Countries) includes Algeria, Angola, Ecuador, Gabon, Indonesia, Iran, Iraq, Kuwait, Libya, Nige-ria, Qatar, Saudi Arabia, the United Arab Emirates, and Venezuela.
● The “United Kingdom Islands, Caribbean” consists of the British Virgin Islands, the Cayman Islands, Montserrat, and the Turks and Caicos Islands.
Table 1. Alternative Position and Rate-of-Return Estimates for Foreign Direct Investment in the United States, 2013–2016
Valuation method
Millions of dollars
Position at yearend
2013
Changes in 2014 (decrease (–))
Position at yearend
2014
Changes in 2015 (decrease (–))
Position at yearend
2015
Changes in 2016 (decrease (–))
Position at yearend
2016Total
Attributable to:
Total
Attributable to:
Total
Attributable to:
Financial transactions1
(inflows (+))
Other changes in
position
Financial transactions1
(inflows (+))
Other changes in
position
Financial transactions1
(inflows (+))
Other changes in
position
Historical cost ........................... Current cost.............................. Market value .............................
2,727,825 3,320,861 4,948,418
217,970 219,793 508,470
201,733 212,325 212,325
16,237 7,468
296,145
2,945,795 3,540,654 5,456,888
357,791 389,080 252,770
465,765 476,684 476,684
–107,974 –87,604
–223,914
3,303,586 3,929,734 5,709,658
421,832 461,898 845,964
457,125 468,330 468,330
–35,293 –6,432
377,634
3,725,418 4,391,632 6,555,622
Valuation method
Millions of dollars Percent
Direct investment income Direct investment position at yearend Rate of return
2013 2014 2015 2016 2012 2013 2014 2015 2016 2013 2014 2015 2016
Historical cost 2 ......................... Current cost 3 ............................ Market value 4 ...........................
168,235 184,115 128,736
177,294 187,886 150,195
148,335 159,254 111,386
159,749 170,954 140,043
2,584,708 3,158,652 3,915,805
2,727,825 3,320,861 4,948,418
2,945,795 3,540,654 5,456,888
3,303,586 3,929,734 5,709,658
3,725,418 4,391,632 6,555,622
6.3 5.7 2.9
6.2 5.5 2.9
4.7 4.3 2.0
4.5 4.1 2.3
1. Historical-cost financial transactions include reinvestment of earnings without the current-cost adjustment, and current-cost and market-value financial transactions include reinvestment of earnings with the adjustment.
2. Historical-cost direct investment income excludes capital gains and losses and the current-cost adjust-ment to income on equity. The historical-cost rate of return equals this measure of income divided by the average of the beginning- and end-of-year historical-cost direct investment positions. In accordance with inter-national guidelines, this measure of income, like the other measures in this table, is recorded gross (before deduction) of U.S. and foreign withholding taxes on dividends and withdrawals and interest.
3. Current-cost direct investment income excludes capital gains and losses and includes a current-cost
adjustment to income on equity that adjusts depreciation to reflect current-period prices and excludes depletion charges, as required for the national and international economic accounts. The current-cost rate of return equals this measure of income divided by the average of the beginning- and end-of-year current-cost direct investment positions.
4. Market-value direct investment income measures the financial return to investors, so it includes capital gains and losses of the affiliate but excludes the current-cost adjustment. The market-value rate of return equals this measure of income divided by the average of the beginning- and end-of-year market-value direct investment positions.

Table 2. Foreign Direct Investment in the United States: Position and Balance of Payments Flows, 2005–2016 [Millions of dollars]
Position, financial transactions, and income as shown in tables 3–17 2005 2006 1 2007 2 2008 2009 2010 2011 2012 2013 2014 2015 2016
Direct investment position on a historical-cost basis ......................... 1,634,121 1,840,463 1,993,156 2,046,662 2,069,438 2,280,044 2,433,848 2,584,708 2,727,825 2,945,795 3,303,586 3,725,418 Financial transactions without current-cost adjustment
(inflows (+)) ......................................................................................... 104,773 237,136 215,952 306,366 143,604 198,049 229,862 199,034 201,393 201,733 465,765 457,125 Equity other than reinvestment of earnings........................................... 70,725 115,027 142,253 255,724 126,814 140,474 106,462 119,775 124,103 51,570 309,413 254,097 Reinvestment of earnings...................................................................... 33,869 63,101 42,951 35,411 14,814 54,871 72,383 79,210 71,787 84,250 69,828 86,467 Debt instruments ................................................................................... 180 59,008 30,748 15,231 1,977 2,703 51,017 49 5,504 65,913 86,524 116,561
Income without current-cost adjustment ............................................. 113,538 144,755 120,960 125,721 97,990 145,088 165,968 160,328 168,235 177,294 148,335 159,749
As shown in the international investment position (IIP) accounts in IIP table 2.1 and the international transactions accounts
in tables 4.2 and 6.1 2005 2006 1 2007 2 2008 2009 2010 2011 2012 2013 2014 2015 2016
Direct investment position At current cost..................................................................................... 2,007,151 2,255,955 2,463,600 2,598,789 2,560,407 2,791,358 2,990,410 3,158,652 3,320,861 3,540,654 3,929,734 4,391,632 At market value.................................................................................... 2,817,970 3,293,053 3,551,307 2,486,446 2,995,459 3,422,293 3,498,726 3,915,805 4,948,418 5,456,888 5,709,658 6,555,622
Financial transactions (inflows (+))....................................................... 116,656 247,327 227,714 318,449 157,737 210,544 242,155 211,468 217,273 212,326 476,684 468,330 Equity other than reinvestment of earnings........................................... 70,725 115,027 142,253 255,724 126,814 140,474 106,462 119,775 124,103 51,570 309,413 254,097 Reinvestment of earnings...................................................................... 45,752 73,292 54,714 47,494 28,946 67,367 84,676 91,643 87,667 94,842 80,747 97,672 Debt instruments ................................................................................... 180 59,008 30,748 15,231 1,977 2,703 51,017 49 5,504 65,913 86,524 116,561
Income ..................................................................................................... 125,420 154,946 132,723 137,804 112,123 157,584 178,262 172,762 184,115 187,886 159,254 170,954
1. Prior to 2006, the income statistics in the top panel are presented net, or after deduction, of U.S. and foreign with- because of the reclassification of permanent debt and associated interest, a component of income, between affiliated holding taxes. Beginning with 2006, these statistics are presented gross, or before deduction, of U.S. and foreign with- depository institutions from direct investment to other investment accounts. holding taxes. NOTE. See the text for details on how the statistics in the top panel differ from those in the international investment posi-
2. The direct investment position, financial transactions, and income reflect a discontinuity between 2006 and 2007 tion accounts and the international transactions accounts.

To print selected tables, use the Print option on the drop down menu under File at the top, then choose Current Page or Pages (for example choose 3-4 or 37).
3.Foreign Direct Investment Position in the United States on a Historical-Cost Basis, 2014–2016...........................2
4.Foreign Direct Investment Position in the United States on a Historical-Cost Basis by Account, 2014–2016...........4
5.1. Change in the Historical-Cost Foreign Direct Investment Position in the United States by Account, 2014.........10
5.2. Change in the Historical-Cost Foreign Direct Investment Position in the United States by Account, 2015..........14
5.3. Change in the Historical-Cost Foreign Direct Investment Position in the United States by Account, 2016..........18
6. Foreign Direct Investment in the United States: Income on Equity Without Current-Cost Adjustment and Reinvestment Ratios, 2014-2016.........................22
7.Foreign Direct Investment in the United States: Income Without Current-Cost Adjustment, 2014–2016...........28
8.1. Foreign Direct Investment Position in the United States on a Historical-Cost Basis, 2014..............................34
8.2. Foreign Direct Investment Position in the United States on a Historical-Cost Basis, 2015.............................36
8.3. Foreign Direct Investment Position in the United States on a Historical-Cost Basis, 2016..............................38
9.1. Foreign Direct Investment in the United States: Financial Transactions Without Current-Cost Adjustment, 2014...............................................................40
9.2. Foreign Direct Investment in the United States: Financial Transactions Without Current-Cost Adjustment, 2015..............................................................42
9.3. Foreign Direct Investment in the United States: Financial Transactions Without Current-Cost Adjustment, 2016...............................................................44
10.1. Foreign Direct Investment in the United States: Equity Other Than Reinvestment of Earnings, 2014..............................................................................46
10.2. Foreign Direct Investment in the United States: Equity Other Than Reinvestment of Earnings, 2015..............................................................................48
10.3. Foreign Direct Investment in the United States: Equity Other Than Reinvestment of Earnings, 2016..............................................................................50
11.1. Foreign Direct Investment in the United States: Reinvestment of Earnings Without Current-Cost Adjustment, 2014..........................................................52
11.2. Foreign Direct Investment in the United States: Reinvestment of Earnings Without Current-Cost Adjustment, 2015..........................................................54
11.3. Foreign Direct Investment in the United States: Reinvestment of Earnings Without Current-Cost Adjustment, 2016..........................................................56
12.1. Foreign Direct Investment in the United States: Debt Instruments, 2014.................................................58
12.2. Foreign Direct Investment in the United States: Debt Instruments, 2015.................................................60
12.3. Foreign Direct Investment in the United States: Debt Instruments, 2016..............................................62
13.1. Foreign Direct Investment in the United States: Income Without Current-Cost Adjustment, 2014............64
13.2. Foreign Direct Investment in the United States: Income Without Current-Cost Adjustment, 2015............66
13.3. Foreign Direct Investment in the United States: Income Without Current-Cost Adjustment, 2016................68
14.Foreign Direct Investment in the United States: Selected Items by Detailed Country, 2012–2016........70
15. Foreign Direct Investment in the United States: Selected Items by Detailed Industry of U.S. Affiliate, 2012–2016........................................................82
16. Historical-Cost Foreign Direct Investment Position in the United States and Income Without Current-Cost Adjustment, by Country of Foreign-Parent-Group Member and of the Ultimate Beneficial Owner, 2014-2016.................100
17. Historical-Cost Foreign Direct Investment Position in the United States by Industry of the Ultimate Beneficial Owner, 2014-2016.....................................................................103
1

Bureau of Economic AnalysisTable 3. Foreign Direct Investment Position in the United States on a Historical-Cost Basis,2014–2016 [Millions of dollars]Release Date: July 24, 2017
2014 2015 2016 All areas 2,945,795 3,303,586 3,725,418
Manufacturing 1,114,540 1,362,109 1,532,365 Wholesale trade 332,424 362,747 367,596 Retail trade 58,911 63,245 72,403 Information 147,618 169,861 185,806 Depository institutions (banking) 198,002 193,436 190,665 Finance (except depository institutions) and insurance 385,997 407,227 504,780
Real estate and rental and leasing 65,374 74,759 82,261 Professional, scientific, and technical services 130,015 154,272 197,948 Other industries 512,914 515,930 591,595
Canada 273,896 322,118 371,468 Manufacturing 80,981 114,373 114,760 Wholesale trade 8,246 20,259 21,677 Retail trade 7,733 7,727 7,942 Information 4,398 6,326 7,667 Depository institutions (banking) 42,968 46,901 (D) Finance (except depository institutions) and insurance 50,272 55,008 62,441
Real estate and rental and leasing 7,576 10,378 11,449 Professional, scientific, and technical services 5,113 7,844 8,738 Other industries 66,609 53,301 (D)
Europe 2,004,199 2,276,695 2,605,559 Manufacturing 839,633 1,036,344 1,195,643 Wholesale trade 160,869 179,099 187,257 Retail trade 42,432 46,613 54,761 Information 114,011 134,494 148,651 Depository institutions (banking) 116,269 105,188 94,526 Finance (except depository institutions) and insurance 264,876 265,829 333,427
Real estate and rental and leasing 34,107 36,364 39,275 Professional, scientific, and technical services 101,494 121,578 163,701 Other industries 330,507 351,186 388,319 Of which:
United Kingdom Manufacturing 172,935 214,693 235,364 Wholesale trade 29,097 34,677 28,382 Retail trade 2,109 3,719 4,789 Information 21,030 30,499 30,563 Depository institutions (banking) 57,276 (D) (D) Finance (except depository institutions) and insurance 55,182 56,028 78,491
Real estate and rental and leasing 2,992 8,672 10,688 Professional, scientific, and technical services 31,024 10,793 14,311
Other industries 107,730 (D) (D) Latin America and Other Western Hemisphere 117,051 117,301 124,798
Manufacturing 32,111 36,079 21,982 Wholesale trade 8,870 1,748 5,160 Retail trade (D) (D) 1,218 Information 1,044 1,412 2,175 Depository institutions (banking) 5,756 6,944 6,665 Finance (except depository institutions) and insurance 10,363 9,055 (D)
Real estate and rental and leasing 9,165 10,147 10,454 Professional, scientific, and technical services 4,342 4,563 4,363 Other industries (D) (D) (D)
479,373 512,139 555,687
Continues on next page
2

Bureau of Economic AnalysisTable 3. Foreign Direct Investment Position in the United States on a Historical-Cost Basis,2014–2016 [Millions of dollars]Release Date: July 24, 2017
2014 2015 2016 Africa
Manufacturing Wholesale trade Retail trade Information Depository institutions (banking) Finance (except depository institutions) and insurance Real estate and rental and leasing Professional, scientific, and technical services Other industries
Middle East Manufacturing Wholesale trade Retail trade Information Depository institutions (banking) Finance (except depository institutions) and insurance Real estate and rental and leasing Professional, scientific, and technical services Other industries
Asia and Pacific Manufacturing Wholesale trade Retail trade Information Depository institutions (banking) Finance (except depository institutions) and insurance Real estate and rental and leasing Professional, scientific, and technical services Other industries
1,691 -126
(D) (D) (D) (D)
9
528 (D) (D)
16,467 2,551
(D) (D) (D) (D)
2,139
1,643 (D)
2,337 532,491 159,390 148,870
6,597 27,275 31,134
58,337
12,355 19,075 69,457
4,330 (D) (D) (D) (D) (D)
10
518 110 (D)
18,169 (D) (D) (D) (D) (D)
2,166
1,707 -43
2,021 564,974 169,058 155,770
7,739 26,826 32,374
75,158
15,646 20,220 62,182
4,394 2,320
(D) (D)
9 (D)
7
520 112
1,137 19,826
3,731 (D) (D) 851 (D)
(D)
2,963 853
2,058 599,373 193,928 146,923
8,431 26,452 36,312
87,047
17,601 20,181 62,498
3

Bureau of Economic AnalysisTable 4. Foreign Direct Investment Position in the United States on a Historical-Cost Basis byAccount, 2014-2016 [Millions of dollars]Release Date: July 24, 2017
2014 Debt instrumentsEquityTotal /1/ Net U.S. affiliates'
payables U.S. affiliates' receivables
All areas 2,945,795 2,384,659 561,136 945,814 384,678 Manufacturing 1,114,540 833,996 280,545 417,446 136,901 Wholesale trade 332,424 242,421 90,003 143,381 53,379 Retail trade 58,911 43,223 15,688 16,937 1,249 Information 147,618 106,641 40,976 59,539 18,563 Depository institutions (banking) 198,002 198,002 (*) (*) (*) Finance (except depository institutions) and insurance 385,997 405,732 -19,735 59,677 79,412
Real estate and rental and leasing 65,374 49,950 15,424 22,513 7,090 Professional, scientific, and technical services 130,015 113,165 16,850 31,800 14,951 Other industries 512,914 391,529 121,385 194,520 73,135
Canada 273,896 253,335 20,561 46,257 25,696 Manufacturing 80,981 73,864 7,117 18,461 11,344 Wholesale trade 8,246 7,727 520 3,100 2,580 Retail trade 7,733 7,561 173 (D) (D) Information 4,398 3,070 1,328 1,837 509 Depository institutions (banking) 42,968 42,968 0 0 0 Finance (except depository institutions) and insurance 50,272 50,165 107 2,360 2,254
Real estate and rental and leasing 7,576 6,887 689 1,025 336 Professional, scientific, and technical services 5,113 4,342 771 1,485 713 Other industries 66,609 56,752 9,857 (D) (D)
Europe 2,004,199 1,534,401 469,798 721,685 251,887 Manufacturing 839,633 584,311 255,322 363,008 107,686 Wholesale trade 160,869 116,394 44,475 72,831 28,357 Retail trade 42,432 28,046 14,386 14,650 264 Information 114,011 74,544 39,467 56,365 16,898 Depository institutions (banking) 116,269 116,269 0 0 0 Finance (except depository institutions) and insurance 264,876 267,469 -2,593 43,563 46,156
Real estate and rental and leasing 34,107 24,537 9,570 15,338 5,768 Professional, scientific, and technical services 101,494 86,834 14,660 26,786 12,126 Other industries 330,507 235,996 94,511 129,143 34,632 Of which:
United Kingdom Manufacturing 172,935 153,598 19,336 68,804 49,468 Wholesale trade 29,097 22,808 6,289 9,715 3,426 Retail trade 2,109 1,557 551 565 14 Information 21,030 19,885 1,145 (D) (D) Depository institutions (banking) 57,276 57,276 0 0 0 Finance (except depository institutions) and insurance 55,182 54,717 465 2,974 2,509
Real estate and rental and leasing 2,992 2,990 2 3,810 3,808 Professional, scientific, and technical services 31,024 30,060 963 3,353 2,390
Other industries 107,730 74,311 33,419 (D) (D) Latin America and Other Western Hemisphere 117,051 129,490 -12,439 68,098 80,538
Manufacturing 32,111 29,558 2,553 11,458 8,905 Wholesale trade 8,870 5,412 3,458 15,546 12,088 Retail trade (D) 1,171 (D) (D) (D) Information 1,044 1,750 -706 215 922 Depository institutions (banking) 5,756 5,756 (*) (*) (*) Finance (except depository institutions) and insurance 10,363 29,691 -19,328 11,178 30,506
Real estate and rental and leasing 9,165 7,792 1,373 1,951 578 Professional, scientific, and technical services 4,342 (D) (D) 384 (D) Other industries (D) (D) (D) (D) 26,980
479,373 417,202 62,171 154,739 92,568
Continues on next page
4

Bureau of Economic AnalysisTable 4. Foreign Direct Investment Position in the United States on a Historical-Cost Basis byAccount, 2014-2016 [Millions of dollars]Release Date: July 24, 2017
2014
Total Equity /1/
Debt instruments
Net U.S. affiliates' payables
U.S. affiliates' receivables
Africa 1,691 2,436 -745 1,060 1,806 Manufacturing -126 (D) (D) (D) (D) Wholesale trade (D) (D) (D) (D) 152 Retail trade (D) (D) (D) (D) (D) Information (D) 2 (D) (D) (D) Depository institutions (banking) (D) (D) 0 0 0 Finance (except depository institutions) and insurance 9 (D) (D) 2 (D)
Real estate and rental and leasing 528 591 -63 (D) (D) Professional, scientific, and technical services (D) (D) (D) 34 (D) Other industries (D) (D) 137 (D) (D)
Middle East 16,467 12,567 3,900 6,086 2,186 Manufacturing 2,551 (D) (D) (D) (D) Wholesale trade (D) (D) (D) (D) 283 Retail trade (D) (D) (D) (D) (*) Information (D) 850 (D) (D) (D) Depository institutions (banking) (D) (D) 0 0 0 Finance (except depository institutions) and insurance 2,139 (D) (D) 1,174 (D)
Real estate and rental and leasing 1,643 1,331 313 (D) (D) Professional, scientific, and technical services (D) -106 (D) 42 (D) Other industries 2,337 (D) (D) (D) (D)
Asia and Pacific 532,491 452,430 80,060 102,627 22,567 Manufacturing 159,390 144,023 15,367 22,806 7,438 Wholesale trade 148,870 109,054 39,816 49,735 9,919 Retail trade 6,597 6,433 163 (D) (D) Information 27,275 26,425 850 1,073 223 Depository institutions (banking) 31,134 31,134 0 0 0 Finance (except depository institutions) and insurance 58,337 57,427 911 1,400 489
Real estate and rental and leasing 12,355 8,812 3,543 3,813 270 Professional, scientific, and technical services 19,075 16,876 2,199 3,070 871 Other industries 69,457 52,246 17,211 (D) (D)
Continues on next page
5

Bureau of Economic AnalysisTable 4. Foreign Direct Investment Position in the United States on a Historical-Cost Basis byAccount, 2014-2016 [Millions of dollars]Release Date: July 24, 2017
2015 Debt instrumentsEquityTotal /1/ Net U.S. affiliates'
payables U.S. affiliates' receivables
All areas 3,303,586 2,670,348 633,238 1,041,451 408,213 Manufacturing 1,362,109 1,030,789 331,320 497,374 166,054 Wholesale trade 362,747 276,588 86,159 144,204 58,045 Retail trade 63,245 48,716 14,529 17,036 2,507 Information 169,861 111,115 58,746 65,287 6,541 Depository institutions (banking) 193,436 193,435 1 1 (*) Finance (except depository institutions) and insurance 407,227 429,110 -21,883 61,393 83,276
Real estate and rental and leasing 74,759 57,300 17,459 25,231 7,772 Professional, scientific, and technical services 154,272 135,254 19,019 35,965 16,947 Other industries 515,930 388,041 127,889 194,960 67,071
Canada 322,118 306,827 15,290 42,387 27,097 Manufacturing 114,373 108,025 6,348 17,816 11,468 Wholesale trade 20,259 17,621 2,638 6,179 3,541 Retail trade 7,727 8,628 -901 (D) (D) Information 6,326 5,023 1,303 1,884 581 Depository institutions (banking) 46,901 46,901 0 0 0 Finance (except depository institutions) and insurance 55,008 55,390 -382 1,727 2,108
Real estate and rental and leasing 10,378 9,057 1,321 1,664 343 Professional, scientific, and technical services 7,844 6,897 946 1,712 766 Other industries 53,301 49,285 4,016 (D) (D)
Europe 2,276,695 1,722,769 553,926 818,030 264,104 Manufacturing 1,036,344 728,958 307,386 438,296 130,910 Wholesale trade 179,099 130,779 48,320 78,483 30,163 Retail trade 46,613 32,032 14,581 15,070 489 Information 134,494 77,685 56,809 61,821 5,012 Depository institutions (banking) 105,188 105,188 0 0 0 Finance (except depository institutions) and insurance 265,829 267,997 -2,168 47,935 50,103
Real estate and rental and leasing 36,364 26,785 9,579 15,819 6,241 Professional, scientific, and technical services 121,578 104,865 16,713 30,535 13,823 Other industries 351,186 248,480 102,706 130,070 27,364 Of which:
United Kingdom Manufacturing 214,693 175,885 38,807 74,032 35,225 Wholesale trade 34,677 27,082 7,595 11,863 4,268 Retail trade 3,719 3,057 662 707 44 Information 30,499 18,315 12,183 13,722 1,539 Depository institutions (banking) (D) (D) 0 0 0 Finance (except depository institutions) and insurance 56,028 56,379 -351 2,875 3,225
Real estate and rental and leasing 8,672 3,590 5,083 (D) (D) Professional, scientific, and technical services 10,793 9,839 954 3,608 2,654
Other industries (D) (D) 36,227 (D) (D) Latin America and Other Western Hemisphere 117,301 142,464 -25,163 63,336 88,499
Manufacturing 36,079 37,684 -1,605 11,177 12,782 Wholesale trade 1,748 6,197 -4,449 9,990 14,439 Retail trade (D) (D) (D) 410 (D) Information 1,412 1,831 -419 298 717 Depository institutions (banking) 6,944 6,944 (*) (*) (*) Finance (except depository institutions) and insurance 9,055 30,197 -21,142 9,314 30,456
Real estate and rental and leasing 10,147 9,025 1,122 1,694 572 Professional, scientific, and technical services 4,563 4,564 (*) (D) (D) Other industries (D) (D) (D) (D) (D)
512,139 410,978 101,162 164,604 63,442
Continues on next page
6

Bureau of Economic AnalysisTable 4. Foreign Direct Investment Position in the United States on a Historical-Cost Basis byAccount, 2014-2016 [Millions of dollars]Release Date: July 24, 2017
2015
Total Equity /1/
Debt instruments
Net U.S. affiliates' payables
U.S. affiliates' receivables
Africa 4,330 5,130 -800 1,123 1,923 Manufacturing (D) (D) -82 165 247 Wholesale trade (D) (D) (D) (D) 152 Retail trade (D) (D) (D) (D) (D) Information (D) 2 (D) (D) (D) Depository institutions (banking) (D) (D) 0 0 0 Finance (except depository institutions) and insurance 10 8 1 2 1
Real estate and rental and leasing 518 582 -63 (D) (D) Professional, scientific, and technical services 110 (D) (D) (D) (D) Other industries (D) (D) (D) (D) 555
Middle East 18,169 12,183 5,986 8,279 2,294 Manufacturing (D) (D) 2,231 3,881 1,650 Wholesale trade (D) (D) (D) (D) 190 Retail trade (D) (D) (D) (D) (*) Information (D) 680 (D) (D) (D) Depository institutions (banking) (D) (D) 0 0 0 Finance (except depository institutions) and insurance 2,166 958 1,208 1,213 5
Real estate and rental and leasing 1,707 1,387 319 (D) (D) Professional, scientific, and technical services -43 (D) (D) (D) 31 Other industries 2,021 1,587 433 (D) (D)
Asia and Pacific 564,974 480,974 84,000 108,296 24,296 Manufacturing 169,058 152,017 17,041 26,039 8,998 Wholesale trade 155,770 117,667 38,103 47,663 9,560 Retail trade 7,739 7,123 616 700 84 Information 26,826 25,894 932 1,144 212 Depository institutions (banking) 32,374 32,374 (*) (*) 0 Finance (except depository institutions) and insurance 75,158 74,559 599 1,202 603
Real estate and rental and leasing 15,646 10,464 5,182 5,661 479 Professional, scientific, and technical services 20,220 18,181 2,039 3,140 1,101 Other industries 62,182 42,695 19,487 22,746 3,259
Continues on next page
7

Bureau of Economic AnalysisTable 4. Foreign Direct Investment Position in the United States on a Historical-Cost Basis byAccount, 2014-2016 [Millions of dollars]Release Date: July 24, 2017
2016 Debt instrumentsEquityTotal /1/ Net U.S. affiliates'
payables U.S. affiliates' receivables
All areas 3,725,418 2,953,297 772,122 1,177,653 405,531 Manufacturing 1,532,365 1,145,330 387,035 561,352 174,318 Wholesale trade 367,596 274,422 93,174 148,490 55,316 Retail trade 72,403 54,765 17,638 21,560 3,922 Information 185,806 121,126 64,680 73,260 8,580 Depository institutions (banking) 190,665 190,664 1 1 (*) Finance (except depository institutions) and insurance 504,780 492,769 12,011 89,960 77,949
Real estate and rental and leasing 82,261 64,670 17,591 28,911 11,320 Professional, scientific, and technical services 197,948 160,466 37,482 54,031 16,549 Other industries 591,595 449,085 142,510 200,088 57,578
Canada 371,468 347,789 23,679 51,210 27,531 Manufacturing 114,760 109,851 4,909 16,808 11,899 Wholesale trade 21,677 18,075 3,603 7,283 3,681 Retail trade 7,942 (D) (D) 882 (D) Information 7,667 6,131 1,536 2,071 535 Depository institutions (banking) (D) (D) 0 0 0 Finance (except depository institutions) and insurance 62,441 58,966 3,475 4,617 1,142
Real estate and rental and leasing 11,449 10,158 1,291 1,639 348 Professional, scientific, and technical services 8,738 7,370 1,368 2,187 819 Other industries (D) (D) (D) 15,722 (D)
Europe 2,605,559 1,926,192 679,367 965,223 285,855 Manufacturing 1,195,643 831,119 364,524 502,850 138,327 Wholesale trade 187,257 135,725 51,532 80,799 29,267 Retail trade 54,761 36,433 18,327 (D) (D) Information 148,651 87,645 61,006 68,416 7,410 Depository institutions (banking) 94,526 94,526 0 0 0 Finance (except depository institutions) and insurance 333,427 308,886 24,541 73,418 48,877
Real estate and rental and leasing 39,275 29,776 9,499 19,151 9,652 Professional, scientific, and technical services 163,701 128,819 34,882 47,910 13,028 Other industries 388,319 273,263 115,056 (D) (D) Of which:
United Kingdom Manufacturing 235,364 187,888 47,475 75,521 28,045 Wholesale trade 28,382 25,727 2,655 6,626 3,971 Retail trade 4,789 (D) (D) 671 (D) Information 30,563 20,044 10,519 14,036 3,517 Depository institutions (banking) (D) (D) 0 0 0 Finance (except depository institutions) and insurance 78,491 63,376 15,115 17,700 2,585
Real estate and rental and leasing 10,688 4,019 6,669 (D) (D) Professional, scientific, and technical services 14,311 11,492 2,819 4,268 1,449
Other industries (D) (D) (D) (D) (D) Latin America and Other Western Hemisphere 124,798 146,007 -21,209 38,707 59,916
Manufacturing 21,982 24,941 -2,959 8,480 11,440 Wholesale trade 5,160 6,385 -1,225 10,029 11,254 Retail trade 1,218 (D) (D) (D) (D) Information 2,175 2,183 -8 339 347 Depository institutions (banking) 6,665 6,664 (*) (*) (*) Finance (except depository institutions) and insurance (D) 38,371 (D) (D) 26,976
Real estate and rental and leasing 10,454 9,502 952 (D) (D) Professional, scientific, and technical services 4,363 4,278 85 (D) (D) Other industries (D) (D) (D) (D) 8,570
555,687 434,869 120,817 176,840 56,022
Continues on next page
8

Bureau of Economic AnalysisTable 4. Foreign Direct Investment Position in the United States on a Historical-Cost Basis byAccount, 2014-2016 [Millions of dollars]Release Date: July 24, 2017
2016
Total Equity /1/
Debt instruments
Net U.S. affiliates' payables
U.S. affiliates' receivables
Africa 4,394 5,277 -884 1,203 2,087 Manufacturing 2,320 (D) (D) (D) 297 Wholesale trade (D) (D) (D) (D) (D) Retail trade (D) (D) (D) (D) (D) Information 9 3 6 (D) (D) Depository institutions (banking) (D) (D) 0 0 0 Finance (except depository institutions) and insurance 7 8 -1 (*) 1
Real estate and rental and leasing 520 583 -63 (D) (D) Professional, scientific, and technical services 112 (D) (D) (D) (D) Other industries 1,137 898 239 883 644
Middle East 19,826 14,411 5,415 8,825 3,410 Manufacturing 3,731 (D) (D) (D) 2,620 Wholesale trade (D) (D) (D) (D) (D) Retail trade (D) (D) (D) (D) (D) Information 851 611 241 (D) (D) Depository institutions (banking) (D) (D) 0 0 0 Finance (except depository institutions) and insurance (D) 68 (D) (D) 5
Real estate and rental and leasing 2,963 2,180 783 (D) (D) Professional, scientific, and technical services 853 (D) (D) (D) 45 Other industries 2,058 1,587 471 827 356
Asia and Pacific 599,373 513,620 85,753 112,486 26,732 Manufacturing 193,928 174,446 19,483 29,218 9,736 Wholesale trade 146,923 109,340 37,583 48,302 10,719 Retail trade 8,431 7,549 882 (D) (D) Information 26,452 24,553 1,899 2,079 179 Depository institutions (banking) 36,312 36,312 (*) (*) 0 Finance (except depository institutions) and insurance 87,047 86,470 577 1,525 948
Real estate and rental and leasing 17,601 12,472 5,129 (D) (D) Professional, scientific, and technical services 20,181 18,308 1,873 3,182 1,309 Other industries 62,498 44,170 18,327 (D) (D)
Legend / Footnotes: 1. Includes capital stock, additional paid-in capital, retained earnings, and cumulative translation adjustments.
9
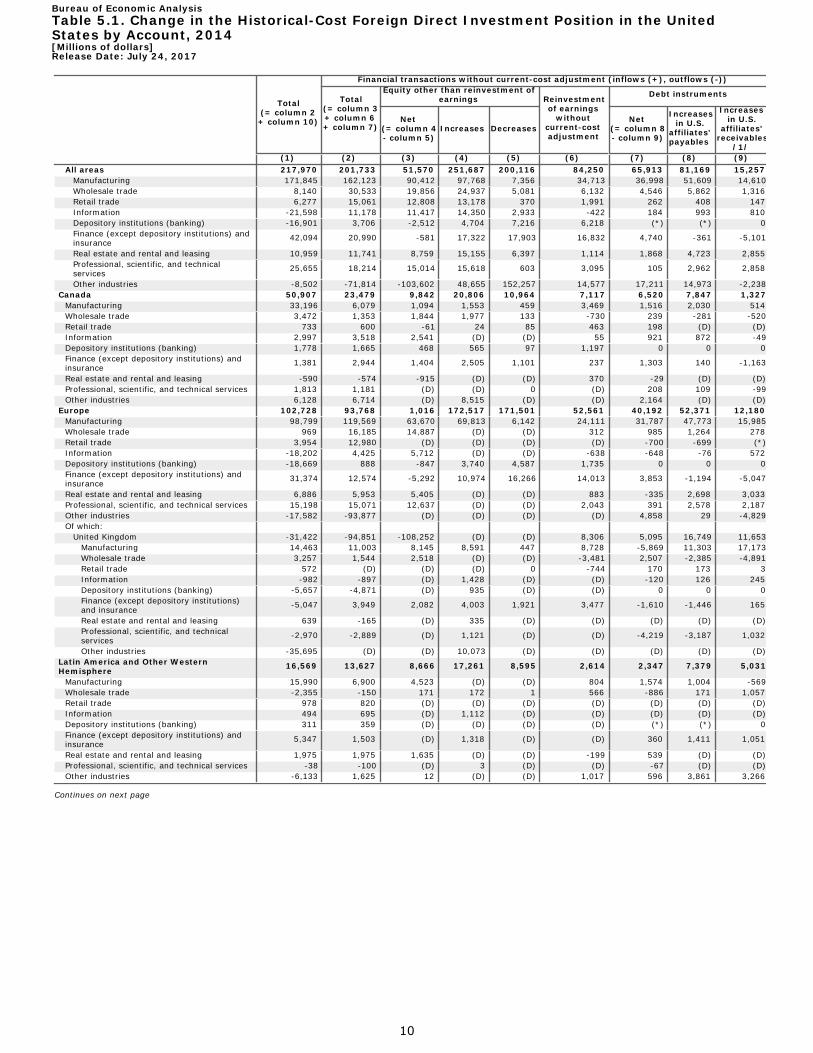
Bureau of Economic AnalysisTable 5.1. Change in the Historical-Cost Foreign Direct Investment Position in the UnitedStates by Account, 2014[Millions of dollars]Release Date: July 24, 2017
Total (= column 2 + column 10)
Financial transactions without current-cost adjustment (inflows (+), outflows (-))
Total (= column 3 + column 6 + column 7)
Equity other than reinvestment of earnings Reinvestment
of earnings without
current-cost adjustment
Debt instruments
Net (= column 4 - column 5)
Increases Decreases Net
(= column 8 - column 9)
Increases in U.S.
affiliates' payables
Increases in U.S.
affiliates' receivables
/1/ (1) (2) (3) (4) (5) (6) (7) (8) (9)
All areas 217,970 201,733 51,570 251,687 200,116 84,250 65,913 81,169 15,257 Manufacturing 171,845 162,123 90,412 97,768 7,356 34,713 36,998 51,609 14,610 Wholesale trade 8,140 30,533 19,856 24,937 5,081 6,132 4,546 5,862 1,316 Retail trade 6,277 15,061 12,808 13,178 370 1,991 262 408 147 Information -21,598 11,178 11,417 14,350 2,933 -422 184 993 810 Depository institutions (banking) -16,901 3,706 -2,512 4,704 7,216 6,218 (*) (*) 0 Finance (except depository institutions) and insurance 42,094 20,990 -581 17,322 17,903 16,832 4,740 -361 -5,101
Real estate and rental and leasing 10,959 11,741 8,759 15,155 6,397 1,114 1,868 4,723 2,855 Professional, scientific, and technical services 25,655 18,214 15,014 15,618 603 3,095 105 2,962 2,858
Other industries -8,502 -71,814 -103,602 48,655 152,257 14,577 17,211 14,973 -2,238 Canada 50,907 23,479 9,842 20,806 10,964 7,117 6,520 7,847 1,327
Manufacturing 33,196 6,079 1,094 1,553 459 3,469 1,516 2,030 514 Wholesale trade 3,472 1,353 1,844 1,977 133 -730 239 -281 -520 Retail trade 733 600 -61 24 85 463 198 (D) (D) Information 2,997 3,518 2,541 (D) (D) 55 921 872 -49 Depository institutions (banking) 1,778 1,665 468 565 97 1,197 0 0 0 Finance (except depository institutions) and insurance 1,381 2,944 1,404 2,505 1,101 237 1,303 140 -1,163
Real estate and rental and leasing -590 -574 -915 (D) (D) 370 -29 (D) (D) Professional, scientific, and technical services 1,813 1,181 (D) (D) 0 (D) 208 109 -99 Other industries 6,128 6,714 (D) 8,515 (D) (D) 2,164 (D) (D)
Europe 102,728 93,768 1,016 172,517 171,501 52,561 40,192 52,371 12,180 Manufacturing 98,799 119,569 63,670 69,813 6,142 24,111 31,787 47,773 15,985 Wholesale trade 969 16,185 14,887 (D) (D) 312 985 1,264 278 Retail trade 3,954 12,980 (D) (D) (D) (D) -700 -699 (*) Information -18,202 4,425 5,712 (D) (D) -638 -648 -76 572 Depository institutions (banking) -18,669 888 -847 3,740 4,587 1,735 0 0 0 Finance (except depository institutions) and insurance 31,374 12,574 -5,292 10,974 16,266 14,013 3,853 -1,194 -5,047
Real estate and rental and leasing 6,886 5,953 5,405 (D) (D) 883 -335 2,698 3,033 Professional, scientific, and technical services 15,198 15,071 12,637 (D) (D) 2,043 391 2,578 2,187 Other industries -17,582 -93,877 (D) (D) (D) (D) 4,858 29 -4,829 Of which:
United Kingdom -31,422 -94,851 -108,252 (D) (D) 8,306 5,095 16,749 11,653 Manufacturing 14,463 11,003 8,145 8,591 447 8,728 -5,869 11,303 17,173 Wholesale trade 3,257 1,544 2,518 (D) (D) -3,481 2,507 -2,385 -4,891 Retail trade 572 (D) (D) (D) 0 -744 170 173 3 Information -982 -897 (D) 1,428 (D) (D) -120 126 245 Depository institutions (banking) -5,657 -4,871 (D) 935 (D) (D) 0 0 0 Finance (except depository institutions) and insurance -5,047 3,949 2,082 4,003 1,921 3,477 -1,610 -1,446 165
Real estate and rental and leasing 639 -165 (D) 335 (D) (D) (D) (D) (D) Professional, scientific, and technical services -2,970 -2,889 (D) 1,121 (D) (D) -4,219 -3,187 1,032
Other industries -35,695 (D) (D) 10,073 (D) (D) (D) (D) (D) Latin America and Other Western Hemisphere 16,569 13,627 8,666 17,261 8,595 2,614 2,347 7,379 5,031
Manufacturing 15,990 6,900 4,523 (D) (D) 804 1,574 1,004 -569 Wholesale trade -2,355 -150 171 172 1 566 -886 171 1,057 Retail trade 978 820 (D) (D) (D) (D) (D) (D) (D) Information 494 695 (D) 1,112 (D) (D) (D) (D) (D) Depository institutions (banking) 311 359 (D) (D) (D) (D) (*) (*) 0 Finance (except depository institutions) and insurance 5,347 1,503 (D) 1,318 (D) (D) 360 1,411 1,051
Real estate and rental and leasing 1,975 1,975 1,635 (D) (D) -199 539 (D) (D) Professional, scientific, and technical services -38 -100 (D) 3 (D) (D) -67 (D) (D) Other industries -6,133 1,625 12 (D) (D) 1,017 596 3,861 3,266
Continues on next page
10

Bureau of Economic AnalysisTable 5.1. Change in the Historical-Cost Foreign Direct Investment Position in the UnitedStates by Account, 2014[Millions of dollars]Release Date: July 24, 2017
Total (= column 2 + column 10)
Financial transactions without current-cost adjustment (inflows (+), outflows (-))
Total (= column 3 + column 6 + column 7)
Equity other than reinvestment of earnings Reinvestment
of earnings without
current-cost adjustment
Debt instruments
Net (= column 4 - column 5)
Increases Decreases Net
(= column 8 - column 9)
Increases in U.S.
affiliates' payables
Increases in U.S.
affiliates' receivables
/1/ (1) (2) (3) (4) (5) (6) (7) (8) (9)
Africa 56 825 512 512 0 482 -169 154 323 Manufacturing 157 156 0 0 0 4 152 (D) (D) Wholesale trade 246 257 (D) (D) 0 (D) 95 95 (*) Retail trade (D) (D) 0 0 0 0 (D) 0 (D) Information (D) (D) 0 0 0 -1 (D) (D) -20 Depository institutions (banking) -4 (D) 0 0 0 (D) 0 0 0 Finance (except depository institutions) and insurance -3 -3 0 0 0 (D) (D) (D) (D)
Real estate and rental and leasing 5 5 0 0 0 5 0 0 0 Professional, scientific, and technical services (D) (D) (D) (D) 0 (D) (D) (D) (D) Other industries -293 268 (D) (D) 0 (D) 114 (D) (D)
Middle East -1,477 -1,548 233 521 288 114 -1,895 -2,729 -833 Manufacturing -749 -1,045 0 0 0 284 -1,329 (D) (D) Wholesale trade -1,061 -1,066 (D) (D) (D) (D) -1,154 -1,058 96 Retail trade (D) (D) 0 0 0 (D) 0 0 0 Information (D) (D) (D) (D) (D) (D) (D) (D) (D) Depository institutions (banking) 39 (D) (D) (D) (D) (D) 0 0 0 Finance (except depository institutions) and insurance -490 -83 (D) 0 (D) -37 (D) (D) (D)
Real estate and rental and leasing -17 -17 -30 (D) (D) 16 -3 (D) (D) Professional, scientific, and technical services (D) (D) 0 0 0 2 (D) 2 (D) Other industries 677 539 (D) 0 (D) (D) 580 (D) (D)
Asia and Pacific 49,187 71,582 31,302 40,070 8,768 21,362 18,918 16,148 -2,770 Manufacturing 24,453 30,463 21,125 (D) (D) 6,040 3,298 2,876 -422 Wholesale trade 6,868 13,955 2,839 3,217 378 5,849 5,266 5,672 406 Retail trade 608 656 (D) (D) (D) (D) -21 -17 3 Information -7,028 2,399 1,673 1,727 54 267 459 417 -42 Depository institutions (banking) -356 799 -2,191 (D) (D) 2,990 0 0 0 Finance (except depository institutions) and insurance 4,485 4,054 2,323 2,526 203 2,535 -804 -747 57
Real estate and rental and leasing 2,700 4,398 2,663 4,042 1,379 40 1,695 1,667 -28 Professional, scientific, and technical services 8,757 1,939 (D) 1,300 (D) (D) 124 285 161 Other industries 8,700 12,918 1,292 5,285 3,993 2,726 8,900 5,994 -2,906
Continues on next page
11

Bureau of Economic AnalysisTable 5.1. Change in the Historical-Cost Foreign Direct Investment Position in the UnitedStates by Account, 2014[Millions of dollars]Release Date: July 24, 2017
Other changes in position Total (= column 11
+ column 12 + column 13)
Translation adjustments
/2/
Capital gains and losses of
affiliates
Other changes in volume and
valuation /3/ (10) (11) (12) (13)
All areas 16,237 -3,709 -27,099 47,045 Manufacturing 9,722 -749 -17,197 27,668 Wholesale trade -22,393 -685 -8,483 -13,225 Retail trade -8,784 -27 -96 -8,662 Information -32,776 -104 -5,470 -27,202 Depository institutions (banking) -20,607 -104 -518 -19,985 Finance (except depository institutions) and insurance 21,104 -1,699 12,232 10,571
Real estate and rental and leasing -782 -180 80 -682 Professional, scientific, and technical services 7,441 -59 1,294 6,205 Other industries 63,312 -101 -8,943 72,356
Canada 27,428 -810 1,704 26,533 Manufacturing 27,116 47 -1,562 28,631 Wholesale trade 2,119 (D) 857 (D) Retail trade 133 -2 (D) (D) Information -521 (D) (*) (D) Depository institutions (banking) 113 (*) 282 -169 Finance (except depository institutions) and insurance -1,564 (D) 1,846 (D)
Real estate and rental and leasing -16 (D) (D) (D) Professional, scientific, and technical services 632 (D) -24 (D) Other industries -586 -127 309 -767
Europe 8,960 -1,674 -24,423 35,057 Manufacturing -20,770 -477 -15,523 -4,770 Wholesale trade -15,215 -93 -8,524 -6,598 Retail trade -9,027 (D) -297 (D) Information -22,627 102 (D) (D) Depository institutions (banking) -19,557 (D) -411 (D) Finance (except depository institutions) and insurance 18,800 -1,010 6,800 13,011
Real estate and rental and leasing 933 -17 312 638 Professional, scientific, and technical services 127 -36 1,297 -1,134 Other industries 76,296 -61 (D) (D) Of which:
United Kingdom 63,429 -241 -5,283 68,953 Manufacturing 3,460 -100 -2,870 6,431 Wholesale trade 1,713 -4 -373 2,090 Retail trade (D) 0 (D) 0 Information -86 (D) -334 (D) Depository institutions (banking) -786 (*) 1,112 -1,899 Finance (except depository institutions) and insurance -8,996 (D) -1,712 (D)
Real estate and rental and leasing 803 (D) 67 (D) Professional, scientific, and technical services -81 (D) (D) -1,303
Other industries (D) (D) (D) 70,036 Latin America and Other Western Hemisphere 2,941 -30 922 2,049
Manufacturing 9,090 (D) (D) 9,240 Wholesale trade -2,205 -34 -38 -2,134 Retail trade 158 0 (*) 159 Information -201 (*) 2 -202 Depository institutions (banking) -48 (*) -26 -22 Finance (except depository institutions) and insurance 3,844 (D) 2,959 (D)
Real estate and rental and leasing -1 0 103 -104 Professional, scientific, and technical services 62 (D) 19 (D) Other industries -7,757 (D) (D) -5,836
Continues on next page
12

Bureau of Economic AnalysisTable 5.1. Change in the Historical-Cost Foreign Direct Investment Position in the UnitedStates by Account, 2014[Millions of dollars]Release Date: July 24, 2017
Other changes in position Total (= column 11
+ column 12 + column 13)
Translation adjustments
/2/
Capital gains and losses of
affiliates
Other changes in volume and
valuation /3/ (10) (11) (12) (13)
Africa -769 (D) 9 (D) Manufacturing 1 0 0 1 Wholesale trade -11 (D) (D) (D) Retail trade 0 0 0 0 Information (D) 0 0 (D) Depository institutions (banking) (D) 0 (D) 0 Finance (except depository institutions) and insurance 0 0 0 0
Real estate and rental and leasing (*) 0 0 (*) Professional, scientific, and technical services -198 0 0 -198 Other industries -560 0 (D) (D)
Middle East 72 (D) 341 (D) Manufacturing 295 (D) (D) 1 Wholesale trade 6 0 (D) (D) Retail trade 0 0 0 0 Information (D) 0 (D) 0 Depository institutions (banking) (D) 0 (D) 0 Finance (except depository institutions) and insurance -408 0 (D) (D)
Real estate and rental and leasing (*) 0 (*) 0 Professional, scientific, and technical services 0 0 0 0 Other industries 137 0 (*) 137
Asia and Pacific -22,395 -1,189 -5,653 -15,553 Manufacturing -6,010 -264 -311 -5,435 Wholesale trade -7,086 -550 -787 -5,750 Retail trade -48 (D) (D) (*) Information -9,427 (D) (D) -7,109 Depository institutions (banking) -1,156 (D) -404 (D) Finance (except depository institutions) and insurance 431 -145 (D) (D)
Real estate and rental and leasing -1,699 (D) (D) (D) Professional, scientific, and technical services 6,818 (D) 2 (D) Other industries -4,218 (D) (D) -1,721
Legend / Footnotes: 1. An increase in U.S. affiliates' receivables is a decrease in net intercompany debt and a financial outflow. 2. Represents changes in exchange rates used to translate the foreign-currency-denominated assets and liabilities of affiliates into U.S. dollars. 3. Includes (1) differences between the transaction values given or received for equity interests in affiliates and their book values and (2) the reclassification of investment positions between direct investment and portfolio investment. In addition, if an affiliate's industry classification changes, offsetting adjustments are made to move the position from the former to the current industry. Offsetting adjustments are also made when there is a change in the country of the foreign parent due to transactions between foreign residents or due to changes in the political boundaries of a country.
13

Bureau of Economic AnalysisTable 5.2. Change in the Historical-Cost Foreign Direct Investment Position in the UnitedStates by Account, 2015[Millions of dollars]Release Date: July 24, 2017
Total (= column 2 + column 10)
Financial transactions without current-cost adjustment (inflows (+), outflows (-))
Total (= column 3 + column 6 + column 7)
Equity other than reinvestment of earnings Reinvestment
of earnings without
current-cost adjustment
Debt instruments
Net (= column 4 - column 5)
Increases Decreases Net
(= column 8 - column 9)
Increases in U.S.
affiliates' payables
Increases in U.S.
affiliates' receivables
/1/ (1) (2) (3) (4) (5) (6) (7) (8) (9)
All areas 357,791 465,765 309,413 354,459 45,046 69,828 86,524 86,754 230 Manufacturing 247,569 326,847 221,876 232,246 10,371 22,621 82,350 75,172 -7,178 Wholesale trade 30,323 22,468 23,381 24,431 1,050 11,638 -12,550 -7,761 4,789 Retail trade 4,334 4,481 2,064 (D) (D) 3,391 -974 285 1,259 Information 22,243 11,619 3,481 3,887 405 802 7,336 4,655 -2,681 Depository institutions (banking) -4,566 2,009 -3,078 6,914 9,992 5,087 (*) (*) 0 Finance (except depository institutions) and insurance 21,230 35,972 23,806 36,772 12,967 14,704 -2,537 1,615 4,152
Real estate and rental and leasing 9,385 8,478 5,511 6,394 883 2,147 820 1,485 665 Professional, scientific, and technical services 24,257 21,797 15,221 15,819 598 3,921 2,655 4,467 1,812
Other industries 3,017 32,093 17,151 (D) (D) 5,518 9,424 6,836 -2,588 Canada 48,221 59,555 50,819 52,655 1,836 9,368 -632 801 1,433
Manufacturing 33,392 34,688 (D) (D) 213 (D) 129 -133 -262 Wholesale trade 12,013 1,750 1,022 1,037 16 1,079 -350 180 531 Retail trade -6 118 (D) (D) 8 917 (D) -122 (D) Information 1,928 1,832 (D) (D) 0 293 (D) (D) (D) Depository institutions (banking) 3,934 4,298 2,790 2,870 81 1,508 0 0 0 Finance (except depository institutions) and insurance 4,736 6,183 5,048 5,702 655 1,623 -488 -633 -145
Real estate and rental and leasing 2,802 3,264 (D) (D) (D) (D) 308 (D) (D) Professional, scientific, and technical services 2,730 2,752 (D) (D) (D) (D) 189 227 38 Other industries -13,308 4,671 2,275 (D) (D) 1,706 690 1,017 328
Europe 272,496 345,958 223,951 258,901 34,950 37,564 84,443 77,498 -6,944 Manufacturing 196,711 275,323 183,054 190,378 7,324 14,390 77,878 68,891 -8,988 Wholesale trade 18,230 15,098 17,987 18,220 234 3,847 -6,736 -3,777 2,959 Retail trade 4,181 4,056 (D) (D) (D) (D) 170 (D) (D) Information 20,482 9,012 1,116 1,478 362 836 7,060 4,588 -2,472 Depository institutions (banking) -11,081 -4,309 -5,405 (D) (D) 1,096 0 0 0 Finance (except depository institutions) and insurance 954 9,379 2,759 13,725 10,966 7,998 -1,377 2,570 3,947
Real estate and rental and leasing 2,256 1,788 962 1,392 431 1,200 -373 100 472 Professional, scientific, and technical services 20,084 17,542 12,126 12,565 439 2,719 2,697 4,210 1,513 Other industries 20,679 18,069 (D) 15,913 (D) (D) 5,123 (D) (D) Of which:
United Kingdom 32,766 39,323 23,694 36,324 12,630 -4,725 20,354 4,869 -15,484 Manufacturing 41,758 37,925 24,588 25,816 1,228 -6,340 19,677 5,403 -14,274 Wholesale trade 5,580 3,863 (D) (D) 36 (D) -899 943 1,841 Retail trade 1,610 1,588 (D) (D) 0 (D) 86 118 32 Information 9,469 367 171 318 147 -633 829 492 -337 Depository institutions (banking) (D) -8,406 (D) 1,294 (D) (D) 0 0 0 Finance (except depository institutions) and insurance 846 4,375 1,842 2,408 566 3,304 -772 -55 717
Real estate and rental and leasing 5,681 2,461 (D) 0 (D) (D) 1,924 (D) (D) Professional, scientific, and technical services -20,231 678 35 70 35 630 13 258 246
Other industries (D) -3,529 (D) 405 (D) (D) -505 (D) (D) Latin America and Other Western Hemisphere 250 10,744 (D) (D) (D) (D) -644 3,718 4,362
Manufacturing 3,968 2,859 -453 (D) (D) 2,325 988 1,056 68 Wholesale trade -7,122 -1,825 (D) (D) 0 (D) -2,553 -212 2,341 Retail trade -998 (D) (D) 0 (D) (D) (D) (D) (D) Information 368 370 (D) (D) 0 (D) 287 (D) (D) Depository institutions (banking) 1,188 88 268 (D) (D) -180 (*) (*) 0 Finance (except depository institutions) and insurance -1,307 1,977 (D) 1,805 (D) (D) (D) (D) (D)
Real estate and rental and leasing 981 558 745 (D) (D) 117 -304 (D) (D) Professional, scientific, and technical services 221 208 (D) (*) (D) (D) 44 -20 -64 Other industries 2,951 (D) 4,241 5,406 1,165 (D) 1,817 3,741 1,923
Continues on next page
14

Bureau of Economic AnalysisTable 5.2. Change in the Historical-Cost Foreign Direct Investment Position in the UnitedStates by Account, 2015[Millions of dollars]Release Date: July 24, 2017
Total (= column 2 + column 10)
Financial transactions without current-cost adjustment (inflows (+), outflows (-))
Total (= column 3 + column 6 + column 7)
Equity other than reinvestment of earnings Reinvestment
of earnings without
current-cost adjustment
Debt instruments
Net (= column 4 - column 5)
Increases Decreases Net
(= column 8 - column 9)
Increases in U.S.
affiliates' payables
Increases in U.S.
affiliates' receivables
/1/ (1) (2) (3) (4) (5) (6) (7) (8) (9)
Africa 2,639 1,872 (D) (D) (D) (D) -59 63 122 Manufacturing (D) 1,680 (D) (D) 0 (D) 59 (D) (D) Wholesale trade -177 (D) 0 0 0 (D) (D) (D) (*) Retail trade 0 0 0 0 0 0 0 0 0 Information 4 4 0 0 0 (*) 4 6 2 Depository institutions (banking) 13 (D) 0 0 0 (D) 0 0 0 Finance (except depository institutions) and insurance 1 1 0 0 0 (D) (D) (*) (D)
Real estate and rental and leasing -9 -9 (D) 0 (D) (D) 0 0 0 Professional, scientific, and technical services (D) 39 0 0 0 (D) (D) (D) (D) Other industries 287 (D) (D) (D) 0 (D) (D) (D) (D)
Middle East 1,702 2,157 (D) (D) 52 (D) 1,929 2,041 112 Manufacturing (D) 1,631 0 0 0 -271 1,902 (D) (D) Wholesale trade 478 (D) (D) (D) (D) (D) (D) (D) -93 Retail trade 14 (D) 0 0 0 (D) 0 0 0 Information -90 -241 0 0 0 (D) (D) (D) (D) Depository institutions (banking) 141 (D) 1 1 0 (D) 0 0 0 Finance (except depository institutions) and insurance 26 29 (D) 0 (D) (D) (D) (D) (D)
Real estate and rental and leasing 63 64 0 0 0 57 7 (D) (D) Professional, scientific, and technical services (D) 35 (D) (D) 0 (D) (D) (D) (D) Other industries -317 83 (D) 0 (D) (D) 74 -36 -110
Asia and Pacific 32,484 45,480 27,232 30,358 3,125 16,760 1,488 2,634 1,146 Manufacturing 9,668 10,665 4,587 (D) (D) 4,684 1,394 3,024 1,630 Wholesale trade 6,900 7,069 4,136 (D) (D) 5,656 -2,722 -3,671 -948 Retail trade 1,143 953 (D) (D) 11 238 (D) (D) (D) Information -449 643 749 792 43 -197 91 78 -13 Depository institutions (banking) 1,240 1,854 -731 (D) (D) 2,585 (*) (*) 0 Finance (except depository institutions) and insurance 16,821 18,403 15,243 15,540 297 3,472 -312 -198 114
Real estate and rental and leasing 3,291 2,813 (D) 1,541 (D) (D) 1,182 1,391 209 Professional, scientific, and technical services 1,145 1,222 (D) (D) 24 (D) -331 -87 243 Other industries -7,275 1,857 (D) 1,053 (D) (D) (D) (D) (D)
Continues on next page
15

Bureau of Economic AnalysisTable 5.2. Change in the Historical-Cost Foreign Direct Investment Position in the UnitedStates by Account, 2015[Millions of dollars]Release Date: July 24, 2017
Other changes in position Total (= column 11
+ column 12 + column 13)
Translation adjustments
/2/
Capital gains and losses of
affiliates
Other changes in volume and
valuation /3/ (10) (11) (12) (13)
All areas -107,974 -5,510 -36,949 -65,516 Manufacturing -79,278 -1,762 5,785 -83,301 Wholesale trade 7,854 -1,271 -7,343 16,468 Retail trade -148 59 -25 -182 Information 10,624 275 -1,274 11,622 Depository institutions (banking) -6,575 -68 -954 -5,553 Finance (except depository institutions) and insurance -14,742 -2,368 -13,573 1,199
Real estate and rental and leasing 907 -147 -300 1,354 Professional, scientific, and technical services 2,460 -90 2,117 433 Other industries -29,076 -138 -21,382 -7,556
Canada -11,334 -265 -13,127 2,058 Manufacturing -1,296 46 -3,963 2,620 Wholesale trade 10,263 (D) -41 (D) Retail trade -124 (D) -108 (D) Information 97 -48 -7 151 Depository institutions (banking) -364 (*) -364 0 Finance (except depository institutions) and insurance -1,446 -7 -1,662 223
Real estate and rental and leasing -462 (D) (D) (D) Professional, scientific, and technical services -22 (D) -49 (D) Other industries -17,979 63 (D) (D)
Europe -73,462 -2,583 -5,136 -65,743 Manufacturing -78,611 -553 11,591 -89,648 Wholesale trade 3,132 -138 -6,764 10,035 Retail trade 125 6 94 25 Information 11,471 364 (D) (D) Depository institutions (banking) -6,772 (D) -168 (D) Finance (except depository institutions) and insurance -8,426 -2,101 -9,439 3,115
Real estate and rental and leasing 468 (D) 132 (D) Professional, scientific, and technical services 2,541 12 2,113 417 Other industries 2,610 (D) (D) 5,135 Of which:
United Kingdom -6,557 -346 4,159 -10,370 Manufacturing 3,832 -415 6,983 -2,735 Wholesale trade 1,717 7 1 1,709 Retail trade 23 (*) -1 25 Information 9,102 4 69 9,029 Depository institutions (banking) (D) 0 -8 (D) Finance (except depository institutions) and insurance -3,529 1 -2,692 -838
Real estate and rental and leasing 3,219 (D) 79 (D) Professional, scientific, and technical services -20,909 (D) (D) -21,227
Other industries (D) (D) (D) 6,540 Latin America and Other Western Hemisphere -10,494 -543 -4,877 -5,074
Manufacturing 1,109 (D) (D) 1,798 Wholesale trade -5,297 (D) 15 (D) Retail trade (D) 0 -1 (D) Information -3 (*) -2 (*) Depository institutions (banking) 1,099 (*) -12 1,111 Finance (except depository institutions) and insurance -3,285 (D) -910 (D)
Real estate and rental and leasing 423 (*) 259 164 Professional, scientific, and technical services 13 (D) (D) (D) Other industries (D) -86 (D) -156
Continues on next page
16
Bureau of Economic AnalysisTable 5.2. Change in the Historical-Cost Foreign Direct Investment Position in the UnitedStates by Account, 2015[Millions of dollars]Release Date: July 24, 2017
Other changes in position Total (= column 11
+ column 12 + column 13)
Translation adjustments
/2/
Capital gains and losses of
affiliates
Other changes in volume and
valuation /3/ (10) (11) (12) (13)
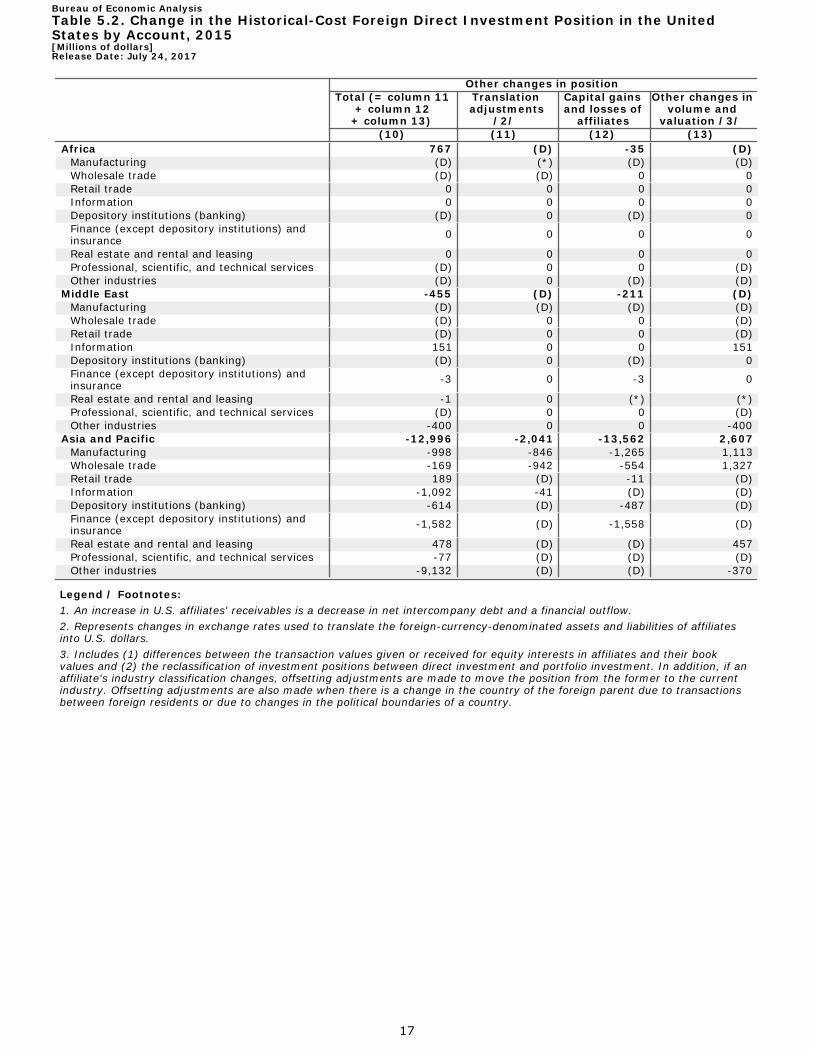
Africa 767 (D) -35 (D) Manufacturing (D) (*) (D) (D) Wholesale trade (D) (D) 0 0 Retail trade 0 0 0 0 Information 0 0 0 0 Depository institutions (banking) (D) 0 (D) 0 Finance (except depository institutions) and insurance 0 0 0 0
Real estate and rental and leasing 0 0 0 0 Professional, scientific, and technical services (D) 0 0 (D) Other industries (D) 0 (D) (D)
Middle East -455 (D) -211 (D) Manufacturing (D) (D) (D) (D) Wholesale trade (D) 0 0 (D) Retail trade (D) 0 0 (D) Information 151 0 0 151 Depository institutions (banking) (D) 0 (D) 0 Finance (except depository institutions) and insurance -3 0 -3 0
Real estate and rental and leasing -1 0 (*) (*) Professional, scientific, and technical services (D) 0 0 (D) Other industries -400 0 0 -400
Asia and Pacific -12,996 -2,041 -13,562 2,607 Manufacturing -998 -846 -1,265 1,113 Wholesale trade -169 -942 -554 1,327 Retail trade 189 (D) -11 (D) Information -1,092 -41 (D) (D) Depository institutions (banking) -614 (D) -487 (D) Finance (except depository institutions) and insurance -1,582 (D) -1,558 (D)
Real estate and rental and leasing 478 (D) (D) 457 Professional, scientific, and technical services -77 (D) (D) (D) Other industries -9,132 (D) (D) -370
Legend / Footnotes: 1. An increase in U.S. affiliates' receivables is a decrease in net intercompany debt and a financial outflow. 2. Represents changes in exchange rates used to translate the foreign-currency-denominated assets and liabilities of affiliates into U.S. dollars. 3. Includes (1) differences between the transaction values given or received for equity interests in affiliates and their book values and (2) the reclassification of investment positions between direct investment and portfolio investment. In addition, if an affiliate's industry classification changes, offsetting adjustments are made to move the position from the former to the current industry. Offsetting adjustments are also made when there is a change in the country of the foreign parent due to transactions between foreign residents or due to changes in the political boundaries of a country.
17

Bureau of Economic AnalysisTable 5.3. Change in the Historical-Cost Foreign Direct Investment Position in the UnitedStates by Account, 2016[Millions of dollars]Release Date: July 24, 2017
Total (= column 2 + column 10)
Financial transactions without current-cost adjustment (inflows (+), outflows (-))
Total (= column 3 + column 6 + column 7)
Equity other than reinvestment of earnings Reinvestment
of earnings without
current-cost adjustment
Debt instruments
Net (= column 4 - column 5)
Increases Decreases Net
(= column 8 - column 9)
Increases in U.S.
affiliates' payables
Increases in U.S.
affiliates' receivables
/1/ (1) (2) (3) (4) (5) (6) (7) (8) (9)
All areas 421,832 457,125 254,097 274,376 20,279 86,467 116,561 109,548 -7,013 Manufacturing 170,255 203,775 97,871 99,196 1,325 48,544 57,361 58,182 821 Wholesale trade 4,849 8,490 8,568 9,327 760 -913 835 -2,318 -3,154 Retail trade 9,158 9,582 2,553 2,607 54 4,021 3,008 4,201 1,194 Information 15,945 17,393 10,989 (D) (D) 641 5,764 7,728 1,964 Depository institutions (banking) -2,771 6,043 839 2,240 1,400 5,203 (*) (*) 0 Finance (except depository institutions) and insurance 97,553 72,623 34,593 42,901 8,308 18,911 19,119 19,647 529
Real estate and rental and leasing 7,502 7,099 4,355 4,604 249 2,331 413 3,962 3,549 Professional, scientific, and technical services 43,676 42,827 22,754 23,264 511 2,550 17,523 17,140 -383
Other industries 75,665 89,293 71,576 (D) (D) 5,178 12,539 1,006 -11,533 Canada 49,350 51,922 40,864 41,768 904 9,741 1,316 -1,436 -2,753
Manufacturing 387 1,470 1,588 1,680 92 1,394 -1,512 -4,252 -2,740 Wholesale trade 1,418 1,454 70 82 12 421 963 1,104 140 Retail trade 215 814 (D) (D) 5 1,087 (D) (D) (D) Information 1,341 1,543 (D) (D) (*) (D) 215 168 -46 Depository institutions (banking) (D) 2,710 1,055 1,098 43 1,655 0 0 0 Finance (except depository institutions) and insurance 7,433 6,943 3,413 (D) (D) 2,446 1,084 117 -967
Real estate and rental and leasing 1,071 955 33 40 6 951 -30 -25 5 Professional, scientific, and technical services 894 675 (D) (D) (D) (D) 226 244 18 Other industries (D) 35,359 32,649 32,764 116 (D) (D) (D) (D)
Europe 328,865 334,362 165,982 178,296 12,314 57,988 110,392 130,245 19,853 Manufacturing 159,299 176,506 79,631 80,525 894 38,722 58,152 61,443 3,290 Wholesale trade 8,158 -805 5,789 6,260 471 -4,075 -2,520 -5,013 -2,493 Retail trade 8,148 7,630 (D) (D) 14 (D) (D) (D) (D) Information 14,158 15,026 9,513 (D) (D) 1,397 4,116 6,548 2,432 Depository institutions (banking) -10,662 806 106 933 827 700 0 0 0 Finance (except depository institutions) and insurance 67,598 45,387 19,719 26,649 6,930 11,275 14,394 19,024 4,630
Real estate and rental and leasing 2,911 3,428 1,673 1,882 210 870 886 4,298 3,412 Professional, scientific, and technical services 42,123 39,964 (D) (D) 455 (D) 17,479 16,684 -795 Other industries 37,133 46,421 (D) 28,323 (D) 4,315 (D) (D) (D) Of which:
United Kingdom 43,547 49,068 25,709 27,007 1,299 7,880 15,478 7,740 -7,738 Manufacturing 20,671 30,307 14,485 14,638 154 4,384 11,439 4,160 -7,278 Wholesale trade -6,295 -5,742 (D) 644 (D) (D) -4,924 -5,286 -362 Retail trade 1,070 1,069 (D) (D) 1 (D) (D) -35 (D) Information 64 -377 (D) (D) 11 (D) -1,823 5 1,828 Depository institutions (banking) -652 -889 436 (D) (D) -1,325 0 0 0 Finance (except depository institutions) and insurance 22,463 16,626 5,592 (D) (D) 4,574 6,461 5,820 -641
Real estate and rental and leasing 2,015 2,077 (D) (D) 0 (D) 1,572 (D) (D) Professional, scientific, and technical services 3,519 3,378 1,194 (D) (D) 444 1,741 532 -1,209
Other industries 692 2,617 (D) 1,804 (D) (D) (D) (D) (D) Latin America and Other Western Hemisphere 7,497 21,190 11,988 (D) (D) 4,811 4,390 -22,737 -27,127
Manufacturing -14,098 3,466 (D) (D) 8 (D) 608 -731 -1,339 Wholesale trade 3,412 1,931 (D) 1 (D) (D) 1,732 39 -1,694 Retail trade (D) 181 (D) (D) 0 (D) (*) (D) (D) Information 764 427 (D) (D) 0 (D) 404 (D) (D) Depository institutions (banking) -279 165 (D) (D) (D) (D) 0 0 0 Finance (except depository institutions) and insurance (D) 6,606 (D) (D) (D) (D) (D) (D) -3,481
Real estate and rental and leasing 307 1,055 1,125 1,147 22 99 -169 (D) (D) Professional, scientific, and technical services -200 1,030 (D) (D) 1 (D) 89 (D) (D) Other industries 5,562 6,329 6,936 (D) (D) (D) (D) (D) (D)
Continues on next page
18

Bureau of Economic AnalysisTable 5.3. Change in the Historical-Cost Foreign Direct Investment Position in the UnitedStates by Account, 2016[Millions of dollars]Release Date: July 24, 2017
Total (= column 2 + column 10)
Financial transactions without current-cost adjustment (inflows (+), outflows (-))
Total (= column 3 + column 6 + column 7)
Equity other than reinvestment of earnings Reinvestment
of earnings without
current-cost adjustment
Debt instruments
Net (= column 4 - column 5)
Increases Decreases Net
(= column 8 - column 9)
Increases in U.S.
affiliates' payables
Increases in U.S.
affiliates' receivables
/1/ (1) (2) (3) (4) (5) (6) (7) (8) (9)
Africa 64 100 0 0 0 183 -83 81 164 Manufacturing (D) -36 0 0 0 (D) (D) (D) (D) Wholesale trade -64 -4 0 0 0 (D) (D) (D) (D) Retail trade 0 0 0 0 0 0 0 0 0 Information (D) (D) 0 0 0 (*) (D) (D) (D) Depository institutions (banking) 26 (D) 0 0 0 (D) 0 0 0 Finance (except depository institutions) and insurance -3 -3 0 0 0 (*) -3 -2 (*)
Real estate and rental and leasing 1 1 0 0 0 1 0 0 0 Professional, scientific, and technical services 1 (D) 0 0 0 (D) -12 (D) (D) Other industries (D) (D) 0 0 0 (D) (D) (D) 88
Middle East 1,657 545 1,169 (D) (D) 744 -1,368 -325 1,043 Manufacturing (D) -1,137 (D) (D) 0 (D) (D) (D) (D) Wholesale trade 772 772 (D) 20 (D) (D) (D) (D) (D) Retail trade (D) (D) 0 0 0 (D) (D) (*) (D) Information (D) (D) 0 0 0 -69 (D) (D) (D) Depository institutions (banking) (D) (D) (D) 0 (D) (D) 0 0 0 Finance (except depository institutions) and insurance (D) -119 (D) 0 (D) (D) (D) (D) (*)
Real estate and rental and leasing 1,257 -13 (D) (D) 0 -25 (D) (D) (*) Professional, scientific, and technical services 896 (D) (D) (D) 0 3 -31 (D) (D) Other industries 37 52 (D) (D) 0 (D) 53 45 -8
Asia and Pacific 34,399 49,007 34,094 (D) (D) 12,999 1,913 3,720 1,807 Manufacturing 24,870 23,507 14,841 15,172 331 6,751 1,915 2,505 590 Wholesale trade -8,847 5,141 2,692 2,965 273 1,925 524 1,364 840 Retail trade 692 (D) 88 123 35 (D) (D) (D) (D) Information -374 403 (D) 75 (D) (D) 967 935 -33 Depository institutions (banking) 3,938 2,236 -110 (D) (D) 2,346 (*) (*) 0 Finance (except depository institutions) and insurance 11,889 13,810 10,469 10,631 162 3,464 -122 223 345
Real estate and rental and leasing 1,955 1,673 (D) (D) 12 435 (D) (D) (D) Professional, scientific, and technical services -39 258 232 (D) (D) 254 -228 37 265 Other industries 315 (D) (D) 4,673 (D) (D) (D) (D) (D)
Continues on next page
19

Bureau of Economic AnalysisTable 5.3. Change in the Historical-Cost Foreign Direct Investment Position in the UnitedStates by Account, 2016[Millions of dollars]Release Date: July 24, 2017
Other changes in position Total (= column 11
+ column 12 + column 13)
Translation adjustments
/2/
Capital gains and losses of
affiliates
Other changes in volume and
valuation /3/ (10) (11) (12) (13)
All areas -35,293 -2,118 -19,706 -13,469 Manufacturing -33,520 -236 -4,720 -28,564 Wholesale trade -3,641 -391 -19,942 16,692 Retail trade -424 (D) -457 (D) Information -1,448 -56 -1,405 13 Depository institutions (banking) -8,814 -31 3,718 -12,500 Finance (except depository institutions) and insurance 24,930 -831 2,313 23,448
Real estate and rental and leasing 403 87 953 -637 Professional, scientific, and technical services 849 26 -59 882 Other industries -13,628 (D) -108 (D)
Canada -2,572 190 -3,212 450 Manufacturing -1,083 -27 -1,055 -1 Wholesale trade -36 (D) -75 (D) Retail trade -599 (D) (D) 0 Information -202 (D) (D) 18 Depository institutions (banking) (D) 0 -128 (D) Finance (except depository institutions) and insurance 490 46 -598 1,043
Real estate and rental and leasing 116 (D) (D) 5 Professional, scientific, and technical services 219 (D) (D) (D) Other industries (D) -19 -573 (D)
Europe -5,498 -1,428 -4,313 244 Manufacturing -17,207 18 -3,879 -13,346 Wholesale trade 8,963 -77 -7,228 16,268 Retail trade 518 (D) 204 (D) Information -868 -118 -349 -401 Depository institutions (banking) -11,468 (D) 4,277 (D) Finance (except depository institutions) and insurance 22,211 -627 611 22,226
Real estate and rental and leasing -517 (D) (D) -1,406 Professional, scientific, and technical services 2,159 28 191 1,940 Other industries -9,288 (D) (D) -9,594 Of which:
United Kingdom -5,520 -591 -10,157 5,227 Manufacturing -9,636 -200 -6,758 -2,679 Wholesale trade -553 -21 -145 -388 Retail trade 1 0 1 0 Information 441 (D) (D) 526 Depository institutions (banking) 238 (*) (D) (D) Finance (except depository institutions) and insurance 5,837 (D) -4,272 (D)
Real estate and rental and leasing -62 (D) 13 (D) Professional, scientific, and technical services 140 32 (D) (D)
Other industries -1,924 (D) 837 (D) Latin America and Other Western Hemisphere -13,692 -243 1,752 -15,201
Manufacturing -17,563 (D) (D) -17,167 Wholesale trade 1,480 (D) -20 (D) Retail trade (D) 0 (*) (D) Information 336 (*) 0 336 Depository institutions (banking) -444 (*) -190 -253 Finance (except depository institutions) and insurance (D) -9 1,923 (D)
Real estate and rental and leasing -748 -1 39 -786 Professional, scientific, and technical services -1,230 4 (D) (D) Other industries -767 (D) (D) -889
Continues on next page
20

Bureau of Economic AnalysisTable 5.3. Change in the Historical-Cost Foreign Direct Investment Position in the UnitedStates by Account, 2016[Millions of dollars]Release Date: July 24, 2017
Other changes in position Total (= column 11
+ column 12 + column 13)
Translation adjustments
/2/
Capital gains and losses of
affiliates
Other changes in volume and
valuation /3/ (10) (11) (12) (13)
Africa -37 (D) (D) -1 Manufacturing (D) 0 0 (D) Wholesale trade -60 (D) 0 (D) Retail trade 0 0 0 0 Information 0 0 0 0 Depository institutions (banking) (D) (D) (D) 0 Finance (except depository institutions) and insurance 0 0 0 0
Real estate and rental and leasing 0 0 0 0 Professional, scientific, and technical services (D) 0 0 (D) Other industries (D) (*) (D) (*)
Middle East 1,112 (D) (D) 882 Manufacturing (D) (D) (D) (D) Wholesale trade 0 0 0 0 Retail trade 0 0 0 0 Information 63 0 0 63 Depository institutions (banking) (D) 0 (D) 0 Finance (except depository institutions) and insurance (D) 0 0 (D)
Real estate and rental and leasing 1,270 0 (D) (D) Professional, scientific, and technical services (D) 0 0 (D) Other industries -15 0 0 -15
Asia and Pacific -14,607 -623 -14,142 158 Manufacturing 1,364 -40 186 1,218 Wholesale trade -13,988 -304 -12,620 -1,064 Retail trade (D) (D) (D) (D) Information -777 (D) (D) -3 Depository institutions (banking) 1,702 (D) -239 (D) Finance (except depository institutions) and insurance -1,921 -242 378 -2,057
Real estate and rental and leasing 281 (D) (*) (D) Professional, scientific, and technical services -297 (D) (D) 61 Other industries (D) 1 -665 (D)
Legend / Footnotes: 1. An increase in U.S. affiliates' receivables is a decrease in net intercompany debt and a financial outflow. 2. Represents changes in exchange rates used to translate the foreign-currency-denominated assets and liabilities of affiliates into U.S. dollars. 3. Includes (1) differences between the transaction values given or received for equity interests in affiliates and their book values and (2) the reclassification of investment positions between direct investment and portfolio investment. In addition, if an affiliate's industry classification changes, offsetting adjustments are made to move the position from the former to the current industry. Offsetting adjustments are also made when there is a change in the country of the foreign parent due to transactions between foreign residents or due to changes in the political boundaries of a country.
21
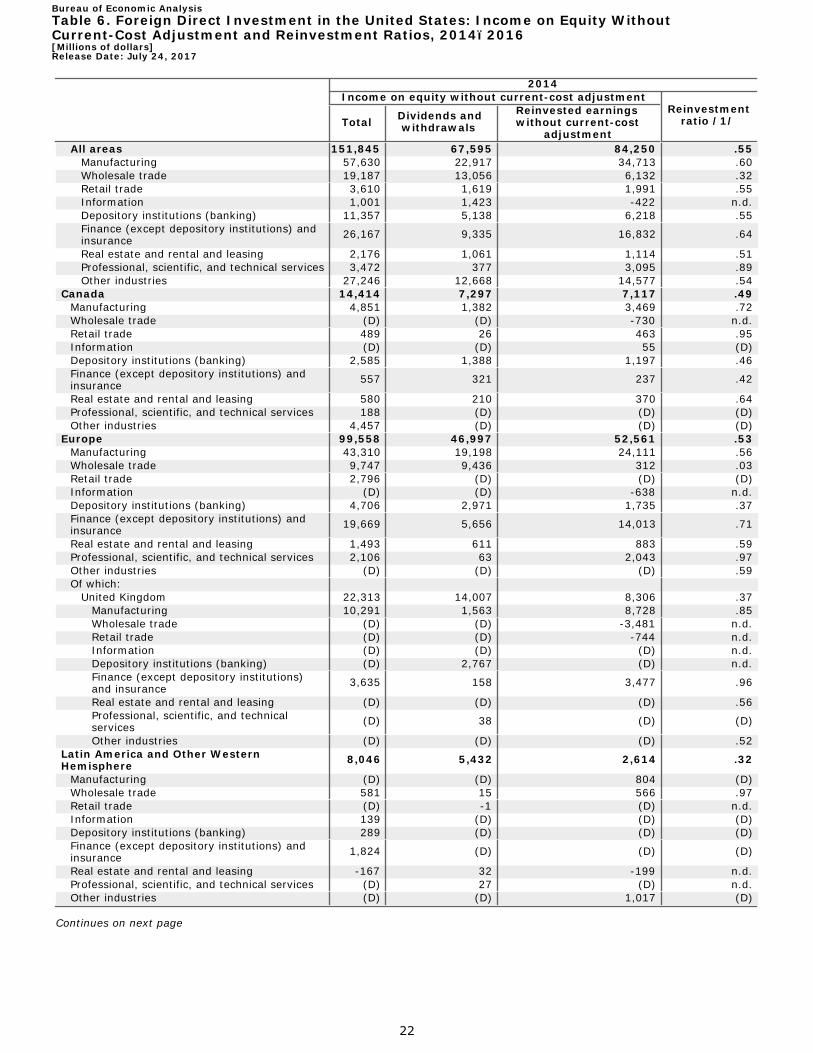
Bureau of Economic AnalysisTable 6. Foreign Direct Investment in the United States: Income on Equity WithoutCurrent-Cost Adjustment and Reinvestment Ratios, 2014–2016[Millions of dollars]Release Date: July 24, 2017
2014 Income on equity without current-cost adjustment
Reinvestment ratio /1/Total Dividends and
withdrawals Reinvested earnings without current-cost
adjustment All areas 151,845 67,595 84,250 .55
Manufacturing 57,630 22,917 34,713 .60 Wholesale trade 19,187 13,056 6,132 .32 Retail trade 3,610 1,619 1,991 .55 Information 1,001 1,423 -422 n.d. Depository institutions (banking) 11,357 5,138 6,218 .55 Finance (except depository institutions) and insurance 26,167 9,335 16,832 .64
Real estate and rental and leasing 2,176 1,061 1,114 .51 Professional, scientific, and technical services 3,472 377 3,095 .89 Other industries 27,246 12,668 14,577 .54
Canada 14,414 7,297 7,117 .49 Manufacturing 4,851 1,382 3,469 .72 Wholesale trade (D) (D) -730 n.d. Retail trade 489 26 463 .95 Information (D) (D) 55 (D) Depository institutions (banking) 2,585 1,388 1,197 .46 Finance (except depository institutions) and insurance 557 321 237 .42
Real estate and rental and leasing 580 210 370 .64 Professional, scientific, and technical services 188 (D) (D) (D) Other industries 4,457 (D) (D) (D)
Europe 99,558 46,997 52,561 .53 Manufacturing 43,310 19,198 24,111 .56 Wholesale trade 9,747 9,436 312 .03 Retail trade 2,796 (D) (D) (D) Information (D) (D) -638 n.d. Depository institutions (banking) 4,706 2,971 1,735 .37 Finance (except depository institutions) and insurance 19,669 5,656 14,013 .71
Real estate and rental and leasing 1,493 611 883 .59 Professional, scientific, and technical services 2,106 63 2,043 .97 Other industries (D) (D) (D) .59 Of which:
United Kingdom 22,313 14,007 8,306 .37 Manufacturing 10,291 1,563 8,728 .85 Wholesale trade (D) (D) -3,481 n.d. Retail trade (D) (D) -744 n.d. Information (D) (D) (D) n.d. Depository institutions (banking) (D) 2,767 (D) n.d. Finance (except depository institutions) and insurance 3,635 158 3,477 .96
Real estate and rental and leasing (D) (D) (D) .56 Professional, scientific, and technical services (D) 38 (D) (D)
Other industries (D) (D) (D) .52 Latin America and Other Western Hemisphere 8,046 5,432 2,614 .32
Manufacturing (D) (D) 804 (D) Wholesale trade 581 15 566 .97 Retail trade (D) -1 (D) n.d. Information 139 (D) (D) (D) Depository institutions (banking) 289 (D) (D) (D) Finance (except depository institutions) and insurance 1,824 (D) (D) (D)
Real estate and rental and leasing -167 32 -199 n.d. Professional, scientific, and technical services (D) 27 (D) n.d. Other industries (D) (D) 1,017 (D)
Continues on next page
22

Bureau of Economic AnalysisTable 6. Foreign Direct Investment in the United States: Income on Equity WithoutCurrent-Cost Adjustment and Reinvestment Ratios, 2014–2016[Millions of dollars]Release Date: July 24, 2017
2014 Income on equity without current-cost adjustment
Reinvestment ratio /1/Total Dividends and
withdrawals Reinvested earnings without current-cost
adjustment Africa 491 9 482 .98
Manufacturing (D) (D) 4 (D) Wholesale trade (D) (*) (D) 1.00 Retail trade 0 0 0 n.d. Information -2 -1 -1 n.d. Depository institutions (banking) (D) 0 (D) n.d. Finance (except depository institutions) and insurance (D) (*) (D) n.d.
Real estate and rental and leasing 13 8 5 .40 Professional, scientific, and technical services (D) (*) (D) 1.00 Other industries (D) (D) (D) .97
Middle East 270 156 114 .42 Manufacturing 284 (*) 284 1.00 Wholesale trade (D) -8 (D) (D) Retail trade (D) -1 (D) (D) Information (D) -1 (D) n.d. Depository institutions (banking) (D) (D) (D) .12 Finance (except depository institutions) and insurance (D) (D) -37 n.d.
Real estate and rental and leasing 20 4 16 .80 Professional, scientific, and technical services -2 -4 2 -.70 Other industries 32 (D) (D) (D)
Asia and Pacific 29,067 7,705 21,362 .73 Manufacturing (D) (D) 6,040 (D) Wholesale trade (D) (D) 5,849 (D) Retail trade 380 (D) (D) (D) Information 341 74 267 .78 Depository institutions (banking) (D) (D) 2,990 (D) Finance (except depository institutions) and insurance (D) (D) 2,535 (D)
Real estate and rental and leasing 236 197 40 .17 Professional, scientific, and technical services 812 (D) (D) (D) Other industries 3,885 1,159 2,726 .70
Continues on next page
23

Bureau of Economic AnalysisTable 6. Foreign Direct Investment in the United States: Income on Equity WithoutCurrent-Cost Adjustment and Reinvestment Ratios, 2014–2016[Millions of dollars]Release Date: July 24, 2017
2015 Income on equity without current-cost adjustment
Reinvestment ratio /1/Total Dividends and
withdrawals Reinvested earnings without current-cost
adjustment All areas 120,318 50,490 69,828 .58
Manufacturing 46,000 23,378 22,621 .49 Wholesale trade 16,872 5,234 11,638 .69 Retail trade 4,259 868 3,391 .80 Information 1,058 256 802 .76 Depository institutions (banking) 9,046 3,959 5,087 .56 Finance (except depository institutions) and insurance 22,660 7,956 14,704 .65
Real estate and rental and leasing 3,166 1,020 2,147 .68 Professional, scientific, and technical services 4,355 434 3,921 .90 Other industries 12,903 7,385 5,518 .43
Canada 14,950 5,582 9,368 .63 Manufacturing 4,505 (D) (D) (D) Wholesale trade 1,082 3 1,079 1.00 Retail trade 925 8 917 .99 Information (D) (D) 293 (D) Depository institutions (banking) 2,902 1,393 1,508 .52 Finance (except depository institutions) and insurance 1,969 346 1,623 .82
Real estate and rental and leasing 721 (D) (D) (D) Professional, scientific, and technical services 380 (D) (D) (D) Other industries (D) (D) 1,706 (D)
Europe 74,128 36,565 37,564 .51 Manufacturing 32,208 17,817 14,390 .45 Wholesale trade 8,061 4,214 3,847 .48 Retail trade 2,968 (D) (D) (D) Information 955 120 836 .87 Depository institutions (banking) 2,548 1,452 1,096 .43 Finance (except depository institutions) and insurance 13,963 5,966 7,998 .57
Real estate and rental and leasing 1,818 618 1,200 .66 Professional, scientific, and technical services 3,004 286 2,719 .90 Other industries 8,602 (D) (D) (D) Of which:
United Kingdom 4,955 9,680 -4,725 n.d. Manufacturing -3,162 3,178 -6,340 n.d. Wholesale trade 1,530 (D) (D) n.d. Retail trade (D) (D) (D) .98 Information -624 10 -633 n.d. Depository institutions (banking) 192 (D) (D) n.d. Finance (except depository institutions) and insurance 3,473 168 3,304 .95
Real estate and rental and leasing 967 (D) (D) (D) Professional, scientific, and technical services 892 262 630 .71
Other industries (D) (D) (D) n.d. Latin America and Other Western Hemisphere 7,911 (D) (D) (D)
Manufacturing 2,339 15 2,325 .99 Wholesale trade 586 (D) (D) (D) Retail trade -10 (D) (D) n.d. Information 32 (D) (D) (D) Depository institutions (banking) (D) (D) -180 n.d. Finance (except depository institutions) and insurance 2,374 (D) (D) (D)
Real estate and rental and leasing 151 34 117 .77 Professional, scientific, and technical services 196 (D) (D) (D) Other industries (D) (D) (D) .50
Continues on next page
24

Bureau of Economic AnalysisTable 6. Foreign Direct Investment in the United States: Income on Equity WithoutCurrent-Cost Adjustment and Reinvestment Ratios, 2014–2016[Millions of dollars]Release Date: July 24, 2017
2015 Income on equity without current-cost adjustment
Reinvestment ratio /1/Total Dividends and
withdrawals Reinvested earnings without current-cost
adjustment Africa 192 (D) (D) (D)
Manufacturing (D) (D) (D) 1.00 Wholesale trade (D) (D) (D) .99 Retail trade 0 0 0 n.d. Information (D) (D) (*) (D) Depository institutions (banking) (D) 0 (D) 1.00 Finance (except depository institutions) and insurance (D) (D) (D) n.d.
Real estate and rental and leasing (D) (D) (D) .30 Professional, scientific, and technical services (D) (*) (D) 1.00 Other industries (D) 1 (D) n.d.
Middle East 382 (D) (D) (D) Manufacturing (D) (D) -271 n.d. Wholesale trade (D) -8 (D) (D) Retail trade (D) -1 (D) (D) Information (D) -1 (D) n.d. Depository institutions (banking) (D) (D) (D) .59 Finance (except depository institutions) and insurance (D) (D) (D) .04
Real estate and rental and leasing (D) (D) 57 (D) Professional, scientific, and technical services (D) (D) (D) -2.06 Other industries (D) (D) (D) .78
Asia and Pacific 22,754 5,995 16,760 .74 Manufacturing 6,978 2,295 4,684 .67 Wholesale trade 6,626 971 5,656 .85 Retail trade (D) (D) 238 (D) Information -88 110 -197 n.d. Depository institutions (banking) (D) (D) 2,585 (D) Finance (except depository institutions) and insurance 4,249 776 3,472 .82
Real estate and rental and leasing 403 (D) (D) (D) Professional, scientific, and technical services 760 (D) (D) (D) Other industries (D) (D) (D) n.d.
Continues on next page
25

Bureau of Economic AnalysisTable 6. Foreign Direct Investment in the United States: Income on Equity WithoutCurrent-Cost Adjustment and Reinvestment Ratios, 2014–2016[Millions of dollars]Release Date: July 24, 2017
2016 Income on equity without current-cost adjustment
Reinvestment ratio /1/Total Dividends and
withdrawals Reinvested earnings without current-cost
adjustment All areas 126,903 40,436 86,467 .68
Manufacturing 61,904 13,360 48,544 .78 Wholesale trade 7,058 7,971 -913 n.d. Retail trade 4,862 840 4,021 .83 Information 806 165 641 .80 Depository institutions (banking) 8,162 2,958 5,203 .64 Finance (except depository institutions) and insurance 27,770 8,859 18,911 .68
Real estate and rental and leasing 3,391 1,060 2,331 .69 Professional, scientific, and technical services 2,928 378 2,550 .87 Other industries 10,023 4,845 5,178 .52
Canada 15,327 5,586 9,741 .64 Manufacturing 4,704 3,310 1,394 .30 Wholesale trade 612 191 421 .69 Retail trade 1,093 7 1,087 .99 Information (D) (D) (D) n.d. Depository institutions (banking) (D) (D) 1,655 (D) Finance (except depository institutions) and insurance 2,747 300 2,446 .89
Real estate and rental and leasing 1,002 51 951 .95 Professional, scientific, and technical services 454 (D) (D) (D) Other industries (D) 331 (D) (D)
Europe 85,517 27,529 57,988 .68 Manufacturing 46,521 7,798 38,722 .83 Wholesale trade 2,210 6,285 -4,075 n.d. Retail trade 3,352 (D) (D) (D) Information 1,494 97 1,397 .94 Depository institutions (banking) 1,673 973 700 .42 Finance (except depository institutions) and insurance 17,921 6,646 11,275 .63
Real estate and rental and leasing 1,721 850 870 .51 Professional, scientific, and technical services 2,418 (D) (D) (D) Other industries 8,208 3,892 4,315 .53 Of which:
United Kingdom 14,202 6,322 7,880 .55 Manufacturing 5,080 695 4,384 .86 Wholesale trade (D) (D) (D) n.d. Retail trade 619 (D) (D) (D) Information 106 (D) (D) (D) Depository institutions (banking) (D) (D) -1,325 n.d. Finance (except depository institutions) and insurance 4,989 415 4,574 .92
Real estate and rental and leasing 727 (D) (D) (D) Professional, scientific, and technical services 503 58 444 .88
Other industries (D) (D) (D) n.d. Latin America and Other Western Hemisphere 6,933 2,122 4,811 .69
Manufacturing 2,128 (D) (D) (D) Wholesale trade (D) (D) (D) .77 Retail trade (D) (D) (D) n.d. Information -15 (D) (D) n.d. Depository institutions (banking) (D) (D) (D) 1.00 Finance (except depository institutions) and insurance 2,654 (D) (D) (D)
Real estate and rental and leasing 129 30 99 .77 Professional, scientific, and technical services (D) (D) (D) n.d. Other industries 1,715 (D) (D) (D)
Continues on next page
26

Bureau of Economic AnalysisTable 6. Foreign Direct Investment in the United States: Income on Equity WithoutCurrent-Cost Adjustment and Reinvestment Ratios, 2014–2016[Millions of dollars]Release Date: July 24, 2017
2016 Income on equity without current-cost adjustment
Reinvestment ratio /1/Total Dividends and
withdrawals Reinvested earnings without current-cost
adjustment Africa 193 9 183 .95
Manufacturing (D) (*) (D) 1.00 Wholesale trade (D) (D) (D) .95 Retail trade 0 0 0 n.d. Information (D) (D) (*) (D) Depository institutions (banking) (D) 0 (D) 1.00 Finance (except depository institutions) and insurance (*) (*) (*) n.d.
Real estate and rental and leasing (D) (D) 1 (D) Professional, scientific, and technical services (D) (*) (D) 1.00 Other industries (D) (D) (D) n.d.
Middle East 810 66 744 .92 Manufacturing (D) (D) (D) 1.00 Wholesale trade (D) -9 (D) (D) Retail trade (D) -1 (D) (D) Information -70 -1 -69 n.d. Depository institutions (banking) (D) (D) (D) .88 Finance (except depository institutions) and insurance (D) (D) (D) n.d.
Real estate and rental and leasing (D) (D) -25 n.d. Professional, scientific, and technical services (D) (D) 3 (D) Other industries -5 (D) (D) n.d.
Asia and Pacific 18,123 5,124 12,999 .72 Manufacturing (D) (D) 6,751 (D) Wholesale trade 3,370 1,445 1,925 .57 Retail trade 391 (D) (D) (D) Information -562 (D) (D) n.d. Depository institutions (banking) (D) (D) 2,346 (D) Finance (except depository institutions) and insurance (D) (D) 3,464 (D)
Real estate and rental and leasing 551 116 435 .79 Professional, scientific, and technical services 339 85 254 .75 Other industries (D) (D) (D) n.d.
Legend / Footnotes: n.d. Reinvestment ratio is not defined because reinvested earnings without current-cost adjustment are negative or income on equity without current-cost adjustment is zero. 1. Reinvested earnings without current-cost adjustment divided by income on equity without current-cost adjustment. Note. In this table, income on equity and dividends and withdrawals are shown before deduction of withholding taxes.
27

Bureau of Economic AnalysisTable 7. Foreign Direct Investment in the United States: Income Without Current-CostAdjustment, 2014–2016[Millions of dollars]Release Date: July 24, 2017
2014
Total (= column 2 + column 3)
Income on equity without current-cost adjustment
Interest
Net U.S. affiliates' payments
U.S. affiliates' receipts
(1) (2) (3) (4) (5) All areas 177,294 151,845 25,449 30,003 4,554
Manufacturing 70,634 57,630 13,004 14,331 1,326 Wholesale trade 20,769 19,187 1,582 2,725 1,144 Retail trade 4,335 3,610 725 734 9 Information 3,608 1,001 2,607 2,702 94 Depository institutions (banking) 11,357 11,357 (*) (*) 0 Finance (except depository institutions) and insurance 27,824 26,167 1,658 2,143 485
Real estate and rental and leasing 2,941 2,176 765 833 67 Professional, scientific, and technical services 3,682 3,472 210 (D) (D) Other industries 32,144 27,246 4,898 (D) (D)
Canada 15,032 14,414 619 978 359 Manufacturing 4,999 4,851 148 336 187 Wholesale trade 569 (D) (D) 58 (D) Retail trade 490 489 1 7 6 Information 178 (D) (D) 9 (D) Depository institutions (banking) 2,585 2,585 0 0 0 Finance (except depository institutions) and insurance 587 557 30 64 35
Real estate and rental and leasing 603 580 23 27 4 Professional, scientific, and technical services 181 188 -7 (D) (D) Other industries 4,841 4,457 384 (D) (D)
Europe 122,793 99,558 23,234 26,695 3,460 Manufacturing 56,013 43,310 12,703 13,643 940 Wholesale trade 10,954 9,747 1,207 1,979 773 Retail trade 3,507 2,796 711 713 2 Information 3,206 (D) (D) 2,684 (D) Depository institutions (banking) 4,706 4,706 0 0 0 Finance (except depository institutions) and insurance 20,796 19,669 1,126 1,539 412
Real estate and rental and leasing 2,047 1,493 554 603 50 Professional, scientific, and technical services 2,303 2,106 197 (D) (D) Other industries 19,261 (D) (D) (D) (D) Of which:
United Kingdom 27,147 22,313 4,833 5,735 902 Manufacturing 12,268 10,291 1,977 2,402 425 Wholesale trade 1,339 (D) (D) 183 (D) Retail trade 314 (D) (D) (D) (*) Information 919 (D) (D) 1,090 (D) Depository institutions (banking) (D) (D) 0 0 0 Finance (except depository institutions) and insurance 3,691 3,635 56 128 72
Real estate and rental and leasing 795 (D) (D) (D) (D) Professional, scientific, and technical services 726 (D) (D) 109 (D)
Other industries (D) (D) (D) 1,743 (D) Latin America and Other Western Hemisphere 8,835 8,046 790 1,403 613
Manufacturing 1,723 (D) (D) (D) 167 Wholesale trade 623 581 43 (D) (D) Retail trade (D) (D) (D) 8 (D) Information (D) 139 (D) (D) 7 Depository institutions (banking) 289 289 (*) (*) 0 Finance (except depository institutions) and insurance 2,269 1,824 445 481 35
Real estate and rental and leasing -75 -167 92 96 4 Professional, scientific, and technical services (D) (D) (D) 1 (D) Other industries 3,927 (D) (D) (D) (D)
Continues on next page
28

Bureau of Economic AnalysisTable 7. Foreign Direct Investment in the United States: Income Without Current-CostAdjustment, 2014–2016[Millions of dollars]Release Date: July 24, 2017
2014
Total (= column 2 + column 3)
Income on equity without current-cost adjustment
Interest
Net U.S. affiliates' payments
U.S. affiliates' receipts
(1) (2) (3) (4) (5) Africa 488 491 -3 5 8
Manufacturing 5 (D) (D) (D) (D) Wholesale trade (D) (D) (D) (D) (D) Retail trade 0 0 0 0 0 Information -2 -2 (*) (D) (D) Depository institutions (banking) (D) (D) 0 0 0 Finance (except depository institutions) and insurance (*) (D) (D) (*) (D)
Real estate and rental and leasing 11 13 -3 1 4 Professional, scientific, and technical services (D) (D) (D) (*) (D) Other industries 31 (D) (D) (D) 3
Middle East 346 270 76 80 4 Manufacturing 289 284 5 (D) (D) Wholesale trade (D) (D) 5 6 1 Retail trade (D) (D) (*) (*) (*) Information (D) (D) (D) (*) (D) Depository institutions (banking) (D) (D) 0 0 0 Finance (except depository institutions) and insurance 90 (D) (D) 51 (D)
Real estate and rental and leasing 32 20 12 12 (*) Professional, scientific, and technical services -2 -2 1 1 (*) Other industries (D) 32 (D) (D) (D)
Asia and Pacific 29,800 29,067 732 843 110 Manufacturing 7,606 (D) (D) 189 (D) Wholesale trade 8,490 (D) (D) (D) (D) Retail trade (D) 380 (D) 6 (D) Information 343 341 2 3 1 Depository institutions (banking) (D) (D) 0 0 0 Finance (except depository institutions) and insurance 4,082 (D) (D) 8 (D)
Real estate and rental and leasing 324 236 87 93 5 Professional, scientific, and technical services 830 812 18 20 3 Other industries (D) 3,885 (D) (D) (D)
Continues on next page
29

Bureau of Economic AnalysisTable 7. Foreign Direct Investment in the United States: Income Without Current-CostAdjustment, 2014–2016[Millions of dollars]Release Date: July 24, 2017
2015
Total (= column 7 + column 8)
Income on equity without current-cost adjustment
Interest
Net U.S. affiliates' payments
U.S. affiliates' receipts
(6) (7) (8) (9) (10) All areas 148,335 120,318 28,017 32,843 4,826
Manufacturing 59,998 46,000 13,998 15,397 1,398 Wholesale trade 19,237 16,872 2,365 3,421 1,056 Retail trade 5,083 4,259 824 834 10 Information 3,723 1,058 2,664 2,714 50 Depository institutions (banking) 9,046 9,046 (*) (*) 0 Finance (except depository institutions) and insurance 24,121 22,660 1,461 2,149 688
Real estate and rental and leasing 3,841 3,166 674 906 232 Professional, scientific, and technical services 5,198 4,355 842 1,650 807 Other industries 18,090 12,903 5,187 5,772 585
Canada 15,941 14,950 991 1,344 353 Manufacturing 4,791 4,505 286 450 164 Wholesale trade 1,304 1,082 222 (D) (D) Retail trade 925 925 (*) 7 7 Information 338 (D) (D) 9 (D) Depository institutions (banking) 2,902 2,902 0 0 0 Finance (except depository institutions) and insurance 1,950 1,969 -19 8 27
Real estate and rental and leasing 797 721 76 80 4 Professional, scientific, and technical services 447 380 66 (D) (D) Other industries 2,488 (D) (D) 420 (D)
Europe 99,497 74,128 25,369 28,909 3,541 Manufacturing 45,696 32,208 13,488 14,486 998 Wholesale trade 10,138 8,061 2,077 2,595 519 Retail trade 3,778 2,968 810 812 2 Information 3,613 955 2,658 2,696 38 Depository institutions (banking) 2,548 2,548 0 0 0 Finance (except depository institutions) and insurance 14,787 13,963 823 1,438 614
Real estate and rental and leasing 2,190 1,818 372 582 210 Professional, scientific, and technical services 3,767 3,004 763 1,530 767 Other industries 12,981 8,602 4,378 4,771 392 Of which:
United Kingdom 9,348 4,955 4,393 5,101 708 Manufacturing -1,102 -3,162 2,060 2,288 227 Wholesale trade 1,610 1,530 79 120 41 Retail trade 350 (D) (D) 24 (D) Information 386 -624 1,009 1,025 16 Depository institutions (banking) 192 192 0 0 0 Finance (except depository institutions) and insurance 3,572 3,473 99 203 104
Real estate and rental and leasing 1,005 967 39 (D) (D) Professional, scientific, and technical services 925 892 33 (D) (D)
Other industries 2,410 (D) (D) 1,197 (D) Latin America and Other Western Hemisphere 8,610 7,911 699 1,475 776
Manufacturing 2,321 2,339 -18 172 190 Wholesale trade 367 586 -220 (D) (D) Retail trade (D) -10 (D) 8 (D) Information (D) 32 (D) (D) 7 Depository institutions (banking) 20 (D) (D) (D) 0 Finance (except depository institutions) and insurance 2,956 2,374 582 626 44
Real estate and rental and leasing 253 151 102 (D) (D) Professional, scientific, and technical services 197 196 1 1 1 Other industries 2,470 (D) (D) (D) (D)
Continues on next page
30

Bureau of Economic AnalysisTable 7. Foreign Direct Investment in the United States: Income Without Current-CostAdjustment, 2014–2016[Millions of dollars]Release Date: July 24, 2017
2015
Total (= column 7 + column 8)
Income on equity without current-cost adjustment
Interest
Net U.S. affiliates' payments
U.S. affiliates' receipts
(6) (7) (8) (9) (10) Africa 189 192 -4 6 10
Manufacturing (D) (D) (D) (D) (*) Wholesale trade (D) (D) 1 1 (*) Retail trade 0 0 0 0 0 Information -1 (D) (D) (D) (D) Depository institutions (banking) (D) (D) 0 0 0 Finance (except depository institutions) and insurance (*) (D) (D) (D) (D)
Real estate and rental and leasing 9 (D) (D) (D) 4 Professional, scientific, and technical services 15 (D) (D) (D) (*) Other industries -124 (D) (D) (D) 5
Middle East 516 382 134 138 4 Manufacturing (D) (D) (D) (D) 1 Wholesale trade (D) (D) 15 15 (*) Retail trade (D) (D) (D) (*) (D) Information (D) (D) 1 (D) (D) Depository institutions (banking) (D) (D) 0 0 0 Finance (except depository institutions) and insurance 161 (D) (D) (D) (D)
Real estate and rental and leasing 74 (D) (D) (D) (D) Professional, scientific, and technical services -1 (D) (D) 1 (D) Other industries 56 (D) (D) (D) 2
Asia and Pacific 23,582 22,754 828 971 143 Manufacturing 7,174 6,978 196 240 45 Wholesale trade 6,896 6,626 270 323 53 Retail trade 368 (D) (D) 7 (D) Information -85 -88 2 3 1 Depository institutions (banking) 3,453 (D) (D) (D) 0 Finance (except depository institutions) and insurance 4,267 4,249 18 (D) (D)
Real estate and rental and leasing 518 403 115 125 10 Professional, scientific, and technical services 773 760 12 (D) (D) Other industries 219 (D) (D) (D) (D)
Continues on next page
31

Bureau of Economic AnalysisTable 7. Foreign Direct Investment in the United States: Income Without Current-CostAdjustment, 2014–2016[Millions of dollars]Release Date: July 24, 2017
2016
Total (= column 12 + column 13)
Income on equity without current-cost adjustment
Interest
Net U.S. affiliates' payments
U.S. affiliates' receipts
(11) (12) (13) (14) (15) All areas 159,749 126,903 32,846 39,720 6,874
Manufacturing 78,714 61,904 16,810 19,249 2,439 Wholesale trade 9,241 7,058 2,183 3,558 1,375 Retail trade 5,789 4,862 927 963 36 Information 3,637 806 2,831 2,878 46 Depository institutions (banking) 8,162 8,162 (*) (*) 0 Finance (except depository institutions) and insurance 29,573 27,770 1,803 2,903 1,100
Real estate and rental and leasing 4,242 3,391 851 1,182 331 Professional, scientific, and technical services 4,132 2,928 1,204 1,867 663 Other industries 16,259 10,023 6,236 7,120 885
Canada 16,417 15,327 1,090 1,441 351 Manufacturing 4,954 4,704 250 393 142 Wholesale trade 812 612 200 (D) (D) Retail trade 1,087 1,093 -6 (D) (D) Information -34 (D) (D) 10 (D) Depository institutions (banking) (D) (D) 0 0 0 Finance (except depository institutions) and insurance 2,824 2,747 78 (D) (D)
Real estate and rental and leasing 1,075 1,002 73 77 4 Professional, scientific, and technical services 524 454 70 (D) (D) Other industries (D) (D) (D) 497 (D)
Europe 115,033 85,517 29,515 34,799 5,284 Manufacturing 61,837 46,521 15,316 17,370 2,053 Wholesale trade 4,444 2,210 2,233 2,856 623 Retail trade 4,260 3,352 908 932 24 Information 4,314 1,494 2,820 2,854 34 Depository institutions (banking) 1,673 1,673 0 0 0 Finance (except depository institutions) and insurance 19,353 17,921 1,433 2,400 967
Real estate and rental and leasing 2,184 1,721 464 778 314 Professional, scientific, and technical services 3,541 2,418 1,123 1,729 606 Other industries 13,426 8,208 5,219 5,881 662 Of which:
United Kingdom 19,485 14,202 5,282 6,316 1,034 Manufacturing 6,978 5,080 1,898 2,217 319 Wholesale trade 1,679 (D) (D) (D) (D) Retail trade 630 619 11 (D) (D) Information 1,101 106 995 1,010 16 Depository institutions (banking) (D) (D) 0 0 0 Finance (except depository institutions) and insurance 5,661 4,989 671 798 127
Real estate and rental and leasing 1,123 727 396 (D) (D) Professional, scientific, and technical services 551 503 48 (D) (D)
Other industries (D) (D) (D) 1,393 (D) Latin America and Other Western Hemisphere 7,906 6,933 973 1,917 944
Manufacturing 2,923 2,128 795 (D) (D) Wholesale trade (D) (D) (D) (D) 528 Retail trade (D) (D) (D) (D) (D) Information -13 -15 3 10 7 Depository institutions (banking) 348 (D) (D) (D) 0 Finance (except depository institutions) and insurance 2,866 2,654 213 (D) (D)
Real estate and rental and leasing 213 129 84 89 5 Professional, scientific, and technical services -287 (D) (D) 10 (D) Other industries 2,095 1,715 380 482 102
Continues on next page
32
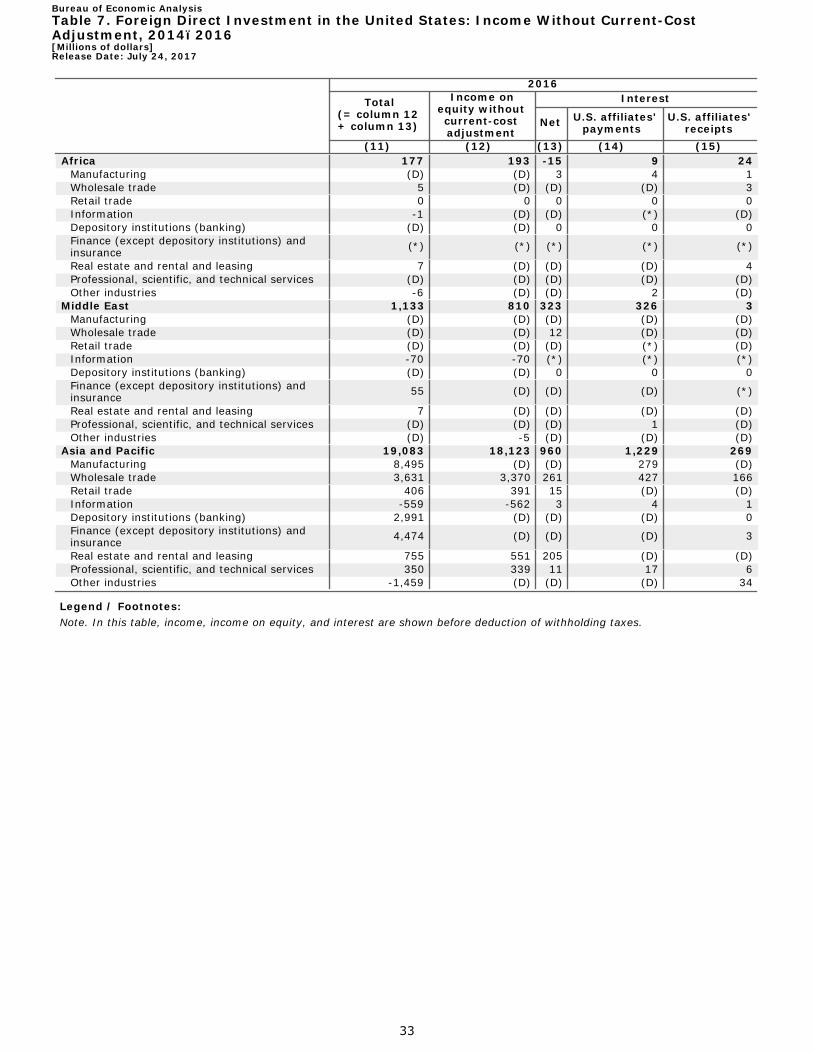
Bureau of Economic AnalysisTable 7. Foreign Direct Investment in the United States: Income Without Current-CostAdjustment, 2014–2016[Millions of dollars]Release Date: July 24, 2017
2016
Total (= column 12 + column 13)
Income on equity without current-cost adjustment
Interest
Net U.S. affiliates' payments
U.S. affiliates' receipts
(11) (12) (13) (14) (15) Africa 177 193 -15 9 24
Manufacturing (D) (D) 3 4 1 Wholesale trade 5 (D) (D) (D) 3 Retail trade 0 0 0 0 0 Information -1 (D) (D) (*) (D) Depository institutions (banking) (D) (D) 0 0 0 Finance (except depository institutions) and insurance (*) (*) (*) (*) (*)
Real estate and rental and leasing 7 (D) (D) (D) 4 Professional, scientific, and technical services (D) (D) (D) (D) (D) Other industries -6 (D) (D) 2 (D)
Middle East 1,133 810 323 326 3 Manufacturing (D) (D) (D) (D) (D) Wholesale trade (D) (D) 12 (D) (D) Retail trade (D) (D) (D) (*) (D) Information -70 -70 (*) (*) (*) Depository institutions (banking) (D) (D) 0 0 0 Finance (except depository institutions) and insurance 55 (D) (D) (D) (*)
Real estate and rental and leasing 7 (D) (D) (D) (D) Professional, scientific, and technical services (D) (D) (D) 1 (D) Other industries (D) -5 (D) (D) (D)
Asia and Pacific 19,083 18,123 960 1,229 269 Manufacturing 8,495 (D) (D) 279 (D) Wholesale trade 3,631 3,370 261 427 166 Retail trade 406 391 15 (D) (D) Information -559 -562 3 4 1 Depository institutions (banking) 2,991 (D) (D) (D) 0 Finance (except depository institutions) and insurance 4,474 (D) (D) (D) 3
Real estate and rental and leasing 755 551 205 (D) (D) Professional, scientific, and technical services 350 339 11 17 6 Other industries -1,459 (D) (D) (D) 34
Legend / Footnotes: Note. In this table, income, income on equity, and interest are shown before deduction of withholding taxes.
33

2014
Bureau of Economic AnalysisTable 8.1. Foreign Direct Investment Position in the United States on a Historical-Cost Basis,
[Millions of dollars]Release Date: July 24, 2017
All industries
Manufacturing
Total Food Chemicals Primary and fabricated metals
Machinery
Computers and
electronic products
Electrical equipment,
appliances, and components
Transportation equipment
Other manufacturing
All countries 2,945,795 1,114,540 72,994 385,850 63,447 83,364 47,454 38,105 116,026 307,300 Canada 273,896 80,981 3,777 45,075 5,610 105 612 -105 8,339 17,567 Europe /1/ 2,004,199 839,633 58,672 311,604 44,935 52,084 28,687 35,818 58,972 248,860
Austria 6,962 3,207 (D) 16 568 594 -1 (D) 27 (D) Belgium 97,038 55,974 (D) 19,327 641 2,279 10 (D) (D) (D) Denmark 13,322 3,475 (D) 653 (D) 1,322 (D) 4 9 199 Finland 4,284 2,002 (D) (D) (D) 1,542 7 (D) (D) 200 France 202,682 90,195 1,756 45,951 2,248 (D) 1,889 (D) 8,617 15,322 Germany 251,009 83,942 318 27,000 7,818 12,321 635 946 25,308 9,593 Ireland 26,431 6,349 (D) 3,184 (D) -642 (D) (D) 0 (D) Italy 23,508 5,999 426 934 342 875 (D) 96 -39 (D) Luxembourg 232,288 92,796 3,605 68,420 4,124 408 (D) (D) 858 (D) Netherlands 258,177 141,347 (D) 26,847 546 (D) 13,165 (D) 2,949 45,786 Norway 19,539 1,496 1 (D) (D) (D) -4 (D) (D) (D) Spain 63,956 7,548 (D) (D) (D) (D) (D) 22 510 1,420 Sweden 40,142 36,572 2 (D) 7,539 2,994 (D) (D) 2,192 4,475 Switzerland 245,188 111,874 16,534 28,464 1,470 3,561 353 (D) 230 (D) United Kingdom 479,373 172,935 7,097 67,382 10,998 3,254 4,850 288 16,260 62,806 Other 40,300 23,922 6,166 3,411 5,365 35 68 (D) 1,121 (D)
Latin America and Other Western Hemisphere 117,051 32,111 5,738 131 2,342 (D) -1,449 161 1,893 (D) South and Central America 25,083 8,647 2,678 -142 (D) -287 -153 (D) 289 4,426
Brazil 1,444 126 -82 -376 190 -115 -108 (D) 716 (D) Mexico 15,198 4,395 (D) 179 856 -119 -48 -10 -319 (D) Panama 2,350 881 0 (D) (D) (D) (*) (*) 3 (D) Venezuela 3,926 (D) (D) (D) (D) (D) (D) -7 (D) (D) Other 2,166 (D) (D) (D) (D) (D) (D) (D) (D) 44
Other Western Hemisphere 91,967 23,464 3,060 273 (D) (D) -1,296 (D) 1,604 (D) Bahamas 813 (D) 2 (D) (D) 0 (*) 0 1 (*) Bermuda 993 10,082 (D) (D) (D) (D) (D) 0 0 616 Curacao 1,982 (D) -3 (D) 0 (D) 1 0 0 (D) United Kingdom Islands, Caribbean 87,344 12,761 (D) 562 (D) (D) (D) (D) 1,603 2,960 Other 834 202 -2 (D) 0 0 (D) 0 0 (D)
Africa 1,691 -126 (D) -22 (D) 6 -6 -3 (D) -67 South Africa 329 -50 -4 (D) 1 (D) -2 -1 (D) (D) Other 1,362 -76 (D) (D) (D) (D) -4 -3 (D) (D)
Middle East 16,467 2,551 (D) 2,300 (D) (D) 158 -38 (D) -82 Israel 6,175 2,664 (D) 2,233 (D) (D) 172 -1 (D) (D) Kuwait 1,072 4 0 0 0 0 (D) (D) (D) (D) Lebanon -19 0 0 0 0 0 0 0 0 0 Saudi Arabia (D) 5 (*) (D) (D) (*) (D) (D) 0 (D) United Arab Emirates 2,618 -73 0 (D) -1 (D) (D) (D) -1 (D) Other (D) -48 0 0 0 (D) (D) 0 0 (D)
Asia and Pacific 532,491 159,390 4,735 26,761 10,591 (D) 19,451 2,272 46,785 (D) Australia 56,404 14,038 867 (D) 1,298 (*) -24 -4 -29 (D) China 10,071 2,609 -22 153 (D) 583 30 32 657 (D) Hong Kong 9,776 2,362 (D) (D) -2 (D) (D) (D) (D) -66 India 8,927 1,148 (D) 590 8 (D) 40 (D) (*) (D) Japan 371,874 121,055 3,244 18,239 7,678 13,922 8,958 1,911 43,988 23,114 Korea, Republic of 39,966 5,402 (D) (D) 492 (D) 20 -3 1,221 1,140 Malaysia 1,154 201 6 -1 (*) (D) (D) 1 -4 (D) New Zealand 1,048 218 8 (D) (D) (D) -1 (D) (D) -1 Singapore 20,665 9,632 (D) -118 19 (D) (D) (D) (D) 296 Taiwan 6,107 2,444 -1 (D) 6 (D) 106 (D) 12 (D) Other 6,498 282 (D) -26 (D) -11 8 (D) 174 73
Addenda: European Union (28) 1,725,714 720,649 42,116 280,344 39,672 48,502 28,333 (D) 58,696 (D) OPEC 14,596 2,456 (D) 28 -61 (D) 26 -46 -43 (D)
Continues on next page
34

2014
Bureau of Economic AnalysisTable 8.1. Foreign Direct Investment Position in the United States on a Historical-Cost Basis,
[Millions of dollars]Release Date: July 24, 2017
Wholesale trade
Retail trade
58,911 7,733
42,432 (D) (D) -1 (*)
4,846 (D) (D)
4,263 956
3,791 (*) (D) 98 (D)
2,109 (D) (D) (D) (*)
122 24 (D) (D)
1,919 0 6
(D) 1,820
(D) (D) (D)
0 (D) (D)
0 0 0
(*) (D)
6,597 (D) -15 (D)
0 6,367
1 0
(*) (D) (D) -2
31,848 (D)
Information Depository institutions
Finance (except depository institutions) and insurance
Real estate and rental and
leasing
Professional, scientific, and
technical services
Other industries
All countries Canada Europe /1/
Austria Belgium Denmark Finland France Germany Ireland Italy Luxembourg Netherlands Norway Spain Sweden Switzerland United Kingdom Other
Latin America and Other Western Hemisphere South and Central America
Brazil Mexico Panama Venezuela Other
Other Western Hemisphere Bahamas Bermuda Curacao United Kingdom Islands, Caribbean Other
Africa South Africa Other
Middle East Israel Kuwait Lebanon Saudi Arabia United Arab Emirates Other
Asia and Pacific Australia China Hong Kong India Japan Korea, Republic of Malaysia New Zealand Singapore Taiwan Other
Addenda: European Union (28) OPEC
332,424 8,246
160,869 (D)
23,117 5,968 2,182
17,182 22,634
(D) 2,121
13,381 14,729 14,321
76 -4,257 22,715 29,097
(D) 8,870
946 -974
1,390 (D) (D) (D)
7,924 (D) (D) (D)
13,560 (D) (D) (D) 183 (D) 420
0 (*) (D) (D) (D)
148,870 3,870 -171
2,247 209
111,952 26,464
420 683
2,472 474 249
123,007 (D)
147,618 4,398
114,011 4
(D) 8
(D) 15,646
(D) (D) 139
21,064 6,279
(D) 81 (D)
12,532 21,030
552 1,044
-411 -51
-340 1 3
-24 1,455
(*) (D) (D)
1,237 (D) (D) (D) (D) (D) (D) (*)
0 2
(D) (D)
27,275 -7
155 (D) -3
25,528 (D) (D)
2 (D) 97 8
101,309 154
198,002 42,968
116,269 (D) (D)
0 (D)
19,335 17,431
-49 (D)
0 (D) (D)
16,735 (D) (D)
57,276 619
5,756 5,110 1,209 1,126
(D) 1,337
(D) 646 (D)
0 (D) (D)
8 (D)
0 (D) (D)
1,760 (D)
0 (D) (D) (D)
31,134 2,011 2,632
653 1,403
20,820 1,020
(D) 0
476 1,780
(D)
113,466 1,536
385,997 50,272
264,876 3
(D) 1
(*) 29,896 40,461 5,483
(D) 24,984 37,050
(D) (D) 118
47,507 55,182
-51 10,363
1,372 1,011
248 114 (D) (D)
8,991 118
-14,486 17
23,336 6 9
(D) (D)
2,139 (D) (D) (*)
0 (D) (D)
58,337 4,572
(D) 14 (D)
45,614 521 (D)
2 (D) (D) (D)
217,296 2,027
65,374 7,576
34,107 (D) (D) 38 2
778 8,305
(D) (D)
1,629 5,582 1,697 1,377
(D) (D)
2,992 4,854 9,165 1,143
(D) 345 604 17 (D)
8,022 65
1,316 534
5,690 417 528
2 526
1,643 580
1,077 (D) 30 (D) (D)
12,355 707 (D) 332 (*)
10,254 142 (D) 72 7
19 61
30,615 1,068
130,015 5,113
101,494 (D) 322 (D) (D)
5,604 (D) (D) (D)
30,662 4,700
(D) 436 (D)
1,014 31,024
4 4,342
-30 -74 75 -1
-12 -17
4,372 (D)
3,281 (D) 559 (D) (D) -44 (D) (D) -70
0 (D) (D) -16 (D)
19,075 (D)
-105 128
3,062 9,125
68 24 16 (D)
8 15
99,737 -38
512,914 66,609
330,507 46
7,439 (D) (D)
19,199 26,001 2,991 6,120
46,817 (D) (D) (D)
2,844 39,186
107,730 (D) (D) (D) (D)
7,838 (D)
-110 -344
35,174 310 (D) 641 (D)
-585 (D) 128 (D)
2,337 -225 (D) (D) (D) 784
1,842 69,457
(D) (D) (D) (D)
21,160 (D) (D) 54
1,688 (D)
5,523
287,789 (D)
Legend / Footnotes: 1. In 2014, the euro area includes Austria, Belgium, Cyprus, Estonia, Finland, France, Germany, Greece, Ireland, Italy, Latvia, Luxembourg, Malta, the Netherlands, Portugal, Slovakia, Slovenia, and Spain. For 2014, the euro area direct investment position in the United States was $1,171,179 million.
35

2015
Bureau of Economic AnalysisTable 8.2. Foreign Direct Investment Position in the United States on a Historical-Cost Basis,
[Millions of dollars]Release Date: July 24, 2017
All industries
Manufacturing
Total Food Chemicals Primary and fabricated metals
Machinery
Computers and
electronic products
Electrical equipment,
appliances, and components
Transportation equipment
Other manufacturing
All countries 3,303,586 1,362,109 89,217 566,595 67,171 90,721 58,069 38,901 134,623 316,812 Canada 322,118 114,373 4,507 80,514 5,708 514 943 -89 8,237 14,040 Europe /1/ 2,276,695 1,036,344 65,419 447,370 47,897 64,659 37,366 36,787 79,266 257,580
Austria 7,088 3,133 (D) (D) 553 523 (D) 1 22 1,861 Belgium 89,231 53,672 (D) 16,083 558 1,568 -65 (D) (D) (D) Denmark 14,432 4,614 (D) 642 (D) 2,115 (D) 3 9 511 Finland 6,482 2,053 (D) (D) (D) 1,435 15 (D) (D) 217 France 232,431 107,965 2,004 60,300 2,548 356 4,273 (D) 9,765 (D) Germany 279,735 103,382 334 27,227 7,827 14,040 604 1,006 39,798 12,547 Ireland 35,814 -12,611 (D) 7,825 271 -334 (D) (D) 0 (D) Italy 27,690 7,278 472 992 450 1,624 (D) (D) (D) (D) Luxembourg 347,864 233,055 (D) 162,098 4,016 (D) (D) (D) 902 36,146 Netherlands 299,780 137,343 (D) 20,555 434 (D) 14,220 (D) 2,440 46,639 Norway 20,706 2,180 1 (D) (D) (D) -5 (D) 8 (D) Spain 66,985 9,726 (D) (D) (D) (D) (D) (D) (D) 1,496 Sweden 43,416 38,303 3 (D) 7,367 3,316 (D) (D) (D) 5,385 Switzerland 249,225 110,526 (D) 30,964 1,453 3,570 416 (D) 186 (D) United Kingdom 512,139 214,693 6,567 92,730 14,007 3,331 4,747 -55 19,798 73,568 Other 43,678 21,032 3,164 6,616 4,969 12 65 94 1,064 5,049
Latin America and Other Western Hemisphere 117,301 36,079 14,853 (D) 2,470 (D) -338 -78 256 8,515 South and Central America 25,755 9,252 3,184 -221 2,026 (D) -105 (D) 40 4,655
Brazil 551 530 (D) -427 (D) -139 -6 (D) 743 (D) Mexico 15,209 3,911 (D) 102 888 -64 -77 -9 -696 (D) Panama 2,592 (D) 0 (D) (D) (D) (*) (*) 5 (D) Venezuela 4,187 (D) -9 (D) (D) 2 -1 (D) -3 (D) Other 3,216 797 (D) -27 (D) (D) -21 (D) -9 51
Other Western Hemisphere 91,546 26,828 11,669 (D) 444 (D) -233 (D) 216 3,860 Bahamas 805 (D) (D) 0 (D) 0 (*) 0 (D) (*) Bermuda -7,411 5,519 (D) (D) (D) (D) (D) 0 0 707 Curacao 1,630 170 -3 (D) 0 (D) 1 0 0 (D) United Kingdom Islands, Caribbean 94,773 20,990 (D) (D) (D) (D) (D) (D) (D) 2,957 Other 1,749 (D) -3 (D) (*) 0 (D) 0 0 (D)
Africa 4,330 (D) (D) (D) (D) -6 (D) (D) (D) -48 South Africa 2,942 (D) (D) (D) (D) (D) -2 (*) (D) (D) Other 1,388 29 (D) -32 (D) (D) (D) (D) (D) (D)
Middle East 18,169 (D) (D) 3,746 (D) 49 (D) (D) (D) -113 Israel 7,442 4,091 (D) 3,697 (D) (D) 198 (*) (D) -69 Kuwait 1,113 3 0 0 0 0 (D) (D) (D) (D) Lebanon -14 1 0 0 0 0 0 0 1 0 Saudi Arabia (D) -91 0 (D) (D) -3 -1 (D) 0 -5 United Arab Emirates 2,755 (D) 0 (D) (D) (D) 1 -9 -1 -32 Other (D) -67 0 (D) 0 (D) (D) 0 0 (D)
Asia and Pacific 564,974 169,058 4,368 31,724 11,185 (D) 19,803 (D) 46,814 36,838 Australia 47,270 15,281 1,102 (D) 1,613 -74 -22 -5 -16 (D) China 16,769 4,235 -21 182 (D) 19 439 58 641 (D) Hong Kong 10,991 1,892 (D) (D) -2 (D) 756 (D) (D) -48 India 9,629 801 (D) 244 7 -22 130 -2 4 (D) Japan 402,164 128,535 3,298 22,543 7,830 14,271 9,055 2,006 44,285 25,247 Korea, Republic of 40,585 6,128 (D) (D) 553 (D) 25 -4 1,316 1,324 Malaysia 1,278 298 (D) -3 (D) (D) (D) (*) (*) (D) New Zealand 439 -393 (D) 1 (D) (D) -1 (D) (D) 1 Singapore 21,654 8,753 (D) -22 14 -33 (D) (D) (D) 81 Taiwan 6,890 2,856 (*) (D) 1 (D) 104 (D) 18 (D) Other 7,306 672 (D) -39 (D) (D) (D) 21 231 74
Addenda: European Union (28) 1,981,879 914,607 40,735 409,933 42,648 61,072 36,958 (D) 79,045 (D) OPEC 15,461 2,788 (D) (*) (D) (D) (D) (D) (D) (D)
Continues on next page
36

2015
Bureau of Economic AnalysisTable 8.2. Foreign Direct Investment Position in the United States on a Historical-Cost Basis,
[Millions of dollars]Release Date: July 24, 2017
Wholesale trade
Retail trade
63,245 7,727
46,613 (D) (D) -1 (*)
4,122 (D) (D)
4,199 2,883 4,886
(*) (D) (D) (D)
3,719 (D) (D) (D) -1
124 21 (D) 42
910 0 7
(D) 889 (D) (D) (D)
0 (D) (D)
0 0 0
(*) 2
7,739 (D) (D) 10 0
7,101 1 0
(*) (D) (D) -4
36,373 (D)
Information Depository institutions
Finance (except depository institutions) and insurance
Real estate and rental and
leasing
Professional, scientific, and
technical services
Other industries
All countries Canada Europe /1/
Austria Belgium Denmark Finland France Germany Ireland Italy Luxembourg Netherlands Norway Spain Sweden Switzerland United Kingdom Other
Latin America and Other Western Hemisphere South and Central America
Brazil Mexico Panama Venezuela Other
Other Western Hemisphere Bahamas Bermuda Curacao United Kingdom Islands, Caribbean Other
Africa South Africa Other
Middle East Israel Kuwait Lebanon Saudi Arabia United Arab Emirates Other
Asia and Pacific Australia China Hong Kong India Japan Korea, Republic of Malaysia New Zealand Singapore Taiwan Other
Addenda: European Union (28) OPEC
362,747 20,259
179,099 (D)
18,219 6,041 2,458
16,648 25,538 -2,913 2,172
18,312 24,159 15,209
102 -4,352 21,244 34,677
(D) 1,748
-726 -2,104 1,214
(D) 23 (D)
2,474 (D) (D) (D)
9,492 551 (D) (D) (D) (D) 422
0 (*) (D) (D) -67
155,770 3,711 1,077 2,705
405 116,572 26,698
472 694
2,642 449 344
141,820 (D)
169,861 6,326
134,494 6
(D) 9
(D) 18,289
(D) (D) 138
21,112 8,841
(D) 135 (D)
15,791 30,499
432 1,412
-72 -39 (D)
2 4
(D) 1,484
(*) (D) (D)
1,193 (D) (D) (D) (D) (D) (D) (*)
0 2
(D) (D)
26,826 -1 46 (D) (D)
24,983 -10 (D)
1 -172 120
2
118,661 (D)
193,436 46,901
105,188 (D) (D)
0 (D)
20,336 19,604
7 (D)
0 (D) (D)
16,350 (D) (D) (D) 807
6,944 6,199 1,299 1,038
(D) (D) (D) 745 (D)
0 (D) (D)
8 (D)
0 (D) (D)
1,891 (D)
0 (D) (D) (D)
32,374 1,484 2,863
724 1,500
21,942 1,085
(D) 0
456 1,936
(D)
102,479 1,454
407,227 55,008
265,829 3
(D) 1
(*) 32,898 39,791 5,782
(D) 16,964 34,121
(D) (D) 122
55,990 56,028
(D) 9,055 1,104
724 270 110 (D) (D)
7,952 121
-14,811 17
22,580 45 10 (D) (D)
2,166 (D) (D)
2 0
(D) (D)
75,158 4,635
450 -23 (D)
61,429 550 (D)
2 (D) (D) (D)
209,759 2,048
74,759 10,378 36,364
(D) 119 37 2
1,017 9,722
(D) (D)
1,923 1,709 1,712 1,486
(D) (D)
8,672 4,702
10,147 1,284
(D) (D) 636 (D) (D)
8,863 (D)
1,360 558
6,257 (D) 518
2 516
1,707 580
1,140 (D) 30 (D) (D)
15,646 32
2,659 931 (*)
11,706 (D) (D) 73 (D) 19 63
32,789 1,131
154,272 7,844
121,578 (D) 307 34 (D)
9,806 (D)
35,919 (D)
6,322 31,182
265 499 (D)
1,327 10,793
93 4,563
12 -48 82 -2
-15 -6
4,551 (D)
3,490 (D) 534 (D) 110 (D) (D) -43 -19
0 (D) (D) -25 (D)
20,220 (D)
-230 225
3,460 9,367
66 2 5
(D) 8
17
119,988 -46
515,930 53,301
351,186 45
7,331 3,697
(D) 21,349 28,560 3,167 2,972
47,294 (D) (D) (D)
4,203 34,568
(D) (D) (D) (D) (D)
8,141 705 (D) (D)
37,741 403 (D) 462 (D) 63
(D) 437 (D)
2,021 -693 -50 (D) (D) 838
1,928 62,182
(D) (D) (D) (D)
20,529 (D) (D) 57
1,483 (D) (D)
305,404 (D)
Legend / Footnotes: 1. In 2015, the euro area included Austria, Belgium, Cyprus, Estonia, Finland, France, Germany, Greece, Ireland, Italy, Latvia, Lithuania, Luxembourg, Malta, the Netherlands, Portugal, Slovakia, Slovenia, and Spain. For 2015, the euro area direct investment position in the United States was $1,398,037 million.
37

2016
Bureau of Economic AnalysisTable 8.3. Foreign Direct Investment Position in the United States on a Historical-Cost Basis,
[Millions of dollars]Release Date: July 24, 2017
All industries
Manufacturing
Total Food Chemicals Primary and fabricated metals
Machinery
Computers and
electronic products
Electrical equipment,
appliances, and components
Transportation equipment
Other manufacturing
All countries 3,725,418 1,532,365 95,606 653,594 65,627 94,026 76,899 43,297 143,834 359,482 Canada 371,468 114,760 4,946 (D) 4,838 317 1,224 -128 8,831 (D) Europe /1/ 2,605,559 1,195,643 73,276 534,813 45,915 76,038 47,329 40,874 83,135 294,263
Austria 10,611 3,264 (D) (D) 542 713 (D) 1 26 1,813 Belgium 79,854 55,799 (D) 17,669 374 (D) -66 (D) 10 (D) Denmark 18,233 5,146 (D) 701 (D) 2,329 (D) 7 (D) 680 Finland 5,874 1,906 (D) (D) (D) 1,367 -2 (D) (D) 218 France 252,864 118,351 2,149 74,275 2,290 366 3,208 (D) 10,282 (D) Germany 291,697 104,161 349 21,007 7,476 14,029 808 954 43,498 16,041 Ireland 85,460 21,727 875 42,921 (D) (D) (D) (D) (*) -20,037 Italy 30,010 8,285 552 1,268 519 1,659 (D) 17 (D) 2,436 Luxembourg 417,386 251,828 16,241 158,613 4,673 (D) (D) (D) 632 44,560 Netherlands 355,242 160,767 (D) 29,259 495 (D) 19,194 (D) 2,299 51,715 Norway 25,548 1,432 1 (D) (D) (D) -5 (D) (D) (D) Spain 68,169 9,638 (D) (D) (D) 488 (D) (D) 707 1,558 Sweden 46,933 40,177 4 16,806 7,830 3,154 (D) (D) (D) 6,113 Switzerland 310,759 149,994 (D) 57,909 2,275 (D) 3,705 (D) (D) 50,794 United Kingdom 555,687 235,364 6,581 100,332 13,240 6,081 4,853 -248 18,968 85,556 Other 51,231 27,805 7,918 9,744 4,926 (D) 74 66 1,059 (D)
Latin America and Other Western Hemisphere 124,798 21,982 11,201 560 2,469 -197 -75 -26 197 7,854 South and Central America 25,805 9,984 2,945 319 (D) -309 -337 (D) 197 5,195
Brazil -1,831 -67 -212 -421 (D) -137 -19 -15 (D) -77 Mexico 16,757 4,713 3,157 457 954 -87 -315 5 -391 934 Panama 2,922 (D) 0 (D) (D) (D) (*) (*) 5 (D) Venezuela 4,457 (D) -9 (D) -5 (D) 0 0 (D) (D) Other 3,500 742 9 84 (D) -74 -3 (D) (D) -76
Other Western Hemisphere 98,993 11,997 8,256 242 (D) 112 262 (D) (*) 2,659 Bahamas 484 5 3 0 (D) 0 (D) 0 1 (D) Bermuda 9,361 -2,871 (D) -368 (D) 33 -2,047 0 0 (D) Curacao 1,660 (D) -2 (D) 0 (D) 1 0 0 (D) United Kingdom Islands, Caribbean 86,054 14,625 (D) 592 (D) 82 2,297 (D) -1 (D) Other 1,434 (D) -1 (D) 0 (D) (D) 0 0 (D)
Africa 4,394 2,320 (D) (D) (D) (D) (D) (D) (D) (D) South Africa 3,114 (D) -4 (D) 1 -26 (D) (*) -3 (D) Other 1,280 (D) (D) (D) (D) (D) 0 (D) (D) (D)
Middle East 19,826 3,731 (D) 2,952 (D) (D) (D) (D) (D) -134 Israel 8,136 3,900 (D) 2,894 (D) (D) 531 0 (D) -108 Kuwait 1,122 4 0 0 0 0 (D) (D) 3 0 Lebanon -13 2 0 0 0 0 0 0 1 (*) Saudi Arabia (D) -119 0 (D) (D) (*) (*) (D) 0 (D) United Arab Emirates 2,843 (D) 0 (D) (D) -5 (D) (D) -1 (D) Other (D) (D) 0 -1 0 (D) (D) 0 0 (D)
Asia and Pacific 599,373 193,928 6,045 33,321 12,508 17,588 27,904 2,606 51,621 42,336 Australia 46,926 16,010 1,151 (D) 2,392 -69 -8 -4 -6 (D) China 27,475 14,038 -39 197 (D) 29 7,926 118 2,106 (D) Hong Kong 11,649 1,680 (D) (D) -2 21 397 (D) (D) 23 India 9,852 978 (D) 420 9 (*) 6 3 -29 (D) Japan 421,103 139,638 3,351 23,696 8,234 (D) 9,895 2,046 47,494 (D) Korea, Republic of 40,937 7,194 (D) (D) 634 (D) 31 -3 1,553 1,314 Malaysia 1,136 91 34 -3 4 -11 40 (*) (*) 27 New Zealand 176 -475 (D) (D) (D) (*) (*) (D) (D) (D) Singapore 23,933 9,743 -38 92 20 -30 (D) 102 (D) 3 Taiwan 7,196 3,133 (*) (D) 3 17 82 (D) 20 (D) Other 8,991 1,898 (D) -25 (D) -21 (D) 96 200 69
Addenda: European Union (28) 2,241,063 1,032,496 47,768 466,812 40,581 72,591 43,632 (D) 82,912 (D) OPEC 18,311 3,129 -16 (D) -130 -30 -4 (D) 5 (D)
Continues on next page
38

2016
Bureau of Economic AnalysisTable 8.3. Foreign Direct Investment Position in the United States on a Historical-Cost Basis,
[Millions of dollars]Release Date: July 24, 2017
Wholesale trade
Retail trade
72,403 7,942
54,761 (D) (D) (D) (*)
4,650 (D) (D)
4,311 2,992 8,646
(*) (D) (D) (D)
4,789 (D)
1,218 205
-2 127 (D) (D) (D)
1,013 -1 7
(D) 1,014
(D) (D) (D)
0 (D) (D)
0 0 0
(D) (D)
8,431 (D) -16 (D) (D)
7,899 1 0
(*) (D) 61 -2
44,335 (D)
Information Depository institutions
Finance (except depository institutions) and insurance
Real estate and rental and
leasing
Professional, scientific, and
technical services
Other industries
All countries Canada Europe /1/
Austria Belgium Denmark Finland France Germany Ireland Italy Luxembourg Netherlands Norway Spain Sweden Switzerland United Kingdom Other
Latin America and Other Western Hemisphere South and Central America
Brazil Mexico Panama Venezuela Other
Other Western Hemisphere Bahamas Bermuda Curacao United Kingdom Islands, Caribbean Other
Africa South Africa Other
Middle East Israel Kuwait Lebanon Saudi Arabia United Arab Emirates Other
Asia and Pacific Australia China Hong Kong India Japan Korea, Republic of Malaysia New Zealand Singapore Taiwan Other
Addenda: European Union (28) OPEC
367,596 21,677
187,257 (D)
8,394 6,380 2,486
17,242 28,177 -2,119 2,193
25,659 27,972
(D) 215
-4,223 22,770 28,382
(D) 5,160 -1,056 -2,929 1,556
(*) 19
297 6,216
(D) -3,359
(D) 9,277
496 (D) 185 (D) (D) 472 (*) (*) (D) (D) (D)
146,923 3,509 1,142 2,772
345 107,167 27,180
480 (D)
2,812 413 (D)
141,596 (D)
185,806 7,667
148,651 6
(D) (D) (D)
17,788 (D) (D) 136
20,767 21,900
(D) 930 (D)
15,652 30,563
63 2,175
364 -33 357
1 4
35 1,812
(*) 492 (D)
1,186 (D) 9 7 2
851 (D) (*)
0 2
(D) (D)
26,452 -9
(D) (D) 241
24,565 -38
1 1
-169 125
7
132,947 -18
190,665 (D)
94,526 (D) (D)
0 0
8,944 22,996
(D) (D)
0 (D) (D)
14,979 (D) (D) (D) 878
6,665 6,067 1,389
798 (D) (D)
2,611 598
0 0
(D) (D)
8 (D)
0 (D) (D)
1,970 (D)
0 (D) (D) -34
36,312 1,579 3,076
790 1,467
25,464 1,177
(D) 0
490 1,860
(D)
92,690 1,518
504,780 62,441
333,427 4
(D) 2
(D) 48,099 41,643 5,410
(D) 11,544 40,142
(D) (D) 117
81,790 78,491
42 (D) (D) 710 212 106 (*) (D)
19,959 123 (D) 17
22,188 (D) 7
(D) (D) (D) (D) (D)
3 0
(D) (D)
87,047 3,921
425 -7
(D) 73,277
489 (D)
2 (D)
4 (D)
251,561 (D)
82,261 11,449 39,275
28 (D) 35 3
(D) 11,247
(D) 136
1,985 966 369
1,734 (D)
1,265 10,688 4,618
10,454 1,300
87 434 653 18
108 9,154
57 802 570
7,360 365 520
2 518
2,963 574 (D) (D) 30 (D) 15
17,601 -252
3,627 986 (*)
12,822 89 (D) 73 87 20 (D)
36,957 2,405
197,948 8,738
163,701 -14 315 42 (D)
13,624 (D) (D) (D) (D)
32,209 (D) 529 (D)
2,834 14,311
92 4,363
10 -43 77 -2
(D) (D)
4,353 (D)
3,269 (D) 592 (D) 112 -33 145 853 (D)
0 (D) -15 (D)
2 20,181
(D) -172 240
3,635 8,852
53 4
(D) (D)
9 34
160,608 -53
591,595 (D)
388,319 42
7,418 6,007
(D) (D)
29,907 20,315 4,165
(D) (D) 160 (D)
5,223 28,719
(D) (D) (D) (D)
-942 8,482
702 -21 (D)
43,890 375 (D) 444 (D) 47
1,137 (D) (D)
2,058 -740 (D) (D) 43
878 1,978
62,498 (D) (D)
3,473 2,357
21,418 4,791
114 59
1,791 1,572
(D)
347,874 4,426
Legend / Footnotes: 1. In 2016, the euro area included Austria, Belgium, Cyprus, Estonia, Finland, France, Germany, Greece, Ireland, Italy, Latvia, Lithuania, Luxembourg, Malta, the Netherlands, Portugal, Slovakia, Slovenia, and Spain. For 2016, the euro area direct investment position in the United States was $1,602,354 million.
39

Bureau of Economic AnalysisTable 9.1. Foreign Direct Investment in the United States: Financial Transactions WithoutCurrent-Cost Adjustment, 2014[Millions of dollars; inflows (+), outflows(-)]Release Date: July 24, 2017
All industries
Manufacturing
Total Food Chemicals Primary and fabricated metals
Machinery Computers
and electronic products
Electrical equipment,
appliances, and components
Transportation equipment
Other manufacturing
All countries 201,733 162,123 9,812 80,370 349 4,726 13,072 2,769 8,014 43,010 Canada 23,479 6,079 860 2,374 -912 414 -55 51 788 2,560 Europe 93,768 119,569 6,393 76,531 -2,678 2,843 8,587 3,220 4,264 20,409
Austria 983 705 8 -2 31 53 4 (D) (*) (D) Belgium 11,410 13,109 (D) 530 (D) 387 (D) (D) (D) (D) Denmark 3,282 1,696 (D) 46 (D) 246 33 (*) 1 (D) Finland -1,455 35 -1 (D) (D) -13 -4 (D) (D) (D) France 10,197 5,270 73 1,044 96 21 3,090 884 420 -358 Germany 37,121 13,747 19 11,273 -1,278 -676 -6 156 3,387 872 Ireland 7,114 3,008 -6 3,684 (D) (D) (D) (D) 0 (D) Italy 4,071 407 26 289 47 45 (D) (D) (D) 156 Luxembourg 27,943 36,220 897 31,099 -963 (D) (D) (*) (D) 108 Netherlands 29,685 19,020 (D) 13,936 (D) 234 2,137 160 129 3,003 Norway 3,549 123 (*) 13 (D) 2 (*) 5 (D) (D) Spain 4,671 1,060 16 (D) 22 -152 (D) 19 (D) 248 Sweden 4,134 2,158 1 273 1,055 -247 (D) (D) (D) 711 Switzerland 31,139 8,303 (D) 4,526 301 803 101 (D) 72 1,212 United Kingdom -94,851 11,003 1,008 8,840 -387 419 451 (D) 128 (D) Other 14,777 3,707 (D) 114 -613 14 (*) (D) 2 75
Latin America and Other Western Hemisphere 13,627 6,900 2,048 838 394 -66 885 -406 430 2,777 South and Central America 1,880 1,022 -3 278 356 83 (D) (D) 42 368
Brazil -407 245 -37 112 246 46 -85 -23 -14 1 Mexico 1,742 842 38 140 101 27 13 (*) 45 480 Panama 208 39 1 (D) (*) (D) (*) (*) (*) (D) Venezuela 246 250 (*) -1 -1 1 2 (D) (D) (D) Other 90 -355 -4 (D) 11 (D) (D) (D) (D) -368
Other Western Hemisphere 11,748 5,878 2,052 561 37 -149 (D) (D) 387 2,409 Bahamas 183 (D) 1 (D) (*) 0 (*) 0 (*) (*) Bermuda -1,962 726 (D) -247 0 (D) (D) 0 0 100 Curacao -84 (D) (*) (D) 0 (*) 0 0 0 (D) United Kingdom Islands, Caribbean 13,507 4,998 (D) 656 37 (D) 7 (D) 387 2,305 Other 104 126 (*) (D) 0 0 (D) 0 0 (D)
Africa 825 156 (D) (D) (D) (D) (D) (D) (D) -44 South Africa 421 199 -1 -1 1 (D) -2 0 (D) (D) Other 404 -43 (D) (D) (D) 5 (D) (D) 1 (D)
Middle East -1,548 -1,045 (D) (D) (D) (D) (D) (D) (D) 7 Israel -1,198 -1,070 (D) -1,035 (D) 4 -53 0 3 (D) Kuwait 61 (*) 0 0 0 (D) (D) 0 (D) (D) Lebanon 9 0 0 0 0 0 0 0 0 0 Saudi Arabia -1,189 11 (D) (D) (D) 1 (D) (D) 0 (D) United Arab Emirates 639 33 (D) (D) -3 (D) -2 (D) -1 (D) Other 129 -18 0 -1 0 (D) (D) 0 0 (D)
Asia and Pacific 71,582 30,463 498 1,621 3,551 1,322 3,708 -73 2,534 17,302 Australia 1,098 514 92 -163 6 35 -5 -5 -3 556 China 2,201 1,690 -1 390 (D) 233 -126 6 161 (D) Hong Kong 4,731 3,283 1 (D) -1 1 (D) -8 5 8 India 1,287 117 8 106 2 9 -30 -5 12 13 Japan 44,891 23,095 308 963 2,583 964 486 -1 2,145 15,647 Korea, Republic of 9,024 1,388 (D) 268 -28 (D) -6 -1 177 (D) Malaysia 235 158 1 4 (D) 10 (D) 4 -5 5 New Zealand 66 -4 -5 2 (D) -2 2 5 (D) -2 Singapore 3,911 -55 (D) -144 3 -153 (D) (D) 9 184 Taiwan 1,387 323 -3 (D) 4 -4 25 (D) 2 (D) Other 2,750 -45 (D) (D) 1 (D) (D) (D) (D) 13
Addenda: European Union (28) 49,204 111,760 3,844 72,086 -2,202 2,037 8,489 (D) 4,183 (D) OPEC -188 246 4 46 -7 2 1 -26 (D) (D)
Continues on next page
40

Bureau of Economic AnalysisTable 9.1. Foreign Direct Investment in the United States: Financial Transactions WithoutCurrent-Cost Adjustment, 2014[Millions of dollars; inflows (+), outflows(-)]Release Date: July 24, 2017
Wholesale trade
Retail trade
15,061
Information Depository institutions
Finance (except depository institutions) and insurance
Real estate and rental and
leasing
Professional, scientific, and
technical services
Other industries
All countries 30,533 11,178 3,706 20,990 11,741 18,214 -71,814 Canada 1,353 600 3,518 1,665 2,944 -574 1,181 6,714 Europe 16,185 12,980 4,425 888 12,574 5,953 15,071 -93,877
Austria 31 (D) (D) (D) (*) (D) (D) -1 Belgium -688 (D) (D) (D) (D) 13 (D) 559 Denmark 1,202 (*) (*) 0 (*) 4 (D) (D) Finland -156 0 (D) (D) (*) (*) (D) (D) France 710 416 -49 1,410 -390 10 900 1,919 Germany 2,350 650 1,525 2,743 6,383 46 (D) (D) Ireland -3,585 (D) (D) -17 -239 (D) -2 778 Italy -24 292 8 (D) 59 8 63 (D) Luxembourg 1,627 (D) 2,005 0 -5,318 -94 5,466 (D) Netherlands 649 582 1,683 (D) 1,819 (D) 2,258 (D) Norway 1,858 (*) (D) (D) (D) 1,533 (D) (D) Spain 20 (D) 11 681 1,597 (D) (D) 820 Sweden 1,120 (D) -63 35 5 (D) (D) (D) Switzerland 9,473 (D) -194 (D) 5,033 (D) 152 6,713 United Kingdom 1,544 (D) -897 -4,871 3,949 -165 -2,889 (D) Other 54 (D) 29 54 (D) -341 (D) (D)
Latin America and Other Western Hemisphere -150 820 695 359 1,503 1,975 -100 1,625 South and Central America -730 27 -333 294 14 154 -61 1,494
Brazil -951 1 -2 139 15 (D) -25 (D) Mexico -121 20 (D) (D) 2 7 -16 1,191 Panama 37 (D) 1 (D) -3 125 -2 -4 Venezuela (D) 0 1 -20 -3 1 -9 (D) Other (D) (D) (D) 51 3 (D) -9 127
Other Western Hemisphere 581 793 1,028 65 1,489 1,821 -38 131 Bahamas (D) 0 0 (D) 6 5 (*) 152 Bermuda (D) (*) (D) 0 380 -5 -6 (D) Curacao (D) (D) 1 -3 (D) 59 (D) -33 United Kingdom Islands, Caribbean 831 679 1,043 (D) 1,199 1,762 -28 (D) Other (D) (D) (D) (*) (D) (*) (D) 23
Africa 257 (D) (D) (D) -3 5 (D) 268 South Africa 132 (D) 4 0 (D) (*) (D) (D) Other 126 0 (D) (D) (D) 5 19 (D)
Middle East -1,066 (D) (D) (D) -83 -17 (D) 539 Israel 84 (D) (D) -28 (D) (D) -3 -36 Kuwait 0 0 (*) (D) (D) 21 0 (D) Lebanon (*) 0 0 0 (*) 18 (D) (D) Saudi Arabia (D) 0 (*) (D) 0 -1 -1 (D) United Arab Emirates (D) 0 (*) (D) (D) (D) 2 499 Other (D) (D) (D) 10 -1 (D) (*) (D)
Asia and Pacific 13,955 656 2,399 799 4,054 4,398 1,939 12,918 Australia 408 -3 20 -1,122 899 (D) 92 (D) China -139 1 13 -328 (D) (D) -45 236 Hong Kong 436 3 56 71 6 -15 7 885 India (D) 0 -13 58 (D) (*) 674 318 Japan 9,189 (D) 2,152 1,865 2,492 2,853 1,163 (D) Korea, Republic of 3,536 (*) -8 69 35 -2 12 3,994 Malaysia 12 0 2 (D) -2 5 33 (D) New Zealand 62 (*) (D) 0 -2 (*) 4 (D) Singapore 807 5 163 58 379 (D) -8 (D) Taiwan -116 (D) 9 (D) 7 1 -3 (D) Other (D) (*) (D) (D) (D) 2 11 (D)
Addenda: European Union (28) 4,787 1,053 4,621 (D) 7,540 4,516 14,924 (D) OPEC (D) (*) (D) -43 85 22 -1 582
Legend / Footnotes: Note. Inflows increase the foreign direct investment position in the United States, while outflows decrease it.
41

Bureau of Economic AnalysisTable 9.2. Foreign Direct Investment in the United States: Financial Transactions WithoutCurrent-Cost Adjustment, 2015[Millions of dollars; inflows (+), outflows(-)]Release Date: July 24, 2017
All industries
Manufacturing
Total Food Chemicals Primary and fabricated metals
Machinery Computers
and electronic products
Electrical equipment,
appliances, and components
Transportation equipment
Other manufacturing
All countries 465,765 326,847 10,521 168,098 4,690 10,329 4,294 1,476 22,140 105,299 Canada 59,555 34,688 730 31,730 941 423 347 16 989 -487 Europe 345,958 275,323 10,054 127,648 3,127 11,296 2,083 1,575 20,420 99,119
Austria 127 -83 5 (D) -13 -65 (D) (D) -5 -31 Belgium -7,780 -2,494 (D) -2,906 -17 -710 -72 (D) (D) 1,665 Denmark 936 913 (D) -10 (D) 700 14 (*) (*) 175 Finland 254 -53 (D) (D) (D) -131 8 (*) (D) 17 France 32,951 19,251 250 14,392 297 -755 2,527 770 1,149 621 Germany 26,774 19,948 15 1,008 5 (D) -18 55 14,412 (D) Ireland 6,493 2,831 (D) 18 (D) (D) 1 (D) 0 (D) Italy 6,931 1,566 46 57 99 777 53 (D) (D) 278 Luxembourg 182,561 186,120 (D) 97,611 -344 (D) (D) (*) 62 (D) Netherlands 32,326 8,373 (D) -5,461 3 (D) 1,065 (D) -521 3,264 Norway 8,175 839 (*) 3 (D) -1 (*) (D) (D) (D) Spain 4,592 2,505 215 (D) 13 78 (D) (D) (D) 387 Sweden 3,532 1,981 1 -714 -143 322 (D) (D) 1,921 824 Switzerland 7,153 475 (D) 2,783 1 117 51 (D) (D) -2,325 United Kingdom 39,323 37,925 -531 19,737 3,119 81 313 -343 3,556 11,994 Other 1,610 -4,774 -436 (D) -395 -20 -3 (D) -57 81
Latin America and Other Western Hemisphere 10,744 2,859 -302 775 93 -1,571 1,176 -177 -317 3,184 South and Central America 832 928 506 (D) (D) (D) 69 (D) -192 531
Brazil -645 384 (D) -52 (D) -24 85 13 28 (D) Mexico 1,059 -125 215 -78 32 55 14 1 -378 15 Panama 243 (D) 0 (D) -1 1 (*) (*) 1 (D) Venezuela 224 353 (D) -12 1 (D) (D) (D) (D) (D) Other -49 (D) -5 (D) (D) -3 (D) (D) (D) 7
Other Western Hemisphere 9,912 1,932 -809 (D) (D) (D) 1,107 (D) -125 2,653 Bahamas -117 -5 (D) (D) (*) 0 (*) 0 (D) (*) Bermuda -783 -465 (D) 945 0 (D) (D) 0 0 94 Curacao 143 (D) 1 (D) 0 (*) 0 0 0 (D) United Kingdom Islands, Caribbean 10,544 2,510 (D) (D) (D) 8 (D) (D) (D) 2,561 Other 125 (D) -1 (D) (*) 0 4 0 0 (D)
Africa 1,872 1,680 -6 (D) (D) (D) (D) (D) 8 18 South Africa 1,899 (D) (*) (D) (D) (D) (*) 1 8 (D) Other -26 (D) -6 (D) 0 3 (D) (D) (*) (D)
Middle East 2,157 1,631 1 (D) (D) (D) (D) (D) 5 -31 Israel 1,653 1,636 1 1,673 (D) 3 26 1 3 (D) Kuwait 41 -1 0 0 0 0 (D) 0 (*) (D) Lebanon 5 1 0 0 0 0 0 0 1 0 Saudi Arabia 478 -20 (*) 9 (D) -3 (D) (D) 0 (D) United Arab Emirates 132 32 0 -27 (D) (D) (D) (D) (*) (D) Other -152 -18 0 (D) 0 (D) (D) 0 0 (D)
Asia and Pacific 45,480 10,665 44 4,734 511 244 546 55 1,036 3,496 Australia -1,327 1,584 628 334 431 -21 2 -1 -46 258 China 5,917 719 1 29 130 -424 324 25 -16 650 Hong Kong 670 -562 (D) 87 1 -1 -631 (D) 2 18 India 287 -272 6 -346 (*) -27 85 (D) 4 (D) Japan 34,379 8,972 65 4,422 101 473 384 112 1,033 2,383 Korea, Republic of 1,384 519 (D) 38 59 (D) 5 -6 95 138 Malaysia 118 97 (D) -1 (D) -30 (D) -1 4 3 New Zealand -318 -295 -4 (D) (D) (*) 1 3 (D) 3 Singapore 2,724 -886 (D) 94 -5 128 -56 -5 12 (D) Taiwan 761 412 1 92 (D) 7 -2 57 6 (D) Other 884 377 13 (D) -11 (D) (D) (D) (D) (D)
Addenda: European Union (28) 323,685 274,742 10,279 125,339 2,969 11,180 2,041 1,460 20,473 101,000 OPEC 900 396 -5 -28 18 16 -27 (D) (D) 373
Continues on next page
42

Bureau of Economic AnalysisTable 9.2. Foreign Direct Investment in the United States: Financial Transactions WithoutCurrent-Cost Adjustment, 2015[Millions of dollars; inflows (+), outflows(-)]Release Date: July 24, 2017
Wholesale trade
Retail trade
4,481
Information Depository institutions
Finance (except
depository institutions)
and insurance
Real estate and
rental and
leasing
Professional, scientific,
and technical services
Other industries
All countries 22,468 11,619 2,009 35,972 8,478 21,797 32,093 Canada 1,750 118 1,832 4,298 6,183 3,264 2,752 4,671 Europe 15,098 4,056 9,012 -4,309 9,379 1,788 17,542 18,069
Austria (D) (D) 2 (D) (*) 1 1 -1 Belgium -4,942 (D) (D) (D) 29 (D) -17 136 Denmark 126 (*) 1 0 (*) -1 21 -124 Finland 289 0 (D) (D) (*) (*) (D) (D) France 164 137 2,103 1,345 3,747 (D) 3,647 (D) Germany 345 694 1,105 1,267 -163 1,612 -618 2,585 Ireland 552 (*) 131 46 373 (D) (D) 216 Italy 56 -27 -1 (D) -147 -10 (D) (D) Luxembourg 1,639 (D) -320 0 -7,629 -45 (D) 1,509 Netherlands 4,316 990 2,511 (D) 2,075 -864 3,190 (D) Norway (D) (*) 2 (D) (D) 14 (D) (D) Spain (D) (D) 53 714 476 159 66 588 Sweden -95 (D) 21 64 4 (D) (D) 1,360 Switzerland (D) (D) (D) (D) 6,191 39 (D) -3,903 United Kingdom 3,863 1,588 367 -8,406 4,375 2,461 678 -3,529 Other (D) (D) -105 45 (D) -243 90 (D)
Latin America and Other Western Hemisphere -1,825 (D) 370 88 1,977 558 208 (D)
South and Central America -1,719 (D) 339 98 8 142 44 (D) Brazil -1,132 -2 13 90 -6 9 30 -31 Mexico -221 1 (D) 40 18 (D) 7 914 Panama -22 -3 1 (D) -4 32 -1 (D) Venezuela (D) 0 (*) (D) (*) (D) -2 (D) Other (D) (D) (D) (D) (*) (D) 11 (D)
Other Western Hemisphere -107 -672 31 -10 1,969 416 164 6,188 Bahamas -3 0 0 (D) 3 (D) 4 93 Bermuda -1,481 (*) -3 0 1,088 31 180 -133 Curacao (D) (D) 1 (D) (*) 24 (D) -14 United Kingdom Islands, Caribbean 1,185 -643 (D) (D) 839 370 -11 6,217 Other (D) (D) (D) (*) 38 (D) (D) 25
Africa (D) 0 4 (D) 1 -9 39 (D) South Africa (D) 0 4 0 1 (*) 19 (D) Other (D) 0 (*) (D) (*) -9 19 (D)
Middle East (D) (D) -241 (D) 29 64 35 83 Israel 2 9 (D) 55 (D) 1 51 -68 Kuwait 0 0 (*) (D) -1 63 0 (D) Lebanon (*) 0 0 0 3 1 1 -1 Saudi Arabia (D) 0 (*) (D) 0 (*) -4 (D) United Arab Emirates (D) 0 (*) (D) 22 -1 -13 54 Other (D) (D) (D) 1 (D) (*) -1 87
Asia and Pacific 7,069 953 643 1,854 18,403 2,813 1,222 1,857 Australia -157 1 5 -596 -538 -680 26 -973 China 1,191 (D) 9 329 (D) (D) -123 1,530 Hong Kong 457 (D) 1 69 -37 142 97 (D) India -64 0 (D) 99 (D) (*) 227 169 Japan 3,143 680 422 1,669 18,059 1,441 195 -201 Korea, Republic of 572 (*) -39 67 28 (D) -2 (D) Malaysia 53 0 -1 (D) (*) -1 -22 (D) New Zealand -26 (*) -1 0 (*) 1 1 3 Singapore 1,832 (D) -10 (D) (D) (D) 822 -62 Taiwan -25 -1 23 134 6 1 -1 212 Other 94 -2 (D) 30 (*) 2 2 (D)
Addenda: European Union (28) 6,405 4,397 5,832 (D) 3,182 1,721 17,567 (D) OPEC 499 (*) (D) -106 21 63 -12 (D)
Legend / Footnotes: Note. Inflows increase the foreign direct investment position in the United States, while outflows decrease it.
43

Bureau of Economic AnalysisTable 9.3. Foreign Direct Investment in the United States: Financial Transactions WithoutCurrent-Cost Adjustment, 2016[Millions of dollars; inflows (+), outflows(-)]Release Date: July 24, 2017
All industries
Manufacturing
Total Food Chemicals Primary and fabricated metals
Machinery Computers
and electronic products
Electrical equipment,
appliances, and components
Transportation equipment
Other manufacturing
All countries 457,125 203,775 5,278 112,691 541 2,496 12,157 4,640 11,091 54,881 Canada 51,922 1,470 432 -136 -757 -198 272 -39 668 1,228 Europe 334,362 176,506 1,925 112,522 39 1,679 3,346 4,252 5,945 46,796
Austria 3,531 120 4 -7 -11 178 -1 (*) 4 -47 Belgium 5,147 2,870 (D) 1,443 (D) (D) -1 (D) (D) 2,343 Denmark 3,922 494 (D) (D) (D) 176 (D) 3 (D) 169 Finland 98 -139 (D) (D) (D) -68 -6 (*) (D) 1 France 24,295 14,370 162 13,170 -233 28 -983 136 516 1,573 Germany 14,051 10,567 16 4,004 -351 -403 (D) -52 3,622 (D) Ireland 40,346 42,532 (D) 41,541 (D) (D) 1 (D) (*) 701 Italy 741 1,035 80 276 69 36 -52 (D) (D) 269 Luxembourg 61,429 12,827 (D) 1,722 112 56 (D) (*) (D) 8,168 Netherlands 51,092 23,224 563 8,996 61 (D) -1,232 4,259 -227 (D) Norway -289 43 (*) 7 (D) -1 (*) 3 (D) (D) Spain 2,905 704 154 227 (D) -96 -14 2 (D) 62 Sweden 3,371 2,488 1 447 434 353 (D) (D) (D) 717 Switzerland 71,689 33,084 (D) 27,478 7 (D) (D) 108 (D) 1,020 United Kingdom 49,068 30,307 10 10,279 -808 2,673 96 -60 1,076 17,041 Other 2,968 1,979 -112 2,886 -40 (D) 9 -28 -5 (D)
Latin America and Other Western Hemisphere 21,190 3,466 1,633 -347 15 -144 294 51 24 1,941 South and Central America 703 676 -240 (D) (D) (D) -235 46 23 622
Brazil -2,382 -597 (D) 6 -55 1 -13 (D) (D) -32 Mexico 2,036 673 150 355 66 -22 -241 14 172 180 Panama 300 251 0 (D) -1 -6 (*) (*) (*) (D) Venezuela 481 (D) 0 (D) (D) (D) 1 (D) (D) (D) Other 268 (D) (D) 110 (D) (D) 18 (D) (D) -128
Other Western Hemisphere 20,487 2,789 1,873 (D) (D) (D) 529 5 (*) 1,319 Bahamas -214 (D) (D) 0 (*) 0 (D) 0 (D) (D) Bermuda 20,741 1,165 (D) (D) 0 (D) (D) 0 0 351 Curacao 18 (D) 1 -2 0 (D) 0 0 0 (D) United Kingdom Islands, Caribbean -20 1,699 (D) (D) (D) (D) (D) 5 (D) 952 Other -38 -87 1 (D) (*) (D) 4 0 0 (D)
Africa 100 -36 -3 132 (D) (D) (D) (D) (D) (D) South Africa 212 (D) (D) (D) 1 (D) -3 (*) (D) -51 Other -112 (D) (D) (D) (D) -11 (D) (D) -1 (D)
Middle East 545 -1,137 (D) -1,032 (D) (D) (D) (D) (D) -21 Israel 112 -705 (D) (D) (D) (D) (D) (*) (D) (D) Kuwait 15 (D) 0 0 0 0 (D) 0 (D) 1 Lebanon 1 (*) 0 0 0 0 0 0 0 (*) Saudi Arabia 744 -29 0 (D) -9 3 (*) (*) 0 (D) United Arab Emirates -387 -400 (D) (D) -6 (D) (D) (D) (*) (D) Other 59 (D) 0 (D) 0 (*) (D) 0 0 (D)
Asia and Pacific 49,007 23,507 (D) 1,552 1,258 1,198 8,023 371 4,454 (D) Australia -1,705 631 (D) -148 694 1 14 (*) 10 (D) China 10,337 9,626 -19 (D) 41 9 (D) 49 1,588 (D) Hong Kong 1,865 -211 (D) 88 (*) (D) -357 (D) (D) 70 India 529 107 (*) 176 1 22 -81 5 -33 17 Japan 33,914 10,195 52 1,123 421 616 793 131 2,839 4,218 Korea, Republic of 173 950 (D) 105 80 (D) 6 1 125 12 Malaysia -155 -207 (D) (*) (D) -2 (D) (*) (*) (D) New Zealand -274 (D) 2 (D) (D) (D) (*) 3 (D) (D) Singapore 2,297 988 (D) 116 7 3 (D) (D) 2 -78 Taiwan 299 277 (*) 71 2 (*) -23 8 3 216 Other 1,726 (D) (D) 14 11 (D) (D) (D) -30 -5
Addenda: European Union (28) 259,978 140,934 1,096 81,673 -24 2,262 (D) 4,141 5,944 (D) OPEC 996 -29 (D) 33 -15 -16 2 (D) -4 (D)
Continues on next page
44

Bureau of Economic AnalysisTable 9.3. Foreign Direct Investment in the United States: Financial Transactions WithoutCurrent-Cost Adjustment, 2016[Millions of dollars; inflows (+), outflows(-)]Release Date: July 24, 2017
Wholesale trade
Retail trade
9,582
Information Depository institutions
Finance (except
depository institutions)
and insurance
Real estate and
rental and
leasing
Professional, scientific,
and technical services
Other industries
All countries 8,490 17,393 6,043 72,623 7,099 42,827 89,293 Canada 1,454 814 1,543 2,710 6,943 955 675 35,359 Europe -805 7,630 15,026 806 45,387 3,428 39,964 46,421
Austria (D) (D) (*) (D) 1 (D) (D) -3 Belgium 1,206 (D) -1 (D) -3 (D) 10 663 Denmark 339 (D) (D) 0 (*) -2 8 2,310 Finland 29 0 (D) (D) (D) (*) 3 (D) France 556 367 -161 695 1,945 (D) 3,839 (D) Germany -3,927 718 473 808 2,919 1,504 -754 1,743 Ireland 793 -1 (D) -23 -380 (D) (D) (D) Italy 35 114 -3 (D) 44 (D) 31 (D) Luxembourg 1,929 109 -138 0 -2,602 64 (D) (D) Netherlands 980 1,430 13,045 (D) -2,382 -479 1,027 (D) Norway -426 (*) (D) (D) (*) 17 (D) 29 Spain 114 (D) (D) 597 117 (D) 30 289 Sweden 142 (D) -24 10 -5 (D) -138 (D) Switzerland 3,055 (D) -102 (D) 29,061 (D) 285 6,804 United Kingdom -5,742 1,069 -377 -889 16,626 2,077 3,378 2,617 Other (D) (D) 3 10 (D) -77 -1 (D)
Latin America and Other Western Hemisphere 1,931 181 427 165 6,606 1,055 1,030 6,329
South and Central America -360 (D) 436 208 -65 17 2 (D) Brazil -825 (*) 6 89 -14 (D) (D) (D) Mexico 345 3 (D) -16 (D) (D) -6 717 Panama 5 (D) -1 (D) -4 19 (*) -3 Venezuela -4 0 (*) -15 (D) (D) (D) (D) Other 119 (D) (D) (D) (D) (D) (D) 36
Other Western Hemisphere 2,292 (D) -8 -44 6,670 1,038 1,027 (D) Bahamas (D) -1 0 (D) 2 (D) 4 -29 Bermuda 2,549 (*) 3 0 5,740 12 (D) (D) Curacao (D) (D) (*) (D) (*) 12 (D) -27 United Kingdom Islands, Caribbean -172 203 -7 (D) (D) 1,000 (D) -3,651 Other -55 (D) -4 (*) (D) (D) (D) -16
Africa -4 0 (D) (D) -3 1 (D) (D) South Africa 48 0 (D) 0 -2 (*) (D) 65 Other -51 0 (D) (D) -1 1 (D) (D)
Middle East 772 (D) (D) (D) -119 -13 (D) 52 Israel 50 6 (D) 81 (D) -6 (D) -31 Kuwait (*) 0 (*) (D) (*) (D) 0 (D) Lebanon (*) 0 0 0 (*) (D) 1 (D) Saudi Arabia (D) 0 (*) (D) 0 (*) -9 (D) United Arab Emirates (D) (D) -2 (D) (D) (D) 3 39 Other (D) (D) 37 7 -1 (D) -1 50
Asia and Pacific 5,141 (D) 403 2,236 13,810 1,673 258 (D) Australia -203 (*) -8 81 -563 (D) -6 (D) China 67 (D) 45 251 -34 738 60 (D) Hong Kong 67 (D) 12 85 17 55 15 (D) India 33 (D) (D) -58 (D) (*) 174 (D) Japan 4,457 (D) 365 1,826 13,662 1,062 -105 (D) Korea, Republic of 475 (*) -27 87 -61 (D) (D) -1,246 Malaysia 7 0 (D) 4 1 3 3 (D) New Zealand -281 (*) (*) 0 (*) (*) (D) 2 Singapore 189 44 4 (D) (D) (D) 31 325 Taiwan -35 (D) 6 -83 (D) (*) 1 (D) Other 366 3 (D) (D) -1 (D) 17 99
Addenda: European Union (28) -3,451 7,441 15,120 (D) 16,331 3,325 39,682 (D) OPEC 759 (D) (D) 36 18 -6 1 195
Legend / Footnotes: Note. Inflows increase the foreign direct investment position in the United States, while outflows decrease it.
45

Bureau of Economic AnalysisTable 10.1. Foreign Direct Investment in the United States: Equity Other Than Reinvestmentof Earnings, 2014[Millions of dollars; inflows (+), outflows(-)]Release Date: July 24, 2017
All industries
Manufacturing
Total Food Chemicals Primary and fabricated metals
Machinery Computers
and electronic products
Electrical equipment,
appliances, and components
Transportation equipment
Other manufacturing
All countries 51,570 90,412 3,607 36,116 2,451 1,004 8,277 134 512 38,311 Canada 9,842 1,094 (D) -109 (D) (D) 0 0 -52 206 Europe 1,016 63,670 (D) 34,719 542 512 4,200 (D) 115 (D)
Austria (D) (D) (*) 0 0 0 0 0 0 (D) Belgium (D) (D) 0 (D) 0 0 0 0 0 (D) Denmark (D) 0 0 0 0 0 0 0 0 0 Finland (D) (D) 0 0 0 (D) 0 0 0 0 France 3,429 2,985 (D) (D) (D) (D) (D) (D) (D) 34 Germany 25,003 10,532 (*) (D) 15 (D) (*) 1 148 (D) Ireland 10,664 (D) 0 (D) 0 0 0 0 0 6 Italy 392 (D) (*) (D) 0 -3 1 0 0 (D) Luxembourg 31,667 (D) (D) (D) 0 22 (D) 0 (D) (D) Netherlands 4,101 1,051 35 (D) 0 27 1,767 305 0 (D) Norway (D) 0 0 0 0 0 0 0 0 0 Spain 4,014 (D) (D) 0 (D) 0 0 0 0 (D) Sweden 603 875 0 13 (D) (*) 0 -1 0 (D) Switzerland 2,614 (D) (D) (D) 3 -1 (D) 0 0 (D) United Kingdom -108,252 8,145 (D) (D) (D) 0 (D) (D) 42 (D) Other (D) (D) 0 0 (D) 0 0 0 0 0
Latin America and Other Western Hemisphere 8,666 4,523 (D) (D) 0 (D) (D) (D) (D) (D) South and Central America 542 (D) 0 0 0 0 0 0 0 (D)
Brazil (D) 0 0 0 0 0 0 0 0 0 Mexico 485 (D) 0 0 0 0 0 0 0 (D) Panama 0 0 0 0 0 0 0 0 0 0 Venezuela (D) 0 0 0 0 0 0 0 0 0 Other 67 1 0 0 0 0 0 0 0 1
Other Western Hemisphere 8,125 (D) (D) (D) 0 (D) (D) (D) (D) 2,188 Bahamas (D) 0 0 0 0 0 0 0 0 0 Bermuda -1,955 (D) 0 0 0 (D) (D) 0 0 0 Curacao (D) 0 0 0 0 0 0 0 0 0 United Kingdom Islands, Caribbean 9,968 3,395 (D) (D) 0 0 0 (D) (D) 2,188 Other 0 0 0 0 0 0 0 0 0 0
Africa 512 0 0 0 0 0 0 0 0 0 South Africa (D) 0 0 0 0 0 0 0 0 0 Other (D) 0 0 0 0 0 0 0 0 0
Middle East 233 0 0 0 0 0 0 0 0 0 Israel -46 0 0 0 0 0 0 0 0 0 Kuwait (*) 0 0 0 0 0 0 0 0 0 Lebanon (D) 0 0 0 0 0 0 0 0 0 Saudi Arabia 11 0 0 0 0 0 0 0 0 0 United Arab Emirates (D) 0 0 0 0 0 0 0 0 0 Other (D) 0 0 0 0 0 0 0 0 0
Asia and Pacific 31,302 21,125 (D) (D) (D) (D) (D) (D) (D) (D) Australia -2,001 (D) 0 (D) 0 0 0 0 0 (D) China 655 822 0 (D) (D) 0 0 0 (D) 0 Hong Kong (D) (D) 0 0 0 0 (D) 0 0 0 India -55 0 0 0 0 0 0 0 0 0 Japan 25,417 15,993 (D) 279 (D) (D) 24 (D) 215 (D) Korea, Republic of 3,484 (D) 0 (D) (D) 0 0 0 (D) (D) Malaysia 0 0 0 0 0 0 0 0 0 0 New Zealand (D) 0 0 0 0 0 0 0 0 0 Singapore 249 (D) 0 0 0 0 (D) 0 0 0 Taiwan (D) 0 0 0 0 0 0 0 0 0 Other 0 0 0 0 0 0 0 0 0 0
Addenda: European Union (28) -14,299 62,984 (D) (D) (D) 513 (D) (D) 115 (D) OPEC 159 0 0 0 0 0 0 0 0 0
Continues on next page
46

Bureau of Economic AnalysisTable 10.1. Foreign Direct Investment in the United States: Equity Other Than Reinvestmentof Earnings, 2014[Millions of dollars; inflows (+), outflows(-)]Release Date: July 24, 2017
Wholesale trade
Retail trade
12,808
Information Depository institutions
Finance (except depository institutions) and insurance
Real estate and rental and
leasing
Professional, scientific, and
technical services
Other industries
All countries 19,856 11,417 -2,512 -581 8,759 15,014 -103,602 Canada 1,844 -61 2,541 468 1,404 -915 (D) (D) Europe 14,887 (D) 5,712 -847 -5,292 5,405 12,637 (D)
Austria 0 0 0 0 0 0 0 0 Belgium 14 0 0 0 (D) 0 0 (D) Denmark (D) 0 0 0 0 0 0 (D) Finland 0 0 (D) 0 0 0 0 (D) France (D) 15 (D) 62 (D) 0 (D) (D) Germany (D) 18 (D) (D) 1,775 -285 (D) (D) Ireland 0 0 (D) 0 81 (D) 0 (D) Italy 0 (D) 0 -1 (D) 0 0 (D) Luxembourg (D) 0 (D) 0 -6,324 0 (D) (D) Netherlands (D) 0 (D) 0 (D) (D) (D) 967 Norway (D) 0 0 0 0 (D) (*) 0 Spain 0 0 0 54 (D) (D) (D) 491 Sweden (D) 0 (D) (D) 0 (D) (D) 0 Switzerland (D) (D) 0 (D) 296 0 0 (D) United Kingdom 2,518 (D) (D) (D) 2,082 (D) (D) (D) Other 1 (D) (D) (D) 0 (D) 0 580
Latin America and Other Western Hemisphere 171 (D) (D) (D) (D) 1,635 (D) 12 South and Central America (D) 0 (D) (D) 0 (D) 0 142
Brazil (D) 0 (D) 0 0 0 0 0 Mexico -1 0 0 (D) 0 (D) 0 (D) Panama 0 0 0 0 0 0 0 0 Venezuela 0 0 0 (D) 0 0 0 0 Other 0 0 0 (D) 0 0 0 (D)
Other Western Hemisphere (D) (D) 1,100 (D) (D) (D) (D) -130 Bahamas 0 0 0 0 0 0 0 (D) Bermuda 0 0 0 0 (D) (D) 3 -3,147 Curacao (D) 0 0 0 0 (D) 0 (D) United Kingdom Islands, Caribbean (D) (D) 1,100 (D) 714 1,656 (D) 2,949 Other 0 0 0 0 0 0 0 0
Africa (D) 0 0 0 0 0 (D) (D) South Africa (D) 0 0 0 0 0 (D) 0 Other 0 0 0 0 0 0 0 (D)
Middle East (D) 0 (D) (D) (D) -30 0 (D) Israel (D) 0 (D) (D) (D) (D) 0 0 Kuwait 0 0 0 0 0 (*) 0 0 Lebanon 0 0 0 0 0 (D) 0 0 Saudi Arabia 11 0 0 0 0 0 0 0 United Arab Emirates 0 0 0 (D) 0 0 0 (D) Other 0 0 (D) 0 0 0 0 0
Asia and Pacific 2,839 (D) 1,673 -2,191 2,323 2,663 (D) 1,292 Australia 1 0 0 (D) (D) (D) (D) (D) China 0 0 (D) (D) (D) (D) 2 1 Hong Kong 6 0 (D) 3 0 (D) 0 (D) India 0 0 0 (D) 0 0 (D) (D) Japan 2,604 (D) 1,447 106 (D) 2,249 (D) 330 Korea, Republic of 213 0 0 5 (D) 0 4 (D) Malaysia 0 0 0 0 0 0 0 0 New Zealand (D) 0 0 0 0 0 0 0 Singapore 0 0 (D) 0 8 0 0 (D) Taiwan (D) 0 0 (D) 3 0 0 0 Other 0 0 0 0 0 0 0 0
Addenda: European Union (28) 12,607 (D) 5,712 (D) -5,588 (D) 12,637 -108,219 OPEC 11 0 (D) -121 0 (*) 0 (D)
Legend / Footnotes: Note. Inflows increase the foreign direct investment position in the United States, while outflows decrease it.
47
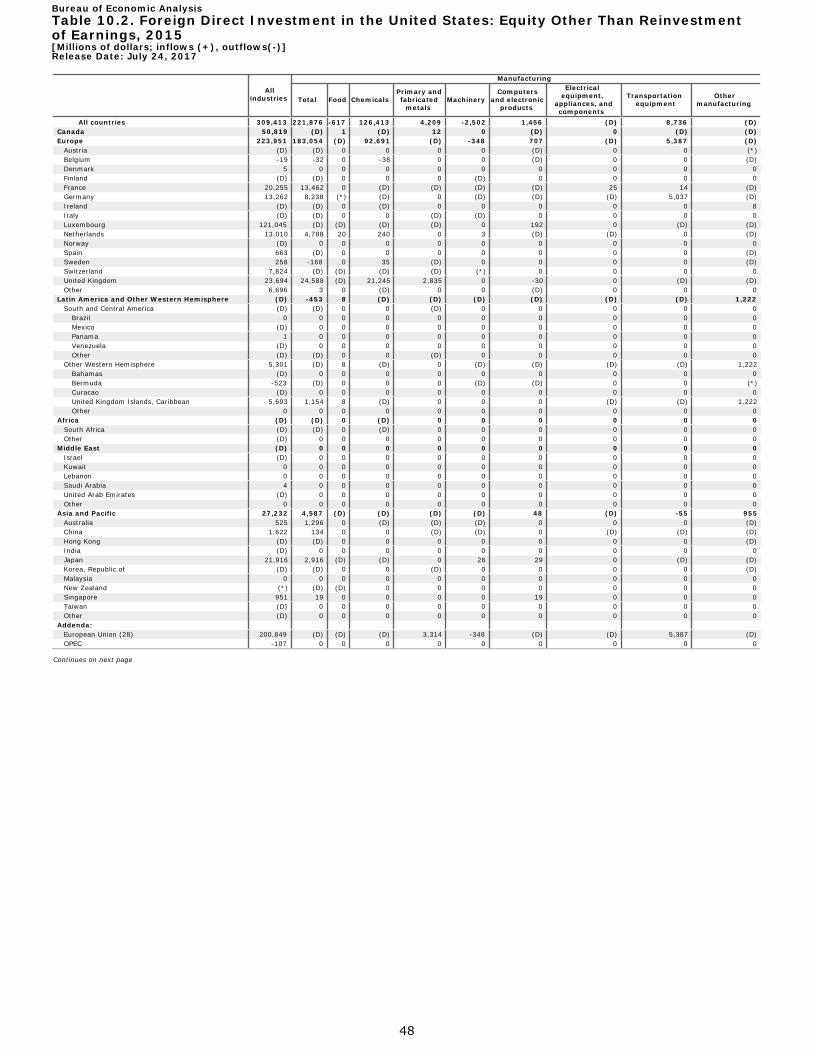
Bureau of Economic AnalysisTable 10.2. Foreign Direct Investment in the United States: Equity Other Than Reinvestmentof Earnings, 2015[Millions of dollars; inflows (+), outflows(-)]Release Date: July 24, 2017
All industries
Manufacturing
Total Food Chemicals Primary and fabricated metals
Machinery Computers
and electronic products
Electrical equipment,
appliances, and components
Transportation equipment
Other manufacturing
All countries 309,413 221,876 -617 126,413 4,209 -2,502 1,456 (D) 8,736 (D) Canada 50,819 (D) 1 (D) 12 0 (D) 0 (D) (D) Europe 223,951 183,054 (D) 92,691 (D) -348 707 (D) 5,387 (D)
Austria (D) (D) 0 0 0 0 (D) 0 0 (*) Belgium -19 -32 0 -38 0 0 (D) 0 0 (D) Denmark 5 0 0 0 0 0 0 0 0 0 Finland (D) (D) 0 0 0 (D) 0 0 0 0 France 20,255 13,462 0 (D) (D) (D) (D) 25 14 (D) Germany 13,262 8,238 (*) (D) 0 (D) (D) (D) 5,037 (D) Ireland (D) (D) 0 (D) 0 0 0 0 0 8 Italy (D) (D) 0 0 (D) (D) 0 0 0 0 Luxembourg 121,045 (D) (D) (D) (D) 0 192 0 (D) (D) Netherlands 13,010 4,788 20 240 0 3 (D) (D) 0 (D) Norway (D) 0 0 0 0 0 0 0 0 0 Spain 663 (D) 0 0 0 0 0 0 0 (D) Sweden 258 -168 0 35 (D) 0 0 0 0 (D) Switzerland 7,824 (D) (D) (D) (D) (*) 0 0 0 0 United Kingdom 23,694 24,588 (D) 21,245 2,835 0 -30 0 (D) (D) Other 6,696 3 0 (D) 0 0 (D) 0 0 0
Latin America and Other Western Hemisphere (D) -453 8 (D) (D) (D) (D) (D) (D) 1,222 South and Central America (D) (D) 0 0 (D) 0 0 0 0 0
Brazil 0 0 0 0 0 0 0 0 0 0 Mexico (D) 0 0 0 0 0 0 0 0 0 Panama 1 0 0 0 0 0 0 0 0 0 Venezuela (D) 0 0 0 0 0 0 0 0 0 Other (D) (D) 0 0 (D) 0 0 0 0 0
Other Western Hemisphere 5,301 (D) 8 (D) 0 (D) (D) (D) (D) 1,222 Bahamas (D) 0 0 0 0 0 0 0 0 0 Bermuda -523 (D) 0 0 0 (D) (D) 0 0 (*) Curacao (D) 0 0 0 0 0 0 0 0 0 United Kingdom Islands, Caribbean 5,693 1,154 8 (D) 0 0 0 (D) (D) 1,222 Other 0 0 0 0 0 0 0 0 0 0
Africa (D) (D) 0 (D) 0 0 0 0 0 0 South Africa (D) (D) 0 (D) 0 0 0 0 0 0 Other (D) 0 0 0 0 0 0 0 0 0
Middle East (D) 0 0 0 0 0 0 0 0 0 Israel (D) 0 0 0 0 0 0 0 0 0 Kuwait 0 0 0 0 0 0 0 0 0 0 Lebanon 0 0 0 0 0 0 0 0 0 0 Saudi Arabia 4 0 0 0 0 0 0 0 0 0 United Arab Emirates (D) 0 0 0 0 0 0 0 0 0 Other 0 0 0 0 0 0 0 0 0 0
Asia and Pacific 27,232 4,587 (D) (D) (D) (D) 48 (D) -55 955 Australia 525 1,296 0 (D) (D) (D) 0 0 0 (D) China 1,622 134 0 0 (D) (D) 0 (D) (D) (D) Hong Kong (D) (D) 0 0 0 0 0 0 0 (D) India (D) 0 0 0 0 0 0 0 0 0 Japan 21,916 2,916 (D) (D) 0 26 29 0 (D) (D) Korea, Republic of (D) (D) 0 0 (D) 0 0 0 0 (D) Malaysia 0 0 0 0 0 0 0 0 0 0 New Zealand (*) (D) (D) 0 0 0 0 0 0 0 Singapore 951 19 0 0 0 0 19 0 0 0 Taiwan (D) 0 0 0 0 0 0 0 0 0 Other (D) 0 0 0 0 0 0 0 0 0
Addenda: European Union (28) 200,849 (D) (D) (D) 3,314 -348 (D) (D) 5,387 (D) OPEC -107 0 0 0 0 0 0 0 0 0
Continues on next page
48

Bureau of Economic AnalysisTable 10.2. Foreign Direct Investment in the United States: Equity Other Than Reinvestmentof Earnings, 2015[Millions of dollars; inflows (+), outflows(-)]Release Date: July 24, 2017
Wholesale trade
Retail trade
2,064
Information Depository institutions
Finance (except
depository institutions)
and insurance
Real estate and
rental and
leasing
Professional, scientific,
and technical services
Other industries
All countries 23,381 3,481 -3,078 23,806 5,511 15,221 17,151 Canada 1,022 (D) (D) 2,790 5,048 (D) (D) 2,275 Europe 17,987 (D) 1,116 -5,405 2,759 962 12,126 (D)
Austria 0 0 0 0 0 0 0 0 Belgium 11 0 0 0 0 0 0 2 Denmark (*) 0 0 0 0 0 0 5 Finland 0 0 0 0 0 0 0 1 France 100 (D) (D) 41 1,373 0 (D) 1,932 Germany 31 13 (D) (D) -743 1,130 (D) (D) Ireland 0 0 5 0 61 12 (D) 0 Italy (D) 23 0 1 (D) 0 (D) 0 Luxembourg (D) 0 19 0 (D) 0 28 254 Netherlands (D) (D) (D) 0 (D) (D) (D) (D) Norway (D) 0 0 0 0 (D) 0 0 Spain 0 0 0 35 (D) 0 0 (D) Sweden 0 0 0 0 0 (D) (D) (D) Switzerland (D) 0 0 (D) 5,899 0 0 23 United Kingdom (D) (D) 171 (D) 1,842 (D) 35 (D) Other 0 0 (D) 2 (D) (D) 1 6,745
Latin America and Other Western Hemisphere (D) (D) (D) 268 (D) 745 (D) 4,241
South and Central America 0 0 (D) (D) 0 (D) 0 (D) Brazil 0 0 0 0 0 0 0 0 Mexico 0 0 (D) (D) 0 (D) 0 (D) Panama 0 0 0 0 0 1 0 0 Venezuela 0 0 0 (D) 0 0 0 0 Other 0 0 0 0 0 0 0 (D)
Other Western Hemisphere (D) (D) (D) (D) (D) (D) (D) (D) Bahamas 0 0 0 0 0 0 0 (D) Bermuda 0 0 0 0 (D) (D) 0 103 Curacao 0 0 0 (D) 0 -1 0 (D) United Kingdom Islands, Caribbean (D) (D) (D) 0 -238 670 (D) 4,017 Other 0 0 0 0 0 0 0 0
Africa 0 0 0 0 0 (D) 0 (D) South Africa 0 0 0 0 0 0 0 (D) Other 0 0 0 0 0 (D) 0 0
Middle East (D) 0 0 1 (D) 0 (D) (D) Israel (D) 0 0 1 0 0 (D) (D) Kuwait 0 0 0 0 0 0 0 0 Lebanon 0 0 0 0 0 0 0 0 Saudi Arabia 4 0 0 0 0 0 0 0 United Arab Emirates 0 0 0 0 (D) 0 0 (D) Other 0 0 0 0 0 0 0 0
Asia and Pacific 4,136 (D) 749 -731 15,243 (D) (D) (D) Australia (*) 0 0 (D) (D) (D) 12 (D) China 0 0 0 (D) (D) (D) 0 8 Hong Kong (D) 0 0 (D) 0 0 (D) (D) India 0 0 (D) -1 0 0 (D) 0 Japan (D) 13 (D) 43 14,749 457 18 283 Korea, Republic of (D) 0 0 2 (D) 0 0 1 Malaysia 0 0 0 0 0 0 0 0 New Zealand (D) 0 0 0 0 0 0 0 Singapore (*) (D) 0 0 12 0 (D) (D) Taiwan 0 0 0 (D) 0 0 0 0 Other 0 0 0 0 0 0 0 (D)
Addenda: European Union (28) (D) (D) (D) (D) -3,140 (D) 12,126 (D) OPEC 4 0 0 (D) (D) 0 0 (D)
Legend / Footnotes: Note. Inflows increase the foreign direct investment position in the United States, while outflows decrease it.
49

Bureau of Economic AnalysisTable 10.3. Foreign Direct Investment in the United States: Equity Other Than Reinvestmentof Earnings, 2016[Millions of dollars; inflows (+), outflows(-)]Release Date: July 24, 2017
All industries
Manufacturing
Total Food Chemicals Primary and fabricated metals
Machinery Computers
and electronic products
Electrical equipment,
appliances, and components
Transportation equipment
Other manufacturing
All countries 254,097 97,871 2,129 46,222 1,370 (D) 12,029 (D) 3,661 26,730 Canada 40,864 1,588 (D) (D) 5 0 0 0 (D) 320 Europe 165,982 79,631 (D) 45,242 (D) (D) (D) (D) 1,055 23,412
Austria 0 0 0 0 0 0 0 0 0 0 Belgium -47 (D) 0 -185 0 0 0 0 0 (D) Denmark 2,348 0 0 0 0 0 0 0 0 0 Finland 0 0 0 0 0 0 0 0 0 0 France 6,522 5,625 0 5,090 -4 0 21 45 (D) (D) Germany 5,827 5,246 2 (D) 0 42 (D) 0 (D) (D) Ireland 32,200 (D) 0 (D) 0 0 0 0 0 18 Italy 77 (D) 0 0 (D) 0 0 0 0 0 Luxembourg 22,898 3,148 0 1,938 0 (D) 49 0 0 (D) Netherlands 39,401 15,305 (D) -6 0 44 19 (D) 0 (D) Norway (D) 0 0 0 0 0 0 0 0 0 Spain 1,797 396 0 (D) 0 (D) 0 0 0 (D) Sweden (D) (D) 0 (D) (D) 0 0 0 0 16 Switzerland 25,489 (D) (D) (D) 0 0 (D) 0 0 155 United Kingdom 25,709 14,485 0 (D) (D) (D) (D) 0 (D) (D) Other 824 (D) 0 18 (D) 0 0 0 0 0
Latin America and Other Western Hemisphere 11,988 (D) 34 0 0 0 (D) 0 0 (D) South and Central America -81 0 0 0 0 0 0 0 0 0
Brazil 0 0 0 0 0 0 0 0 0 0 Mexico (D) 0 0 0 0 0 0 0 0 0 Panama (*) 0 0 0 0 0 0 0 0 0 Venezuela (D) 0 0 0 0 0 0 0 0 0 Other 0 0 0 0 0 0 0 0 0 0
Other Western Hemisphere 12,069 (D) 34 0 0 0 (D) 0 0 (D) Bahamas (D) 0 0 0 0 0 0 0 0 0 Bermuda (D) 0 0 0 0 0 0 0 0 0 Curacao (D) 0 0 0 0 0 0 0 0 0 United Kingdom Islands, Caribbean 540 (D) 34 0 0 0 (D) 0 0 (D) Other 0 0 0 0 0 0 0 0 0 0
Africa 0 0 0 0 0 0 0 0 0 0 South Africa 0 0 0 0 0 0 0 0 0 0 Other 0 0 0 0 0 0 0 0 0 0
Middle East 1,169 (D) 0 0 0 0 (D) 0 0 0 Israel 1,137 (D) 0 0 0 0 (D) 0 0 0 Kuwait 0 0 0 0 0 0 0 0 0 0 Lebanon 0 0 0 0 0 0 0 0 0 0 Saudi Arabia (D) 0 0 0 0 0 0 0 0 0 United Arab Emirates (D) 0 0 0 0 0 0 0 0 0 Other (D) 0 0 0 0 0 0 0 0 0
Asia and Pacific 34,094 14,841 (D) (D) (D) (D) 8,088 0 (D) (D) Australia 337 (D) 0 (D) (D) 0 0 0 0 (D) China 11,246 9,057 0 (*) (D) 0 (D) 0 (D) 0 Hong Kong (D) (D) 0 0 0 0 (D) 0 0 0 India (D) 0 0 0 0 0 0 0 0 0 Japan 18,356 3,162 -5 (D) (D) 22 (D) 0 157 (D) Korea, Republic of 603 (D) 0 0 0 (D) 0 0 0 0 Malaysia 0 0 0 0 0 0 0 0 0 0 New Zealand (D) 0 0 0 0 0 0 0 0 0 Singapore 631 (D) 0 0 0 0 (D) 0 0 0 Taiwan (D) 0 0 0 0 0 0 0 0 0 Other (D) (D) (D) 0 0 0 0 0 0 0
Addenda: European Union (28) 139,015 72,673 (D) 42,108 22 (D) 26 (D) 1,055 23,258 OPEC -43 0 0 0 0 0 0 0 0 0
Continues on next page
50
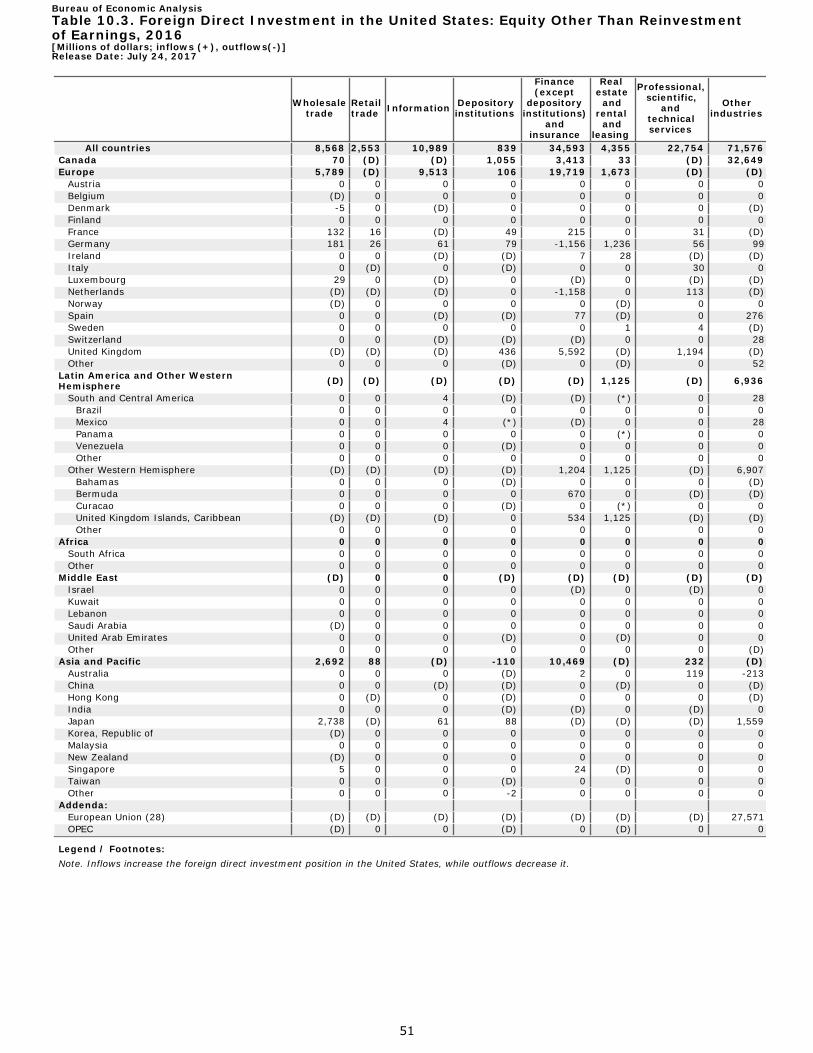
Bureau of Economic AnalysisTable 10.3. Foreign Direct Investment in the United States: Equity Other Than Reinvestmentof Earnings, 2016[Millions of dollars; inflows (+), outflows(-)]Release Date: July 24, 2017
Wholesale trade
Retail trade
2,553
Information Depository institutions
Finance (except
depository institutions)
and insurance
Real estate and
rental and
leasing
Professional, scientific,
and technical services
Other industries
All countries 8,568 10,989 839 34,593 4,355 22,754 71,576 Canada 70 (D) (D) 1,055 3,413 33 (D) 32,649 Europe 5,789 (D) 9,513 106 19,719 1,673 (D) (D)
Austria 0 0 0 0 0 0 0 0 Belgium (D) 0 0 0 0 0 0 0 Denmark -5 0 (D) 0 0 0 0 (D) Finland 0 0 0 0 0 0 0 0 France 132 16 (D) 49 215 0 31 (D) Germany 181 26 61 79 -1,156 1,236 56 99 Ireland 0 0 (D) (D) 7 28 (D) (D) Italy 0 (D) 0 (D) 0 0 30 0 Luxembourg 29 0 (D) 0 (D) 0 (D) (D) Netherlands (D) (D) (D) 0 -1,158 0 113 (D) Norway (D) 0 0 0 0 (D) 0 0 Spain 0 0 (D) (D) 77 (D) 0 276 Sweden 0 0 0 0 0 1 4 (D) Switzerland 0 0 (D) (D) (D) 0 0 28 United Kingdom (D) (D) (D) 436 5,592 (D) 1,194 (D) Other 0 0 0 (D) 0 (D) 0 52
Latin America and Other Western Hemisphere (D) (D) (D) (D) (D) 1,125 (D) 6,936
South and Central America 0 0 4 (D) (D) (*) 0 28 Brazil 0 0 0 0 0 0 0 0 Mexico 0 0 4 (*) (D) 0 0 28 Panama 0 0 0 0 0 (*) 0 0 Venezuela 0 0 0 (D) 0 0 0 0 Other 0 0 0 0 0 0 0 0
Other Western Hemisphere (D) (D) (D) (D) 1,204 1,125 (D) 6,907 Bahamas 0 0 0 (D) 0 0 0 (D) Bermuda 0 0 0 0 670 0 (D) (D) Curacao 0 0 0 (D) 0 (*) 0 0 United Kingdom Islands, Caribbean (D) (D) (D) 0 534 1,125 (D) (D) Other 0 0 0 0 0 0 0 0
Africa 0 0 0 0 0 0 0 0 South Africa 0 0 0 0 0 0 0 0 Other 0 0 0 0 0 0 0 0
Middle East (D) 0 0 (D) (D) (D) (D) (D) Israel 0 0 0 0 (D) 0 (D) 0 Kuwait 0 0 0 0 0 0 0 0 Lebanon 0 0 0 0 0 0 0 0 Saudi Arabia (D) 0 0 0 0 0 0 0 United Arab Emirates 0 0 0 (D) 0 (D) 0 0 Other 0 0 0 0 0 0 0 (D)
Asia and Pacific 2,692 88 (D) -110 10,469 (D) 232 (D) Australia 0 0 0 (D) 2 0 119 -213 China 0 0 (D) (D) 0 (D) 0 (D) Hong Kong 0 (D) 0 (D) 0 0 0 (D) India 0 0 0 (D) (D) 0 (D) 0 Japan 2,738 (D) 61 88 (D) (D) (D) 1,559 Korea, Republic of (D) 0 0 0 0 0 0 0 Malaysia 0 0 0 0 0 0 0 0 New Zealand (D) 0 0 0 0 0 0 0 Singapore 5 0 0 0 24 (D) 0 0 Taiwan 0 0 0 (D) 0 0 0 0 Other 0 0 0 -2 0 0 0 0
Addenda: European Union (28) (D) (D) (D) (D) (D) (D) (D) 27,571 OPEC (D) 0 0 (D) 0 (D) 0 0
Legend / Footnotes: Note. Inflows increase the foreign direct investment position in the United States, while outflows decrease it.
51

Bureau of Economic AnalysisTable 11.1. Foreign Direct Investment in the United States: Reinvestment of Earnings WithoutCurrent-Cost Adjustment, 2014[Millions of dollars]Release Date: July 24, 2017
All industries
Manufacturing
Total Food Chemicals Primary and fabricated metals
Machinery Computers
and electronic products
Electrical equipment,
appliances, and components
Transportation equipment
Other manufacturing
All countries 84,250 34,713 3,277 9,478 461 4,658 2,018 938 5,012 8,871 Canada 7,117 3,469 (D) 2,070 (D) (D) -25 -8 718 652 Europe 52,561 24,111 (D) 6,575 125 3,364 1,468 (D) 2,740 (D)
Austria (D) (D) 7 -1 47 28 (*) 0 (*) (D) Belgium (D) (D) (D) (D) (D) 30 (D) (*) (D) (D) Denmark (D) 549 (D) 51 (D) (D) (D) 0 1 38 Finland (D) (D) -1 (D) (*) (D) (D) 0 (D) (D) France 6,380 1,343 99 (D) 77 (D) 746 (D) (D) -189 Germany 11,909 4,156 14 (D) 165 (D) 10 30 2,046 (D) Ireland 2,847 (D) (D) (D) 5 (D) 2 0 0 (D) Italy 1,338 (D) 33 (D) 46 49 (D) (*) 36 (D) Luxembourg 1,024 (D) (D) 336 (D) (D) (D) (*) -40 (D) Netherlands 6,762 2,064 (D) (D) -61 (D) -106 -41 28 1,091 Norway 477 (D) (*) (D) (D) (*) (*) (D) 0 0 Spain 811 (D) (D) (D) (D) (D) 3 (*) (D) (D) Sweden 2,302 1,286 0 182 (D) 37 (D) (D) (D) 481 Switzerland 7,747 (D) (D) (D) 51 279 (D) (D) (*) (D) United Kingdom 8,306 8,728 284 (D) (D) 212 (D) (D) 112 4,667 Other (D) (D) (D) (D) (D) (*) (*) 4 16 34
Latin America and Other Western Hemisphere 2,614 804 (D) (D) -47 (D) (D) (D) (D) (D) South and Central America 1,569 (D) (D) (D) (D) (D) (D) (*) (D) (D)
Brazil (D) 21 (*) (*) 3 (D) 0 0 (D) (D) Mexico 1,281 (D) (D) (D) (D) (*) (*) (*) 1 (D) Panama 102 (D) 0 (*) (*) (D) (*) (*) 1 (D) Venezuela (D) (D) 0 0 0 (*) 0 0 0 (D) Other -2 66 (*) (D) (D) 0 (D) 0 0 39
Other Western Hemisphere 1,045 (D) (D) -2 (D) (D) 142 (D) 95 (D) Bahamas (D) 1 1 0 (*) 0 (*) 0 (*) (*) Bermuda 747 (D) (*) 1 0 (D) (D) 0 0 (D) Curacao (D) (D) (*) (*) 0 (*) 0 0 0 (D) United Kingdom Islands, Caribbean 416 508 (D) -3 (D) (D) (D) (D) 95 (D) Other (D) -2 0 (*) 0 0 -2 0 0 0
Africa 482 4 0 0 0 (D) 0 0 0 (D) South Africa (D) 0 0 0 0 0 0 0 0 0 Other (D) 4 0 0 0 (D) 0 0 0 (D)
Middle East 114 284 (D) (D) (D) 4 5 0 (D) (D) Israel 136 (D) (D) (D) (D) 4 (D) 0 2 (D) Kuwait (D) (*) 0 0 0 0 (D) 0 (D) 0 Lebanon (*) 0 0 0 0 0 0 0 0 0 Saudi Arabia (D) (D) 0 (D) (D) 0 0 0 0 (D) United Arab Emirates (D) (D) 0 0 0 0 (D) 0 0 0 Other (D) (D) 0 0 0 0 (D) 0 0 0
Asia and Pacific 21,362 6,040 (D) (D) (D) (D) (D) (D) (D) (D) Australia 1,821 -208 (D) (D) (D) (D) -1 0 (*) -71 China 945 -25 0 (*) 1 (D) -6 (*) (D) (D) Hong Kong (D) (D) 0 (D) 0 1 (D) 0 1 -2 India 632 7 (D) 14 (*) 0 (D) 0 (*) (D) Japan 14,599 5,544 197 503 (D) (D) 416 (D) 1,323 (D) Korea, Republic of 2,045 267 (D) (D) (D) (D) (*) 0 (D) (D) Malaysia 5 (*) 0 0 0 0 (*) 0 0 0 New Zealand (D) 8 (D) (D) 0 (*) 0 5 (D) 0 Singapore 440 (D) 0 (D) 3 0 (D) (D) 2 (*) Taiwan (D) (D) 0 (D) (*) 2 25 (D) (*) (D) Other (D) (*) 0 (D) (*) 0 (*) 0 0 (D)
Addenda: European Union (28) 44,657 22,480 (D) (D) (D) 3,085 (D) (D) 2,734 (D) OPEC -24 (D) 0 (D) (D) (*) -1 0 (D) (D)
Continues on next page
52

Bureau of Economic AnalysisTable 11.1. Foreign Direct Investment in the United States: Reinvestment of Earnings WithoutCurrent-Cost Adjustment, 2014[Millions of dollars]Release Date: July 24, 2017
Wholesale trade
Retail trade
1,991
Information Depository institutions
Finance (except
depository institutions)
and insurance
Real estate and
rental and
leasing
Professional, scientific,
and technical services
Other industries
All countries 6,132 -422 6,218 16,832 1,114 3,095 14,577 Canada -730 463 55 1,197 237 370 (D) (D) Europe 312 (D) -638 1,735 14,013 883 2,043 (D)
Austria 5 (D) (*) (D) (*) -1 (D) -1 Belgium 91 (D) (*) (D) 1 1 13 227 Denmark (D) (*) 1 0 (*) 4 (D) (D) Finland 31 0 (D) (D) 0 (*) 2 (D) France (D) 369 90 1,348 1,483 (D) (D) (D) Germany (D) (D) 694 (D) 3,181 135 181 917 Ireland (D) (*) 4 -17 347 (D) (D) (D) Italy -33 37 2 (D) 57 3 45 (D) Luxembourg (D) (D) (D) 0 1,084 (D) (D) 609 Netherlands (D) (D) (D) (D) (D) -302 (D) 2,003 Norway (D) 0 (D) (D) (D) -4 (D) (D) Spain 20 (D) 7 627 (D) 37 35 325 Sweden 591 1 (D) (D) 3 (D) (D) (D) Switzerland (D) (D) (D) (D) 2,745 44 -56 (D) United Kingdom -3,481 -744 (D) (D) 3,477 (D) (D) (D) Other 27 -5 (D) (D) -11 (D) (D) (D)
Latin America and Other Western Hemisphere 566 (D) (D) (D) (D) -199 (D) 1,017
South and Central America (D) (D) (D) (D) (D) 13 (D) 988 Brazil (D) (*) (D) 139 16 (D) (*) -4 Mexico 72 19 (D) -63 (D) (D) -6 1,117 Panama 1 (*) 0 (D) -3 (D) -1 (D) Venezuela (*) 0 (*) (D) (*) 1 0 (D) Other 2 (D) (D) (D) (*) 4 (D) (D)
Other Western Hemisphere (D) (D) (D) (D) (D) -212 -29 29 Bahamas (D) 0 0 (D) 6 (D) 3 (D) Bermuda -19 (*) (D) 0 (D) (D) (D) (D) Curacao (D) 0 1 -3 (D) -51 (D) -73 United Kingdom Islands, Caribbean (D) (D) -59 (D) -30 -161 (D) -357 Other (D) (D) (D) (*) 0 -2 (D) (D)
Africa (D) 0 -1 (D) (D) 5 (D) (D) South Africa (D) 0 (*) 0 (D) (*) (D) (D) Other (D) 0 -1 (D) (D) 5 (D) (D)
Middle East (D) (D) (D) (D) -37 16 2 (D) Israel (D) (D) 29 (D) (D) -6 1 (D) Kuwait 0 0 (*) (D) (D) 21 0 (D) Lebanon (*) 0 0 0 0 (D) 1 (D) Saudi Arabia (D) 0 (*) (D) 0 (D) (*) (D) United Arab Emirates -3 0 (D) (D) (D) 1 (*) (D) Other -3 (D) (D) 10 -1 (D) (*) (D)
Asia and Pacific 5,849 (D) 267 2,990 2,535 40 (D) 2,726 Australia 10 -1 -16 (D) -224 -187 (D) 2,314 China 13 (*) 17 (D) (D) (*) -1 (D) Hong Kong -24 (*) (D) 68 1 4 (D) (D) India 1 0 -4 (D) (D) (*) (D) (D) Japan 4,281 (D) 287 1,759 2,160 (D) 223 (D) Korea, Republic of 1,464 (*) -6 63 (D) -2 7 (D) Malaysia -2 0 (*) (D) (*) (*) (*) (D) New Zealand 7 (*) 0 0 (*) (*) 2 (D) Singapore 9 5 (D) 58 (D) -3 -1 22 Taiwan (D) 5 (D) (D) 5 1 -2 23 Other (D) (D) 0 (D) (D) (D) 3 (D)
Addenda: European Union (28) -1,683 1,190 (D) (D) 11,265 (D) 2,000 (D) OPEC (D) (*) (D) 78 (D) 22 (*) (D)
Legend / Footnotes: Note. Reinvestment of earnings are equal to income on equity less dividends and withdrawals. Positive reinvestment of earnings increases the foreign direct investment position in the United States, while negative reinvestment of earnings decreases it.
53

Bureau of Economic AnalysisTable 11.2. Foreign Direct Investment in the United States: Reinvestment of Earnings WithoutCurrent-Cost Adjustment, 2015[Millions of dollars]Release Date: July 24, 2017
All industries
Manufacturing
Total Food Chemicals Primary and fabricated metals
Machinery Computers
and electronic products
Electrical equipment,
appliances, and components
Transportation equipment
Other manufacturing
All countries 69,828 22,621 917 13,092 -429 1,947 821 (D) 3,371 (D) Canada 9,368 (D) 326 1,641 -212 47 (D) -3 (D) (D) Europe 37,564 14,390 (D) 10,973 (D) 664 888 (D) 3,181 (D)
Austria (D) (D) 5 (*) 12 50 (*) 0 -1 (D) Belgium 2,930 2,210 (D) 733 -19 (D) -1 (*) 1 (D) Denmark 694 335 (D) 26 (D) (D) (D) 0 1 18 Finland (D) (D) (D) (D) (*) (D) (D) 0 (D) (D) France 11,007 5,485 241 (D) -108 (D) (D) (D) 291 (D) Germany 5,073 2,368 12 (D) 135 -536 (D) -151 1,964 (D) Ireland (D) (D) 77 (D) 8 (D) 1 0 0 (D) Italy (D) (D) 42 99 (D) (D) (D) (*) 35 62 Luxembourg 873 (D) 172 302 (D) -1 (D) (*) (D) 651 Netherlands 3,727 1,173 (D) 1,887 57 (D) (D) (D) -83 600 Norway (D) 169 (*) (D) (D) (*) (D) (D) 0 0 Spain 1,817 (D) (D) (D) (D) (D) 2 (D) (D) (D) Sweden 1,512 779 0 -222 (D) 200 (D) (D) (D) 573 Switzerland 9,769 (D) (D) (D) (D) 228 14 (D) (D) 541 United Kingdom -4,725 -6,340 73 -252 93 195 63 (D) (D) (D) Other 296 84 (D) 311 -346 (*) (D) (D) 16 99
Latin America and Other Western Hemisphere (D) 2,325 490 (D) (D) (D) (D) (D) (D) 1,249 South and Central America (D) (D) 163 (D) (D) (*) (D) (D) (D) 1,077
Brazil 176 22 (*) (*) (D) (*) 0 0 (D) (D) Mexico (D) 182 162 (D) -36 (*) (*) (D) 1 (D) Panama 256 (D) 0 (*) -1 (*) (*) (*) (*) (D) Venezuela (D) (D) 0 0 0 (*) 0 0 0 (D) Other (D) (D) (*) (D) (D) 0 (D) 0 0 (D)
Other Western Hemisphere 3,198 (D) 327 (D) 11 (D) 114 (D) (D) 173 Bahamas -133 (D) (D) 0 (*) 0 (*) 0 (D) (*) Bermuda 2,307 (D) (D) 1 0 (D) (D) 0 0 (D) Curacao (D) (D) 1 (*) 0 (*) 0 0 0 (D) United Kingdom Islands, Caribbean 975 285 (D) 1 11 7 (D) (D) (D) (D) Other (D) 4 0 (D) 0 0 (D) 0 0 0
Africa (D) (D) 0 (D) 0 3 0 0 0 (D) South Africa (D) (D) 0 (D) 0 0 0 0 0 0 Other (D) (D) 0 0 0 3 0 0 0 (D)
Middle East (D) -271 1 (D) (D) 3 4 0 3 (D) Israel (D) (D) 1 (D) (D) 3 (D) 0 3 (D) Kuwait 48 (D) 0 0 0 0 (D) 0 (*) 0 Lebanon 1 0 0 0 0 0 0 0 0 0 Saudi Arabia (D) (D) 0 (D) (D) 0 0 0 0 (D) United Arab Emirates (D) (D) 0 0 0 0 (D) 0 0 0 Other (D) (D) 0 0 0 0 (D) 0 0 0
Asia and Pacific 16,760 4,684 (D) (D) (D) (D) -262 (D) 1,190 2,031 Australia -469 99 (D) (D) (D) (D) (*) (*) (*) (D) China -25 -19 0 1 (D) (D) (D) 1 (D) (D) Hong Kong (D) (D) -2 (D) 0 1 (D) 0 1 (*) India (D) 11 (D) 27 (*) 0 (D) 0 (*) (D) Japan 14,396 4,530 116 (D) 125 528 343 59 (D) (D) Korea, Republic of (D) (D) (D) (D) (D) (D) (*) 0 105 (D) Malaysia 1 (*) 0 0 0 0 (*) 0 0 0 New Zealand -65 (D) (D) (D) 0 (*) 0 3 (D) 0 Singapore 650 (D) 0 5 2 1 (D) (D) (D) (D) Taiwan (D) 283 0 (D) (D) (*) -3 (D) (*) (D) Other (D) (*) 0 (D) (*) 0 (*) 0 0 (D)
Addenda: European Union (28) 27,521 (D) (D) (D) 184 436 (D) (D) 3,172 (D) OPEC 1,247 (D) 0 (D) (D) (*) (*) 0 (*) (D)
Continues on next page
54

Bureau of Economic AnalysisTable 11.2. Foreign Direct Investment in the United States: Reinvestment of Earnings WithoutCurrent-Cost Adjustment, 2015[Millions of dollars]Release Date: July 24, 2017
Wholesale trade
Retail trade
3,391
Information Depository institutions
Finance (except
depository institutions)
and insurance
Real estate and
rental and
leasing
Professional, scientific,
and technical services
Other industries
All countries 11,638 802 5,087 14,704 2,147 3,921 5,518 Canada 1,079 917 293 1,508 1,623 (D) (D) 1,706 Europe 3,847 (D) 836 1,096 7,998 1,200 2,719 (D)
Austria (D) (D) (*) (D) (D) (D) 2 (D) Belgium 255 (D) (*) (D) (D) 1 9 186 Denmark 384 (*) 1 0 (*) -1 18 -43 Finland 106 0 (D) (D) 0 (*) 1 (D) France 795 154 239 1,303 1,599 52 (D) (D) Germany 1,128 (D) 643 (D) 31 85 -237 (D) Ireland (D) (*) (D) 46 480 (D) (D) 32 Italy (D) 44 3 (D) (D) (D) 59 -516 Luxembourg (D) 24 -874 0 (D) (D) (D) -91 Netherlands (D) 485 1,182 (D) (D) (D) 640 2,743 Norway (D) 0 (*) (D) (D) (D) 25 -9 Spain (D) 8 4 679 331 (D) (D) 439 Sweden (D) 1 -13 64 1 (D) (D) 97 Switzerland (D) -8 (D) (D) 3,423 (D) -75 188 United Kingdom (D) (D) -633 (D) 3,304 (D) 630 (D) Other (D) -2 12 43 (D) (D) 4 (D)
Latin America and Other Western Hemisphere (D) (D) (D) -180 (D) 117 (D) (D)
South and Central America 104 (D) (D) (D) (D) 67 -6 (D) Brazil 50 (*) 1 90 -5 (D) (*) (D) Mexico 29 12 110 (D) (D) 11 -8 (D) Panama (*) (D) 0 (D) -4 24 -1 (D) Venezuela (*) 0 (*) (D) (*) (D) 0 (*) Other 24 (*) (D) (D) (D) (D) 3 (D)
Other Western Hemisphere (D) (D) -69 (D) (D) 49 (D) (D) Bahamas (D) 0 0 (D) 3 1 4 (D) Bermuda (D) (*) -2 0 (D) 41 193 (D) Curacao 2 0 1 (D) (*) 20 (D) -50 United Kingdom Islands, Caribbean (D) -22 (D) (D) 623 -15 -6 (D) Other (D) (D) (D) (*) 0 3 (D) (D)
Africa (D) 0 (*) (D) (D) (D) (D) (D) South Africa (D) 0 (*) 0 (D) (*) -1 (D) Other (D) 0 (*) (D) (*) (D) (D) (D)
Middle East (D) (D) (D) (D) (D) 57 (D) (D) Israel (D) 9 34 54 (D) -6 (D) -21 Kuwait 0 0 (*) (D) -1 63 0 (D) Lebanon (*) 0 0 0 0 1 1 -1 Saudi Arabia (D) 0 (*) (D) 0 (*) (*) (D) United Arab Emirates -3 0 (*) (D) (D) -1 (*) (D) Other -1 (D) (D) 1 (D) (*) (D) (D)
Asia and Pacific 5,656 238 -197 2,585 3,472 (D) (D) (D) Australia 24 -1 -10 (D) (D) (D) 10 -82 China 20 (D) (D) (D) (D) (D) -4 -197 Hong Kong (D) (*) (D) (D) (*) (D) (D) (D) India (D) 0 -2 101 (D) (*) (D) (D) Japan (D) (D) -96 1,626 3,487 392 214 (D) Korea, Republic of (D) (*) -43 66 34 1 4 -16 Malaysia -1 0 (*) (D) (*) -1 (*) (D) New Zealand (D) (*) 0 0 (*) 1 2 (D) Singapore 12 (D) -36 (D) (D) (*) 2 (D) Taiwan 29 3 (D) (D) 3 1 -1 (D) Other (D) (*) 0 30 (*) 2 (D) (D)
Addenda: European Union (28) (D) (D) (D) (D) 4,574 1,153 2,765 (D) OPEC (D) (*) (D) (D) (D) 63 (*) (D)
Legend / Footnotes: Note. Reinvestment of earnings are equal to income on equity less dividends and withdrawals. Positive reinvestment of earnings increases the foreign direct investment position in the United States, while negative reinvestment of earnings decreases it.
55

Bureau of Economic AnalysisTable 11.3. Foreign Direct Investment in the United States: Reinvestment of Earnings WithoutCurrent-Cost Adjustment, 2016[Millions of dollars]Release Date: July 24, 2017
All industries
Manufacturing
Total Food Chemicals Primary and fabricated metals
Machinery Computers
and electronic products
Electrical equipment,
appliances, and components
Transportation equipment
Other manufacturing
All countries 86,467 48,544 3,617 15,158 1,178 (D) 1,506 (D) 8,158 13,709 Canada 9,741 1,394 (D) (D) -159 52 119 -1 (D) 678 Europe 57,988 38,722 (D) 13,634 (D) (D) (D) (D) 5,689 10,015
Austria 494 64 6 (D) -27 (D) (*) 0 (*) (D) Belgium 3,388 (D) (D) 962 2 (D) (*) (*) 1 (D) Denmark 731 303 (D) 50 (D) 166 (D) 0 (D) 23 Finland 343 (D) (D) (D) (*) 48 (*) 0 (D) (D) France 7,642 2,939 159 2,046 -219 -17 368 128 (D) (D) Germany 10,301 8,321 16 (D) 120 (D) (D) (D) (D) (D) Ireland 4,464 (D) (D) (D) (D) (D) 1 0 0 (D) Italy 26 (D) 75 180 (D) 251 (D) (D) 31 53 Luxembourg 3,980 2,675 309 -1,918 139 (D) (D) (*) -25 (D) Netherlands 10,885 9,080 (D) 5,768 43 (D) (D) (D) -99 (D) Norway (D) (D) (*) (D) (D) (*) (D) (*) 0 (D) Spain 1,416 171 (D) (D) (D) (D) 1 (*) (D) (D) Sweden (D) (D) 0 (D) (D) 119 (D) (D) (D) (D) Switzerland 5,696 (D) (D) (D) 59 242 -64 (D) (D) 912 United Kingdom 7,880 4,384 63 (D) (D) (D) (D) -46 (D) (D) Other 460 (D) (D) (D) -42 (*) 3 (D) 15 (D)
Latin America and Other Western Hemisphere 4,811 (D) 818 (D) -24 (D) (D) 5 (D) (D) South and Central America 1,794 687 (D) (D) -30 (D) (D) (*) (D) (D)
Brazil 255 (D) (*) (*) 1 (*) 0 0 (D) (D) Mexico (D) 295 240 (D) (D) (*) (*) (*) 1 48 Panama 215 (D) 0 (*) -1 (*) (*) (*) (*) (D) Venezuela (D) (D) 0 0 0 (D) 0 0 0 (D) Other 73 (D) (D) (D) (D) 0 (D) 0 0 -4
Other Western Hemisphere 3,018 (D) (D) (D) 6 (D) 109 5 (*) (D) Bahamas (D) 1 (D) 0 (*) 0 (D) 0 (D) (D) Bermuda (D) (D) -3 (D) 0 (*) (D) 0 0 (D) Curacao (D) 1 1 (*) 0 (D) 0 0 0 (D) United Kingdom Islands, Caribbean 2,006 (D) (D) (D) 6 (D) -23 5 (D) (*) Other -3 3 0 (D) 0 0 (D) 0 0 0
Africa 183 (D) 0 (D) 0 (D) 0 0 0 (D) South Africa 184 (D) 0 (D) 0 0 0 0 0 0 Other -1 (D) 0 0 0 (D) 0 0 0 (D)
Middle East 744 (D) 4 (D) (D) (D) 3 0 (D) 2 Israel 238 (D) 4 (D) (D) (D) 3 0 (D) 2 Kuwait 14 (D) 0 0 0 0 (D) 0 (D) 0 Lebanon (D) 0 0 0 0 0 0 0 0 0 Saudi Arabia (D) (D) 0 (D) (D) 0 0 0 0 (*) United Arab Emirates (D) (D) 0 0 0 0 (D) 0 0 0 Other (D) (D) 0 0 0 0 (D) 0 0 0
Asia and Pacific 12,999 6,751 (D) (D) (D) (D) -643 129 (D) 2,506 Australia -1,018 (D) (D) (D) (D) 4 (*) (*) (*) 163 China -460 -140 0 (D) (D) -2 (D) 1 2 -39 Hong Kong (D) (D) -1 (D) 0 (D) (D) 0 2 3 India (D) 53 (D) 50 (*) 0 -1 0 (*) (D) Japan 13,182 6,819 93 (D) (D) 641 (D) 110 2,272 (D) Korea, Republic of 1,049 (D) (D) (D) 27 (D) (*) 0 129 (D) Malaysia 2 (*) 0 0 0 0 (*) 0 0 0 New Zealand (D) (D) 1 0 0 (D) 0 3 (D) 0 Singapore 120 (D) 0 (*) 1 (*) (D) (D) (D) (D) Taiwan (D) 268 0 (D) (*) 1 (*) (D) (*) (D) Other (D) (*) 0 (*) (*) 0 (D) 0 0 (D)
Addenda: European Union (28) 52,977 34,504 (D) 11,422 934 (D) (D) (D) 5,681 9,097 OPEC 733 (D) 0 (D) (D) (D) (*) 0 (D) (D)
Continues on next page
56

Bureau of Economic AnalysisTable 11.3. Foreign Direct Investment in the United States: Reinvestment of Earnings WithoutCurrent-Cost Adjustment, 2016[Millions of dollars]Release Date: July 24, 2017
Wholesale trade
Retail trade
4,021
Information Depository institutions
Finance (except
depository institutions)
and insurance
Real estate and
rental and
leasing
Professional, scientific,
and technical services
Other industries
All countries -913 641 5,203 18,911 2,331 2,550 5,178 Canada 421 1,087 (D) 1,655 2,446 951 (D) (D) Europe -4,075 (D) 1,397 700 11,275 870 (D) 4,315
Austria 150 (D) (*) (D) (*) (D) (D) -2 Belgium (D) (D) (*) (D) 2 (*) -2 121 Denmark 381 (D) (D) 0 (*) -2 11 (D) Finland 73 0 (D) (D) 0 (*) 1 (D) France 607 356 (D) 646 1,699 (*) 601 (D) Germany -4,043 (D) 431 729 3,189 -60 -237 (D) Ireland (D) (*) (D) (D) 471 (D) (D) -66 Italy -30 (D) (D) (D) 44 (D) 38 -556 Luxembourg 595 (D) (D) 0 (D) (D) 37 (D) Netherlands (D) (D) 980 (D) -689 (D) 551 (D) Norway (D) 0 (*) (D) 1 (D) 26 8 Spain 72 (D) 37 (D) 157 50 (D) (D) Sweden (D) (*) (D) 10 -2 (D) (D) 141 Switzerland 1,164 -48 (D) (D) (D) 48 35 -1,049 United Kingdom (D) (D) (D) -1,325 4,574 (D) 444 (D) Other (D) -1 3 (D) (D) -37 4 (D)
Latin America and Other Western Hemisphere (D) (D) (D) (D) (D) 99 (D) (D)
South and Central America 155 (D) 28 (D) (D) 24 (D) (D) Brazil (D) (*) 1 89 -16 (D) (D) -5 Mexico 8 (D) 28 -16 28 (D) -7 (D) Panama 5 (*) 0 (D) -4 (D) (*) (D) Venezuela (*) 0 (*) (D) (D) (D) 0 (*) Other (D) (*) -1 (D) (*) (D) (D) (D)
Other Western Hemisphere (D) (D) (D) (D) 1,744 75 -308 753 Bahamas (D) 0 0 2 2 2 4 (D) Bermuda -7 (*) 2 0 798 11 -222 (D) Curacao 3 0 (*) -1 (*) 12 (D) (D) United Kingdom Islands, Caribbean (D) -60 (D) (D) 944 42 -22 (D) Other (D) (D) -4 (*) 0 9 (D) (D)
Africa (D) 0 (*) (D) (*) 1 (D) (D) South Africa (D) 0 (D) 0 (*) (*) (D) (D) Other (D) 0 (D) (D) (*) 1 (D) (D)
Middle East (D) (D) -69 (D) (D) -25 3 (D) Israel 22 6 (D) 81 -1 (D) (D) (D) Kuwait 0 0 (*) (D) (*) (D) 0 (D) Lebanon (D) 0 0 0 0 (D) 1 (D) Saudi Arabia (D) 0 (*) (D) 0 (*) (D) (D) United Arab Emirates -1 0 (*) (D) (D) (D) (D) (D) Other (*) (D) (D) 7 (D) (D) (*) (D)
Asia and Pacific 1,925 (D) (D) 2,346 3,464 435 254 (D) Australia -6 -1 -5 (D) -319 31 -11 -935 China -48 2 (D) (D) (D) (D) -7 (D) Hong Kong 2 1 (D) (D) -1 (D) 29 -76 India (D) (D) (D) (D) (D) (*) (D) (D) Japan 946 (D) -553 1,738 (D) (D) (D) (D) Korea, Republic of (D) (*) -31 87 -61 (D) (D) (D) Malaysia (*) 0 (D) 4 (*) -3 (*) (D) New Zealand (D) (*) 0 0 (*) (*) (D) 2 Singapore 29 44 -5 (D) (D) (D) 1 -58 Taiwan 32 (D) (D) (D) 3 (*) (*) 36 Other (D) (*) 0 (D) (*) (D) 3 55
Addenda: European Union (28) (D) (D) (D) (D) (D) 836 (D) (D) OPEC (D) (*) (D) (D) (D) -17 (*) 9
Legend / Footnotes: Note. Reinvestment of earnings are equal to income on equity less dividends and withdrawals. Positive reinvestment of earnings increases the foreign direct investment position in the United States, while negative reinvestment of earnings decreases it.
57

Bureau of Economic AnalysisTable 12.1. Foreign Direct Investment in the United States: Debt Instruments, 2014[Millions of dollars; inflows (+), outflows (-)]Release Date: July 24, 2017
All industries
Manufacturing
Total Food Chemicals Primary and fabricated metals
Machinery Computers
and electronic products
Electrical equipment,
appliances, and components
Transportation equipment
Other manufacturing
All countries 65,913 36,998 2,928 34,777 -2,563 -936 2,778 1,697 2,490 -4,173 Canada 6,520 1,516 325 414 -947 -129 -30 59 122 1,702 Europe 40,192 31,787 1,632 35,237 -3,346 -1,033 2,919 1,839 1,409 -6,871
Austria 53 54 1 -1 -16 24 4 (D) (*) (D) Belgium -2,523 -55 (D) -230 219 356 -2 (D) -91 -14 Denmark 1,551 1,147 (D) -6 (D) (D) (D) (*) (*) (D) Finland -844 114 0 (D) (D) 138 (D) (D) (D) (D) France 388 943 (D) -935 (D) -18 (D) (D) 253 -202 Germany 209 -940 5 1,338 -1,458 -2,131 -17 126 1,194 4 Ireland -6,397 -924 (D) 104 (D) (D) (D) (D) 0 (D) Italy 2,342 182 -7 183 1 -1 (D) (D) (D) 130 Luxembourg -4,748 11,951 80 (D) (D) (D) 366 0 -1 -489 Netherlands 18,822 15,904 (D) 15,579 (D) (D) 475 -104 101 (D) Norway (D) (D) 0 (D) (D) 2 (*) (D) (D) (D) Spain -154 255 -55 (D) (D) (D) (D) 19 (D) 13 Sweden 1,229 -4 1 79 -167 -284 -3 (D) (D) (D) Switzerland 20,778 5,676 (D) 5,385 247 525 60 (D) 72 636 United Kingdom 5,095 -5,869 (D) 2,815 -609 208 105 (D) -26 -8,845 Other (D) (D) (D) (D) -357 14 -1 (D) -14 41
Latin America and Other Western Hemisphere 2,347 1,574 968 175 440 -156 -100 (D) (D) 157 South and Central America -231 759 (D) (D) (D) (D) (D) (D) (D) (D)
Brazil -672 224 -37 112 243 (D) -85 -23 (D) (D) Mexico -24 613 (D) (D) (D) 27 13 (*) 44 205 Panama 106 (D) 1 (D) 0 (*) 0 0 -1 (D) Venezuela 335 (D) (*) -1 -1 1 2 (D) (D) (D) Other 25 -422 -4 (D) (D) (D) (D) (D) (D) -408
Other Western Hemisphere 2,578 815 (D) (D) (D) (D) (D) 0 (D) (D) Bahamas (D) (D) 0 (D) 0 0 0 0 0 (*) Bermuda -753 -425 (D) -248 0 (D) (D) 0 0 (D) Curacao 60 (D) 0 (D) 0 0 0 0 0 -1 United Kingdom Islands, Caribbean 3,124 1,095 (D) (D) (D) (D) (D) 0 (D) (D) Other (D) 128 (*) (D) 0 0 (D) 0 0 (D)
Africa -169 152 (D) (D) (D) (D) (D) (D) (D) (D) South Africa -381 199 -1 -1 1 (D) -2 0 (D) (D) Other 212 -47 (D) (D) (D) (D) (D) (D) 1 (D)
Middle East -1,895 -1,329 (D) (D) (D) (D) (D) (D) (*) (D) Israel -1,288 (D) (D) (D) 0 (*) (D) 0 1 (D) Kuwait (D) (*) 0 0 0 (D) 0 0 0 (D) Lebanon (D) 0 0 0 0 0 0 0 0 0 Saudi Arabia (D) (D) (D) (*) (D) 1 (D) (D) 0 0 United Arab Emirates 608 (D) (D) (D) -3 (D) (D) (D) -1 (D) Other 38 (D) 0 -1 0 (D) 0 0 0 (D)
Asia and Pacific 18,918 3,298 -11 228 1,289 177 45 -153 849 874 Australia 1,278 (D) (D) 54 (D) (D) -4 -5 -3 (D) China 601 892 -1 (D) (D) (D) -120 6 133 17 Hong Kong 951 (D) 1 (D) -1 (*) 81 -8 4 10 India 710 109 (D) 92 2 9 (D) -5 12 (D) Japan 4,875 1,559 (D) 181 791 -58 47 -40 607 (D) Korea, Republic of 3,496 (D) 1 -16 3 (D) -6 -1 59 (D) Malaysia 229 158 1 4 (D) 10 (D) 4 -5 5 New Zealand (D) -12 (D) (D) (D) -2 2 (*) (D) -2 Singapore 3,221 -158 (D) (D) (*) -153 (D) (D) 8 184 Taiwan 842 (D) -3 (D) 4 -5 (*) (D) 2 -2 Other (D) -45 (D) 6 (*) (D) (D) (D) (D) (D)
Addenda: European Union (28) 18,845 26,296 1,526 29,853 -3,070 -1,560 2,859 (D) 1,333 (D) OPEC -324 (D) 4 (D) (D) 2 2 -26 (D) (D)
Continues on next page
58

Bureau of Economic AnalysisTable 12.1. Foreign Direct Investment in the United States: Debt Instruments, 2014[Millions of dollars; inflows (+), outflows (-)]Release Date: July 24, 2017
Wholesale trade
Retail trade Information Depository
institutions
Finance (except
depository institutions)
and insurance
Real estate and
rental and
leasing
Professional, scientific,
and technical services
Other industries
All countries 4,546 262 184 (*) 4,740 1,868 105 17,211 Canada 239 198 921 0 1,303 -29 208 2,164 Europe 985 -700 -648 0 3,853 -335 391 4,858
Austria 26 (D) (D) 0 (*) (D) -2 (*) Belgium -793 (D) (D) 0 (D) 12 (D) (D) Denmark -58 (*) -1 0 (*) (*) (D) (D) Finland -187 0 (D) 0 (*) (*) (D) (D) France -1,950 32 (D) 0 (D) (D) 176 1,600 Germany -598 (D) (D) 0 1,426 196 (D) 110 Ireland (D) (D) (D) 0 -667 (D) (D) 65 Italy 9 (D) 5 0 (D) 4 18 2,102 Luxembourg 8 (D) 2,017 0 -78 (D) (D) -20,895 Netherlands -2,367 (D) 26 0 3,918 (D) 312 (D) Norway 32 (*) (*) 0 (*) (D) (D) -131 Spain (*) (D) 3 0 (D) 2 -13 4 Sweden (D) (D) -48 0 3 (D) (D) (D) Switzerland 7,052 908 (D) 0 1,992 (D) 208 5,450 United Kingdom 2,507 170 -120 0 -1,610 (D) -4,219 (D) Other 26 (D) 3 0 (D) (D) -21 510
Latin America and Other Western Hemisphere -886 (D) (D) (*) 360 539 -67 596
South and Central America -910 (D) (D) 0 (D) (D) (D) 364 Brazil -1,055 1 -4 0 -1 (D) -25 (D) Mexico -193 1 (D) 0 (D) (*) -10 (D) Panama 36 (D) 1 0 0 (D) -1 (D) Venezuela (D) 0 1 0 -3 0 -9 26 Other (D) (D) (D) 0 4 (D) (D) (D)
Other Western Hemisphere 24 777 (D) (*) (D) (D) (D) 232 Bahamas (D) 0 0 0 0 (D) -3 11 Bermuda (D) 0 (D) 0 -54 0 (D) -225 Curacao (D) (D) (*) (*) 0 (D) (*) (D) United Kingdom Islands, Caribbean 210 (D) 1 0 515 267 (D) (D) Other (D) (D) (D) 0 (D) 2 -1 (D)
Africa 95 (D) (D) 0 (D) 0 (D) 114 South Africa (D) (D) 3 0 (*) 0 (D) (D) Other (D) 0 (D) 0 (D) 0 (D) (D)
Middle East -1,154 0 (D) 0 (D) -3 (D) 580 Israel 61 0 (D) 0 (*) -3 -4 (D) Kuwait 0 0 0 0 0 0 0 (D) Lebanon 0 0 0 0 (*) 0 (D) (D) Saudi Arabia (D) 0 0 0 0 (D) -1 -46 United Arab Emirates (D) 0 (D) 0 (D) (D) 2 531 Other (D) 0 1 0 0 0 (*) (D)
Asia and Pacific 5,266 -21 459 0 -804 1,695 124 8,900 Australia 398 -2 35 0 (D) (D) 13 -615 China -153 1 (D) 0 1 2 -46 (D) Hong Kong 453 3 39 0 5 (D) (D) 402 India (D) 0 -9 0 (*) 0 264 (D) Japan 2,304 -5 419 0 (D) (D) (D) 1,330 Korea, Republic of 1,859 0 -2 0 (*) 0 2 (D) Malaysia 15 0 2 0 -2 5 33 18 New Zealand (D) 0 (D) 0 -2 (*) 2 4 Singapore 798 0 -23 0 (D) (D) -7 2,515 Taiwan -205 (D) (D) 0 -1 (*) -1 (D) Other (D) (D) (D) 0 -1 (D) 7 2,974
Addenda: European Union (28) -6,137 (D) (D) 0 1,863 -1,182 287 -499 OPEC (D) 0 2 0 (D) (*) -1 584
Legend / Footnotes: Note. Inflows increase the foreign direct investment position in the United States, while outflows decrease it.
59

Bureau of Economic AnalysisTable 12.2. Foreign Direct Investment in the United States: Debt Instruments, 2015[Millions of dollars; inflows (+), outflows (-)]Release Date: July 24, 2017
All industries
Manufacturing
Total Food Chemicals Primary and fabricated metals
Machinery Computers
and electronic products
Electrical equipment,
appliances, and components
Transportation equipment
Other manufacturing
All countries 86,524 82,350 10,221 28,593 910 10,884 2,017 -3,956 10,033 23,647 Canada -632 129 404 (D) 1,141 375 -65 18 -1,362 (D) Europe 84,443 77,878 11,234 23,984 -249 10,980 487 -3,929 11,853 23,518
Austria -316 -220 (*) (D) -25 -115 3 (D) -4 (D) Belgium -10,691 -4,671 (D) -3,602 2 (D) (D) (D) (D) (D) Denmark 237 578 (D) -36 (D) (D) (D) (*) (*) 157 Finland 195 113 0 (D) (D) -63 (D) (*) (D) (D) France 1,689 304 8 -1,542 (D) 46 835 (D) 844 13 Germany 8,440 9,342 3 -1,550 -130 2,012 -60 (D) 7,411 (D) Ireland -233 -1,512 (D) -3,713 (D) (D) (*) (D) 0 (D) Italy 126 770 4 -42 46 228 (D) (D) (D) 216 Luxembourg 60,643 57,434 (D) (D) -133 (D) (D) 0 143 1,643 Netherlands 15,589 2,412 463 -7,587 -54 (D) 1,219 (D) -437 (D) Norway 359 670 0 (D) (D) -1 (D) (D) (D) (D) Spain 2,112 1,799 (D) (D) (D) (D) (D) 1 (*) 26 Sweden 1,762 1,370 1 -528 -410 122 3 (D) (D) (D) Switzerland -10,440 -5,327 (D) -1,416 35 -111 37 14 (D) -2,865 United Kingdom 20,354 19,677 (D) -1,257 191 -114 280 (D) 2,291 18,678 Other -5,382 -4,861 (D) -1,259 -49 -20 -6 (D) -73 -18
Latin America and Other Western Hemisphere -644 988 -800 686 133 -79 697 7 -368 712 South and Central America -2,057 -338 343 (D) (D) (D) (D) 7 (D) -545
Brazil -821 362 (D) -52 38 -24 85 13 (D) (D) Mexico -510 -307 53 (D) 69 55 14 (D) -379 (D) Panama -14 (D) 0 (D) (*) 1 0 0 1 (D) Venezuela -527 (D) (D) -12 1 (D) (D) (D) (D) (D) Other -184 158 -6 (D) (D) -3 3 (D) (D) (D)
Other Western Hemisphere 1,413 1,326 -1,144 (D) (D) (D) (D) 0 (D) 1,258 Bahamas (D) (D) 0 (D) 0 0 0 0 0 (*) Bermuda -2,568 387 (D) 944 0 (D) (D) 0 0 (D) Curacao 62 (D) 0 (D) 0 0 0 0 0 (D) United Kingdom Islands, Caribbean 3,876 1,070 (D) 2 (D) 1 (D) 0 (D) (D) Other (D) (D) -1 (D) (*) 0 (D) 0 0 (D)
Africa -59 59 -6 -62 (D) (D) (D) (D) 8 (D) South Africa -133 -42 (*) (D) (D) (D) (*) 1 8 (D) Other 74 101 -6 (D) 0 (*) (D) (D) (*) (D)
Middle East 1,929 1,902 (*) (D) (D) (D) (D) (D) 2 (D) Israel 1,804 (D) (*) (D) 0 (*) (D) 1 (*) (D) Kuwait -7 (D) 0 0 0 0 0 0 0 (D) Lebanon 4 1 0 0 0 0 0 0 1 0 Saudi Arabia (D) (D) (*) (D) (D) -3 (D) (D) 0 0 United Arab Emirates 142 (D) 0 -27 (D) (D) (D) (D) (*) (D) Other (D) (D) 0 (D) 0 (D) 0 0 0 (D)
Asia and Pacific 1,488 1,394 -610 1,376 -159 -323 760 -60 -99 510 Australia -1,383 189 (D) 67 22 20 2 -1 -46 (D) China 4,320 604 1 28 34 -273 (D) (D) -85 545 Hong Kong 432 (D) (D) (D) 1 -2 (D) (D) 1 (D) India -405 -284 (D) -372 (*) -27 (D) (D) 4 (D) Japan -1,932 1,526 (D) 1,544 -24 -81 12 53 -42 (D) Korea, Republic of -1,711 -34 (*) (D) 22 (D) 5 -6 -10 17 Malaysia 117 97 (D) -1 (D) -30 (D) -1 4 3 New Zealand -253 (D) -1 3 (D) (*) 1 (*) (D) 3 Singapore 1,124 (D) (D) 89 -7 127 (D) (D) (D) -217 Taiwan 257 129 1 (D) -4 7 1 (D) 6 58 Other 923 377 13 -13 -11 (D) (D) (D) (D) -12
Addenda: European Union (28) 95,315 83,397 12,204 26,245 -529 11,093 460 (D) 11,915 (D) OPEC -240 (D) -5 (D) (D) 16 -27 (D) (D) (D)
Continues on next page
60

Bureau of Economic AnalysisTable 12.2. Foreign Direct Investment in the United States: Debt Instruments, 2015[Millions of dollars; inflows (+), outflows (-)]Release Date: July 24, 2017
Wholesale trade
Retail trade
-974
Information Depository institutions
Finance (except
depository institutions)
and insurance
Real estate and
rental and
leasing
Professional, scientific,
and technical services
Other industries
All countries -12,550 7,336 (*) -2,537 820 2,655 9,424 Canada -350 (D) (D) 0 -488 308 189 690 Europe -6,736 170 7,060 0 -1,377 -373 2,697 5,123
Austria -28 (D) 2 0 (D) (D) -1 (D) Belgium -5,208 (D) (D) 0 (D) (D) -27 -52 Denmark -258 0 (*) 0 (*) (*) 3 -86 Finland 183 0 (D) 0 (*) (*) (D) (D) France -731 (D) (D) 0 775 (D) -31 -54 Germany -813 (D) (D) 0 549 397 (D) -798 Ireland (D) (*) (D) 0 -168 (D) (D) 183 Italy -54 -94 -4 0 (D) (D) -3 (D) Luxembourg 713 (D) 535 0 -424 (D) (D) 1,346 Netherlands 1,283 (D) (D) 0 1,645 -211 (D) 9,417 Norway (D) (*) 1 0 (*) (*) (D) (D) Spain 3 (D) 50 0 (D) (D) (D) (D) Sweden (D) (D) 34 0 3 (*) -7 (D) Switzerland -1,100 (D) (D) 0 -3,131 (D) (D) -4,114 United Kingdom -899 86 829 0 -772 1,924 13 -505 Other (D) (D) (D) 0 6 (D) 85 -427
Latin America and Other Western Hemisphere -2,553 (D) 287 (*) (D) -304 44 1,817
South and Central America -1,823 (D) (D) 0 (D) (D) 50 -151 Brazil -1,182 -2 12 0 -1 (D) 30 (D) Mexico -249 -10 (D) 0 (D) (*) 14 (D) Panama -22 (D) 1 0 0 8 (*) (D) Venezuela (D) 0 (*) 0 (*) 0 -2 (D) Other (D) (D) -1 0 (D) (*) 8 1
Other Western Hemisphere -730 -523 (D) (*) -395 (D) -6 1,969 Bahamas (D) 0 0 0 0 (D) (*) (D) Bermuda (D) 0 -1 0 -888 (D) -13 (D) Curacao (D) (D) 0 (*) 0 5 (*) (D) United Kingdom Islands, Caribbean 586 (D) 0 0 454 -286 (D) (D) Other (D) (D) (D) 0 38 (D) (D) (D)
Africa (D) 0 4 0 (D) 0 (D) (D) South Africa (D) 0 4 0 (D) 0 20 (D) Other (D) 0 0 0 0 0 (D) (D)
Middle East (D) 0 (D) 0 (D) 7 (D) 74 Israel -47 0 (D) 0 (*) 7 (D) (D) Kuwait 0 0 0 0 0 0 0 (D) Lebanon (*) 0 0 0 3 0 (*) 0 Saudi Arabia (D) 0 0 0 0 0 -4 29 United Arab Emirates (D) 0 (*) 0 (D) (*) -13 50 Other (D) 0 0 0 1 0 (D) (D)
Asia and Pacific -2,722 (D) 91 (*) -312 1,182 -331 (D) Australia -180 2 15 0 -227 (D) 4 (D) China 1,172 -2 (D) 0 (*) (D) -118 1,718 Hong Kong 523 (D) (D) 0 -37 (D) 68 -138 India (D) 0 2 0 (*) (*) -237 (D) Japan -4,046 (D) (D) 0 -177 593 -36 (D) Korea, Republic of -1,928 0 4 0 (D) (D) -6 (D) Malaysia 53 0 -1 0 (*) (*) -22 -11 New Zealand -77 0 -1 0 (*) (*) -1 (D) Singapore 1,820 (*) 26 0 (D) (D) (D) 31 Taiwan -53 -5 (D) 0 3 (*) (*) (D) Other (D) -2 (D) (*) (*) (*) (D) 472
Addenda: European Union (28) -5,829 501 (D) 0 1,747 (D) 2,676 (D) OPEC (D) 0 (*) 0 (D) (*) -11 185
Legend / Footnotes: Note. Inflows increase the foreign direct investment position in the United States, while outflows decrease it.
61

Bureau of Economic AnalysisTable 12.3. Foreign Direct Investment in the United States: Debt Instruments, 2016[Millions of dollars; inflows (+), outflows (-)]Release Date: July 24, 2017
All industries
Manufacturing
Total Food Chemicals Primary and fabricated metals
Machinery Computers
and electronic products
Electrical equipment,
appliances, and components
Transportation equipment
Other manufacturing
All countries 116,561 57,361 -469 51,310 -2,007 -3,610 -1,378 -201 -727 14,442 Canada 1,316 -1,512 53 -689 -603 -250 153 -38 -369 231 Europe 110,392 58,152 -1,277 53,646 -1,663 -3,139 -1,530 -455 -799 13,370
Austria 3,037 55 -2 (D) 16 (D) -1 (*) 3 (D) Belgium 1,806 -152 (D) 667 (D) -534 (*) (D) (D) 240 Denmark 843 191 (D) (D) (D) 10 (D) 3 (*) 146 Finland -245 (D) 0 (D) (D) -116 -6 (*) -3 (D) France 10,131 5,806 3 6,034 -10 45 -1,371 -37 -96 1,238 Germany -2,077 -3,000 -2 346 -471 (D) -16 (D) -1,081 -447 Ireland 3,682 13,138 (D) 13,192 188 (D) (*) (D) (*) (D) Italy 638 422 5 96 (*) -215 (D) 6 (D) 215 Luxembourg 34,551 7,004 (D) 1,703 -27 -107 (D) 0 (D) 4,280 Netherlands 806 -1,161 (D) 3,234 18 (D) (D) -20 -128 -1,907 Norway -11 (D) 0 (D) (D) -2 (D) 3 (D) -5 Spain -308 137 (D) 210 (D) (D) -15 2 4 7 Sweden -126 718 1 (D) 180 234 1 (D) (D) (D) Switzerland 40,503 22,791 (D) (D) -53 (D) 420 (D) (D) -46 United Kingdom 15,478 11,439 -53 3,167 -817 -43 147 -15 -176 9,228 Other 1,684 (D) (D) (D) (D) (D) 6 (D) -20 63
Latin America and Other Western Hemisphere 4,390 608 782 (D) 38 (D) -448 46 (D) 639 South and Central America -1,010 -11 (D) 507 (D) -71 (D) 46 (D) (D)
Brazil -2,638 (D) (D) 6 -56 1 -13 (D) -114 (D) Mexico 1,019 378 -91 (D) (D) -22 -241 14 171 131 Panama 84 (D) 0 (D) (*) -7 0 0 (*) (D) Venezuela 329 (D) 0 (D) (D) (D) 1 (D) (D) (D) Other 195 -49 (D) (D) 3 (D) (D) (D) (D) -124
Other Western Hemisphere 5,400 619 (D) (D) (D) (D) (D) 0 0 (D) Bahamas -8 (D) 0 0 0 0 0 0 0 (D) Bermuda 7,955 (D) (D) -799 0 (D) (D) 0 0 (D) Curacao 56 (D) 0 -2 0 0 0 0 0 (D) United Kingdom Islands, Caribbean -2,567 -265 (D) (D) (D) -1 (D) 0 0 (D) Other -35 -90 1 (D) (*) (D) (D) 0 0 (D)
Africa -83 (D) -3 (D) (D) (D) (D) (D) (D) (D) South Africa 28 (D) (D) 28 1 (D) -3 (*) (D) -51 Other -111 -145 (D) (D) (D) (D) (D) (D) -1 (D)
Middle East -1,368 (D) (D) (D) (D) 64 (D) (D) (*) -24 Israel -1,263 -1,193 (D) (D) 0 (D) (D) (*) 0 (D) Kuwait 1 1 0 0 0 0 0 0 0 1 Lebanon (D) (*) 0 0 0 0 0 0 0 (*) Saudi Arabia (D) (D) 0 (D) (D) 3 (*) (*) 0 (D) United Arab Emirates -308 (D) (D) (D) -6 (D) -1 (D) (*) (D) Other (D) (D) 0 (D) 0 (*) 0 0 0 (D)
Asia and Pacific 1,913 1,915 (D) -5 229 -190 578 242 429 (D) Australia -1,023 56 (D) 16 254 -2 14 (*) 10 (D) China -449 709 -19 19 -44 10 31 47 (D) (D) Hong Kong 459 (D) (D) (D) (*) -7 (D) (D) (D) 67 India -13 54 (D) 126 1 22 -81 5 -33 (D) Japan 2,376 213 -36 -314 -54 -47 400 21 410 -168 Korea, Republic of -1,479 -125 (*) (D) 53 -153 6 1 -4 (D) Malaysia -158 -207 (D) (*) (D) -2 (D) (*) (*) (D) New Zealand -15 (D) 1 (D) (D) (D) (*) (*) 3 (D) Singapore 1,546 890 (D) 116 5 3 276 44 (D) (D) Taiwan 31 9 (*) (D) 2 -1 -23 (D) 3 (D) Other 639 228 (D) 14 11 (D) (D) (D) -30 (D)
Addenda: European Union (28) 67,985 33,757 -1,299 28,143 -980 -2,313 -1,950 (D) -793 (D) OPEC 306 (D) (D) (D) (D) (D) 2 (D) (D) (D)
Continues on next page
62
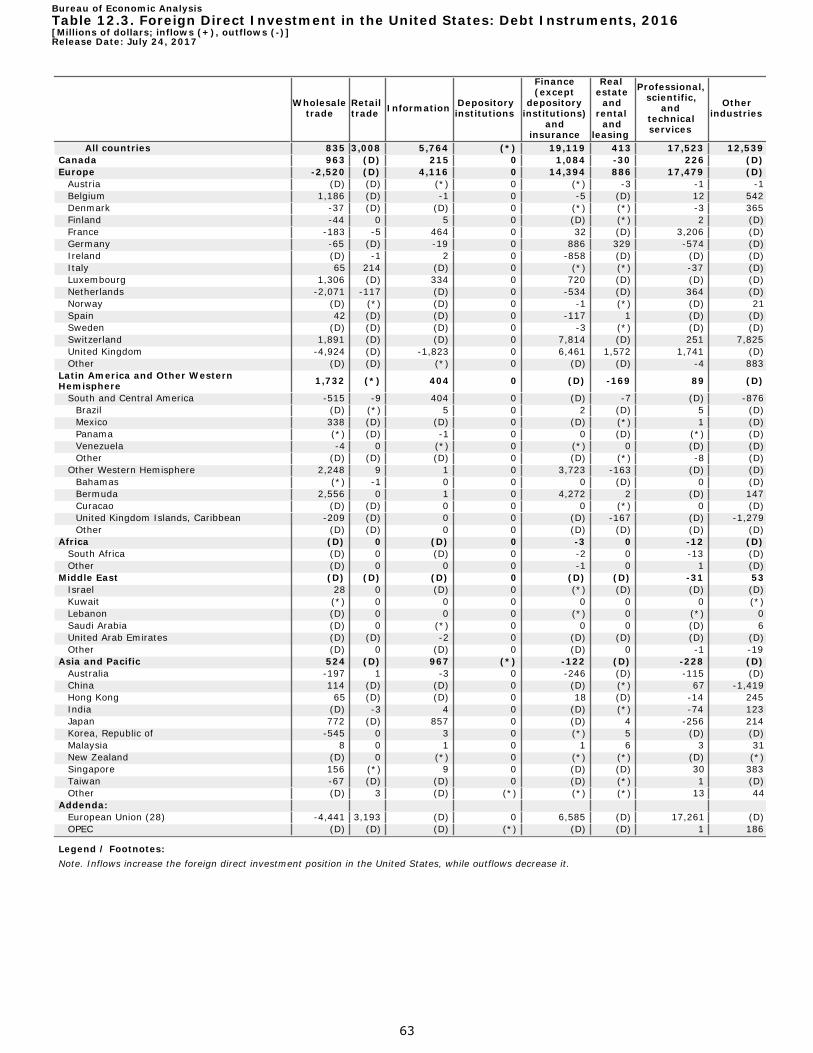
Bureau of Economic AnalysisTable 12.3. Foreign Direct Investment in the United States: Debt Instruments, 2016[Millions of dollars; inflows (+), outflows (-)]Release Date: July 24, 2017
Wholesale trade
Retail trade
3,008
Information Depository institutions
Finance (except
depository institutions)
and insurance
Real estate and
rental and
leasing
Professional, scientific,
and technical services
Other industries
All countries 835 5,764 (*) 19,119 413 17,523 12,539 Canada 963 (D) 215 0 1,084 -30 226 (D) Europe -2,520 (D) 4,116 0 14,394 886 17,479 (D)
Austria (D) (D) (*) 0 (*) -3 -1 -1 Belgium 1,186 (D) -1 0 -5 (D) 12 542 Denmark -37 (D) (D) 0 (*) (*) -3 365 Finland -44 0 5 0 (D) (*) 2 (D) France -183 -5 464 0 32 (D) 3,206 (D) Germany -65 (D) -19 0 886 329 -574 (D) Ireland (D) -1 2 0 -858 (D) (D) (D) Italy 65 214 (D) 0 (*) (*) -37 (D) Luxembourg 1,306 (D) 334 0 720 (D) (D) (D) Netherlands -2,071 -117 (D) 0 -534 (D) 364 (D) Norway (D) (*) (D) 0 -1 (*) (D) 21 Spain 42 (D) (D) 0 -117 1 (D) (D) Sweden (D) (D) (D) 0 -3 (*) (D) (D) Switzerland 1,891 (D) (D) 0 7,814 (D) 251 7,825 United Kingdom -4,924 (D) -1,823 0 6,461 1,572 1,741 (D) Other (D) (D) (*) 0 (D) (D) -4 883
Latin America and Other Western Hemisphere 1,732 (*) 404 0 (D) -169 89 (D)
South and Central America -515 -9 404 0 (D) -7 (D) -876 Brazil (D) (*) 5 0 2 (D) 5 (D) Mexico 338 (D) (D) 0 (D) (*) 1 (D) Panama (*) (D) -1 0 0 (D) (*) (D) Venezuela -4 0 (*) 0 (*) 0 (D) (D) Other (D) (D) (D) 0 (D) (*) -8 (D)
Other Western Hemisphere 2,248 9 1 0 3,723 -163 (D) (D) Bahamas (*) -1 0 0 0 (D) 0 (D) Bermuda 2,556 0 1 0 4,272 2 (D) 147 Curacao (D) (D) 0 0 0 (*) 0 (D) United Kingdom Islands, Caribbean -209 (D) 0 0 (D) -167 (D) -1,279 Other (D) (D) 0 0 (D) (D) (D) (D)
Africa (D) 0 (D) 0 -3 0 -12 (D) South Africa (D) 0 (D) 0 -2 0 -13 (D) Other (D) 0 0 0 -1 0 1 (D)
Middle East (D) (D) (D) 0 (D) (D) -31 53 Israel 28 0 (D) 0 (*) (D) (D) (D) Kuwait (*) 0 0 0 0 0 0 (*) Lebanon (D) 0 0 0 (*) 0 (*) 0 Saudi Arabia (D) 0 (*) 0 0 0 (D) 6 United Arab Emirates (D) (D) -2 0 (D) (D) (D) (D) Other (D) 0 (D) 0 (D) 0 -1 -19
Asia and Pacific 524 (D) 967 (*) -122 (D) -228 (D) Australia -197 1 -3 0 -246 (D) -115 (D) China 114 (D) (D) 0 (D) (*) 67 -1,419 Hong Kong 65 (D) (D) 0 18 (D) -14 245 India (D) -3 4 0 (D) (*) -74 123 Japan 772 (D) 857 0 (D) 4 -256 214 Korea, Republic of -545 0 3 0 (*) 5 (D) (D) Malaysia 8 0 1 0 1 6 3 31 New Zealand (D) 0 (*) 0 (*) (*) (D) (*) Singapore 156 (*) 9 0 (D) (D) 30 383 Taiwan -67 (D) (D) 0 (D) (*) 1 (D) Other (D) 3 (D) (*) (*) (*) 13 44
Addenda: European Union (28) -4,441 3,193 (D) 0 6,585 (D) 17,261 (D) OPEC (D) (D) (D) (*) (D) (D) 1 186
Legend / Footnotes: Note. Inflows increase the foreign direct investment position in the United States, while outflows decrease it.
63
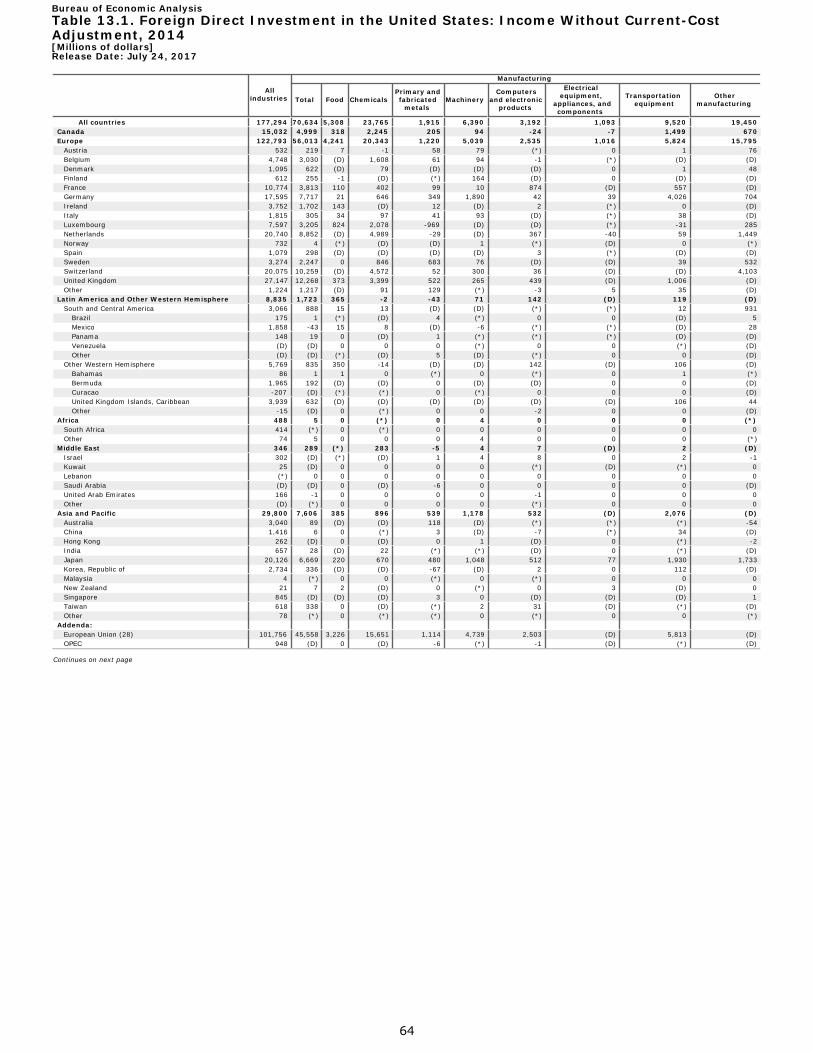
Bureau of Economic AnalysisTable 13.1. Foreign Direct Investment in the United States: Income Without Current-CostAdjustment, 2014[Millions of dollars]Release Date: July 24, 2017
All industries
Manufacturing
Total Food Chemicals Primary and fabricated metals
Machinery Computers
and electronic products
Electrical equipment,
appliances, and components
Transportation equipment
Other manufacturing
All countries 177,294 70,634 5,308 23,765 1,915 6,390 3,192 1,093 9,520 19,450 Canada 15,032 4,999 318 2,245 205 94 -24 -7 1,499 670 Europe 122,793 56,013 4,241 20,343 1,220 5,039 2,535 1,016 5,824 15,795
Austria 532 219 7 -1 58 79 (*) 0 1 76 Belgium 4,748 3,030 (D) 1,608 61 94 -1 (*) (D) (D) Denmark 1,095 622 (D) 79 (D) (D) (D) 0 1 48 Finland 612 255 -1 (D) (*) 164 (D) 0 (D) (D) France 10,774 3,813 110 402 99 10 874 (D) 557 (D) Germany 17,595 7,717 21 646 349 1,890 42 39 4,026 704 Ireland 3,752 1,702 143 (D) 12 (D) 2 (*) 0 (D) Italy 1,815 305 34 97 41 93 (D) (*) 38 (D) Luxembourg 7,597 3,205 824 2,078 -969 (D) (D) (*) -31 285 Netherlands 20,740 8,852 (D) 4,989 -29 (D) 367 -40 59 1,449 Norway 732 4 (*) (D) (D) 1 (*) (D) 0 (*) Spain 1,079 298 (D) (D) (D) (D) 3 (*) (D) (D) Sweden 3,274 2,247 0 846 683 76 (D) (D) 39 532 Switzerland 20,075 10,259 (D) 4,572 52 300 36 (D) (D) 4,103 United Kingdom 27,147 12,268 373 3,399 522 265 439 (D) 1,006 (D) Other 1,224 1,217 (D) 91 129 (*) -3 5 35 (D)
Latin America and Other Western Hemisphere 8,835 1,723 365 -2 -43 71 142 (D) 119 (D) South and Central America 3,066 888 15 13 (D) (D) (*) (*) 12 931
Brazil 175 1 (*) (D) 4 (*) 0 0 (D) 5 Mexico 1,858 -43 15 8 (D) -6 (*) (*) (D) 28 Panama 148 19 0 (D) 1 (*) (*) (*) (D) (D) Venezuela (D) (D) 0 0 0 (*) 0 0 (*) (D) Other (D) (D) (*) (D) 5 (D) (*) 0 0 (D)
Other Western Hemisphere 5,769 835 350 -14 (D) (D) 142 (D) 106 (D) Bahamas 86 1 1 0 (*) 0 (*) 0 1 (*) Bermuda 1,965 192 (D) (D) 0 (D) (D) 0 0 (D) Curacao -207 (D) (*) (*) 0 (*) 0 0 0 (D) United Kingdom Islands, Caribbean 3,939 632 (D) (D) (D) (D) (D) (D) 106 44 Other -15 (D) 0 (*) 0 0 -2 0 0 (D)
Africa 488 5 0 (*) 0 4 0 0 0 (*) South Africa 414 (*) 0 (*) 0 0 0 0 0 0 Other 74 5 0 0 0 4 0 0 0 (*)
Middle East 346 289 (*) 283 -5 4 7 (D) 2 (D) Israel 302 (D) (*) (D) 1 4 8 0 2 -1 Kuwait 25 (D) 0 0 0 0 (*) (D) (*) 0 Lebanon (*) 0 0 0 0 0 0 0 0 0 Saudi Arabia (D) (D) 0 (D) -6 0 0 0 0 (D) United Arab Emirates 166 -1 0 0 0 0 -1 0 0 0 Other (D) (*) 0 0 0 0 (*) 0 0 0
Asia and Pacific 29,800 7,606 385 896 539 1,178 532 (D) 2,076 (D) Australia 3,040 89 (D) (D) 118 (D) (*) (*) (*) -54 China 1,416 6 0 (*) 3 (D) -7 (*) 34 (D) Hong Kong 262 (D) 0 (D) 0 1 (D) 0 (*) -2 India 657 28 (D) 22 (*) (*) (D) 0 (*) (D) Japan 20,126 6,669 220 670 480 1,048 512 77 1,930 1,733 Korea, Republic of 2,734 336 (D) (D) -67 (D) 2 0 112 (D) Malaysia 4 (*) 0 0 (*) 0 (*) 0 0 0 New Zealand 21 7 2 (D) 0 (*) 0 3 (D) 0 Singapore 845 (D) (D) (D) 3 0 (D) (D) (D) 1 Taiwan 618 338 0 (D) (*) 2 31 (D) (*) (D) Other 78 (*) 0 (*) (*) 0 (*) 0 0 (*)
Addenda: European Union (28) 101,756 45,558 3,226 15,651 1,114 4,739 2,503 (D) 5,813 (D) OPEC 948 (D) 0 (D) -6 (*) -1 (D) (*) (D)
Continues on next page
64

Bureau of Economic AnalysisTable 13.1. Foreign Direct Investment in the United States: Income Without Current-CostAdjustment, 2014[Millions of dollars]Release Date: July 24, 2017
Wholesale trade
Retail trade
4,335
Information Depository institutions
Finance (except
depository institutions)
and insurance
Real estate and
rental and
leasing
Professional, scientific,
and technical services
Other industries
All countries 20,769 3,608 11,357 27,824 2,941 3,682 32,144 Canada 569 490 178 2,585 587 603 181 4,841 Europe 10,954 3,507 3,206 4,706 20,796 2,047 2,303 19,261
Austria 29 (D) (D) (D) (D) 4 (D) (D) Belgium 359 (D) (D) (D) (D) 1 26 692 Denmark 542 (*) (*) 0 (*) 4 -1 -71 Finland 46 0 (D) (D) 0 (*) 2 (D) France 1,168 632 153 1,348 2,191 32 236 1,202 Germany 1,762 (D) 1,505 506 4,152 406 (D) 1,233 Ireland (D) (*) 24 30 673 (D) (D) 96 Italy 56 45 3 (D) 58 6 56 (D) Luxembourg 753 (D) -638 0 1,853 171 (D) 1,748 Netherlands 1,680 418 377 (D) 5,414 (D) 439 3,392 Norway (D) 0 (*) (D) 3 -4 91 (D) Spain (D) (D) 10 633 -379 27 59 376 Sweden 457 1 -20 55 3 (D) (D) (D) Switzerland (D) (D) (D) (D) 3,102 72 -52 2,948 United Kingdom 1,339 314 919 (D) 3,691 795 726 (D) Other (D) (D) 19 45 (D) -73 2 -53
Latin America and Other Western Hemisphere 623 (D) (D) 289 2,269 -75 (D) 3,927
South and Central America 60 (D) 190 232 62 52 (D) (D) Brazil 16 (*) 1 139 33 (D) (*) (D) Mexico 41 19 (D) -63 26 (*) -2 (D) Panama 1 (*) 0 (D) 3 59 -1 (D) Venezuela (*) (*) (*) 46 (D) 1 (*) (*) Other 3 (D) (D) (D) (D) (D) (D) (D)
Other Western Hemisphere 563 -70 (D) 57 2,208 -127 (*) (D) Bahamas (D) 0 0 (D) (D) -6 -1 72 Bermuda -113 1 -1 0 601 10 -10 1,285 Curacao (D) 0 1 -3 (D) -49 (D) -73 United Kingdom Islands, Caribbean 783 -71 -67 (D) 1,581 -76 13 (D) Other (D) (*) (D) (*) 0 -5 (D) -28
Africa (D) 0 -2 (D) (*) 11 (D) 31 South Africa (D) 0 (*) 0 0 (*) (D) (D) Other (D) 0 -2 (D) (*) 11 (D) (D)
Middle East (D) (D) (D) (D) 90 32 -2 (D) Israel 15 (D) 28 40 (D) 5 -1 -37 Kuwait 0 0 (*) 5 -2 21 0 (D) Lebanon (*) 0 0 0 0 2 (*) -2 Saudi Arabia (D) 0 (*) (D) 0 -1 (*) (D) United Arab Emirates -3 0 (*) (D) (D) 4 (*) 30 Other -3 (D) (D) 10 -1 1 (*) (D)
Asia and Pacific 8,490 (D) 343 (D) 4,082 324 830 (D) Australia 55 5 -15 367 -3 4 153 2,385 China 8 1 18 804 (D) 1 13 (D) Hong Kong -19 (*) (D) 68 3 3 (D) (D) India 1 0 -3 145 (D) (*) 392 (D) Japan 6,330 (D) 307 1,934 3,209 312 250 (D) Korea, Republic of 1,999 (*) -12 84 45 3 10 267 Malaysia (D) 0 (*) (D) (*) -1 (*) -3 New Zealand 14 (*) 0 0 (*) (*) (*) (*) Singapore 10 5 -25 81 (D) -3 (*) 111 Taiwan 79 5 (D) 160 6 2 -3 (D) Other (D) (*) (*) (D) (*) 3 (D) 19
Addenda: European Union (28) 8,246 3,010 (D) (D) 17,690 1,987 2,262 16,357 OPEC (D) (*) (D) 82 109 26 (*) 73
65

Bureau of Economic AnalysisTable 13.2. Foreign Direct Investment in the United States: Income Without Current-CostAdjustment, 2015[Millions of dollars]Release Date: July 24, 2017
All industries
Manufacturing
Total Food Chemicals Primary and fabricated metals
Machinery Computers
and electronic products
Electrical equipment,
appliances, and components
Transportation equipment
Other manufacturing
All countries 148,335 59,998 3,885 29,842 1,169 4,841 1,988 2,164 8,444 7,665 Canada 15,941 4,791 365 3,280 46 42 77 -1 322 658 Europe 99,497 45,696 2,282 25,588 972 3,456 1,951 2,118 5,814 3,515
Austria 506 169 5 (*) 22 83 (*) 0 (*) 58 Belgium 4,529 3,165 (D) 1,450 -5 143 (*) (*) 6 (D) Denmark 1,026 378 (D) 43 (D) (D) (D) 0 1 20 Finland 398 133 (D) (D) (*) 79 (D) 0 (D) (D) France 15,874 7,845 267 3,910 -86 -19 1,204 (D) 411 (D) Germany 12,731 7,199 20 336 245 1,587 63 21 4,097 830 Ireland 4,826 1,827 103 1,438 (D) (D) 1 0 0 (D) Italy 516 460 47 100 17 184 (D) 3 37 (D) Luxembourg 8,750 5,580 216 3,921 -172 -1 (D) (*) -37 (D) Netherlands 16,450 8,263 259 5,520 63 (D) 421 (D) -59 869 Norway 72 (D) (*) (D) (D) (*) (*) -3 0 (*) Spain 2,109 370 169 (D) (D) (D) 2 (*) (D) (D) Sweden 2,490 1,631 0 169 422 232 (D) (D) 168 639 Switzerland 18,487 8,560 (D) 5,009 -33 326 18 (D) 5 2,269 United Kingdom 9,348 -1,102 186 2,955 400 265 220 (D) 1,026 (D) Other 1,385 (D) 111 591 -187 (*) (*) (D) 35 361
Latin America and Other Western Hemisphere 8,610 2,321 466 (D) (D) (D) 115 (D) 21 1,299 South and Central America 2,623 1,255 156 50 -64 -4 (*) (*) 8 1,109
Brazil 58 10 1 (D) (D) 1 (*) 0 (D) (D) Mexico 1,358 196 155 (D) -35 -4 (*) (*) (D) 73 Panama 301 (D) 0 (*) (D) (*) (*) (*) 1 (D) Venezuela (D) (D) 0 0 0 (*) 0 0 0 (D) Other (D) 15 (*) (D) (D) (*) (*) 0 0 (D)
Other Western Hemisphere 5,987 1,067 311 (D) (D) (D) 115 (D) 12 190 Bahamas 49 1 1 0 (D) 0 (*) 0 (*) (D) Bermuda 2,716 641 (D) -7 0 (D) (D) 0 0 (D) Curacao -22 (D) (*) (*) 0 (*) 0 0 0 (D) United Kingdom Islands, Caribbean 3,161 406 (D) 3 4 8 (D) (D) 12 42 Other 84 (D) 0 (D) 0 0 4 0 0 (*)
Africa 189 (D) 0 (D) 0 3 0 0 0 (*) South Africa (D) (D) 0 (D) 0 0 0 0 0 0 Other (D) 4 0 0 0 3 0 0 0 (*)
Middle East 516 (D) 2 -210 (D) 3 6 (*) 3 -2 Israel -90 -205 2 (D) 1 3 6 0 3 (D) Kuwait 66 (*) 0 0 0 0 (*) (*) (*) 0 Lebanon 1 0 0 0 0 0 0 0 0 0 Saudi Arabia (D) (D) 0 (D) (D) 0 0 0 0 (D) United Arab Emirates 197 1 0 0 1 0 (*) 0 0 0 Other (D) (*) 0 0 0 0 (*) 0 0 0
Asia and Pacific 23,582 7,174 770 901 237 (D) -160 (D) 2,284 2,194 Australia 914 577 523 (D) 66 9 (*) (*) (*) (D) China 691 18 0 1 -8 -7 (D) 1 59 (D) Hong Kong -286 (D) -2 (D) 0 1 (D) 0 -1 (*) India 477 36 (D) 45 (*) (*) (D) 0 (*) (D) Japan 18,380 6,410 167 773 177 629 440 70 2,235 1,919 Korea, Republic of 1,993 406 (D) (D) (*) (D) 1 0 105 -9 Malaysia (*) (*) 0 0 (*) (*) (*) 0 0 0 New Zealand -64 (D) 1 -4 0 (*) 0 2 (D) 0 Singapore 866 (D) (D) 5 2 1 (D) (D) (D) (*) Taiwan 554 287 0 (D) (*) (*) 3 (D) (*) (D) Other 58 (*) (*) (*) (*) 0 (*) 0 0 (*)
Addenda: European Union (28) 80,186 36,489 1,453 19,933 1,011 3,130 1,933 (D) 5,801 (D) OPEC 1,448 (D) 0 (D) (D) (*) (*) (*) (*) (D)
Continues on next page
66

Bureau of Economic AnalysisTable 13.2. Foreign Direct Investment in the United States: Income Without Current-CostAdjustment, 2015[Millions of dollars]Release Date: July 24, 2017
Wholesale trade
Retail trade
5,083
Information Depository institutions
Finance (except
depository institutions)
and insurance
Real estate and
rental and
leasing
Professional, scientific,
and technical services
Other industries
All countries 19,237 3,723 9,046 24,121 3,841 5,198 18,090 Canada 1,304 925 338 2,902 1,950 797 447 2,488 Europe 10,138 3,778 3,613 2,548 14,787 2,190 3,767 12,981
Austria (D) (D) (*) (D) (*) 2 2 1 Belgium 560 (D) (D) (D) (D) 2 17 230 Denmark 629 (*) (*) 0 (*) -2 (D) (D) Finland 130 0 (D) (D) 0 (*) 2 (D) France 1,125 (D) 391 1,303 2,258 55 1,179 (D) Germany 1,377 (D) 1,455 -539 1,684 322 (D) 1,136 Ireland -21 (*) (D) 50 687 (D) 1,350 76 Italy 110 49 4 (D) 57 2 62 (D) Luxembourg 884 36 -610 0 1,353 75 198 1,234 Netherlands 1,541 506 1,206 (D) 1,016 -194 658 (D) Norway (D) 0 (*) (D) (*) -5 21 -27 Spain 20 8 6 685 350 25 (D) (D) Sweden 554 3 -12 64 1 (D) (D) (D) Switzerland 1,761 (D) (D) (D) 3,791 85 -64 3,071 United Kingdom 1,610 350 386 192 3,572 1,005 925 2,410 Other (D) (D) 15 43 (D) (D) 2 253
Latin America and Other Western Hemisphere 367 (D) (D) 20 2,956 253 197 2,470
South and Central America -26 (D) (D) -93 33 106 -6 1,238 Brazil -67 (*) 1 90 6 (D) (*) (D) Mexico 15 12 105 (D) 25 15 -4 (D) Panama 1 (*) 0 (D) 2 58 -1 (D) Venezuela (*) (*) (*) -38 (D) (D) (*) (*) Other 24 (D) (D) 83 (D) (D) -1 (D)
Other Western Hemisphere 393 -14 -75 113 2,922 147 203 1,233 Bahamas (D) 0 0 (D) 10 1 (*) (D) Bermuda -42 (*) (D) 0 1,539 43 193 (D) Curacao 2 0 1 (D) 1 22 (D) -50 United Kingdom Islands, Caribbean 432 -15 -88 (D) 1,372 79 16 (D) Other (D) (*) (D) (*) 0 2 (D) (D)
Africa (D) 0 -1 (D) (*) 9 15 -124 South Africa (D) 0 (*) 0 0 (*) (D) (D) Other (D) 0 -1 (D) (*) 9 (D) (D)
Middle East (D) (D) (D) (D) 161 74 -1 56 Israel 14 8 33 69 (D) 5 -1 (D) Kuwait 0 0 (*) 3 (D) 63 0 (D) Lebanon (*) 0 0 0 0 2 (*) -1 Saudi Arabia (D) 0 (*) (D) 0 (*) (*) 1 United Arab Emirates -3 0 (*) (D) 158 2 (*) (D) Other 7 (D) (D) 1 (*) 1 (*) (D)
Asia and Pacific 6,896 368 -85 3,453 4,267 518 773 219 Australia 64 6 -10 297 -105 16 58 13 China 19 1 (D) 771 (D) (D) 8 -25 Hong Kong -33 (*) (D) 84 3 27 (D) (D) India (D) 0 -1 101 (D) (*) (D) (D) Japan 5,265 (D) -87 1,824 3,933 502 240 (D) Korea, Republic of 1,438 (*) -49 86 34 3 7 68 Malaysia 1 0 (*) (D) (*) -1 1 (D) New Zealand (D) (*) 0 0 (*) 1 (*) (*) Singapore 24 (D) -35 83 (D) (*) 3 182 Taiwan 30 4 (D) 177 4 2 -1 (D) Other (D) (*) (*) (D) (*) (D) (*) 11
Addenda: European Union (28) 8,574 3,225 (D) (D) 10,995 2,120 3,808 9,694 OPEC (D) (*) (D) 13 157 67 (*) 77
67

Bureau of Economic AnalysisTable 13.3. Foreign Direct Investment in the United States: Income Without Current-CostAdjustment, 2016[Millions of dollars]Release Date: July 24, 2017
All industries
Manufacturing
Total Food Chemicals Primary and fabricated metals
Machinery Computers
and electronic products
Electrical equipment,
appliances, and components
Transportation equipment
Other manufacturing
All countries 159,749 78,714 6,116 29,358 2,763 4,376 2,727 3,079 9,923 20,372 Canada 16,417 4,954 427 2,674 65 68 120 1 875 725 Europe 115,033 61,837 3,460 25,158 1,922 3,595 2,964 2,914 6,095 15,729
Austria 602 108 6 (*) -24 90 (*) 0 1 35 Belgium 4,647 3,865 (D) 1,488 11 (D) (*) 0 (*) (D) Denmark 1,174 338 (D) 68 (D) 168 (D) 0 1 30 Finland 456 60 (D) (D) (*) 72 3 0 (D) -1 France 11,782 5,310 198 3,014 -191 -16 491 (D) 294 (D) Germany 15,312 9,386 21 1,553 227 1,478 (D) 82 4,265 (D) Ireland 4,711 1,511 (D) 808 (D) (D) 1 0 0 -24 Italy 408 639 84 184 24 259 (D) (*) 34 (D) Luxembourg 14,183 9,215 936 2,886 253 (D) (D) (*) -9 3,662 Netherlands 19,607 11,423 (D) 6,509 64 (D) 723 (D) -89 1,208 Norway -633 (D) (*) 5 (D) (*) (*) (*) 0 (*) Spain 1,561 240 (D) (D) (D) (D) 1 (*) (D) -5 Sweden 2,584 1,666 0 21 431 151 (D) (D) (D) 731 Switzerland 17,752 9,805 (D) 5,063 87 356 (D) (D) (D) 3,378 United Kingdom 19,485 6,978 148 3,283 266 247 131 (D) 1,254 (D) Other 1,401 (D) 314 (D) 117 (*) (*) (D) 21 (D)
Latin America and Other Western Hemisphere 7,906 2,923 1,684 (D) -26 (D) 113 5 8 1,189 South and Central America 1,763 678 236 15 -26 -6 -1 (*) 8 452
Brazil 16 31 1 (D) (D) (*) (*) 0 (D) (D) Mexico 1,225 300 235 (D) -7 -6 (*) (*) (D) 68 Panama 260 (D) 0 (*) (*) (*) (*) (*) (*) (D) Venezuela 196 (D) 0 0 0 (*) 0 0 0 (D) Other 66 -10 (*) (D) (D) (*) (*) 0 (*) -6
Other Western Hemisphere 6,143 2,245 1,448 (D) 1 (D) 114 5 (*) 738 Bahamas -39 1 1 0 (*) 0 (*) 0 (*) (*) Bermuda 1,308 107 (D) (*) 0 (*) 129 0 0 (D) Curacao -71 2 (*) (*) 0 (*) 0 0 0 2 United Kingdom Islands, Caribbean 4,848 2,132 (D) 3 (*) (D) -18 5 (*) (D) Other 96 2 0 (D) 0 0 3 0 0 (D)
Africa 177 (D) 0 (D) 0 (D) 0 0 0 (D) South Africa 177 (D) 0 (D) 0 0 0 0 0 0 Other (*) 3 0 0 0 (D) 0 0 0 (D)
Middle East 1,133 (D) (D) 260 -3 (D) 5 (*) 2 6 Israel 312 183 8 (D) 1 (D) 5 0 2 6 Kuwait 29 (*) 0 0 0 0 (*) (*) (*) 0 Lebanon 1 0 0 0 0 0 0 0 0 0 Saudi Arabia (D) (D) 0 (D) -5 0 0 0 0 (*) United Arab Emirates 236 (D) (D) 0 2 0 (*) 0 0 0 Other (D) (*) 0 0 0 0 (*) 0 0 0
Asia and Pacific 19,083 8,495 (D) 1,110 805 871 -476 159 2,943 (D) Australia 5 551 (D) (D) 307 1 (*) (*) (*) 182 China 27 -74 0 (D) (D) -2 (D) 1 39 -9 Hong Kong -109 (D) -1 (D) 0 1 (D) 3 2 3 India 120 81 (D) 59 (D) (*) -1 0 (*) (D) Japan 16,781 7,962 142 930 475 (D) 530 129 2,804 (D) Korea, Republic of 1,639 590 (D) (D) 30 (D) 1 0 129 (D) Malaysia 4 (*) 0 0 0 0 (*) 0 0 0 New Zealand -145 (D) 1 0 0 (*) 0 2 (D) 0 Singapore 282 -499 (D) -1 1 -1 (D) (D) (D) (*) Taiwan 378 273 0 (D) (*) 1 5 (D) (*) (D) Other 102 (*) 0 (*) (D) 0 (*) 0 0 (D)
Addenda: European Union (28) 97,305 51,497 2,597 19,684 1,718 3,239 3,024 (D) 6,084 (D) OPEC 1,052 (D) (D) (D) -3 (*) (*) (*) (*) (D)
Continues on next page
68
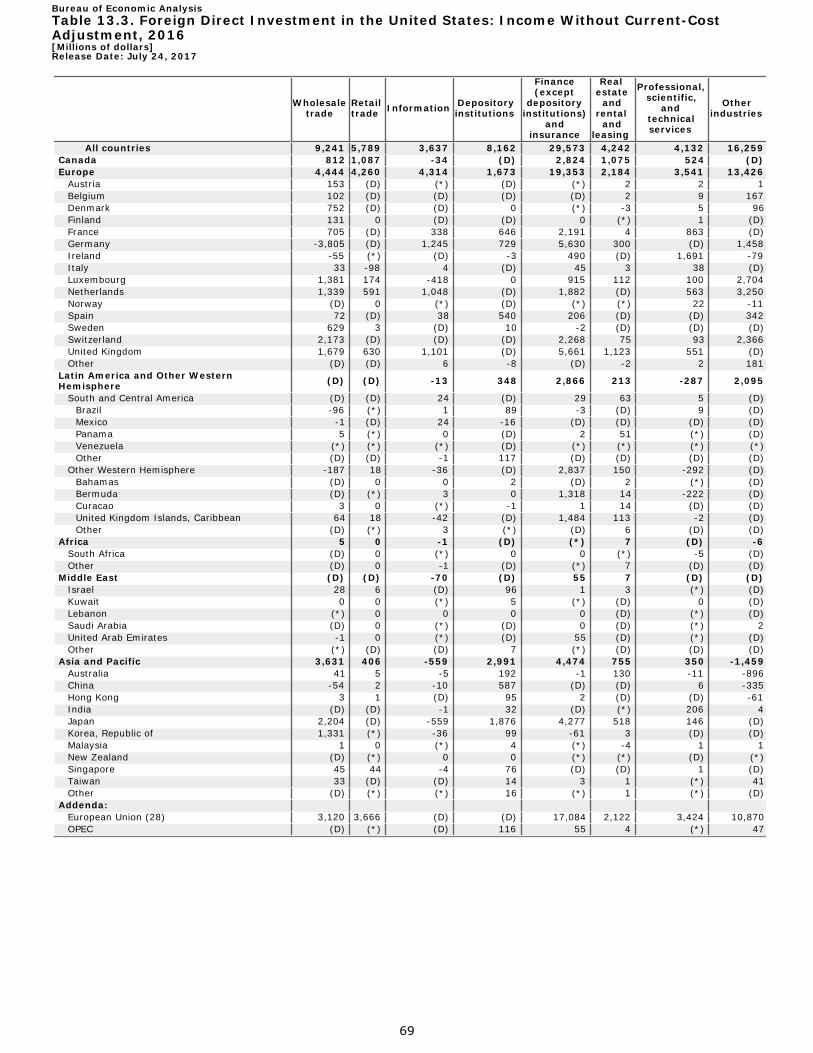
Bureau of Economic AnalysisTable 13.3. Foreign Direct Investment in the United States: Income Without Current-CostAdjustment, 2016[Millions of dollars]Release Date: July 24, 2017
Wholesale trade
Retail trade
5,789
Information Depository institutions
Finance (except
depository institutions)
and insurance
Real estate and
rental and
leasing
Professional, scientific,
and technical services
Other industries
All countries 9,241 3,637 8,162 29,573 4,242 4,132 16,259 Canada 812 1,087 -34 (D) 2,824 1,075 524 (D) Europe 4,444 4,260 4,314 1,673 19,353 2,184 3,541 13,426
Austria 153 (D) (*) (D) (*) 2 2 1 Belgium 102 (D) (D) (D) (D) 2 9 167 Denmark 752 (D) (D) 0 (*) -3 5 96 Finland 131 0 (D) (D) 0 (*) 1 (D) France 705 (D) 338 646 2,191 4 863 (D) Germany -3,805 (D) 1,245 729 5,630 300 (D) 1,458 Ireland -55 (*) (D) -3 490 (D) 1,691 -79 Italy 33 -98 4 (D) 45 3 38 (D) Luxembourg 1,381 174 -418 0 915 112 100 2,704 Netherlands 1,339 591 1,048 (D) 1,882 (D) 563 3,250 Norway (D) 0 (*) (D) (*) (*) 22 -11 Spain 72 (D) 38 540 206 (D) (D) 342 Sweden 629 3 (D) 10 -2 (D) (D) (D) Switzerland 2,173 (D) (D) (D) 2,268 75 93 2,366 United Kingdom 1,679 630 1,101 (D) 5,661 1,123 551 (D) Other (D) (D) 6 -8 (D) -2 2 181
Latin America and Other Western Hemisphere (D) (D) -13 348 2,866 213 -287 2,095
South and Central America (D) (D) 24 (D) 29 63 5 (D) Brazil -96 (*) 1 89 -3 (D) 9 (D) Mexico -1 (D) 24 -16 (D) (D) (D) (D) Panama 5 (*) 0 (D) 2 51 (*) (D) Venezuela (*) (*) (*) (D) (*) (*) (*) (*) Other (D) (D) -1 117 (D) (D) (D) (D)
Other Western Hemisphere -187 18 -36 (D) 2,837 150 -292 (D) Bahamas (D) 0 0 2 (D) 2 (*) (D) Bermuda (D) (*) 3 0 1,318 14 -222 (D) Curacao 3 0 (*) -1 1 14 (D) (D) United Kingdom Islands, Caribbean 64 18 -42 (D) 1,484 113 -2 (D) Other (D) (*) 3 (*) (D) 6 (D) (D)
Africa 5 0 -1 (D) (*) 7 (D) -6 South Africa (D) 0 (*) 0 0 (*) -5 (D) Other (D) 0 -1 (D) (*) 7 (D) (D)
Middle East (D) (D) -70 (D) 55 7 (D) (D) Israel 28 6 (D) 96 1 3 (*) (D) Kuwait 0 0 (*) 5 (*) (D) 0 (D) Lebanon (*) 0 0 0 0 (D) (*) (D) Saudi Arabia (D) 0 (*) (D) 0 (D) (*) 2 United Arab Emirates -1 0 (*) (D) 55 (D) (*) (D) Other (*) (D) (D) 7 (*) (D) (D) (D)
Asia and Pacific 3,631 406 -559 2,991 4,474 755 350 -1,459 Australia 41 5 -5 192 -1 130 -11 -896 China -54 2 -10 587 (D) (D) 6 -335 Hong Kong 3 1 (D) 95 2 (D) (D) -61 India (D) (D) -1 32 (D) (*) 206 4 Japan 2,204 (D) -559 1,876 4,277 518 146 (D) Korea, Republic of 1,331 (*) -36 99 -61 3 (D) (D) Malaysia 1 0 (*) 4 (*) -4 1 1 New Zealand (D) (*) 0 0 (*) (*) (D) (*) Singapore 45 44 -4 76 (D) (D) 1 (D) Taiwan 33 (D) (D) 14 3 1 (*) 41 Other (D) (*) (*) 16 (*) 1 (*) (D)
Addenda: European Union (28) 3,120 3,666 (D) (D) 17,084 2,122 3,424 10,870 OPEC (D) (*) (D) 116 55 4 (*) 47
69

Bureau of Economic AnalysisTable 14. Foreign Direct Investment in the United States: Selected Items by Detailed Country,2012–2016 [Millions of dollars]Release Date: July 24, 2017
Direct investment position on a historical-cost basis 2012 2013 2014 2015 2016
All countries 2,584,708 2,727,825 2,945,795 3,303,586 3,725,418 Canada 214,314 222,989 273,896 322,118 371,468 Europe /1/ 1,836,716 1,901,471 2,004,199 2,276,695 2,605,559
Austria 5,286 5,976 6,962 7,088 10,611 Belgium 102,705 91,413 97,038 89,231 79,854 Denmark 7,732 9,913 13,322 14,432 18,233 Finland 6,087 6,852 4,284 6,482 5,874 France 214,712 197,338 202,682 232,431 252,864 Germany 197,438 213,256 251,009 279,735 291,697 Ireland 17,801 18,981 26,431 35,814 85,460 Italy 22,151 24,899 23,508 27,690 30,010 Luxembourg 202,339 223,339 232,288 347,864 417,386 Netherlands 244,147 237,734 258,177 299,780 355,242 Norway 18,769 18,470 19,539 20,706 25,548 Spain 48,417 50,722 63,956 66,985 68,169 Sweden 39,216 40,848 40,142 43,416 46,933 Switzerland 199,125 220,349 245,188 249,225 310,759 United Kingdom 485,785 510,795 479,373 512,139 555,687 Other 25,006 30,586 40,300 43,678 51,231
Albania (*) 0 (*) (*) 1 Armenia 1 1 2 2 3 Azerbaijan (D) -40 (D) (D) -5 Belarus -3 -4 2 2 3 Bosnia and Herzegovina (*) (*) (*) (*) (*) Bulgaria (*) (D) -4 (D) (D) Croatia -12 (D) (D) (D) (D) Cyprus 2,418 2,580 2,450 2,600 2,218 Czech Republic 63 88 84 108 101 Estonia -4 -5 -5 -5 (D) Georgia 0 0 0 -1 0 Gibraltar 737 655 2,931 14,807 15,016 Greece -376 612 605 638 684 Greenland 2 2 2 2 2 Hungary 11,080 11,952 20,269 12,126 11,454 Iceland (D) (D) (D) (D) 7,113 Kazakhstan -2 (D) -40 1 -2 Kyrgyzstan 0 0 0 0 0 Latvia (*) (*) (D) (*) (*) Liechtenstein 637 (D) (D) (D) 849 Lithuania -3 (D) (D) (D) (D) Macedonia -1 0 -1 1 0 Malta (D) (D) 964 689 (D) Monaco 1 1 2 2 3 Poland (D) 1,229 (D) 1,496 (D) Portugal 407 761 805 942 937 Romania (D) 69 60 85 (D) Russia 6,077 6,354 4,729 4,358 4,550 Serbia -2 (*) 2 4 2 Slovakia 17 13 1 (D) 21 Slovenia (D) (D) (D) (D) (D) Tajikistan 0 0 0 0 (*) Turkey (D) 649 624 625 652 Turkmenistan (D) (D) -9 -3 -3 Ukraine (*) -6 -5 6 5 Uzbekistan (*) (*) (*) (*) (*)
Latin America and Other Western Hemisphere 83,525 100,482 117,051 117,301 124,798
South and Central America 23,754 25,036 25,083 25,755 25,805 Brazil 3,562 1,891 1,444 551 -1,831 Mexico 12,751 15,869 15,198 15,209 16,757 Panama 1,218 1,527 2,350 2,592 2,922 Venezuela 4,393 3,881 3,926 4,187 4,457
Continues on next page
70

Bureau of Economic AnalysisTable 14. Foreign Direct Investment in the United States: Selected Items by Detailed Country,2012–2016 [Millions of dollars]Release Date: July 24, 2017
Direct investment position on a historical-cost basis 2012 2013 2014 2015 2016
Other 1,830 1,868 2,166 3,216 3,500 Argentina 170 106 898 851 823 Belize (D) 14 13 13 (D) Bolivia -17 (D) (D) -16 -27 Chile 673 753 837 2,087 2,220 Colombia 775 659 -211 -97 -16 Costa Rica -112 -62 -104 -84 -92 Ecuador 40 9 (*) 1 -4 El Salvador -14 -13 -24 -18 -16 French Guiana 0 (D) -5 -5 -5 Guatemala -6 -12 -22 -15 3 Guyana -2 (D) (*) (*) (D) Honduras -35 -21 -19 -16 -3 Nicaragua (D) 53 27 (D) (D) Paraguay -2 -3 (D) (D) -3 Peru 118 160 119 117 144 Suriname (*) (*) (*) 0 (D) Uruguay 338 289 691 393 462
Other Western Hemisphere 59,772 75,446 91,967 91,546 98,993 Bahamas 635 643 813 805 484 Bermuda -13,030 -8,486 993 -7,411 9,361 Curacao 4,470 4,344 1,982 1,630 1,660 Netherlands Antilles -- -- -- -- --United Kingdom Islands, Caribbean 66,000 78,228 87,344 94,773 86,054 Other 1,697 717 834 1,749 1,434
Anguilla (D) (D) (D) (D) (D) Antigua and Barbuda 4 (D) 3 3 4 Aruba -5 -4 (D) -7 -8 Barbados 1,131 316 301 1,340 1,142 Cuba (*) (D) (*) (*) (*) Dominica (*) (D) 2 -1 (*) Dominican Republic 71 -1 -5 -8 -2 French Islands, Caribbean -1 (D) -1 -1 -1 Grenada 8 8 8 8 8 Haiti (D) -8 (D) (D) (D) Jamaica 4 (*) 3 (*) (*) Netherlands Islands, Caribbean 163 182 213 (D) 89 St. Kitts and Nevis -1 (D) -1 (*) -1 St. Lucia 0 0 (*) 0 0 St. Vincent and the Grenadines (*) (D) 0 (*) 0 Trinidad and Tobago 252 124 229 175 115 United Kingdom Islands, Atlantic (OWH) 24 35 36 35 21
Africa 3,761 1,635 1,691 4,330 4,394 South Africa 755 105 329 2,942 3,114 Other 3,005 1,530 1,362 1,388 1,280
Algeria 1 (D) (D) -13 (D) Angola 163 160 89 207 234 Benin 0 0 0 0 0 Botswana (*) (*) -1 -1 -1 Burkina Faso 0 0 0 0 -1 Cameroon -7 (D) -9 (D) -8 Central African Republic 0 0 0 (*) (*) Chad (*) -1 -4 (*) (*) Congo (Brazzaville) (D) 8 -7 -6 -4 Congo (Kinshasa) (D) 0 0 2 0 Cote d'Ivoire -1 -6 -3 (D) -1 Egypt -98 -86 -84 -76 -120 Equatorial Guinea -3 (D) -4 3 2 Ethiopia -1 -1 0 -1 -1 Gabon -9 (D) -11 (D) -4 Ghana (D) 28 37 -33 (D)
Continues on next page
71

Bureau of Economic AnalysisTable 14. Foreign Direct Investment in the United States: Selected Items by Detailed Country,2012–2016 [Millions of dollars]Release Date: July 24, 2017
Direct investment position on a historical-cost basis 2012 2013 2014 2015 2016
Guinea (D) (D) (D) (D) (D) Kenya (D) -32 -8 -8 (D) Lesotho 0 0 0 0 0 Liberia 516 502 512 501 461 Libya (D) (D) -3 (D) (D) Madagascar 0 0 0 0 0 Malawi (*) (*) (*) (*) (*) Mali -1 -2 -3 -2 -3 Mauritania 0 -1 (*) (*) (*) Mauritius 2,266 894 651 386 339 Morocco (D) -15 -20 (D) (D) Mozambique (*) -2 -1 (*) -1 Namibia 0 -9 (D) 2 (*) Niger (*) (*) (*) (*) (*) Nigeria 23 (*) 14 29 53 Senegal 0 0 (*) (*) -2 Seychelles (*) (*) (*) (*) (*) Sierra Leone (*) (*) (*) 0 0 Somalia (*) (*) (*) (*) (*) South Sudan 0 0 0 (*) 0 Sudan (*) (*) (*) (*) (*) Swaziland (*) 2 -5 -5 -5 Tanzania (*) -7 -3 (D) (D) Tunisia -9 -14 -17 -17 -17 Uganda 0 -1 (*) (*) (*) United Kingdom Islands, Atlantic (Africa) (*) (D) 0 0 0 Zambia (D) (D) (*) (D) (D) Zimbabwe 1 0 0 0 0
Middle East 18,374 17,944 16,467 18,169 19,826 Israel 7,361 7,041 6,175 7,442 8,136 Kuwait 742 1,011 1,072 1,113 1,122 Lebanon -60 -28 -19 -14 -13 Saudi Arabia (D) (D) (D) (D) (D) United Arab Emirates 2,782 2,245 2,618 2,755 2,843 Other (D) (D) (D) (D) (D)
Bahrain -3 -153 -134 -162 -83 Iran 1 -2 1 (D) (D) Iraq (D) (D) (D) (D) (D) Jordan -87 -93 -65 (D) (D) Oman -19 -52 -45 -33 -32 Qatar (D) (D) 2,080 (D) 2,043 Syria (*) 0 (*) 0 0 Yemen 1 (D) (D) (D) (D)
Asia and Pacific 428,016 483,304 532,491 564,974 599,373 Australia 51,138 49,127 56,404 47,270 46,926 China 7,076 7,855 10,071 16,769 27,475 Hong Kong 9,750 7,404 9,776 10,991 11,649 India 5,959 7,661 8,927 9,629 9,852 Japan 301,183 350,395 371,874 402,164 421,103 Korea, Republic of 25,260 31,790 39,966 40,585 40,937 Malaysia 1,012 986 1,154 1,278 1,136 New Zealand 1,052 1,046 1,048 439 176 Singapore 18,701 17,082 20,665 21,654 23,933 Taiwan 5,039 6,135 6,107 6,890 7,196 Other 1,847 3,825 6,498 7,306 8,991
Afghanistan 1 1 1 2 0 Bangladesh 7 (D) (D) (*) (*) Brunei -2 (D) (D) (D) (D) Burma 4 5 (D) (D) (D) Cambodia (*) (D) (D) (*) (*) French Islands, Pacific -4 -3 (*) (*) 2
Continues on next page
72

Bureau of Economic AnalysisTable 14. Foreign Direct Investment in the United States: Selected Items by Detailed Country,2012–2016 [Millions of dollars]Release Date: July 24, 2017
Direct investment position on a historical-cost basis 2012 2013 2014 2015 2016
Indonesia 24 1,190 1,521 1,604 1,637 Laos 0 0 0 0 0 Macau 629 268 124 139 8 Marshall Islands (D) (D) 29 38 63 Micronesia 1 1 1 1 1 Mongolia (D) (*) (*) 1 (*) North Korea 0 -1 0 0 0 Pakistan 64 -237 -133 -117 -131 Papua New Guinea 1 -3 -1 2 2 Philippines 289 339 1,028 1,173 1,413 Samoa (D) (D) (D) (D) (D) Solomon Islands 0 0 0 0 0 Sri Lanka 17 43 42 56 70 Thailand 382 1,422 1,997 2,468 4,058 Timor-Leste 0 0 -4 -4 -4 Tuvalu 0 0 0 0 0 United Kingdom Islands, Indian Ocean 0 0 0 (*) 0 United Kingdom Islands, Pacific (D) (D) (D) (D) (D) Vanuatu (D) (D) (D) (D) (D) Vietnam 39 -30 1,043 1,515 1,392
Continues on next page
73
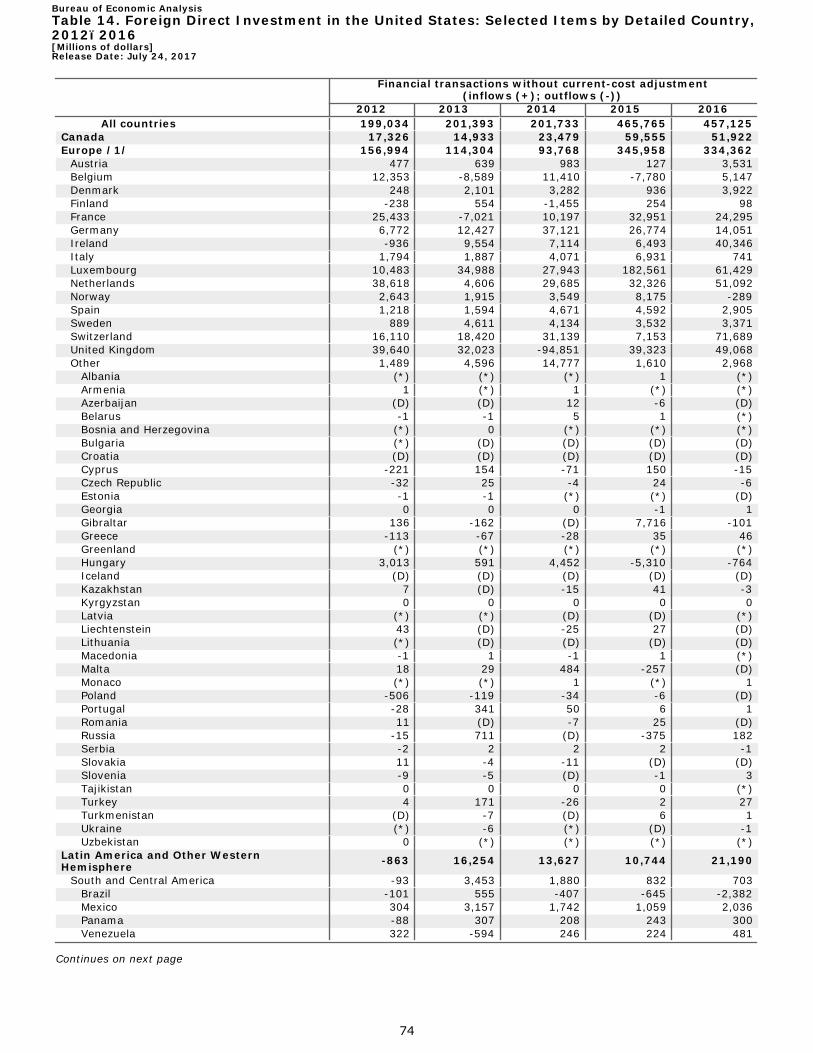
Bureau of Economic AnalysisTable 14. Foreign Direct Investment in the United States: Selected Items by Detailed Country,2012–2016 [Millions of dollars]Release Date: July 24, 2017
Financial transactions without current-cost adjustment (inflows (+); outflows (-))
2012 2013 2014 2015 2016 All countries 199,034 201,393 201,733 465,765 457,125
Canada 17,326 14,933 23,479 59,555 51,922 Europe /1/ 156,994 114,304 93,768 345,958 334,362
Austria 477 639 983 127 3,531 Belgium 12,353 -8,589 11,410 -7,780 5,147 Denmark 248 2,101 3,282 936 3,922 Finland -238 554 -1,455 254 98 France 25,433 -7,021 10,197 32,951 24,295 Germany 6,772 12,427 37,121 26,774 14,051 Ireland -936 9,554 7,114 6,493 40,346 Italy 1,794 1,887 4,071 6,931 741 Luxembourg 10,483 34,988 27,943 182,561 61,429 Netherlands 38,618 4,606 29,685 32,326 51,092 Norway 2,643 1,915 3,549 8,175 -289 Spain 1,218 1,594 4,671 4,592 2,905 Sweden 889 4,611 4,134 3,532 3,371 Switzerland 16,110 18,420 31,139 7,153 71,689 United Kingdom 39,640 32,023 -94,851 39,323 49,068 Other 1,489 4,596 14,777 1,610 2,968
Albania (*) (*) (*) 1 (*) Armenia 1 (*) 1 (*) (*) Azerbaijan (D) (D) 12 -6 (D) Belarus -1 -1 5 1 (*) Bosnia and Herzegovina (*) 0 (*) (*) (*) Bulgaria (*) (D) (D) (D) (D) Croatia (D) (D) (D) (D) (D) Cyprus -221 154 -71 150 -15 Czech Republic -32 25 -4 24 -6 Estonia -1 -1 (*) (*) (D) Georgia 0 0 0 -1 1 Gibraltar 136 -162 (D) 7,716 -101 Greece -113 -67 -28 35 46 Greenland (*) (*) (*) (*) (*) Hungary 3,013 591 4,452 -5,310 -764 Iceland (D) (D) (D) (D) (D) Kazakhstan 7 (D) -15 41 -3 Kyrgyzstan 0 0 0 0 0 Latvia (*) (*) (D) (D) (*) Liechtenstein 43 (D) -25 27 (D) Lithuania (*) (D) (D) (D) (D) Macedonia -1 1 -1 1 (*) Malta 18 29 484 -257 (D) Monaco (*) (*) 1 (*) 1 Poland -506 -119 -34 -6 (D) Portugal -28 341 50 6 1 Romania 11 (D) -7 25 (D) Russia -15 711 (D) -375 182 Serbia -2 2 2 2 -1 Slovakia 11 -4 -11 (D) (D) Slovenia -9 -5 (D) -1 3 Tajikistan 0 0 0 0 (*) Turkey 4 171 -26 2 27 Turkmenistan (D) -7 (D) 6 1 Ukraine (*) -6 (*) (D) -1 Uzbekistan 0 (*) (*) (*) (*)
Latin America and Other Western Hemisphere -863 16,254 13,627 10,744 21,190
South and Central America -93 3,453 1,880 832 703 Brazil -101 555 -407 -645 -2,382 Mexico 304 3,157 1,742 1,059 2,036 Panama -88 307 208 243 300 Venezuela 322 -594 246 224 481
Continues on next page
74

Bureau of Economic AnalysisTable 14. Foreign Direct Investment in the United States: Selected Items by Detailed Country,2012–2016 [Millions of dollars]Release Date: July 24, 2017
Financial transactions without current-cost adjustment (inflows (+); outflows (-))
2012 2013 2014 2015 2016 Other -530 28 90 -49 268
Argentina -95 -63 -35 -103 -28 Belize -1 (D) -1 (*) (D) Bolivia -27 (D) 29 (D) -11 Chile 38 59 67 150 117 Colombia -88 -114 -239 169 82 Costa Rica -32 50 -32 20 -7 Ecuador -8 -25 -4 2 -2 El Salvador -1 (*) -11 6 2 French Guiana (D) (D) (D) 0 0 Guatemala 16 -5 -11 6 19 Guyana (*) (D) (D) (*) (D) Honduras -25 14 2 3 12 Nicaragua (D) (D) (D) (D) (*) Paraguay -1 -1 (D) (D) (*) Peru -118 42 -45 -3 24 Suriname (*) (*) (*) (*) (D) Uruguay -79 -46 400 -298 70
Other Western Hemisphere -770 12,801 11,748 9,912 20,487 Bahamas 8 23 183 -117 -214 Bermuda -4,521 3,516 -1,962 -783 20,741 Curacao 464 76 -84 143 18 Netherlands Antilles -- -- -- -- --United Kingdom Islands, Caribbean 3,474 10,124 13,507 10,544 -20 Other -195 -937 104 125 -38
Anguilla 1 5 (D) (D) (D) Antigua and Barbuda 1 (D) -2 (*) 1 Aruba 3 1 (D) (D) -1 Barbados -80 -1,128 -30 194 80 Cuba (*) (D) (D) (*) (*) Dominica (*) (*) (D) -1 (*) Dominican Republic 2 -72 -5 -3 7 French Islands, Caribbean -1 (D) (D) (*) (*) Grenada 1 (*) (*) (*) 0 Haiti 0 (D) (D) (*) 0 Jamaica -8 -4 3 -3 (*) Netherlands Islands, Caribbean -88 367 31 (D) (D) St. Kitts and Nevis (*) (D) (D) (*) (*) St. Lucia -1 0 (*) (*) 0 St. Vincent and the Grenadines (*) 0 0 (*) (*) Trinidad and Tobago -28 -129 109 -54 -60 United Kingdom Islands, Atlantic (OWH) 2 (D) 1 -1 -15
Africa -72 207 825 1,872 100 South Africa -147 234 421 1,899 212 Other 75 -27 404 -26 -112
Algeria -5 (D) (D) (D) (D) Angola 177 -3 -71 118 26 Benin 0 0 0 0 0 Botswana (*) (*) -1 0 (*) Burkina Faso (*) 0 0 0 -1 Cameroon -7 (D) (D) (D) (D) Central African Republic 0 0 0 (*) (*) Chad (*) -1 -2 4 (*) Congo (Brazzaville) (D) (D) -10 1 2 Congo (Kinshasa) (D) (D) 0 2 -2 Cote d'Ivoire 2 -5 3 (D) (D) Egypt -11 (D) (*) 8 -44 Equatorial Guinea -11 (D) (D) 7 (*) Ethiopia -1 (*) 1 -1 (*) Gabon -6 (D) (D) (D) (D) Ghana -1 -41 8 -70 (D)
Continues on next page
75

Bureau of Economic AnalysisTable 14. Foreign Direct Investment in the United States: Selected Items by Detailed Country,2012–2016 [Millions of dollars]Release Date: July 24, 2017
Financial transactions without current-cost adjustment (inflows (+); outflows (-))
2012 2013 2014 2015 2016 Guinea (D) (D) (D) (D) (D) Kenya -2 (D) 24 -1 (D) Lesotho (*) 0 0 0 0 Liberia -88 -13 5 -11 -40 Libya (D) (D) (D) (D) (*) Madagascar 1 0 0 0 0 Malawi (*) (*) (*) (*) (*) Mali -1 -1 -1 1 -1 Mauritania 0 -1 1 (*) (*) Mauritius 16 114 322 -316 -51 Morocco -2 (D) -5 (D) 2 Mozambique -1 -2 1 (*) (*) Namibia 0 -9 (D) (D) -2 Niger (*) (*) (*) (*) (*) Nigeria -15 -23 13 16 24 Senegal 0 0 (*) (*) -2 Seychelles 0 (*) (*) (*) (*) Sierra Leone 5 (*) (*) (*) 0 Somalia (*) (*) (*) (*) (*) South Sudan 0 0 0 (*) (*) Sudan (*) (*) (*) (*) (*) Swaziland (*) 2 -7 0 0 Tanzania (*) -7 5 (D) -2 Tunisia (D) -5 -4 1 -1 Uganda 0 -1 (*) (*) (*) United Kingdom Islands, Atlantic (Africa) (*) (D) (D) 0 0 Zambia (D) 0 (D) (D) -4 Zimbabwe 1 -1 0 0 0
Middle East -681 1,222 -1,548 2,157 545 Israel -658 575 -1,198 1,653 112 Kuwait -29 274 61 41 15 Lebanon 2 3 9 5 1 Saudi Arabia (D) 608 -1,189 478 744 United Arab Emirates -196 -547 639 132 -387 Other (D) 309 129 -152 59
Bahrain 143 339 19 -28 16 Iran (*) -2 2 (D) (*) Iraq (D) -44 (D) -3 4 Jordan (D) (D) 28 (D) (D) Oman -15 -33 7 12 1 Qatar -45 (D) (D) (D) (D) Syria (*) (*) (*) (*) 0 Yemen (*) (D) (*) (D) (D)
Asia and Pacific 26,330 54,473 71,582 45,480 49,007 Australia -7,122 -4,805 1,098 -1,327 -1,705 China 3,419 1,920 2,201 5,917 10,337 Hong Kong 1,020 1,745 4,731 670 1,865 India 367 -22 1,287 287 529 Japan 22,114 46,413 44,891 34,379 33,914 Korea, Republic of 6,185 6,601 9,024 1,384 173 Malaysia -307 -28 235 118 -155 New Zealand -475 -21 66 -318 -274 Singapore 544 562 3,911 2,724 2,297 Taiwan 315 1,086 1,387 761 299 Other 269 1,022 2,750 884 1,726
Afghanistan (D) (*) (*) 1 -2 Bangladesh 1 (D) (D) (D) (*) Brunei (D) (D) (D) (*) (*) Burma (*) 1 (D) 2 (D) Cambodia (*) (D) (D) (D) (*) French Islands, Pacific (D) 1 3 0 2
Continues on next page
76

Bureau of Economic AnalysisTable 14. Foreign Direct Investment in the United States: Selected Items by Detailed Country,2012–2016 [Millions of dollars]Release Date: July 24, 2017
Financial transactions without current-cost adjustment (inflows (+); outflows (-))
2012 2013 2014 2015 2016 Indonesia -117 1,170 339 173 36 Laos 0 0 0 0 0 Macau (D) -361 -144 16 -131 Marshall Islands (D) (D) (D) 9 25 Micronesia 0 0 0 0 0 Mongolia (D) (D) (*) 1 -1 North Korea 0 -1 1 0 0 Pakistan -11 (D) 105 15 -14 Papua New Guinea (*) -5 2 2 (*) Philippines 100 (D) 768 144 242 Samoa (D) (D) (D) (D) (D) Solomon Islands 0 0 0 0 0 Sri Lanka 3 26 -1 2 14 Thailand 245 79 572 472 1,628 Timor-Leste 2 0 -4 0 0 Tuvalu 0 0 0 0 0 United Kingdom Islands, Indian Ocean 0 0 0 (*) (*) United Kingdom Islands, Pacific -6 -1 -5 (D) 4 Vanuatu (*) (*) (*) (*) (*) Vietnam 23 -70 1,065 473 -124
Continues on next page
77

Bureau of Economic AnalysisTable 14. Foreign Direct Investment in the United States: Selected Items by Detailed Country,2012–2016 [Millions of dollars]Release Date: July 24, 2017
Income without current-cost adjustment 2012 2013 2014 2015 2016
All countries 160,328 168,235 177,294 148,335 159,749 Canada 11,932 15,540 15,032 15,941 16,417 Europe /1/ 120,117 120,582 122,793 99,497 115,033
Austria 489 609 532 506 602 Belgium 4,847 6,237 4,748 4,529 4,647 Denmark 854 885 1,095 1,026 1,174 Finland 88 500 612 398 456 France 14,184 12,729 10,774 15,874 11,782 Germany 15,780 12,832 17,595 12,731 15,312 Ireland 2,217 1,468 3,752 4,826 4,711 Italy 1,938 1,678 1,815 516 408 Luxembourg 7,665 7,941 7,597 8,750 14,183 Netherlands 21,766 24,314 20,740 16,450 19,607 Norway 455 531 732 72 -633 Spain 1,195 2,444 1,079 2,109 1,561 Sweden 2,541 3,132 3,274 2,490 2,584 Switzerland 15,668 14,269 20,075 18,487 17,752 United Kingdom 29,388 30,288 27,147 9,348 19,485 Other 1,041 723 1,224 1,385 1,401
Albania 0 0 0 0 0 Armenia (*) 1 (*) (*) (*) Azerbaijan (*) (*) (*) (*) (*) Belarus (*) (*) (*) (*) (*) Bosnia and Herzegovina 0 0 0 0 0 Bulgaria (*) (*) (*) 2 3 Croatia 1 1 (*) (*) (*) Cyprus -86 -35 43 94 116 Czech Republic (*) (*) (*) (*) (*) Estonia -1 -1 (D) (*) (*) Georgia 0 0 0 0 0 Gibraltar (D) 40 -66 797 401 Greece -111 (D) (D) (D) (D) Greenland (*) (*) (*) (*) (*) Hungary 908 615 (D) 447 (D) Iceland 154 52 (D) (D) 268 Kazakhstan (*) (*) (*) (*) (*) Kyrgyzstan 0 0 0 0 0 Latvia 0 0 0 0 0 Liechtenstein 14 40 53 51 -30 Lithuania (*) (*) (*) (*) (*) Macedonia 0 0 0 0 0 Malta (D) (D) 22 (D) (D) Monaco (*) (*) 0 0 0 Poland (D) 58 (D) 22 (D) Portugal 22 27 13 10 -1 Romania (D) (*) (*) (*) (*) Russia -45 -15 -60 -284 -30 Serbia 0 0 0 0 0 Slovakia -1 (*) (D) (*) (*) Slovenia (D) -5 -2 -1 (*) Tajikistan 0 0 0 0 0 Turkey (D) 9 (D) (D) -1 Turkmenistan 0 0 0 (*) 0 Ukraine (*) (*) (*) (*) (*) Uzbekistan (*) (*) (*) (*) (*)
Latin America and Other Western Hemisphere 5,712 7,645 8,835 8,610 7,906
South and Central America 3,179 3,427 3,066 2,623 1,763 Brazil 172 281 175 58 16 Mexico 2,152 2,319 1,858 1,358 1,225 Panama 132 104 148 301 260 Venezuela (D) (D) (D) (D) 196
Continues on next page
78

Bureau of Economic AnalysisTable 14. Foreign Direct Investment in the United States: Selected Items by Detailed Country,2012–2016 [Millions of dollars]Release Date: July 24, 2017
Income without current-cost adjustment 2012 2013 2014 2015 2016
Other (D) (D) (D) (D) 66 Argentina -121 -20 (D) -88 -71 Belize -2 -1 -1 (*) (D) Bolivia (*) (*) (*) (*) (D) Chile 37 65 69 69 85 Colombia -54 -81 74 19 21 Costa Rica 2 1 2 1 -2 Ecuador -10 1 1 1 1 El Salvador -6 (*) (*) (*) (*) French Guiana 0 0 0 0 0 Guatemala 1 1 (*) (*) (D) Guyana 0 0 0 0 0 Honduras (*) (*) (*) (*) (D) Nicaragua (*) (*) (*) (*) (D) Paraguay 0 0 0 0 0 Peru (D) (D) (D) (D) (D) Suriname 0 0 0 0 0 Uruguay 21 17 46 67 28
Other Western Hemisphere 2,533 4,218 5,769 5,987 6,143 Bahamas -40 1 86 49 -39 Bermuda 806 1,776 1,965 2,716 1,308 Curacao 169 156 -207 -22 -71 Netherlands Antilles -- -- -- -- --United Kingdom Islands, Caribbean 1,585 2,323 3,939 3,161 4,848 Other 13 -38 -15 84 96
Anguilla 6 4 3 2 1 Antigua and Barbuda (*) (*) (*) (*) (*) Aruba (*) (*) (*) (*) (*) Barbados 8 -34 -16 85 112 Cuba (*) (*) (*) (*) (*) Dominica 0 0 0 0 0 Dominican Republic 4 -3 (*) (*) (*) French Islands, Caribbean (*) (*) (*) (*) (*) Grenada (*) (*) (*) (*) (*) Haiti 0 0 0 0 0 Jamaica (*) (*) (*) (*) (*) Netherlands Islands, Caribbean 2 1 1 1 1 St. Kitts and Nevis (*) (*) (*) (*) (*) St. Lucia 0 0 0 0 0 St. Vincent and the Grenadines 0 0 0 0 0 Trinidad and Tobago (*) (*) (*) (*) (*) United Kingdom Islands, Atlantic (OWH) -6 -5 -3 -5 -19
Africa 39 -100 488 189 177 South Africa 65 -122 414 (D) 177 Other -26 22 74 (D) (*)
Algeria (*) (*) (*) (*) (*) Angola (D) (D) (D) (D) 6 Benin 0 0 0 0 0 Botswana 0 0 0 0 0 Burkina Faso 0 0 0 0 0 Cameroon (*) (*) (*) (*) (*) Central African Republic 0 0 0 0 0 Chad 0 0 0 0 0 Congo (Brazzaville) (*) (*) (*) (*) (*) Congo (Kinshasa) 0 0 0 0 0 Cote d'Ivoire (*) (*) (*) (*) (*) Egypt 2 2 2 3 (D) Equatorial Guinea (*) (*) (*) (*) (*) Ethiopia 0 0 0 0 0 Gabon (*) (*) (*) (*) (*) Ghana (*) (*) (*) -2 -3
Continues on next page
79

Bureau of Economic AnalysisTable 14. Foreign Direct Investment in the United States: Selected Items by Detailed Country,2012–2016 [Millions of dollars]Release Date: July 24, 2017
Income without current-cost adjustment 2012 2013 2014 2015 2016
Guinea 5 (D) (D) (D) (D) Kenya 0 0 0 0 0 Lesotho 0 0 0 0 0 Liberia 30 17 11 10 7 Libya 0 0 0 (*) 0 Madagascar 0 0 0 0 0 Malawi (*) (*) (*) (*) (*) Mali 0 0 0 0 0 Mauritania 0 0 0 0 0 Mauritius -74 -46 4 (D) -58 Morocco (*) (*) (*) (*) (*) Mozambique 0 0 0 0 0 Namibia 0 0 0 0 0 Niger (*) (*) (*) (*) (*) Nigeria (D) -3 (D) (D) (D) Senegal 0 0 0 0 0 Seychelles (*) (*) (*) (*) (*) Sierra Leone 0 0 0 0 0 Somalia (*) (*) (*) (*) (*) South Sudan 0 0 0 0 0 Sudan (*) (*) (*) (*) (*) Swaziland 0 0 0 0 0 Tanzania 0 0 0 0 0 Tunisia 0 0 0 (*) 0 Uganda 0 0 0 0 0 United Kingdom Islands, Atlantic (Africa) 0 (*) 0 0 0 Zambia 0 0 0 0 0 Zimbabwe 0 0 0 0 0
Middle East 269 -406 346 516 1,133 Israel 227 86 302 -90 312 Kuwait 7 (D) 25 66 29 Lebanon (*) (*) (*) 1 1 Saudi Arabia 88 90 (D) (D) (D) United Arab Emirates 32 117 166 197 236 Other -85 (D) (D) (D) (D)
Bahrain -51 -33 4 18 19 Iran 0 (*) (*) (*) (*) Iraq 0 0 0 0 0 Jordan (D) -5 -4 -4 -4 Oman (*) (*) (*) (*) (*) Qatar (D) (D) (D) (D) (D) Syria 0 0 0 0 0 Yemen (*) (*) (*) (*) (*)
Asia and Pacific 22,260 24,974 29,800 23,582 19,083 Australia 1,305 2,120 3,040 914 5 China 375 627 1,416 691 27 Hong Kong 315 536 262 -286 -109 India 488 323 657 477 120 Japan 15,995 17,010 20,126 18,380 16,781 Korea, Republic of 2,614 2,829 2,734 1,993 1,639 Malaysia -30 11 4 (*) 4 New Zealand -21 14 21 -64 -145 Singapore 538 751 845 866 282 Taiwan 654 692 618 554 378 Other 27 61 78 58 102
Afghanistan 0 0 0 0 0 Bangladesh (*) (*) (*) (*) (*) Brunei 0 0 0 0 0 Burma -4 (D) -1 (*) (*) Cambodia (*) (*) (*) (*) (*) French Islands, Pacific 0 0 0 0 0
Continues on next page
80

Bureau of Economic AnalysisTable 14. Foreign Direct Investment in the United States: Selected Items by Detailed Country,2012–2016 [Millions of dollars]Release Date: July 24, 2017
Income without current-cost adjustment 2012 2013 2014 2015 2016
Indonesia 14 18 25 20 28 Laos 0 0 0 0 0 Macau (*) (*) (*) (*) (*) Marshall Islands (D) 9 6 9 (D) Micronesia 0 0 0 0 0 Mongolia 0 0 0 0 0 North Korea 0 0 0 0 0 Pakistan 9 8 10 6 -14 Papua New Guinea (*) (*) (*) (*) (*) Philippines 3 4 (D) (D) 2 Samoa (D) (D) (D) (D) (D) Solomon Islands 0 0 0 0 0 Sri Lanka (*) (*) (*) (*) (*) Thailand -4 8 19 18 32 Timor-Leste 0 0 0 0 0 Tuvalu 0 0 0 0 0 United Kingdom Islands, Indian Ocean 0 0 0 0 0 United Kingdom Islands, Pacific -7 (*) -1 3 4 Vanuatu (*) (*) (*) (*) (*) Vietnam (*) (*) (*) (*) (*)
Legend / Footnotes: OWH Other Western Hemisphere 1. In 2016, the euro area included Austria, Belgium, Cyprus, Estonia, Finland, France, Germany, Greece, Ireland, Italy, Latvia, Lithuania, Luxembourg, Malta, the Netherlands, Portugal, Slovakia, Slovenia, and Spain. For 2016, the euro area direct investment position in the United States was $1,602,354 million; financial transactions without current-cost adjustment were $204,263 million; and income without current-cost adjustment was $73,454 million. Note. Inflows increase the foreign direct investment position in the United States, while outflows decrease it.
81

Bureau of Economic AnalysisTable 15. Foreign Direct Investment in the United States: Selected Items by Detailed Industryof U.S. Affiliate, 2012–2016 [Millions of dollars]Release Date: July 24, 2017
Direct investment position on a historical-cost basis 2012 2013 2014 2015 2016
All industries 2,584,708 2,727,825 2,945,795 3,303,586 3,725,418 Manufacturing 864,437 942,695 1,114,540 1,362,109 1,532,365
Food 54,700 69,350 72,994 89,217 95,606 Animal foods (D) (D) (D) (D) (D) Grain and oilseed milling 3,598 1,565 2,214 2,128 (D) Sugar and confectionery products 793 935 (D) 2,194 2,310 Fruit and vegetable preserving and specialty foods 1,760 1,563 3,475 2,811 3,011
Dairy products 2,606 3,193 3,379 3,874 5,321 Meat products 2,806 7,187 8,277 19,961 20,375 Seafood product preparation and packaging 762 908 1,033 1,466 1,445 Bakeries and tortillas 9,421 10,858 12,623 11,820 11,885 Other food products (D) (D) (D) (D) (D)
Chemicals 239,902 294,130 385,850 566,595 653,594 Basic chemicals 42,138 54,086 52,474 62,240 78,691 Resins and synthetic rubber, fibers, and filaments 9,878 12,376 13,265 13,382 14,193
Pharmaceuticals and medicines 149,372 185,196 257,076 417,598 497,632 Soap, cleaning compounds, and toilet preparations 12,376 13,574 20,085 21,530 23,160
Other 26,138 28,899 42,950 51,846 39,919 Pesticides, fertilizers, and other agricultural chemicals 8,134 8,958 10,245 10,283 10,179
Paints, coatings, and adhesives 10,386 11,293 14,729 13,016 16,506 Other chemical products and preparations 7,619 8,648 17,976 28,547 13,234
Primary and fabricated metals 50,110 55,702 63,447 67,171 65,627 Primary metals 31,520 33,866 40,783 43,813 44,016
Iron and steel mills and ferroalloys 17,724 20,306 22,198 24,126 24,158 Steel products from purchased steel 6,444 6,394 9,882 12,491 13,881 Alumina and aluminum production and processing 3,473 3,262 3,299 3,520 (D)
Nonferrous metal (except aluminum) production and processing 3,349 3,285 3,353 3,138 3,007
Foundries 531 619 2,052 538 (D) Fabricated metal products 18,590 21,836 22,664 23,358 21,611
Forging and stamping 963 918 1,290 1,252 1,215 Cutlery and handtools 1 2 2 1 (*) Architectural and structural metals 1,543 1,650 1,586 1,621 1,785 Boilers, tanks, and shipping containers (D) 1,832 1,244 1,295 (D) Hardware 2,648 (D) (D) 4,051 2,217 Spring and wire products 2,052 1,817 1,550 1,695 1,651 Machine shops, turned products, and screws, nuts, and bolts 888 997 1,060 1,137 1,155
Coating, engraving, heat treating, and allied activities 2,217 2,270 2,375 2,449 2,530
Other fabricated metal products (D) (D) (D) 9,857 (D) Machinery 74,787 76,023 83,364 90,721 94,026
Agriculture, construction, and mining machinery 14,015 16,085 17,403 16,713 16,998
Industrial machinery 15,998 15,497 20,521 19,635 19,882 Other 44,775 44,442 45,440 54,372 57,146
Commercial and service industry machinery (D) (D) 1,131 (D) (D)
Ventilation, heating, air-conditioning, and commercial refrigeration equipment 7,367 3,909 3,979 4,129 7,940
Metalworking machinery 2,411 2,758 3,532 3,640 (D) Engines, turbines, and power transmission equipment (D) (D) 26,569 (D) (D)
Other general purpose machinery 8,320 8,539 10,230 11,341 12,137 Computers and electronic products 43,253 38,998 47,454 58,069 76,899
Computers and peripheral equipment 3,134 2,368 2,232 (D) 10,684 Communications equipment 8,722 6,105 10,117 12,165 (D)
Continues on next page
82

Bureau of Economic AnalysisTable 15. Foreign Direct Investment in the United States: Selected Items by Detailed Industryof U.S. Affiliate, 2012–2016 [Millions of dollars]Release Date: July 24, 2017
Direct investment position on a historical-cost basis 2012 2013 2014 2015 2016
Semiconductors and other electronic components 11,265 9,942 10,551 17,199 23,234
Navigational, measuring, and other instruments 18,969 19,438 23,756 25,573 30,968
Other 1,163 1,145 798 (D) (D) Audio and video equipment (D) 1,125 (D) (D) (D) Magnetic and optical media (D) 20 (D) 14 13
Electrical equipment, appliances, and components 30,293 37,087 38,105 38,901 43,297
Electric lighting equipment (D) (D) (D) (D) 1,361 Household appliances (D) (D) (D) (D) (D) Electrical equipment 23,916 30,606 31,741 33,065 35,581 Other electrical equipment and components 3,714 3,849 3,390 2,707 (D)
Transportation equipment 107,938 108,513 116,026 134,623 143,834 Motor vehicles, bodies and trailers, and parts 73,627 74,888 84,652 99,199 109,626
Motor vehicles 42,099 40,649 44,958 (D) 45,882 Motor vehicle bodies and trailers 7 8 10 (D) 14 Motor vehicle parts 31,521 34,231 39,684 56,030 63,730
Other 34,310 33,625 31,374 35,424 34,207 Aerospace products and parts 20,338 20,870 18,293 20,457 21,863 Railroad rolling stock 449 480 310 284 256 Ship and boat building (D) (D) (D) (D) (D) Other transportation equipment (D) (D) (D) (D) (D)
Other manufacturing 263,454 262,891 307,300 316,812 359,482 Beverages and tobacco products 25,332 27,753 50,230 57,349 74,532
Beverages (D) (D) 46,947 (D) (D) Tobacco products (D) (D) 3,282 (D) (D)
Textiles, apparel, and leather products 2,321 2,464 2,597 2,706 2,703 Textile mills 1,321 1,461 1,456 1,491 1,469 Textile product mills 220 216 (D) (D) (D) Apparel 691 699 789 810 812 Leather and allied products 89 88 (D) (D) (D)
Paper 5,964 6,570 6,438 6,580 7,211 Pulp, paper, and paperboard mills 3,265 3,453 2,960 2,619 2,751 Converted paper products 2,700 3,117 3,479 3,962 4,460
Printing and related support activities 1,974 2,085 2,495 2,644 3,282 Petroleum and coal products 126,167 112,302 110,013 109,984 (D)
Integrated petroleum refining and extraction (D) (D) (D) (D) (D)
Petroleum refining excluding oil and gas extraction (D) (D) (D) 9,203 9,819
Asphalt and other petroleum and coal products 1,422 1,598 1,717 (D) (D)
Plastics and rubber products 15,132 17,977 33,950 38,264 44,900 Plastics products 7,332 8,278 12,357 12,545 14,517 Rubber products 7,800 9,699 21,593 25,720 30,383
Nonmetallic mineral products 48,127 53,872 57,295 60,065 63,640 Clay products and refractories 2,438 4,825 4,789 5,059 5,072 Glass and glass products 5,095 1,186 1,137 1,542 2,331 Cement and concrete products 37,435 41,531 44,361 46,244 47,952 Lime and gypsum products 2,316 2,176 2,246 2,254 (D) Other nonmetallic mineral products 843 4,154 4,762 4,965 (D)
Wood products 1,324 1,199 1,938 2,327 2,359 Furniture and related products 1,097 1,155 1,118 1,236 (D) Miscellaneous manufacturing 36,015 37,513 41,227 35,657 (D)
Medical equipment and supplies 30,982 32,025 35,400 26,839 34,534
Continues on next page
83
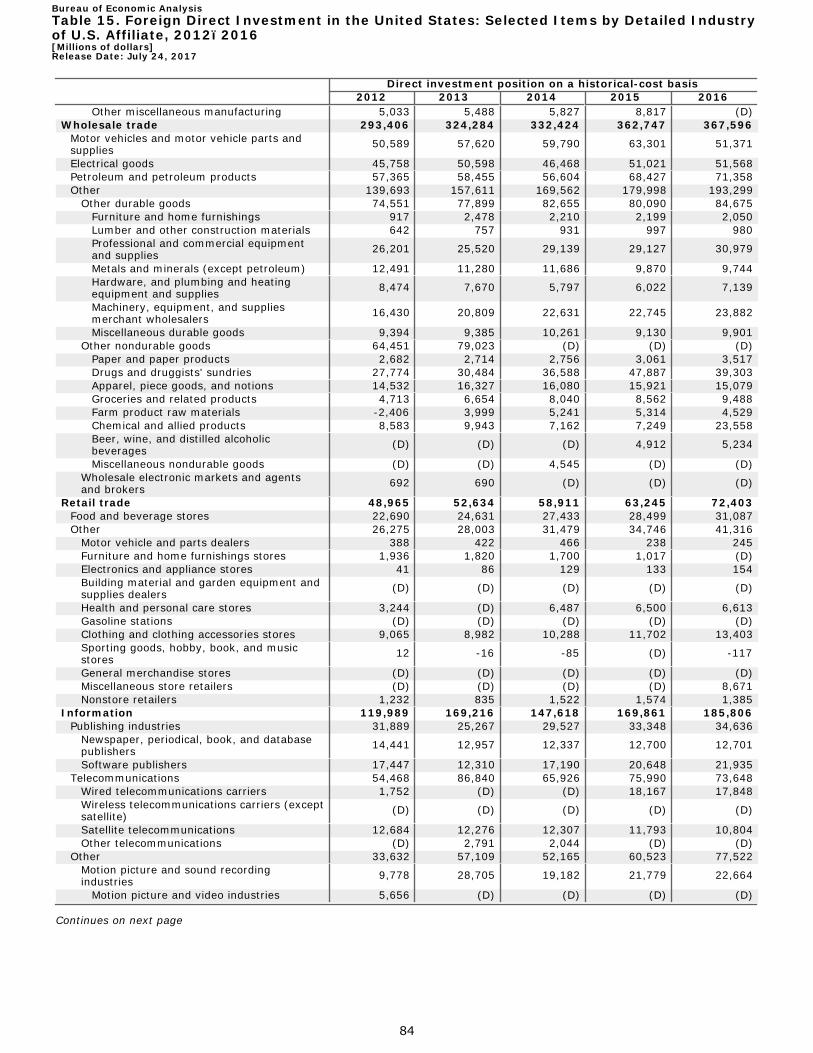
Bureau of Economic AnalysisTable 15. Foreign Direct Investment in the United States: Selected Items by Detailed Industryof U.S. Affiliate, 2012–2016 [Millions of dollars]Release Date: July 24, 2017
Direct investment position on a historical-cost basis 2012 2013 2014 2015 2016
Other miscellaneous manufacturing 5,033 5,488 5,827 8,817 (D) Wholesale trade 293,406 324,284 332,424 362,747 367,596
Motor vehicles and motor vehicle parts and supplies 50,589 57,620 59,790 63,301 51,371
Electrical goods 45,758 50,598 46,468 51,021 51,568 Petroleum and petroleum products 57,365 58,455 56,604 68,427 71,358 Other 139,693 157,611 169,562 179,998 193,299
Other durable goods 74,551 77,899 82,655 80,090 84,675 Furniture and home furnishings 917 2,478 2,210 2,199 2,050 Lumber and other construction materials 642 757 931 997 980 Professional and commercial equipment and supplies 26,201 25,520 29,139 29,127 30,979
Metals and minerals (except petroleum) 12,491 11,280 11,686 9,870 9,744 Hardware, and plumbing and heating equipment and supplies 8,474 7,670 5,797 6,022 7,139
Machinery, equipment, and supplies merchant wholesalers 16,430 20,809 22,631 22,745 23,882
Miscellaneous durable goods 9,394 9,385 10,261 9,130 9,901 Other nondurable goods 64,451 79,023 (D) (D) (D)
Paper and paper products 2,682 2,714 2,756 3,061 3,517 Drugs and druggists' sundries 27,774 30,484 36,588 47,887 39,303 Apparel, piece goods, and notions 14,532 16,327 16,080 15,921 15,079 Groceries and related products 4,713 6,654 8,040 8,562 9,488 Farm product raw materials -2,406 3,999 5,241 5,314 4,529 Chemical and allied products 8,583 9,943 7,162 7,249 23,558 Beer, wine, and distilled alcoholic beverages (D) (D) (D) 4,912 5,234
Miscellaneous nondurable goods (D) (D) 4,545 (D) (D) Wholesale electronic markets and agents and brokers 692 690 (D) (D) (D)
Retail trade 48,965 52,634 58,911 63,245 72,403 Food and beverage stores 22,690 24,631 27,433 28,499 31,087 Other 26,275 28,003 31,479 34,746 41,316
Motor vehicle and parts dealers 388 422 466 238 245 Furniture and home furnishings stores 1,936 1,820 1,700 1,017 (D) Electronics and appliance stores 41 86 129 133 154 Building material and garden equipment and supplies dealers (D) (D) (D) (D) (D)
Health and personal care stores 3,244 (D) 6,487 6,500 6,613 Gasoline stations (D) (D) (D) (D) (D) Clothing and clothing accessories stores 9,065 8,982 10,288 11,702 13,403 Sporting goods, hobby, book, and music stores 12 -16 -85 (D) -117
General merchandise stores (D) (D) (D) (D) (D) Miscellaneous store retailers (D) (D) (D) (D) 8,671 Nonstore retailers 1,232 835 1,522 1,574 1,385
Information 119,989 169,216 147,618 169,861 185,806 Publishing industries 31,889 25,267 29,527 33,348 34,636
Newspaper, periodical, book, and database publishers 14,441 12,957 12,337 12,700 12,701
Software publishers 17,447 12,310 17,190 20,648 21,935 Telecommunications 54,468 86,840 65,926 75,990 73,648
Wired telecommunications carriers 1,752 (D) (D) 18,167 17,848 Wireless telecommunications carriers (except satellite) (D) (D) (D) (D) (D)
Satellite telecommunications 12,684 12,276 12,307 11,793 10,804 Other telecommunications (D) 2,791 2,044 (D) (D)
Other 33,632 57,109 52,165 60,523 77,522 Motion picture and sound recording industries 9,778 28,705 19,182 21,779 22,664
Motion picture and video industries 5,656 (D) (D) (D) (D)
Continues on next page
84

Bureau of Economic AnalysisTable 15. Foreign Direct Investment in the United States: Selected Items by Detailed Industryof U.S. Affiliate, 2012–2016 [Millions of dollars]Release Date: July 24, 2017
Direct investment position on a historical-cost basis 2012 2013 2014 2015 2016
Sound recording industries 4,122 (D) (D) (D) (D) Broadcasting (except internet) 677 737 782 43 (D)
Radio and television broadcasting 122 102 88 (D) 68 Cable and other subscription programming 555 635 695 (D) (D)
Data processing, hosting, and related services 332 355 1,717 2,102 2,061
Other information services 22,845 27,312 30,483 36,599 (D) Depository institutions (banking) 205,908 214,903 198,002 193,436 190,665
Banks 151,631 152,084 138,331 130,464 119,445 Branches and agencies 54,278 62,819 59,670 62,972 71,220
Finance (except depository institutions) and insurance 367,810 343,902 385,997 407,227 504,780
Finance, except depository institutions 191,476 195,707 236,250 242,778 286,744 Nondepository credit intermediation and related services 70,114 54,638 67,258 50,091 49,754
Non-depository credit intermediation 67,263 51,628 64,090 47,322 46,896 Activities related to credit intermediation 2,851 3,010 3,168 2,769 2,857
Securities, commodity contracts, and other intermediation and related activities 110,515 129,183 151,912 176,620 219,969
Securities and commodity contracts intermediation and brokerage 74,817 74,903 75,549 91,006 122,007
Other financial investment activities and exchanges 35,699 54,280 76,363 85,615 97,962
Funds, trusts, and other financial vehicles 10,846 11,886 17,080 16,067 17,022 Insurance carriers and related activities 176,334 148,195 149,747 164,449 218,036
Insurance carriers, except life insurance carriers 53,647 44,512 (D) 56,613 79,812
Life insurance carriers (D) (D) 82,694 87,728 100,291 Agencies, brokerages, and other insurance related activities (D) (D) (D) 20,107 37,932
Real estate and rental and leasing 48,665 54,415 65,374 74,759 82,261 Real estate 37,058 40,788 45,842 52,406 57,817 Rental and leasing (except real estate) 11,607 13,627 19,532 22,353 24,444
Automotive equipment rental and leasing (D) (D) (D) (D) (D) Other rental and leasing services (D) (D) (D) (D) (D) Lessors of nonfinancial intangible assets (except copyrighted works) 6,137 6,133 3,881 4,967 5,510
Professional, scientific, and technical services 96,389 104,360 130,015 154,272 197,948
Architectural, engineering, and related services 9,882 11,153 15,066 15,037 50,111 Computer systems design and related services 30,452 31,027 44,743 56,014 56,922 Management, scientific, and technical consulting 22,296 25,777 32,138 34,483 38,549
Other 33,759 36,403 38,068 48,738 52,366 Legal services -25 (D) 18 (D) (D) Accounting, tax preparation, bookkeeping, and payroll services 125 163 193 221 239
Specialized design services 227 5 7 8 9 Scientific research and development services 2,759 2,922 3,602 3,817 4,265 Advertising and related services (D) (D) (D) (D) (D) Other professional, scientific, and technical services (D) (D) (D) (D) 15,706
Other industries 539,139 521,415 512,914 515,930 591,595 Agriculture, forestry, fishing, and hunting 3,881 4,043 4,657 4,880 4,671
Crop production 1,349 1,346 1,814 1,855 1,663 Animal production 2,395 2,510 2,615 2,373 2,317 Forestry and logging 128 168 213 251 266 Fishing, hunting, and trapping 13 13 11 (D) (D) Support activities for agriculture and forestry -4 5 4 (D) (D)
Mining 136,318 120,110 126,961 109,527 115,090 Oil and gas extraction 61,813 47,676 54,761 38,360 36,888 Mining (except oil and gas) 38,054 35,224 35,185 33,562 35,691
Coal mining (D) 1,686 (D) -169 -11
Continues on next page
85

Bureau of Economic AnalysisTable 15. Foreign Direct Investment in the United States: Selected Items by Detailed Industryof U.S. Affiliate, 2012–2016 [Millions of dollars]Release Date: July 24, 2017
Direct investment position on a historical-cost basis 2012 2013 2014 2015 2016
Metal ore mining 32,827 29,470 29,305 29,096 30,852 Iron ores (D) (D) 359 383 268 Gold and silver ores 20,765 17,405 16,933 15,660 16,553 Copper, nickel, lead, and zinc ores 10,460 10,240 11,667 12,815 13,904 Other metal ores (D) (D) 346 239 127
Nonmetallic mineral mining and quarrying (D) 4,068 (D) 4,635 4,851 Support activities for mining 36,451 37,210 37,014 37,605 42,511
Support activities for oil and gas extraction 35,456 35,842 35,781 36,355 41,278 Support activities for mining, except for oil and gas extraction 995 1,367 1,233 1,250 1,233
Utilities 65,851 65,917 67,067 66,389 89,711 Electric power generation, transmission, and distribution 61,948 61,570 62,649 61,106 82,950
Natural gas distribution (D) (D) (D) (D) (D) Water, sewage, and other systems (D) (D) (D) (D) (D)
Construction 12,320 18,032 20,970 22,361 23,290 Construction of buildings 5,100 8,249 9,444 10,508 11,362 Heavy and civil engineering construction 6,365 8,809 10,260 10,696 10,519 Specialty trade contractors 855 974 1,265 1,157 1,409
Transportation and warehousing 43,086 48,079 74,396 69,822 80,854 Air transportation 1,510 902 959 527 (D) Rail transportation (D) (D) (D) (D) (D) Water transportation -288 (D) (D) (D) (D)
Petroleum tanker operations (D) 61 49 (D) 46 Other water transportation (D) (D) (D) (D) (D)
Truck transportation 290 139 459 459 482 Transit and ground passenger transportation 4,539 5,273 5,526 5,918 6,261 Pipeline transportation 15,492 17,775 24,400 (D) (D)
Pipeline transportation of crude oil, refined petroleum products, and natural gas 15,483 17,766 24,391 (D) (D)
Other pipeline transportation 10 9 9 (D) (D) Scenic and sightseeing transportation 29 28 28 27 26 Support activities for transportation 9,506 10,198 10,655 15,243 16,518 Couriers and messengers (D) (D) (D) (D) (D) Warehousing and storage 2,160 2,377 2,783 2,798 2,076
Petroleum storage for hire (D) (D) (D) (D) (D) Other warehousing and storage (D) (D) (D) (D) (D)
Holding companies (nonbank) 212,117 197,740 151,513 175,256 172,489 Holding companies, except bank holding companies 210,782 196,532 144,413 168,493 (D)
Corporate, subsidiary, and regional management offices 1,336 1,208 7,100 6,762 (D)
Administration, support, and waste management 33,783 34,287 35,864 31,805 61,020
Administrative and support services (D) 31,614 33,319 28,333 (D) Office administrative services (D) (D) (D) (D) (D) Facilities support services (D) (D) (D) -50 -55 Employment services 3,646 3,644 3,866 3,737 4,354 Business support services 2,269 3,092 3,859 4,368 6,061 Travel arrangement and reservation services 1,837 2,190 2,893 2,927 3,149
Investigation and security services 14,365 14,204 14,308 9,528 (D) Services to buildings and dwellings (D) (D) (D) (D) (D) Other support services 58 72 1,129 (D) 5,015
Waste management and remediation services (D) 2,673 2,545 3,473 (D)
Health care and social assistance 9,656 11,245 9,284 9,743 13,167 Ambulatory health care services (D) 10,317 8,579 9,224 12,694
Continues on next page
86
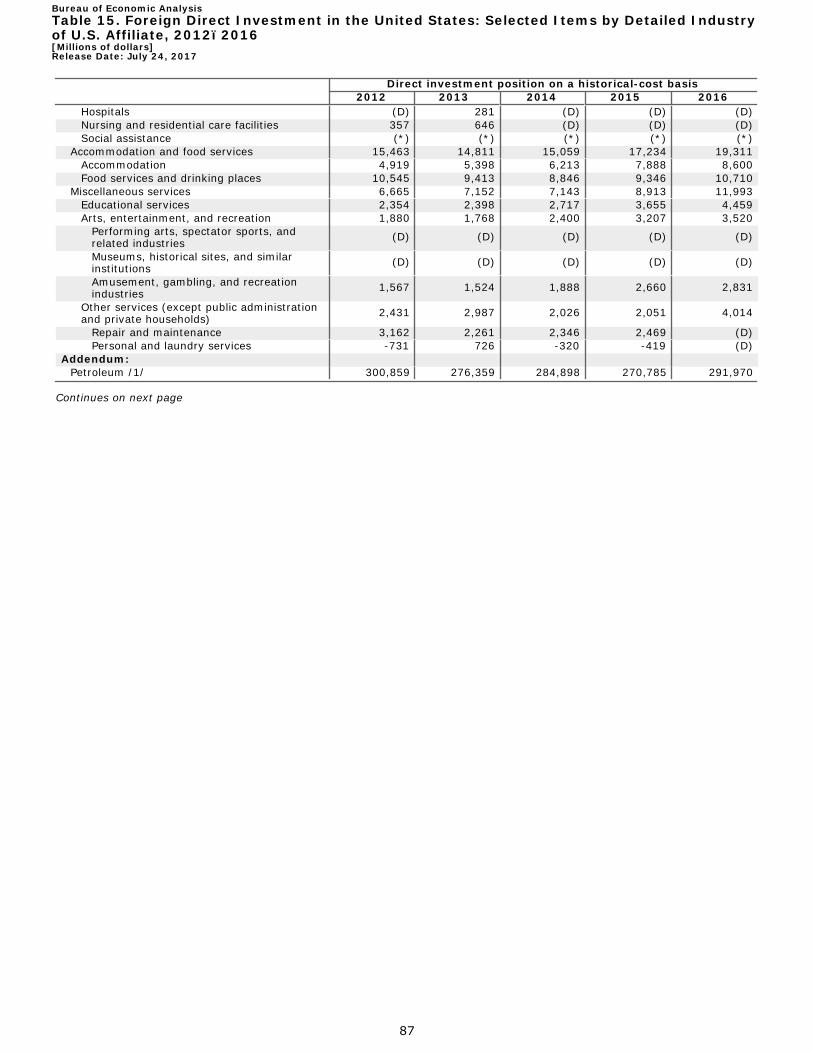
Bureau of Economic AnalysisTable 15. Foreign Direct Investment in the United States: Selected Items by Detailed Industryof U.S. Affiliate, 2012–2016 [Millions of dollars]Release Date: July 24, 2017
Direct investment position on a historical-cost basis 2012 2013 2014 2015 2016
Hospitals Nursing and residential care facilities Social assistance
Accommodation and food services Accommodation Food services and drinking places
Miscellaneous services Educational services Arts, entertainment, and recreation
Performing arts, spectator sports, and related industries Museums, historical sites, and similar institutions Amusement, gambling, and recreation industries
Other services (except public administration and private households)
Repair and maintenance Personal and laundry services
Addendum: Petroleum /1/
(D) 357 (*)
15,463 4,919
10,545 6,665 2,354 1,880
(D)
(D)
1,567
2,431
3,162 -731
300,859
281 646 (*)
14,811 5,398 9,413 7,152 2,398 1,768
(D)
(D)
1,524
2,987
2,261 726
276,359
(D) (D) (*)
15,059 6,213 8,846 7,143 2,717 2,400
(D)
(D)
1,888
2,026
2,346 -320
284,898
(D) (D) (*)
17,234 7,888 9,346 8,913 3,655 3,207
(D)
(D)
2,660
2,051
2,469 -419
270,785
(D) (D) (*)
19,311 8,600
10,710 11,993 4,459 3,520
(D)
(D)
2,831
4,014
(D) (D)
291,970
Continues on next page
87

Bureau of Economic AnalysisTable 15. Foreign Direct Investment in the United States: Selected Items by Detailed Industryof U.S. Affiliate, 2012–2016 [Millions of dollars]Release Date: July 24, 2017
Financial transactions without current-cost adjustment (inflows (+); outflows (-))
2012 2013 2014 2015 2016 All industries 199,034 201,393 201,733 465,765 457,125
Manufacturing 103,392 85,619 162,123 326,847 203,775 Food 1,944 15,661 9,812 10,521 5,278
Animal foods (D) (D) (D) (D) 861 Grain and oilseed milling 337 (D) 587 (D) (D) Sugar and confectionery products (D) 142 (D) (D) 117 Fruit and vegetable preserving and specialty foods (D) 63 1,956 -654 200
Dairy products 759 587 185 496 677 Meat products (D) (D) 1,653 (D) 47 Seafood product preparation and packaging -70 137 135 440 -14 Bakeries and tortillas 156 1,101 1,787 -791 71 Other food products -500 3,285 1,397 -2,439 (D)
Chemicals 56,193 61,712 80,370 168,098 112,691 Basic chemicals 14,628 11,788 13,707 9,033 16,952 Resins and synthetic rubber, fibers, and filaments 1,687 3,063 807 -182 803
Pharmaceuticals and medicines 35,696 45,152 52,800 149,108 89,313 Soap, cleaning compounds, and toilet preparations 1,583 536 1,002 1,580 1,920
Other 2,599 1,173 12,055 8,559 3,704 Pesticides, fertilizers, and other agricultural chemicals 242 93 1,170 -269 6
Paints, coatings, and adhesives 2,281 839 1,349 -1,841 3,490 Other chemical products and preparations 76 241 9,536 10,669 207
Primary and fabricated metals -1,688 2,951 349 4,690 541 Primary metals -3,225 1,235 -232 3,906 -310
Iron and steel mills and ferroalloys -2,064 984 -3,788 984 76 Steel products from purchased steel 15 18 2,154 2,374 567 Alumina and aluminum production and processing -1,166 138 83 336 (D)
Nonferrous metal (except aluminum) production and processing -41 -15 (D) 14 103
Foundries 31 111 (D) 198 (D) Fabricated metal products 1,537 1,716 581 783 852
Forging and stamping 49 -83 -139 -42 -36 Cutlery and handtools 1 (*) (*) -1 -1 Architectural and structural metals -187 109 298 37 162 Boilers, tanks, and shipping containers (D) (D) (D) 51 (D) Hardware 446 (D) (D) (D) 772 Spring and wire products 492 -86 -176 151 -34 Machine shops, turned products, and screws, nuts, and bolts 117 98 61 31 32
Coating, engraving, heat treating, and allied activities 19 55 110 71 72
Other fabricated metal products (D) 1,051 403 (D) (D) Machinery 7,918 286 4,726 10,329 2,496
Agriculture, construction, and mining machinery 3,730 1,660 2,610 -619 343
Industrial machinery 1,143 -5,699 1,989 1,201 -16 Other 3,045 4,325 127 9,747 2,169
Commercial and service industry machinery -150 53 141 (D) 92
Ventilation, heating, air-conditioning, and commercial refrigeration equipment -376 86 81 167 3,811
Metalworking machinery (D) 359 497 (D) (D) Engines, turbines, and power transmission equipment (D) 2,771 -1,847 (D) (D)
Other general purpose machinery 1,596 1,057 1,255 1,114 460 Computers and electronic products 850 -3,321 13,072 4,294 12,157
Computers and peripheral equipment 713 252 (D) (D) 8,921 Communications equipment 983 (D) 4,222 2,192 -1,417
Continues on next page
88

Bureau of Economic AnalysisTable 15. Foreign Direct Investment in the United States: Selected Items by Detailed Industryof U.S. Affiliate, 2012–2016 [Millions of dollars]Release Date: July 24, 2017
Financial transactions without current-cost adjustment (inflows (+); outflows (-))
2012 2013 2014 2015 2016 Semiconductors and other electronic components -1,861 -688 4,384 -259 5,421
Navigational, measuring, and other instruments 942 186 1,754 2,002 -750
Other 72 (D) (D) (D) -18 Audio and video equipment (D) (D) -343 (D) -16 Magnetic and optical media (D) -9 (D) (D) -1
Electrical equipment, appliances, and components 24,018 6,062 2,769 1,476 4,640
Electric lighting equipment (D) (D) (D) (D) (D) Household appliances (D) (D) (D) (D) 1,938 Electrical equipment (D) 6,014 2,067 (D) 2,515 Other electrical equipment and components 213 52 138 -620 (D)
Transportation equipment 7,841 468 8,014 22,140 11,091 Motor vehicles, bodies and trailers, and parts 6,632 1,892 7,127 16,989 9,552
Motor vehicles 1,771 -623 2,440 (D) (D) Motor vehicle bodies and trailers 4 1 2 (D) (D) Motor vehicle parts 4,857 2,514 4,685 18,224 7,135
Other 1,209 -1,424 887 5,151 1,539 Aerospace products and parts 549 -764 375 3,266 1,473 Railroad rolling stock 71 -140 (D) -26 -27 Ship and boat building 580 -504 360 (D) 240 Other transportation equipment 8 -16 (D) (D) -147
Other manufacturing 6,317 1,800 43,010 105,299 54,881 Beverages and tobacco products -1,514 1,686 32,846 7,456 27,779
Beverages -2,412 1,836 32,977 (D) (D) Tobacco products 897 -150 -131 (D) (D)
Textiles, apparel, and leather products 250 301 164 109 -4 Textile mills 40 281 11 33 -21 Textile product mills (D) 13 (D) (D) (D) Apparel 129 7 94 22 1 Leather and allied products (D) (*) (D) (D) (D)
Paper 119 368 262 515 380 Pulp, paper, and paperboard mills -67 -82 6 29 80 Converted paper products 185 450 256 487 300
Printing and related support activities 138 114 396 (D) 639 Petroleum and coal products 6,286 (D) -5,557 7,292 (D)
Integrated petroleum refining and extraction (D) (D) (D) (D) (D)
Petroleum refining excluding oil and gas extraction (D) -407 (D) (D) (D)
Asphalt and other petroleum and coal products 239 172 148 111 99
Plastics and rubber products 249 1,786 11,323 3,238 5,997 Plastics products -1,081 128 1,336 723 1,291 Rubber products 1,330 1,657 9,987 2,515 4,706
Nonmetallic mineral products -3,530 1,655 -564 3,489 3,891 Clay products and refractories 648 2,361 -219 261 3 Glass and glass products 1,137 -514 6 392 799 Cement and concrete products -5,629 -30 -1,133 2,383 2,015 Lime and gypsum products 312 -139 82 (D) (D) Other nonmetallic mineral products 2 -23 700 (D) (D)
Wood products -78 -170 132 267 35 Furniture and related products -195 (D) 33 121 (D) Miscellaneous manufacturing 4,591 2,319 3,975 (D) (D)
Medical equipment and supplies 4,613 2,596 3,959 (D) 6,850
Continues on next page
89

Bureau of Economic AnalysisTable 15. Foreign Direct Investment in the United States: Selected Items by Detailed Industryof U.S. Affiliate, 2012–2016 [Millions of dollars]Release Date: July 24, 2017
Financial transactions without current-cost adjustment (inflows (+); outflows (-))
2012 2013 2014 2015 2016 Other miscellaneous manufacturing -22 -277 16 2,925 (D)
Wholesale trade 23,502 26,400 30,533 22,468 8,490 Motor vehicles and motor vehicle parts and supplies 2,140 6,557 6,711 2,638 -7,460
Electrical goods 9,583 5,209 5,991 5,014 1,184 Petroleum and petroleum products 5,631 -1,526 3,178 4,759 2,417 Other 6,148 16,160 14,652 10,058 12,349
Other durable goods 5,456 5,163 5,123 -1,357 3,870 Furniture and home furnishings 60 460 -1,019 -23 -224 Lumber and other construction materials 114 26 181 66 -75 Professional and commercial equipment and supplies 2,355 507 3,679 -331 1,732
Metals and minerals (except petroleum) 408 -219 2,421 -205 172 Hardware, and plumbing and heating equipment and supplies 541 -569 -1,834 229 1,021
Machinery, equipment, and supplies merchant wholesalers 1,302 4,541 1,682 146 1,255
Miscellaneous durable goods 675 417 13 -1,238 -12 Other nondurable goods 696 10,997 (D) 11,030 (D)
Paper and paper products 474 66 -13 305 267 Drugs and druggists' sundries 449 4,533 6,646 8,810 5,541 Apparel, piece goods, and notions 519 517 -2,303 -119 -564 Groceries and related products 401 547 1,423 559 987 Farm product raw materials -1,218 3,215 1,361 -68 25 Chemical and allied products -129 1,471 -1,175 255 909 Beer, wine, and distilled alcoholic beverages -15 349 1,914 780 363
Miscellaneous nondurable goods 214 298 (D) 508 (D) Wholesale electronic markets and agents and brokers -4 1 (D) 385 (D)
Retail trade 3,271 3,051 15,061 4,481 9,582 Food and beverage stores 931 1,766 3,018 1,048 2,660 Other 2,340 1,285 12,043 3,433 6,921
Motor vehicle and parts dealers -25 30 44 -100 7 Furniture and home furnishings stores 160 (D) -124 (D) (D) Electronics and appliance stores (D) (*) 8 3 22 Building material and garden equipment and supplies dealers (D) 2 (D) (D) (D)
Health and personal care stores 106 270 (D) 51 110 Gasoline stations (D) (D) (D) (D) (D) Clothing and clothing accessories stores 340 211 1,344 1,202 1,488 Sporting goods, hobby, book, and music stores (D) (D) (D) (D) (D)
General merchandise stores (D) (D) (D) (D) (D) Miscellaneous store retailers 439 1,017 (D) (D) (D) Nonstore retailers -191 -544 768 60 29
Information -2,955 31,579 11,178 11,619 17,393 Publishing industries 1,922 -3,623 7,381 4,044 2,127
Newspaper, periodical, book, and database publishers 1,432 986 2,015 479 457
Software publishers 490 -4,609 5,365 3,565 1,671 Telecommunications 733 30,966 910 779 -1,185
Wired telecommunications carriers 1,161 (D) 130 430 123 Wireless telecommunications carriers (except satellite) (D) (D) 719 -512 -616
Satellite telecommunications -508 (D) 426 -711 -991 Other telecommunications (D) 379 -365 1,573 299
Other -5,610 4,236 2,887 6,796 16,451 Motion picture and sound recording industries -322 893 2,458 2,316 387
Motion picture and video industries (D) (D) (D) (D) (D)
Continues on next page
90

Bureau of Economic AnalysisTable 15. Foreign Direct Investment in the United States: Selected Items by Detailed Industryof U.S. Affiliate, 2012–2016 [Millions of dollars]Release Date: July 24, 2017
Financial transactions without current-cost adjustment (inflows (+); outflows (-))
2012 2013 2014 2015 2016 Sound recording industries (D) (D) (D) (D) (D)
Broadcasting (except internet) -8 (D) 43 -222 (D) Radio and television broadcasting (D) -20 -15 (D) (D) Cable and other subscription programming (D) (D) 58 (D) (D)
Data processing, hosting, and related services -41 23 1,454 384 11
Other information services -5,240 (D) -1,069 4,318 (D) Depository institutions (banking) -2,262 8,763 3,706 2,009 6,043
Banks -4,926 5,298 410 -2,415 3,976 Branches and agencies 2,665 3,466 3,296 4,425 2,067
Finance (except depository institutions) and insurance 23,274 20,362 20,990 35,972 72,623
Finance, except depository institutions 13,229 8,396 18,708 14,015 30,491 Nondepository credit intermediation and related services -2,555 -38 4,226 -4,626 -2,101
Non-depository credit intermediation -3,316 -200 4,072 -4,700 -2,353 Activities related to credit intermediation 760 162 154 74 252
Securities, commodity contracts, and other intermediation and related activities 15,936 8,013 11,119 19,524 31,913
Securities and commodity contracts intermediation and brokerage 4,825 4,220 2,629 8,809 22,055
Other financial investment activities and exchanges 11,110 3,793 8,491 10,715 9,858
Funds, trusts, and other financial vehicles -152 421 3,363 -884 680 Insurance carriers and related activities 10,045 11,966 2,282 21,957 42,132
Insurance carriers, except life insurance carriers -8,269 12,140 4 11,714 (D)
Life insurance carriers (D) -880 1,357 8,767 10,815 Agencies, brokerages, and other insurance related activities (D) 706 921 1,477 (D)
Real estate and rental and leasing 7,821 943 11,741 8,478 7,099 Real estate 2,291 220 6,142 4,775 5,354 Rental and leasing (except real estate) 5,530 723 5,598 3,703 1,745
Automotive equipment rental and leasing (D) (D) (D) (D) (D) Other rental and leasing services 679 1,483 (D) (D) (D) Lessors of nonfinancial intangible assets (except copyrighted works) (D) (D) -2,723 1,338 761
Professional, scientific, and technical services 9,158 8,066 18,214 21,797 42,827
Architectural, engineering, and related services 493 1,659 2,670 -345 35,320 Computer systems design and related services 7,903 1,739 11,961 11,109 741 Management, scientific, and technical consulting 1,777 1,993 1,731 2,018 3,405
Other -1,015 2,676 1,852 9,016 3,361 Legal services (D) (D) (D) (D) (D) Accounting, tax preparation, bookkeeping, and payroll services 58 (D) 29 28 18
Specialized design services (D) 3 2 1 1 Scientific research and development services 82 -2 764 166 405 Advertising and related services -207 1,263 (D) (D) 1,401 Other professional, scientific, and technical services -978 1,576 1,303 (D) (D)
Other industries 33,833 16,611 -71,814 32,093 89,293 Agriculture, forestry, fishing, and hunting 142 120 603 153 178
Crop production 10 35 470 -1 179 Animal production 149 60 126 -258 -40 Forestry and logging -6 15 11 (D) 6 Fishing, hunting, and trapping 1 (*) -3 (D) (D) Support activities for agriculture and forestry -13 10 -1 13 (D)
Mining 9,685 -2,834 12,781 -911 15,551 Oil and gas extraction 2,431 -4,640 6,860 -1,006 -719 Mining (except oil and gas) 9,473 -645 2,121 -1,539 2,354
Coal mining 121 -60 -356 (D) 2
Continues on next page
91
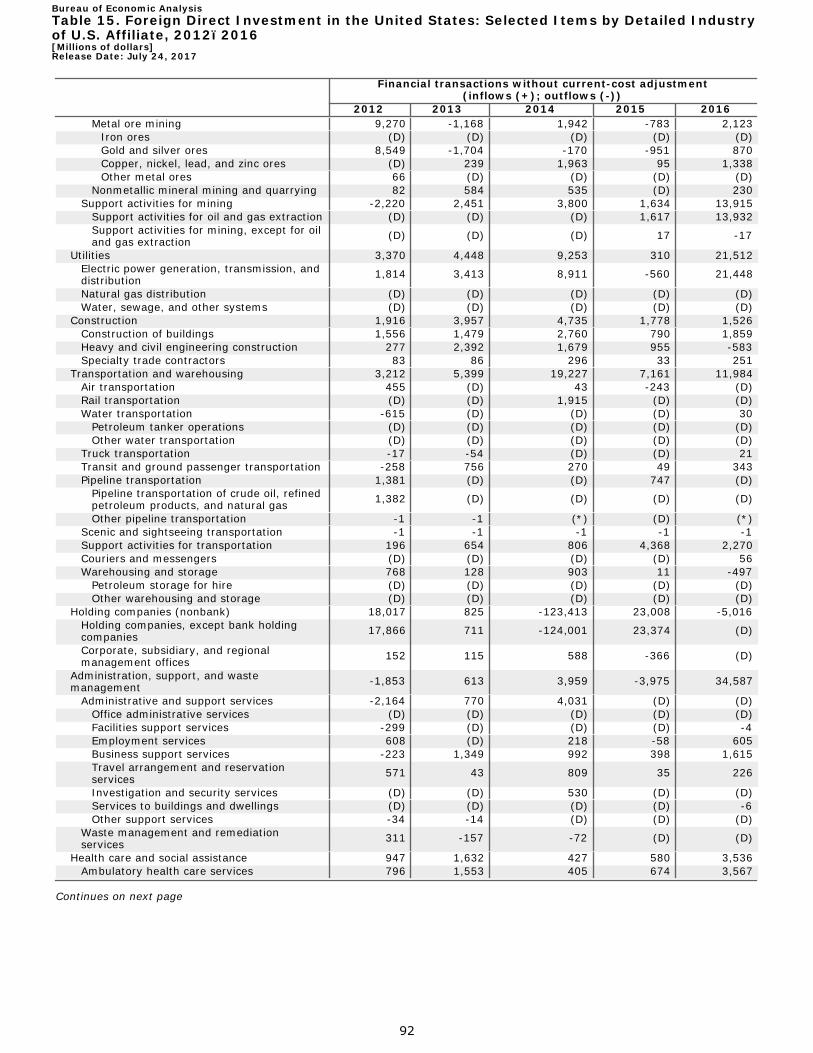
Bureau of Economic AnalysisTable 15. Foreign Direct Investment in the United States: Selected Items by Detailed Industryof U.S. Affiliate, 2012–2016 [Millions of dollars]Release Date: July 24, 2017
Financial transactions without current-cost adjustment (inflows (+); outflows (-))
2012 2013 2014 2015 2016 Metal ore mining 9,270 -1,168 1,942 -783 2,123
Iron ores (D) (D) (D) (D) (D) Gold and silver ores 8,549 -1,704 -170 -951 870 Copper, nickel, lead, and zinc ores (D) 239 1,963 95 1,338 Other metal ores 66 (D) (D) (D) (D)
Nonmetallic mineral mining and quarrying 82 584 535 (D) 230 Support activities for mining -2,220 2,451 3,800 1,634 13,915
Support activities for oil and gas extraction (D) (D) (D) 1,617 13,932 Support activities for mining, except for oil and gas extraction (D) (D) (D) 17 -17
Utilities 3,370 4,448 9,253 310 21,512 Electric power generation, transmission, and distribution 1,814 3,413 8,911 -560 21,448
Natural gas distribution (D) (D) (D) (D) (D) Water, sewage, and other systems (D) (D) (D) (D) (D)
Construction 1,916 3,957 4,735 1,778 1,526 Construction of buildings 1,556 1,479 2,760 790 1,859 Heavy and civil engineering construction 277 2,392 1,679 955 -583 Specialty trade contractors 83 86 296 33 251
Transportation and warehousing 3,212 5,399 19,227 7,161 11,984 Air transportation 455 (D) 43 -243 (D) Rail transportation (D) (D) 1,915 (D) (D) Water transportation -615 (D) (D) (D) 30
Petroleum tanker operations (D) (D) (D) (D) (D) Other water transportation (D) (D) (D) (D) (D)
Truck transportation -17 -54 (D) (D) 21 Transit and ground passenger transportation -258 756 270 49 343 Pipeline transportation 1,381 (D) (D) 747 (D)
Pipeline transportation of crude oil, refined petroleum products, and natural gas 1,382 (D) (D) (D) (D)
Other pipeline transportation -1 -1 (*) (D) (*) Scenic and sightseeing transportation -1 -1 -1 -1 -1 Support activities for transportation 196 654 806 4,368 2,270 Couriers and messengers (D) (D) (D) (D) 56 Warehousing and storage 768 128 903 11 -497
Petroleum storage for hire (D) (D) (D) (D) (D) Other warehousing and storage (D) (D) (D) (D) (D)
Holding companies (nonbank) 18,017 825 -123,413 23,008 -5,016 Holding companies, except bank holding companies 17,866 711 -124,001 23,374 (D)
Corporate, subsidiary, and regional management offices 152 115 588 -366 (D)
Administration, support, and waste management -1,853 613 3,959 -3,975 34,587
Administrative and support services -2,164 770 4,031 (D) (D) Office administrative services (D) (D) (D) (D) (D) Facilities support services -299 (D) (D) (D) -4 Employment services 608 (D) 218 -58 605 Business support services -223 1,349 992 398 1,615 Travel arrangement and reservation services 571 43 809 35 226
Investigation and security services (D) (D) 530 (D) (D) Services to buildings and dwellings (D) (D) (D) (D) -6 Other support services -34 -14 (D) (D) (D)
Waste management and remediation services 311 -157 -72 (D) (D)
Health care and social assistance 947 1,632 427 580 3,536 Ambulatory health care services 796 1,553 405 674 3,567
Continues on next page
92

Bureau of Economic AnalysisTable 15. Foreign Direct Investment in the United States: Selected Items by Detailed Industryof U.S. Affiliate, 2012–2016 [Millions of dollars]Release Date: July 24, 2017
Financial transactions without current-cost adjustment (inflows (+); outflows (-))
2012 2013 2014 2015 2016 Hospitals Nursing and residential care facilities Social assistance
Accommodation and food services Accommodation Food services and drinking places
Miscellaneous services Educational services Arts, entertainment, and recreation
Performing arts, spectator sports, and related industries Museums, historical sites, and similar institutions Amusement, gambling, and recreation industries
Other services (except public administration and private households)
Repair and maintenance Personal and laundry services
Addendum: Petroleum /1/
(D) (D) (*)
-2,509 -2,817
307 906
-357 201
(D)
(D)
28
1,062
(D) (D)
15,383
(D) (D) (*)
1,056 744 312
1,395 -38
-107
(D)
(D)
-43
1,541
(D) (D)
-6,908
(D) (D) (*)
174 764
-590 441 382 101
(D)
(D)
62
-42
(D) (D)
12,967
(D) (D) (*)
2,190 1,655
534 1,800
915 861
(D)
(D)
825
24
(D) (D)
15,117
(D) (D) (*)
1,954 608
1,346 3,481 1,135
415
(D)
(D)
225
1,932
(D) (D)
33,270
Continues on next page
93
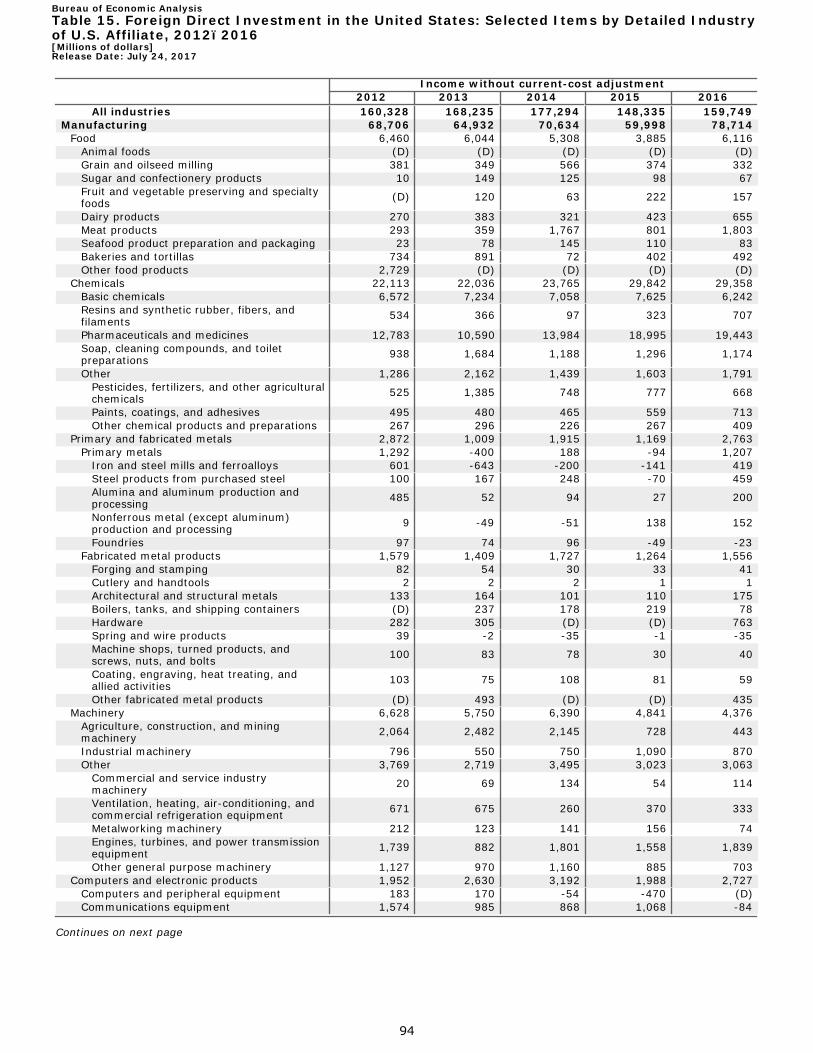
Bureau of Economic AnalysisTable 15. Foreign Direct Investment in the United States: Selected Items by Detailed Industryof U.S. Affiliate, 2012–2016 [Millions of dollars]Release Date: July 24, 2017
Income without current-cost adjustment 2012 2013 2014 2015 2016
All industries 160,328 168,235 177,294 148,335 159,749 Manufacturing 68,706 64,932 70,634 59,998 78,714
Food 6,460 6,044 5,308 3,885 6,116 Animal foods (D) (D) (D) (D) (D) Grain and oilseed milling 381 349 566 374 332 Sugar and confectionery products 10 149 125 98 67 Fruit and vegetable preserving and specialty foods (D) 120 63 222 157
Dairy products 270 383 321 423 655 Meat products 293 359 1,767 801 1,803 Seafood product preparation and packaging 23 78 145 110 83 Bakeries and tortillas 734 891 72 402 492 Other food products 2,729 (D) (D) (D) (D)
Chemicals 22,113 22,036 23,765 29,842 29,358 Basic chemicals 6,572 7,234 7,058 7,625 6,242 Resins and synthetic rubber, fibers, and filaments 534 366 97 323 707
Pharmaceuticals and medicines 12,783 10,590 13,984 18,995 19,443 Soap, cleaning compounds, and toilet preparations 938 1,684 1,188 1,296 1,174
Other 1,286 2,162 1,439 1,603 1,791 Pesticides, fertilizers, and other agricultural chemicals 525 1,385 748 777 668
Paints, coatings, and adhesives 495 480 465 559 713 Other chemical products and preparations 267 296 226 267 409
Primary and fabricated metals 2,872 1,009 1,915 1,169 2,763 Primary metals 1,292 -400 188 -94 1,207
Iron and steel mills and ferroalloys 601 -643 -200 -141 419 Steel products from purchased steel 100 167 248 -70 459 Alumina and aluminum production and processing 485 52 94 27 200
Nonferrous metal (except aluminum) production and processing 9 -49 -51 138 152
Foundries 97 74 96 -49 -23 Fabricated metal products 1,579 1,409 1,727 1,264 1,556
Forging and stamping 82 54 30 33 41 Cutlery and handtools 2 2 2 1 1 Architectural and structural metals 133 164 101 110 175 Boilers, tanks, and shipping containers (D) 237 178 219 78 Hardware 282 305 (D) (D) 763 Spring and wire products 39 -2 -35 -1 -35 Machine shops, turned products, and screws, nuts, and bolts 100 83 78 30 40
Coating, engraving, heat treating, and allied activities 103 75 108 81 59
Other fabricated metal products (D) 493 (D) (D) 435 Machinery 6,628 5,750 6,390 4,841 4,376
Agriculture, construction, and mining machinery 2,064 2,482 2,145 728 443
Industrial machinery 796 550 750 1,090 870 Other 3,769 2,719 3,495 3,023 3,063
Commercial and service industry machinery 20 69 134 54 114
Ventilation, heating, air-conditioning, and commercial refrigeration equipment 671 675 260 370 333
Metalworking machinery 212 123 141 156 74 Engines, turbines, and power transmission equipment 1,739 882 1,801 1,558 1,839
Other general purpose machinery 1,127 970 1,160 885 703 Computers and electronic products 1,952 2,630 3,192 1,988 2,727
Computers and peripheral equipment 183 170 -54 -470 (D) Communications equipment 1,574 985 868 1,068 -84
Continues on next page
94

Bureau of Economic AnalysisTable 15. Foreign Direct Investment in the United States: Selected Items by Detailed Industryof U.S. Affiliate, 2012–2016 [Millions of dollars]Release Date: July 24, 2017
Income without current-cost adjustment 2012 2013 2014 2015 2016
Semiconductors and other electronic components -649 229 1,255 484 1,885
Navigational, measuring, and other instruments 1,105 1,363 1,123 865 1,435
Other -261 -116 (*) 42 (D) Audio and video equipment (D) -109 2 42 (D) Magnetic and optical media (D) -7 -2 (*) 1
Electrical equipment, appliances, and components 3,481 1,449 1,093 2,164 3,079
Electric lighting equipment (D) (D) (D) (D) (D) Household appliances (D) (D) (D) (D) (D) Electrical equipment 2,714 1,058 905 1,832 2,721 Other electrical equipment and components 100 43 -73 84 59
Transportation equipment 7,304 6,241 9,520 8,444 9,923 Motor vehicles, bodies and trailers, and parts 5,780 5,051 7,584 7,803 8,911
Motor vehicles 3,603 2,671 3,938 (D) 3,696 Motor vehicle bodies and trailers 3 3 3 (D) 4 Motor vehicle parts 2,174 2,377 3,642 4,426 5,211
Other 1,523 1,191 1,936 641 1,011 Aerospace products and parts 1,122 703 1,578 184 623 Railroad rolling stock 61 41 (*) 14 15 Ship and boat building 322 432 312 (D) (D) Other transportation equipment 18 15 46 (D) (D)
Other manufacturing 17,896 19,772 19,450 7,665 20,372 Beverages and tobacco products 2,037 2,370 3,371 3,633 5,242
Beverages 1,811 2,197 3,128 (D) 4,776 Tobacco products 226 173 243 (D) 466
Textiles, apparel, and leather products 195 400 150 167 134 Textile mills 100 319 47 78 91 Textile product mills 20 19 (D) (D) (D) Apparel 76 63 51 39 20 Leather and allied products -1 (*) (D) (D) (D)
Paper 279 253 270 368 431 Pulp, paper, and paperboard mills 52 -130 8 15 35 Converted paper products 227 383 262 353 396
Printing and related support activities 160 168 203 202 209 Petroleum and coal products 10,343 9,262 7,889 -4,884 1,002
Integrated petroleum refining and extraction (D) (D) (D) (D) (D)
Petroleum refining excluding oil and gas extraction 1,620 (D) (D) (D) (D)
Asphalt and other petroleum and coal products (D) 193 144 111 85
Plastics and rubber products 2,090 2,662 2,915 2,848 3,837 Plastics products 401 601 828 758 878 Rubber products 1,690 2,061 2,088 2,090 2,959
Nonmetallic mineral products -334 231 1,190 2,454 2,226 Clay products and refractories 26 11 40 131 115 Glass and glass products 266 -17 -16 63 111 Cement and concrete products -828 -181 624 1,790 1,525 Lime and gypsum products 186 236 184 163 171 Other nonmetallic mineral products 17 182 357 306 304
Wood products 66 359 175 77 186 Furniture and related products 105 92 69 86 95 Miscellaneous manufacturing 2,954 3,976 3,217 2,714 7,010
Medical equipment and supplies 2,669 3,749 2,871 2,266 6,455
Continues on next page
95
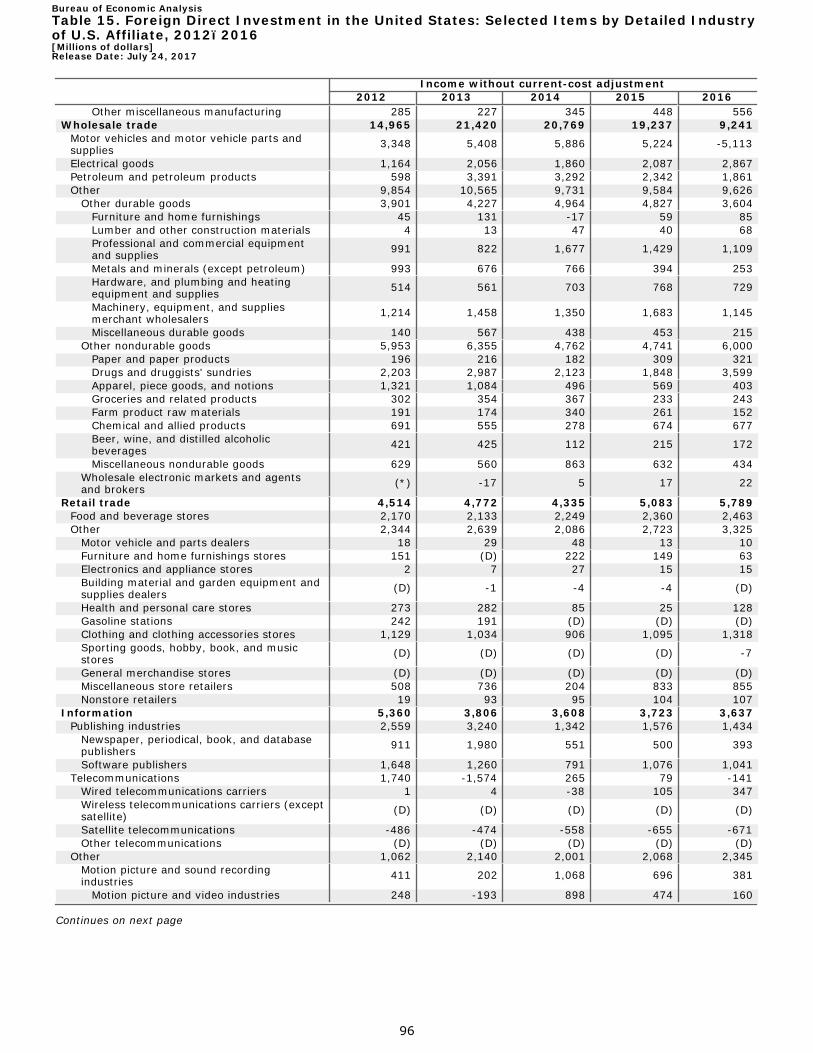
Bureau of Economic AnalysisTable 15. Foreign Direct Investment in the United States: Selected Items by Detailed Industryof U.S. Affiliate, 2012–2016 [Millions of dollars]Release Date: July 24, 2017
Income without current-cost adjustment 2012 2013 2014 2015 2016
Other miscellaneous manufacturing 285 227 345 448 556 Wholesale trade 14,965 21,420 20,769 19,237 9,241
Motor vehicles and motor vehicle parts and supplies 3,348 5,408 5,886 5,224 -5,113
Electrical goods 1,164 2,056 1,860 2,087 2,867 Petroleum and petroleum products 598 3,391 3,292 2,342 1,861 Other 9,854 10,565 9,731 9,584 9,626
Other durable goods 3,901 4,227 4,964 4,827 3,604 Furniture and home furnishings 45 131 -17 59 85 Lumber and other construction materials 4 13 47 40 68 Professional and commercial equipment and supplies 991 822 1,677 1,429 1,109
Metals and minerals (except petroleum) 993 676 766 394 253 Hardware, and plumbing and heating equipment and supplies 514 561 703 768 729
Machinery, equipment, and supplies merchant wholesalers 1,214 1,458 1,350 1,683 1,145
Miscellaneous durable goods 140 567 438 453 215 Other nondurable goods 5,953 6,355 4,762 4,741 6,000
Paper and paper products 196 216 182 309 321 Drugs and druggists' sundries 2,203 2,987 2,123 1,848 3,599 Apparel, piece goods, and notions 1,321 1,084 496 569 403 Groceries and related products 302 354 367 233 243 Farm product raw materials 191 174 340 261 152 Chemical and allied products 691 555 278 674 677 Beer, wine, and distilled alcoholic beverages 421 425 112 215 172
Miscellaneous nondurable goods 629 560 863 632 434 Wholesale electronic markets and agents and brokers (*) -17 5 17 22
Retail trade 4,514 4,772 4,335 5,083 5,789 Food and beverage stores 2,170 2,133 2,249 2,360 2,463 Other 2,344 2,639 2,086 2,723 3,325
Motor vehicle and parts dealers 18 29 48 13 10 Furniture and home furnishings stores 151 (D) 222 149 63 Electronics and appliance stores 2 7 27 15 15 Building material and garden equipment and supplies dealers (D) -1 -4 -4 (D)
Health and personal care stores 273 282 85 25 128 Gasoline stations 242 191 (D) (D) (D) Clothing and clothing accessories stores 1,129 1,034 906 1,095 1,318 Sporting goods, hobby, book, and music stores (D) (D) (D) (D) -7
General merchandise stores (D) (D) (D) (D) (D) Miscellaneous store retailers 508 736 204 833 855 Nonstore retailers 19 93 95 104 107
Information 5,360 3,806 3,608 3,723 3,637 Publishing industries 2,559 3,240 1,342 1,576 1,434
Newspaper, periodical, book, and database publishers 911 1,980 551 500 393
Software publishers 1,648 1,260 791 1,076 1,041 Telecommunications 1,740 -1,574 265 79 -141
Wired telecommunications carriers 1 4 -38 105 347 Wireless telecommunications carriers (except satellite) (D) (D) (D) (D) (D)
Satellite telecommunications -486 -474 -558 -655 -671 Other telecommunications (D) (D) (D) (D) (D)
Other 1,062 2,140 2,001 2,068 2,345 Motion picture and sound recording industries 411 202 1,068 696 381
Motion picture and video industries 248 -193 898 474 160
Continues on next page
96

Bureau of Economic AnalysisTable 15. Foreign Direct Investment in the United States: Selected Items by Detailed Industryof U.S. Affiliate, 2012–2016 [Millions of dollars]Release Date: July 24, 2017
Income without current-cost adjustment 2012 2013 2014 2015 2016
Sound recording industries 163 395 170 222 221 Broadcasting (except internet) -43 (D) (D) (D) (D)
Radio and television broadcasting -27 -16 -10 -6 -3 Cable and other subscription programming -17 (D) (D) (D) (D)
Data processing, hosting, and related services -47 -12 -24 -17 -39
Other information services 741 (D) (D) (D) (D) Depository institutions (banking) 6,307 8,581 11,357 9,046 8,162
Banks 1,154 3,417 4,270 3,539 3,555 Branches and agencies 5,153 5,165 7,087 5,507 4,607
Finance (except depository institutions) and insurance 23,740 28,604 27,824 24,121 29,573
Finance, except depository institutions 14,040 14,531 17,052 12,144 14,068 Nondepository credit intermediation and related services 4,325 4,191 2,974 2,709 950
Non-depository credit intermediation 4,110 4,032 2,798 2,532 494 Activities related to credit intermediation 215 160 177 177 456
Securities, commodity contracts, and other intermediation and related activities 8,806 9,489 13,161 8,767 12,447
Securities and commodity contracts intermediation and brokerage 7,413 4,540 4,316 3,498 6,720
Other financial investment activities and exchanges 1,393 4,949 8,845 5,269 5,727
Funds, trusts, and other financial vehicles 910 850 917 668 671 Insurance carriers and related activities 9,700 14,074 10,772 11,977 15,505
Insurance carriers, except life insurance carriers 3,130 4,658 3,338 4,021 5,844
Life insurance carriers 6,019 8,904 6,456 7,220 8,703 Agencies, brokerages, and other insurance related activities 551 511 978 736 958
Real estate and rental and leasing 1,012 2,447 2,941 3,841 4,242 Real estate 641 1,356 1,228 1,432 1,996 Rental and leasing (except real estate) 371 1,091 1,713 2,408 2,247
Automotive equipment rental and leasing (D) (D) (D) (D) (D) Other rental and leasing services (D) (D) (D) (D) (D) Lessors of nonfinancial intangible assets (except copyrighted works) 274 786 454 582 329
Professional, scientific, and technical services 2,642 3,444 3,682 5,198 4,132
Architectural, engineering, and related services 328 618 367 455 118 Computer systems design and related services 1,112 1,085 1,158 1,208 724 Management, scientific, and technical consulting 758 875 685 951 1,327
Other 444 866 1,472 2,584 1,964 Legal services (D) 27 (D) (D) (D) Accounting, tax preparation, bookkeeping, and payroll services 11 9 28 21 13
Specialized design services 30 3 3 2 2 Scientific research and development services -257 -251 -121 125 182 Advertising and related services 702 873 1,208 1,572 1,151 Other professional, scientific, and technical services (D) 205 (D) (D) (D)
Other industries 33,083 30,230 32,144 18,090 16,259 Agriculture, forestry, fishing, and hunting 185 156 186 67 191
Crop production 84 76 82 66 215 Animal production 105 76 69 -19 -60 Forestry and logging 7 5 30 9 7 Fishing, hunting, and trapping 5 4 3 (D) (D) Support activities for agriculture and forestry -15 -6 2 (D) (D)
Mining 7,642 4,995 8,952 -1,210 -2,456 Oil and gas extraction 911 -279 3,755 -3,522 -4,310 Mining (except oil and gas) 4,719 3,393 2,262 617 917
Coal mining -76 -64 -174 (D) (*)
Continues on next page
97

Bureau of Economic AnalysisTable 15. Foreign Direct Investment in the United States: Selected Items by Detailed Industryof U.S. Affiliate, 2012–2016 [Millions of dollars]Release Date: July 24, 2017
Income without current-cost adjustment 2012 2013 2014 2015 2016
Metal ore mining 4,409 3,130 1,985 529 878 Iron ores (D) (D) (D) (D) (D) Gold and silver ores 3,089 2,262 985 338 771 Copper, nickel, lead, and zinc ores 1,144 771 1,066 329 186 Other metal ores (D) (D) (D) (D) (D)
Nonmetallic mineral mining and quarrying 386 327 451 (D) 38 Support activities for mining 2,012 1,880 2,935 1,695 937
Support activities for oil and gas extraction 1,960 1,881 2,931 1,718 964 Support activities for mining, except for oil and gas extraction 52 -1 4 -23 -27
Utilities 1,533 2,002 3,228 2,262 2,606 Electric power generation, transmission, and distribution 1,450 1,746 2,927 2,040 2,356
Natural gas distribution 36 (D) (D) (D) (D) Water, sewage, and other systems 47 (D) (D) (D) (D)
Construction 929 1,201 1,593 1,495 1,035 Construction of buildings 619 634 876 583 724 Heavy and civil engineering construction 161 457 550 762 187 Specialty trade contractors 148 110 167 151 125
Transportation and warehousing 2,212 2,965 3,209 3,780 3,154 Air transportation 81 102 (D) -26 -4 Rail transportation (D) (D) 1,495 (D) (D) Water transportation -226 67 -90 126 48
Petroleum tanker operations (D) (D) (D) (D) (D) Other water transportation (D) (D) (D) (D) (D)
Truck transportation -32 -35 8 10 2 Transit and ground passenger transportation 246 244 280 396 429 Pipeline transportation 957 842 1,036 1,138 (D)
Pipeline transportation of crude oil, refined petroleum products, and natural gas 958 842 1,036 1,138 (D)
Other pipeline transportation -1 -1 (*) (*) (*) Scenic and sightseeing transportation (*) 1 1 1 1 Support activities for transportation 41 437 71 485 524 Couriers and messengers (D) (D) (D) (D) (D) Warehousing and storage 227 468 295 230 149
Petroleum storage for hire (D) (D) (D) (D) (D) Other warehousing and storage (D) (D) (D) (D) (D)
Holding companies (nonbank) 16,617 15,197 11,164 8,209 7,267 Holding companies, except bank holding companies 16,809 15,150 11,071 7,762 7,045
Corporate, subsidiary, and regional management offices -192 47 93 447 222
Administration, support, and waste management 2,747 1,970 2,305 1,835 2,184
Administrative and support services 2,394 1,885 2,229 1,785 (D) Office administrative services (D) (D) (D) (D) (D) Facilities support services -8 (D) 11 2 2 Employment services 153 147 202 -96 364 Business support services 112 240 262 236 291 Travel arrangement and reservation services 137 177 311 183 201
Investigation and security services 993 358 551 576 441 Services to buildings and dwellings (D) (D) (D) (D) -6 Other support services (D) -8 (D) (D) -145
Waste management and remediation services 353 85 76 50 (D)
Health care and social assistance 717 860 636 784 870 Ambulatory health care services 662 760 548 (D) (D)
Continues on next page
98

Bureau of Economic AnalysisTable 15. Foreign Direct Investment in the United States: Selected Items by Detailed Industryof U.S. Affiliate, 2012–2016 [Millions of dollars]Release Date: July 24, 2017
Income without current-cost adjustment 2012 2013 2014 2015 2016
Hospitals Nursing and residential care facilities Social assistance
Accommodation and food services Accommodation Food services and drinking places
Miscellaneous services Educational services Arts, entertainment, and recreation
Performing arts, spectator sports, and related industries Museums, historical sites, and similar institutions Amusement, gambling, and recreation industries
Other services (except public administration and private households)
Repair and maintenance Personal and laundry services
Addendum: Petroleum /1/
30 25 (*)
478 -301 779 22 4
-170
(D)
(D)
-137
188
58 130
15,023
(D) (D) (*)
661 -155 816 223 -76 -58
(D)
(D)
2
356
273 83
15,400
(D) (D) (*)
876 139 737
-6 -2
-99
-51
(D)
(D)
95
91 4
19,354
(D) (D) (*)
1,006 224 782
-139 -141 -73
-12
(D)
(D)
76
65 11
-2,576
(D) (D) (*)
1,575 550
1,025 -166 -132 -43
(D)
(D)
29
9
(D) (D)
942
Legend / Footnotes: 1. Petroleum consists of oil and gas extraction; support activities for oil and gas extraction; petroleum and coal products manufacturing; petroleum and petroleum products wholesale trade; gasoline stations; petroleum tanker operations; pipeline transportation of crude oil, refined petroleum products, and natural gas; and petroleum storage for hire. Note. Inflows increase the foreign direct investment position in the United States, while outflows decrease it.
99

Bureau of Economic AnalysisTable 16. Historical-Cost Foreign Direct Investment Position in the United States and Income Without Current-CostAdjustment, by Country of Foreign-Parent-Group Member and of the Ultimate Beneficial Owner, 2014-2016 /1/[Millions of dollars]Release Date: July 24, 2017
2014 By country of each member of the By country of ultimate beneficial
foreign parent group owner Position on a Income without Position on a Income without historical-cost current-cost historical-cost current-cost
basis adjustment basis adjustment All countries 2,945,795 177,294 2,945,795 177,294
Canada 273,896 15,032 328,089 16,239 Europe 2,004,199 122,793 1,760,618 114,716
Austria 6,962 532 3,073 203 Belgium 97,038 4,748 44,257 2,926 Denmark 13,322 1,095 13,188 1,060 Finland 4,284 612 7,678 800 France 202,682 10,774 218,339 12,986 Germany 251,009 17,595 327,995 22,531 Ireland 26,431 3,752 136,291 5,914 Italy 23,508 1,815 33,071 2,820 Luxembourg 232,288 7,597 12,086 -500 Netherlands 258,177 20,740 131,678 12,806 Norway 19,539 732 33,408 964 Spain 63,956 1,079 61,892 1,283 Sweden 40,142 3,274 43,566 3,252 Switzerland 245,188 20,075 154,550 15,924 United Kingdom 479,373 27,147 520,463 31,319 Other 40,300 1,224 19,083 429
Latin America and Other Western Hemisphere 117,051 8,835 128,870 8,745
South and Central America 25,083 3,066 66,186 4,205 Brazil 1,444 175 18,530 1,706 Mexico 15,198 1,858 33,302 1,788 Panama 2,350 148 704 10 Venezuela 3,926 (D) 4,326 (D) Other 2,166 (D) 9,324 (D)
Other Western Hemisphere 91,967 5,769 62,683 4,541 Bahamas 813 86 355 (D) Bermuda 993 1,965 32,139 1,705 Curacao 1,982 -207 (D) (D) Netherlands Antilles United Kingdom Islands, Caribbean Other 834 -15 639 34
Africa 1,691 488 3,474 843 South Africa 329 414 3,075 777 Other 1,362 74 399 65
Middle East 16,467 346 62,255 725 Israel 6,175 302 20,561 690 Kuwait 1,072 25 318 -14 Lebanon -19 (*) 255 26 Saudi Arabia (D) (D) 11,542 -65 United Arab Emirates 2,618 166 26,208 422 Other (D) (D) 3,371 -334
Asia and Pacific 532,491 29,800 574,655 31,366 Australia 56,404 3,040 60,951 3,384 China 10,071 1,416 29,049 2,366 Hong Kong 9,776 262 13,012 236 India 8,927 657 11,514 805 Japan 371,874 20,126 373,120 20,142 Korea, Republic of 39,966 2,734 37,900 2,694 Malaysia 1,154 4 1,304 -47 New Zealand 1,048 21 1,210 243 Singapore 20,665 845 33,675 589 Taiwan 6,107 618 9,439 943 Other 6,498 78 3,482 11
United States ------------ ------------ 87,833 4,661
87,344 3,939 (D) 1,027
Continues on next page
100
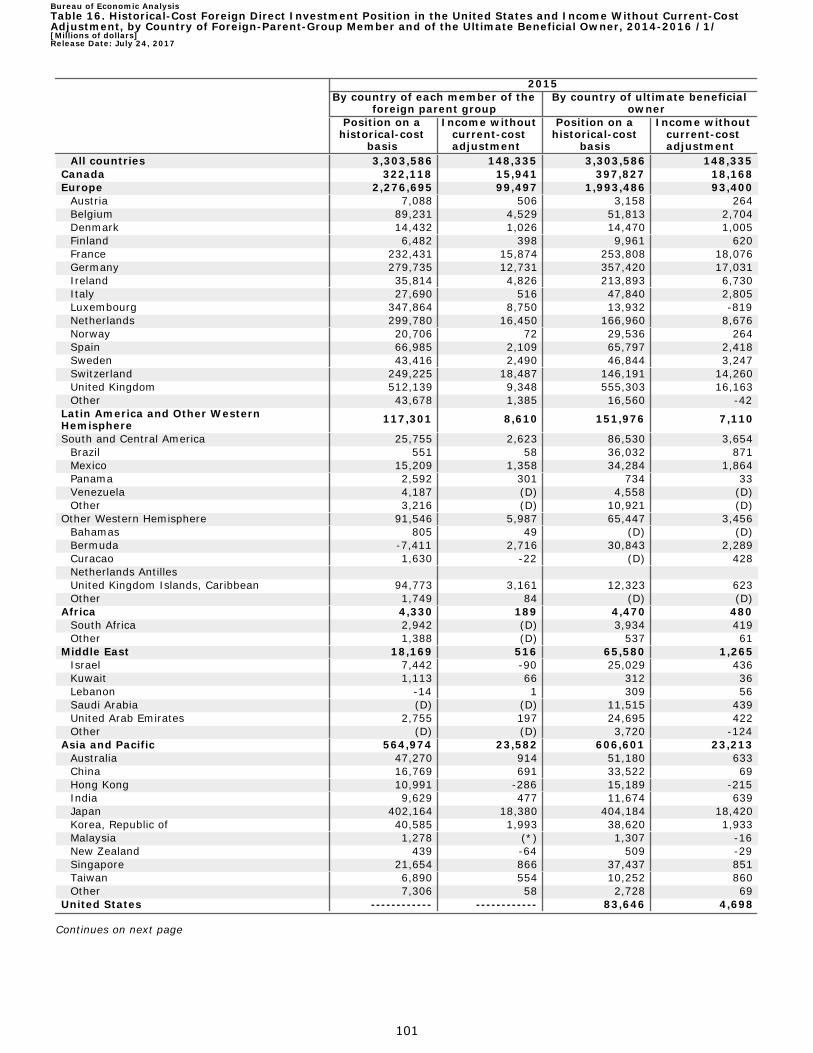
Bureau of Economic AnalysisTable 16. Historical-Cost Foreign Direct Investment Position in the United States and Income Without Current-CostAdjustment, by Country of Foreign-Parent-Group Member and of the Ultimate Beneficial Owner, 2014-2016 /1/[Millions of dollars]Release Date: July 24, 2017
2015 By country of each member of the By country of ultimate beneficial
foreign parent group owner Position on a Income without Position on a Income without historical-cost current-cost historical-cost current-cost
basis adjustment basis adjustment All countries 3,303,586 148,335 3,303,586 148,335
Canada 322,118 15,941 397,827 18,168 Europe 2,276,695 99,497 1,993,486 93,400
Austria 7,088 506 3,158 264 Belgium 89,231 4,529 51,813 2,704 Denmark 14,432 1,026 14,470 1,005 Finland 6,482 398 9,961 620 France 232,431 15,874 253,808 18,076 Germany 279,735 12,731 357,420 17,031 Ireland 35,814 4,826 213,893 6,730 Italy 27,690 516 47,840 2,805 Luxembourg 347,864 8,750 13,932 -819 Netherlands 299,780 16,450 166,960 8,676 Norway 20,706 72 29,536 264 Spain 66,985 2,109 65,797 2,418 Sweden 43,416 2,490 46,844 3,247 Switzerland 249,225 18,487 146,191 14,260 United Kingdom 512,139 9,348 555,303 16,163 Other 43,678 1,385 16,560 -42
Latin America and Other Western Hemisphere 117,301 8,610 151,976 7,110
South and Central America 25,755 2,623 86,530 3,654 Brazil 551 58 36,032 871 Mexico 15,209 1,358 34,284 1,864 Panama 2,592 301 734 33 Venezuela 4,187 (D) 4,558 (D) Other 3,216 (D) 10,921 (D)
Other Western Hemisphere 91,546 5,987 65,447 3,456 Bahamas 805 49 (D) (D) Bermuda -7,411 2,716 30,843 2,289 Curacao 1,630 -22 (D) 428 Netherlands Antilles United Kingdom Islands, Caribbean Other 1,749 84 (D) (D)
Africa 4,330 189 4,470 480 South Africa 2,942 (D) 3,934 419 Other 1,388 (D) 537 61
Middle East 18,169 516 65,580 1,265 Israel 7,442 -90 25,029 436 Kuwait 1,113 66 312 36 Lebanon -14 1 309 56 Saudi Arabia (D) (D) 11,515 439 United Arab Emirates 2,755 197 24,695 422 Other (D) (D) 3,720 -124
Asia and Pacific 564,974 23,582 606,601 23,213 Australia 47,270 914 51,180 633 China 16,769 691 33,522 69 Hong Kong 10,991 -286 15,189 -215 India 9,629 477 11,674 639 Japan 402,164 18,380 404,184 18,420 Korea, Republic of 40,585 1,993 38,620 1,933 Malaysia 1,278 (*) 1,307 -16 New Zealand 439 -64 509 -29 Singapore 21,654 866 37,437 851 Taiwan 6,890 554 10,252 860 Other 7,306 58 2,728 69
United States ------------ ------------ 83,646 4,698
94,773 3,161 12,323 623
Continues on next page
101

Bureau of Economic AnalysisTable 16. Historical-Cost Foreign Direct Investment Position in the United States and Income Without Current-CostAdjustment, by Country of Foreign-Parent-Group Member and of the Ultimate Beneficial Owner, 2014-2016 /1/[Millions of dollars]Release Date: July 24, 2017
2016 By country of each member of the By country of ultimate beneficial
foreign parent group owner Position on a Income without Position on a Income without historical-cost current-cost historical-cost current-cost
basis adjustment basis adjustment All countries 3,725,418 159,749 3,725,418 159,749
Canada 371,468 16,417 453,641 20,230 Europe 2,605,559 115,033 2,237,648 105,680
Austria 10,611 602 3,674 365 Belgium 79,854 4,647 55,940 3,254 Denmark 18,233 1,174 17,726 1,169 Finland 5,874 456 9,587 684 France 252,864 11,782 267,573 15,111 Germany 291,697 15,312 372,778 18,798 Ireland 85,460 4,711 279,647 9,468 Italy 30,010 408 48,624 2,960 Luxembourg 417,386 14,183 31,095 -255 Netherlands 355,242 19,607 191,937 8,730 Norway 25,548 -633 27,367 -558 Spain 68,169 1,561 67,179 1,547 Sweden 46,933 2,584 52,730 3,297 Switzerland 310,759 17,752 196,595 12,090 United Kingdom 555,687 19,485 598,319 28,529 Other 51,231 1,401 16,876 492
Latin America and Other Western Hemisphere 124,798 7,906 162,707 8,065
South and Central America 25,805 1,763 87,997 4,898 Brazil -1,831 16 36,869 2,695 Mexico 16,757 1,225 34,400 1,723 Panama 2,922 260 785 59 Venezuela 4,457 196 4,742 202 Other 3,500 66 11,201 218
Other Western Hemisphere 98,993 6,143 74,711 3,168 Bahamas 484 -39 411 (D) Bermuda 9,361 1,308 33,460 1,425 Curacao 1,660 -71 (D) 366 Netherlands Antilles United Kingdom Islands, Caribbean Other 1,434 96 748 (D)
Africa 4,394 177 4,632 268 South Africa 3,114 177 4,038 201 Other 1,280 (*) 594 67
Middle East 19,826 1,133 98,649 3,015 Israel 8,136 312 55,362 1,359 Kuwait 1,122 29 286 3 Lebanon -13 1 367 60 Saudi Arabia (D) (D) 12,320 799 United Arab Emirates 2,843 236 26,324 896 Other (D) (D) 3,991 -103
Asia and Pacific 599,373 19,083 693,739 18,892 Australia 46,926 5 54,307 (*) China 27,475 27 58,154 -915 Hong Kong 11,649 -109 15,194 -276 India 9,852 120 12,089 437 Japan 421,103 16,781 424,347 16,771 Korea, Republic of 40,937 1,639 38,750 1,642 Malaysia 1,136 4 1,484 61 New Zealand 176 -145 585 -28 Singapore 23,933 282 73,677 611 Taiwan 7,196 378 10,798 532 Other 8,991 102 4,354 58
United States ------------ ------------ 74,402 3,599
86,054 4,848 (D) 1,425
Legend / Footnotes: 1. The ultimate beneficial owner is that person, proceeding up a U.S. affiliate's ownership chain, beginning with and including the foreign parent, that is not owned more than 50 percent by another person. The country of ultimate beneficial owner is often the same as that or the foreign parent, but it may be a different country or the United States.
102

Bureau of Economic AnalysisTable 17. Historical-Cost Foreign Direct Investment Position in the United States by Industryof the Ultimate Beneficial Owner, 2014-2016 [Millions of dollars]Release Date: July 24, 2017
All industries Government and government-related entities Individuals, estates, and trusts Manufacturing Wholesale and retail trade Information Depository institutions and bank holding companies Finance (except depository institutions) and insurance Real estate Professional, scientific, and technical services Other industries
2014 2015 2016 2,945,795 3,303,586 3,725,418
151,073 151,986 155,916 225,153 251,181 280,588
1,261,798 1,495,943 1,689,048 89,032 90,686 98,664
146,442 167,137 168,231
307,097 319,458 333,896
257,927 292,717 366,207
20,673 24,418 27,882 103,722 118,362 132,952 382,878 391,698 472,035
103