foreign direct investment, economic growth, and political ... · foreign direct investment,...
TRANSCRIPT
JOURNAL OF ECONOMIC DEVELOPMENT 17 Volume 42, Number 2, June 2017
FOREIGN DIRECT INVESTMENT, ECONOMIC GROWTH, AND
POLITICAL INSTABILITY
KEVIN WILLIAMS
University of the West Indies, Trinidad and Tobago
This paper studies the relationship between FDI and economic growth in a system of
simultaneous equations framework. The system of simultaneous equations model exploits
that the relationship between FDI and growth is endogenously determined with respect to
each other. Our empirical results yield that growth responds significantly positive to FDI.
FDI on the other hand does not respond significantly to growth. In addition, we construct
several dimensions of political instability and document that political instability has
differential effect on FDI and growth. We show that the effect that these dimensions of
political instability have on growth and FDI is not different in Sub-Saharan Africa, a region
that experiences high incidence of politically instability.
Keywords: Foreign Direct Investment, Economic Growth, Political Instability JEL Classification: F23, F04, D74
1. INTRODUCTION
Foreign direct investment (FDI) and economic growth have attracted much attention from policy makers, development agencies, and researchers, not least because they hold huge potential of improving the welfare of the vast number of poor people living in developing countries, but also because they are expected to complement each other. This suggests that, holding other things equal, faster growing economies will attract higher inflows of FDI and higher levels of FDI will in turn boost growth in the recipient country. This is especially possible in the current wave of globalization where goods and services, labor, and international financial capital cross national-state borders with fewer restrictions than before. However, not all international capital inflows to developing countries are growth-inducing, yet some theoretical models make the argument for full international capital liberalization. One argument goes as follows: ‘By breaking the constraint that domestic investment is limited to the volume of national saving, capital inflows can be used to finance a more rapid pace of growth than a country could achieve on its own’ (Bosworth, 2005, p. 1). Capital inflows with short-term horizon are unlikely however to generate sustainable growth in developing countries.
KEVIN WILLIAMS 18
Short-term capital inflows were widely believed to have contributed to the financial crisis and subsequent economic crisis in East Asia in the late 1990s and in Mexico in 1994. And there is evidence that the recent financial crisis in the U.S. was propagated to developing countries through the short-term dynamics of international capital flows. Short-term capital can enter and exit a developing country at the same speed, generating severe economic and financial shocks, leaving that country in a worse economic and financial position upon exit. This makes the case for FDI stronger in developing countries; hence capital liberalization policy should crowd out short-term capital and crowd in FDI (Stiglitz, 2000). FDI has longer-term predictability relative to the short-term variety, so policy makers can incorporate FDI in the development process with less fear of ‘sudden stops’ and thus fewer shocks to their economies. Long-term capital inflows in the form of FDI will reduce uncertainty, increase productivity, and improve growth in developing countries.
Thus, the benefits of the potential complementary effect of FDI and growth are more likely to be realized in developing countries – higher standard of living and reliable access of public goods through higher tax revenues. This paper studies how FDI responds to growth and whether FDI in turn stimulates growth in developing economies within a system of simultaneous equations model, using a three-stage least squares (3SLS) estimator. We go beyond many previous studies that only examined the effect of growth on FDI or the other way around, for example, Durham (2004), Reisen and Soto (2001), and Nair-Reichert and Weinhold (2001). From a policy perspective, this is important as the analysis here seeks to enhance our understanding of the relationship between FDI and economic growth and, we hope, informs policy outcomes in developing countries. Our paper makes several contributions to economic literature. First, the paper documents that FDI improves growth in developing countries but FDI does not respond significantly to growth.
In our second contribution to the literature on growth and FDI, we construct several dimensions of political instability and examine their effect on growth and FDI in the simultaneous equations framework. We find that political instability affects growth and FDI differently. In our final contribution, we test whether these dimensions of political instability impact FDI and growth differently in Sub-Sahara Africa (SSA) relative to a global sample of developing countries. We do not find supporting evidence that political instability affects FDI and growth in SSA differently.
The rest of the paper is organized as follows. Section 2 discusses the literature on FDI and economic growth. Section 3 presents the empirical model and the data. Section 4 contains the empirical results on FDI and growth. Section 5 investigates whether political instability affects growth and FDI differently. Section 6 presents estimates of the effect of political instability on growth and FDI in SSA. Section 7 concludes the paper.
FOREIGN DIRECT INVESTMENT, ECONOMIC GROWTH, AND POLITICAL INSTABILITY 19
2. RELATED LITERATURE
In this section we discuss the empirical studies that linked FDI and economic growth. This empirical evidence is ambiguous. Li and Liu (2005) examined the relationship between FDI and economic growth in a panel of 84 developed and developing countries over 1970-1999. They found that FDI and economic growth were endogenously related, but this was only for the sub-period 1985-99. While Li and Xiaming (2005) made no distinction between developed and developing countries, the present study focuses on developing countries. This distinction is important. Because developed and developing economies have different characteristics along many dimensions, policies based on evidence in developed countries are unlikely to work in developing countries. Developed countries are more attractive to FDI and they have stronger institutional frameworks that make them more likely to maximize the growth effect of FDI. Other cross-country evidence includes Nair-Reichert and Weinhold (2001), Reisen and Soto (2001), Hsiao and Shen (2003), and Durham (2004). These studies examined the relationship between FDI and growth within a single equation framework and found mixed evidence. We build on these studies by allowing the relationship between FDI and growth to be endogenously determined.
Case study evidence is also ambiguous. Bende-Nabende and Ford (1998) used Taiwan’s data to illustrate that growth and FDI were endogenously related. In Chile, Chowdhury and Mavrotas (2006) found that growth attracted higher levels of FDI. To counter these findings Basu et al. (2003) have argued that the relationship between growth and FDI is conditional on whether a country is a closed or an open economy, finding evidence that FDI responded significantly to growth in closed economies. In previously planned economies, FDI discouraged growth (Mencinger, 2003). Hansen and Rand (2004) however found that a larger share of FDI in a country’s capital stock promoted growth. Importantly, however, while these studies examined the relationship between FDI and growth, unlike these papers, we provide evidence on the differential effect that political instability has on growth and FDI in our panel of developing countries. And we also examine whether political instability affects growth and FDI differently in SSA. This is an important departure relative to previous studies that examined the relationship between growth and FDI. One recent paper examined the spillover effect of FDI on domestic firms in India and found positive effect (Behera, 2015), while Lee (2015) studied the potential determinants of FDI in previously centrally planned economies for the implication of autocratic North Korea.
3. ESTIMATION FRAMEWORK AND DATA
Gupta et al. (2009) specify a system of two equations and used the three-stage least squares estimator to estimate the endogenous relationship between poverty and remittances in Africa. We adopt this approach here. The key advantage of using the three-stage least squares estimator in the system of equations is that if the relationship
KEVIN WILLIAMS 20
between growth and FDI is endogenous it allows us to observe the effect of growth and of FDI simultaneously.1 Thus, the three-stage least squares estimator is well suited to estimate the endogenous relationship between growth and FDI in a system of equations. Further, to assure the credibility of the estimates, we also perform several robustness checks. The system of equations estimated is:
= ℎ + + , (1) ℎ = + + , (2)
where and are countries and non-overlapping 5-year averages over 1975-2005 for the 68 developing countries, respectively. We use non-overlapping 5-year averages to clean the data of volatility and cyclical variation in and growth. is the ratio of net foreign direct investment inflows to GDP from the World Development Indicators (WDI). Growthit is the change in the natural logarithm of real GDP per capita between period and − 1 (in constant 2000 US$) from the WDI. is a vector of FDI determinants suggested by the empirical literature: the ratio of debt to GDP from the WDI, infrastructure as measured by the number of telephone per 1,000 population from the WDI, the quality of governance as measured by constraints on the executive from the Polity IV Project, and the annual rate of inflation from the WDI. In equation 2, is also a vector of growth controls: log initial real GDP per capita, constraints on the executive, average years of schooling in the population (age 25 years and older) from Barro and Lee (2000), and dummies for SSA and Latin America and the Caribbean (LAC).
Theoretically, there are several reasons to expect the relationship between growth and FDI to be endogenous with respect to each other. But before we proceed to estimate the system of simultaneous equations (1) and (2), we first perform a Durbin-Wu- Hausman (DWH) test of endogeneity between growth and FDI. This test helps to determine whether we are justified in treating the relationship between FDI and growth as endogenous. If the null of no endogeneity is significantly different from zero, then (in the absence of suitable external instruments) a single-equation estimator is biased and estimates based on the three-stage least squares in the system of simultaneous equations (which allows for the endogenous relationship) are relatively more efficient (Cameron and Trivedi, 2006). The DWH test of endogeneity on the residuals of the system of equations (1) and (2) returns a p-value (0.007) that is highly significant thus rejecting the null of no endogeneity and confirms the endogenous relationship between FDI and growth.
1 The three-stage least squares estimator is closely related to the two-stage least squares estimator, as it
produces two stage least squares estimates of the equations in the system simultaneously (Gupta et al., 2009).
The key drawback however is that misspecification in one equation in the system tends to affect other
equations.
FOREIGN DIRECT INVESTMENT, ECONOMIC GROWTH, AND POLITICAL INSTABILITY 21
4. EMPIRICAL RESULTS
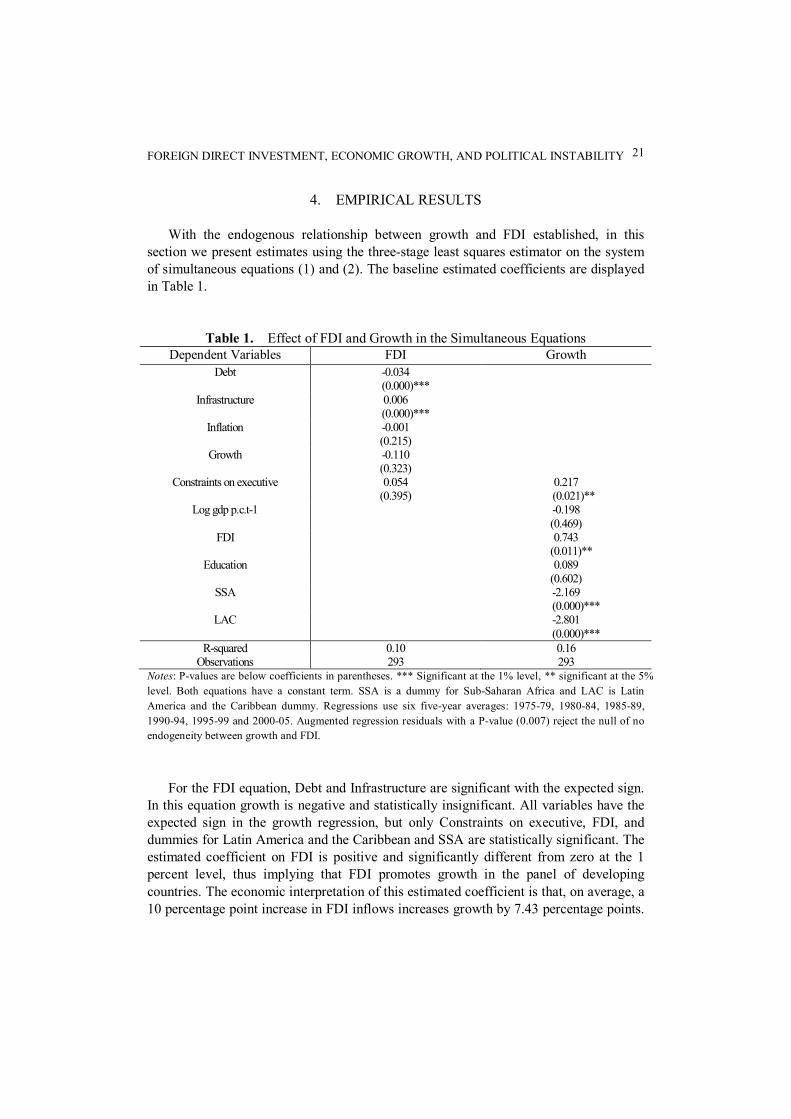
With the endogenous relationship between growth and FDI established, in this section we present estimates using the three-stage least squares estimator on the system of simultaneous equations (1) and (2). The baseline estimated coefficients are displayed in Table 1.
Table 1. Effect of FDI and Growth in the Simultaneous Equations Dependent Variables FDI Growth
Debt -0.034 (0.000)***
Infrastructure 0.006 (0.000)***
Inflation -0.001 (0.215)
Growth -0.110 (0.323)
Constraints on executive 0.054 (0.395)
0.217 (0.021)**
Log gdp p.c.t-1 -0.198 (0.469)
FDI 0.743 (0.011)**
Education 0.089 (0.602)
SSA -2.169 (0.000)***
LAC -2.801 (0.000)***
R-squared 0.10 0.16 Observations 293 293
Notes: P-values are below coefficients in parentheses. *** Significant at the 1% level, ** significant at the 5%
level. Both equations have a constant term. SSA is a dummy for Sub-Saharan Africa and LAC is Latin
America and the Caribbean dummy. Regressions use six five-year averages: 1975-79, 1980-84, 1985-89,
1990-94, 1995-99 and 2000-05. Augmented regression residuals with a P-value (0.007) reject the null of no
endogeneity between growth and FDI.
For the FDI equation, Debt and Infrastructure are significant with the expected sign. In this equation growth is negative and statistically insignificant. All variables have the expected sign in the growth regression, but only Constraints on executive, FDI, and dummies for Latin America and the Caribbean and SSA are statistically significant. The estimated coefficient on FDI is positive and significantly different from zero at the 1 percent level, thus implying that FDI promotes growth in the panel of developing countries. The economic interpretation of this estimated coefficient is that, on average, a 10 percentage point increase in FDI inflows increases growth by 7.43 percentage points.
KEVIN WILLIAMS 22
The main conclusion from these baseline estimates is that there is no evidence of a significant effect of growth on FDI, while FDI has a significant effect on growth. In Appendix Table 1A, we estimate a parsimonious model with only significant variables from Table 1. The estimated coefficients continue to be significant and retain their sign and magnitude. For example, the point estimate for FDI (0.695) is positive and significant at the 1 percent level (p-value 0.000). In the rest of this section we perform a number of robust checks on the baseline estimates in order to identify the magnitude and the direction of the effect that FDI has on growth.
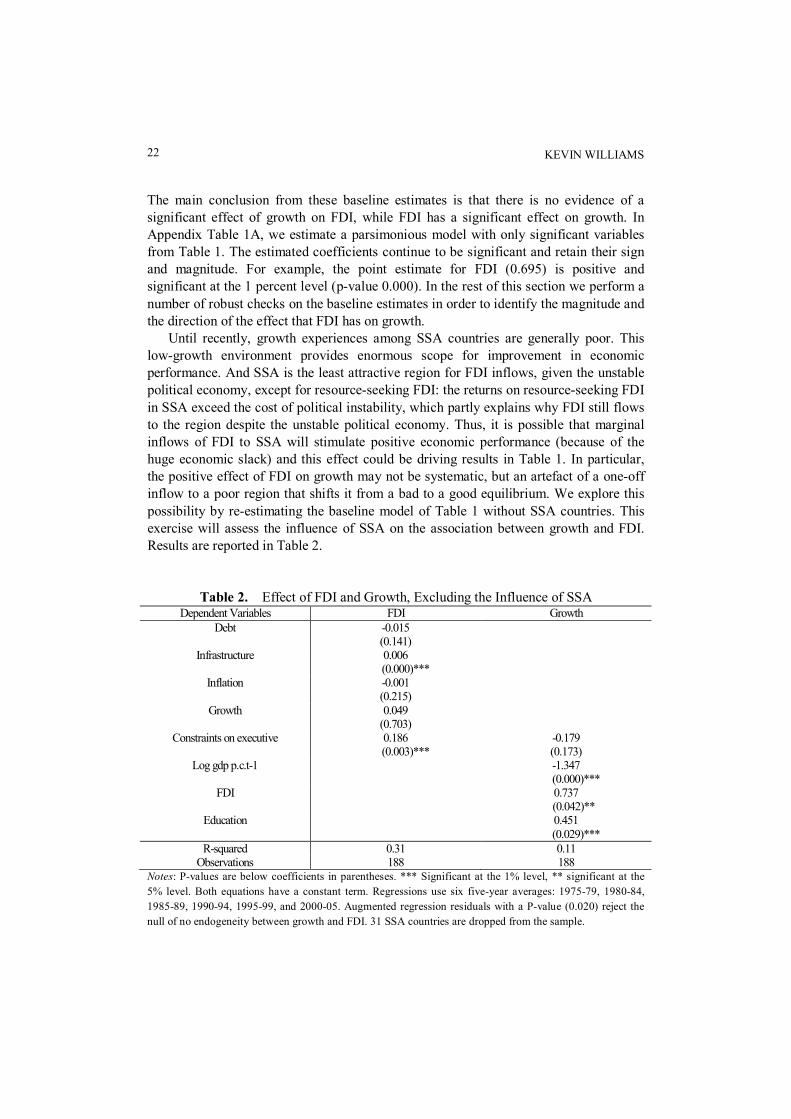
Until recently, growth experiences among SSA countries are generally poor. This low-growth environment provides enormous scope for improvement in economic performance. And SSA is the least attractive region for FDI inflows, given the unstable political economy, except for resource-seeking FDI: the returns on resource-seeking FDI in SSA exceed the cost of political instability, which partly explains why FDI still flows to the region despite the unstable political economy. Thus, it is possible that marginal inflows of FDI to SSA will stimulate positive economic performance (because of the huge economic slack) and this effect could be driving results in Table 1. In particular, the positive effect of FDI on growth may not be systematic, but an artefact of a one-off inflow to a poor region that shifts it from a bad to a good equilibrium. We explore this possibility by re-estimating the baseline model of Table 1 without SSA countries. This exercise will assess the influence of SSA on the association between growth and FDI. Results are reported in Table 2.
Table 2. Effect of FDI and Growth, Excluding the Influence of SSA Dependent Variables FDI Growth
Debt -0.015 (0.141)
Infrastructure 0.006 (0.000)***
Inflation -0.001 (0.215)
Growth 0.049 (0.703)
Constraints on executive 0.186 (0.003)***
-0.179 (0.173)
Log gdp p.c.t-1 -1.347 (0.000)***
FDI 0.737 (0.042)**
Education 0.451 (0.029)***
R-squared 0.31 0.11 Observations 188 188
Notes: P-values are below coefficients in parentheses. *** Significant at the 1% level, ** significant at the
5% level. Both equations have a constant term. Regressions use six five-year averages: 1975-79, 1980-84,
1985-89, 1990-94, 1995-99, and 2000-05. Augmented regression residuals with a P-value (0.020) reject the
null of no endogeneity between growth and FDI. 31 SSA countries are dropped from the sample.
FOREIGN DIRECT INVESTMENT, ECONOMIC GROWTH, AND POLITICAL INSTABILITY 23
When we exclude SSA countries from the sample, the estimated coefficient on growth remains statistically insignificant (p-value 0.703) at the conventional levels, column 1. In column 2, FDI continues to have a significant positive effect on growth. This is the case after we have accounted for the influence of SSA. The magnitude (0.737) of the estimated coefficient on FDI is similar to that in Table 1 where we included SSA, which is significant at the 5 percent level. We can therefore reject the hypothesis at the 5 percent level that FDI does not have a significant positive effect on growth in our sample of developing countries, even after accounting for potential outlying countries. Substantively, a 10 percentage point increase in FDI inflows raises GDP per capita growth by 7.4 percentage points. We note that the observations in Table 2 have been reduced by about 35 percent compared with Table 1. Regardless of this reduction in the observations, however, we are still able to identify a positive and significant effect of FDI on growth. The main message from Table 2 is that the marginal effect of FDI induces economic growth and this effect is not driven by a group of countries that have a poor-growth record, which provides the opportunity for rapid growth if the correct policies are introduced. The estimated coefficients on lagged GDP per capita and education are significantly related to growth, column 2. In column 1, constraints on the executive and infrastructure are positive and statistically significant.
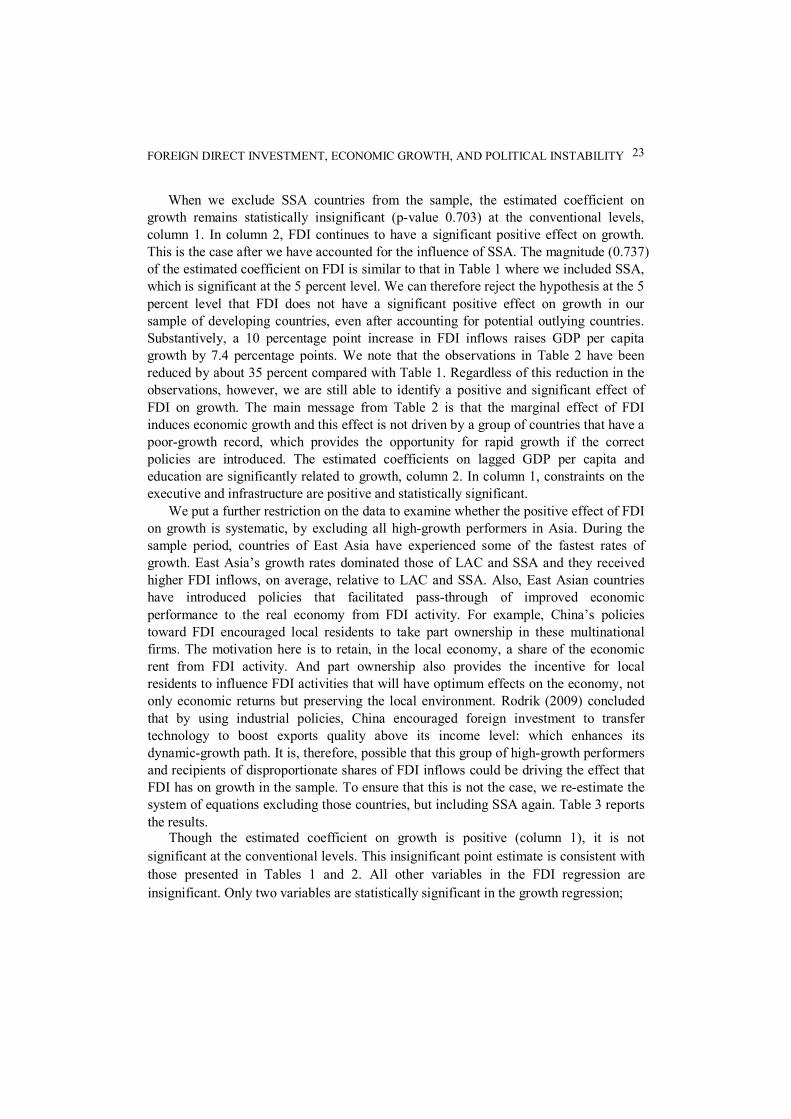
We put a further restriction on the data to examine whether the positive effect of FDI on growth is systematic, by excluding all high-growth performers in Asia. During the sample period, countries of East Asia have experienced some of the fastest rates of growth. East Asia’s growth rates dominated those of LAC and SSA and they received higher FDI inflows, on average, relative to LAC and SSA. Also, East Asian countries have introduced policies that facilitated pass-through of improved economic performance to the real economy from FDI activity. For example, China’s policies toward FDI encouraged local residents to take part ownership in these multinational firms. The motivation here is to retain, in the local economy, a share of the economic rent from FDI activity. And part ownership also provides the incentive for local residents to influence FDI activities that will have optimum effects on the economy, not only economic returns but preserving the local environment. Rodrik (2009) concluded that by using industrial policies, China encouraged foreign investment to transfer technology to boost exports quality above its income level: which enhances its dynamic-growth path. It is, therefore, possible that this group of high-growth performers and recipients of disproportionate shares of FDI inflows could be driving the effect that FDI has on growth in the sample. To ensure that this is not the case, we re-estimate the system of equations excluding those countries, but including SSA again. Table 3 reports the results.
Though the estimated coefficient on growth is positive (column 1), it is not
significant at the conventional levels. This insignificant point estimate is consistent with
those presented in Tables 1 and 2. All other variables in the FDI regression are
insignificant. Only two variables are statistically significant in the growth regression;
KEVIN WILLIAMS 24
Table 3. Effect of FDI and Growth, Excluding Countries from Asia Dependent Variables FDI Growth
Debt -0.018 (0.522)
Infrastructure 0.002 (0.419)
Inflation -0.0005 (0.215)
Growth 0.674 (0.493)
Constraints on executive -0.075 (0.075)
0.161 (0.087)*
Log gdp p.c.t-1 -0.160 (0.546)
FDI 0.707 (0.015)**
Education 0.119 (0.369)
R-squared 0.45 0.05 Observations 261 261
Notes: P-values are below coefficients in parentheses. ** Significant at the 5% level, * significant at the 10%
level. Both equations have a constant term. Regressions use six five-year averages: 1975-79, 1980-84,
1985-89, 1990-94, 1995-99, and 2000-05. Augmented regression residuals with a P-value (0.001) reject the
null of no endogeneity between growth and FDI. Excluded countries are: China, South Korea, India,
Indonesia, Malaysia, Thailand, Sri Lanka, and Singapore.
as our focus is the relationship between FDI and growth, all other variables are treated as
controls. The measure for the quality of governance is statistically significant at the 10
percent level with a positive sign. We conclude from Table 3 that the positive and
significant marginal effect of FDI on growth is robust to the exclusion of those countries
that performed relatively better on both FDI inflows and growth. This echoes the finding
in Tables 1 and 2. It is important to note that the size of the estimated coefficient (0.707)
on FDI is similar to those in Tables 1 and 2, where we used the full sample and excluded
only SSA countries, respectively.
We conduct a further robustness check on our main result that FDI has a positive effect on growth and that FDI does not respond significantly to growth by estimating two sub-samples, each consists of three non-overlapping 5-year averages, 1975-79, 1980-84, 1985-89 and 1990-94, 1995-99, 2000-05. The rationale for this analysis is that the trends toward liberalization in many developing countries were intensified from the early 1990s to the end of the sample period. During the 1990s, growth and FDI inflows to developing countries compared with the mid-1970s and 1980s were better. The oil shock in the mid-1970s and the debt crisis during the 1980s put a damper on economic activity in developing countries. Indeed, during the 1990s ‘growth soared to levels not seen in a generation’ (Stiglitz, 2004). Thus, we expect a relatively stronger effect of FDI on growth in the period 1990-2005. The results are presented in Table 4.
FOREIGN DIRECT INVESTMENT, ECONOMIC GROWTH, AND POLITICAL INSTABILITY 25
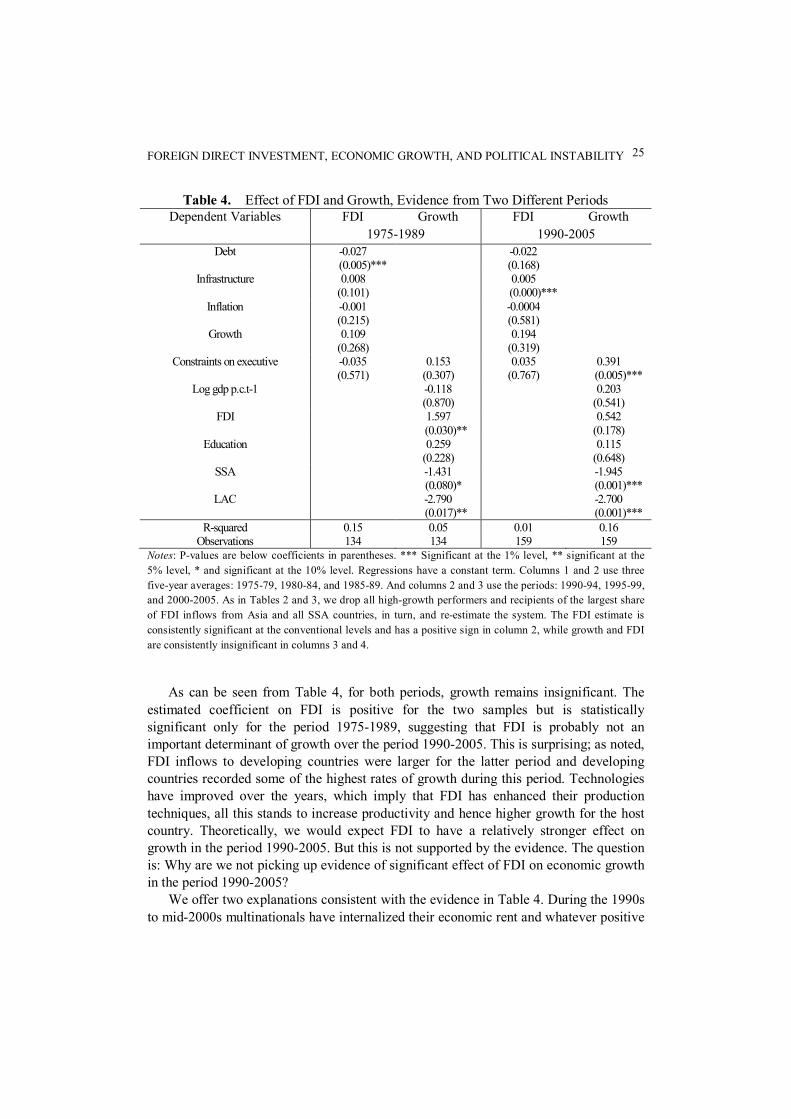
Table 4. Effect of FDI and Growth, Evidence from Two Different Periods Dependent Variables FDI Growth FDI Growth
1975-1989 1990-2005
Debt -0.027 (0.005)***
-0.022 (0.168)
Infrastructure 0.008 (0.101)
0.005 (0.000)***
Inflation -0.001 (0.215)
-0.0004 (0.581)
Growth 0.109 (0.268)
0.194 (0.319)
Constraints on executive -0.035 (0.571)
0.153 (0.307)
0.035 (0.767)
0.391 (0.005)***
Log gdp p.c.t-1 -0.118 (0.870)
0.203 (0.541)
FDI 1.597 (0.030)**
0.542 (0.178)
Education 0.259 (0.228)
0.115 (0.648)
SSA -1.431 (0.080)*
-1.945 (0.001)***
LAC -2.790 (0.017)**
-2.700 (0.001)***
R-squared 0.15 0.05 0.01 0.16 Observations 134 134 159 159
Notes: P-values are below coefficients in parentheses. *** Significant at the 1% level, ** significant at the
5% level, * and significant at the 10% level. Regressions have a constant term. Columns 1 and 2 use three
five-year averages: 1975-79, 1980-84, and 1985-89. And columns 2 and 3 use the periods: 1990-94, 1995-99,
and 2000-2005. As in Tables 2 and 3, we drop all high-growth performers and recipients of the largest share
of FDI inflows from Asia and all SSA countries, in turn, and re-estimate the system. The FDI estimate is
consistently significant at the conventional levels and has a positive sign in column 2, while growth and FDI
are consistently insignificant in columns 3 and 4.
As can be seen from Table 4, for both periods, growth remains insignificant. The estimated coefficient on FDI is positive for the two samples but is statistically significant only for the period 1975-1989, suggesting that FDI is probably not an important determinant of growth over the period 1990-2005. This is surprising; as noted, FDI inflows to developing countries were larger for the latter period and developing countries recorded some of the highest rates of growth during this period. Technologies have improved over the years, which imply that FDI has enhanced their production techniques, all this stands to increase productivity and hence higher growth for the host country. Theoretically, we would expect FDI to have a relatively stronger effect on growth in the period 1990-2005. But this is not supported by the evidence. The question is: Why are we not picking up evidence of significant effect of FDI on economic growth in the period 1990-2005?
We offer two explanations consistent with the evidence in Table 4. During the 1990s to mid-2000s multinationals have internalized their economic rent and whatever positive
KEVIN WILLIAMS 26
effect on recipient countries arising from their activity was not sufficient to stimulate growth. For instance “fragmentation” of production has reduced the benefits for host countries (multinationals reap the gains). A large proportion of FDI takes the form of services, acquisition of infrastructure2 (e.g. water and electricity), and mergers which are less growth-inducing compared with Greenfield investments. Additionally, FDI has become sophisticated in their ability to circumvent restrictions that would constrain them to share their returns with recipient countries. This reflects the political power of FDI in which, ‘If governments decide to tax or regulate them in ways they don’t like, they threaten to move elsewhere’ (Stiglitz, 2006, p. 188). And because developing countries are competing to attract FDI, threats3 to relocate serve as an incentive for FDI to demand economic rent to the disadvantage of the host country.
A second explanation is that the introduction of economic reforms in developing countries in the early 1990s, in particular Africa, enabled the opening up and growth of the local private sector. These reforms made productive technologies easier to transfer even without the inflow of FDI. Thus, technological transfer for productivity gains may no longer solely dependent on FDI.
5. DOES POLITICAL INSTABILITY AFFECT GROWTH AND FDI DIFFERENTLY?
In our second contribution, we extend the analysis to investigate whether FDI and
growth respond differently to shocks arising from political instability in our panel of developing countries. Political instability has affected many developing countries, but Africa is often cited as the region most affected. ‘Civil conflict has afflicted a third of all nations and two thirds of Africa since 1991,’ (Blattman and Annan, 2010, p. 885). And political instability is not a recent phenomenon. Blomberg (1996) argued that between 1950 and 1987 one out of every two attempts to replace existing governments through unconstitutional means was successful. These internal conflicts are more widespread than international conflicts (Collier and Hoeffler, 2004).
Political instability does not only affect life and property and thus discourages economic activity, but can have persistent effects through grievances (ethnic or religious, political repression, political exclusion, and economic inequality). Dube and Vargas
2 There was massive privatization of state-owned enterprises across the developing world during the
1990s. 3 ‘In Thailand and Peru, corporations threatened to move elsewhere if environmental regulations were
enforced; in Peru, one mining company went so far as to pressure the government not to test children living
near their mining operations to see if they had been exposed to health hazards. At one point, Papua New
Guinea passed a law making it illegal to sue international mining companies outside the country even for
enforcement of health, environmental, or legal rights, fearing that such suits would discourage investment in
the country’ (Stiglitz, 2006, p. 195).
FOREIGN DIRECT INVESTMENT, ECONOMIC GROWTH, AND POLITICAL INSTABILITY 27
(2013) and Collier and Hoeffler (2004) argued that positive international commodity price shocks can explain political instability in developing countries by making it costly to be recruited in paramilitary or guerilla armies.
Political instability is characterized by uncertainty, which tends to adversely affect development outcomes in developing countries, as investment opportunities and thus economic growth become distorted. A politically unstable country is likely to misallocate its human capital by making it more attractive to engage in corruption and other activities that discourage growth. From this perspective, political instability distorts incentives for development, but it is also possible that a limited amount of political instability may be necessary to move a country to a good equilibrium by removing a corrupt regime from political office4 in order to restore confidence in governance, leading to productivity and higher output growth (Cerra and Saxena, 2005). For instance, Campos and Nugent (2003) found that political instability is positively related to investment in the medium to long run. Moreover, resource-seeking FDI is unlikely to be deterred by political instability due to the size of the economic rent they generate from their activity. Hayakawa et al. (2013) on the other hand showed that while political risk is adversely associated with FDI, low level of financial risk does not induce more FDI inflows.
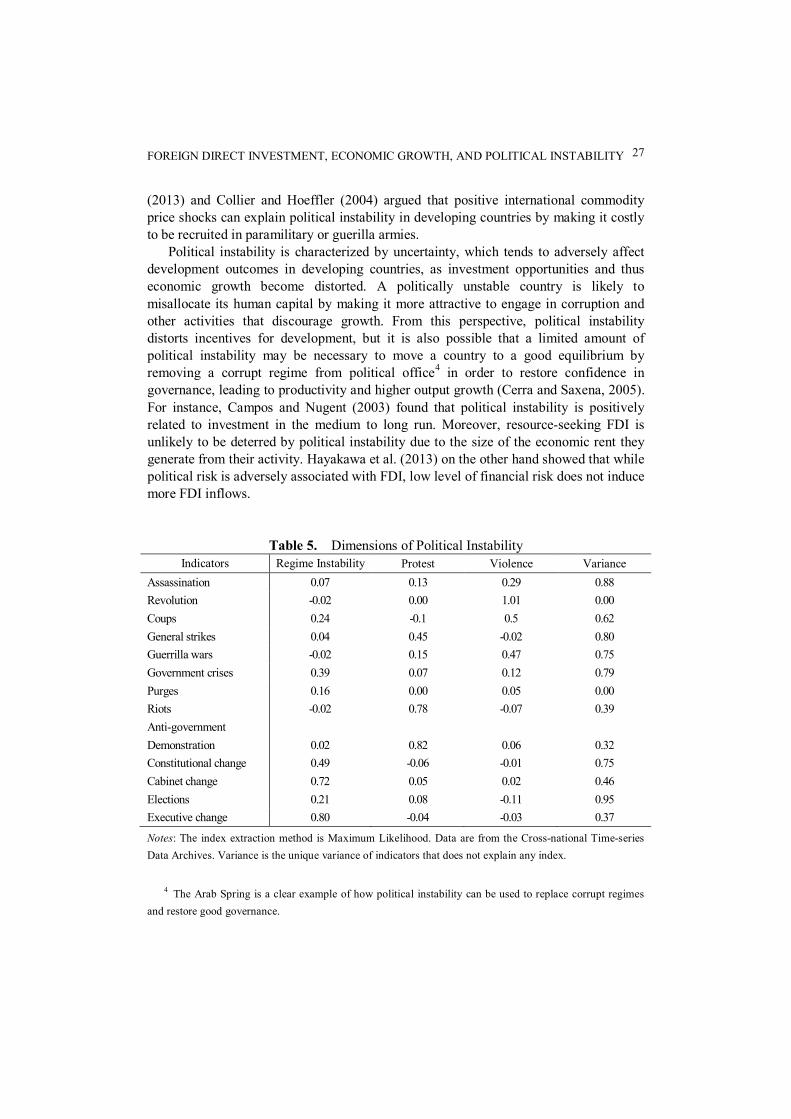
Table 5. Dimensions of Political Instability Indicators Regime Instability Protest Violence Variance
Assassination 0.07 0.13 0.29 0.88
Revolution -0.02 0.00 1.01 0.00
Coups 0.24 -0.1 0.5 0.62
General strikes 0.04 0.45 -0.02 0.80
Guerrilla wars -0.02 0.15 0.47 0.75
Government crises 0.39 0.07 0.12 0.79
Purges 0.16 0.00 0.05 0.00
Riots -0.02 0.78 -0.07 0.39
Anti-government
Demonstration 0.02 0.82 0.06 0.32
Constitutional change 0.49 -0.06 -0.01 0.75
Cabinet change 0.72 0.05 0.02 0.46
Elections 0.21 0.08 -0.11 0.95
Executive change 0.80 -0.04 -0.03 0.37
Notes: The index extraction method is Maximum Likelihood. Data are from the Cross-national Time-series
Data Archives. Variance is the unique variance of indicators that does not explain any index.
4 The Arab Spring is a clear example of how political instability can be used to replace corrupt regimes
and restore good governance.
KEVIN WILLIAMS 28
To examine whether political instability has differential effect on growth and FDI, we follow Jong-A-Pin (2009) and construct different dimensions of political instability. Jon-A-Pin (2009) uses various indicators of political instability to construct four indices of political instability, using the exploratory factor analysis (EFA) method. The exploratory factor analysis clusters indicators with shared variances, to form an index, from those with unique variances. We use 13 indicators of political instability to construct three indices of political instability. Table 5 reports the indicators of political instability, indices, and unique variances (part of the variance that doesn’t explain any index).
Following Jon-A-Pin (2009) we identify three dimensions of political instability, those with variance above 0.30, as indicated in Table 5.5 Index with high variance on cabinet changes, government crises, constitutional changes, and executive changes is labeled instability of the political regime: these reflect instability of the government. Index with high variance on anti-government demonstrations, general strikes, and riots is labeled protest. And index with high variance indicating violence – coups, revolution, and guerrilla wars – is labeled violence. No indicator has cross-variance (i.e. explaining more than one index), implying that political instability has different dimensions. With these indices in hand, we estimate our system of simultaneous equations:
= ℎ + + + , (3) ℎ = + + + , (4)
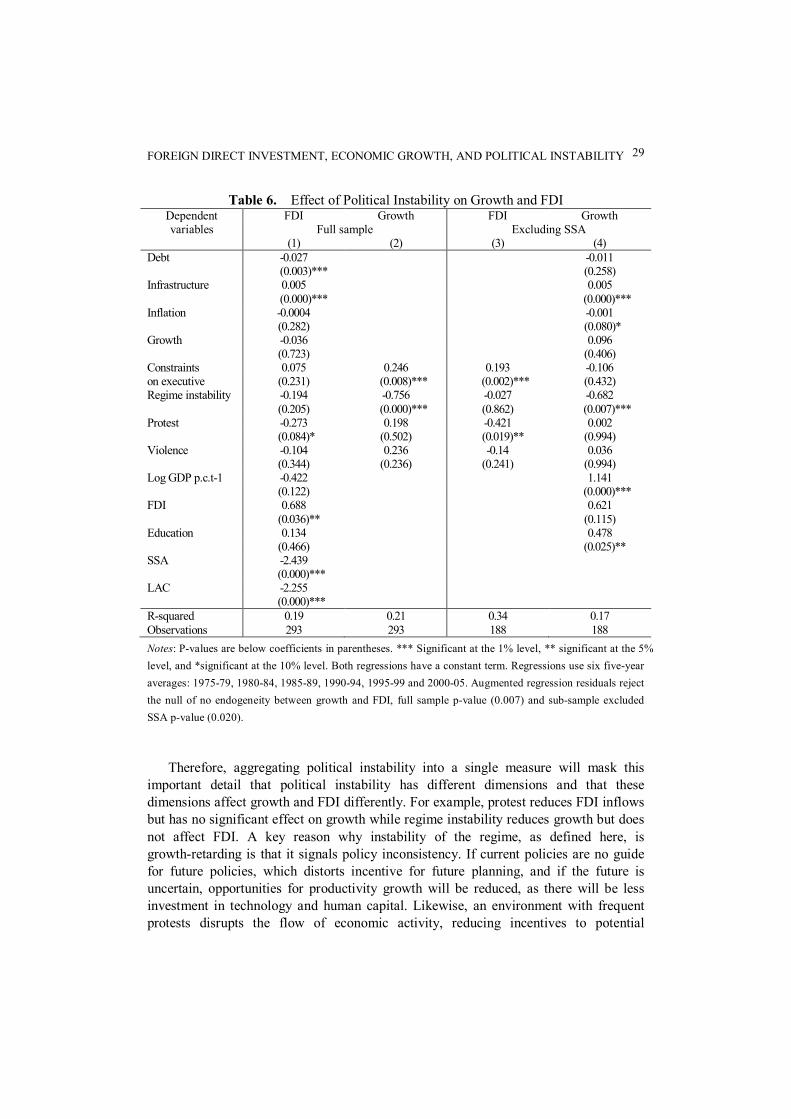
where is the vector of the three dimensions of political instability: Regime instability, Protest, and Violence. All other variables remain. Estimates are presented in Table 6. In columns 1 and 2, we estimate the system of equations (3) and (4) with the full sample including the three dimensions of political instability. The inclusion of the political instability measures in the system of equations improves the fit of the model. In the FDI equation, column 1, increases in the number of protests have a negative effect on FDI. The estimated coefficient on protest is statistically significant at the 10 percent level. Regime instability and violence are statistically insignificant. In the growth equation, column 2, regime instability is negative and significant, implying that regime instability reduces growth. In this equation, protest and violence are insignificant. We note that even after accounting for political instability, FDI is positive and significant in column 2 and growth is statistically insignificant in column 1. The significantly negative coefficient on protest in the FDI equation (column 1) and the significantly negative coefficient on regime instability in the growth equation (column 2) together suggest that FDI and growth are likely to be affected by different aspects of political instability.
5 Indicators with variance above 0.30 best explain each index of political instability (Costello and
Osborne, 2005).
FOREIGN DIRECT INVESTMENT, ECONOMIC GROWTH, AND POLITICAL INSTABILITY 29
Table 6. Effect of Political Instability on Growth and FDI Dependent variables
FDI Growth FDI Growth Full sample Excluding SSA
(1) (2) (3) (4)
Debt -0.027
-0.011
(0.003)***
(0.258)
Infrastructure 0.005
0.005
(0.000)***
(0.000)***
Inflation -0.0004
-0.001
(0.282)
(0.080)*
Growth -0.036
0.096
(0.723)
(0.406)
Constraints on executive
0.075 0.246 0.193 -0.106 (0.231) (0.008)*** (0.002)*** (0.432)
Regime instability -0.194 -0.756 -0.027 -0.682
(0.205) (0.000)*** (0.862) (0.007)***
Protest -0.273 0.198 -0.421 0.002
(0.084)* (0.502) (0.019)** (0.994)
Violence -0.104 0.236 -0.14 0.036
(0.344) (0.236) (0.241) (0.994)
Log GDP p.c.t-1 -0.422
1.141
(0.122)
(0.000)***
FDI 0.688
0.621
(0.036)**
(0.115)
Education 0.134
0.478
(0.466)
(0.025)**
SSA -2.439
(0.000)***
LAC -2.255
(0.000)***
R-squared 0.19 0.21 0.34 0.17 Observations 293 293 188 188
Notes: P-values are below coefficients in parentheses. *** Significant at the 1% level, ** significant at the 5%
level, and *significant at the 10% level. Both regressions have a constant term. Regressions use six five-year
averages: 1975-79, 1980-84, 1985-89, 1990-94, 1995-99 and 2000-05. Augmented regression residuals reject
the null of no endogeneity between growth and FDI, full sample p-value (0.007) and sub-sample excluded
SSA p-value (0.020).
Therefore, aggregating political instability into a single measure will mask this important detail that political instability has different dimensions and that these dimensions affect growth and FDI differently. For example, protest reduces FDI inflows but has no significant effect on growth while regime instability reduces growth but does not affect FDI. A key reason why instability of the regime, as defined here, is growth-retarding is that it signals policy inconsistency. If current policies are no guide for future policies, which distorts incentive for future planning, and if the future is uncertain, opportunities for productivity growth will be reduced, as there will be less investment in technology and human capital. Likewise, an environment with frequent protests disrupts the flow of economic activity, reducing incentives to potential
KEVIN WILLIAMS 30
investors. As a robustness check on columns 1 and 2, in columns 3 and 4 we exclude all SSA
observations and re-estimate the system of equations. As suggested by Blattman and Annan (2010), political instability has disproportionately afflicted SSA not only in terms of the actual manifestations, but in terms of perception (Nel, 2003). The estimates in columns 3 and 4 show that protest and regime instability are still significantly related to FDI and growth, respectively, even after we have excluded SSA countries.
6. IS THERE POLITICAL INSTABILITY CURSE IN SSA?
It has been suggested that SSA is likely to experience relatively higher incidence of political instability than other regions; if so, what role does political instability play in SSA growth and FDI outcomes? Specifically, does political instability affect growth and FDI differently in SSA compared with other regions? In our third contribution, we explore this question in this section. From 1960 to 2001 eighty-two successful military coups occurred in Africa (Collier and Hoeffler, 2005).6 This underscores the fact that, ‘Africa is the most conflict ridden region of the World and the only region in which the number of armed conflict is on the rise’ (Stockholm International Peace Research Institute, 1999).7 Thus, ‘Africa has supplied far more than its share of violent political conflict’ (Bates et al., 2006, p. 13).
Further, ‘the level of political instability has been a significant factor in the lack of progress experience by the continent’s economies’ (Mbaku and Paul, 1989, p. 63), which implies that SSA economies are being punished for the relatively high incidence of political instability. This provides an interesting opportunity to empirically investigate whether political instability affects growth and FDI differently in SSA.
Easterly and Levine (1997) found that ethnic diversity explained SSA growth tragedies. Guillaumont et al. (1999) used coups, foreign, and civil wars as their political-instability index and found that political instability explained growth in Africa. Using the number of government changes, Haan and Siermann (1996) reported mixed evidence of the effect of political instability on growth in Africa. Fosu (1992) used coup d’état, attempted coups, and coups plots as a measure of political instability and found that political instability negatively affected growth in SSA, while Ojo and Oshikoya (1995) used coups d’état and civil liberty to measure political instability in assessing the determinants of growth in SSA. A related study by Ghura (1995) employed the number of people affected by wars, civil conflicts, ethnic violence, and natural disasters as a share of total population, highlighting significant effect of political instability on growth in SSA. The important distinction between the above studies and this paper is that we
6 There are 145 coup plots and 109 failed attempts for the same period (Collier and Hoeffler, 2005).
There are 56 successful coups between 1958 and 1984 (McGowan and Johnson, 1984). 7 See Collier and Hoeffler, (2002, p. 13).
FOREIGN DIRECT INVESTMENT, ECONOMIC GROWTH, AND POLITICAL INSTABILITY 31
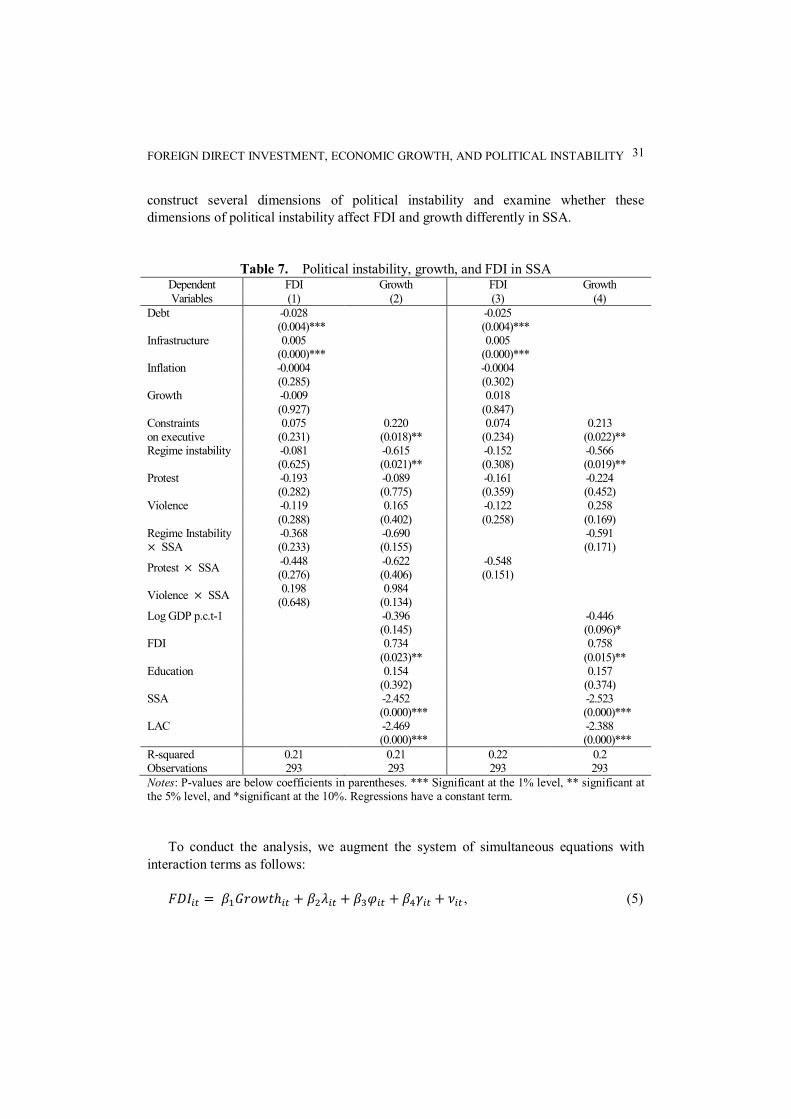
construct several dimensions of political instability and examine whether these dimensions of political instability affect FDI and growth differently in SSA.
Table 7. Political instability, growth, and FDI in SSA Dependent Variables
FDI Growth FDI Growth (1) (2) (3) (4)
Debt -0.028
-0.025
(0.004)***
(0.004)***
Infrastructure 0.005
0.005
(0.000)***
(0.000)***
Inflation -0.0004
-0.0004
(0.285)
(0.302)
Growth -0.009
0.018
(0.927)
(0.847)
Constraints on executive
0.075 0.220 0.074 0.213 (0.231) (0.018)** (0.234) (0.022)**
Regime instability -0.081 -0.615 -0.152 -0.566
(0.625) (0.021)** (0.308) (0.019)**
Protest -0.193 -0.089 -0.161 -0.224
(0.282) (0.775) (0.359) (0.452)
Violence -0.119 0.165 -0.122 0.258
(0.288) (0.402) (0.258) (0.169)
Regime Instability × SSA
-0.368 -0.690
-0.591 (0.233) (0.155)
(0.171)
Protest × SSA -0.448 -0.622 -0.548
(0.276) (0.406) (0.151)
Violence × SSA
0.198 0.984
(0.648) (0.134)
Log GDP p.c.t-1
-0.396
-0.446
(0.145)
(0.096)*
FDI
0.734
0.758
(0.023)**
(0.015)**
Education
0.154
0.157
(0.392)
(0.374)
SSA
-2.452
-2.523
(0.000)***
(0.000)***
LAC
-2.469
-2.388
(0.000)***
(0.000)***
R-squared 0.21 0.21 0.22 0.2 Observations 293 293 293 293 Notes: P-values are below coefficients in parentheses. *** Significant at the 1% level, ** significant at the 5% level, and *significant at the 10%. Regressions have a constant term.
To conduct the analysis, we augment the system of simultaneous equations with
interaction terms as follows: = ℎ + + + + , (5)
KEVIN WILLIAMS 32
ℎ = + + + + , (6)
where is the vector with the three interaction terms, Regime × , × , and × . These interaction terms in our system of equations will determine whether SSA is different. We present the estimates in Table 7.
We estimate two systems of simultaneous equations as display in Table 7, first with all three interaction terms (columns 1 and 2) and, second, with only one interaction term (columns 3 and 4), together with all three dimensions of political instability. In column 1, the FDI equation, all three interaction terms are statistically insignificant. In the growth equation, column 2, these interaction terms are also statistically insignificant. In this system of equations instability of the regime is the only measure of political instability that is significant at the 5 percent level (column 2). We check these results in columns 3 and 4, by including interactions between SSA and the two dimensions of political instability that were significantly related to growth and FDI. Protest and regime instability were found to be significantly related to FDI and growth, respectively, in Table 6. In column 3, the FDI equation, we include one interaction term × and in column 4, the growth equation, we also include one interaction term Regime × . The estimated coefficient for both interaction terms is statistically insignificant. We can therefore conclude from the estimates in Table 7 that political instability does not affect growth and FDI differently in SSA. These results support Collier and Hoeffler (2002) who argued that the risk of political instability in SSA should be no higher than other developing countries and thus the effect of political instability on economic indicators should be no different.
Indeed, the evidence suggests that political instability does not have differential effect in SSA compared with other developing countries. There is no evidence of political instability curse in SSA. It is possible however that the perception of political instability is what influences the risk profile of the region (Nel, 2003) and thus distinguishes SSA from other developing countries. This perception of political instability in SSA could potentially cause rating agencies to grade the economic prospects in SSA disproportionately risky (Bates et al., 2006). If this is correct, improving the image of SSA is a concern for policy makers.
7. CONCLUSION
This paper examined the relationship between FDI and growth in a system of simultaneous equations model using a three-stage least squares estimator, which exploits that the relationship between FDI and growth is endogenously determined. We used several indicators of political instability to construct three dimensions of political instability and studied whether FDI and growth respond differently to political instability. Finally, we also investigated whether political instability affects growth and FDI in SSA differently.
First, our empirical analysis showed that FDI had a significant positive effect on
FOREIGN DIRECT INVESTMENT, ECONOMIC GROWTH, AND POLITICAL INSTABILITY 33
growth. Economic growth on the other hand did not significantly increase FDI inflows. Based on this finding, FDI has the potential to enhance growth in developing countries, not only through its embodied technology, but through other channels for example instigating competition among local enterprises and constrains policy makers to adopt growth-inducing policies through threats of relocation. Therefore, it may be worthwhile for policy makers in developing countries who are thinking about growth to include FDI as part of this goal.
Second, we documented that political instability had different dimensions and that they affected growth and FDI differently. In particular, regime instability significantly reduced growth and protest significantly reduced FDI inflows. Violence is insignificantly related to growth and FDI. Third, we introduced interaction terms between SSA and these dimensions of political instability in our system of simultaneous equations model and found that political instability did not affect FDI and growth in SSA differently relative to other regions. The task therefore of escaping a political instability image trap is for SSA to demonstrate to the world that the effect of political instability there is no different from other regions. This may require radical reforms of the judicial processes in ensuring speedy trials in courts and orderly transition of political power.
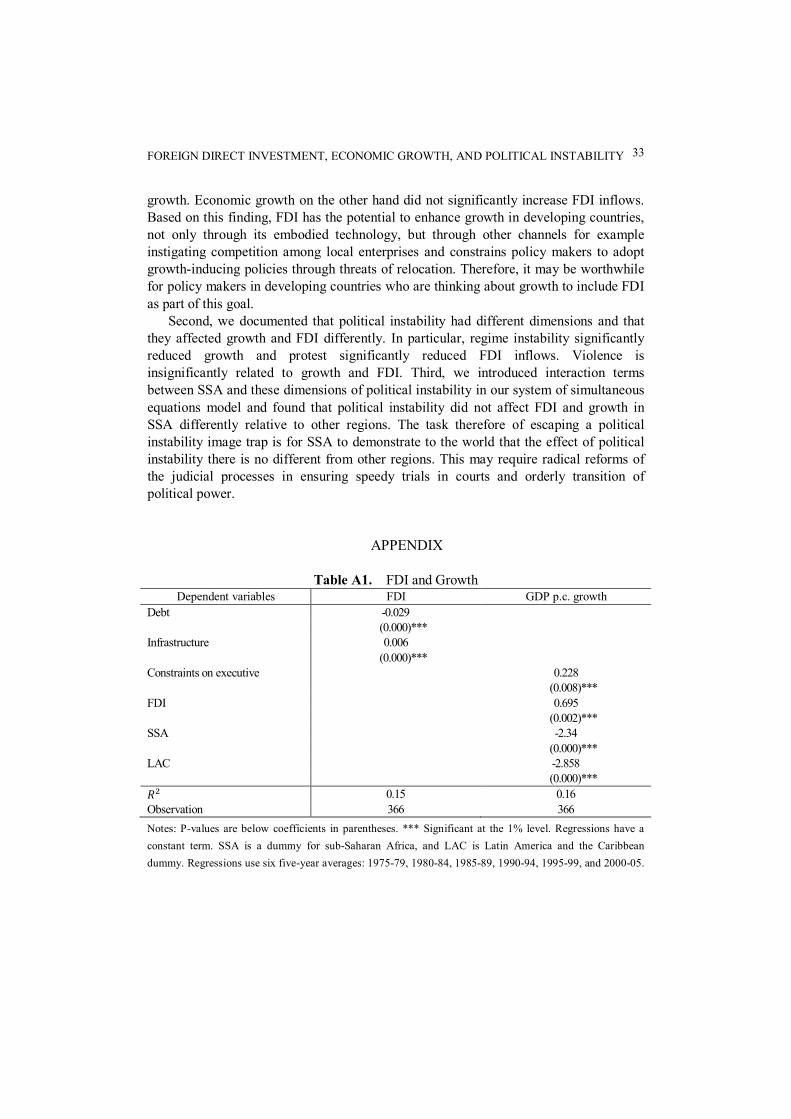
APPENDIX
Table A1. FDI and Growth Dependent variables FDI GDP p.c. growth
Debt -0.029
(0.000)***
Infrastructure 0.006
(0.000)***
Constraints on executive 0.228
(0.008)***
FDI
0.695
(0.002)***
SSA
-2.34
(0.000)***
LAC
-2.858
(0.000)***
0.15 0.16
Observation 366 366
Notes: P-values are below coefficients in parentheses. *** Significant at the 1% level. Regressions have a
constant term. SSA is a dummy for sub-Saharan Africa, and LAC is Latin America and the Caribbean
dummy. Regressions use six five-year averages: 1975-79, 1980-84, 1985-89, 1990-94, 1995-99, and 2000-05.
KEVIN WILLIAMS 34
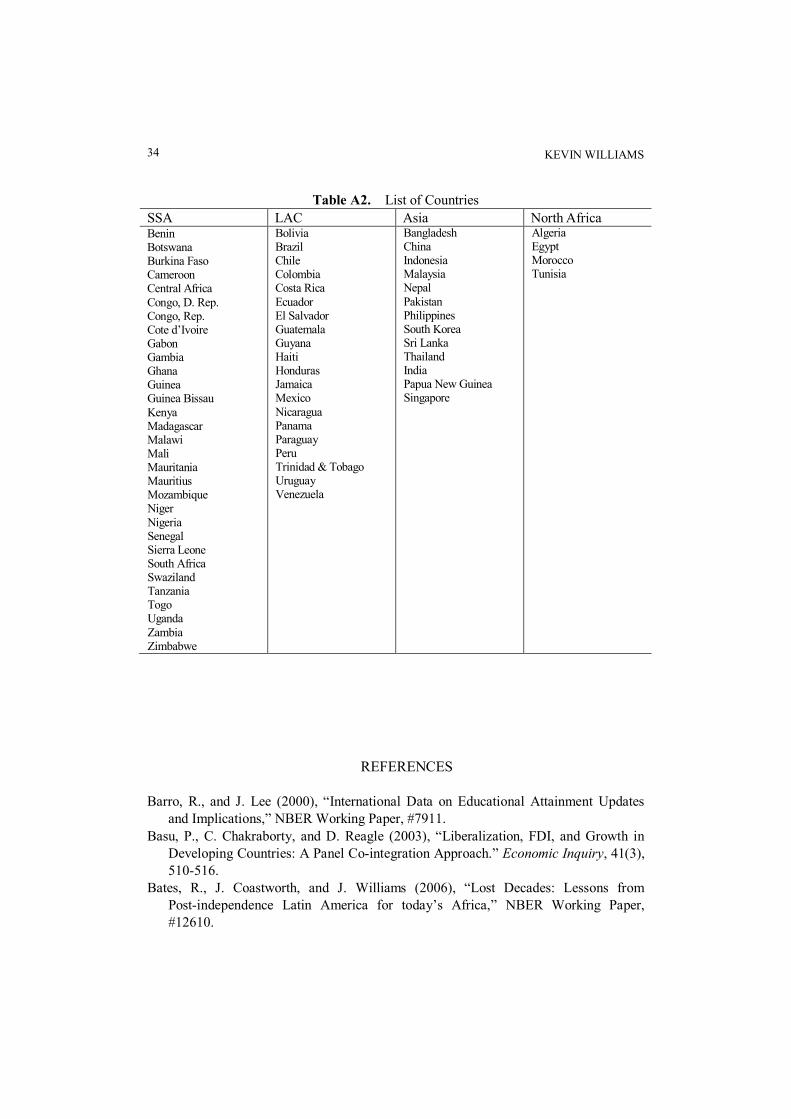
Table A2. List of Countries
SSA LAC Asia North Africa Benin Botswana Burkina Faso Cameroon Central Africa Congo, D. Rep. Congo, Rep. Cote d’Ivoire Gabon Gambia Ghana Guinea Guinea Bissau Kenya Madagascar Malawi Mali Mauritania Mauritius Mozambique Niger Nigeria Senegal Sierra Leone South Africa Swaziland Tanzania Togo Uganda Zambia Zimbabwe
Bolivia Brazil Chile Colombia Costa Rica Ecuador El Salvador Guatemala Guyana Haiti Honduras Jamaica Mexico Nicaragua Panama Paraguay Peru Trinidad & Tobago Uruguay Venezuela
Bangladesh China Indonesia Malaysia Nepal Pakistan Philippines South Korea Sri Lanka Thailand India Papua New Guinea Singapore
Algeria Egypt Morocco Tunisia
REFERENCES
Barro, R., and J. Lee (2000), “International Data on Educational Attainment Updates and Implications,” NBER Working Paper, #7911.
Basu, P., C. Chakraborty, and D. Reagle (2003), “Liberalization, FDI, and Growth in Developing Countries: A Panel Co-integration Approach.” Economic Inquiry, 41(3), 510-516.
Bates, R., J. Coastworth, and J. Williams (2006), “Lost Decades: Lessons from Post-independence Latin America for today’s Africa,” NBER Working Paper, #12610.
FOREIGN DIRECT INVESTMENT, ECONOMIC GROWTH, AND POLITICAL INSTABILITY 35
Behera, S.R. (2015), “Do Domestic Firms Really Benefit from Foreign Direct Investment? The role of Horizontal and Vertical Spillovers and Absorptive Capacity,” Journal of Economic Development, 40 (2), 57-86.
Bende-Nabende, A., and J. Ford (1998), “FDI, Policy Adjustment and Endogenous Growth: Multiplier Effects from a Small Dynamic Model for Taiwan, 1959-1995,” World Development, 26(7), 1315-1330.
Blattman, C., and J. Annan (2010), “The Consequences of Child Soldiering,” Review of Economics and Statistics, 42(2), 882-898.
Blomberg, B. (1996), “Growth, Political Instability and the Defense Burden,” Economica, 63(252), 252, 649-672.
Bosworth, B. (2005), Managing Capital Inflows: What have We Learned, Templeton College, University of Oxford.
Cameron, C., and P. Trivedi (2005), Microeconometrics: Method and Applications, New York: Cambridge University Press.
Campos, N., and J. Nugent (2003), “Aggregate Investment and Political Instability: An Econometric Investigation,” Economica, 70(279), 533-549.
Cerra, V., and S. Saxena (2005), “Growth Dynamics: The Myth of Economic Recovery,” International Monetary Fund Working Paper, 147.
Chowdhury, A., and G. Mavrotas (2006), “FDI and Growth: What Causes What?” World Economy, 29(1), 9-19.
Collier, P., and A. Hoeffler (2002), “On the Incidence of Civil War in Africa,” Journal of Conflict Resolution, 46 (1), 13-28.
_____ (2004), “Greed and Grievance in Civil War,” Oxford Economic Papers, 56(4), 563-595.
_____ (2005), “Coups Traps: Why does Africa have so many Coups d’Etat?” Centre for the Study of African Economies, Department of Economic, University of Oxford.
Costello, A., and J. Osborne (2005), “Best Practices in Exploratory Factor Analysis: Four Recommendations for Getting the Most from your Analysis.” Practical Assessment, Research and Evaluation, 10(7), 1-9.
Dube, O., and J. Vargas (2013), “Commodity Price Shocks and Civil Conflict: Evidence from Colombia,” Review of Economic Studies, 80(4), 1384-1421.
Durham, B. (2004), “Absorptive Capacity and the Effects of Foreign Direct Investment and Equity Foreign Portfolio Investment on Economic Growth,” European Economic Review, 48(2), 285-306.
Easterly, W., and R. Levine (1997), “Africa’s Growth Tragedy: Policies and Ethnic Divisions,” Quarterly Journal of Economics, 112(4), 1203-1250.
Fosu, A. (1992), “Political Instability and Economic Growth: Evidence from Sub-Saharan Africa,” Economic Development and Cultural Change, 40(4), 829-841.
Ghura, D. (1995), “Macro Policies, External Forces, and Economic Growth in Sub-Saharan Africa,” Economic Development and Cultural Change, 43(4), 759-778.
Guillaumont, P., S. Jeanneney, and J. Brun (1999), “How Instability Lowers African Growth,” Journal of African Economies, 8(1), 87-107.
KEVIN WILLIAMS 36
Gupta, S., C.A. Pattillo, and S. Wagh (2009), “Effect of Remittances on Poverty and Financial Development in Sub-Saharan Africa,” World Development, 37(1), 104-115.
Haan, J., and C. Siermann (1996), “Political Instability, Freedom, and Economic Growth: Some Further Evidence,” Economic Development and Cultural Change, 44(2), 339-350.
Hansen, H., and J. Rand (2004), “On the Causal Links between FDI and Growth in Developing Countries,” Discussion Papers, Institute of Economics, University of Copenhagen.
Hsiao, C., and Y. Shen (2003), “Foreign Direct Investment and Economic Growth: The Importance of Institutions and Urbanization,” Economic Development and Cultural Change, 51(4), 883-896.
Hayakawa, K., F. Kimura, and H. Lee (2013), “How Does Country Risk Matter for Foreign Direct Investment?” Developing Economies, 51(1), 60-78.
Jong-A-Pin, R. (2009), “On the Measurement of Political Instability and its Impact on Economic Growth,” European Journal of Political Economy, 25(1), 15-29.
Lee, H. (2015), “Foreign Direct Investment in North Korea and the Effect of Special Economic Zones: Learning from Transition Economies,” Journal of Economic Development, 40(2), 35-56.
Li, X., and L. Xiaming (2005), “Foreign Direct Investment and Economic Growth: An Increasingly Endogenous Relationship,” World Development, 33(3), 393-407.
Mbaku, J., and C. Paul (1989) “Political instability in Africa: A Rent-seeking Approach.” Public Choice, 63(1), 63-72.
McGowan, P., and T. Johnson (1984), “African Military Coups d'Etat and Underdevelopment: A Quantitative Historical Analysis,” Journal of Modern African Studies, 22(4), 633-666.
Mencinger, J. (2003), “Does Foreign Direct Investment always enhance Economic Growth?” Kyklos, 56(1), 491-508.
Nair-Reichert, U., and D. Weinhold (2001), “Causality tests for Cross-country Panel: A new look at FDI and Economic Growth in Developing Countries,” Oxford Bulletin of Economics and Statistics, 63(2), 153-171.
Nel, P. (2003), “Income Inequality, Economic Growth, and Political Instability in Sub-Saharan Africa,” Journal of Modern African Studies, 41(4), 611-639.
Ojo, O., and T. Oshikoya (1995), “Determinants of Long-term Growth: Some African Results,” Journal of African Economies, 4(2), 163-191.
Reisen, H., and M. Soto (2001), “Which types of Capital Inflows foster Developing-country Growth?” International Finance, 4(1), 1-14.
Rodrik, D. (2009), “A De-globalised World? Developing Countries must Resume Push into Tradable Goods & Services for High Growth,” Business Standard, available at: http://www.business-standard.com/india/news/dani-rodrikde-globalised- world/357808/.
Stockholm International Peace Research Institute (1999), Yearbook of world armaments
FOREIGN DIRECT INVESTMENT, ECONOMIC GROWTH, AND POLITICAL INSTABILITY 37
and dis-armaments, Oxford: Oxford University Press. Stiglitz, J. (2000), “Capital Market Liberalization, Economic Growth, and Instability,”
World Development, 28(6), 1075-1086. _____ (2004), The Roaring Nineties: Why We’re Paying the Price for the Greediest
Decade in History, London: Penguin Books Ltd. _____ (2006), Making Globalization Work: The next Steps to Global Justice, London:
Penguin Book Ltd. Mailing Address: The Department of Economics, The University of the West Indies, St. Augustine Campus, Trinidad and Tobago. Email: [email protected]
Received April 25, 2016, Revised March 31, 2017, Accepted April 3, 2017.