foreign direct investment and domestic capital formationfile/wp36e.pdf · foreign direct investment...
TRANSCRIPT

Industry Canada Research Publications Program
Working Paper Number 36 April 2002
FOREIGN DIRECT INVESTMENT
AND DOMESTIC CAPITAL
FORMATION

Industry Canada Research Publications Program The Industry Canada Research Publications Program provides a forum for the analysis of key micro-economic challenges in the Canadian economy and contributes to an informed public debate on these issues. Under the direction of the Micro-Economic Policy Analysis Branch, the Program’s research paper series features peer-reviewed analytical working papers and policy-related discussion papers written by specialists on micro-economic issues of broad importance.
The views expressed in these papers do not necessarily reflect the views of Industry Canada or of the federal government.
By Walid Hejazi and Peter Pauly University of Toronto
Aussi disponible en français
Industry Canada Research Publications Program
FOREIGN DIRECT INVESTMENT
AND DOMESTIC CAPITAL
FORMATION
Working Paper Number 36 April 2002

National Library of Canada Cataloguing in Publication Data Hejazi, Walid, 1963- Foreign direct investment and domestic capital formation (Working paper ; no. 36) Text in English and French on inverted pages. Title on added t.p.: Investissement étranger direct et formation intérieure de capital. Issued also on the Internet. Includes bibliographical references. ISBN 0-662-66099-4 Cat. No. C21-24/36-2001 1. Investments, foreign – Canada. 2. Capital investments – Canada. 3. Canada – Economic policy. I. Pauly, Peter. II. Canada. Industry Canada. III. Title. IV. Series: Working Paper (Canada. Industry Canada) ; no. 36. HG4538.H34 2001 332.67'3'0971 C2001-980310-9E The list of titles available in the Research Publications Program and details on how to obtain copies can be found at the end of this document. Abstracts of research volumes and papers published in Industry Canada’s various series, and the full text of our quarterly newsletter, MICRO, are available on Strategis, the Department’s online business information site, at http://strategis.gc.ca. Comments should be addressed to: Someshwar Rao Director Strategic Investment Analysis Micro-Economic Policy Analysis Industry Canada 5th Floor, West Tower 235 Queen Street Ottawa, Ontario K1A 0H5 Tel.: (613) 941-8187 Fax: (613) 991-1261 E-mail: [email protected]

ACKNOWLEDGEMENTS We would like to acknowledge several people within Statistics Canada for their help in obtaining data: Christian Lajule, Jocelyn Elibani, Gail Sharland, Flo Magmanlac, Fred Gault, and Judy Hosein. Detailed comments were provided by seminar participants at Industry Canada, the University of Toronto, the 2000 International Atlantic Economic Society Meetings, and the 2000 Canada at the World Conference. Detailed comments were provided by Someshwar Rao, A.Edward Safarian, Joseph Daniels, and Andrew Sharpe. The financial support of Industry Canada is gratefully acknowledged. Of course, any remaining errors are our own.


TABLE OF CONTENTS
ABSTRACT....................................................................................................................................... i 1. INTRODUCTION......................................................................................................................... 1 2. LITERATURE REVIEW............................................................................................................. 11 A Simple Test for Canada ..................................................................................................... 14 3. METHODOLOGY AND DATA REQUIREMENTS..................................................................... 21 4. DATA DESCRIPTION................................................................................................................ 23 5. ESTIMATION............................................................................................................................ 31 Gross Fixed Capital Formation — All Components ................................................................ 31 Gross Fixed Capital Formation by Component ....................................................................... 32 Machinery and Equipment Capital Formation............................................................. 32 Engineering Construction Capital Formation .............................................................. 32 Building Construction Capital Formation................................................................... 33 Summary ............................................................................................................................. 33 6. DOES THE TRADING / INVESTMENT PARTNER MATTER?.................................................. 43
All Components ................................................................................................................... 43 Machinery and Equipment..................................................................................................... 43 Engineering Construction ...................................................................................................... 47 Building Construction ........................................................................................................... 47 Summarizing the Evidence.................................................................................................... 47 Explaining the Heterogeneity Across Countries ...................................................................... 49
7. DISCUSSION AND CONCLUSIONS.......................................................................................... 57 NOTES ........................................................................................................................................... 61 BIBLIOGRAPHY............................................................................................................................ 63 DATA APPENDIX.......................................................................................................................... 67 INDUSTRY CANADA RESEARCH PUBLICATIONS..................................................................... 69


ABSTRACT
Canada has traditionally been a major host economy for foreign direct investment (FDI). In 1970, the ratio of the inward FDI stock to GDP was 30 percent, whereas the ratio of the outward FDI stock was only 7 percent. By 1998, these figures had changed dramatically: the outward FDI ratio had increased to 27 percent and the inward FDI ratio had fallen to 24 percent. These changes have raised important policy questions about their impact on several aspects of the Canadian economy. The analysis presented here addresses only the impact of these changes on capital formation in Canada. Using annual industry-level data for the period 1983 to 1995 and panel data techniques we estimate the link between FDI and domestic capital formation. For the economy as a whole, the results show no statistically significant link between outward FDI and domestic investment. In contrast, inward FDI is found to supplement Canadian domestic capital formation. However, there is heterogeneity when gross fixed capital formation is broken down in its components, by industry and by trading partner. The policy conclusions are multi-facetted and are discussed in the paper. Overall, policymakers should not consider policies that would restrict outward FDI to certain regions of the world, but rather should focus on the factors that enter into firm-level decision making that undertake direct investment abroad. Furthermore, given that inward FDI is found to supplement capital formation in Canada regardless of the source country, policies should aim at encouraging inward FDI.


1. INTRODUCTION
Much concern has been expressed by policy makers in Canada regarding the country’s falling share of inward foreign direct investment (FDI) stock (Figure 1). Regardless of whether we talk about the world, the G-7 or North America, Canada’s share of inward FDI stock has been falling. By contrast, Canada’s share of outward FDI stock increased over the 1970s and 1980s, but fell in the 1990s. Therefore, the traditional position of Canada among developed countries as a predominantly host economy but not a large home (source) economy for FDI stock has been changing. Figure 2a shows how Canada’s rank among developed countries as a FDI host economy stock has fallen. Although there has been a surge in Canada’s outward FDI stock (both in level and relative to GDP), its rank as a source (home) of FDI has also fallen. Figures 3a and 3b provide data on FDI flows relative to capital formation, averaged over the period 1986 to 1991, and also for 1996. Canada’s rank in terms of inward FDI flows relative to gross fixed capital formation (GFCF) has not changed. On the other hand, Canada’s outward FDI flows have increased relative to GFGF and in terms of Canada’s rank among countries. The immediate reaction of many to such changing FDI patterns is that it must somehow be linked to the United States or to the NAFTA. Therefore, we have assembled a table showing Canada’s share of FDI in North America (Table 1). Panel A shows that Canada received 37 percent of all inward FDI in North America in 1980, but this percentage has fallen steadily after to reach 15 percent in 1996. In Panel B, we consider only intra-North America FDI stocks. On this measure, Canada received a whopping 67 percent of all FDI in North America in 1980, but this percentage has also fallen steadily over the ensuing period to under 50 percent in 1996. In Panel C, we consider only FDI stocks located in North America that originated abroad: that is, we net out intra-North America FDI stocks. On this measure too, Canada has seen its share of North American FDI fall from 15 percent in 1980 to 6 percent in 1996. In short, Canada’s share of inward FDI has fallen regardless of how we consider its position in North America. The changing patterns of Canada’s FDI are far more dramatic, however, when considered in a domestic context, as revealed by Figure 4. In 1970, the stock of inward FDI in Canada relative to GDP was 30 percent. This ratio fell sharply during the 1970s to slightly below 20 percent, where it remained for most of the 1980s and early 1990s. There was an increase in this ratio during the second half of the 1990s. Mirroring the fall of Canada’s inward FDI stock is the rise in the stock of Canadian FDI abroad. In 1970, the ratio of outward FDI to GDP was 7 percent. This ratio has increased steadily over the entire post-1970 period. By 1997, the ratio of outward FDI to GDP exceeded the stock of inward FDI relative to GDP.1 Coincident with the growing importance of Canadian FDI abroad and the shrinking importance of FDI in Canada has been a reduction in GFCF relative to GDP in Canada (Figure 4). That is, the ratio of GFCF to GDP has been markedly lower in the post-1980 period.2 These trends have raised important policy questions regarding their likely impact on several aspects of the Canadian economy, including international trade, gross fixed capital formation, employment, productivity, the balance of payments, and overall welfare. In this paper, we measure the impact of Canada’s changing patterns of FDI stock on GFCF in Canada. The question we address is: To what extent are changing patterns of FDI stock (outward and inward) causing a reduction in GFCF in Canada? These trends are shown in Table 2 below.

2 Introduction
Figure 1
It is often argued that increases in outward FDI result in the export of domestic production and employment, and thus have a negative impact on domestic capital formation. Furthermore, it is also believed that inward FDI complements the domestic capital stock. The implication of this argument would be that the recent trends of a lower inward FDI stock (relative to GDP) and a higher outward FDI stock (relative to GDP) have had a negative impact on capital formation in Canada. In the paper, we test empirically the merits of this argument. In order to examine carefully the links between FDI and GFCF, we must estimate a full model of capital formation. Using annual industry-level data for the period 1983 to 1995, we estimate the impact that changing levels of FDI stock (outward and inward) have had on GFCF in Canada. We estimate investment demand equations by industry (SIC-C 1980) that incorporate industry-level data on the capital stock, depreciation allowances, R&D expenditures, corporate profits, corporate taxes, wages and intermediate inputs. Measures of industry-level FDI stock are then added to the specification to determine whether the patterns of FDI stock provide additional information for explaining GFCF, after taking into account the traditional determinants.
Patterns of Canada's Share of Inward FDI Stock(exchange rates in millions of current US$ )
010
203040506070
1970 1980 1985 1990 1995 1997
Year
Per
cent
World
CAN+US
G7
G6 (less US)
NAFTA
Patterns of Canada's Share of Outward FDI Stock(exchange rates in millions of current US$)
0
5
10
15
20
1970 1980 1985 1990 1995 1997
Year
Per
cent
World
CAN+US
G7
G6 (less US)
NAFTA

Introduction 3
Figure 2a Inward FDI Stock Relative to GDP,
Canada in an International Perspective
1970 Inward FDI Stock as a % of GDP
0
5
10
15
20
25
30
Canad
a
Austra
lia
Netherla
nds
New Z
ealand
UK
Bel-Lu
xGree
ce
Denm
ark
German
y
Switze
rland
Austri
a Italy
Swed
en
Norwa
y USSp
ain
Finlan
d
Portug
alFra
nce Japan
Inw
ard
FDI s
tock
as
a %
of
GD
P
``
1970 Inward FDI Stock as a % of GDP
Inw
ard
FDI S
tock
as
a %
of G
DP
Can
ada
Aus
tral
ia
Net
herla
nds
N-Z
eala
nd
U.K
.
Bel
.-Lu
x.
Gre
ece
Den
mar
k
Ger
man
y
Sw
itzer
land
Aus
tria
Italy
Sw
eden
Nor
way
U.S
.
Spa
in
Finl
and
Por
tuga
l
Fran
ce
Japa
n
1980 Inward FDI Stock as a % of GDP
0
2
4
6
8
10
12
14
16
18
20
22
South
Africa
Canad
aIrel
and UK
Norway
Greece
Netherla
nds
New Ze
aland
Austra
lia
Switze
rland
Denmark
Bel-Lu
x
Germany
Portug
alAu
stria
France US
Swede
nSpa
in Italy
Israe
l
Finlan
dJa
pan
Inw
ard
FD
I st
ock
as
a %
of
GD
P
1980 Inward FDI Stock as a % of GDP
Inw
ard
FDI S
tock
as
a %
of G
DP
Sou
th A
frica
Can
ada
Irela
nd
U.K
.
Nor
way
Gre
ece
Net
herla
nds
N.-
Zeal
and
Aus
tral
ia
Sw
itzer
land
Den
mar
k
Bel
.-Lu
x.
Ger
man
y
Por
tuga
l
Aus
tria
Fran
ce
U.S
.
Sw
eden
Spa
in
Italy
Isra
el
Finl
and
Japa
n
1996 Inward FDI Stock as a % of GDP
0
5
10
15
20
25
30
35
40
45
50
55
New Z
ealand Be
l-Lux
Netherla
nds
Austra
liaCa
nada
Irelan
d UKSp
ain
Switze
rland
Greece
Swede
n
Denmark
Norwa
yFra
nce
South
Africa Au
stria US
Italy
Finlan
d
Portug
al
Germany Isra
elJa
pan
Inw
ard
FD
I st
ock
as
a %
of
GD
P
1996 Inward FDI Stock as a % of GDP
Inw
ard
FDI S
tock
as
a %
of G
DP
N.-
Zeal
and
Bel
.-Lu
x.
Net
herla
nds
Aus
tral
ia
Can
ada
Irela
nd
U.K
.
Spa
in
Sw
itzer
land
Gre
ece
Sw
eden
Den
mar
k
Nor
way
Fran
ce
Sou
th A
frica
Aus
tria
U.S
.
Italy
Finl
and
Por
tuga
l
Ger
man
y
Isra
el
Japa
n

4 Introduction
The results indicate that, on a net basis, outward FDI has not had a statistically significant impact on capital formation in Canada. This is true for the total economy and for service industries and non-service industries. In contrast, inward FDI is found to have a strong positive impact on domestic capital formation for the overall economy and for non-service industries, but no measured impact on services. Breaking gross fixed capital formation down into its components, namely machinery and equipment capital formation, engineering construction capital formation, and building construction capital formation, reveals much heterogeneity.
Figure 2b Outward FDI Stock Relative to GDP,
Canada in an International Perspective
1980 Outward FDI Stock as a % of GDP
0
5
10
15
20
25
Netherla
nds
Switze
rland UK
Canad
a US
South
Africa
New Z
ealand
Germany
Bel-Lu
x
Swede
nFra
nce
Norwa
y
Denmark
Japa
nItal
y
Austra
liaFin
land
Austria
Spain
Portug
al Israel
Ou
twar
d F
DI s
tock
as
a %
of
GD
P
1996 Outward FDI Stock as a % of GDP
0
5
10
15
20
25
30
35
40
45
50
Switze
rland
Nethe
rlands
Bel-Lu
x UK
Swede
nCa
nada
Norway
New Z
ealand Fin
land
France
Denmark
Germany
Austra
lia Italy US
South
Africa Irel
and
Spain
Austria
Japa
n
Portug
al Israel
Greece
Ou
twar
d F
DI s
tock
as
a %
of
GD
P
1996 Outward FDI Stock as a % of GDP
1980 Outward FDI Stock as a % of GDP
Out
war
d FD
I Sto
ck a
s a
% o
f GD
P O
utw
ard
FDI S
tock
as
a %
of G
DP
Net
herla
nds
Sw
itzer
land
U.K
.
Can
ada
U.S
.
Sou
th A
frica
N.-
Zeal
and
Ger
man
y
Bel
.-Lu
x.
Sw
eden
Fran
ce
Nor
way
Den
mar
k
Japa
n
Italy
Aus
tral
ia
Finl
and
Aus
tria
Spa
in
Por
tuga
l
Isra
el
Sw
itzer
land
Net
herla
nds
Bel
.-Lu
x.
U.K
.
Sw
eden
Can
ada
Nor
way
N.-
Zeal
and
Finl
and
Fran
ce
Den
mar
k
Ger
man
y
Aus
tral
ia
Italy
U.S
.
Sou
th A
frica
Irela
nd
Spai
n
Aus
tria
Japa
n
Por
tuga
l
Isra
el
Gre
ece

Introduction 5
We also tested whether the trading/investment partner matter. Regressions were undertaken to test the impact that Canada’s bilateral FDI with the United States, the United Kingdom and the rest of the world (ROW) have had on Canada’s patterns of GFCF. We found that Canada’s outward FDI to the United States stimulates capital formation in Canada, a result consistent with the strong complementarities documented between Canada’s trade and FDI with that country. On the other hand, Canada’s outward FDI to the United Kingdom has no significant impact on capital formation in Canada.
Figure 3a Inward FDI Flows Relative to GFCF
Average(1986-1991) Inward FDI Flows Relative to GFCF
-1
2
5
8
11
14
17
20
New Ze
aland
Bel-Lu
x UK
Netherl
ands
Austra
lia
Portug
al Spain US
Greece
Irelan
d
Swede
nCan
ada
Switze
rland
France
Denm
arkNo
rway Ita
ly
Austr
ia
Finlan
d
Germany Isra
el
South
Africa
Inw
ard
FD
I Flo
w /
GF
CF
1996 Inward FDI Flows Relative to GFCF
-1
4
9
14
19
24
29
Bel-L
ux
New Z
ealand Ire
land
Swed
en UK
Norway
Netherl
ands
Franc
e
Austr
alia US
Austri
aCa
nada
Switze
rland
Finlan
dSp
ainIsr
ael
Greece
South
Afric
a
Denmark
Portug
al Italy
Germany
Inw
ard
FD
I Flo
w /
GF
CF
Average (1986-91) Inward FDI Flows Relative to GFCF
1996 Inward FDI Flows Relative to GFCF
Inw
ard
FDI F
low
/ G
FCF
In
war
d FD
I Flo
w /
GFC
F
N.-
Zeal
and
Bel
.-Lu
x.
U.K
.
Net
herla
nds
Aus
tral
ia
Por
tuga
l
Spa
in
U.S
.
Gre
ece
Irela
nd
Sw
eden
Can
ada
Sw
itzer
land
Fran
ce
Den
mar
k
Nor
way
Italy
Aus
tria
Finl
and
Ger
man
y
Isra
el
Sou
th A
frica
Bel
.-Lu
x.
N.-
Zeal
and
Irela
nd
Sw
eden
U.K
.
Nor
way
Net
herla
nds
Fran
ce
Aus
tral
ia
U.S
.
Aus
tria
Can
ada
Sw
itzer
land
Finl
and
Spa
in
Isra
el
Gre
ece
Sou
th A
frica
Den
mar
k
Por
tuga
l
Italy
Ger
man
y

6 Introduction
This may be due to relatively high tariffs between Canada and the United Kingdom, and hence to a tariff jumping motivation for FDI. But even in this case, the increased outward FDI has not reduced domestic capital formation in the economy. In sharp contrast to these results, we found that outward FDI to the rest of the world (net of the U.S. and U.K.) has a strong negative impact on capital formation in Canada. One possible explanation is that Canadian multinationals may be transferring production to low-cost locations abroad, which has a negative impact on capital formation in Canada.
Figure 3bOutward FDI Flows Relative to GFCF
Average(1986-1991) Outward FDI Flows Relative to GFCF
0
3
6
9
12
15
18
21
Netherl
ands
Sweden UK
Bel-Lu
x
New Zea
land
Switzerl
and
France
Finlan
d
Denmark
German
y
Irelan
d
Austra
lia
Norway
Canad
aJa
pan US
Austria Ita
ly
Spain
Portug
alIsr
ael
South
Africa
Out
war
d FD
I Flo
w /
GFC
F
1996 Outward FDI Flows Relative to GFCF
0
5
10
15
20
25
30
Netherl
ands
Switzerl
and UK
Finlan
d
Norway
Bel-Lu
x
Sweden
France
New Zea
land
Denmark
Canad
a
Austra
lia US
German
y
Irelan
dSpa
inIta
ly
Portug
al
Austria
Japa
nIsr
ael
South
Africa
Out
war
d FD
I Flo
w /
GFC
F
Average (1986-91) Outward FDI Flows Relative to GFCF
1996 Outward FDI Flows Relative to GFCF
O
utw
ard
FDI F
low
/ G
FCF
O
utw
ard
FDI F
low
/ G
FCF
Net
herla
nds
Swed
en
U.K
.
Bel.-
Lux.
N.-Z
eala
nd
Switz
erla
nd
Fran
ce
Finl
and
Den
mar
k
Ger
man
y
Irela
nd
Aust
ralia
Nor
wa y
Can
ada
Japa
n
U.S
.
Aust
ria
Ital y
Spai
n
Portu
gal
Isra
el
Sout
h Af
rica
Net
herla
nds
Switz
erla
nd
U.K
.
Finl
and
Nor
way
Bel.-
Lux.
Swed
en
Fran
ce
N.-Z
eala
nd
Den
mar
k
Can
ada
Aust
ralia
U.S
.
Ger
man
y
Irela
nd
Spai
n
Ital y
Portu
gal
Aust
ria
Japa
n
Isra
el
Sout
h Af
rica

Introduction 7
Table 1
Canada’s Share of North American FDI Panel A
Inward FDI Stocks C$ Millions Percentage Distribution
Canada United States
Mexico
North America
Canada
United States
Mexico
North America
1980 64,725 99,240 9,685 173,650 0.37 0.57 0.06 1.00
1990 131,143 458,097 37,727 626,967 0.21 0.73 0.06 1.00
1996 176,548 863,162 102,387 1,142,097 0.15 0.76 0.09 1.00 Panel B
Intra-North America FDI Stocks
C$ Millions Percentage Distribution Canadian FDI in U.S. FDI in Mexican FDI in Distribution of Intra-N.A. FDI
United States Mexico Canada Mexico Canada
United States Canada
United States Mexico
1980 17,849 165 50,368 7,153 1 163 0.67 0.24 0.10
1990 60,049 245 84,089 10,858 0 643 0.54 0.39 0.07
1996 93,973 1,046 118,261 27,263 267 2,535 0.49 0.40 0.12 Panel C
Inward FDI Stocks Net of Intra-North America FDI Stocks
C$ Millions Percentage Distribution
Canada
United States
Mexico
North America
Canada
United States
Mexico
North America
1980 14,356 81,228 2,367 97,951 0.15 0.83 0.02 1.00
1990 47,054 397,405 26,624 471,083 0.10 0.84 0.06 1.00
1996 58,020 766,654 74,078 898,752 0.06 0.85 0.08 1.00 Sources: Data in Panel A from World Investment Report, UNCTAD, 1998. Data in Panel B from Statistics Canada and the U.S. Bureau of Economic Analysis. Data in Panel C derived from Panel A and Panel B.
Table 2 Inward and Outward Stocks of FDI and GFCF, Canada
(relative to GDP)
1970
1980
1990
1998
Inward 30 21 19 24 Outward 7 9 13 27 GFCF 16 18 15 14
8 Introduction
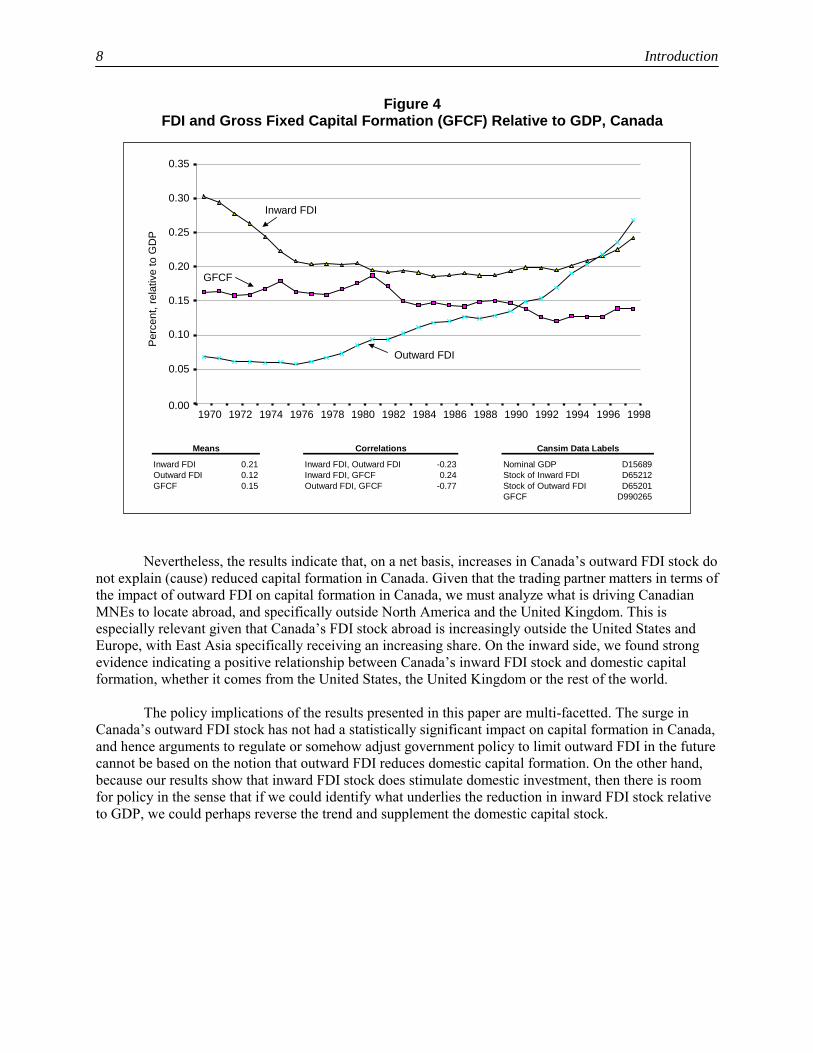
Nevertheless, the results indicate that, on a net basis, increases in Canada’s outward FDI stock do not explain (cause) reduced capital formation in Canada. Given that the trading partner matters in terms of the impact of outward FDI on capital formation in Canada, we must analyze what is driving Canadian MNEs to locate abroad, and specifically outside North America and the United Kingdom. This is especially relevant given that Canada’s FDI stock abroad is increasingly outside the United States and Europe, with East Asia specifically receiving an increasing share. On the inward side, we found strong evidence indicating a positive relationship between Canada’s inward FDI stock and domestic capital formation, whether it comes from the United States, the United Kingdom or the rest of the world. The policy implications of the results presented in this paper are multi-facetted. The surge in Canada’s outward FDI stock has not had a statistically significant impact on capital formation in Canada, and hence arguments to regulate or somehow adjust government policy to limit outward FDI in the future cannot be based on the notion that outward FDI reduces domestic capital formation. On the other hand, because our results show that inward FDI stock does stimulate domestic investment, then there is room for policy in the sense that if we could identify what underlies the reduction in inward FDI stock relative to GDP, we could perhaps reverse the trend and supplement the domestic capital stock.
Figure 4FDI and Gross Fixed Capital Formation (GFCF) Relative to GDP, Canada
0.00
0.05
0.15
0.20
0.25
0.30
0.35
1970 1972 1974 1976 1978 1980 1982 1984 1986 1988 1990 1992 1994 1996 1998
Perc
ent,
rela
tive
to G
DP
Inward FDI
GFCF
Outward FDI
Inward FDI 0.21 Inward FDI, Outward FDI -0.23 Nominal GDP D15689Outward FDI 0.12 Inward FDI, GFCF 0.24 Stock of Inward FDI D65212GFCF 0.15 Outward FDI, GFCF -0.77 Stock of Outward FDI D65201
GFCF D990265
Means Correlations Cansim Data Labels
0.10

Introduction 9
The results indicating that outward FDI stocks to the rest of the world reduce capital formation in Canada requires further analysis. It would be unwise to interpret this result as somehow justifying a policy that would restrict FDI to the rest of the world. Rather, we should focus on what motivation underlies this FDI. For example, if we are transferring low value-added production from Canada to countries with relatively inexpensive labour, then this form of FDI should be encouraged. However, if such FDI is driven abroad because of a poor competitive environment in Canada, caused for example by low R&D spending, insufficient financial liquidity, or relatively high taxes, then perhaps government policy should be directed at these factors.3 That is, policies should aim factors that enter into firm-level decision making to undertake FDI abroad, rather than attempting to restrict FDI to certain regions of the world. The format of the paper is as follows. Section 2 provides a brief literature review. The methodology used and data requirements are discussed in Section 3, while Section 4 describes the data. Estimation results are presented in Section 5. Section 6 examines whether trading partners matter to the relation between capital formation and FDI. Finally, a discussion and conclusions are offered in Section 7.


2. LITERATURE REVIEW4
Several studies on Canada have considered the impact of FDI patterns on international trade (Rao et al., 1996; Hejazi and Safarian, 1999b). Rao et al. (1996) analyze trade and FDI stock patterns among APEC economies. They find that the growth in FDI stock has partly led and partly followed the growth in trade. They conclude that the trends point more to complementarity than substitutability between international trade and FDI stock in the APEC region. They test this hypothesis empirically by regressing the ratio of total trade (exports plus imports) to GDP on the ratio of total FDI stock (inward plus outward) to GDP. The coefficient on the FDI stock variable was positive and highly insignificant. Hejazi and Safarian (1999b) use a gravity model framework to test the relationship between Canada’s trade with 35 trading partners over the 1970-96 period. First, trade patterns are regressed on the gravity model determinants of international trade. After these traditional measures of trade are taken into account, patterns of bilateral FDI stock are added. They find that outward FDI is a statistically significant and positive determinant of exports, whereas no statistically significant link is found between inward FDI stock and imports. Hejazi and Safarian (2001a) extend the analysis using U.S. data to consider the links between trade and FDI at the industry level. They find that outward FDI in petroleum has little impact on trade, whereas outward FDI in manufacturing has a large impact on both exports and imports, and outward FDI in services has a large impact on exports but has little or no impact on imports. In short, the impact of outward FDI varies across industries.5 Data limitations prevent this type of industry-level analysis for Canada.6 The evidence would therefore indicate that trade and FDI are complementary. Brainard (1997) points to a problem raised by studies considering the link between trade and FDI. She argues correctly that exports and FDI are a conceptual mismatch and that the proper comparison is between exports and foreign production. Furthermore, trade alone does not distinguish between arms-length trade and trade within multinationals. Nevertheless, studies that use actual patterns of foreign production rather than FDI generally reinforce the evidence from studies that use FDI, namely that there is complementarity between international trade and foreign production (Horst, 1972; Swedenborg, 1979; Lipsey and Weiss, 1981, 1984; Grubert and Mutti, 1991).7 This indirect evidence lends support to the view that increased outward FDI (foreign production) likely increases domestic capital formation because outward FDI opens foreign markets for home country exports, thus stimulating domestic production and employment. Lipsey (1995) concludes that domestic employment likely increases because of the increase in exports associated with increasing patterns of foreign production. Brainard (1997) examines how well location decisions by MNEs accord with a trade-off between proximity to customers (hence the creation of subsidiaries abroad) and concentrating production at home so as to achieve economies of scale (hence exports). She finds that overseas production by MNEs is relatively high when transport costs and trade barriers are high, and relatively low when investment barriers and plant-scale economies are high. Moreover, MNE activity is higher when the home and foreign markets are similar. In effect, this study moves beyond some traditional explanations of MNEs that emphasize differences in the proportions of various agents of production used, in wages, or in per capita incomes across countries to an approach that considers market access conditions and that allows for economies of scale in production. The direct implication of Brainard’s results is that an increase in outward FDI is determined by an increase in transport costs, holding the importance of scale economies constant. The first order effect of these results is that increased outward FDI (foreign production) reduces domestic production. However, this does not take into account the second order effects, namely the increase in exports of intermediate inputs and the increase in exports from the home market resulting from a local presence in the foreign market. Which of the two effects dominate is then an empirical question.

12 Literature Review The results of several studies show on balance that there is indeed an increase in exports associated with increased foreign production, indicating that the second effect would dominate (Horst, 1972; Swedenborg, 1979; Lipsey and Weiss, 1981, 1984; Grubert and Mutti, 1991). These results thus provide indirect evidence that affiliate activity abroad, and hence outward FDI, tend to stimulate domestic capital formation through increased exports.8 Feinberg et al. (1998) examine the response of U.S. MNEs and their affiliates in Canada to the substantial reduction in tariffs that occurred over the 1983-92 period. Using confidential firm-level data from the U.S. Bureau of Economic Analysis, they find that Canadian affiliate employment and assets were negatively related with Canadian tariff rates. That is, as tariffs between Canada and the United States fell, U.S. affiliate employment and assets in Canada actually increased. Much heterogeneity is observed across industries. This evidence is in contrast to the results of Gaston and Trefler (1997) who, using industry-level data, find that as a consequence of the Canada-U.S. FTA, employment contracted in all industries during 1989-93. In addition, real exports and imports contracted over most of the period.9 The authors conclude, however, that the massive job losses in Canada during 1989-93 were not primarily caused by the FTA but by other factors, such as Canada’s pursuit of zero inflation. These studies indicate therefore that changes in affiliate activity in Canada over the past two decades have increased affiliate employment and assets, thus resulting in increased capital formation among these firms. It is not clear, however, how changes in foreign affiliate activity in Canada has affected overall activity in Canada. Few studies have formally tested the direct impact of FDI on domestic capital formation. Using data on capital formation in Canada and on Canada’s outward FDI stock to each G-7 country and to all countries in aggregate over the 1970-91 period, Rao et al. (1994) find either a positive relationship or no relationship between trends in Canada’s outward FDI stock and capital formation in Canada. In a careful study of individual multinational firms, Stevens and Lipsey (1992) use a unique sample that covers the domestic and foreign operations of seven multinationals over a 16 to 20-year period beginning in 1960. The major drawback is that foreign data are only available in aggregate form, i.e. not broken down by country. The authors model the interdependence of the real and financial sides of the firm. They argue that as the cost of external financing rises, fixed investments in different locations compete for funds. They find a positive correlation between domestic and foreign investments in plant and equipment. Similar results were also found by Herring and Willet (1973) and, to some extent, by Severn (1972) and Noorzoy (1980). However, Stevens and Lipsey argue that the correlation is unlikely to reflect a causal relationship. Rather, the causal role is given to demand conditions in domestic and foreign markets and to the level of internal financing. It is pointed out that since domestic and foreign expenditures are positively related to the firm’s worldwide supply of internal funds, they will tend to be positively correlated. Noorzoy (1980) tests the impact that ex-post patterns of U.S. inward and outward FDI flows had on U.S. capital formation over the period 1959-71. He argues that the effects of direct investment operate through the supply of investment funds caused by capital flows as well as through the possible complementarity and substitutability between direct investment and domestic investment. Since the impact on the supply of funds is expected to be small, Noorzoy focuses on the latter. The results indicate that U.S. FDI flows abroad complement domestic investment. On the other hand, he finds that inward FDI displaces FDI. It should be noted that the sample period used here is quite old, and that, furthermore, FDI was then concentrated in manufacturing. In an earlier study, Noorzoy (1979) examines the impact of Canadian flows of FDI abroad and of FDI flows into Canada on the level of investment in Canada. The sample period is 1957 to 1971. The results show that FDI abroad had a negative impact on capital formation in Canada, whereas FDI in Canada had a positive effect on domestic investment. The evidence is thus consistent with that of Caves and Reuber (1971), who show a complementary relationship between U.S. FDI in Canada and capital formation in Canada.

Literature Review 13
Ultimately, what one would like to test is the impact of FDI on economic growth. That is, in addition to testing the impact of FDI on domestic capital formation, it is also important to verify whether FDI is more productive than domestic investment. Borensztein et al. (1998) estimate aggregate investment equations for a panel of 69 countries over the 1960s and 1970s. Patterns of FDI are added to these investment demand equations. They show that inward FDI increases domestic investment more than proportionately. That is, inward FDI crowds in domestic investment. Furthermore, they argue that this result does not depend on the productivity of FDI because their interaction variables between FDI and human capital are statistically insignificant. However, the results are sensitive to the specification, which leads the authors to conclude that most of the additional growth likely comes from efficiency gains rather than higher levels of capital. Lipsey (2000) argues that FDI flows among developed countries have little to do with the location of production, but rather reflect changes in the ownership of productive assets from less efficient to more efficient owners and managers. There may be no change in the geographic location of aggregate production or of the production of a particular industry. The author also argues that neither inflows nor outflows of FDI are crucial to the level of capital formation in a given country, as the data indicate that FDI inflows have been small relative to gross fixed capital formation. Perhaps the most widely known study on the link between FDI flows and capital formation is that of Feldstein and Horioka (1980). The authors regress the ratio of investment to GDP on the ratio of savings to GDP for OECD countries over the period 1960-74. They show that there is a very strong bias to invest savings in the home country. For OECD countries, the savings retention coefficient (the fraction of a dollar of savings invested domestically) is estimated at between 0.8 and 0.9. In a world of perfect capital mobility, the savings retention coefficient should be zero: the rate of domestic investment would not depend on the savings generated in the country. The Feldstein-Horioka results have been replicated by several authors, including Frankel (1991) and Mussa and Goldstein (1993). Unfortunately, their study does not test whether domestic investment is related to outbound or inbound investment, something which Feldstein (1995) explicitly addresses. Feldstein (1995) tests whether countries that experience sustained high rates of either inward or outward FDI flows have higher or lower rates of domestic investment. Although it is acknowledged that the answer may in fact depend on the form (or motivation) of FDI, data limitations prevent such a disaggregated analysis. The relevant policy question is: When a country experiences an increase in outward FDI, how does it impact on the local economy? There are two extreme possibilities. Domestic investment may fall dollar for dollar. Alternatively, the funds that would otherwise have financed the investment gone abroad now finance domestic investment — that is, domestic investment is unchanged. Similar arguments can be made for inward FDI. One dollar of inward FDI may result in a complete displacement of domestic investment, thus leaving the domestic capital stock unchanged, or the inflow of FDI may entirely supplement the domestic capital stock by one dollar.10 Feldstein estimates the following pooled time-series cross-section equation: (1) GDIit/GDPit = a0 + a1[GNSit/GDPit] + a2[OUTFDIit/GDPit] + a3[INFDIit/GDPit] + uit where i = 1...17 OECD countries, and t = 1970s and 1980s. GDI is gross domestic investment, GNS is gross national savings, OUTFDI and INFDI are outward and inward flows of FDI, and GDP is gross domestic product. The variables are denominated in current dollars. There are only two observations per country: one which averages over the 1970s and one over the 1980s. There are thus 34 observations in this regression. The equation is estimated with and without inclusion of retained earnings in FDI flows. The coefficient estimate for outward FDI flows is negative and robust, indicating that outward FDI causes a reduction in the level of domestic investment.
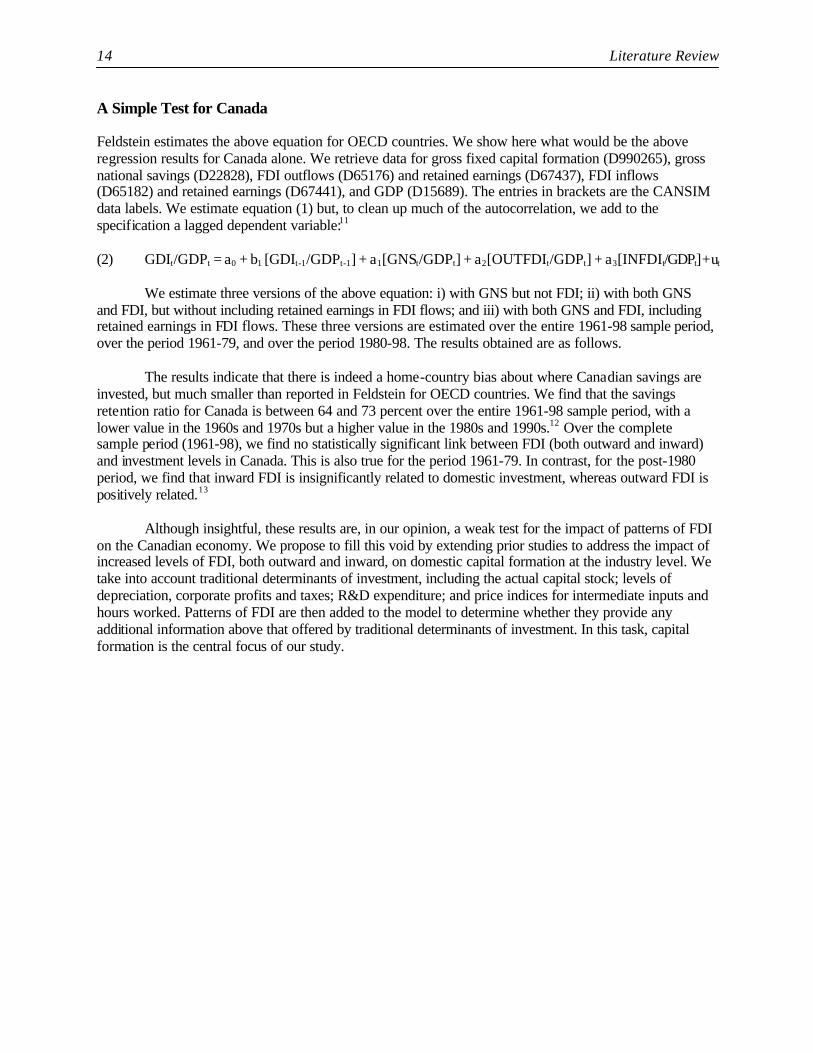
14 Literature Review A Simple Test for Canada Feldstein estimates the above equation for OECD countries. We show here what would be the above regression results for Canada alone. We retrieve data for gross fixed capital formation (D990265), gross national savings (D22828), FDI outflows (D65176) and retained earnings (D67437), FDI inflows (D65182) and retained earnings (D67441), and GDP (D15689). The entries in brackets are the CANSIM data labels. We estimate equation (1) but, to clean up much of the autocorrelation, we add to the specification a lagged dependent variable:11 (2) GDIt/GDPt = a0 + b1 [GDIt-1/GDPt-1] + a1[GNSt/GDPt] + a2[OUTFDIt/GDPt] + a3[INFDIt/GDPt] + ut
We estimate three versions of the above equation: i) with GNS but not FDI; ii) with both GNS and FDI, but without including retained earnings in FDI flows; and iii) with both GNS and FDI, including retained earnings in FDI flows. These three versions are estimated over the entire 1961-98 sample period, over the period 1961-79, and over the period 1980-98. The results obtained are as follows. The results indicate that there is indeed a home-country bias about where Canadian savings are invested, but much smaller than reported in Feldstein for OECD countries. We find that the savings retention ratio for Canada is between 64 and 73 percent over the entire 1961-98 sample period, with a lower value in the 1960s and 1970s but a higher value in the 1980s and 1990s.12 Over the complete sample period (1961-98), we find no statistically significant link between FDI (both outward and inward) and investment levels in Canada. This is also true for the period 1961-79. In contrast, for the post-1980 period, we find that inward FDI is insignificantly related to domestic investment, whereas outward FDI is positively related.13 Although insightful, these results are, in our opinion, a weak test for the impact of patterns of FDI on the Canadian economy. We propose to fill this void by extending prior studies to address the impact of increased levels of FDI, both outward and inward, on domestic capital formation at the industry level. We take into account traditional determinants of investment, including the actual capital stock; levels of depreciation, corporate profits and taxes; R&D expenditure; and price indices for intermediate inputs and hours worked. Patterns of FDI are then added to the model to determine whether they provide any additional information above that offered by traditional determinants of investment. In this task, capital formation is the central focus of our study.

Literature Review 15
Table 3 A Simple Test for Canada: the Feldstein (1995) Regression
Dependent Variable: Gross Domestic Investment (all variables are relative to GDP)
1961-98 1961-79 1980-98
i ii iii i ii iii i ii iii
Constant
0.148 (3.63)
0.118 (2.16)
0.107 (2.06)
0.183 (1.42)
0.233 (1.72)
0.220 (1.46)
0.137 (3.37)
0.142 (2.77)
0.105 (2.17)
GDIt–1
0.595 (7.46)
0.631 (6.87)
0.645 (7.24)
0.579 (3.16)
0.405 (2.11)
0.491 (2.30)
0.588 (7.31)
0.588 (6.68)
0.629 (7.32)
GNSt
0.259 (5.60)
0.261 (5.51)
0.257 (4.95)
0.234 (1.87)
0.293 (2.86)
0.198 (1.74)
0.308 (5.76)
0.270 (5.00)
0.298 (5.82)
OUTFDIt
0.140 (0.78)
0.195 (1.21)
–0.424 (–0.43)
–0.522 (–0.80)
0.277 (1.78)
0.329 (2.06)
INFDIt
0.064 (0.32)
0.027 (0.15)
1.155 (1.96)
0.490 (0.92)
–0.292 (–1.42)
–0.170 (–0.70)
adj R2
0.872
0.867
0.87
0.434
0.56
0.4
0.913
0.923
0.926
Long run impact a1/(1–b1)
0.64
0.71
0.73
0.56
0.49
0.39
0.75
0.66
0.8
Note: t statistics are reported in parentheses. In testing for autocorrelation in the presence of a lagged dependent
variable, we use Durbin’s h test. Note also that the long-run impact measure is calculated taking the presence of a lagged dependent variable into account.

16 Literature Review
Box 1 Literature Review
Authors Title Sample Period Methodology Conclusions
Rao, Ahmad and Barnes (1996)
Foreign Direct Investment and APEC Economic Integration
Industry Canada Working Paper Series
1980 to 1995 Use regression methodology to test links between trade and FDI stock within the APEC region.
Regress trade relative to GDP on total FDI relative to GDP, an APEC dummy and a time trend.
Find that FDI has partly led and partly followed growth in trade, and is interpreted as a complementary relationship between trade and FDI within the APEC region.
That is, there is evidence of a strong and complementary relationship between total trade and total FDI within the APEC region.
Hejazi and Safarian (1999b)
Modelling Links Between Canadian Trade and Foreign Direct Investment
Perspectives on North American Free Trade Series, paper number 2, Industry Canada
1970 to 1996
Use a gravity mo del framework to test Canada’s bilateral trade with 35 of its trading partners.
Trade patterns are regressed on the gravity model determinants of international trade.
After these determinants of trade are taken into account, patterns of FDI stock are added.
Find that outward FDI is a statistically significant and positive determinant of exports, but no statistically significant link is found between inward FDI and imports.
A more limited set of tests is undertaken at the industry level, and the results indicate much heterogeneity in the relationship between international trade and FDI stocks.
Hejazi and Safarian (2001a)
“The Complementarity Between US FDI Stock and Trade”
Atlantic Economic Journal
1982 to 1994 Use a gravity model framework to test U.S. bilateral trade with 51 of its trading partners.
Trade patterns are regressed on the gravity model determinants of international trade.
After these determinants of trade are taken into account, patterns of FDI stock are added.
The bilateral FDI stock data are broken down by industry, namely services, manufacturing, and petroleum.
Hejazi and Safarian (2001a) extend the analysis undertaken in Hejazi and Safarian (1999b) using U.S. data to consider links between trade and FDI at the industry level.
Find that outward FDI in petroleum has little impact on trade, whereas outward FDI in manufacturing has a large impact on both exports and imports, and outward FDI in services has a large impact on exports but little impact on imports.
In short, the impact of outward FDI varies across industries.
Data limitations prevent such an analysis for Canada.

Literature Review 17
Authors Title Sample Period Methodology Conclusions
The results are then linked to patterns of intra-firm trade.
The results are directly linked to patterns of intra-firm trade within multinational enterprises, a result consistent with the transactions-cost theory of multinationals.
Brainard (1997)
“An Empirical Assessment of the Proximity-Concentration Trade-off Between Multinational Sales and Trade”
American Economic Review
1989 cross-section
Uses a gravity model to test the links between MNE exports and foreign production.
The data are on a bilateral basis between the United States and 27 other countries, at the industry level.
Aggregate measures in the regression are per capita GDP, corporate taxes, openness to trade and FDI.
Industry measures are transport costs, tariffs and scale economies.
Also included are dummy variables for political stability, adjacency, and an EC dummy to test the links between MNE exports and foreign production.
The results imply that overseas production increases relative to exports:
the higher are transport costs the higher are trade barriers, the lower are investment the lower are scale economies.
Lipsey and Weiss (1981)
“Foreign Production and Exports in Manufacturing”
Review of Economics and Statistics
1970 cross-section
Use a gravity model linking exports to country size, distance, and membership in a trade bloc.
Use data on exports to a cross-section of 44 countries from the United States and 13 other major countries.
Exports are at the industry level.
Add to this variables measuring direct investment.
For the 14 industries studied, the level of U.S. affiliate activity is found to be positively related to U.S. exports to that country and that industry, and negatively related to exports of rival producers.
The presence of foreign countries’ firms is negatively related to U.S. exports and positively related to foreign countries’ exports.
This indicates that U.S. manufacturing activity in foreign countries tend to promote U.S. exports.

18 Literature Review Authors Title Sample Period Methodology Conclusions
No evidence of substitutability between own production and exports.
Lipsey and Weiss (1984)
“Foreign Production and Exports of Individual Firms”
Review of Economics and Statistics
1970 cross-section
In a gravity model framework, exports to each of 5 areas of the world by individual firms are related to characteristics of the parent firms and to output of their overseas affiliates and the size of the market within each area.
Data used are unpublished firm-level data from the 1970 BEA survey.
Find that parent exports to an area (whether exports to non-affiliates are included or not) are almost always positively related to manufacturing affiliate activity in that area.
In general, at the industry level, increased foreign production goes along with higher exports of intermediate goods, while there is either no effect or a positive effect on final products.
Feinberg et al (1998)
“Trade Liberalization and Delocalization: New Evidence from Firm-Level Panel Data”
Canadian Journal of Economics
1983 to 1992 Data used are confidential firm-level data from the U.S. BEA.
Examine the response of U.S. MNEs and their affiliates in Canada to the substantial reduction in tariffs that occurred over the 1983-92 period.
Find that Canadian affiliate employment and assets are negatively related to Canadian tariff rates.
That is, as tariffs between Canada and the United States fell, U.S. affiliate employment and assets in Canada actually increased.
Much heterogeneity is found across industries.
Noorzoy (1979)
“Flows of Direct Investment and their effects on Investment in Canada”
Economics Letters
1957 to 1971 Use an accelerator flow of funds model to test the impact that Canadian flows of FDI abroad and FDI flows into Canada had on Canada’s levels of investment.
The results show that FDI abroad had a negative impact on capital formation in Canada, whereas FDI in Canada had a positive effect on domestic investment.
The evidence is consistent with that of Caves and Reuber (1971), which shows a complementary relationship between U.S. FDI in Canada and capital formation in Canada.

Literature Review 19
Authors Title Sample Period Methodology Conclusions
Noorzoy (1980)
“Flows of Direct Investment and their Effects on U.S. Domestic Investment”
Economics Letters
1959 to 1971 Tests the impacts that ex post patterns of U.S. inward and outward FDI flows had on U.S. capital formation.
It is argued that the effects of direct investment operate through the supply of investment funds caused by capital flows as well as through the complementarity and substitutability direct investment may have with domestic investment.
Since the impact on the supply of funds is expected to be small, Noorzoy focuses on the latter.
The results indicate that U.S. FDI flows abroad complement domestic investment.
On the other hand, it is found that inward FDI displaces FDI.
Feldstein and Horioka (1980)
“Domestic Savings and International Capital Flows”
The Economic Journal
1960 to 1974 Regress the ratio of investment to GDP on the ratio of savings to GDP for OECD countries.
Results indicate that there is a very strong bias to invest savings in the home country.
For OECD countries, the savings retention coefficient (the fraction of a dollar of savings that is invested domestically) is estimated to be between 0.8 and 0.9.
In a world of perfect capital mobility, the savings retention coefficient should be zero: the rate of domestic investment would not depend on the savings generated in that country.
The Feldstein-Horioka results have been replicated by several authors, including Frankel (1991) and Mussa and Goldstein (1993).
Unfortunately, the study does not test whether domestic investment is related to outbound or inbound investment, something which Feldstein (1995) explicitly addresses.

20 Literature Review Authors Title Sample Period Methodology Conclusions
Feldstein (1995)
“The Effects of Outbound Foreign Direct Investment on the Domestic Capital Stock”
in J.R. Hines (ed.), The Effects of Taxation on Multinational Corporations, University of Chicago Press
1970 to 1989 Feldstein extends the Feldstein and Horioka test to include patterns of outward and inward FDI flows.
Using data for 17 OECD countries, investment rates are regressed on savings rates, as well as on patterns of inward and outward FDI, all relative to GDP.
The coefficient estimate on outward FDI flows is robust and negative, a result indicating that outward FDI causes a reduction in the level of domestic investment.
Borensztein et al. (1998)
“How Does Foreign Direct Investment Affect Economic Growth”
Journal of International Economics
1960 to 1979 Estimate aggregate investment equations for a panel of 69 countries
To these investment demand equations patterns of FDI are added
Ultimately, what one would like to test is the impact of FDI on economic growth.
That is, in addition to testing whether FDI, outward or inward, has on domestic capital formation, it is also important to test whether foreign investment is more productive than domestic investment.
The results show that inward FDI increases domestic investment more than proportionately.
That is, it is found that FDI crowds in domestic investment.
Furthermore, it is argued that this result does not depend on the productivity of FDI because the interaction variables between FDI and human capital are statistically insignificant.
However, the results are sensitive to specification, which leads the authors to conclude that most of the increased growth likely comes from efficiency gains rather than higher levels of capital.

3. METHODOLOGY AND DATA REQUIREMENTS
To better understand the link between domestic capital formation (investment) and the decision of a multinational enterprise to go abroad (FDI), we need to examine the formal decision-making process of the firm. It is likely that the impact of Canada’s outward FDI on the domestic (Canadian) economy will depend very much on the motivation underlying that FDI. Foreign direct investment in services (non-tradables) is likely to have a positive impact on the Canadian economy. First, since services are (for the most part) non-tradables, FDI does not displace exports. In the absence of FDI, the foreign market would not be serviced. Furthermore, this type of FDI may generate exports of intermediate inputs to the foreign market, thus stimulating domestic production and investment. Second, if the primary motivation for FDI is gaining (regional) market access (whether in tradables or non-tradables), then outward FDI could stimulate domestic activity by increasing intermediate production. In short, FDI motivated by such factors is likely to have either no effect or a positive effect on domestic production and investment. Third, FDI may be stimulated by factor-endowment differences. In reaction to differences in factor prices, firms may transfer production facilities from Canada to countries that have lower factor costs such as wages. Finally, FDI may be stimulated by a desire to minimize costs based on a trade-off between proximity and concentration. In both of cases, the impact on domestic production and investment is ambiguous. Although these scenarios do stimulate outward FDI at the expense of domestic investment, there is an offsetting effect: exports of intermediate inputs result in an increased demand for domestic production, and therefore stimulate domestic capital formation. It should be pointed out that since most Canadian FDI is located in other developed countries, it is most likely determined by proximity-concentration considerations rather than factor-endowment differences. Nevertheless, factor-price differences may play a role. Similar arguments can be made for inward FDI. Furthermore, patterns of intra-firm trade will be important in determining the relative importance of the offsetting effect noted above. For example, if there is a small amount of intra-firm trade between multinationals and their affiliates, the offsetting effect, namely the export of intermediate inputs, will likely be small, whereas if there is a large amount of intra-firm trade, the offsetting effect too will likely be important. The above discussion implies that to analyse the link between domestic capital formation and FDI, we must consider the firm-level decision making process and somehow determine what is driving Canada's outward FDI.14 Only then can we have direct evidence on the impact of such outward FDI on the Canadian economy. The obvious difficulty in undertaking such an analysis is the lack of suitable firm-level data on Canadian firms. We must therefore defer to an approach that yields only indirect evidence on the impact of outward FDI on domestic capital formation. This paper represents an attempt at estimating this link. The availability of data represents a binding constraint and, in large part, it has dictated the approach chosen. The question then becomes: How do we link FDI to domestic investment? To this end, we propose estimating industry-level domestic investment equations. The mainstream theory of investment, also known as the Jorgensonian approach, emphasizes the net present value of projects. Using the appropriate discount rate, managers maximize the value of the firm, and hence the utility of shareholders, by exploiting investment opportunities that have a positive net present value. Factors affecting the profitability of an investment, and hence the desired capital stock, are expected profitability, the price of capital (PK), the capital depreciation rate (δ), and the interest rate (r). The user cost of capital is defined as the price of capital multiplied by the sum of the interest rate and the depreciation rate [(r + δ) PK ]. Since internal financing carries certain advantages over external sources of funds, current profitability measures have an important role in the investment equation. Other factors that will affect profitability are cost margins, such as the cost of labour and intermediate inputs, in addition to the cost of capital, and corporate taxes. According to the stock-adjustment model, investment is related to

22 Methodology and Data Requirements the difference between the current and desired capital stocks: Id
t = α (K* - Kt-1) + δ Kt-1, where K* is the desired capital stock, Kt-1 is the capital stock from the last period, and α is the speed of adjustment. In a world with no adjustment costs, the current capital stock would adjust instantly to the desired capital stock. In reality, however, there are significant adjustment costs, which result in a substantial time-lag to move to the desired level. Since the desired capital stock, K*, is a function of the measures of profitability, interest rates, corporate taxes, and input costs, including the cost of intermediate inputs and labour, then investment will also depend on these variables and also on the capital stock at the beginning of the current period (i.e. from the last period) and the depreciation allowance. These are the variables entering into our investment equation. We also add measures of R&D as such activities are also important determinants of profitability and hence, investment. We estimate a fully specified model for domestic investment at the industry level: (3) GFCFit
d = f [corporate profitsit, corporate taxesit, wagesit, interest ratest, capital stocksit, depreciationit, R&D spendingit] + g [ industry-level FDI (outwardit, inwardit)]
for i = 1 to 15 industries over the period t = 1983 to 1995.15 This domestic investment demand equation is estimated for a panel of industries over time. We test whether patterns of FDI have any impact on GFCF, after the determinants of GFCF have been taken into account.

4. DATA DESCRIPTION The data were obtained from many different sources. The data appendix provides the sources and contact names. Box 2 below contains a description of the data.
Box 2 Data Description
Gross fixed capital formation End-of-year gross capital stocks Capital consumption allowances End-of-year net capital stocks
These data are available for Total, all components (50) Building construction (01) Engineering construction (03) Machinery and equipment (05)
Data at the 4 digit 1980 SIC classification
Data available both in 1961 constant dollars, and in current dollars
Data available for the period 1961-97
FDI stock data Inward and outward
Total for all countries, and bilateral between Canada and the United States, and Canada and the United Kingdom
Data at the SIC-C 1980 classification
Data available at historical costs Data available for the period
1983-98
Trade data Imports and exports
Total for all countries, and bilateral between Canada and the United States, and Canada and the United Kingdom
Data at the 4 digit SIC-E classification
Data available in current dollars Data available for the period
1983-98
R&D data
Total intramural R&D expenditures
Data at the SIC-C classification Data available in current dollars Data available for the period
1983-98
Corporate profits, before and after taxes
By subtracting corporate profits before tax from those after tax, we calculate both taxes paid and the average corporate tax rate.
Data at the SIC-C 1980 classification
Data available in current dollars Data available for the period
1983-98
Gross output and intermediate inputs price indices for Gross output Intermediate inputs Hours worked Capital inputs
Data at the P-level classification Data available in current and
constant dollars Data available for the period
1960-95
The data are in different industrial classifications and in different units. Our binding constraint was the industrial classification from which FDI data were available: SIC-C 1980 (see Box 3 below). FDI data are only made available in this industrial classification. We therefore carefully transformed all of our data into the SIC-C 1980 classification. This represented an enormous task that is obviously subject to some criticism. Since convertibility tables were available from the SIC-E trade data classification to the

24 Data Description
SIC-C FDI classification, trade data transformation was straightforward. By contrast, no convertibility tables are available from other data classifications into the SIC-C FDI classification. We were thus forced to do the transformation using detailed industry descriptions for each data set. A similar exercise was undertaken by Gera, Gu and Lee (1999). We used Table 1 from Gera, Gu and Lee as a guide to ensure that the distribution of our data by industry was similar to theirs.
Box 3 List of Industries (SIC-C 1980)
1 A Food, Beverages and Tobacco 2 B Wood and Paper 3 C Energy 4 D Chemicals, Chemical Products and Textiles 5 E Metallic Minerals and Metal Products 6 F Machinery and Equipment (except Electrical Machinery) 7 G Transportation Equipment 8 H Electrical and Electronic Products 9 I Construction and Related Activities 10 J Transportation Services 11 K Communications 12 L Finance and Insurance 13 MNO General Services to Business, Government Services,
Education, Health and Social Services 14 PQ Accommodation, Restaurants, Recreation Services and
Food Retailing 15 R Consumer Goods and Services
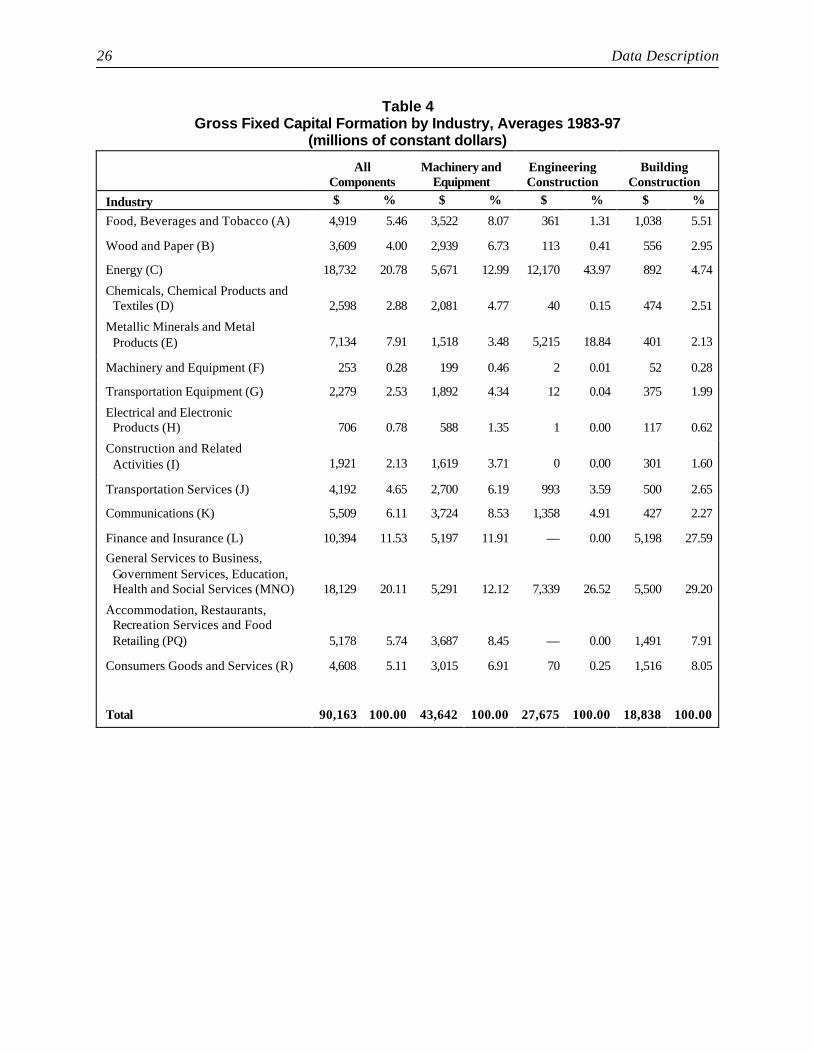
The data description that follows and our empirical results will focus on the SIC-C 1980 classification. Furthermore, current dollar figures were deflated to constant dollar figures using a price index for gross output by industry. Table 4 gives the distribution of gross fixed capital formation (GFCF) by industry over the period 1983-97. GFCF is broken down into three components: machinery and equipment capital formation, engineering construction capital formation, and building construction capital formation. For the whole economy, machinery and equipment capital formation represents 48.4 percent of GFCF (43,642/90,163), whereas engineering construction capital formation represents 30.7 percent (27,675/90,163) and building construction capital formation the remaining 20.9 percent (18,838/90,163). The importance of each of these components varies across industries. For example, for all components of GFCF, the Energy industry accounts for 20.78 percent, followed by General Services to Business, Government Services, Education, Health and Social Services, with 20.11 percent. The ranking is similar for both machinery and equipment capital formation and engineering construction capital formation, but not for building construction capital formation. For the latter, the largest sector is General Services to Business, Government Services, Education, Health and Social Services, followed closely by Finance and Insurance. Table 5 gives the distribution of capital stock by industry. For the economy as a whole, 25 percent (132,276/525,117) of the capital stock is accounted for by machinery and equipment, 42 percent (221,326/525,117) by engineering construction, with the remaining 33 percent (171,515/525,117) accounted for by building construction. As in the previous case, the importance of

Data Description 25
each component differs across industries. For all components, Energy accounts for 27.47 percent of the economy’s capital stock, followed by General Services to Business, Government Services, Education, Health and Social Services, with 25.46 percent. A similar ranking exists for engineering construction, whereas for machinery and equipment, Energy has the largest stock of capital followed by General Services to Business, Government Services, Education, Health and Social Services. As for building construction, the industry accounting for the largest capital stock is General Services to Business, Government Services, Education, Health and Social Services, followed by Finance and Insurance. Table 6 gives the distribution of inward and outward FDI stocks by industry. The data are not broken by components as were GFCF data and capital stock data. Nevertheless, data are broken down along the same industrial classification. Industries accounting for the largest stocks of FDI on the inward side are Energy, and Finance and Insurance; on the outward side, the largest industries are Finance and Insurance followed by Metallic Minerals and Metal Products. The data reported in Table 6 are averages over the sample period 1983-97. However, these averages mask the changes that have occurred over the sample period in each industry. For example, in 1983, only 10.79 percent of Canada’s outward FDI was in Finance and Insurance, but in 1997, the proportion had increased to over 32 percent. In contrast to this sharp increase, two industries experienced sharp drops in their share of Canada’s outward FDI — Energy, and Construction and Related Activities. On the inward side, Finance and Insurance has had far less dramatic growth, whereas Energy has experienced a sharp decline. In most industries on the inward side, there were no dramatic changes. Table 7 gives the distribution of trade by industry. Not surprisingly, Transportation Equipment is by far Canada’s largest export and import industry. Our next largest exporting industries are Energy; Food, Beverages and Tobacco; and Wood and Paper. As for imports, the next largest industries are Electrical and Electronic Products, and Machinery and Equipment. Finally, Table 8 provides the distribution of R&D expenditures, corporate profits, and corporate taxes paid, by industry. Industries exhibiting the highest R&D intensity are Electrical and Electronic Products, and Transportation Equipment. The industry with the largest share of before tax profits is Finance and Insurance, followed by Energy. Energy has the highest share of tax dollars paid, followed by Finance and Insurance.
26 Data Description
Table 4 Gross Fixed Capital Formation by Industry, Averages 1983-97
(millions of constant dollars)
All
Components Machinery and
Equipment Engineering Construction
Building Construction
Industry $ % $ % $ % $ %
Food, Beverages and Tobacco (A) 4,919 5.46 3,522 8.07 361 1.31 1,038 5.51
Wood and Paper (B) 3,609 4.00 2,939 6.73 113 0.41 556 2.95
Energy (C) 18,732 20.78 5,671 12.99 12,170 43.97 892 4.74
Chemicals, Chemical Products and Textiles (D) 2,598 2.88 2,081 4.77 40 0.15 474 2.51
Metallic Minerals and Metal Products (E) 7,134 7.91 1,518 3.48 5,215 18.84 401 2.13
Machinery and Equipment (F) 253 0.28 199 0.46 2 0.01 52 0.28
Transportation Equipment (G) 2,279 2.53 1,892 4.34 12 0.04 375 1.99
Electrical and Electronic Products (H) 706 0.78 588 1.35 1 0.00 117 0.62
Construction and Related Activities (I) 1,921 2.13 1,619 3.71 0 0.00 301 1.60
Transportation Services (J) 4,192 4.65 2,700 6.19 993 3.59 500 2.65
Communications (K) 5,509 6.11 3,724 8.53 1,358 4.91 427 2.27
Finance and Insurance (L) 10,394 11.53 5,197 11.91 — 0.00 5,198 27.59
General Services to Business, Government Services, Education, Health and Social Services (MNO) 18,129 20.11 5,291 12.12 7,339 26.52 5,500 29.20
Accommodation, Restaurants, Recreation Services and Food Retailing (PQ) 5,178 5.74 3,687 8.45 — 0.00 1,491 7.91
Consumers Goods and Services (R) 4,608 5.11 3,015 6.91 70 0.25 1,516 8.05
Total 90,163 100.00 43,642 100.00 27,675 100.00 18,838 100.00

Data Description 27
Table 5 Net Capital Stocks by Industry, Averages 1983-97
(millions of constant dollars)
All
Components Machinery and
Equipment Engineering Construction
Building Construction
Industry $ % $ % $ % $ %
Food, Beverages and Tobacco (A) 21,369 4.07 9,616 7.27 3,276 1.48 8,476 4.94
Wood and Paper (B) 16,525 3.15 12,344 9.33 604 0.27 3,577 2.09
Energy (C) 144,240 27.47 33,744 25.51 103,790 46.89 6,706 3.91
Chemicals, Chemical Products and Textiles (D) 12,144 2.31 7,455 5.64 637 0.29 4,051 2.36
Metallic Minerals and Metal Products (E) 30,938 5.89 5,273 3.99 22,294 10.07 3,371 1.97
Machinery and Equipment (F) 921 0.18 404 0.31 9 0.00 508 0.30
Transportation Equipment (G) 7,374 1.40 4,599 3.48 161 0.07 2,614 1.52
Electrical and Electronic Products (H) 2,256 0.43 1,228 0.93 8 0.00 1,020 0.59
Construction and Related Activities (I) 6,159 1.17 4,228 3.20 11 0.01 1,920 1.12
Transportation Services (J) 27,922 5.32 10,102 7.64 13,671 6.18 4,149 2.42
Communications (K) 25,369 4.83 12,168 9.20 9,009 4.07 4,192 2.44
Finance and Insurance (L) 60,391 11.50 8,026 6.07 — 0.00 52,365 30.53
General Services to Business, Government Services, Education, Health and Social Services (MNO) 133,684 25.46 11,180 8.45 67,551 30.52 54,952 32.04
Accommodation, Restaurants, Recreation Services and Food Retailing (PQ) 19,595 3.73 5,956 4.50 — 0.00 13,640 7.95
Consumer Goods and Services (R) 16,230 3.09 5,952 4.50 305 0.14 9,973 5.81
Total 525,117 100.00 132,276 100.00 221,326 100.00 171,515 100.00

28 Data Description
Table 6 Inward and Outward FDI by Industry, Averages 1983-97
(millions of dollars, historical costs)
Inward FDI Outward FDI
Industry $ % $ %
Food, Beverages and Tobacco (A) 9,985 7.54 7,083 7.22 Wood and Paper (B) 7,012 5.29 3,444 3.41 Energy (C) 20,924 17.49 9,136 9.60 Chemicals, Chemical Products and Textiles (D) 14,019 10.64 7,264 7.26 Metallic Minerals and Metal Products (E) 7,894 6.10 15,574 15.32 Machinery and Equipment (F) 5,262 4.09 742 0.66 Transportation Equipment (G) 13,658 10.55 2,244 2.04 Electrical and Electronic Products (H) 7,623 5.87 5,498 5.15 Construction and Related Activities (I) 6,051 4.86 5,227 6.16 Transportation Services and Communications (JK) 3,183 2.30 12,173 11.34 Finance and Insurance (L) 22,683 17.41 28,987 25.31 General Services to Business, Government Services,
Education, Health, Social Services, Accommodation, Restaurants, Recreation Services and Food Retailing (MNOPQ) 3,882 3.03 4,323 3.38
Consumer Goods and Services (R) 6,136 4.83 3,084 3.13
Total 128,314 100.00 104,779 100.00

Data Description 29
Table 7
Imports and Exports by Industry, Averages 1983-97 (millions of current dollars)
Imports Exports
Industry $ % $ %
Food, Beverages and Tobacco (A) 9,813 6.57 15,435 10.01
Wood and Paper (B) 4,086 2.74 15,435 10.01
Energy (C) 7,681 5.14 21,161 13.72
Chemicals, Chemical Products and Textiles (D) 18,747 12.55 13,426 8.70
Metallic Minerals and Metal Products (E) 12,019 8.05 15,387 9.98
Machinery and Equipment (F) 19,543 13.08 8,405 5.45
Transportation Equipment (G) 43,424 29.07 47,774 30.97
Electrical and Electronic Products (H) 22,211 14.87 11,763 7.63
Construction and Related Activities (I) 997 0.67 1,225 0.79
Transportation Services (J) — 0.00 — 0.00
Communications (K) 2,177 1.46 811 0.53
Finance and Insurance (L) — 0.00 — 0.00
General Services to Business, Government Services, Education, Health and Social Services (MNO)
15 0.01 14 0.01
Accommodation, Restaurants, Recreation Services and Food Retailing (PQ)
63 0.04 59 0.04
Consumer Goods and Services (R) 8,595 5.75 3,342 2.17
Total 149,372 100.00 154,236 100.00

30 Data Description
Table 8
R&D Expenditures, Corporate Profits and Corporate Taxes by Industry, Averages 1983-98
(millions of current dollars)
R&D
Expenditures Profit
Before Taxes Taxes
Industry $ % $ % $ %
Food, Beverages and Tobacco (A) 112 1.98 4,103 8.73 1,218 7.57 Wood and Paper (B) 133 2.37 2,109 4.49 815 5.06 Energy (C) 420 7.45 7,580 16.12 3,335 20.71 Chemicals, Chemical Products and Textiles (D) 554 9.83 2,922 6.21 1,064 6.61 Metallic Minerals and Metal Products (E) 279 4.94 3,308 7.03 963 5.98 Machinery and Equipment (F) 120 2.13 1,216 2.59 504 3.13 Transportation Equipment (G) 1,057 18.76 3,788 8.06 1,239 7.70 Electrical and Electronic Products (H) 1,382 24.52 1,638 3.48 570 3.54 Construction and Related Activities (I) 13 0.24 2,912 6.19 858 5.33 Transportation Services (J) 19 0.34 1,006 2.14 284 1.77 Communications (K) 143 2.53 3,114 6.62 1,126 7.00 Finance and Insurance (L) 186 3.30 8,505 18.09 2,350 14.59 General Services to Business, Government
Services, Education, Health, Social Services, Accommodation, Restaurants, Recreation Services and Food Retailing (MNOPQ) 911 16.16 2,053 4.37 754 4.69
Consumer Goods and Services (R) 307 5.45 2767 5.89 1,018 6.32
Total 5,636 100.00 47,021 100.00 16,101 100.00

5. ESTIMATION
In order to seriously examine the link between the FDI stock and GFCF, we must first condition on the determinants of GFCF. We therefore ask the following question: After the traditional determinants of GFCF are taken into account, do the patterns of FDI stock provide additional information? All variables are expressed relative to gross output by industry. GFCF by industry relative to gross output by industry is the dependent variable. All regressions are estimated in a panel-data framework with industry dummies, that is we estimate a fixed-effects model. The panels cover all fifteen industries (see Box 3 above). We also estimate our investment regressions for the six service industries alone and for the nine non-service industries. Although we report some regression results from equations that contain a lagged dependent variable, there is never a lagged dependent variable in the presence of our conditioning variables. That is, tables 9, 11, 13, and 15 contain a lagged dependent variable and no conditioning variables. Tables 10, 12, 14, and 16 through 19 contain conditioning variables but no lagged dependent variable. Since GFCF is available for all components as well as for the three sub-components (machinery and equipment capital formation, engineering construction capital formation, and building construction capital formation), we have also estimated the equations by these sub-components. Therefore, our results are decomposed by service industries and non-service industries as well as by the components of GFCF. Finally, we also have the FDI data on a bilateral-industry-level basis for the United States, the United Kingdom, and the rest of the world. We therefore test whether the impact of FDI on GFCF depends on the trading partner. Gross Fixed Capital Formation — All Components Our initial estimation results are presented in Table 9.16 Simply regressing GFCF for all components on its lagged values yields a very high R2 statistic (column 1). Column 2 reflects the addition of patterns of FDI stock, both outward and inward. Although there is no statistically significant link between outward FDI and GFCF, inward FDI is found to be statistically significant. Column 3 considers the link between GFCF and patterns of both outward and inward FDI without a lagged dependent variable. In this case, both outward and inward FDI are found to be statistically significant. We next replace the constant in the equation with industry fixed effects. Column 4 indicates the importance of industry fixed effects: a straight fixed-effects model does as well in terms of R2 than any of our other models.17 The importance of lagged GFCF relative to gross output falls in the presence of these industry fixed effects, but nonetheless remains highly significant. Adding patterns of FDI (column 6) is quite revealing: the importance of lagged GFCF is again reduced, and both outward FDI and inward FDI are found to be positively associated with GFCF. The coefficient estimate on inward FDI is about four times larger than that on outward FDI. However, the results presented in Table 9 are limited because several important conditioning variables were omitted. Before one can argue that FDI patterns have an impact on domestic capital formation, we must take into account the traditional determinants of GFCF. This is done in Table 10. We take into account the level of the capital stock, levels of depreciation, R&D expenditures, corporate taxes paid, price indices for total inputs and hours worked, and Treasury Bill yields.18 Patterns of FDI are then added. It should be stressed once again that the data are all at the industry level (with the exception of Treasury Bill yields). These regression results also contain unreported industry fixed effects. Again, we

32 Estimation estimate these relationships in a panel of all 15 industries spanning 12 years (1984-95), without a lagged dependent variable. We then break the sample down into service industries and non-service industries. The results for all industries indicate that GFCF is negatively related to depreciation and corporate taxes paid, but positively related to the level of the capital stock at the beginning of the year (end of the previous year) and to the amount of R&D expenditures. The results of interest, however, are those showing the impact of FDI on GFCF. The evidence indicates that after the conditioning variables and the industry fixed effects are taken into account, the significance of outward FDI disappears, whereas inward FDI maintains its statistical significance. Table 10 also presents results for service and non-service industries. In service industries, there is no statistically significant link between either outward or inward FDI and GFCF. In non-service industries, as in the case of all industries, we find no statistically significant link between outward FDI and GFCF, whereas inward FDI is positively related to GFCF. In short, the conclusions that emerge from Tables 9 and 10 are as follows. In the absence of conditioning variables, there appears to be a positive relationship between FDI, both outward and inward, and GFCF. However, only the statistical significance of the impact of inward FDI remains in the presence of conditioning variables. These results would allow us to conclude that the patterns of increasing outward FDI do not underlie the reduction of gross fixed capital formation in Canada. On the inward side, however, the positive relationship between inward FDI and capital formation would indicate that lower inward FDI relative to GDP does contribute to the observed reduction in capital formation (relative to GDP) in Canada. Gross Fixed Capital Formation by Component We next consider the same set of regressions, but breaking GFCF down into its components: machinery and equipment capital formation, engineering construction capital formation and building construction capital formation. Furthermore, we decompose both capital stocks and depreciation by these components. Recall that the relative importance of these components is provided in Table 4 above. Machinery and Equipment Capital Formation The regression results for the machinery and equipment component of GFCF are reported in Tables 11 and 12. In Table 11, we have no conditioning variables. Clearly, in the absence of industry fixed effects, there is no statistically significant impact of outward FDI on domestic capital formation, but inward FDI is positively related to GFCF. Adding industry fixed effects does not change these results, but adding the conditioning variables does (Table 12). For all industries and for non-service industries alone, outward FDI is found to have a negative and statistically significant impact on GFCF, whereas inward FDI supplements the domestic capital stock. As for service industries alone, there is no statistically significant link between FDI, both outward and inward, and GFCF. Engineering Construction Capital Formation The regression results for the engineering construction component of GFCF are reported in Tables 13 and 14. In Table 13, there is no conditioning variables. In the absence of industry fixed effects, there is a positive and statistically significant impact of both outward and inward FDI on domestic capital formation. Adding industry fixed effects does not change these results. However, adding the conditioning variables does change them (Table 14). For all industries, outward FDI has a positive and statistically significant impact on capital formation, whereas inward FDI is statistically insignificant. For non-service industries alone, outward and inward FDI have a positive and statistically significant impact on GFCF.

Estimation 33
On the other hand, there is no statistically significant link between FDI, both outward and inward, and GFCF in service industries. Building Construction Capital Formation The regression results for the building construction component of GFCF are reported in Tables 15 and 16. In Table 15, we have no conditioning variables. Clearly, in the absence of industry fixed effects, there is a positive and statistically significant effect of both outward and inward FDI on domestic capital formation. Adding industry fixed effects does not change these results. However, adding the conditioning variables changes them (Table 16). As in the case of machinery and equipment, outward FDI has a negative and statistically significant impact on capital formation for all industries and for non-service industries, but no significant impact in service industries alone. However, inward FDI supplements the domestic capital stock in all industries and in non-service industries, but not in service industries. Summary The results can be summarized as follows. First, we find that inward FDI supplements the domestic capital stock in non-service industries and for each component of GFCF. For all components of GFCF, the estimated impact of a one dollar increase in inward FDI is an increase of about 45 cents in capital formation in non-service industries. For machinery and equipment capital formation, the estimated impact is 22 cents, while it is 19 cents for engineering construction capital formation and only 6 cents for building construction capital formation. In service industries, GFCF is not estimated to increase as a result of inward FDI. As for outward FDI, we find that, on a net basis, there is no statistically significant impact of outward FDI on all components of GFCF. However, there is heterogeneity across the components of GFCF. One dollar of outward FDI tends to reduce machinery and equipment capital formation by 17 cents and building construction capital formation by 13 cents in non-service industries, but tends to increase engineering construction capital formation by 29 cents. Capital formation in service industries is not estimated to change as a result of outward FDI. It is unclear to us why we observe no relationship between FDI, both outward and inward, in service industries, as well as the heterogeneity in the impact of FDI patterns on GFCF broken down in its components. Explanations of these results are thus left to future research.

34 Estimation
Table 9 Fixed-Effects Model Without Conditioning Variables
Dependent Variable: GFCF, All Components (1) (2) (3) (4) (5) (6)
Constant 0.007 (0.51)
–0.031 (–1.85)
–0.216 (–7.21)
Industry A
0.171 (2.93)
0.072 (1.49)
–0.068 (–1.32)
Industry B
0.277 (4.75)
0.126 (2.54)
–0.074 (–1.25)
Industry C
5.83 (100.17)
2.57 (7.71)
0.655 (1.40)
Industry D
0.121 (2.07)
0.052 (1.09)
–0.228 (–3.36)
Industry E
0.197 (3.38)
0.087 (1.78)
–0.014 (–0.28)
Industry F
0.050 (0.85)
0.023 (0.48)
–0.411 (–4.42)
Industry G
0.151 (2.59)
0.070 (1.45)
–0.280 (–3.51)
Industry H
0.107 (1.84)
0.044 (0.91)
–0.477 (–4.58)
Industry I
0.050 (0.86)
0.023 (0.48)
–0.046 (–1.00)
Industry J
0.155 (2.66)
0.066 (1.37)
0.054 (1.20)
Industry K
0.139 (2.40)
0.065 (1.35)
0.050 (1.11)
Industry L
0.115 (1.99)
0.053 (1.11)
–0.058 (–1.18)
Industries MNO
0.104 (1.80)
0.106 (2.15)
0.060 (1.34)
Industries PQ
0.230 (3.96)
0.047 (0.99)
0.095 (2.06)
Industry R
0.058 (1.00)
0.027 (0.57)
.000 (0.05)
GFCF(-1) 0.982 (104.97)
0.845 (24.71)
0.555 (9.88)
0.380 (6.23)
Outward FDI
0.065 (1.53)
0.352 (4.31)
0.105 (2.37)
Inward FDI
0.102 (3.22)
0.726 (19.15)
0.402 (5.18)
Adjusted R2 0.981 0.983 0.932 0.977 0.984 0.986
Number of Observations 210 210 210 210 210 210 Note: Standard errors are autocorrelation consistent; t statistics are reported in parentheses.
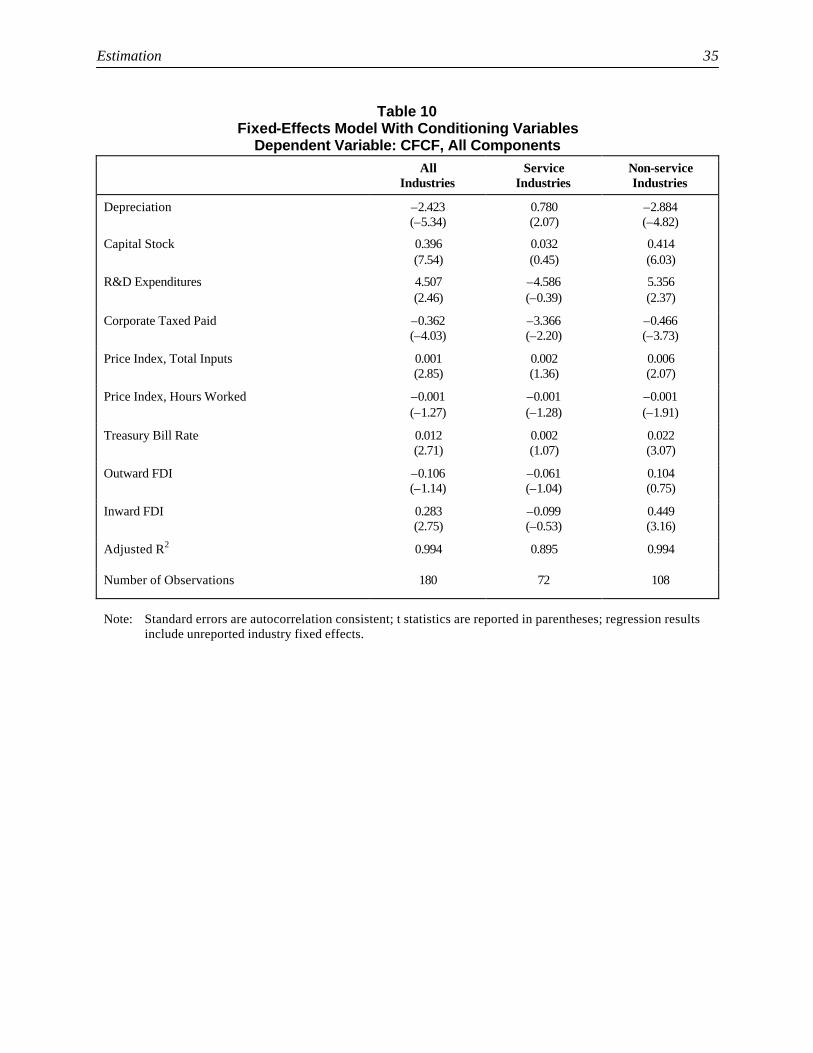
Estimation 35
Table 10
Fixed-Effects Model With Conditioning Variables Dependent Variable: CFCF, All Components
All Industries
Service Industries
Non-service Industries
Depreciation –2.423 (–5.34)
0.780 (2.07)
–2.884 (–4.82)
Capital Stock 0.396 (7.54)
0.032 (0.45)
0.414 (6.03)
R&D Expenditures 4.507 (2.46)
–4.586 (–0.39)
5.356 (2.37)
Corporate Taxed Paid –0.362 (–4.03)
–3.366 (–2.20)
–0.466 (–3.73)
Price Index, Total Inputs 0.001 (2.85)
0.002 (1.36)
0.006 (2.07)
Price Index, Hours Worked –0.001 (–1.27)
–0.001 (–1.28)
–0.001 (–1.91)
Treasury Bill Rate 0.012 (2.71)
0.002 (1.07)
0.022 (3.07)
Outward FDI –0.106 (–1.14)
–0.061 (–1.04)
0.104 (0.75)
Inward FDI 0.283 (2.75)
–0.099 (–0.53)
0.449 (3.16)
Adjusted R2 0.994 0.895 0.994
Number of Observations 180 72 108
Note: Standard errors are autocorrelation consistent; t statistics are reported in parentheses; regression results
include unreported industry fixed effects.
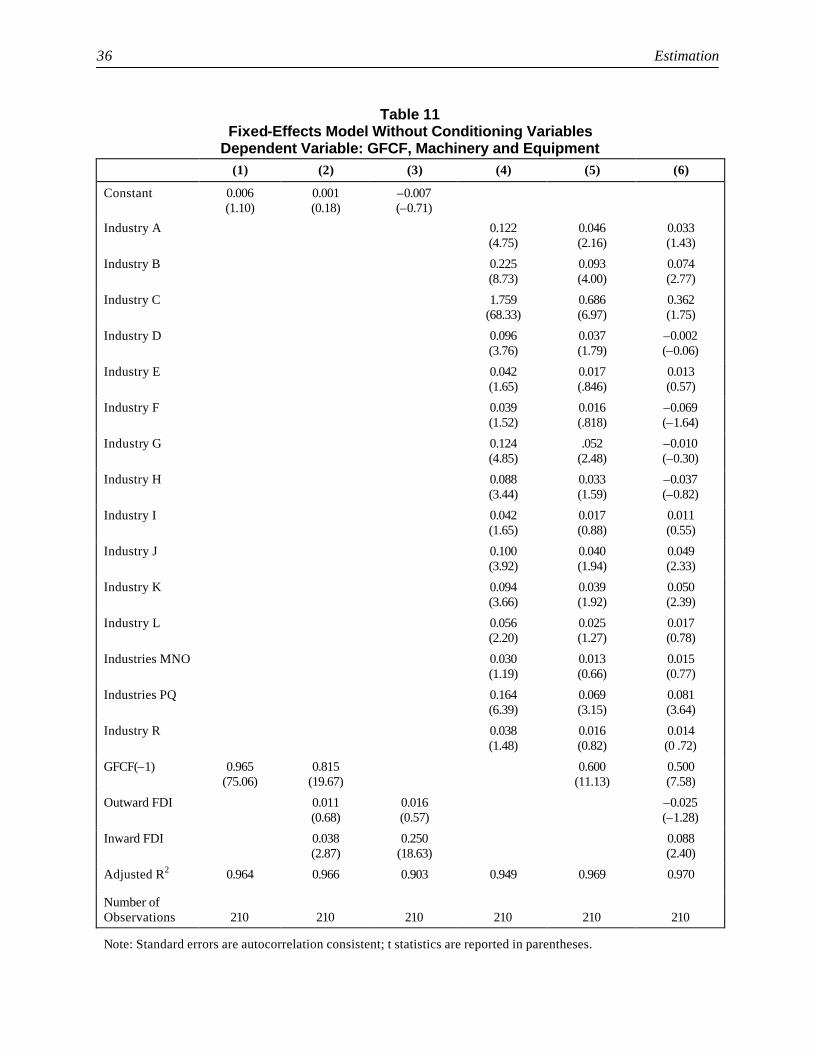
36 Estimation
Table 11 Fixed-Effects Model Without Conditioning Variables
Dependent Variable: GFCF, Machinery and Equipment (1) (2) (3) (4) (5) (6)
Constant 0.006 (1.10)
0.001 (0.18)
–0.007 (–0.71)
Industry A 0.122 (4.75)
0.046 (2.16)
0.033 (1.43)
Industry B 0.225 (8.73)
0.093 (4.00)
0.074 (2.77)
Industry C 1.759 (68.33)
0.686 (6.97)
0.362 (1.75)
Industry D 0.096 (3.76)
0.037 (1.79)
–0.002 (–0.06)
Industry E 0.042 (1.65)
0.017 (.846)
0.013 (0.57)
Industry F 0.039 (1.52)
0.016 (.818)
–0.069 (–1.64)
Industry G 0.124 (4.85)
.052 (2.48)
–0.010 (–0.30)
Industry H 0.088 (3.44)
0.033 (1.59)
–0.037 (–0.82)
Industry I 0.042 (1.65)
0.017 (0.88)
0.011 (0.55)
Industry J 0.100 (3.92)
0.040 (1.94)
0.049 (2.33)
Industry K 0.094 (3.66)
0.039 (1.92)
0.050 (2.39)
Industry L 0.056 (2.20)
0.025 (1.27)
0.017 (0.78)
Industries MNO 0.030 (1.19)
0.013 (0.66)
0.015 (0.77)
Industries PQ 0.164 (6.39)
0.069 (3.15)
0.081 (3.64)
Industry R 0.038 (1.48)
0.016 (0.82)
0.014 (0 .72)
GFCF(–1) 0.965 (75.06)
0.815 (19.67)
0.600 (11.13)
0.500 (7.58)
Outward FDI 0.011 (0.68)
0.016 (0.57)
–0.025 (–1.28)
Inward FDI 0.038 (2.87)
0.250 (18.63)
0.088 (2.40)
Adjusted R2 0.964 0.966 0.903 0.949 0.969 0.970
Number of Observations 210 210 210 210 210 210 Note: Standard errors are autocorrelation consistent; t statistics are reported in parentheses.

Estimation 37
Table 12
Fixed-Effects Model With Conditioning Variables Dependent Variable: GFCF, Machinery and Equipment
All Industries
Service Industries
Non-service Industries
Depreciation –1.039 (–2.83)
–0.594 (–2.21)
–1.861 (–3.49)
Capital Stock 0.281 (5.11)
0.662 (5.72)
0.350 (4.61)
R&D Expenditures 2.414 (2.51)
7.073 (1.07)
2.992 (2.57)
Corporate Taxed Paid –0.134 (–2.24)
–0.453 (–0.46)
–0.177 (–2.14)
Price Index, Total Inputs 0.001 (2.95)
0.002 (2.14)
0.003 (1.90)
Price Index, Hours Worked –0.001 (–0.62)
–0.001 (–0.94)
–0.002 (–1.21)
Treasury Bill Rate 0.006 (2.54)
0.008 (0.99)
0.011 (2.91)
Outward FDI –0.260 (–5.50)
–0.048 (–1.41)
–0.172 (–2.50)
Inward FDI 0.157 (2.97)
–0.040 (–0.38)
0.224 (3.18)
Adjusted R2 0.981 0.950 0.982
Number of Observations 180 72 108
Note: Standard errors are autocorrelation consistent; t statistics are reported in parentheses; regression results
include unreported industry fixed effects.
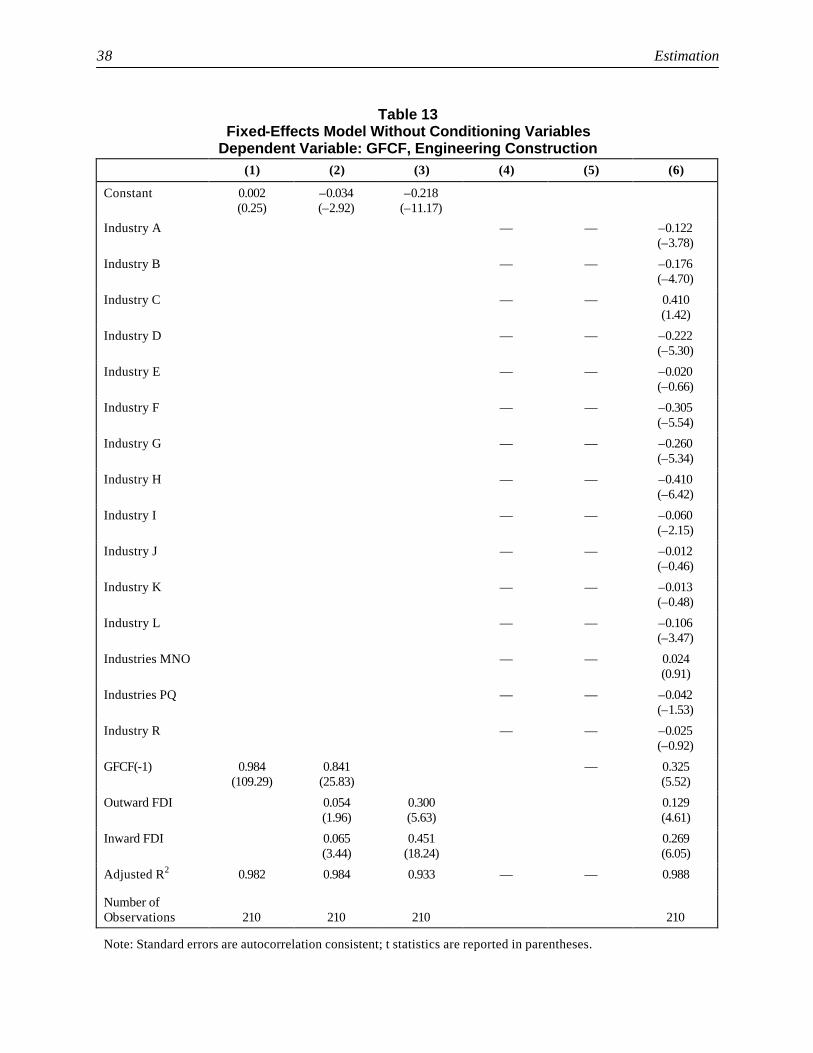
38 Estimation
Table 13 Fixed-Effects Model Without Conditioning Variables
Dependent Variable: GFCF, Engineering Construction (1) (2) (3) (4) (5) (6)
Constant 0.002 (0.25)
–0.034 (–2.92)
–0.218 (–11.17)
Industry A — — –0.122 (–3.78)
Industry B — — –0.176 (–4.70)
Industry C — — 0.410 (1.42)
Industry D — — –0.222 (–5.30)
Industry E — — –0.020 (–0.66)
Industry F — — –0.305 (–5.54)
Industry G — — –0.260 (–5.34)
Industry H — — –0.410 (–6.42)
Industry I — — –0.060 (–2.15)
Industry J — — –0.012 (–0.46)
Industry K — — –0.013 (–0.48)
Industry L — — –0.106 (–3.47)
Industries MNO — — 0.024 (0.91)
Industries PQ — — –0.042 (–1.53)
Industry R — — –0.025 (–0.92)
GFCF(-1) 0.984 (109.29)
0.841 (25.83)
— 0.325 (5.52)
Outward FDI 0.054 (1.96)
0.300 (5.63)
0.129 (4.61)
Inward FDI 0.065 (3.44)
0.451 (18.24)
0.269 (6.05)
Adjusted R2 0.982 0.984 0.933 — — 0.988
Number of Observations 210 210 210 210 Note: Standard errors are autocorrelation consistent; t statistics are reported in parentheses.
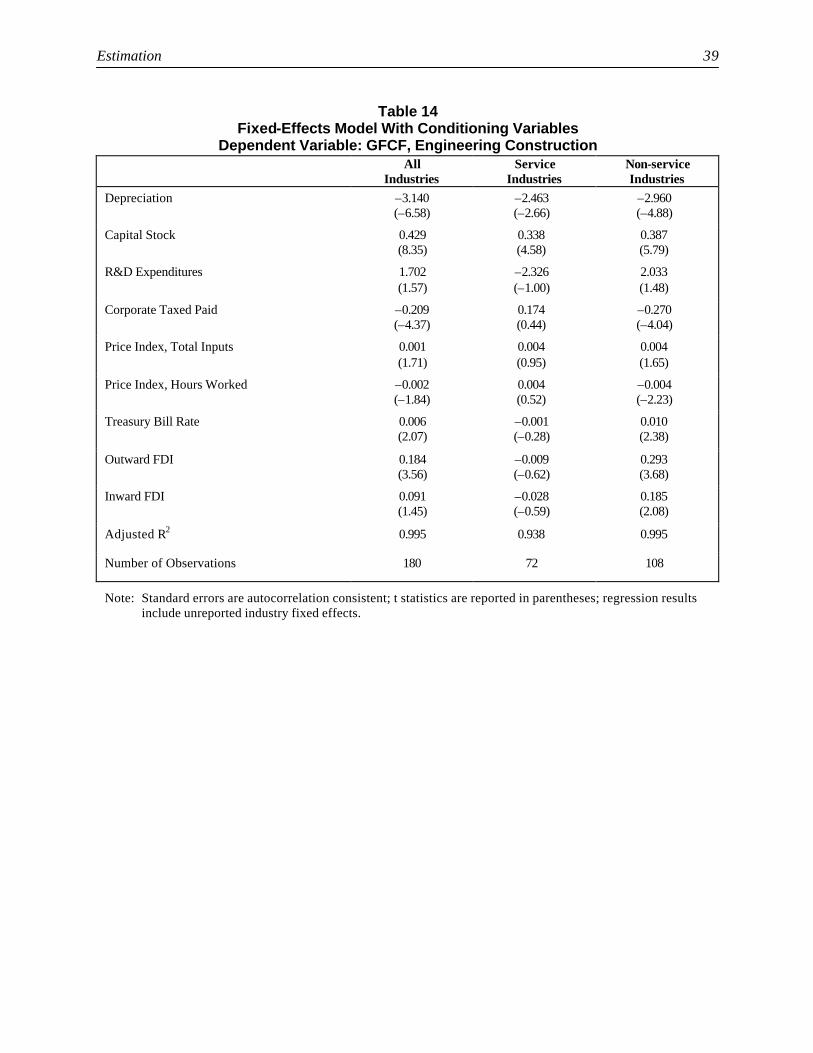
Estimation 39
Table 14
Fixed-Effects Model With Conditioning Variables Dependent Variable: GFCF, Engineering Construction All
Industries Service
Industries Non-service Industries
Depreciation –3.140 (–6.58)
–2.463 (–2.66)
–2.960 (–4.88)
Capital Stock 0.429 (8.35)
0.338 (4.58)
0.387 (5.79)
R&D Expenditures 1.702 (1.57)
–2.326 (–1.00)
2.033 (1.48)
Corporate Taxed Paid –0.209 (–4.37)
0.174 (0.44)
–0.270 (–4.04)
Price Index, Total Inputs 0.001 (1.71)
0.004 (0.95)
0.004 (1.65)
Price Index, Hours Worked –0.002 (–1.84)
0.004 (0.52)
–0.004 (–2.23)
Treasury Bill Rate 0.006 (2.07)
–0.001 (–0.28)
0.010 (2.38)
Outward FDI 0.184 (3.56)
–0.009 (–0.62)
0.293 (3.68)
Inward FDI 0.091 (1.45)
–0.028 (–0.59)
0.185 (2.08)
Adjusted R2 0.995 0.938 0.995
Number of Observations 180 72 108
Note: Standard errors are autocorrelation consistent; t statistics are reported in parentheses; regression results
include unreported industry fixed effects.

40 Estimation
Table 15 Fixed-Effects Model Without Conditioning Variables Dependent Variable: GFCF, Building Construction
(1) (2) (3) (4) (5) (6)
Constant 0.004 (1.62)
0.004 (1.83)
0.010 (3.60)
Industry A 0.036 (4.68)
0.026 (3.36)
0.014 (1.68)
Industry B 0.043 (5.58)
0.032 (3.97)
0.015 (1.60)
Industry C 0.281 (36.48)
0.209 (10.07)
–0.007 (–0.01)
Industry D 0.022 (2.87)
0.016 (2.16)
–0.006 (–0.64)
Industry E 0.011 (1.44)
0.008 (1.06)
–0.008 (–0.98)
Industry F 0.010 (1.34)
0.007 (1.02)
–0.021 (–1.54)
Industry G 0.025 (3.30)
0.019 (2.47)
–0.004 (–0.34)
Industry H 0.018 (2.38)
0.012 (1.69)
–0.034 (–2.22)
Industry I 0.007 (1.01)
0.005 (0.77)
0.000 (–0.12)
Industry J 0.018 (2.37)
0.013 (1.77)
0.009 (1.32)
Industry K 0.010 (1.41)
0.008 (1.07)
0.002 (0.35)
Industry L 0.059 (7.66)
0.043 (5.03)
0.034 (4.00)
Industries MNO
0.031 (4.11)
0.023 (3.01)
0.026 (3.46)
Industries PQ 0.065 (8.52)
0.048 (5.58)
0.049 (5.79)
Industry R 0.019 (2.49)
0.014 (1.89)
0.013 (1.80)
GFCF(-1) 0.900 (27.57)
0.540 (9.04)
0.259 (3.71)
0.163 (2.26)
Outward FDI 0.012 (1.85)
0.035 (4.57)
0.027 (3.56)
Inward FDI 0.012 (3.93)
0.023 (6.70)
0.024 (2.22)
Adjusted R2 0.785 0.823 0.755 0.847 0.846 0.858
Number of Observations 210 210 210 210 210 210 Note: Standard errors are autocorrelation consistent; t statistics are reported in parentheses.
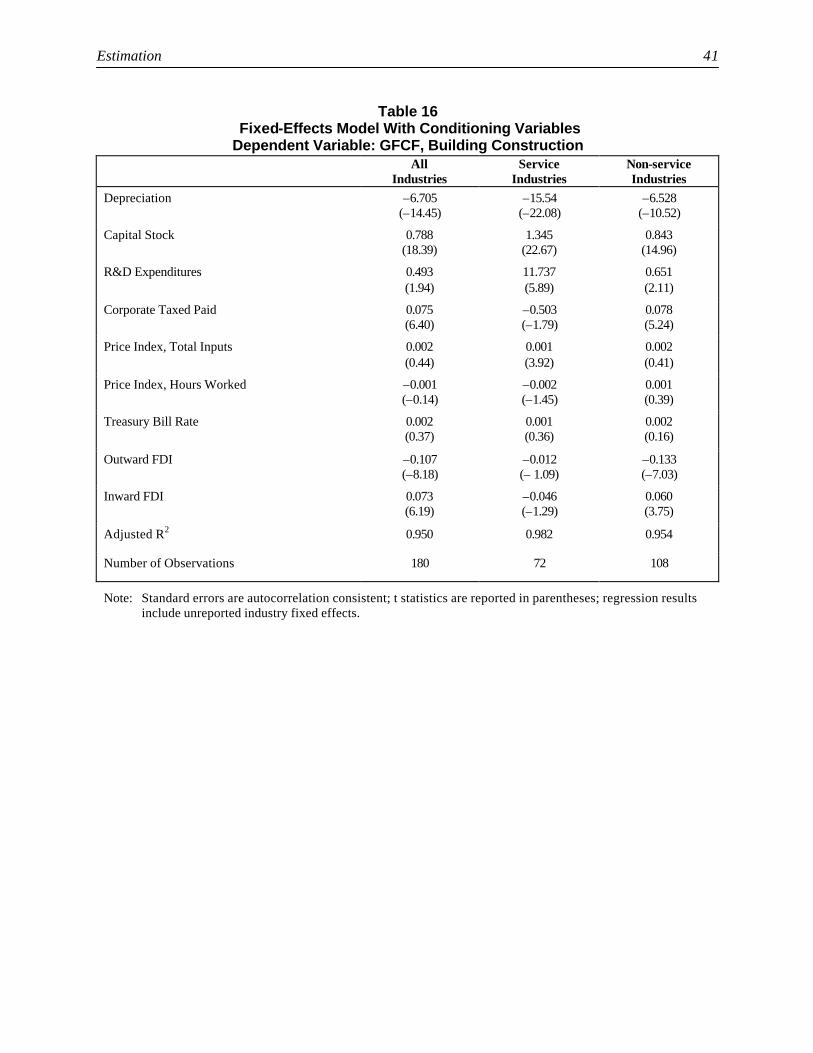
Estimation 41
Table 16
Fixed-Effects Model With Conditioning Variables Dependent Variable: GFCF, Building Construction
All Industries
Service Industries
Non-service Industries
Depreciation –6.705 (–14.45)
–15.54 (–22.08)
–6.528 (–10.52)
Capital Stock 0.788 (18.39)
1.345 (22.67)
0.843 (14.96)
R&D Expenditures 0.493 (1.94)
11.737 (5.89)
0.651 (2.11)
Corporate Taxed Paid 0.075 (6.40)
–0.503 (–1.79)
0.078 (5.24)
Price Index, Total Inputs 0.002 (0.44)
0.001 (3.92)
0.002 (0.41)
Price Index, Hours Worked –0.001 (–0.14)
–0.002 (–1.45)
0.001 (0.39)
Treasury Bill Rate 0.002 (0.37)
0.001 (0.36)
0.002 (0.16)
Outward FDI –0.107 (–8.18)
–0.012 (– 1.09)
–0.133 (–7.03)
Inward FDI 0.073 (6.19)
–0.046 (–1.29)
0.060 (3.75)
Adjusted R2 0.950 0.982 0.954
Number of Observations 180 72 108
Note: Standard errors are autocorrelation consistent; t statistics are reported in parentheses; regression results
include unreported industry fixed effects.


6. DOES THE TRADING /
INVESTMENT PARTNER MATTER?
As a final exercise, we test whether the home and host country matter in terms of the impact that changing patterns of FDI have on Canadian GFCF. Tables 17 and 18 report regression results for the impact on capital formation of changing FDI patterns between Canada and the United States and between Canada and the United Kingdom, respectively. Table 19 provides evidence on the impact of FDI between Canada and the rest of the world (net of the U.S. and the U.K.) on capital formation in Canada. To conserve space, we report only coefficients of interest — those that measure the impact of FDI on capital formation. We do not report industry fixed effects nor the estimated coefficients on the conditioning variables. The results indicate that the trading partner does matter with regard to the estimated impact of FDI on domestic capital formation. As in the previous discussion, these estimates are undertaken for a panel of all industries, as well as for service industries and non-service industries alone. The regressions are also further disaggregated by GFCF components. All Components For the United States (Table 17), the results indicate that increases in both outward and inward FDI result in increased domestic capital formation for all components of GFCF, for all industries and for non-service industries. There is no estimated impact in services industries. For the United Kingdom (Table 18), outward FDI is found to have no significant impact on GFCF. As for inward FDI from the United Kingdom, capital formation is supplemented in all industries and in non-service industries, but not in service industries. Table 19 provides evidence on the impact FDI with the rest of the world has on capital formation in Canada. In contrast to the above cases, the impact of Canada’s outward FDI to the rest of the world is strongly negative and statistically significant. This is true for all industries and for non-service industries. There is no statistically significant link between outward FDI to the rest of the world and capital formation in services industries. Inward FDI from the rest of the world is found to supplement the capital stock in all industries and in non-service industries, but no statistically significant link is observed for service industries. Machinery and Equipment Outward FDI supplements machinery and equipment domestic capital formation in Canada for all industries and for non-service industries only in the case of the United States. Outward FDI to the United Kingdom and to the rest of the world reduces machinery and equipment capital formation in Canada. Again this holds for all industries and for non-service industries. There is no measured impact on capital formation in service industries. On the other hand, inward FDI is found to stimulate machinery and equipment capital formation in all industries and in non-service industries for the United States, the United Kingdom and the rest of the world. There is no measured impact in service industries.

44 Does the Trading / Investment Partner Matter?
Table 17 Fixed-Effects Model With Conditioning Variables
(U.S. FDI) Dependent Variable: GFCF, All components
All industries
Service Industries
Non-service Industries
Outward FDI 0.809 (4.86)
–0.064 (–1.04)
1.388 (5.80)
Inward FDI 0.390 (5.49)
0.074 (0.34)
0.443 (5.41)
Adjusted R2 0.995 0.894 0.996
Number of Observations 180 72 108
Dependent Variable: GFCF, Machinery and Equipment
All industries
Service Industries
Non-service Industries
Outward FDI 0.244 (2.53)
–0.042 (–1.20)
0.479 (3.50)
Inward FDI 0.370 (9.18)
0.026 (0.22)
0.382 (8.35)
Adjusted R2 0.980 0.949 0.984
Number of Observations 180 72 108
Dependent Variable: GFCF, Engineering Construction
All industries
Service Industries
Non-service Industries
Outward FDI 0.518 (5.32)
–0.013 (–0.81)
0.869 (5.81)
Inward FDI –0.035 (–0.81)
0.069 (1.22)
0.014 (0.27)
Adjusted R2 0.995 0.939 0.996
Number of Observations 180 72 108
Dependent Variable: GFCF, Building Construction
All industries
Service Industries
Non-service Industries
Outward FDI –0.029 (–1.28)
–0.002 (–0.20)
–0.035 (–1.01)
Inward FDI 0.157 (10.27)
–0.091 (–2.27)
0.163 (8.22)
Adjusted R2 0.947 0.983 0.949
Number of Observations 180 72 108
Note: Standard errors are autocorrelation consistent; t statistics are reported in parentheses;
regression results include unreported industry fixed effects.

Does the Trading / Investment Partner Matter? 45
Table 18
Fixed-Effects Model With Conditioning Variables (U.K. FDI)
Dependent Variable: GFCF, All Components
All Industries
Service Industries
Non-service Industries
Outward FDI 0.058 (0.19)
0.268 (1.28)
0.126 (0.31)
Inward FDI 1.401 (3.93)
–0.243 (–0.28)
1.234 (2.68)
Adjusted R2 0.994 0.895 0.994
Number of Observations 180 72 108
Dependent Variable: GFCF, Machinery and Equipment
All Industries
Service Industries
Non-service Industries
Outward FDI –0.312 (–1.96)
–0.124 (–1.14)
–0.312 (–1.51)
Inward FDI 1.284 (6.81)
–0.642 (–1.43)
1.121 (4.53)
Adjusted R2 0.981 0.950 0.981
Number of Observations 180 72 108
Dependent Variable: GFCF, Engineering Construction
All Industries
Service Industries
Non-service Industries
Outward FDI 0.671 (3.61)
.095 (1.34)
0.733 (2.92)
Inward FDI 0.311 (1.45)
–0.317 (–1.60)
0.293 (1.03)
Adjusted R2 0.995 0.941 0.995
Number of Observations 180 72 108
Dependent Variable: GFCF, Building Construction
All Industries
Service Industries
Non-service Industries
Outward FDI –0.280 (–5.80)
–0.101 (–2.93)
–0.318 (–5.12)
Inward FDI 0.200 (4.19)
–0.230 (–1.27)
0.171 (2.86)
Adjusted R2 0.937 0.984 0.939
Number of Observations 180 72 108 Note: Standard errors are autocorrelation consistent; t statistics are reported in parentheses;
regression results include unreported industry fixed effects.

46 Does the Trading / Investment Partner Matter?
Table 19 Fixed-Effects Model With Conditioning Variables
(Rest of the World FDI) Dependent Variable: GFCF, All components
All Industries
Service Industries
Non-service Industries
Outward FDI –1.743 (–11.43)
–0.196 (–1.17)
–1.734 (–8.65)
Inward FDI 1.405 (6.95)
–0.325 (–0.87)
1.514 (5.63)
Adjusted R2 0.996 0.900 0.996
Number of Observations 180 72 108
Dependent Variable: GFCF, Machinery and Equipment
All Industries
Service Industries
Non-service Industries
Outward FDI –0.917 (–11.12)
0.021 (0.22)
–0.924 (–8.70)
Inward FDI 0.246 (2.12)
–0.192 (–0.90)
0.311 (2.04)
Adjusted R2 0.988 0.948 0.989
Number of Observations 180 72 108
Dependent Variable: GFCF, Engineering Construction
All Industries
Service Industries
Non-service Industries
Outward FDI –0.676 (–5.90)
–.021 (–0.53)
–0.692 (–4.54)
Inward FDI 1.014 (7.29)
–0.227 (–2.46)
1.107 (5.91)
Adjusted R2 0.996 0.946 0.996
Number of Observations 180 72 108
Dependent Variable: GFCF, Building Construction
All Industries
Service Industries
Non-service Industries
Outward FDI –0.235 (–8.49)
–0.062 (–1.79)
–0.275 (–8.80)
Inward FDI –0.076 (–2.22)
0.098 (1.30)
–0.163 (–4.12)
Adjusted R2 0.949 0.982 0.963
Number of Observations 180 72 108
Note: Standard errors are autocorrelation consistent; t statistics are reported in parentheses;
regression results include unreported industry fixed effects.

Does the Trading / Investment Partner Matter? 47
Engineering Construction Outward FDI to the United States and the United Kingdom is found to have a positive and statistically significant impact on engineering construction capital formation in all industries and in non-service industries, but no impact in service industries. Outward FDI to the rest of the world reduces engineering construction capital formation in all industries and in non-service industries, but has no impact on engineering construction in service industries. Inward FDI from the United States and the United Kingdom has no measured impact on engineering construction for all industries, non-service industries, or service industries. In contrast, inward FDI from the rest of the world stimulates engineering construction capital formation for all industries and the non-service industries, but reduces such capital formation for the service industries. Building Construction Outward FDI to the United States has no statistically significant impact on building construction capital formation in any industry. In contrast, outward FDI to the United Kingdom and the rest of the world reduces capital formation in all industries, non-service industries, and service industries. Inward FDI from the United States and the United Kingdom increases building construction capital formation in all industries and non-service industries. For the United States, it also reduces building construction capital formation in services industries, whereas there is an insignificant effect for the United Kingdom. As for the rest of the world, inward FDI reduces building construction capital formation in all industries and non-service industries, with no statistically significant impact in service industries. Summarizing the Evidence We have presented regression results that cover many different possibilities. Consequently, it is difficult to get a clear impression of the overall picture. To help in this task, we have constructed a 3-panel table that summarizes our empirical results (Table 20): Panel A reports the results for the impact of outward FDI on capital formation, while panel B reports the results for inward FDI. These results are provided for our regressions based on FDI with all countries, the United States, the United Kingdom, and the rest of the world. For each of these, there are four additional entries, labelled 1 to 4, to identify the components of capital formation: 1) all components, 2) machinery and equipment, 3) engineering construction, and 4) building construction. Finally, the results are provided for three industry groupings: all industries, service industries, and non-service industries. In total, there are 48 entries for the impact of outward FDI and 48 for the impact of inward FDI. We have indicated whether the estimated impact is positive or negative, as well as whether the relationship is statistically significant. Panel C provides a summary of how many coefficients have a positive or negative sign, and how many are statistically significant. We discuss the results in Panel C. In the outward FDI regressions, 26 of the estimated relationships are positive and 22 are negative. Furthermore, 11 of the positive links and 14 of the negative links are statistically significant. As for the inward FDI results, 33 coefficients have a positive sign and 15 a negative sign, with 25 of the former statistically significant, and only 4 of the latter statistically significant. In other words, in about half the cases, the impact of outward FDI has no statistically significant impact on capital formation (23 of 48 effects are insignificant); in about 25 percent of cases, the impact is positive and statistically significant (11 out of 48); for the remaining 25 percent of cases, the impact is negative and statistically significant (14 out of 48). This explains why the net impact for all industries and all countries is statistically insignificant. As for inward FDI, there is no statistically significant impact in 40 percent of

48 Does the Trading / Investment Partner Matter?
the cases (19 out of 48 effects are insignificant); in about 50 percent of the cases, the impact is positive and statistically significant (25 out of 48); and in the remaining 10 percent of cases, the impact is negative and statistically significant (4 out of 48). This explains why the net impact for all industries and all countries is positive and statistically insignificant.
Table 20 Summary of Empirical Evidence
Panel A Estimated Impact of Outward FDI on Domestic Capital Formation
All Countries United States United Kingdom Rest of World
1 2 3 4 1 2 3 4 1 2 3 4 1 2 3 4
All Industries – (–) (+) (–) (+) (+) (+) – + – (+) (–) (–) (–) (–) (–)
Services Industries – – – – – – – – + – + (–) – + – –
Non-service Industries + (–) (+) (–) (+) (+) (+) – + – (+) (–) (–) (–) (–) (–)
Panel B Estimated Impact of Inward FDI on Domestic Capital Formation
All Countries United States United Kingdom Rest of World
1 2 3 4 1 2 3 4 1 2 3 4 1 2 3 4
All Industries (+) (+) + (+) (+) (+) – (+) (+) (+) + (+) (+) (+) (+) (–)
Services Industries – – – – + + + (–) – – – – – – (–) +
Non-service Industries (+) (+) (+) (+) (+) (+) + (+) (+) (+) + (+) (+) (+) (+) (–)
Panel C Sign Count from Panels A and B
Outward FDI Impact Inward FDI Impact Total
Pos. Pos. Sig. Neg.
Neg. Sig. Pos.
Pos. Sig.
Neg.
Neg. Sig. Pos.
Pos. Sig. Neg.
Neg. Sig.
All Industries 6 5 10 7 14 12 2 1 20 17 12 8
Services Industries 13 1 3 0 4 0 12 2 17 1 15 2
Non-service Industries 7 5 9 7 15 13 1 1 22 18 10 8
Total 26 11 22 14 33 25 15 4 59 36 37 18 Notes: 1 = All Components, 2 = Machinery and Equipment, 3 = Engineering Construction, 4 = Building
Construction. Entries in parentheses are statistically significant.
Does the Trading / Investment Partner Matter? 49
Explaining the Heterogeneity Across Countries We now attempt to explain the heterogeneity observed across countries, but not across the components of capital formation. For all components, inward FDI tends to complement capital formation, whether FDI from all countries, or FDI from the United States, the United Kingdom, or the rest of the world considered separately. As for outward FDI, data for all countries reveal no statistically significant impact. However, breaking down outward FDI gives very different results: outward FDI to the United States tends to stimulate capital formation in Canada; outward FDI to the United Kingdom has no statistically significant impact on capital formation; and outward FDI to the rest of the world tends to reduce capital formation. It is this heterogeneity that we hope to explain in what follows. To help explain the different impacts of outward FDI to the world, the United States, the United Kingdom, and the rest of the world, we consider four possibilities: the distribution of FDI by service industries and non-service industries; Canada’s FDI to Barbados, the Bahamas, and Bermuda; average duty rates; and the role of intra-firm trade. Data limitations prevent the use of a formal statistical analysis. We must therefore try to determine whether the observed heterogeneity in our results across countries can somehow be explained by the heterogeneity in these factors by country. We provide more detail below on FDI data by industry. Table 21 provides the distribution of Canada’s outward and inward FDI by industry over the sample period. Table 22 provides similar data for the United States, Table 23 for the United Kingdom, and Table 24 for the rest of the world. Once again, these tables contain a lot of information that is difficult to absorb. Therefore, we have summarized the distribution of FDI by service industries in Table 25. The data indicate that although a majority of Canada’s outward FDI is in services, only about 30 percent of Canada’s inward FDI is in that sector. That is, a majority of Canada’s inward FDI remains in manufacturing and natural resources. Also, over the 1983-97 period, the share of services in Canada’s inward FDI has grown slowly, whereas the share of services in Canada’s outward FDI has grown rapidly. These patterns are very similar to those for the United States and the United Kingdom. What is surprising is the decreasing share of inward FDI coming from the rest of the world in services. Almost half of Canada’s inward FDI from the United Kingdom (45 percent) is in services while 55 percent of Canada’s outward FDI to the United Kingdom is in that sector. What is interesting here is that the percentage of Canada’s outward FDI in services is very much the same, whether we consider the United States, the United Kingdom, or the rest of the world. In contrast, the percentage of inward FDI from the United States going into services is lower than for FDI coming from the rest of the world or the United Kingdom. Our results for the impact of FDI on capital formation in Canada shows heterogeneity for outward FDI but not for inward FDI. That is, inward FDI from the United States, the United Kingdom and the rest of the world, for all components and for all industries, tends to increase capital formation in Canada, albeit to different degrees. As for outward FDI, the impact differs by trading partner: outward FDI to the United States increases capital formation in Canada; outward FDI to the United Kingdom has no statistically significant impact on capital formation in Canada; finally, outward FDI to the rest of the world tends to reduce capital formation in Canada. As for the distribution of FDI by service industries and non-service industries, we find heterogeneity on the inward side, whereas Canada’s outward FDI to these three partners appears quite similar. In other words, the distribution of FDI between service industries and non-service industries is unlikely to explain these results. There is one important qualification to make when looking at Canada’s outward FDI regarding the role of the three Bs, namely Barbados, Bermuda and the Bahamas. Table 26 shows the importance of these three economies in Canada’s total outward FDI. Approximately 11 percent of Canada’s outward FDI is located in these countries, almost entirely in services — presumably in tax related investments. Unfortunately, we were unable to obtain bilateral industry-level data for these countries in order to take

50 Does the Trading / Investment Partner Matter? them out of our industry-level analysis. Nevertheless, we can see that if these three countries are taken out of the analysis, the percentage of Canada’s outward FDI to the rest of the world that goes into services drops by about 10 percent. We have also compiled data on duties paid on imports into Canada from the world, the United States, the United Kingdom, and the rest of the world (Table 27). Canada’s average import duty rate on imports from the world has fallen over the sample period from over 4 percent in 1983 to slightly over 1 percent in 1997. This conceals heterogeneity both across industries and across countries. Across industries, we see that import duties are highest in Consumer Goods and Services (6.90 percent), Chemicals, Chemical Products and Textiles (1.62 percent), and Accommodation, Restaurants, Recreation Services and Food Retailing (1.25 percent). Duties are lowest in Energy (0.07 percent), Machinery and Equipment (0.32 percent), and Wood and Paper (0.36 percent). Duties with the United States are lowest, with the average duty paid at only 0.3 percent. Duties on goods coming from the United Kingdom and the rest of the world average 2 to 3 percent. Again, there is heterogeneity across industries. The most striking example is Food, Beverages and Tobacco, where the average duty paid on goods coming from the United States is only 1.15 percent, against 3.02 percent from the rest of the world and over 20 percent from the United Kingdom. Finally, we have some data on intra-firm trade between foreign MNEs in Canada, taken from Cameron (1998). Specifically, over the period 1990-92, 56.7 percent of Canadian exports were attributed to domestic firms, 38.8 percent to U.S. firms, and 1.8 percent to U.K. firms. On the import side, domestic firms accounted for 56.7 percent, U.S. firms for 38.3 percent, and U.K. firms again for 1.8 percent. These figures are consistent with our a priori expectations. Given the strong complementarities between trade and FDI between Canada and the United States and the large role played by multinationals in facilitating such trade, it is not surprising that FDI between the United States and Canada increases domestic economic activity, and hence domestic capital formation. This is in contrast to the Canada-U.K. relationship, where the complementarities between trade and FDI are far less significant in comparison to the Canada-U.S. relationship. Therefore, much of the FDI to the United Kingdom can be thought of as tariff-jumping in nature. Inward FDI would tend to stimulate capital formation, whereas outward FDI would not be expected to increase capital formation at best. As for the rest of the world, the results are more in line with what one would expect to observe in a traditional trade-model analysis. Inward FDI stimulates domestic capital formation as foreign firms are locating here to undertake production in order to gain regional market access and avoid tariffs or transportation costs. In contrast, Canadian FDI abroad is undertaken to take advantage of factor endowment differences such as cheap labour, or perhaps to gain regional market access, be that in Europe, Latin America or East Asia. As a result of such FDI, employment, production and capital formation fall in Canada. These explanations are by no means supported empirically because the data required to do a formal statistical analysis are unavailable, but we nevertheless offer them here as possibilities. Clearly, further work needs to be done to explain the heterogeneity observed in the impact of FDI on capital formation, with respect to both trading partners and components of capital formation.

Does the Trading / Investment Partner Matter? 51
Table 21a Distribution of Canada's Outward FDI Stock in all Countries by Industry (%)
Industries (SIC-C 1980) 1983 1987 1990 1997
1. Food, Beverages and Tobacco 2. Wood and Paper 3. Energy 4. Chemicals, Chemical Products and Textiles 5. Metallic Minerals and Metal Products 6. Machinery and Equipment 7. Transportation Equipment 8. Electrical and Electronic Products 9. Construction and Related Activities 10. Transportation Services 11. Communications 12. Finance and Insurance 13. Accommodation, Restaurants, Recreation Services and Food Retailing 14. Consumer Goods and Services 15. Other Total
9.01 3.69 16.63 8.85 18.97 0.44 1.50 3.56 12.57 3.28 5.85 10.79
1.23 3.26 0.38
100.00
7.55 3.95 8.75 7.70 15.93 0.71 2.09 4.70 7.90 4.18 7.17 21.24
2.22 5.17 0.74
100.00
8.31 3.84 7.70 7.60 14.38 1.20 2.32 5.48 7.48 4.97 8.21 23.80
2.02 1.50 1.18
100.00
5.55 3.09 8.22 5.54 14.53 0.74 2.21 4.61 2.66 3.13 7.61 32.07
5.69 3.53 0.83
100.00
Table 21b Distribution of Canada's Inward FDI Stock from all Countries by Industry (%)
Industries (SIC-C 1980) 1983 1987 1990 1997
1. Food, Beverages and Tobacco 2. Wood and Paper 3. Energy 4. Chemicals, Chemical Products and Textiles 5. Metallic Minerals and Metal Products 6. Machinery and Equipment 7. Transportation Equipment 8. Electrical and Electronic Products 9. Construction and Related Activities 10. + 11. Transportation Services and Communications 12. Finance and Insurance 13. Accommodation, Restaurants, Recreation Services and Food Retailing 14. Consumer Goods and Services 15. Other Total
5.66 4.09
25.86 11.20 6.34 3.76 8.58 3.99 5.46 1.61
13.27
N/A 6.92 3.26
100.00
7.05 5.01
19.75 8.52 5.56 4.10
11.99 6.31 6.13 1.73
16.97
N/A 4.11 3.06
100.00
7.04 5.80
16.61 10.46 7.51 4.06
10.01 5.60 4.91 2.40
18.92
N/A 3.83 2.87
100.00
9.15 5.63
11.27 12.94 5.42 3.95
11.77 6.56 4.08 3.07
17.85
N/A 5.11 3.21
100.00

52 Does the Trading / Investment Partner Matter?
Table 22a Distribution of Canada's Outward FDI Stock in the United States by Industry (%)
Industries (SIC-C 1980) 1983 1987 1990 1997
1. Food, Beverages and Tobacco 2. Wood and Paper 3. Energy 4. Chemicals, Chemical Products and Textiles 5. Metallic Minerals and Metal Products 6. Machinery and Equipment 7. Transportation Equipment 8. Electrical and Electronic Products 9. Construction and Related Activities 10. Transportation Services 11. Communications 12. Finance and Insurance 13. Accommodation, Restaurants, Recreation Services and Food Retailing 14. Consumer Goods and Services 15. Other Total
8.59 4.76 17.79 11.76 13.05 0.18 0.37 4.85 17.17 2.27 7.25 6.11 1.82
3.54 0.49
100.00
6.39 3.75 7.82 9.83
13.52 0.46 1.69 5.13
10.84 5.41 7.78
17.53 3.09
6.02 0.74
100.00
7.51 3.69 8.41
10.05 11.79 0.81 1.40 6.42 7.52 6.29 9.46
22.95 2.26
1.01 0.44
100.00
5.45 4.21 6.63 5.52
14.61 0.71 1.78 4.75 4.42 4.45 9.39
22.03 11.03
4.10 0.92
100.00
Table 22b Distribution of Canada's Inward FDI Stock from the United States by Industry (%)
Industries (SIC-C 1980) 1983 1987 1990 1997
1. Food, Beverages and Tobacco 2. Wood and Paper 3. Energy 4. Chemicals, Chemical Products and Textiles 5. Metallic Minerals and Metal Products 6. Machinery and Equipment 7. Transportation Equipment 8. Electrical and Electronic Products 9. Construction and Related Activities 10. + 11. Transportation Services and Communications 12. Finance and Insurance 13. Accommodation, Restaurants, Recreation Services and Food Retailing 14. Consumer Goods and Services 15. Other Total
5.83 3.75 26.07 12.22 7.18 4.69 9.88 4.53 2.56 1.83 11.45
N/A 6.21 3.79
100.00
7.33 3.34
20.36 9.57 5.81 4.79
14.45 7.66 4.98 2.15
12.01
N/A 4.18 3.38
100.00
6.66 6.52
17.07 10.56 6.26 4.86
12.54 7.26 4.10 3.08
14.06
N/A 4.15 2.86
100.00
8.74 6.03
10.03 13.07 5.19 4.33
14.52 7.99 2.94 4.32
13.73
N/A 6.13 2.98
100.00
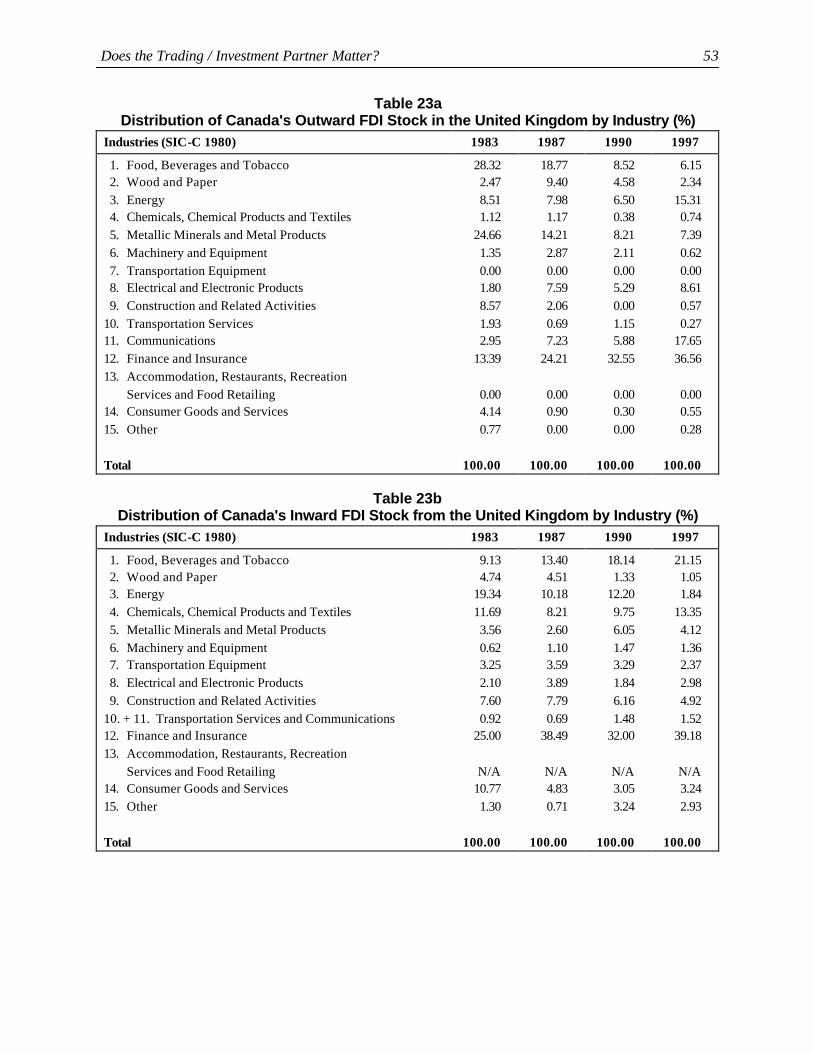
Does the Trading / Investment Partner Matter? 53
Table 23a Distribution of Canada's Outward FDI Stock in the United Kingdom by Industry (%)
Industries (SIC-C 1980) 1983 1987 1990 1997
1. Food, Beverages and Tobacco 2. Wood and Paper 3. Energy 4. Chemicals, Chemical Products and Textiles 5. Metallic Minerals and Metal Products 6. Machinery and Equipment 7. Transportation Equipment 8. Electrical and Electronic Products 9. Construction and Related Activities 10. Transportation Services 11. Communications 12. Finance and Insurance 13. Accommodation, Restaurants, Recreation Services and Food Retailing 14. Consumer Goods and Services 15. Other Total
28.32 2.47 8.51 1.12 24.66 1.35 0.00 1.80 8.57 1.93 2.95 13.39
0.00 4.14 0.77
100.00
18.77 9.40 7.98 1.17
14.21 2.87 0.00 7.59 2.06 0.69 7.23
24.21
0.00 0.90 0.00
100.00
8.52 4.58 6.50 0.38 8.21 2.11 0.00 5.29 0.00 1.15 5.88
32.55
0.00 0.30 0.00
100.00
6.15 2.34
15.31 0.74 7.39 0.62 0.00 8.61 0.57 0.27
17.65 36.56
0.00 0.55 0.28
100.00
Table 23b
Distribution of Canada's Inward FDI Stock from the United Kingdom by Industry (%) Industries (SIC-C 1980) 1983 1987 1990 1997
1. Food, Beverages and Tobacco 2. Wood and Paper 3. Energy 4. Chemicals, Chemical Products and Textiles 5. Metallic Minerals and Metal Products 6. Machinery and Equipment 7. Transportation Equipment 8. Electrical and Electronic Products 9. Construction and Related Activities 10. + 11. Transportation Services and Communications 12. Finance and Insurance 13. Accommodation, Restaurants, Recreation Services and Food Retailing 14. Consumer Goods and Services 15. Other Total
9.13 4.74 19.34 11.69 3.56 0.62 3.25 2.10 7.60 0.92 25.00
N/A
10.77 1.30
100.00
13.40 4.51
10.18 8.21 2.60 1.10 3.59 3.89 7.79 0.69
38.49
N/A 4.83 0.71
100.00
18.14 1.33
12.20 9.75 6.05 1.47 3.29 1.84 6.16 1.48
32.00
N/A 3.05 3.24
100.00
21.15 1.05 1.84
13.35 4.12 1.36 2.37 2.98 4.92 1.52
39.18
N/A 3.24 2.93
100.00

54 Does the Trading / Investment Partner Matter?
Table 24a
Distribution of Canada's Outward FDI Stock in the ROW by Industry (%) Industries (SIC-C 1980) 1983 1987 1990 1997
1. Food, Beverages and Tobacco 2. Wood and Paper 3. Energy 4. Chemicals, Chemical Products and Textiles 5. Metallic Minerals and Metal Products 6. Machinery and Equipment 7. Transportation Equipment 8. Electrical and Electronic Products 9. Construction and Related Activities 10. + 11. Transportation Services and Communications 12. Finance and Insurance 13. Accommodation, Restaurants, Recreation Services and Food Retailing 14. Consumer Goods and Services 15. Other Total
4.48 1.15
15.89 3.27
33.23 0.86 4.96 0.60 1.38 9.32
22.64
0.00 2.25 0.04
100.00
4.51 1.52 9.54 3.03
20.02 0.53 3.81 1.67 0.82 5.53
44.87
0.02 3.58 0.54
100.00
8.13 2.64 5.66 3.43
21.20 1.44 5.03 1.80 0.74 6.84
41.31
0.15 0.29 1.32
100.00
5.45 1.75 8.21 6.94
16.43 0.82 3.44 3.19 0.84 4.24
44.24
0.01 3.60 0.85
100.00
Table 24b Distribution of Canada's Inward FDI Stock from the ROW by Industry (%)
Industries (SIC-C 1980) 1983 1987 1990 1997
1. Food, Beverages and Tobacco 2. Wood and Paper 3. Energy 4. Chemicals, Chemical Products and Textiles 5. Metallic Minerals and Metal Products 6. Machinery and Equipment 7. Transportation Equipment 8. Electrical and Electronic Products 9. Construction and Related Activities 10. + 11. Transportation Services and Communications 12. Finance and Insurance 13. Accommodation, Restaurants, Recreation Services and Food Retailing 14. Consumer Goods and Services 15. Other Total
2.51 5.39
29.11 5.83 3.96 1.19 5.66 2.56
18.43 0.97
14.53
N/A 7.90 1.96
100.00
1.93 11.69 23.55 4.76 6.53 3.42 7.99 2.73 9.42 0.80
20.50
N/A 3.37 3.32
100.00
1.70 6.32
17.86 10.49 11.88 3.30 6.74 3.04 6.48 1.00
25.08
N/A 3.39 2.70
100.00
5.93 6.09
18.61 12.37 6.60 3.74 6.77 3.44 7.28 0.00
22.66
N/A 2.67 4.04
100.00

Does the Trading / Investment Partner Matter? 55
Table 25
Distribution of Canada’s FDI Stock by Service Industries Percentage of FDI in Services
All Countries United States United Kingdom Rest of World
Year Inward Outward Inward Outward Inward Outward Inward Outward
1983 27 37 22 38 44 31 42 36
1987 29 48 23 51 52 35 34 55
1990 30 48 25 49 43 40 36 49
1997 30 55 27 55 49 56 33 53
Table 26 Importance of Barbados, Bermuda, and the Bahamas in
Canada’s Outward FDI Stock Patterns Canada’s Outward FDI
(C$ Millions) Canada’s Outward FDI
(percentage distribution) Percentage in Services
1987 1990 1997 1987 1990 1997 1987 1990 1997
World 74,139 98,373 193,674 100 100 100 48 48 55
Barbados 496 1,453 11,375 0.7 1.5 5.9 97 88 97
Bermuda 1,497 1,758 4,205 2.0 1.8 2.2 79 79 95
Bahamas 1,454 1,950 4,554 2.0 2.0 2.4 99 99 N/A

56 Does the Trading / Investment Partner Matter?
Table 27 Canada's Import Duty Rates With the World, the United States and the United Kingdom
World United States United Kingdom Rest of World
Industries (SIC-C 1980) 1983 1990 1997 1983 1990 1997 1983 1990 1997 1983 1990 1997
1. Food, Beverages and Tobacco 4.26 4.83 2.25 3.22 3.44 1.15 26.68 27.02 20.68 4.32 5.26 3.02
2. Food, Beverages and Tobacco 4.97 3.32 0.36 4.99 3..06 0.11 9.98 5.36 2.57 4.57 4.30 2.04
3. Energy 0.14 0.13 0.07 0.33 0.40 0.08 0.05 0.004 0.01 0.01 0.02 0.09
4. Chemicals, Chemical Products and Textiles 8.43 6.64 1.62 7.65 5.20 0.48 7.80 6.84 2.54 10.57 10.22 5.14
5. Metallic Minerals and Metal Products 5.10 3.90 1.07 5.12 3.44 0.37 6.64 5.84 2.96 4.92 4.77 2.57
6. Machinery and Equipment 3.69 1.99 0.32 3.61 1.81 0.12 3.10 1.84 0.82 4.11 2.45 0.79
7. Transportation Equipment 1.70 1.62 0.48 0.75 0.59 0.11 1.65 1.49 0.91 7.81 5.17 2.08
8. Electrical and Electronic Products 6.17 2.76 0.55 5.83 2.44 0.34 7.60 4.65 1.17 6.95 3.26 0.83
9. Construction and Related Activities 5.91 4.25 1.48 3.81 3.20 0.29 9.46 8.48 5.35 9.93 6.03 3.82
10. Transportation Services — — — — — — — — — — — —
11. Communications 1.84 1.28 0.18 1.77 1.22 0.06 1.87 1.46 0.83 2.52 1.62 1.08
12. Finance and Insurance — — — — — — — — — — — —
13. Accommodation, Restaurants, Recreation Services and Food Retailing 4.25 3.22 1.25 3.74 4.07 1.11 6.07 0.44 0.67 6.58 1.21 2.38
14. Consumer Goods and Services 14.44 12.36 6.90 10.69 6.33 1.02 10.75 9.47 7.56 15.97 15.11 10.78
15. Other — 0.06 0.02 — 0.06 0.02 — 0.01 0.01 — 0.08 0.02
All Goods 4.36 3.47 1.10 3.37 2.30 0.30 6.56 3.66 2.26 6.71 5.82 2.83

7. DISCUSSION AND CONCLUSIONS
Canada has experienced dramatic changes in its patterns of FDI with the world. We have seen the stock of inward FDI relative to GDP fall dramatically but we have also seen dramatic increases on the outward side. Given the benefits associated with inward FDI for the host country, but not necessarily for the home country, these trends have been be of concern to Canadian policy makers. Coincident with these changing FDI patterns, Canada has seen a drop in the level of capital formation relative to GDP. The question we ask here is whether these changes in capital formation can in fact be linked to changing FDI patterns. Our evidence indicates that in aggregate, the lower amounts of inward FDI relative to GDP reduce capital formation, while the increased amounts of Canadian FDI abroad do not. However, there is much heterogeneity in the estimated impact between service and non-service industries, and among components of capital formation and trading partners. Both outward and inward FDI between Canada and the United States has supplemented domestic capital formation, a result that is entirely consistent with the complementarities between trade and FDI that we believe characterize the North American economies. The results for the United Kingdom and for the rest of the world are similar to that for the United States only on the inward side. On the outward side, we seem to cover the entire spectrum: Canada’s outward FDI to the United States stimulates capital formation in Canada, while outward FDI to the United Kingdom has no statistically significant impact on capital formation in Canada, and outward FDI to the rest of the world tends to reduce Canada’s capital formation. Furthermore, as can be seen in Figure 5b, Canada’s outward FDI stock has been less and less destined for the United States and increasingly destined for East Asia, Latin America and the rest of the world. This is also true on the inward side, but to a far lesser extent.19 The implications of this study are that Canada’s outward FDI has not, on balance, affected capital formation in Canada. However, there is tremendous heterogeneity in the impact of outward FDI by component of capital formation, by industry, and by trading partner. More work needs to be done to understand this heterogeneity. In our literature review, we argued that given the available data, we must defer to indirect evidence. That is, the evidence we have provided here is indirect in nature. To better understand the heterogeneity of our results, we need to obtain direct evidence, which would require data at the firm level, or perhaps data that describe the operations of Canadian MNEs locating in the United States, the United Kingdom, and elsewhere, at the industry level. However, it would be dangerous to interpret the results presented here as an argument to somehow promote regulation that discourages FDI to specific parts of the world. Rather, we should focus on the underlying motivation for the FDI. Foreign direct investment associated with transferring low value-added production to low-wage or low-cost countries should not be discouraged. On the other hand, if FDI is driven out of Canada because of a poor competitive environment, perhaps due to low R&D spending, a lack of financial liquidity or relatively high tax rates, then government policy should be aimed at rectifying directly these weaknesses. Clearly, further research is recommended using firm-level data to identify the differences in motivations to locate in the United States rather than in the United Kingdom or abroad, and hence to better explain the heterogeneity observed in the impact of FDI on capital formation in Canada.

58 Discussion and Conclusions
Figure 5aCanada’s Distribution of Inward FDI Stock, 1970-98
Canada's Distribution of Inward FDI
0
50
100
150
200
250
1970 1972 1974 1976 1978 1980 1982 1984 1986 1988 1990 1992 1994 1996 1998
Bill
ions
of C
anad
ian
$
US EC East Asia Latin America ROW
Canada’s Distribution of Inward FDI
C
$ Bi
llions
U.S. EC East Asia Latin America ROW
U.S.. EC East Asia Latin America ROW
Canada's Relative Distribution of Inward FDI
0%
10%
20%
30%
40%
50%
60%
70%
80%
90%
100%
1970 1972 1974 1976 1978 1980 1982 1984 1986 1988 1990 1992 1994 1996 1998
US EC East Asia Latin America ROW
Canada’s Relative Distribution of Inward FDI
U.S. EC East Asia Latin America ROW

Discussion and Conclusions 59
Figure 5bCanada’s Distribution of Outward FDI Stock, 1970-98
Canada's Distribution of Outward FDI
0
50
100
150
200
250
1970 1972 1974 1976 1978 1980 1982 1984 1986 1988 1990 1992 1994 1996 1998
Mill
iard
s de
$ C
AN
É.-U. CE Asie de l'Est Am. Latine RDMU.S. EC East Asia Latin America ROW
Canada’s Distribution of Outward FDI
C
$ Bi
llions
Canada's Relative Distribution of Outward FDI
0%
10%
20%
30%
40%
50%
60%
70%
80%
90%
100%
1970 1972 1974 1976 1978 1980 1982 1984 1986 1988 1990 1992 1994 1996 1998
US EC East Asia Latin America ROW
Canada’s Relative Distribution of Outward FDI
U.S. EC East Asia Latin America ROW


NOTES
1 Although the ratio of inward FDI stock to GDP has fallen dramatically over the post-1970 period,
the level of FDI stock itself has continued to grow: at historical costs, the inward FDI stock grew at a compound rate of 9% over the 1970s, 7% over the 1980s and 6% over the 1990s. The outward FDI stock grew at a much faster pace: 16%, 13% and 10% over the 1970s, 1980s, and 1990s, respectively (Hejazi and Safarian, 1999b).
2 Using a Chow test or a simple difference in means test, it can be shown that the drop in GFCF relative to GDP is statistically significant. These results are available upon request.
3 Hejazi and Safarian (2001b) estimate a fully specified model of FDI to help explain what is driving Canadian multinationals to locate increasingly abroad and why foreign multinational are locating in Canada less often. The results suggest some factors that have pushed investments abroad, such as relatively slow GDP growth on average, poor R&D performance, and significantly reduced financial liquidity during part of the period. These factors can be said to have pushed foreign MNEs out of Canada and encouraged Canadian firms to invest abroad. The failure to lower effective tax rates in the 1990s could also have encouraged firms to locate outside of Canada. This suggests that the decline in Canada's share of inward FDI is a failure for Canada. Although the NAFTA and the Canada-U.S. FTA have contributed to openness, which increases FDI both in and out, it also reduced Canada's inward FDI as MNEs increasingly locate in the United States and export to Canada. It is unclear which of the two effects dominate.
4 Many studies have considered the impact of FDI on specific segments of the home and host economies. For a general review of this literature, see Safarian (1985), Blomstrom and Kokko (1994), Caves (1996), Collins, O’Rourke and Williamson (1997), Dunning (1993), Globerman (1994) and UNCTAD (1997).
5 The analysis is also conducted with foreign sales instead of FDI. The results are qualitatively the same.
6 We have now obtained bilateral FDI data at the industry level between Canada and 20 of its main trade partners for the period 1987-99. Once the corresponding trade data are available, a similar study will be undertaken at the industry level for Canada.
7 Foreign production patterns in time series and at the industry level are only readily available for Sweden and the United States. Consequently, most researchers use patterns of FDI as proxies for foreign production.
8 We return to these issues in section 3 below.
9 The evidence may not be contradictory. Feinberg et al. (1998) consider only U.S. firms operating in Canada, whereas Gaston and Trefler (1997) consider all firms operating in Canada. It is possible that employment by U.S. firms actually went up while total employment fell, even at the industry level.
10 One can argue in a dynamic framework that knowledge spillovers linked to FDI may increase domestic growth (Hejazi and Safarian, 1999a); hence, the net impact of inward FDI can be an increase in domestic investment of more than 1 dollar.

62 Notes 11 Note that equation (2) differs from equation (1) only in that the former does not have an i subscript.
In equation (1), i took on values from 1 to 17, representing 17 OECD countries. In equation (2), the estimation deals only with Canada.
12 It is not surprising that over the entire period, Canada’s bias is lower than that of the OECD given its close integration with the United States. However, it is surprising that the estimated bias is higher for the second half of the sample than for the first half.
13 We find also that Canada’s savings and investment rates are cointegrated. In other words, the residuals in the Feldstein-Horioka regressions are stationary. These results are available upon request.
14 For models that consider the firm-level problem, see Feinberg et al. (1998), Brainard (1997), Grubert and Mutti (1991), Lipsey and Weiss (1984) and Swedenborg (1979).
15 Although some data are available up to 1997, the data in the last row of Box 2 are available only up to 1995. As a result, our regressions with all conditioning variables only include data up to 1995.
16 The regression results presented in Tables 9, 11, 13 and 15 have 210 observations. This represents data for 15 industries and 14 years (1984 to 1997). Once we take into account the conditioning variables (in Tables 10, 12, 14, and 16 to 19), the number of observations falls to at most 180, reflecting 15 industries and 12 years. That is, we excluded the years 1996 and 1997 because many conditioning variables were available only up to 1995. Of course, when we split the sample into the 9 non-service industries, we then have only 108 observations (9 industries over 12 years). Splitting the sample into the 6 service industries leaves us with 72 observations (6 industries over 12 years). The regressions without conditioning variables (Tables 9, 11, 13 and 15) have a lagged dependent variable. The regressions that include conditioning variables (Tables 10, 12, 14, and 16 to 19) do not have a lagged dependent variable.
17 A similar result is found in Brainard’s 1997 paper. Using industry-level data for U.S. multinationals, she finds evidence in favour of the proximity-concentration hypothesis. In the abstract to that paper, she states that one cannot reject a simple fixed-effects model with industry and year effects. A similar conclusion applies here.
18 We initially added patterns of imports and exports by industry to our investment equations. These were statistically insignificant and were dropped because investment demand theory does not call for their inclusion.
19 In Figure 5a, it is difficult to see the entry for Latin America. This is because Latin America remains a very small source of Canada’s inward FDI. Specifically, in 1970, 0.09 percent of Canada’s inward FDI came from Latin America; while this proportion steadily increased, in 1997, it was still only 0.42 percent of Canada’s inward FDI.

BIBLIOGRAPHY
Blomstrom, Magnus and Ari O. Kokko. “Home Country Effects of Foreign Direct Investment: Sweden.”
In Canadian-Based Multinationals, edited by Steven Globerman, Industry Canada Research Series. Calgary: University of Calgary Press, 1994.
Borensztein, E., J. De Gregorio and J.-W. Lee. “How Does Foreign Direct Investment Affect Economic
Growth,” Journal of International Economics, 45 (1998): 115-35. Brainard, S. Lael. “An Empirical Assessment of the Proximity-Concentration Trade-off Between
Multinational Sales and Trade,” American Economic Review, 87, 4 (1997): 520-44. Cameron, Richard A. Intra-firm Trade of Canadian-based Transnational Companies. Industry Canada,
Working Paper No. 26, 1998. Caves, Richard E. Multinational Enterprise and Economic Analysis. Cambridge University Press, 1996. Caves, Richard E. and G. Reuber. Capital Transfers and Economic Policy. Canada, 1951-62. Cambridge
(Mass.): Harvard University Press, 1971. Collins, William J., Kevin H. O'Rourke and Jeffrey G. Williamson. Were Trade and Factor Mobility
Substitutes in History? NBER, Working Paper No. 6059, 1997. Dunning, John. Multinational Enterprises and the Global Economy . Wokingham (England): Addison-
Wesley Publishing Co., 1993. Feinberg, Susan E., Michael P. Keane and Mario F. Bognanno. “Trade Liberalization and Delocalization:
New Evidence from Firm-level Panel Data,” Canadian Journal of Economics, 31, 4 (November 1998): p. 749-77.
Feldstein, Martin. “The Effects of Outbound Foreign Direct Investment on the Domestic Capital Stock.”
In The Effects of Taxation on Multinational Corporations, edited by J.R. Hines. Chicago: University of Chicago Press, 1995.
Feldstein, Martin and Charles Horioka. “Domestic Savings and International Capital Flows,” The
Economic Journal, 90 (1980): 314-29. Frankel, J. A. “Quantifying International Capital Mobility in the 1980s.” In National Savings and
Economic Performance, edited by D. Bernheim and J. Shoven. Chicago: University of Chicago Press, 1991.
Gaston, Noel and Daniel Trefler. “The Labour Market Consequences of the Canada-U.S. Free Trade
Agreement,” Canadian Journal of Economics, 30, 1 (February 1997): 18-41. Gera, Surendra, Wulong Gu and Frank C. Lee. Foreign Direct Investment and Productivity Growth:
The Canadian Host-Country Experience. Industry Canada, Working Paper No. 30, 1999. Globerman, Steven (ed.). Canadian-Based Multinationals. Industry Canada Research Series. Calgary:
University of Calgary Press, 1994.

64 Bibliography Grubert, Harry and John Mutti. “Taxes, Tariffs, and Transfer Pricing in Multinational Corporate Decision
Making,” Review of Economics and Statistics, 73, 2 (May 1991): 285-93. Hejazi, Walid and A. Edward Safarian. “Trade, Foreign Direct Investment, and R&D Spillovers,” Journal
of International Business Studies, 30, 3 (Third quarter 1999a): 491-511. ______. Modelling Links Between Canadian Trade and Foreign Direct Investment. Industry Canada,
Perspectives on North American Free Trade Series, No. 2, 1999b. ______. “The Complementarity Between U.S. FDI Stock and Trade,” Atlantic Economic Journal, 29, 4
(December 2001a). ______. Canada and Foreign Direct Investment: A Study of Determinants. University of Toronto Centre
for Public Management, Toronto: University of Toronto Press, 2001b. Herring, Richard and Thomas D. Willet. “The Relationship Between U.S. Direct Investment at Home and
Abroad,” Revista Internazionale di Scienze Economiche e Commerciali, 20 (1973): 72-80. Horst, Thomas. “The Industrial Composition of U.S. Exports and Subsidiary Sales to the Canadian
Market,” American Economic Review, 62, 1 (March 1972): 37-45. Lipsey, Robert E. Interpreting Developed Countries’ Foreign Direct Investment. NBER, Working Paper
No. 7810, 2000. ______. “Outward Direct Investment and the U.S. Economy,” in The Effects of Taxation on Multinational
Corporations, edited by Martin Feldstein, James R. Hines, Jr. and R. Glenn Hubbard. Chicago: University of Chicago Press for the NBER, Reprint No. 2020, 1995, pp. 7-33.
Lipsey, Robert E. and Merle Yahr Weiss. “Foreign Production and Exports in Manufacturing Industries,”
Review of Economics and Statistics, (November 1981): 488-94. ______. “Foreign Production and Exports of Individual Firms,” Review of Economics and Statistics,
(1984): 304-8. Mussa, Michael and Morris Goldstein. “The Integration of World Capital Markets,” in Changing Capital
Markets: Implication for Monetary Policy. Kansas City Federal Reserve Bank, 1993, pp. 7-33. Noorzoy, M.S. “Flows of Direct Investment and Their Effects on Investment in Canada,” Economics
Letters, 2 (1979): 257-61. ______. “Flows of Direct Investment and Their Effects on U.S. Domestic Investment,” Economics
Letters, 5 (1980): 311-17. Rao, Someshwar, Ashfaq Ahmad and Colleen Barnes. Foreign Direct Investment and APEC Economic
Integration. Industry Canada, Working Paper No. 8, February 1996. Rao, Someshwar, Ashfaq Ahmad and Marc Legault. “Canadian-Based Multinationals: An Analysis of
Activities and Performance.” In Canadian-Based Multinationals, edited by Steven Globerman, Industry Canada Research Series. Calgary: University of Calgary Press, 1994.

Bibliography 65
Safarian, A. Edward. Foreign Direct Investment: A Survey of Canadian Research. Montreal: The Institute for Research on Public Policy, 1985.
Severn, Alan. “Investment and Financial Behaviour of American Direct Investors in Manufacturing,” in
The International Mobility and Movement of Capital, edited by F. Machlup, W. Salant and L. Tarshis. New York: National Bureau of Economic Research, 1972.
Stevens, Guy V.G. and Robert E. Lipsey. “Interactions Between Domestic and Foreign Investment,”
Journal of International Money and Finance, 11, 1 (1992): 40-62. Swedenborg, B. The Multinational Operations of Swedish Firms: An Analysis of Determinants and
Effects. Stockholm: The Industrial Institute for Economic and Social Research, 1979. UNCTAD. World Investment Report. Geneva: United Nations, 1997 and 1998.


DATA APPENDIX
Data on FDI by industry (SIC-C 1980 classification) obtained from the Balance of Payments Division of Statistics Canada (Contact: Christian Lajule, 613-951-2062). Data reported at historical costs. Data on trade by industry (SIC-E 1980 classification) obtained from the International Trade Division of Statistics Canada (Contact: Jocelyn Elibani, 613-951-9786). Data reported in current dollars. Data on corporate profits and corporate taxes (SIC-C 1980 classification) obtained from the Industrial Organization and Finance Division of Statistics Canada. (Contact: Gail Sharland, 613-951-9843) Data reported in current dollars. Data on gross fixed capital formation, end-of-year gross stocks and net stocks, and capital consumption allowances obtained from the National Wealth and Capital Stock Section, Investment and Capital Stock Division of Statistics Canada. (Contact: Flo Magmanlac, 613-951-2765). Data on R&D (total intramural R&D expenditures by industry, corresponding to the SIC-C classification) obtained from the Science, Innovation and Electronic Information Division, Statistics Canada. (Contact: Fred Gault, 613-951-2198). Data on gross outputs, intermediate inputs and related price indices (corresponding to the P-level classification) obtained from the Micro-Economic Analysis Division of Statistics Canada. (Contact: Judy Hosein, 613-951-5704). Data reported in constant dollars.


INDUSTRY CANADA RESEARCH PUBLICATIONS
INDUSTRY CANADA WORKING PAPER SERIES
No. 1 Economic Integration in North America: Trends in Foreign Direct Investment and the Top 1,000
Firms , Micro-Economic Policy Analysis staff including John Knubley, Marc Legault, and P. Someshwar Rao, Industry Canada, 1994.
No. 2 Canadian-Based Multinationals: An Analysis of Activities and Performance, Micro-Economic Policy
Analysis staff including P. Someshwar Rao, Marc Legault, and Ashfaq Ahmad, Industry Canada, 1994. No. 3 International R&D Spillovers Between Industries in Canada and the United States,
Jeffrey I. Bernstein, Carleton University and National Bureau of Economic Research, under contract with Industry Canada, 1994.
No. 4 The Economic Impact of Mergers and Acquisitions on Corporations, Gilles Mcdougall,
Micro-Economic Policy Analysis, Industry Canada, 1995. No. 5 Steppin' Out: An Analysis of Recent Graduates Into the Labour Market, Ross Finnie, School of
Public Administration, Carleton University, and Statistics Canada, under contract with Industry Canada, 1995.
No. 6 Measuring the Compliance Cost of Tax Expenditures: The Case of Research and Development
Incentives, Sally Gunz and Alan Macnaughton, University of Waterloo, and Karen Wensley, Ernst & Young, Toronto, under contract with Industry Canada, 1996.
No. 7 Governance Structure, Corporate Decision-Making and Firm Performance in North America,
P. Someshwar Rao and Clifton R. Lee-Sing, Micro-Economic Policy Analysis, Industry Canada, 1996. No. 8 Foreign Direct Investment and APEC Economic Integration, Ashfaq Ahmad, P. Someshwar Rao,
and Colleen Barnes, Micro-Economic Policy Analysis, Industry Canada, 1996. No. 9 World Mandate Strategies for Canadian Subsidiaries, Julian Birkinshaw, Institute of International
Business, Stockholm School of Economics, under contract with Industry Canada, 1996. No. 10 R&D Productivity Growth in Canadian Communications Equipment and Manufacturing,
Jeffrey I. Bernstein, Carleton University and National Bureau of Economic Research, under contract with Industry Canada, 1996.
No. 11 Long-Run Perspective on Canadian Regional Convergence, Serge Coulombe, Department of
Economics, University of Ottawa, and Frank C. Lee, Industry Canada, 1996. No. 12 Implications of Technology and Imports on Employment and Wages in Canada, Frank C. Lee,
Micro-Economic Policy Analysis, Industry Canada, 1996. No. 13 The Development of Strategic Alliances in Canadian Industries: A Micro Analysis, Sunder Magun,
Applied International Economics, under contract with Industry Canada, 1996. No. 14 Employment Performance in the Knowledge-Based Economy, Surendra Gera, Industry Canada,
and Philippe Massé, Human Resources Development Canada, 1996. No. 15 The Knowledge-Based Economy: Shifts in Industrial Output, Surendra Gera, Industry Canada,
and Kurt Mang, Department of Finance, 1997.
70 Industry Canada Research Publications No. 16 Business Strategies of SMEs and Large Firms in Canada, Gilles Mcdougall and David Swimmer,
Micro-Economic Policy Analysis, Industry Canada, 1997. No. 17 Impact of China’s Trade and Foreign Investment Reforms on the World Economy, Winnie Lam,
Micro-Economic Policy Analysis, Industry Canada, 1997. No. 18 Regional Disparities in Canada: Characterization, Trends and Lessons for Economic Policy,
Serge Coulombe, Department of Economics, University of Ottawa, under contract with Industry Canada, 1997.
No. 19 Inter-Industry and U.S. R&D Spillovers, Canadian Industrial Production and Productivity Growth,
Jeffrey I. Bernstein, Carleton University and National Bureau of Economic Research, under contract with Industry Canada, 1998.
No. 20 Information Technology and Labour Productivity Growth: An Empirical Analysis for Canada and
the United States, Surendra Gera, Wulong Gu, and Frank C. Lee, Micro-Economic Policy Analysis, Industry Canada, 1998.
No. 21 Capital-Embodied Technical Change and the Productivity Growth Slowdown in Canada,
Surendra Gera, Wulong Gu, and Frank C. Lee, Micro-Economic Policy Analysis, Industry Canada, 1998. No. 23 Restructuring in Canadian Industries: A Micro Analysis, Sunder Magun, Applied International
Economics, under contract with Industry Canada, 1998. No. 24 Canadian Government Policies Toward Inward Foreign Direct Investment, Steven Globerman,
Simon Fraser University and Western Washington University, and Daniel Shapiro, Simon Fraser University, under contract with Industry Canada, 1998.
No. 25 A Structuralist Assessment of Technology Policies – Taking Schumpeter Seriously on Policy,
Richard G. Lipsey and Kenneth Carlaw, Simon Fraser University, with a contribution by Davit D. Akman, research associate, under contract with Industry Canada, 1998.
No. 26 Intrafirm Trade of Canadian-Based Foreign Transnational Companies, Richard A. Cameron,
Micro-Economic Policy Analysis, Industry Canada, 1998. No. 27 Recent Jumps in Patenting Activities: Comparative Innovative Performance of Major Industrial
Countries, Patterns and Explanations, Mohammed Rafiquzzaman and Lori Whewell, Micro-Economic Policy Analysis, Industry Canada, 1998.
No. 28 Technology and the Demand for Skills: An Industry-Level Analysis, Surendra Gera and Wulong Gu,
Industry Canada, and Zhengxi Lin, Statistics Canada, 1999. No. 29 The Productivity Gap Between Canadian and U.S. Firms , Frank C. Lee and Jianmin Tang,
Micro-Economic Policy Analysis, Industry Canada, 1999. No. 30 Foreign Direct Investment and Productivity Growth: The Canadian Host-Country Experience,
Surendra Gera, Wulong Gu and Frank C. Lee, Micro-Economic Policy Analysis, Industry Canada, 1999. No. 31 Are Canadian-Controlled Manufacturing Firms Less Productive than their Foreign-Controlled
Counterparts? Someshwar Rao and Jianmin Tang, Micro-Economic Policy Analysis, Industry Canada, 2000.

Industry Canada Research Publications 71
No. 32 The Canada-U.S. Productivity Growth Paradox, Serge Coulombe, Department of Economics, University of Ottawa, under contract with Industry Canada, 2000.
No. 33 R&D Propensity and Productivity Performance of Foreign-Controlled Firms in Canada,
Someshwar Rao and Jianmin Tang, Micro-Economic Policy Analysis, Industry Canada, 2001. No. 34 Sectoral Impacts of Kyoto Compliance, Randall Wigle, Wilfrid Laurier University, under contract
with Industry Canada, 2001. No. 36 Foreign Direct Investment and Domestic Capital Formation, Walid Hejazi and Peter Pauly,
University of Toronto, under contract with Industry Canada, 2002.
INDUSTRY CANADA DISCUSSION PAPER SERIES No. 1 Multinationals as Agents of Change: Setting a New Canadian Policy on Foreign Direct Investment,
Lorraine Eden, Carleton University, under contract with Industry Canada, 1994. No. 2 Technological Change and International Economic Institutions, Sylvia Ostry, Centre for
International Studies, University of Toronto, under contract with Industry Canada, 1995. No. 3 Canadian Corporate Governance: Policy Options, Ronald. J. Daniels, Faculty of Law, University of
Toronto, and Randall Morck, Faculty of Business, University of Alberta, under contract with Industry Canada, 1996.
No. 4 Foreign Direct Investment and Market Framework Policies: Reducing Frictions in APEC Policies
on Competition and Intellectual Property, Ronald Hirshhorn, under contract with Industry Canada, 1996.
No. 5 Industry Canada’s Foreign Investment Research: Messages and Policy Implications,
Ronald Hirshhorn, under contract with Industry Canada, 1997. No. 6 International Market Contestability and the New Issues at the World Trade Organization,
Edward M. Graham, Institute for International Economics, Washington (D.C.), under contract with Industry Canada, 1998.
No. 7 Implications of Foreign Ownership Restrictions for the Canadian Economy – A Sectoral Analysis,
Steven Globerman, Western Washington University, under contract with Industry Canada, 1999. No. 8 Determinants of Canadian Productivity Growth: Issues and Prospects, Richard G. Harris, Simon
Fraser University and Canadian Institute for Advanced Research, under contract with Industry Canada, 1999.
No. 9 Is Canada Missing the “Technology Boat”? Evidence from Patent Data, Manuel Trajtenberg,
Tel Aviv University, National Bureau of Economic Research and Canadian Institute for Advanced Research, under contract with Industry Canada, 2000.
No. 10 North American Economic Integration: Issues and Research Agenda, Richard G. Harris,
Simon Fraser University, under contract with Industry Canada, 2001.
72 Industry Canada Research Publications
INDUSTRY CANADA OCCASIONAL PAPER SERIES No. 1 Formal and Informal Investment Barriers in the G-7 Countries: The Country Chapters, Micro-Economic
Policy Analysis staff including Ashfaq Ahmad, Colleen Barnes, John Knubley, Rosemary D. MacDonald, and Christopher Wilkie, Industry Canada, 1994.
Formal and Informal Investment Barriers in the G-7 Countries: Summary and Conclusions,
Micro-Economic Policy Analysis staff including Ashfaq Ahmad, Colleen Barnes, and John Knubley, Industry Canada, 1994.
No. 2 Business Development Initiatives of Multinational Subsidiaries in Canada, Julian Birkinshaw,
University of Western Ontario, under contract with Industry Canada, 1995. No. 3 The Role of R&D Consortia in Technology Development, Vinod Kumar, Research Centre for
Technology Management, Carleton University, and Sunder Magun, Centre for Trade Policy and Law, University of Ottawa and Carleton University, under contract with Industry Canada, 1995.
No. 4 Gender Tracking in University Programs , Sid Gilbert, University of Guelph, and Alan Pomfret,
King’s College, University of Western Ontario, under contract with Industry Canada, 1995. No. 5 Competitiveness: Concepts and Measures, Donald G. McFetridge, Department of Economics,
Carleton University, under contract with Industry Canada, 1995. No. 6 Institutional Aspects of R&D Tax Incentives: The SR&ED Tax Credit, G. Bruce Doern, School of
Public Administration, Carleton University, under contract with Industry Canada, 1995. No. 7 Competition Policy as a Dimension of Economic Policy: A Comparative Perspective ,
Robert D. Anderson and S. Dev Khosla, Economics and International Affairs Branch, Bureau of Competition Policy, Industry Canada, 1995.
No. 8 Mechanisms and Practices for the Assessment of the Social and Cultural Implications of Science
and Technology, Liora Salter, Osgoode Hall Law School, University of Toronto, under contract with Industry Canada, 1995.
No. 9 Science and Technology: Perspectives for Public Policy, Donald G. McFetridge, Department of
Economics, Carleton University, under contract with Industry Canada, 1995. No. 10 Endogenous Innovation and Growth: Implications for Canada, Pierre Fortin, Université du Québec à
Montréal and Canadian Institute for Advanced Research, and Elhanan Helpman, Tel Aviv University and Canadian Institute for Advanced Research, under contract with Industry Canada, 1995.
No. 11 The University-Industry Relationship in Science and Technology, Jérôme Doutriaux, University of
Ottawa, and Margaret Barker, Meg Barker Consulting, under contract with Industry Canada, 1995. No. 12 Technology and the Economy: A Review of Some Critical Relationships , Michael Gibbons,
University of Sussex, under contract with Industry Canada, 1995. No. 13 Management Skills Development in Canada, Keith Newton, Micro-Economic Policy Analysis,
Industry Canada, 1995. No. 14 The Human Factor in Firm’s Performance: Management Strategies for Productivity and
Competitiveness in the Knowledge-Based Economy, Keith Newton, Micro-Economic Policy Analysis, Industry Canada, 1996.
No. 15 Payroll Taxation and Employment: A Literature Survey, Joni Baran, Micro-Economic Policy
Analysis, Industry Canada, 1996.

Industry Canada Research Publications 73
No. 16 Sustainable Development: Concepts, Measures, Market and Policy Failures at the Open Economy, Industry and Firm Levels, Philippe Crabbé, Institute for Research on the Environment and Economy, University of Ottawa, under contract with Industry Canada, 1997.
No. 17 Measuring Sustainable Development: A Review of Current Practice, Peter Hardi and Stephan Barg,
with Tony Hodge and Laszlo Pinter, International Institute for Sustainable Development, under contract with Industry Canada, 1997.
No. 18 Reducing Regulatory Barriers to Trade: Lessons for Canada from the European Experience,
Ramesh Chaitoo and Michael Hart, Centre for Trade Policy and Law, Carleton University, under contract with Industry Canada, 1997.
No. 19 Analysis of International Trade Dispute Settlement Mechanisms and Implications for Canada’s
Agreement on Internal Trade, E. Wayne Clendenning and Robert J. Clendenning, E. Wayne Clendenning & Associates Inc., under contract with Industry Canada, 1997.
No. 20 Aboriginal Businesses: Characteristics and Strategies for Growth, David Caldwell and Pamela Hunt,
Management Consulting Centre, under contract with Aboriginal Business Canada, Industry Canada, 1998. No. 21 University Research and the Commercialization of Intellectual Property in Canada, Wulong Gu and
Lori Whewell, Micro-Economic Policy Analysis, Industry Canada, 1999. No. 22 A Regional Perspective on the Canada-U.S. Standard of Living Comparison, Raynald Létourneau and
Martine Lajoie, Micro-Economic Policy Analysis , Industry Canada, 2000. No. 23 Linkages Between Technological Change and Productivity Growth, Steven Globerman,
Western Washington University, under contract with Industry Canada, 2000. No. 24 Investment and Productivity Growth – A Survey From the Neoclassical and New Growth
Perspectives, Kevin J. Stiroh, Federal Reserve Bank of New York, under contract with Industry Canada, 2000.
No. 25 The Economic Determinants of Innovation, Randall Morck, University of Alberta, and Bernard Yeung,
New York University, under contract with Industry Canada, 2000. No. 26 SMEs, Exports and Job Creation: A Firm-Level Analysis, Élisabeth Lefebvre and Louis A. Lefebvre,
CIRANO and École Polytechnique de Montréal, under contract with Industry Canada, 2000. No. 27 The Location of Higher Value-Added Activities, Steven Globerman, Western Washington University,
under contract with Industry Canada, 2001.
CANADA IN THE 21ST CENTURY SERIES No. 1 Global Trends: 1980-2015 and Beyond, J. Bradford DeLong, University of California, Berkeley,
under contract with Industry Canada, 1998. No. 2 Broad Liberalization Based on Fundamentals: A Framework for Canadian Commercial Policy,
Randall Wigle, Wilfrid Laurier University, under contract with Industry Canada, 1998. No. 3 North American Economic Integration: 25 Years Backward and Forward, Gary C. Hufbauer and
Jeffrey J. Schott, Institute for International Economics, Washington (D.C.), under contract with Industry Canada, 1998.
74 Industry Canada Research Publications No. 4 Demographic Trends in Canada, 1996-2006: Implications for the Public and Private Sectors,
David K. Foot, Richard A. Loreto, and Thomas W. McCormack, Madison Avenue Demographics Group, under contract with Industry Canada, 1998.
No. 5 Capital Investment Challenges in Canada, Ronald P.M. Giammarino, University of British Columbia,
under contract with Industry Canada, 1998. No. 6 Looking to the 21st Century – Infrastructure Investments for Economic Growth and for the
Welfare and Well-Being of Canadians, Christian DeBresson, Université du Québec à Montréal, and Stéphanie Barker, Université de Montréal, under contract with Industry Canada, 1998.
No. 7 The Implications of Technological Change for Human Resource Policy, Julian R. Betts,
University of California, San Diego, under contract with Industry Canada, 1998. No. 8 Economics and the Environment: The Recent Canadian Experience and Prospects for the Future,
Brian R. Copeland, University of British Columbia, under contract with Industry Canada, 1998. No. 9 Individual Responses to Changes in the Canadian Labour Market, Paul Beaudry and David A. Green,
University of British Columbia, under contract with Industry Canada, 1998. No. 10 The Corporate Response – Innovation in the Information Age, Randall Morck, University of Alberta,
and Bernard Yeung, University of Michigan, under contract with Industry Canada, 1998. No. 11 Institutions and Growth: Framework Policy as a Tool of Competitive Advantage for Canada,
Ronald J. Daniels, University of Toronto, under contract with Industry Canada, 1998.
PERSPECTIVES ON NORTH AMERICAN FREE TRADE SERIES No. 1 Can Small-Country Manufacturing Survive Trade Liberalization? Evidence from the Canada-U.S.
Free Trade Agreement, Keith Head and John Ries, University of British Columbia, under contract with Industry Canada, 1999.
No. 2 Modelling Links Between Canadian Trade and Foreign Direct Investment, Walid Hejazi and
A. Edward Safarian, University of Toronto, under contract with Industry Canada, 1999. No. 3 Trade Liberalisation and the Migration of Skilled Workers, Steven Globerman, Western Washington
University and Simon Fraser University, under contract with Industry Canada, 1999. No. 4 The Changing Industry and Skill Mix of Canada’s International Trade, Peter Dungan and Steve
Murphy, Institute for Policy Analysis, University of Toronto, under contract with Industry Canada, 1999. No. 5 Effects of the Canada-United States Free Trade Agreement on Interprovincial Trade, John F.
Helliwell, University of British Columbia, Frank C. Lee, Industry Canada, and Hans Messinger, Statistics Canada, 1999.
No. 6 The Long and Short of the Canada-U.S. Free Trade Agreement, Daniel Trefler, University of Toronto,
under contract with Industry Canada, 1999.
MONOGRAPH
Industry-Level Productivity and International Competitiveness Between Canada and the United States, edited by Dale W. Jorgenson, Harvard University, and Frank C. Lee, Industry Canada, 2001.

Industry Canada Research Publications 75
RESEARCH VOLUME SERIES No. 1 Foreign Investment, Technology and Economic Growth, Donald G. McFetridge ed., University of
Calgary Press, 1991. No. 2 Corporate Globalization Through Mergers and Acquisitions, L. Waverman ed., University of Calgary
Press, 1991. No. 3 Multinationals in North America, Lorraine Eden ed., University of Calgary Press, 1994. No. 4 Canadian-Based Multinationals, Steven Globerman ed., University of Calgary Press, 1994. No. 5 Corporate Decision-Making in Canada, Ronald J. Daniels and Randall Morck eds., University of
Calgary Press, 1995. No. 6 Implications of Knowledge-Based Growth for Micro-Economic Policies, Peter Howitt ed.,
University of Calgary Press, 1996. No. 7 The Asia Pacific Region in the Global Economy: A Canadian Perspective , Richard G. Harris ed.,
University of Calgary Press, 1996. No. 8 Financing Growth in Canada, Paul J.N. Halpern ed., University of Calgary Press, 1997. No. 9 Competition Policy and Intellectual Property Rights in the Knowledge-Based Economy,
Robert D. Anderson and Nancy T. Gallini eds., University of Calgary Press, 1998.
JOINT PUBLICATIONS Capital Budgeting in the Public Sector, in collaboration with the John Deutsch Institute, Jack Mintz and Ross S.
Preston eds., 1994. Infrastructure and Competitiveness, in collaboration with the John Deutsch Institute, Jack Mintz and Ross S.
Preston eds., 1994. Getting the Green Light: Environmental Regulation and Investment in Canada, in collaboration with the C.D. Howe
Institute, Jamie Benidickson, G. Bruce Doern, and Nancy Olewiler, 1994. To obtain copies of documents published under Industry Canada’s Research Publications Program, please contact: Publications Officer Micro-Economic Policy Analysis Industry Canada 5th Floor, West Tower 235 Queen Street Ottawa, Ontario, K1A 0H5 Tel.: (613) 952-5704 Fax: (613) 991-1261 E-mail: [email protected]