foreign bank entry, performance of domestic banks and the
TRANSCRIPT

Foreign Bank Entry, Performance of Domestic Banks and the Sequence of
Financial Liberalization
Nihal Bayraktar and Yan Wang*
2nd Draft: August 18, 2004
Abstract The openness or internationalization of financial services is a complex issue as it is closely related to structural reforms in domestic financial sector with some perceived implications to macroeconomic stability. This paper attempts to investigate firstly the impact of foreign bank entry on the performance of domestic banks, and secondly how this relationship is affected by the sequence of financial liberalization. Our data set is constructed from the BANKSCOPE database including 30 developed and developing countries and covering the period from 1995 to 2002. We apply panel data regressions by pooling all countries together, and by grouping countries according to the sequence of their financial liberalization. One observation based on descriptive analysis is that the degree of openness to foreign bank entry varies a great deal which is not correlated with average income levels or with GDP growth. Second, the sequence of financial liberalization matters for the performance of domestic banking sector: After controlling for macroeconomic variables and grouping countries by their sequence of liberalization, foreign bank entry has significantly improved domestic bank competitiveness in countries which liberalized their stock market first. In these countries, both profit and cost indicators are negatively related to the share of foreign banks. Countries which liberalized their capital account first seem to have benefited less from foreign bank entry as compared to the other two sets of countries.
JEL Classification: G21, F10, F21.
*Respectively, Penn State University – Harrisburg and World Bank. This is part of a larger effort in WBIPR –Trade to develop materials for capacity building on trade in financial services. The authors thank Gerard Caprio, Roumeen Islam, Will Martin, Aaditya Mattoo, Gianni Zanini, and trade team for encouragement and comments. The findings and views expressed in this paper are entirely those of the authors. They do not necessarily reflect the views of the Bank, its Executive Directors or the Countries the represent.
Pub
lic D
iscl
osur
e A
utho
rized
Pub
lic D
iscl
osur
e A
utho
rized
Pub
lic D
iscl
osur
e A
utho
rized
Pub
lic D
iscl
osur
e A
utho
rized

2
1. Introduction
The opening of financial services and the structural reforms of domestic financial sector are two interwoven processes, both aimed at developing an efficient and competitive financial system to facilitate economic growth. The degree of financial liberalization and integration has risen significantly in the 1990s. In particular, foreign bank presence as measured by percentage in total bank assets in low income countries has increased from 19 percent in 1995 to 42 percent in 2000 (World Bank 2002). Along with the expanded participation in The General Agreement on Trade in Services (GATS), policymakers have come to realize that the presence of foreign financial service providers can benefit the consumers, the financial industry through learning-by-doing, and the economy through efficiency gains. However, foreign bank entry is not without risks especially if it is conducted in the absence of strengthening the institutional framework. More than trade in goods, the gains and costs of trade in financial services depend on many factors including the structural reforms in domestic financial sector, the regulatory framework as well as the sequencing of liberalization.
This paper takes a purely empirical approach by focusing on trade in the banking sector only. Country experiences seem to suggest that foreign bank presence can facilitate increased competition, improve allocation of credits, and help easier access to international capital markets.1 But there are also costs associated with foreign bank entry. For example, if foreign banks attract the most profitable portion of domestic markets, this may give pressure to domestic banks, giving them an incentive for more risk taking.2 Thus the evidence on the role of foreign banks in growth and stability is mixed. Therefore, our first step is asking naïve questions: how open countries are in terms of foreign bank entry/presence? Is the degree of openness in banking sector correlated to average income levels or economic growth or other factors? Are open countries more efficient and more competitive in their banking sectors and thus grow faster or vise versa? An indicator of banking sector openness is constructed using data from BANKSCOPE.
Second, we investigate how the performance of domestic banks changes with foreign bank entry. This issue has been investigated extensively in the literature. But our study is different in that it covers different countries for the period of 1995-2002. Thus, this paper will be useful to confirm the results of previous studies. Since the basic expected role of foreign banks is to increase competitiveness in the banking sector, we specifically try to answer the question of whether domestic banks become more competitive with lower profits, lower costs, and lower net interest margin as more foreign banks participate in their industry.
In the process of financial liberalization or integration, countries have chosen alternative paths: some have liberalized their domestic financial markets first, including the banking sector and stock market, or they may have liberalized their capital account first. Related to the order of financial liberalization, each country has their unique experience. Kaminsky and Schmukler (2003) show that most industrial countries have liberalized their stock markets first while most developing countries had a tendency to open their banking sector first. In the literature, there is no clear-cut solution to the financial liberalization sequencing problem. While some economists
1 Claessens, Demirguc-Kunt, and Huizinga (1998) study effects of foreign bank entry on efficiency of domestic banks. 2 See for example, Hellmann, Murdock and Stiglitz (2000), World Bank (2002), International Monetary Fund (2000).

3
claim that domestic financial sector should be liberalized first, the other group of studies proposes that early capital account liberalization can initiate broader economic reforms.3
The third question we focus on is whether the sequence of financial liberalization is important in determining the effects of foreign bank presence on the efficiency of domestic banks. First, we examine the issue by simply looking at the averages, and then we investigate the issue by pooled cross country regressions controlling for macroeconomic variables and health indicators of the domestic banking sector. In the literature, the linkages between the sequence of financial liberalization and domestic bank performance have not been examined by previous studies. Comparison of cross country experience on foreign bank entry taking into account the sequencing issue is crucial in drawing lessons for other countries, such as China, which is in the process of liberalizing their financial sectors including banks.
In order to accomplish the three objectives, we examine the financial liberalization process of 30 developed and developing countries, foreign bank entry into these countries, and the efficiency of domestic banks. Our panel data set is constructed for the period of 1995-2002 using bank-level data from The BANKSCOPE.
The descriptive analysis shows that the degree of openness to foreign bank entry varies a great deal, which is not correlated with average income levels or with GDP growth. When countries are grouped according to their sequence of financial liberalization (domestic financial markets first, or stock market first, or capital account first), the foreign bank shares in each group are almost the same. But this share is much higher for the Asian and Latin American countries which liberalized either their stock market first or their capital accounts first. Domestic banks’ net interest margin, non-interest income, overhead costs, and loan loss reserve get the lowest values in the countries which liberalized their stock markets first. This implies that the competition is the toughest in the banking sector of these countries.
Building on a model based on Claessens et al (1998), our pooled cross-country regression results indicate first, that changes in foreign bank share is not significantly associated with domestic banks’ performance when all countries are pooled together. Domestic banks’ performance is significantly associated with the equity asset ratio, the overhead cost ratio, and several macroeconomic factors. Thus, the efficiency gain of domestic banks with foreign bank entry is not statistically significant. Our results are largely consistent with results from Claessens et al (1998), even though they find some statistically significant domestic bank efficiency gains.
Second, the sequence of financial liberalization matters for the performance of domestic banking sector: After controlling for macroeconomic variables and grouping countries by their sequence of liberalization, foreign bank entry has significantly improved domestic bank competitiveness in countries which liberalized their stock market first. In these countries, both profit and cost indicators are negatively related to the share of foreign banks, indicating a more competitive environment. Countries which liberalized their capital account first seem to have benefited less from foreign bank entry as compared to the other two sets of countries, as the relationship between the performance indicators and the foreign bank share is the weakest in these countries.
The paper is organized as follows. Section 2 presents the literature review on the impact of foreign bank entry and the sequence of liberalization. Section 3 describes the empirical model and the data set. Section 4 reports some descriptive statistics. Section 5 presents econometric results. In the section 6, two case studies are provided on the Turkish and Chinese banking sectors. Section 7 concludes.
3 See Johnston (1998), and Johnston, Darbar, and Echeverria (1997) for details.

4
2. Literature Review
Related studies are classified in two groups. While the first group of studies is on the sequence of financial liberalization, the second group is on foreign bank entry.
2.1 Foreign Bank Entry in the Domestic Banking Sector
The benefits and costs of foreign bank entry are investigated extensively in the literature. The World Bank (2002) summarizes the benefits as follows. 1) Foreign bank entry increases the efficiency of the domestic banking sector. Increased competition tends to reduce costs and to increase profits (World Bank, 2001; Claessens, Kunt, and Huizinga, 1998). 2) The allocation of credits to the private sector may be improved since it is expected the evaluation and pricing of credit risks to be more sophisticated (Clarke, Cull, and Soledad Martinez Peria, 2001; Barth, Caprio, and Levine, 2001). This may help foster higher growth (Levine, 1996). 3) The presence of foreign banks helps build a domestic banking supervisory and legal framework, and enhance the overall transparency. 4) It is expected foreign banks to provide more stable sources of credit since they may refer to their parents for additional funding and they have easier access to international markets. Thus, domestic financial markets will be less vulnerable to domestic shocks. 5) Foreign banks may reduce the costs associated with recapitalizing and restructuring banks in the post-crisis period. The costs of foreign bank entry are specified as follows: 1) If the franchise value of domestic banks decreases with foreign bank entry, they may have an incentive to take on greater risks (Hellmann, Murdock, and Stiglitz, 2000). 2) With more advanced services and products, foreign banks attract the most profitable portion of domestic markets. Thus, riskier sectors will be served by domestic banks. 3) With increased foreign bank presence, access to credit may be impaired for some sectors of the economy. 4) Foreign banks may increase financial instability by pulling out of host countries or by contagion from problems in the home country. 5) Since foreign banks have different priorities and business focus, their lending pattern tends to ignore domestic priorities.
Claessens, Demirguc-Kunt, and Huizinga (1998) examine the effects of foreign bank entry on the domestic banking sector. They show that in developing countries foreign banks tend to have greater profits, higher interest margins, and higher tax payments compared to domestic banks. But the opposite is true in developed countries. Another interesting conclusion is that both profitability and overhead expenses of domestic banks fall with foreign bank entry. In this study, we apply their empirical technique to a different data set. While their data cover 80 countries and the period of 1988-95, our data set includes 29 countries and covers the period of 1995-2002. Thus, our study will be helpful to confirm their results.
Demirguc-Kunt and Huizinga (1999) present similar results. They show that foreign banks have generally higher profits and margins compared to domestic banks in developing countries, while the opposite is true in industrial countries. Demirguc-Kunt, Levine, and Min (1998) show that foreign bank participation lowers the possibility that a country will experience a banking crisis. They indicate that the presence of foreign banks lowers overhead costs and profits of domestic banks. Foreign banks also increase overall economic growth by raising the efficiency of domestic banks.

5
Another cost of foreign bank entry is pointed out by Agenor (2001). Since foreign investors may not be familiar with the emerging markets, they tend to retreat promptly and massively at the first encounter of difficulty. This may lead to deeper crises in domestic financial markets.
There are also studies focusing on country-level experiences. Denizer (2000) investigates foreign bank entry in Turkey’s banking sector. He shows that the net interest margin, overhead expenses, and returns on assets are related to foreign ownership. He also indicates that foreign bank entry has a strong competitive effect on the banking sector. It lowers the return on assets and overhead expenses. Hasan and Marton (2000) investigate the Hungarian banking sector during the transitional process. They conclude that banks with higher foreign bank ownership involvement are associated with higher efficiency. Goldberg, Dages, and Kinney (2000) study the role of foreign banks in determining the health of domestic financial systems in Argentina and Mexico. The health of banks, and not their ownership, is the critical determinant in the growth, volatility, and cyclicality of bank credits. But diversity in ownership tends to contribute to greater stability of credit in times of crisis and domestic financial system weakness.
2.2 The Sequence of Financial Liberalization There are many empirical and theoretical studies focusing on the order of financial
liberalization. Kaminsky and Schmukler (2003) establish a comprehensive chronology of financial liberalization in 28 developed and emerging economies since 19734. Their study shows that while almost all G-7 countries liberalized their stock market first, European countries followed a mixed strategy. One forth of them has deregulated their domestic financial sector first but most of them liberalized their stock markets. Another result is that the liberalization of domestic financial markets was before the opening of capital accounts in developed countries. They report that the order of liberalization was different in developing countries. While Latin American countries liberalized their domestic financial sectors first, East Asian countries implemented a mixed strategy. The experience of developed countries was much smoother compared to emerging market economies. Liberalization processes started in stock markets were the ones completed this process fastest. They indicate that the order of liberalization does not generally matter in terms of vulnerability to financial crisis. The exception is that crashes are more severe in developing economies if the capital account is liberalized first.
Claessens and Glaessner (1998) show that limits on foreign financial firms in Asia lead to slower institutional development and more costly financial services provision. There are important linkages between internationalization of financial services and two other financial reforms - domestic financial deregulation and capital account liberalization. If a domestic financial market is highly regulated, the opening of the domestic financial market may create problems to domestic firms since the system may be suffering from inefficiencies. The level of capital account liberalization may affect the benefits and costs of internationalization. They also point out that neither capital account liberalization nor the internalization of domestic financial services are prerequisite for each other; but some level of free capital mobility can be necessary for efficient internalization.
Dobson (2003) focuses on three dimensions of liberalization: domestic deregulation, market-opening, and capital account liberalization. She does not specify a sequence but points out that a country undertaking domestic financial reforms and opening its market will be restricted at
4 Details are given in the appendix.

6
some point by continued capital account restrictions in terms of the provision of diverse and modern financial services. Those who have reformed and strengthened the domestic financial sector have met necessary preconditions to relaxing restrictions on the capital account and full internalization.
Johnston (1998) investigates the relationship between the financial sector reform and capital account liberalization. He shows that before opening capital accounts, the financial intermediaries need to be strengthened in order to guarantee the efficient use of capital inflows. Countries with weak financial systems may need time to develop financial institutions and markets, especially the banking sector, before liberalizing their capital account.
Johnston, Darbar, and Echeverria (1997) point out three different views on the issue of sequencing financial liberalization. One view claims that there are preconditions of capital liberalization such as macroeconomic stability and developing domestic financial institutions and markets before liberalizing the capital account. The second view claims that early capital account liberalization can play an important role in broader economic reforms. The last view is in between these first two views: capital account liberalization should be a part of the overall macroeconomic and structural reform. They indicate that the balance of benefits, costs, and risks of following one strategy rather than another may vary across countries.
McKinnon’s (1991) book is a quite essential reference on the order of economic liberalization. He focuses on transition economies. Balancing the central government’s finances is the first step that should be taken. The second stage is the opening of the domestic capital market. He argues that the last step should be the liberalization of the foreign exchanges.
3. Empirical Model Specification and Data
This section introduces the empirical model used through out this paper and gives
information about the data set.
3.1 Model
One of the aims of our study is to investigate the possible determinants of domestic banks’ performance. We also examine how the presence of foreign banks affects their performance5. In addition, we observe how these results change when countries are grouped according to their sequence of financial liberalization.
Claessens, Demirguc-Kunt, and Huizinga’s (1998) empirical model is used in this paper. Changes in domestic banks’ performance indicators are modeled as follows:
DIijt = a0 + b*DFSjt + bi*DBit + bj*DXjt + error term
where
5 Claessens, Demirguc-Kunt, and Huizinga (1998) also analyze this question in their paper. But we focus on a different time period and on a different set of countries. Thus, our study may give some idea about the robustness of their results.

7
DIijt = changes in different performance indicators of domestic banks;
DFSjt = changes in the foreign bank share;
DBit = changes in domestic banks’ bank variables;
DXjt = changes in countries’ macroeconomic variables.
The dependent variable consists of domestic banks’ performance indicators. We apply the same performance indicators used by Claessens, Demirguc-Kunt, and Huizinga (1998)6. The first performance indicator is the net interest margin defined as the ratio of net interest income to total assets. The difference between earnings from interest and expenses on interest is an indicator of competitiveness. As a banking sector gets more competitive, it is expected the lending rate to drop but the deposit rate to increase. The second performance indicator is the ratio of non-interest income to total assets. Since foreign banks possibly provide better services to their customers, it is expected domestic banks’ non-interest income to fall as a result of increased competition from foreign banks.
The share of before tax profit in total assets is another indicator used in this study. In closed and imperfectly competitive banking sectors, it is expected the profit rate to be higher. In such sectors, banks pay low interest rates for funds and also charge higher interest rates on loans. They also require high service fees. Because of this, profits are expected to decrease with the increasing share of foreign banks. As competition among banks increases, domestic banks’ costs may decrease as well. The ratio of overhead costs to total assets is also included as performance indicator to capture this point. One possible explanation of why foreign bank entry and domestic banks’ costs are negatively related is that domestic banks may need to invest heavily on technology in order to attract customers from foreign banks if they are not technologically developed enough to compete with foreign banks. This leads to an increase in domestic banks’ costs in the short run. But these costs are expected to drop in the long run.
The last dependent variable is the ratio of loan loss reserves to total assets. This indicates the health of domestic banks. The higher is this ratio, the higher is the probability of problematic loans. There are two possibilities about how foreign bank entry is linked to this ratio. On the one hand, the presence of foreign banks may reduce the ratio since domestic banks start issuing loans more carefully to avoid losses with increased competition. On the other hand, loan loss reserves may increase with a rising foreign bank share because domestic banks start taking higher risks to compete with foreign banks.
Since one of the targets of this paper is to determine the relationship between the performance indicators of domestic banks and foreign bank entry, the first independent variable is taken as the asset share of foreign banks. In order to analyze the possible effects of changes in the foreign bank share on domestic banks’ performance, it is necessary to control for other determinants of domestic banks’ performance. Two sets of independent variables are used to accomplish this purpose. While the first set consists of bank variables, the second set of variables includes macroeconomic indicators. The bank variables are equity, non-interest earning assets, customer and short term funding, and overhead costs - all in percent of total assets. The tax rate of banks which is measured as taxes paid by domestic banks over their pre-tax profit is also included in this group of variables. The macroeconomic indicators are real GDP per capita, the growth rate 6 There are other studies using similar performance indicators such as Demirguc-Kunt and Huizinga (1999), Demirguc-Kunt, Levine, and Min (1998), and Denizer (2000).

8
of real GDP, the inflation rate, the real interest rate, and the share of domestic credits by banking sector in percent of GDP.
This empirical model is, first of all, estimated including all the countries. Secondly, these countries are grouped according to the sequencing of their financial liberalization. Then, the model is estimated separately for different groups of countries in order to understand the importance of the order of financial liberalization on the performance of domestic banks. Our expectations about how the sequencing of financial liberalization affects the possible role of foreign banks in improving domestic banks’ performance are as follows. We expect the increasing share of foreign banks to be more beneficial in terms of increased competition in the countries which liberalized their domestic financial markets or their stock markets first. This is reasoned by the fact that the basic role of foreign banks is to supply international funds in the presence of capital account restrictions. This role of foreign banks is more meaningful in countries which started their liberalization process with their financial markets. Because of this, foreign banks are expected to play an important role in determining the performance of domestic banks in this group of countries. With the same reason, domestic banks’ efficiency gain from foreign bank entry may not be large in the countries which liberalized their capital accounts first. Both foreign and domestic banks have an access to foreign funds at the same level in these countries.
3.2 Data
In this study we include the countries investigated by Kaminsky and Schmukler (2003)7. The list of countries is Argentina, Brazil, Canada, Chile, Colombia, Denmark, Finland, France, Germany, Hong Kong, Indonesia, Ireland, Italy, Japan, Korea, Malaysia, Mexico, Norway, Peru, Philippines, Portugal, Spain, Sweden, Taiwan, Thailand, United Kingdom, United States, and Venezuela. China and Turkey are also included in this set. Thus, the total number of countries is 308. We separate countries into three groups according to their order of financial liberalization: domestic financial liberalization first, stock market liberalization first or capital account liberalization first. Table 3 presents the list of countries9.
The BANKSCOPE database provided by IBCA is the main data source. This database provides information on individual private and state banks. Our data set covers the years 1995 to 2002. All banks are included in the banking sector of the countries. The exceptions are France, Germany, Italy, Japan, Spain, United Kingdom, and United States, for which we only include the top several hundred banks with the highest total asset level.
Banks are defined as foreign if at least 51 percent of their shares are foreign owned. There are two alternative ways of measuring foreign bank entry. One way is to calculate the asset share of foreign banks as a share of total assets in the banking sector. As it is pointed out by Claessens et al (1998), this measure is appropriate if foreign banks have an effect on the pricing and profitability of domestic banks only after obtaining substantial size. The alternative way is the number of foreign banks as a share of total number of banks in the banking sector. Claessens 7 Kaminsky and Schmukler (2003) conduct a chronology of financial liberalization in 28 countries. Countries in each set are determined using the information give in Table 1 of Kaminsky and Schmukler (2003). For convenience, this table is presented as Table A1 in the appendix section. 8 Note that Turkey and Twain, China are excluded in the regression analyses due to lack of data points, and China is excluded due to the fact that the financial liberalization process was not complete as of 2002. Thus, 27 countries are included in the regression analyses. 9 The definitions of financial liberalization are given in the appendix section.

9
et al (1998) claim that this measure is appropriate if the number of foreign and domestic banks determines competitive conditions. We define the foreign bank share by taking into account their asset shares.
The data set is initially constructed at the bank level for each country. Then, country-level averages are calculated in each year. The regressions and other statistics are based on these panel data which consist of country-level averages.
4. Descriptive Analysis The starting point of our analyses is the construction of descriptive statistics. First of all,
the question of how foreign bank entry is related to macroeconomic variables and to domestic banks’ performance indicators is examined. It is also checked how our results change when the countries are split into different groups according to the sequence of financial liberalization.
Table 1 reports the average values of the performance indicators for foreign banks and domestic banks separately at the country level. The variables change a lot among countries. In general, foreign banks’ revenue indicators (net interest margin, non-interest income, and profits) are higher, but their overhead costs are lower. Another result is that countries with a higher foreign bank share tend to have more competitive domestic banks - cost and profit indicators are lower. First of all, the performance indicators of two developing countries which differ in their foreign bank shares are compared. Brazil (the foreign bank share is 8.3 percent) and Mexico (the foreign bank share is 40.7 percent) are chosen in this group. It can be seen that domestic banks’ net interest margin, non-interest income, profits, and overhead costs are lower in Mexico. We obtain similar results for developed countries. For example, we can compare Finland (the foreign bank share of 0.4 percent) with the United Kingdom (the foreign bank share of 29.1 percent). The values of the performance indicators are lower in the United Kingdom. This last set of results is consistent with the available literature such as World Bank (2002). They show that in poor countries where foreign bank entry is higher than average, costs associated with financial intermediation is lower since net margins and non-interest income are lower. In these countries, banks’ overhead are also lower.
The statistics related to the foreign bank penetration are presented in Table 2. Countries are ranked according to their foreign bank share. Two different measures of the foreign bank share are calculated in this table. While the first measure is the share of foreign banks’ assets in total assets, the second one shows the number of foreign banks in percent of total number of banks. The major result is that the degree of openness to foreign bank entry varies a lot among countries. The asset share of foreign banks ranges from 2 percent in China to 61.3 percent in Hong Kong, China. There is a considerable gap between the highest and the lowest values of the foreign bank share among developed countries as well. While the United Kingdom has the highest foreign banks’ asset share, which is 25.5 percent, that is only 4 percent in Finland. Similar results are obtained when the foreign bank penetration is measured with the number of foreign banks. But in this case, while Japan has the lowest share, which is 1.7 percent, Ireland is the most open country with the foreign bank share of 61.7 percent.
Given such a large spectrum of the foreign bank share, the next question we would ask is whether there is a relationship between countries’ income levels and their degree of openness to foreign banks. In order to answer this question, we plot the log of GDP per capita and the asset share of foreign banks, which measures the degree of openness. The graph is presented in Figure 1. The openness of the banking sector for foreign banks is not related to countries’ income level.

10
The correlation coefficient between these two variables is only 0.00025. Thus, the figure supports the results obtained in Table 2.
One of our objectives is to investigate the possible effects of the order of financial liberalization on domestic banks’ efficiency gain as a result of the increased foreign bank participation. Table 3 reports the list of countries which followed different financial liberalization paths10. While almost all developed countries liberalized their stock markets first, developing countries started to their financial liberalization process either with their domestic financial markets or with their capital accounts.
Table 4 reports statistical information on domestic banks’ performance indicators when countries are grouped according to the sequence of financial liberalization. Each group of countries is separated into two sub-groups depending on their geographical location. While Asian and Latin American countries (emerging market economies) are included in the first set, European and G7 countries (developed countries) take place in the second set. The values of the asset share of foreign banks are on average close to each other in each group. While the share is 13.3 percent in the countries liberalized their capital accounts first, it is 16.8 percent in the countries liberalized their stock markets first, and 15.8 percent in the countries liberalized their domestic financial markets first. If we investigate emerging market economies and developed economies separately, differences in their foreign bank share are more obvious. The banking sectors of the Asian and Latin American countries which liberalized either their stock market first or their capital accounts first are more open to foreign banks. While the asset share of foreign banks is 38.4 percent in the first group, it is 19.2 percent in the second group. The European and G7 countries, which liberalized their domestic financial sector first, also have a relatively large foreign bank penetration rate (i.e. 23.2 percent). The least open markets in terms of foreign bank entry (only 1.5 percent) belong to the European and G7 countries which liberalized their capital accounts first. As Figure 1 confirms, there is no obvious trend between the level of economic development and foreign bank entry.
We can use Table 4 to compare the performance indicators of different group of countries. On the one hand, domestic banks’ net interest margin, non-interest income, overhead costs, and loan loss reserves get the lowest values in the countries which liberalized their stock markets first. This means that the competition is tougher in these countries’ banking sector. As noted above, these countries are also more open to foreign banks on average. On the other hand, the highest values of non-interest income, overhead costs, and loan loss reserves belong to the Asian and Latin American countries which liberalized their domestic financial markets first. Even though the competition is limited in these countries, the asset share of foreign banks (14.1 percent) is close to the overall average value which is 15.2 percent. Thus, the presence of foreign banks is not sufficient to increase the competition in the banking sector.
If we summarize our findings, the descriptive statistics indicate that the countries which liberalized their stock market first tend to have a higher foreign bank entry rate and to have a more competitive banking sector. But we cannot conclude whether the order of liberalization plays an important role in determining the performance of domestic banks since other important factors such as macroeconomic indicators are also effective in this process. Because of this, we need to control for these additional determinants. In order to accomplish this purpose, we apply econometric analyses to investigate the relationship between foreign bank entry and the performance indicators of domestic banks, and the possible role of the sequence of financial liberalization in this process. These results are presented in the next section.
10 While ranking countries according to their order of financial liberalization, we use the information presented by Kaminsky and Schmukler (2003). Detailed information on the liberalization dates is given in Table A1 in the appendix section.

11
5. Empirical Results
The regression results are reported in Tables 5 to 9. All equations are estimated using the ordinary least square technique with heteroscedasticity-corrected standard errors. Fixed effects are also included to remove country specific effects.
Table 5 reports the regression results when all countries in our data set are pooled together. Changes in the foreign bank share are not a statistically significant determinant of any performance indicators. The signs of some estimated coefficients are not as expected, either. For example, it is expected that as the foreign bank share increases, the net interest margin and overhead costs fall since the banking sector is supposed to be more competitive in this case. But the results show the opposite of what we expect.
Our empirical model explains changes in the net interest margin and loan loss reserves more successfully. Changes in some bank variables are significant determinants of the performance indicators. Especially the ratio of equity to total assets and the tax rate paid by banks are statistically significant. As the equity ratio increases, the net interest margin, profits and overhead costs rise but loan loss reserves fall. Increasing overhead costs results in a higher net interest margin and non-interest income. The tax rate is higher when the net interest margin and profits before tax are higher.
When we check the macroeconomic variables, the most significant determinants of the performance indicators are the inflation rate and domestic credits by banking sector. As inflation increases, the net interest margin increases as well. On the other hand, as domestic credits increase, the net interest margin falls. Changes in loan loss reserves are related to changes in the macro variables. As inflation and real interest rates increase, loan loss reserves increase. But changes in the GDP growth and GDP per capita are negatively related to loan loss reserves. Thus, when the macroeconomic environment is weak, loan loss reserves increase.
Our empirical model closely follows the one created by Claessens et al (1998). The main difference is the time period covered and the number of countries included in the study. They focus on the period of 1988-95. Our data set covers the years from 1995 to 2002. While they investigate the banking sector of 80 different countries, we include only 29 countries, almost half of which are developed countries. If we compare the estimated coefficients of the foreign bank share as determinant of domestic banks’ profitability and efficiency, it can be seen that our results are similar to the results of Claessens et al (1998). One major difference is that while their results show that as the foreign bank share increases, overhead costs fall, we find a positive relationship between these two variables. Another difference is that none of our estimated coefficients of the foreign bank share is statistically significant. On the other hand, Claessens et al (1998) find that the foreign bank share is a statistically significant determinant of both before tax profits and loan loss provisions.
Before we get into a detailed study of the regression results for different groups of countries, it would be beneficial to discuss briefly why the sequence of financial liberalization is expected to matter in determining the effects of foreign banks on the performance of domestic banks. If a country liberalizes its financial services first, it is expected that foreign investors or banks to have more opportunities to take place in its banking sector. They can make longer term investments such as purchasing equities in the stock market. They will be also helpful in institutional development of financial intermediaries and in less costly financial services provision. Thus, the presence of foreign banks is expected to have a positive effect on the

12
performance of domestic banks. Besides these positive effects, domestic banks may have a disadvantage in terms of unequal access to international capital markets compared to foreign banks. As a result of this disadvantage, domestic banks may not be able to improve their efficiency.
Foreign bank entry may cause an additional problem if a country liberalizes its domestic financial sector first. Since foreign banks do not have an access to longer term investment instruments when they are first involved in the domestic banking sector, they will provide shorter-term funds. This may affect the health of the banking sector negatively, thus the efficiency gain of domestic banks.
Assuming that foreign banks have an easier access to international funds, the most important effect of foreign bank entry would be that they provide additional funds to the domestic banking sector. But if capital accounts are liberalized first in an economy, it is not an expected outcome of foreign bank entry. The reason is that both foreign and domestic banks will have an easy access to international capital markets. So it would be expected that the share of foreign banks may not affect the efficiency of domestic banks a lot.
Tables from 6 to 8 present the results obtained for different groups of countries. Table 6 gives the estimation results for the group of countries which liberalized their stock market first. The number of countries in this group is 12, and 10 of them are developed countries. Changes in the foreign bank share are statistically significant and they are negative determinants of the net interest margin, non-interest income, and before tax profits. The relationship between the foreign bank share, and overhead costs and loan loss reserves is also negative but statistically insignificant. These are the expected results when we assume that as the share of foreign banks increases, the domestic banks become more competitive and efficient. Changes in costumer and short-term funds, and overhead costs are statistically significant determinants of profitability indicators. Both of these variables are positively related to the net interest margin. GDP per capita and GDP growth rates are statistically significant determinants of some performance indicators, especially the net interest margin and before tax profits. The bank variables are more significant determinants of performance indicators compared to the macroeconomic variables. Given the fact that most of these countries have stable economies, it is expected that the efficiency of domestic banks will be determined mostly by changes in the bank sector rather than by changes in macro variables. The GDP growth rate is a statistically significant determinant of three performance indicators. While the net interest margin and profits increase with increasing inflation, loan loss reserves fall.
Table 7 reports the estimation results for the group of countries which liberalized their domestic financial markets first. 9 countries are included in this set and only 2 of them are developed countries11. The effect of changes in the foreign bank share is less statistically significant compared to the results in Table 6. This coefficient is significant and has an expected sign only for the regression where the ratio of non-interest income to total assets is the dependent variable. In this regression, almost all bank variables are statistically and economically significant determinants. The bank variables are not successful in determining profits, overhead costs, and loan loss reserves. But changes in profits and loan loss reserves ratio can be explained by changes in the macroeconomic variables. On the one hand, as per capita income increases, profits increases, but loan loss reserves fall. On the other hand, changes in inflation and domestic bank credit by the banking sector affect profits and loan loss reserves in an opposite way. This means that healthy macroeconomic environment causes profits to be higher and loan loss reserves to be lower. The net interest margin increases as the GDP growth rate and the real interest rate increase.
11 Turkey and Taiwan, China are excluded due to the lack of data points.
13
Table 8 presents the estimation results for the group of countries which liberalized their capital account first. The number of countries included in this set of regressions is 6, 4 of which are emerging market economies. A change in the foreign bank share is a statistically significant determinant of only changes in overhead costs. At least one bank variable is an important determinant of the performance indicators of domestic banks. Changes in the equity ratio have a positive effect on the net interest margin, profits, and overhead costs, but have a negative effect on the loan loss reserves ratio. The inflation rate is a statistically significant determinant of all performance indicators except the overhead cost ratio. Positive changes in inflation cause the net interest margin, non-interest income, profits, and loan loss reserve to increase.
Since our primary interest is on the foreign bank share, we construct Table 9 to combine the estimated coefficients of the foreign bank participation from Tables 6 to 8. The first row reports the estimated coefficients for all the countries. As the share of foreign banks increases in an economy, it is expected the net interest margin, profits, and overhead costs to fall. This means that it is expected that foreign banks increases the competition in the domestic banking sector. None of the coefficients are statistically significant and the signs of some of them are not as expected. Even though it is not statistically significant, as the foreign bank share increases, overhead costs and the net interest margin rise.
The successive rows report the estimated coefficients of the foreign bank share for different groups of countries. The profitability and efficiency contribution of foreign banks get the highest value in the group of countries which liberalized their stock market first12. The signs of the coefficients are also as expected. The foreign bank participation promotes competition and efficiency. In terms of statistical significance of the estimated coefficients, the efficiency gain obtained by increasing the share of foreign bank is the lowest for the group of countries which liberalized their capital accounts first as reported in the last row of the table. For this group of countries, it is expected both domestic and foreign banks to have an equal access to international funds since their capital accounts are liberalized first. This may reduce the positive effect of an increasing foreign bank share. While the net interest margin and before tax profits are negatively related to the share of foreign banks, overhead costs of domestic banks follow the foreign bank share positively. This last issue can be explained by the fact that late liberalized domestic financial markets may results in some cost disadvantageous to domestic banks. For example, if domestic banks have technological deficiencies compared to foreign banks, they may increase their overhead costs to finance technology related investments in order to compete with foreign banks. In this case, overhead costs will be higher as the share of foreign banks rises.
The third row of the summary table reports the coefficients of the foreign bank share for the group of countries which liberalize their domestic financial markets first. Efficiency gains of domestic banks are not statistically significant for these countries, either. The only statistically significant coefficient reports the negative effect of the foreign bank share on non-interest income of domestic banks. This is the expected result when foreign banks specialize in some specific bank activities which require high service fees. In this case, non-interest income of domestic banks may fall.
If we summarize our results, they indicate that efficiency gains from foreign bank entry (i.e. lower profits and costs) are the highest in countries which liberalized their stock market first after other possible determinants are controlling for. Thus, it can be concluded that the possible negative effects of foreign bank entry are overweighed by the positive effects. But we cannot say the similar things for the countries which liberalized their domestic financial markets first. In these countries, foreign banks cannot help improve the efficiency of domestic banks. In this case, one possibility is that the negative effects and positive effects of foreign banks cancel out each 12 It should be noted that 10 out of 12 countries in this group are developed countries.

14
other, or alternatively they may not have any effect on domestic banks. The relationship between the performance indicators and the foreign bank share is the weakest in the countries which liberalized their capital accounts first.
6. Case Studies
In this section, we investigate the banking sectors in Turkey and China.
6.1 Turkish Banking Sector The reform of the Turkish banking sector took place in a fully liberalized financial
environment. Until 1980s, the Turkish financial sector was heavily regulated by the government. The liberalization of the domestic financial market started in 1980. The elimination of controls on interest rates and reduction in directed credit programs were two of the aims. The other key target of the domestic market liberalization process was to attract new banks into the sector in order to increase efficiency and competition. Thus, entry barriers into the sector were significantly reduced (Denizer, Dinc, and Tarimcilar, 2000). The total number of commercial banks jumped to 56 in 1990 as compared to 36 in 1980 (Denizer, 2000). The number of foreign banks increased to 23 in 1990 from 4 in 1980 (Isik and Hassan, 2003). The deregulation of interest rates allowed price competition in the market. New bank entry enhanced this competition. This led to a decreasing concentration ratio. During 1981-84, the efficiency in the sector increased (Denizer, Dinc, and Tarimcilar, 2000).
The domestic market liberalization was followed by the re-opening of Istanbul Stock Exchange in 1986. In the liberalization process, the last important step was taken in 1989 by liberalizing capital accounts. After the opening of capital accounts, the efficiency of the banking sector at first increased further since banks started borrowing cheaper funds from international financial markets and lending them to public and private sectors (Denizer, Dinc, and Tarimcilar, 2000). But given the unstable macroeconomic situation in Turkey (chronic high inflation, political instability, persistent fiscal imbalances, and periodic balance of payments crises), a large risk premium developed on the foreign interest rate. This led to higher domestic interest rates (Denizer, 2000). The political and economic instability prevented the improvement of long-term securities and restricted both the level and maturity of bank lending as well. Thus, despite these financial liberalization activities, the domestic banking sector could not gain the expected efficiency.
Given high domestic interest rates, commercial banks started heavily borrowing external funds. Due to the fact that the government had been following a flexible exchange rate policy since 1980, the large amount of capital inflows together with high inflation caused real exchange rate appreciation during 1990-93 (Denizer, 2000). The rapid deterioration of fiscal balance in 1993 and policy mistakes related to interest rates and exchange rates led to the first major financial crisis after liberalization in 1994. The Turkish lira was depreciated by 150 percent. This financial crisis severely affected the banking sector. The rapid depreciation of the Turkish lira created a confidence problem so depositors started withdrawing their deposits. During this period, three small banks failed. In order to prevent further panic, 100 percent deposit insurance was introduced.
After this crisis, the central bank started targeting the real interest rate. Thus, the currency was depreciating at the inflation rate. This increased predictability of the exchange rate and encouraged foreign borrowing which was used to purchase high-yield government securities. The

15
open position of private banks (net foreign exchange assets) was quite large. The volume of foreign borrowing reached to 23 percent of domestic credit stock at the end of November 2000 from 14 percent at the end of September 2000 (Erda, 2001). This high level of dependency on foreign borrowing made the sector increasingly vulnerable to deterioration in the market and to large capital outflows. This process led to the second major financial crisis which started at the end of 2000. The problems in the Turkish banking sector were the main reason for the crisis. Erda (2001) points out three problems in the banking sector during the crisis period. First of all, unfair competition from state banks and the reluctance of the government to let problematic banks to fail hampered the development of commercial banks. The second major problem is that the capital deficiency of banks led them to make riskier investments. The presence of high liquidity risk resulted from a rapid increase in short-term foreign debt was the third problem. Alper and Onis (2002) indicate additional problems such as importance of state banks’ duty losses and the negligible presence of foreign banks13.
The 2001 crisis was initiated by the failure of one of the large private banks due to severe liquidity problems14. Due to increasing pressure in the economy, the Turkish lira depreciated in February 2001. Several banks failed after the depreciation of the Turkish Lira and some of them transferred to Saving Deposits Insurance Fund (SDIF) for recapitalization purposes. Table 10 shows that the total number of “deposit money banks” dropped to 51 in 2001 from 62 in 1999. Total public debt arising from state banks and the takeover of private banks amounted to 24 percent of GNP at end-April 2001 (IMF, 2001). During this period, increased interest rates affected banks adversely. Credit risk also increased due to the economic downturn. They led to severe interest rate and foreign exchange losses and rising loan loss reserves. The profits and capital adequacy fell sharply.
After the crisis, the main focus in the banking sector is given to the restructuring the state and SDIF banks; the resolution of SDIF banks; strengthening private banking; and improving legislative and regulatory environment (IMF, 2001). An IMF country report (2003) indicates that open position of banks, non-performing loan and profitability indicators, and the capital adequacy are improving. These results can also be seen in Table 11.
The Turkish banking sector is still vulnerable. It is quite concentrated. The IMF (2002) reports that the asset concentration ratio for the largest five deposit money banks was 46 percent between 1997 and 2001. State banks play an important role in the Turkish banking sector. While their asset share is approximately 35 percent, the share of private domestic deposit banks is approximately 50 percent (IMF, 2002). State banks persistently finance favored sectors. This fact introduces additional distortions in the banking sector.
As indicated in the literature review section, foreign bank entry has many positive effects on domestic banks. The number of foreign banks in Turkey increased rapidly after liberalization. Two main reasons for this increase were opening of capital account in 1989 and increasing international trade (Denizer, 2000). Even though the number of foreign banks increased over the years, their asset share did not change much. One possible reason behind this fact is the lack of proper supervision and regulation in the Turkish banking sector. In such environment only certain
13 In the 1990s, duty losses of state banks were quite important. These losses refer to the quasi-fiscal losses caused by directed lending which the Treasury recognizes as an obligation. The Treasury could not pay these obligations on time, thus state banks started borrowing heavily. This led to high deposit and inter-bank rates in the sector. 14 Demirbank, which was failed in November 2000, had chosen an extremely risky strategy to finance high-yield long-term government bonds. They were borrowing in the overnight repo market. Due to the liquidity problem of this bank, other two large banks stopped crediting it in November 2000 since interbank loans were not insured. As a result, Demirbank failed.

16
type of banks interested in collaborating with domestic private banks would enter the market. Denizer (2000) shows that foreign banks have been highly profitable. Since they focus on highly specialized areas, their profitability reflects fee-based services. Denizer (2000) indicates that foreign bank entry had a strong competitive effect in Turkey even though their asset share was not large. As the role of foreign banks increases, it is expected that this efficiency gain in terms of rising competition will be more.
In the presence of macroeconomic and political instability and major structural problems in the banking sector, financial openness led to many negative effects on the Turkish banking sector. In this case, which financial sector is liberalized first does not matter much since the desired efficiency gain in the banking sector cannot be accomplished in the presence of such problems.
6.2 China’s Banking Sector: Pre- and Post-WTO Reforms15 China is a good example where implementing GATS agreement is made a positive driving
force for domestic restructuring in the financial sector. The pre-WTO financial sector reform were first initiated by the government and was independent of the WTO accession process. Only in later stages was reform measures linked to the WTO or GATS agreements. Second, China took the approach of introducing competition first before privatizing the state financial sector, which is similar to their approach in restructuring other monopolistic industries. Third, unlike some other countries which opened their capital account or stock market first, China took a different reform sequence, --to gradually open its financial sector to domestic and foreign competition, and leave the capital account liberalization to a later stage. 6.2.1. Pre-WTO Reforms: introducing limited competition
China’s financial sector reform was slow and gradual with no specific blueprint or roadmaps. It is lagged behind reforms of other competitive industries due to many factors including its links with the reforms of state enterprise, and constraints related to regulatory capacity. The pre-WTO reforms focused on introducing limited competition from domestic and foreign service providers with the latter subjected to strict geographical constraints. This period can be roughly divided into four stages:
1979—1986: breaking the mono-bank system, and revitalizing the specialized state banks.
1987—1991: introducing limited domestic competition. This period saw a rapid growth of non-bank financial intermediaries and the emergence of other banks and Credit Cooperatives.
1991-1996: diversifying the financial sector. Two stock exchanges and the inter-bank market were established; and life and non-life insurance licenses were extended to foreign firms. A number of shareholding banks were established. In 1996, PBC licensed nine foreign banks to conduct RMB business in the Pudong Development Zone in Shanghai.
1997-2001: addressing the portfolio problems of the commercial banks. The preparations for WTO accession started in this period and attempts were made to strengthen State Owned Banks, including recapitalization, and establishment of Asset Management Companies (AMCs). A few foreign bank were allowed to operate in a limited number of cities to provide services to foreign residents and foreign and joint-venture enterprises. Their business with Chinese corporations and individuals was generally limited to approved foreign currency lending, and import and export
15 The authors thank Bintao Wang for his excellent research assistance in this section.

17
settlement services for Chinese enterprises. Their local currency operations were constrained (For details see Lardy (1998), Bhattasali (2002), Holz and Zhu (2000), Lo (2001), and Tong (2002)).
6.2.2. Post WTO Reforms: Restructuring and Consolidation
In its GATS agreement, China promised to eliminate in a few years most restrictions on foreign entry and ownership in most of its services (Mattoo 2002). The committed schedule has indeed “locked in” some proposed reform steps, and made domestic reform agenda all the more urgent.
More than two years after China joined the WTO, a series changes have taken place.
1. Strengthening supervision and regulation. New regulation was passed by the State Council in December 2001 to give legal guidance to revoke problematic financial institutions. In 2002, PBC started the liquidation of Everbright International Trust and Investment Corporation. In May 2002, PBC published regulations requiring financial institutions to improve their information disclosure system. In April 2003, The China Bank Regulation Commission (CBRC) was established in charge of bank regulation. The People’s Bank Law and Commercial Banks Law have both been re-drafted together with the first Bank Supervisory Law that empowers the CBRC, they have been implemented starting from February 1 2004.
2. Accelerating the Structural Reform in the Domestic financial Sector. In October 2002, the government announced preliminary regulations governing mergers and acquisitions. Some foreign banks have started to negotiate with Chinese banks for M&A deals. And foreign financial institutions have been invited to form join ventures to dispose NPLs (Jin, 2002). In December 2003 CBRC Chairman Liu Mingkang outlined plans for future reform of the banking sector, “to improve retail banks’ badly damaged balance sheets, provide them with new capital, introduce better corporate governance, and foster competition through more foreign bank operations”. “Once the State-owned commercial banks have conditions in place for restructuring or issuing stocks, the central government will encourage them to accept overseas funding as well as domestic capital” (China Daily, January 7, 2004). Several commercial banks have been restructured by attracting foreign strategic investors, including the recent deal of HSBC acquiring in 19.9% of The Bank of Communications in August 2004. (see table 1)
In January 6, 2004, the State Council finished capital injection into Bank of China and China Construction Bank(CCB)—two of the “big four” state owned commercial banks selected for restructuring using 45 billion US dollars of the nation’s foreign exchange reserve. The capital infusion helped CCB become the strongest bank in Asia(excluding Japan) according to Tier One capital strength, number 21st in the world (The Banker, July 2004). It gave the banks a strong push in the process of their ongoing reforms that has a target of an eventual public stock offerings no later than 2006, when the banking sector is opened up to foreign banks under the WTO commitments.
3. Encouraging domestic competition by establishing more shareholding banks. Before entirely open its banking sector to foreign competitors according to its WTO commitments, China is trying to start opening the market to internal competitors first so that China’s banks could achieve improvement in management and accumulate more experience through more competitions. After the approval of the three new banking laws, several new share-holding banks with private shares are already under preparation. Bohai Bank with headquarter in Tianjin was approved last November (Great Wall Finance Research, January 8, 2004) Northeast Reconstruction Bank, Guangdong Nanhua Bank, Huaihai Bank and some other inter-provincial banks with private shares are expected to emerge in the near future. However all of these banks

18
still have a strong government background—with central or local government being the biggest share holder, which inevitably will bring some constrains in the banks’ independent management.
4. Introduce international competition into the financial sector.
a. Opening further to foreign bank entry. In February 2002, PBC published detailed implementation rules of Regulations on the Administration of Foreign Financial Institutions; in March PBC unified the regulations on deposit and loan interest rate towards domestic banks and foreign banks. In March 2002, the PBC began issuing licenses to allow banks to extend foreign exchange services to domestic companies and individuals. Citibank Shanghai HSBC, the Bank of East Asia, Hang Seng Bank and Standard Chartered received licenses in 2002. In June 2003, the Closer Economic Partnership Arrangement (CEPA) was signed between the mainland and Hong Kong with the services sector benefited most from it. A wide range of professions will enjoy freer access to the mainland market and, in particular, the entry requirements for banks will be relaxed (Oxford Analytic, 12 December 2003), the mainland will implement some of the commitments it made to the WTO members ahead of schedule for the benefit of Hong Kong (China Daily, 24 December 2003).
In December 2003, the ceiling on foreign ownership in local banks was raised from 15% to 20% for single shareholders and 25% overall, to encourage foreign banks taking a strategic stake in domestic banks (Oxford Analytica 27 Aug 2003). Foreign banks would benefit by gaining immediate market entry and the right to undertake limited local-currency operations ahead of competitors who must wait until WTO restrictions are lifted in 2006. Many foreign financial institutions have become important shareholders of China’s banks (See table 1). In July 2004, CBRC announced that 100 foreign banks operating in China were allowed to provide banking services in local currency in 13 cities. Foreign bank’s renminbi-denominated assets reached 84.4 billion yuan (US$10.2 billion) at the end of June, up 49 percent, year-on-year, indicates by CBRC’s data (China Business Weekly July 27, 2004). CBRC also loosened rules regarding foreign financial institutions’ capital requirements to “promote their healthy growth”. (China Daily August 05, 2004)
Table 1: Foreign Ownership in China’s Local Banks
Local Banks Investing Foreign Banks % of Shares
Bank of Communications HSBC (Shanghai) 19.9* Shenzhen Development Bank New Bridge Capital 17.89 Shanghai Pudong Development Bank Citi Bank 4.6 China Minsheng Banking Corp. IFC 1.6 Industrial Bank Co.(Fujian) HSBC/ Government Investment Corp. of
Singapore/IFC 16 / 5 / 4
China Everbright Bank China Everbright Group (Hong Kong) /ADB
20.1 / 3
Bank of Shanghai HSBC/IFC/Shanghai Commercial Bank 8 / 7 / 3 Nanjing City Commercial Bank IFC 15 Fujian Asia Bank(a joint venture bank)
HSBC/Ping An Insurance Group 50 / 50
Xi’An City Commercial Bank IFC/ Sotia Bank 12.5 / 12.4 Dalian City Commercial Bank SHK Financial Group 10 Source: Securities Market Weekly July 2004. *This deal was completed in August 2004.

19
b. Significant steps have been taken to open stock market. In late 2001, the China Securities Regulatory Commission (CSRC) issued regulations on the public listing of foreign-invested enterprises. In December 2002, China launched the Qualified Foreign Institutional Investors (QFII) scheme, enabling eligible foreign investors invest in “A” shares (which were previously only open to domestic investors) under certain limitations. As of July 2004, 15 QFIIs had received a cumulative quota of USD$1.875 billion dollars. These funds are transferred and converted into domestic currency, deposited in special accounts and invested in equities and bonds. (See table 2 for a series of important events in China’s QFII development.)
Table 2: Important Events Related to the Qualified Foreign Institutional Investors (QFII)
Nov. 7, 2003 CSRC and PBC jointly issued Administration Rules on Qualified Foreign Institutional Investors (QFII)’s Security Investment, which were implemented from Dec. 1.
Nov. 28, 2003 State Administration of Foreign Exchange(SAFE) issued Foreign Exchanges Administration Rules on QFII’s Security Investment, effective from Dec. 1.
Dec. 1, 2003 QFII Scheme was officially launched. The scheme stipulates that in order to be eligible for QFII a foreign investing institution must have at least 10 billion dollars in assets and foreign banks must be in the top-100 globally. And their investment in A shares is limited to only 10% of any one company. There are restrictions for repatriation: investments in closed-end funds are not allow to repatriate for three years, other funds must wait a year and money can only be repatriated in small trenches.
Mid-Jan., 2003 PBC announced that 6 domestic banks (ICBC, ABC, BOC, CCB, Bank of Communications, China Merchants Bank) and 3 foreign banks’ branches in Shanghai (Standard Charted Bank, HSBC, Citi Bank) have been allowed to open custodial services for domestic securities investment by QFIIs.
May 26, 2003 CSRC awarded QFII license to UBS Warburg and Nomura Securities. They became the first foreign institutions to receive approval to invest directly in RMB-denominated “A” shares and government bonds.
May 30, 2003 SAFE authorized investment quotas of USD$300 million and USD$50 million respectively to UBS Warburg and Nomura Securities.
Jun. 24, 2003 SAFE authorized UBS Warburg to open an special QFII RMB account in its custodial service provider—Citi Bank’s Shanghai Branch. This is the first QFII RMB account.
Jul. 9, 2003 Through Shenyin & Wanguo Securities, UBS Warburg bought stocks of Baoshan Iron & Steel, Shanghai Port Container, SinoTrans Development, and ZTE, completed the first QFII transaction.
Oct. 23, 2003 Deutsche Bank was allowed to open custodial service for domestic securities investment by QFIIs. The total number of such banks reached 12.
Dec. 12, 2003 CSRC awarded QFII license to Standard Charted Bank(Hong Kong), Nikko Cordial Securities, brought the total QFII number to 12, total investment amount USD$1.7 billion.
Mar. 30, 2004 Nikko Cordial Securities made their first investment in China’s capital market. By setting up the first foreign fund to invest in China’s Government bond market, it became the first foreign institution enter the QFII scheme in the form of fund. It also represented Chinese Government’s RMB-denominated bond entered the international investment stage.
May 9, 2004 CSRC awarded QFII license to Merill Lynch. May 12, 2004 CSRC awarded QFII licenses to HSBC Co. Ltd, and Daiwa Securities SMBC Co. Ltd.
Till then, a total of 15 QFIIs have entered China’s security market. Jul. 12, 2004 SAFE authorized Daiwa Securities SMBC Co. Ltd a investment quota of USD$50
million. Till then 15 foreign investment institutions have received a cumulative investment quota of USD$1.875 billion.
Source: Securities Market Weekly July 2004.
20
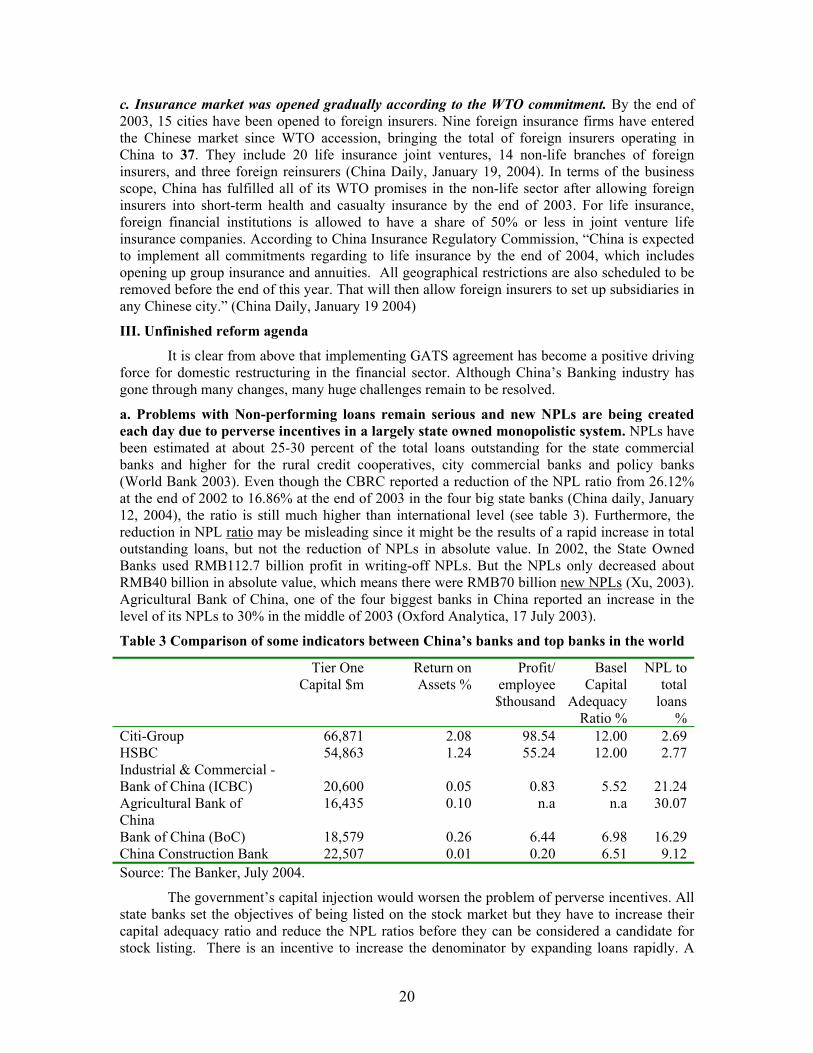
c. Insurance market was opened gradually according to the WTO commitment. By the end of 2003, 15 cities have been opened to foreign insurers. Nine foreign insurance firms have entered the Chinese market since WTO accession, bringing the total of foreign insurers operating in China to 37. They include 20 life insurance joint ventures, 14 non-life branches of foreign insurers, and three foreign reinsurers (China Daily, January 19, 2004). In terms of the business scope, China has fulfilled all of its WTO promises in the non-life sector after allowing foreign insurers into short-term health and casualty insurance by the end of 2003. For life insurance, foreign financial institutions is allowed to have a share of 50% or less in joint venture life insurance companies. According to China Insurance Regulatory Commission, “China is expected to implement all commitments regarding to life insurance by the end of 2004, which includes opening up group insurance and annuities. All geographical restrictions are also scheduled to be removed before the end of this year. That will then allow foreign insurers to set up subsidiaries in any Chinese city.” (China Daily, January 19 2004)
III. Unfinished reform agenda
It is clear from above that implementing GATS agreement has become a positive driving force for domestic restructuring in the financial sector. Although China’s Banking industry has gone through many changes, many huge challenges remain to be resolved.
a. Problems with Non-performing loans remain serious and new NPLs are being created each day due to perverse incentives in a largely state owned monopolistic system. NPLs have been estimated at about 25-30 percent of the total loans outstanding for the state commercial banks and higher for the rural credit cooperatives, city commercial banks and policy banks (World Bank 2003). Even though the CBRC reported a reduction of the NPL ratio from 26.12% at the end of 2002 to 16.86% at the end of 2003 in the four big state banks (China daily, January 12, 2004), the ratio is still much higher than international level (see table 3). Furthermore, the reduction in NPL ratio may be misleading since it might be the results of a rapid increase in total outstanding loans, but not the reduction of NPLs in absolute value. In 2002, the State Owned Banks used RMB112.7 billion profit in writing-off NPLs. But the NPLs only decreased about RMB40 billion in absolute value, which means there were RMB70 billion new NPLs (Xu, 2003). Agricultural Bank of China, one of the four biggest banks in China reported an increase in the level of its NPLs to 30% in the middle of 2003 (Oxford Analytica, 17 July 2003).
Table 3 Comparison of some indicators between China’s banks and top banks in the world
Tier One Capital $m
Return on Assets %
Profit/ employee $thousand
Basel Capital
Adequacy Ratio %
NPL to total
loans %
Citi-Group 66,871 2.08 98.54 12.00 2.69HSBC 54,863 1.24 55.24 12.00 2.77Industrial & Commercial -Bank of China (ICBC)
20,600
0.05
0.83
5.52
21.24
Agricultural Bank of China
16,435 0.10 n.a n.a 30.07
Bank of China (BoC) 18,579 0.26 6.44 6.98 16.29China Construction Bank 22,507 0.01 0.20 6.51 9.12Source: The Banker, July 2004.
The government’s capital injection would worsen the problem of perverse incentives. All state banks set the objectives of being listed on the stock market but they have to increase their capital adequacy ratio and reduce the NPL ratios before they can be considered a candidate for stock listing. There is an incentive to increase the denominator by expanding loans rapidly. A

21
second round of re-capitalization would help clean up balance sheets, but will not address the fundamental incentive problems in the governance system of the state owned banks, on the other hand it may foster moral hazards.
b. Problems of access to credit by the poor and regional disparity. When the state banks are engaging in credit rationing and retreating from lagging areas, it is getting more and more difficult for the poor to access credit. As mentioned earlier, the consolidation of domestic state owned banks have led to a cutting of 44,000 branches in rural and remote regions. Just as Mattoo (2002) pointed out “Initial restrictions on the geographical scope of services liberalization could encourage the further agglomeration of economic activity in certain regions – to an extent that is unlikely to be reversed completely by subsequent country-wide liberalization.” Complementary measures (including reforms on rural credit cooperatives) must be taken to ensure the poor’s access to credit—which is a topic of more in-depth analysis.
c. A broader reform agenda must be designed and implemented including liberalization of interest rates and development of domestic bond market. Currently, government caps on interest rates makes lending rates artificially low, which in turn creates excess demand for credit and rent seeking, in which projects that contribute to local government revenue or favored clients are given priority. The commercialization of banks can hardly be effective without freer interest rates (World Bank 2003). Recently, control on interest rate has been loosened to some extend. PBOC announced in mid-December 2003 that beginning on January 1, banks and urban credit co-operatives will be allowed to set lending rates at 1.7 times the central bank's basic, or benchmark rate (China Business Weekly, December 16, 2003). However, to have a well defined yield curve and to have better risk diversification, it is crucial to develop a deeper domestic bond market as many developing countries such as Korea and India did. See also Eichengreen 2004.16 More research is needed in this area.
In sum, China has made significant inroads in financial sector reforms but faces tough challenges. Risk in the financial sector arises from a higher level of non-performing loans which is still increasing. The State commercial banks are unlikely to be able to carry the current load of non-performing loans. To restore banks to solvency and profitability, not only is there need for an injection of new capital, there is also need for structural reform. The injection of capital is likely to be effective only if accompanied by structural and regulatory reforms in the banking system. Eliminating ambiguities in the objectives and performance measures of bank managers may not be possible “without a greater role for the private sector in bank ownership and operation”(World Bank, 2003).
Opening wider to foreign (and Hong Kong) bank entry and establishing new shareholding banks with private stakes are steps in the right direction. However, opening to foreign bank entry alone will not solve the abovementioned problems. It must be combined with drastic measures of restructuring the existing large state owned banks. One of the options is to breakup the existing large state banks into smaller commercial banks and allow qualified foreign banks to take a large controlling stake in them through Mergers and Acquisitions (M&A) (Wang 1997). This option is likely to achieve win-win situation by “killing two birds with one stone” –recapitalizing as well as restructuring.
China’s financial sector is at a critical juncture where opening or internationalization and restructuring (or privatization) can be combined to reinforce each other. Here implementing GATS agreement is made a positive driving force for domestic restructuring--fully consistent with the Government’s reform agenda. This is a unique opportunity for China and for
16 Eichengreen (2004) suggests that creating a benchmark government bond and a well-defined yield curve will help financial transparency, regulation, anti corruption, contract enforcement and competition.

22
multilateral development agencies to make a difference. It is hopeful that this opportunity will not be lost, provided that investment climate and governance continue to improve, and capacity for regulation and supervision continue to enhance.
7. Conclusions
The purpose of this paper is to investigate the relationship between the efficiency of domestic banks and foreign bank entry, and also to study possible role of the order of financial liberalization in this process. We focus on the banking sector of 30 countries for the period of 1995-2002. The BANKSCOPE database is our main data source.
The first issue that we investigate is how foreign bank openness differs from one country to another and whether foreign bank entry is related to the level of economic development. We also try to examine whether changes in the foreign bank share are significant determinant of domestic banks’ performance indicators such as the net interest margin, non-interest income, profits, overhead costs, and loan loss reserves. Finally, we check how these results change when countries are grouped according to the sequence of their financial liberalization. Throughout our analyses, we control for other bank variables and macroeconomic indicators.
The descriptive statistics indicate that there is no specific relationship between the level of economic development and openness to foreign banks. When the foreign bank share is investigated at the country level, it can be seen that this share changes a lot among countries. When countries are grouped according to their sequence of financial liberalization such as domestic financial markets first, stock market first, or capital account first, it is observed that domestic banks’ net interest margin, non-interest income, overhead costs, and loan loss reserve get the lowest values in the countries liberalized their stock market first. This indicates that competition is well-established in these countries. The highest values of non-interest income, overhead costs, and loan loss reserves are in the Asian and Latin American countries which liberalized their domestic financial markets first. Despite differences in the performance indicators among the groups, the foreign bank share does not change a lot. But it is considerably higher in the Asian and Latin American countries which liberalized either their stock market first or their capital accounts first.
The second set of results is based on regression analyses. They indicate that changes in the foreign bank share are not statistically significant in determining domestic banks’ performance indicators when all countries are pooled together. Then, the countries are grouped according to their order of financial liberalization and the same set of regressions is run for each group. Our results indicate that efficiency gains from foreign bank entry, in terms of lower profit and costs, are the highest in the countries which liberalized their stock market first. The weakest relationship between the performance indicators and the foreign bank share is obtained for the countries which liberalized their capital account first.
We are planning to extend this study in a way to link poverty to the performance of banks. The increased competition in the banking sector may have different effects on poverty. Firstly, the efficient development of the domestic banking sector is a key to the better economic growth performance which, in turn, determines the level of poverty. The second possibility is that rising competition among banks may hurt the poor especially in the short run. For example, credit rationing may increase along with competition. In this case, the poor, especially the ones living in rural areas, may not have an access to credit.

23
APPENDIX – Definitions
A1. Bank Variables
The source of all these variables is the BANKSCOPE data base. The time series of the variables at the country level are obtained by taking bank-level averages in each country.
Net interest Margin (in percent of total assets): The net interest income as a percentage of total assets. The higher the ratio the cheaper the funding or the higher the margin the bank is obtaining. It is an indicator of the operational performance.
Non-interest income (in percent of total assets): It is the ratio of other operating income to total assets. It is an indicator of the operational performance. It indicates to what extent fees and other income represent a greater percentage of earnings of banks. The higher this ratio is the better.
Pre-tax operation income (in percent of total assets): The ratio of profit before tax to total assets.
Overhead Costs (in percent of total assets): It is a measure of efficiency. It is an indicator of the quality of operations.
Loan Loss Provision (in percent of total assets): Loan loss provision in percent of total assets. It is an indicator of asset quality. Ideally this ratio should be low.
Equity (in percent of total assets): As equity is a cushion against asset malfunction, this ratio measures the amount of protection afforded to the bank by the equity they invested in it. The higher this ratio the more protected is the bank.
Non-interest assets (in percent of total assets): The ratio of non-interest earning assets to total assets.
Customer and short term funds (in percent of total assets): This is the ratio of deposits to total assets. It indicates liquidity of banks.
Tax rate: It is the ratio of taxes paid to profit before tax.
Foreign bank share: The ratio of total assets of foreign banks to total assets in the banking sector.

24
A2. Macroeconomic Variables
The source of each macroeconomic variable is World Development Indicators published by World
Bank.
GDP per capita (constant LCU): GDP per capita is gross domestic product divided by midyear population. GDP is the sum of gross value added by all resident producers in the economy plus any product taxes and minus any subsidies not included in the value of the products. It is calculated without making deductions for depreciation of fabricated assets or for depletion and degradation of natural resources.
GDP growth (annual %): Annual percentage growth rate of GDP at market prices based on constant local currency. Aggregates are based on constant 1995 U.S. dollars. GDP is the sum of gross value added by all resident producers in the economy plus any product taxes and minus any subsidies not included in the value of the products. It is calculated without making deductions for depreciation of fabricated assets or for depletion and degradation of natural resources.
Inflation, consumer prices (annual %): Inflation as measured by the consumer price index reflects the annual percentage change in the cost to the average consumer of acquiring a fixed basket of goods and services.
Real interest rate (%): Real interest rate is the lending interest rate adjusted for inflation as measured by the GDP deflator.
Domestic credit provided by banking sector (% of GDP): Domestic credit provided by the banking sector includes all credit to various sectors on a gross basis, with the exception of credit to the central government, which is net. The banking sector includes monetary authorities and deposit money banks, as well as other banking institutions where data are available (including institutions that do not accept transferable deposits but do incur such liabilities as time and savings deposits). A3. Definition of Liberalization
The liberalization process is defined as follows by Kaminsky and Schmukler (2003). Liberalization of domestic financial sector: They evaluate the regulations on deposit interest rates, lending interest rates, allocation of credit, and foreign-currency deposits (Kaminsky and Schmukler, 2003 p.6). Liberalization of capital account: They evaluate the regulations on offshore borrowing by domestic financial institutions, offshore borrowing by non-financial corporations, multiple exchange rate markets, and controls on capital outflows (Kaminsky and Schmukler, 2003 p.6). Liberalization of stock market: They analyze the evolution of regulations on the acquisition of shares in the domestic stock market by foreigners, repatriation of capital, and repatriation of interest and dividends (Kaminsky and Schmukler, 2003 p.7).

25
References Agenor, Pierre-Richard, 2001, “Benefits and Costs of International Financial Integration: theory and
Facts,” unpublished paper (March 19).
Alper, C. Emre and Ziya Onis, 2002, “Soft Budget Constraints, Government Ownership of Banks and Regulatory Failure: The Political Economy of the Turkish Banking System in the Post-Capital Account Liberalization Era,” Bogazici University Working Paper No. 02-02.
Barth, James R., Gerard Caprio, Jr., and Ross Levine, 2000, “Banking systems around the Globe: Do Regulation and Ownership affect performance and stability?” World Bank Working Paper No. 2325 (April).
Barth, James R., Gerard Caprio, Jr. and Ross Levine, 2001, “Bank Regulation and Supervision: What Works Best?” Policy Research Working Paper 2725, World Bank (November).
Bhattasali, Deepak, 2004. Accelerating Financial Market Restructuring in China,” chapter 11 in Bhattasali, Li and Martin 2004, Eds, China and the WTO: Accession, Policy Reform, and Poverty Reduction Strategies, Oxford University Press.
Bird, Graham and Ramkishen S. Rajan (2001) “Banks, Financial Liberalization and Financial Crises in Emerging Markets,” the World Economy, Vol. 24. No.7 pp. 889-910 (July).
Boyreau-Debray, Genevieve, 2003, “Financial Intermediation and Growth: Chinese Style,” World Bank Working Paper No. 3027 (April).
Cho, Yoon Je, 1999, “Financial Crisis of Korea: A Consequence of Unbalanced Liberalization,” Sogang University WP No: 99-02 (February).
Clarke, George, Robert Cull, Laura D’Amato, and Andrea Molinari, 1999, “The effect of foreign entry on Argentina’s domestic banking sector,” World Bank Working Paper No. 2158 (August).
Clarke, George, Robert Cull, and Maria Soledad Martinez Peria, 2001, “Does Foreign Bank Penetration Reduce Access to Credit in Developing Countries? Evidence from Asking Borrowers,” World Bank Working Paper No. 2716 (November).
Clarke, George, Robert Cull, Maria Soledad Martinez Peria, and Susana M. Sanchez, 2003, “Foreign Bank Entry: Experience, Implications for Developing Economies, and Agenda for Further Research,” The World Bank Research Observer, Vol. 18, No.1, pp. 25-59 (Spring).
Claessens, Stijn, Asli Demirguc-Kunt, and Harry Huizinga, 1998, “How Does Foreign Entry affect the domestic banking sector?” World Bank Working Paper No: 1918 (June).
Claessens, Stijn and Tom Glaessner, 1998, “Internationalization of Financial Services in Asia,” World Bank Working Paper, No. 1911 (April).
Clarke, George R., Robert Cull, and Maria Soledad Martinez Peria, 2001, “Does Foreign Bank Penetration Reduce Access to Credit in Developing Countries? Evidence from Asking Borrowers,” Policy Research Working Paper 2716, World Bank (November).
Crystal, Jennifer S., B. Gerard Dages, and Linda S. Goldberg, 2001, “Does foreign ownership contribute to sounder banks? The Latin American experience,” in R. Litan, M. Pomerleano, and P. Masson, eds., Open Doors: Foreign Participation in Emerging Financial Systems, 217-66.
Demirguc-Kunt, Asli and Detragiache, 1998, “Financial Liberalization and Financial Fragility,” World Bank Working Paper No. 1917 (May).
Demirguc-Kunt, Asli and H. Huizinga, 1999, “Determinants of Commercial Bank Interest Margins and Profitability: Some International Evidence,” World Bank Economic Review, Vol. 13, No. 2, (May).
Demirguc-Kunt, Asli, Ross Levine, and Hong-Ghi Min (1998) “Opening to Foreign Banks: Issues of Stability, Efficiency, and Growth,” in Proceedings of the Bank of Korea Conference on the Implications of Globalization of World Financial Markets (December).

26
Denizer, Cevdet A., 1997, “The Effects of Financial Liberalization and New Bank Entry on Market Structure and Competition in Turkey,” the World Bank WP No: 1839 (November).
Denizer, Cevdet A., 2000, “Foreign Entry in Turkey’s Banking Sector: 1980-97,” the World Bank WP No: 2462 (October).
Denizer, Cevdet A., Mustafa Dinc, and Murat Tarimcilar (2000) “Measuring Banking Effficiency in the Pre- and Post- Liberalization Environment: Evidence from the Turkish Banking System,” the World Bank WP No: 2476 (November).
Dobson, Wendy, 2003, “Finances Services and International Trade Agreements: the Development Dimension,” unpublished draft (August).
Erda, Sait (2001) “ Turkish Banking” JP Morgan Equity Research (March).
Esen, Oguz (2000) “Financial Openness in Turkey,” International review of applied economics, vol. 14, no.1 pp. 5-23.
Fethi, Meryem D., Peter M. Jackson, and Thomas Weyman-Jones (2001) “An Empirical Study of Stochastic DEA and Financial Performance: The Case of the Turkish Commercial Banking Industry,” unpublished paper (June).
Goldberg, Linda, B. Gerard Dages, and Daniel Kinney (2000) “Foreign and Domestic Bank Participation in Emerging Markets: Lessons from Mexico and Argentina,” NBER Working Paper No. 7714 (May).
Hasan, Iftekhar and Katherin Marton, 2000, “Development and Efficiency of the Banking Sector in a Transitional Economy: Hungarian Experience,” Bank of Finland Institute for Economies in Transition, BOFIT Discussion Papers No.7.
Hellmann, Thomas, Kevin Murdock, and Joseph Stiglitz, 2000, “Liberalization, Moral Hazard in Banking and Prudential Regulation: Are Capital Requirements Enough?” American Economic Review, Vol. 90, No.1, pp. 147-165.
Holz, Carsten and Zhu, Tian (2000) Banking and Enterprise Reform in the People’s Republic of China after the Asian Financial Crisis: An Appraisal
Hwang, Sang In and In-Sok Shin, 2000, “The Liberalization of Banking Sector in Korea: Impact on the Korean Economy,” Working Paper, KIEP, Seoul, Korea.
IMF, 1998, “Turkey: Recent Economic Developments and Selected Issues,” IMF Staff Country Report No. 98/104 (September).
IMF, 2001, “Turkey: Sixth and Seventh Reviews under the Stand-by Arrangements: Staff Supplements; and Press Release on the Executive Board Discussion,” IMF Country Report No 01/89 (June).
IMF, 2002, “Turkey: Statistical Appendix,” IMF Country Report No. 02/138 (July).
IMF, 2003. “Turkey: fifth Review under the Stand-by Arrangements,” IMF Country Report No. 03/324 (October).
Isik, Ihsan and M. Kabir Hassan, 2003, “Financial Deregulation and Total Factor Productivity Change: An Empirical Study of Turkish Commercial Banks,” Journal of Banking and Finance, vol. 27. pp: 1455-1485.
Jin, Liqun (2002), China: One Year into the WTO Process, A Speech at the World Bank.
Johnston, R. Barry, 1998, “Sequencing Capital Account Liberalizations and Financial Sector Reform,” IMF Working Paper No: PPAA/98/8 (July).
Johnston B., S.M. Darbar, and C. Echeverria (1997) “Sequencing CA liberalization: lesson from the experiences in Chile, Indonesia, Korea, and Thailand,” IMF WP no: 157 (November).
Kaminsky, Graciela L. and Sergio L. Schmukler, 2003, “Short-Run Pain, Long-Run Gain: The Effects of Financial Liberalization,” NBER Working Paper No. 9787 (June).

27
Kireyev, Alexei, 2002, “Liberalization of Trade in Financial Services and Financial Sector Stability,” IMF Working Paper, No: WP/02/139 (August).
Lardy, Nicholas R. (1998) China’s Unfinished Economic Revolution, Washington DC. Brookings Institution Press
Lardy, Nicholas R., 2001, “Foreign financial firms in Asia,” Chapter 9.
Levine, Ross, 1996, “Foreign Banks, Financial Development and Economic Growth,” in Claude E. Barfield, ed. International Financial Markets: Harmonization versus Competition. Washington D.C.: AEI Press.
Lin, Justin Yifu, 2001, “WTO accession and Financial Reform in China,” Cato Journal, vol. 21, no. 1, pp. 13-18 (spring/summer).
Liu, Li-Gang, 2002, “Sequencing Banking Sector Reforms in the People’s Republic of China after the WTO: Options and Strategies,” unpublished paper.
Lo, Wai Chung (2001), A Retrospect on China’s Banking Reform, The Chinese Economy, vol. 34, No. 1, January—February 2001, pp. 15-28.
Mattoo, Aaditya, 1999, “Financial services and the WTO: liberalization commitments of developing and transition economies,” Worldbank Trade Research Report, pp:351-386.
Matto, Aaditya (2002) China’s Accession To The WTO: The Services Dimension, World Bank
McKinnon, Ronald I., 1991, The Order of Economic Liberalization, The Johns Hopkins University Press, Baltimore and London.
Scott, David 2002. “Finance for Growth in China: Improving Access to Finance for Firms.” Paper presented at the China Investment Climate Conference, Beijing.
Shin, Inseok and Yunjomg Wang, 1999, “How to Sequence Capital Market Liberalization: Lessons from the Korean Experience,” Korea Institute for International Economic Policy WP No: 1999.12.
Sina Finance, News (2003 December 29) http://news.sina.com.cn
Transition to a Market Economy, Second Edition, Baltimore and London: The Johns Hopkins University Press.
Tong, Donald D. (2002) The Heart of Economic Reform—China’s Banking Reform and State Enterprise Restructuring, Ashgate Publishing Limited.
Wang, Yan (1997). “Transforming Specialized Banks to Commercial Banks via Foreign Direct Investment: Feasibility in Guangzhou”, a paper presented in 1996 in China and published in Chun Zhang, Decheng Zheng and Yijiang Wang, editors, Bank-Enterprise Reforms and Strategies to Develop Regional Financial Centers, China Economic Press, 1997.
Wang, Yan, 2002, “Banking Sector Openness and Risk Management: Lessons from Emerging Markets and Implications to China,” unpublished paper.
Wang, Yan and Yudong Yao (2003). “Sources of China’s Economic Growth 1952-1999 Incorporating Human Capital Accumulation.” China Economic Review 14(2003) 32-52.
World Bank, 2001, Finance for Growth: Policy Choices in a Volatile World, Washington, D.C.
World Bank, 2002, Global Development Finance, Washington, D.C.
World Bank, 2003, China: Promoting Growth with Equity, Country Economic Memorandum. Report no. 24169-CHA. October 15, 2003.
Xu, Dianqing (2003) The Reason Behind the Dramatic Increase in Outstanding Loans
Yi, Gang (1994), Money, Banking, and Financial Markets in China, Boulder, CO: Westview Press
Zoli, Edda, 2001, “Cost and Effectiveness of Banking Sector Restructuring in Transition Economies,” IMF WP N: WP/01/157.

28
Figure 1 - Foreign Bank Share and Income (averages over 1995-2002)
0
10
20
30
40
50
60
2.5 3 3.5 4 4.5 5
Log of GDP per capita (constatnt 1995 $US)
Asse
t sha
re o
f for
eign
ban
ks (i
n %
of t
otal
ass
ets) Correlation coefficient = 0.00025
Source: World Development Indicators and BANKSCOPE.

Asset share of foreign banks (in % of total assets)
Net margin/ta
Non-interest income/ta
Before tax profits/ta Overhead/ta
Loan loss reserve/ta Net margin/ta
Non-interest income/ta
Before tax profits/ta Overhead/ta
Loan loss reserve/ta
Argentina 19.9 3.5 3.4 -0.7 4.6 1.9 3.7 3.0 -0.4 4.7 1.8Brazil 8.3 6.6 2.0 1.1 6.9 1.2 3.8 7.5 0.6 10.5 1.2Canada 16.8 2.1 1.5 1.0 2.4 0.2 2.0 2.0 1.1 2.6 0.3Chile 20.0 4.2 0.8 1.0 3.1 0.7 2.4 0.8 0.8 1.9 0.6China 0.2 1.2 0.0 1.7 0.7 0.1 1.7 0.1 0.5 1.0 0.3Colombia 16.8 6.3 5.6 0.7 8.9 1.8 4.4 4.8 1.3 6.1 1.4Denmark 14.0 1.7 0.5 1.3 1.5 0.2 1.4 0.3 0.9 1.0 0.1Finland 0.4 3.1 19.8 16.8 5.6 0.7 2.0 1.2 1.0 1.9 0.2France 15.0 1.0 1.0 0.5 1.4 0.2 1.1 1.0 0.5 1.5 0.2Germany 3.0 1.4 0.6 0.4 1.2 0.3 1.3 0.4 0.5 1.0 0.2Hong Kong, China 61.3 0.5 0.2 0.2 0.3 0.2 0.5 1.3 1.3 0.3 0.0Indonesia 12.2 3.0 1.2 1.7 2.1 0.4 1.7 3.7 0.9 3.8 0.5Ireland 29.9 0.4 0.3 0.5 0.2 0.0 0.5 0.7 0.5 0.7 0.0Italy 4.6 2.2 0.8 0.8 1.7 0.5 2.3 1.1 0.8 2.4 0.4Japan 2.6 0.9 0.2 -0.4 0.8 1.4 1.3 0.5 -0.1 1.0 0.9Korea, Rep. 5.2 1.7 1.1 -0.2 1.6 1.7 1.6 0.9 0.0 1.5 1.0Malaysia 15.5 2.9 1.1 1.6 1.5 0.8 2.0 0.6 0.8 1.0 0.8Mexico 40.7 5.8 2.0 0.9 5.3 2.0 1.9 0.8 0.0 2.5 1.1Norway 16.4 2.2 0.9 1.1 2.0 0.1 2.1 0.6 1.2 1.4 0.1Peru 35.9 6.2 2.5 1.5 5.7 1.9 2.8 0.9 0.6 2.9 0.6Philippines 7.1 3.6 2.2 0.3 4.7 1.0 2.6 1.4 1.0 2.6 0.5Portugal 28.1 1.7 0.9 0.6 1.6 0.3 1.6 1.0 0.7 1.6 0.3Spain 6.6 2.2 1.1 0.7 2.4 0.2 2.5 0.8 1.3 1.8 0.2Sweden 0.5 9.3 0.5 6.9 5.3 0.0 1.8 0.7 1.3 1.1 0.2Taiwan, China 3.6 2.6 0.8 0.6 1.9 1.1 1.9 0.4 0.8 1.1 0.5Thailand 5.8 1.8 0.6 -2.6 2.3 1.8 3.4 0.9 -0.6 3.4 1.3Turkey 5.1 8.5 5.4 4.6 8.2 0.3 4.1 5.8 1.5 7.4 0.9United Kingdom 29.1 0.2 1.0 0.3 0.8 0.0 0.6 0.6 0.4 0.8 0.1United States 7.5 1.8 1.2 0.7 2.1 0.2 2.7 2.7 1.6 3.3 0.4Venezuela 23.2 11.5 2.4 3.6 8.6 1.5 6.8 1.7 2.4 5.5 0.8
Table 1: Performance Indicators at Country Level, 1995-2002(average, in percent)
FOREIGN BANKS DOMESTIC BANKS
Source: Authors' calculations using data from BANKSCOPE.

Asset share of foreign banks (in % of total
assets)
Number of foreign banks as a share of total number
of banksChina 0.2 Japan 1.7Finland 0.4 Taiwan, China 3.7Sweden 0.5 Korea, Rep. 5.6Japan 2.6 Italy 6.0Germany 3.0 Germany 6.6Taiwan, China 3.6 China 8.6Italy 4.6 Sweden 8.7Turkey 5.1 Finland 9.9Korea, Rep. 5.2 Denmark 10.6Thailand 5.8 United States 11.8Spain 6.6 Turkey 13.3Philippines 7.1 Spain 14.6United States 7.5 Norway 14.9Brazil 8.3 Venezuela, RB 15.0Indonesia 12.3 Malaysia 17.4Denmark 14.0 Colombia 17.5France 15.0 Philippines 18.7Malaysia 15.5 France 19.8Norway 16.4 Brazil 21.3Canada 16.8 Chile 23.5Colombia 16.8 Mexico 24.1Argentina 17.4 Thailand 24.4Chile 20.0 Argentina 25.0Venezuela, RB 23.2 Canada 30.0United Kingdom 25.5 Portugal 30.1Portugal 28.1 United Kingdom 34.3Ireland 29.9 Indonesia 35.4Peru 35.9 Peru 37.2Mexico 40.7 Hong Kong, China 44.2Hong Kong, China 61.3 Ireland 61.7
Table 2: Ranking of countries according to the share of foreign banks
Source: Authors' calculations using data from BANKSCOPE.

31
Table 3: List of Countries Economies that Liberalized Stock Market First
Canada Denmark
France Germany
Hong Kong, China Italy
Malaysia Portugal Spain
United Kingdom United States
Economies that Liberalized Domestic Financial Market First
Argentina Brazil Chile Colombia Indonesia Ireland Korea Norway Peru
Taiwan, China Turkey Countries Liberalized Capital Account First
Finland Japan Mexico Philippines Thailand Venezuela
Other Countries: China
Note: The classification of countries is based on Kaminsky and Schmukler (2003) except China and Turkey.

Number of countries
Foreign bank asset
shareNet
margin/taNon-interest
income/taBefore tax profits/ta Overhead/ta
Loan loss reserve/ta
All countries 29 15.2 2.3 1.6 0.8 2.6 0.6
Countries Liberalized Domestic Financial Market First 11 15.8 2.6 2.7 0.7 3.8 0.8
Asian and Latin American Countries 9 14.1 2.9 3.1 0.7 4.4 0.9
European and G7 Countries 2 23.2 1.3 0.6 0.8 1.1 0.1
Countries Liberalized Stock Market First 12 16.8 1.7 1.0 0.9 1.5 0.3
Asian and Latin American Countries 2 38.4 1.3 0.9 1.0 0.7 0.4
European and G7 Countries 10 12.5 1.8 1.1 0.9 1.7 0.2
Countries Liberalized Capital Account First 6 13.3 3.0 1.1 0.6 2.8 0.8
Asian and Latin American Countries 4 19.2 3.7 1.2 0.7 3.5 0.9
European and G7 Countries 2 1.5 1.6 0.8 0.4 1.4 0.5
(Average, in percent)Table 4: Performance Indicators of Domestic Banks, 1995-2002
Source: Authors' calculation using data from BANKSCOPE.
Note: China is not included in the analysis since the financial liberalization process was not completed as of 2002 in this country.

Change in net
margin/ta
Change in Non-interest
income/ta
Change in before tax profits/ta
Change in overhead/ta
Change in loan loss reserve/ta
Change in foreign bank asset share 0.016 -0.039 -0.020 0.020 0.027(0.703) (-1.454) (-0.739) (0.753) (1.020)
Change in equity/ta 0.139** -0.075 0.148** 0.191** -0.106**(2.174) (-1.037) (2.559) (2.083) (-2.328)
Change in non earning assets/ta -0.016 -0.009 -0.009 -0.031 0.008(-1.252) (-0.601) (-0.734) (-1.225) (0.858)
Change in customer and ST funds/ta 0.004 -0.014 0.014 0.009 0.002(0.154) (-0.527) (0.446) (0.316) (0.134)
Change in overhead/ta 0.351** 0.5779*** 0.115 -0.024(1.955) (3.252) (0.990) (-0.343)
Change in Tax/pre-tax profit 0.002** -0.002** 0.001** 0.000 0.000(2.223) (-1.872) (1.955) (0.480) (-0.254)
Change in GDP per capita 0.000 0.000 0.000 -0.013 -0.000**(1.014) (-1.315) (0.656) (-0.553) (-2.445)
Change in GDP growth 0.014 0.024 0.045 0.035 -0.037**(0.834) (1.389) (1.597) (1.307) (-2.379)
Change in inflation 0.070*** 0.009 0.026 -0.016 0.029**(3.230) (0.582) (0.581) (-0.638) (2.033)
Change in real interest rate 0.016 -0.013 0.002 -0.006 0.019**(1.037) (-0.917) (0.147) (-0.970) (2.249)
Change in domestic credit by banking sector/GDP -0.009** 0.003 -0.024 1.083** 0.006(-2.308) (0.473) (-1.556) (2.751) (1.411)
R2 0.578 0.655 0.331 0.456 0.303Adjusted R2 0.437 0.540 0.108 0.281 0.066No. of obs 173 173 173 173 170No of countries 27 27 27 27 27Mean of dependent variable -0.120 -0.003 -0.066 -0.098 -0.007
(all countries)(OLS estimation with country and year dummies, heteroskedasticity corrected standard errors)
Table 5: Determinants of Bank Profitability and Efficiency
Note: The data are for domestic banks only for the period 1995-2002. The estimation technique is OLS with heteroscedasticity-corrected standard errors. Fixed effects are also included to remove country effects. Turkey and Taiwan, China are not included due to lack of data points and China is not included since she has not completed her financial liberalization process yet. Panel data used in this study are calculated by taking averages of bank-level series in each year for each country. t-statistics are reported below estimated coefficient values. *,**, and *** indicate 10 percent, 5 percent, and 1 percent significance levels successively.

34
Change in net
margin/ta
Change in Non-interest
income/ta
Change in before tax profits/ta
Change in overhead/ta
Change in loan loss reserve/ta
Change in foreign bank asset share -0.038** -0.063** -0.060** 0.000 -0.007(-2.711) (-2.680) (-2.257) (-0.044) (-0.818)
Change in equity/ta -0.019 0.104* 0.090 -0.004 0.027(-0.590) (1.616) (1.300) (-0.188) (1.493)
Change in non earning assets/ta -0.022* -0.005 -0.009 -0.017 -0.001(-1.775) (-0.542) (-0.517) (-0.972) (-0.181)
Change in customer and ST funds/ta 0.029*** -0.072*** -0.035* -0.022** 0.008(2.904) (-4.063) (-1.758) (-2.664) (1.162)
Change in overhead/ta 0.408** 0.661*** 0.321 -0.044(2.622) (4.303) (1.442) (-0.612)
Change in Tax/pre-tax profit -0.002 0.006 0.003 0.000*** 0.000(-0.914) (1.571) (0.799) (2.911) (-0.277)
Change in GDP per capita 0.000 0.000 -0.000** 0.018 0.000**(0.811) (-1.349) (-1.915) (1.431) (2.196)
Change in GDP growth 0.021** -0.009 0.058** 0.004 -0.043***(1.937) (-0.491) (2.893) (0.163) (-5.167)
Change in inflation 0.043 -0.019 -0.073 0.005 -0.009(1.164) (-0.320) (-1.093) (0.574) (-0.477)
Change in real interest rate 0.006 0.008 -0.004 0.000 0.011(0.593) (0.497) (-0.241) (0.240) (1.212)
Change in domestic credit by banking sector/GDP -0.001 -0.005** -0.004 0.241** 0.001(-1.179) (-1.927) (-1.294) (2.653) (0.583)
R2 0.708 0.854 0.688 0.441 0.732Adjusted R2 0.526 0.764 0.494 0.113 0.553No. of obs 74 74 74 74 71No of countries 12 12 12 12 12Mean of dependent variable -0.066 0.046 -0.013 -0.022 0.006
(countries liberalized stock market first)(OLS estimation with country and year dummies, heteroskedasticity corrected standard errors)
Table 6: Determinants of Bank Profitability and Efficiency
Note: The data are for domestic banks only for the period 1995-2002. The estimation technique is OLS with heteroscedasticity-corrected standard errors. Fixed effects are also included to remove country effects. Turkey and Taiwan, China are not included due to lack of data points and China is not included since she has not completed her financial liberalization process yet. Panel data used in this study are calculated by taking averages of bank-level series in each year for each country. t-statistics are reported below estimated coefficient values. *,**, and *** indicate 10 percent, 5 percent, and 1 percent significance levels successively.
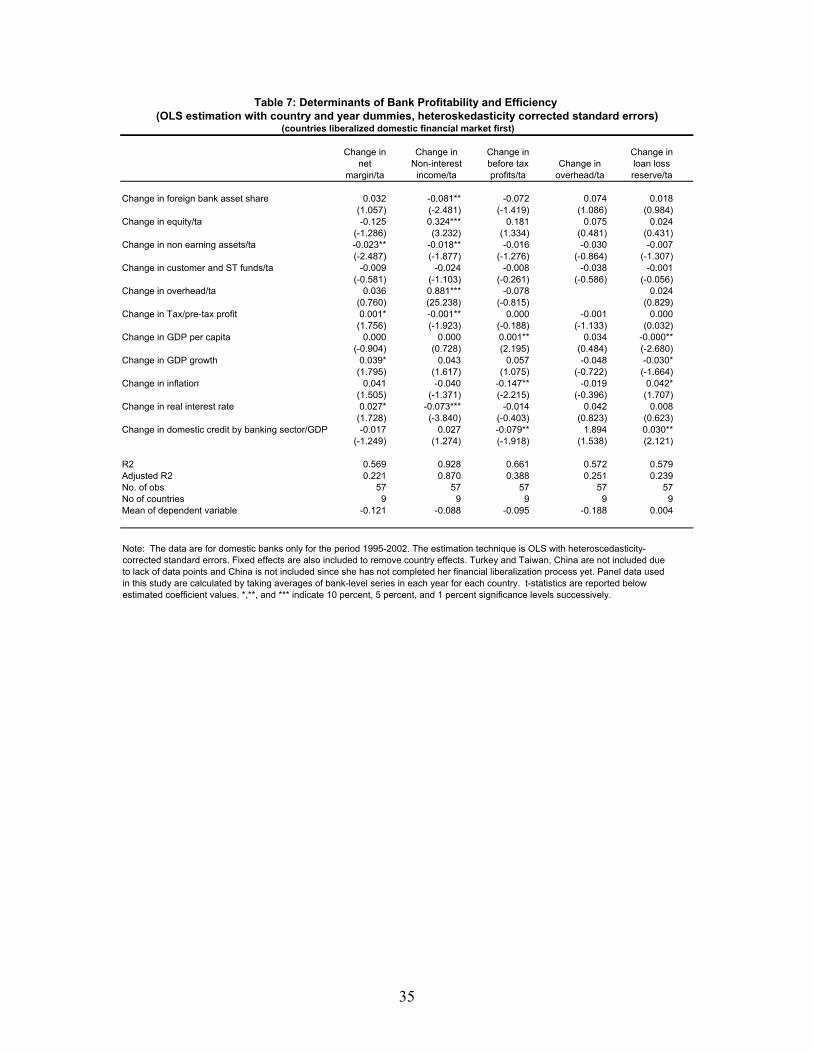
35
Change in net
margin/ta
Change in Non-interest
income/ta
Change in before tax profits/ta
Change in overhead/ta
Change in loan loss reserve/ta
Change in foreign bank asset share 0.032 -0.081** -0.072 0.074 0.018(1.057) (-2.481) (-1.419) (1.086) (0.984)
Change in equity/ta -0.125 0.324*** 0.181 0.075 0.024(-1.286) (3.232) (1.334) (0.481) (0.431)
Change in non earning assets/ta -0.023** -0.018** -0.016 -0.030 -0.007(-2.487) (-1.877) (-1.276) (-0.864) (-1.307)
Change in customer and ST funds/ta -0.009 -0.024 -0.008 -0.038 -0.001(-0.581) (-1.103) (-0.261) (-0.586) (-0.056)
Change in overhead/ta 0.036 0.881*** -0.078 0.024(0.760) (25.238) (-0.815) (0.829)
Change in Tax/pre-tax profit 0.001* -0.001** 0.000 -0.001 0.000(1.756) (-1.923) (-0.188) (-1.133) (0.032)
Change in GDP per capita 0.000 0.000 0.001** 0.034 -0.000**(-0.904) (0.728) (2.195) (0.484) (-2.680)
Change in GDP growth 0.039* 0.043 0.057 -0.048 -0.030*(1.795) (1.617) (1.075) (-0.722) (-1.664)
Change in inflation 0.041 -0.040 -0.147** -0.019 0.042*(1.505) (-1.371) (-2.215) (-0.396) (1.707)
Change in real interest rate 0.027* -0.073*** -0.014 0.042 0.008(1.728) (-3.840) (-0.403) (0.823) (0.623)
Change in domestic credit by banking sector/GDP -0.017 0.027 -0.079** 1.894 0.030**(-1.249) (1.274) (-1.918) (1.538) (2.121)
R2 0.569 0.928 0.661 0.572 0.579Adjusted R2 0.221 0.870 0.388 0.251 0.239No. of obs 57 57 57 57 57No of countries 9 9 9 9 9Mean of dependent variable -0.121 -0.088 -0.095 -0.188 0.004
(countries liberalized domestic financial market first)(OLS estimation with country and year dummies, heteroskedasticity corrected standard errors)
Table 7: Determinants of Bank Profitability and Efficiency
Note: The data are for domestic banks only for the period 1995-2002. The estimation technique is OLS with heteroscedasticity-corrected standard errors. Fixed effects are also included to remove country effects. Turkey and Taiwan, China are not included due to lack of data points and China is not included since she has not completed her financial liberalization process yet. Panel data used in this study are calculated by taking averages of bank-level series in each year for each country. t-statistics are reported below estimated coefficient values. *,**, and *** indicate 10 percent, 5 percent, and 1 percent significance levels successively.

36
Change in net
margin/ta
Change in Non-interest
income/ta
Change in before tax profits/ta
Change in overhead/ta
Change in loan loss reserve/ta
Change in foreign bank asset share -0.047 0.024 -0.027 0.122* 0.095(-0.862) (1.133) (-0.415) (1.779) (1.633)
Change in equity/ta 0.148** -0.007 0.249*** 0.253** -0.212***(2.178) (-0.216) (3.081) (2.146) (-2.908)
Change in non earning assets/ta -0.036 -0.064 0.042 0.034 0.038(-0.472) (-1.505) (0.441) (0.240) (0.384)
Change in customer and ST funds/ta 0.047 0.008 0.083** 0.022 -0.060(1.143) (0.587) (2.221) (0.393) (-1.620)
Change in overhead/ta 0.816*** 0.037 0.184 -0.013(4.160) (0.689) (1.514) (-0.073)
Change in Tax/pre-tax profit 0.001 -0.002** 0.002 -0.001 -0.002(0.603) (-1.972) (1.244) (-1.079) (-0.781)
Change in GDP per capita 0.000 0.000 0.000 -0.128** 0.000(0.140) (0.644) (0.739) (-2.503) (0.132)
Change in GDP growth 0.047 -0.025 0.017 0.016 -0.042(1.221) (-1.264) (0.361) (0.586) (-0.918)
Change in inflation 0.047** 0.022** 0.040** -0.025 0.037**(2.024) (2.573) (2.331) (-1.152) (2.456)
Change in real interest rate 0.025 -0.016 0.005 -0.058* 0.026(0.801) (-1.372) (0.175) (-1.745) (1.191)
Change in domestic credit by banking sector/GDP -0.007 0.000 -0.021 2.025* 0.001(-0.370) (-0.025) (-0.824) (1.774) (0.042)
R2 0.846 0.851 0.730 0.654 0.565Adjusted R2 0.667 0.678 0.418 0.291 0.061No. of obs 42 42 42 42 42No of countries 6 6 6 6 6Mean of dependent variable -0.213 0.025 -0.119 -0.109 -0.043
(countries liberalized capital account first)(OLS estimation with country and year dummies, heteroskedasticity corrected standard errors)
Table 8: Determinants of Bank Profitability and Efficiency
Note: The data are for domestic banks only for the period 1995-2002. The estimation technique is OLS with heteroscedasticity-corrected standard errors. Fixed effects are also included to remove country effects. Turkey and Taiwan, China are not included due to lack of data points and China is not included since she has not completed her financial liberalization process yet. Panel data used in this study are calculated by taking averages of bank-level series in each year for each country. t-statistics are reported below estimated coefficient values. *,**, and *** indicate 10 percent, 5 percent, and 1 percent significance levels successively.

Change in net
margin/ta
Change in Non-interest
income/ta
Change in before tax profits/ta
Change in overhead/ta
Change in loan loss reserve/ta
Change in foreign bank asset share
Total 0.016 -0.039 -0.020 0.020 0.027(0.703) (-1.454) (-0.739) (0.753) (1.020)
Stock market liberalized first -0.038** -0.063** -0.060** 0.000 -0.007(-2.711) (-2.680) (-2.257) (-0.044) (-0.818)
Domestic financial markets liberalized first 0.032 -0.080** -0.072 0.074 0.018(1.057) (-2.481) (-1.419) (1.086) (0.984)
Capital account liberalized first -0.047 0.024 -0.027 0.122* 0.094(-0.862) (1.133) (-0.415) (1.779) (1.633)
(domestic banks)(OLS estimation with country and year dummies, heteroskedasticity corrected standard errors)
Table 9: Summary Table - Foreign Bank Share as a Determinant of Performance Indicators
DEPENDENT VARIABLES
Source: Tables 5 to 8, estimated coefficients of the foreign bank share.
Note: t-statistics are reported below estimated coefficient values. *,**, and *** indicate 10 percent, 5 percent, and 1 percent significance levels successively.

1999 2000 2001
State banks 4 4 3Private banks 28 27 22Foreign banks 22 19 17SDIF banks 8 11 9
Total 62 61 51
Table 10. Turkey: Number of Deposit Money Banks, 1999-2001
Source: IMF (2002, page 45)
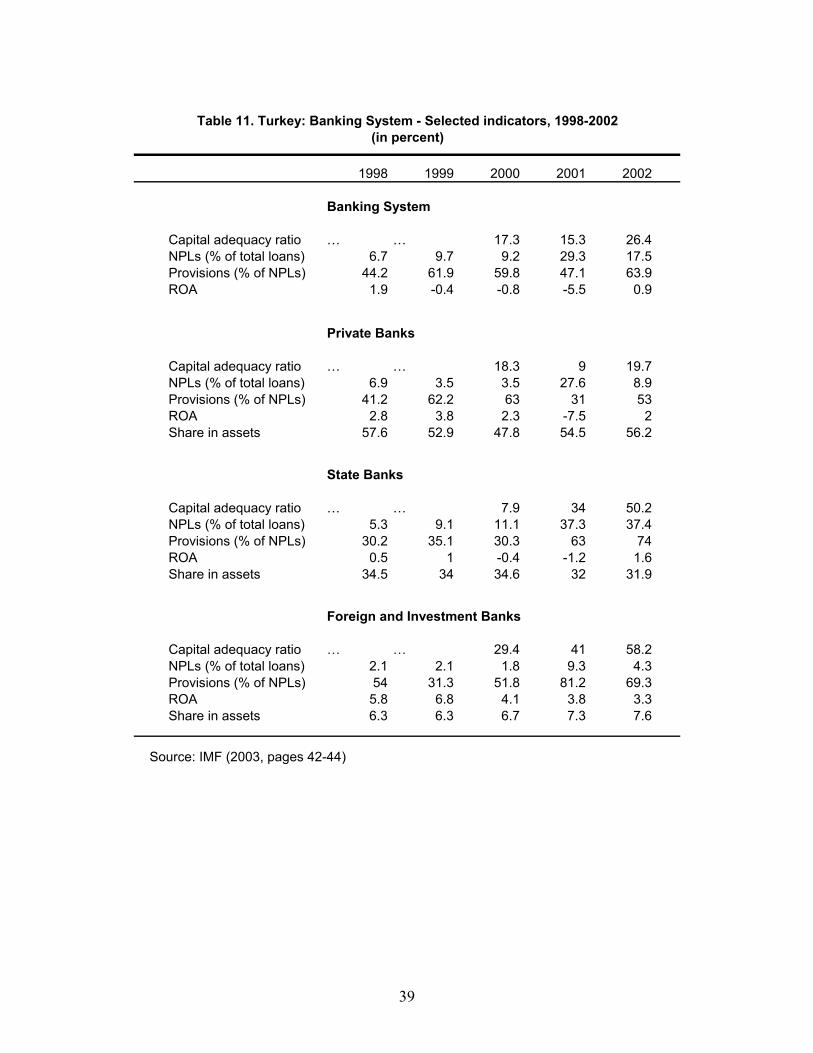
39
1998 1999 2000 2001 2002
Banking System
Capital adequacy ratio … … 17.3 15.3 26.4NPLs (% of total loans) 6.7 9.7 9.2 29.3 17.5Provisions (% of NPLs) 44.2 61.9 59.8 47.1 63.9ROA 1.9 -0.4 -0.8 -5.5 0.9
Private Banks
Capital adequacy ratio … … 18.3 9 19.7NPLs (% of total loans) 6.9 3.5 3.5 27.6 8.9Provisions (% of NPLs) 41.2 62.2 63 31 53ROA 2.8 3.8 2.3 -7.5 2Share in assets 57.6 52.9 47.8 54.5 56.2
State Banks
Capital adequacy ratio … … 7.9 34 50.2NPLs (% of total loans) 5.3 9.1 11.1 37.3 37.4Provisions (% of NPLs) 30.2 35.1 30.3 63 74ROA 0.5 1 -0.4 -1.2 1.6Share in assets 34.5 34 34.6 32 31.9
Foreign and Investment Banks
Capital adequacy ratio … … 29.4 41 58.2NPLs (% of total loans) 2.1 2.1 1.8 9.3 4.3Provisions (% of NPLs) 54 31.3 51.8 81.2 69.3ROA 5.8 6.8 4.1 3.8 3.3Share in assets 6.3 6.3 6.7 7.3 7.6
Table 11. Turkey: Banking System - Selected indicators, 1998-2002(in percent)
Source: IMF (2003, pages 42-44)

40
Table A1 - Liberalization dates (Ranking full liberalization) Country/Economy Capital Account Domestic Financial Sector Stock Market
Asia Hong Kong, China (2) Jan 73- (3) Aug 94p/May 00 (1) Pre 73- Indonesia (2) Jan 78p/Jan88-Feb91 (1) Jan 78p/Jan 83- (3) Dec88p/Aug89- Korea (2) Jan 93p/Jan96- (1) Jan88p/Jan95- (3) Jan91p/May98- Malaysia (3) Jun79p-Dec93
Sep94-Aug98 (2) Oct 78p-Sep85 Feb91- (1) July73/Jan 75p/84-Dec97
Philippines (1) Jan76p-Dec82 Jan94p-
(2) Jul81p/Dec82- (3) Mar 86p/Jan94-
Taiwan, China (2) Jan87p/Jan97 (1) Sep84p/Jul89- (3) Jan87p/Apr98- Thailand (1) Jan 79p-Dec81
Jan 92/Aug95p-Apr97 Jan98-
(3) Jun89p/Jun92- (2) Jan88p/Jan90-
Europe Denmark (3) Oct 88- (2) Jan73p-Jan75
Mar79p/Jan81- (1) Pre73-
Finland (1) Jan87p/Jun89- (3) Jan86p/Jan90- (2) Pre73p/Jan90- Ireland (3) Jan79p/Jan 92- (1) May85p/Feb86- (2) Pre 73p/Jan90- Norway (2) Jan 80p-Dec81
Jan 85p/Jan 88- (1) Jan79-Dec79 Sep85p/Jan88-
(3) Jan 84p/Jan89-
Portugal (3) Sep 89p/Aug 92- (2) Jan84p/Mar90- (1) Pre73-Dec75 Jan86-
Spain (2) Jan 75p/Jan80/Jun 88p/Dec92-
(3) Jan74p/Jan81- (1) Pre73-
Sweden (3) Jan84p/Jan89- (2) Jan78p/Jan85- (1) Pre 73p/Jan80- G-7 Canada (3) Pre73p/Mar75- (2) Pre73- (1) Pre73- France (3) Jun 85p/Jan 90- (2) Jan85- (1) Pre73- Germany (3) Pre 73p/Mar 81- (2) Pre73- (1) Pre73- Italy (3) May 87p/Jan 92- (2) Jan74-Dec74
Jan81- (1) Pre73-
Japan (1) Jan 79p/Jul80- (3) Jan 79p/Dec91- (2) Jan 85- United Kingdom (2) Oct 73p/Oct79- (3) Jan 81- (1) Pre 73- United States (2) Jul 73- (3) Pre 73p/Jan82- (1) Pre73- Latin America Argentina (2) Apr 76p/Dec 78-Mar 82
Dec 89- (1) Jan 77-Jun 82 Oct 87-
(3) Jan 77p-Mar82 Jan 89-
Brazil (3) Jan 90p-Dec 93 Mar 95p-
(1) Jan76-Dec78 Jan 88p/Jan89-
(2) Pre 73 p/Jun 91-
Chile (2) Jun 79p-Dec82 Apr 90/ Jun 91p/Sep 98-
(1) Jan 74p/May 75-Nov 82 Jan 84p/Jan85-
(3) Jan 87p/Jan92-
Colombia (2) Jan 91p/Sep 98- (1) Aug 74p/Sep 1980 – Dec 85 July 86-
(3) Jan 91p-
Mexico (1)Pre 73-Jul 82 Nov91-
(2) Jan 74p-Aug 82 Oct 88p/Apr 89-
(3) Jan 89p/Jan91-
Peru (2) Pre 73p-Dec86 Jan 91-
(1) Pre73p-Dec81 Jan 91-
(3) Jan 92-
Venezuela (1) Pre 73-Jan 83 Mar 89-Dec 93 Apr 96-
(3) Aug 81-Jan 84 Jan 89-Aug94 Apr 96-
(2) Jan 77 – Dec87 Jan 90 - Jun 93 Jun 95 -
Source: Kaminsky and Schmukler (2003) Table 1. Note: This table reports the dates of partial and full liberalization of financial markets. A country is considered to be partially liberalized if at least twp sectors are partially liberalized. Otherwise, the country is considered to be financially repressed. “-“ followed by a blank means that it covers the period until June 1999. Pre 73 (Pre 73 p) means that the sector is already fully (partially) liberalized at that time, with no significant measures taken at that date. The numbers given in parenthesis indicate the sequence of full financial liberalization.