forecasting marcellus productivity in new york - thomas g. (jerry) acton
DESCRIPTION
Thomas G. (Jerry) ActonB.S. Aeronautical Engineering, U.S. Naval AcademyM.S. Mechanical Engineering, North Carolina State UniversityFirst hired by IBM as a systems engineer and anti-submarine warfare expert, Acton worked for 31 years as a lead systems engineer and architecture, requirements, design and operational performance on a wide variety of large, complex military, government and commercial systems. (Retired)TRANSCRIPT

1
Forecasting
Marcellus Productivity
In New York
October 30, 2013
Jerry Acton Systems Engineer / Systems Architect, retired
Ithaca, 30 October 2013
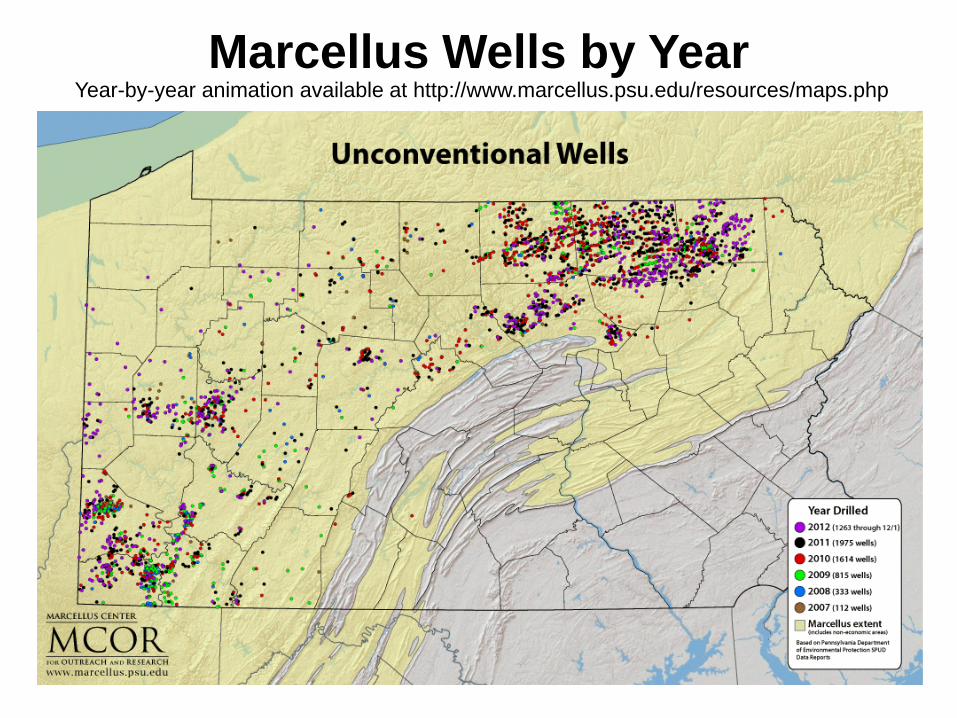
Marcellus Wells by Year Year-by-year animation available at http://www.marcellus.psu.edu/resources/maps.php

Marcellus Wells by Year
Bradford Potter McKean Tioga
Wyoming
Susquehanna
Study
Area Most Relevant
Year-by-year animation available at http://www.marcellus.psu.edu/resources/maps.php

4
Systems Engineering Approach
Project: NY
Identify: IP Patterns & Trends Maps & Graphs
All Data
Publicly Available
Identify: All Producing Horizontal Wells
Determine: Initial Production (IP)
Compute: County & Town IPs 81 Towns
1,540
4 Years 2009-2012 Download: Well Data
Select: Northern Tier PA Counties 6
PA DEP Oil & Gas Reporting Website

Production Decline Curve
Chesapeake Energy
Horizontal
Well
Marcellus
Fm.
Pennsylvania
IP

20.1%
30.1% 30.7%
19.1%
0%
5%
10%
15%
20%
25%
30%
35%
0-2 2.1-4 4.1-7 7.1+
Initial Production (mmcf/d)
Perc
en
t o
f W
ells
20%
30% 31%
19%
6
PA Gas Well Production Levels
6 Counties, 81 Towns, 1540 Wells
Median
4.0

Thickness, Depth, IPs
7
9.0 4.9 1.8 4.7 5.2 1.6 4.7 2.5 2.8 1.1 4.6 1.8 2.8 1.1 3.2 1.6 1.9 0.9 0.4 0.1 0.5 0.1 Well IP 7 5 4 6 # Wells
4.5 2.2 2.0 1.1 Average IP 4.7 1.8 2.4 1.1 Town IP
5500 5500 6500 5300 Depth 275 225 100 140 Thickness
Leroy Orwell Wharton Pleasant Town
Bradford Bradford Potter Potter County

430 37
23
# Producing
Wells
County Median IPs
& Producing Gas Wells
363
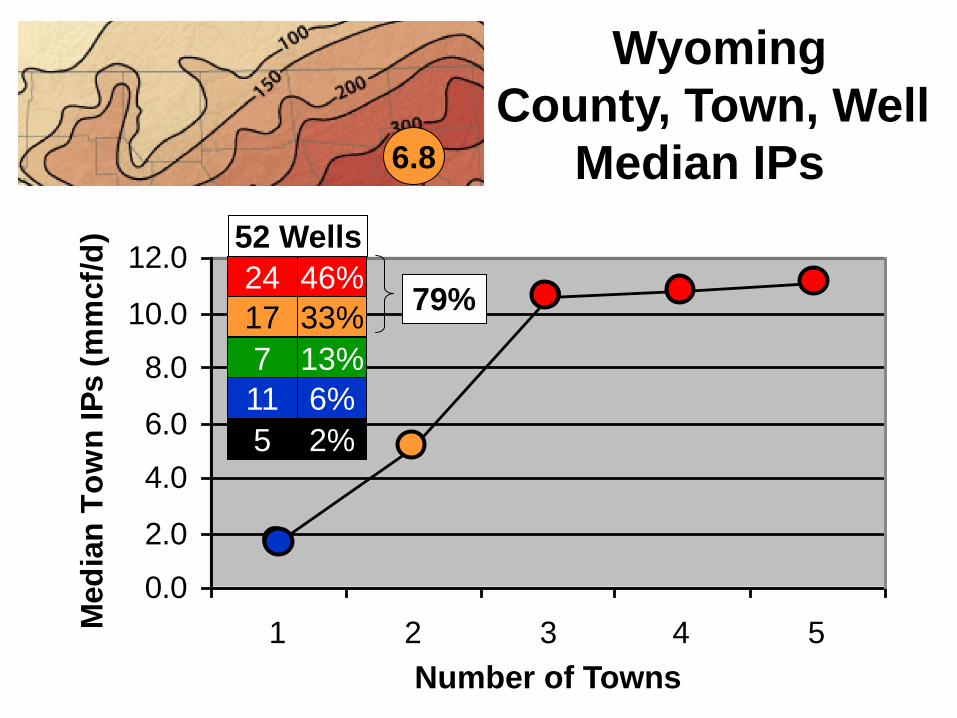
6.5
52 6.8
635
4.4 2.7 1.6 1.9
County-wide
Median IP (mmcf/d) #.#
0.0
2.0
4.0
6.0
8.0
10.0
12.0
1 2 3 4 5
Number of Towns
Med
ian
To
wn
IP
s (
mm
cf/
d)
79%
6.8
24
17
7
11
5
52 Wells
46%
33%
13%
6%
2%
Number of Towns
Wyoming
County, Town, Well
Median IPs

0.0
2.0
4.0
6.0
8.0
10.0
12.0
1 3 5 7 9 11 13 15
Number of Towns
Med
ian
To
wn
IP
s (
mm
cf/
d)
171
83
61
34
14
363 Wells
47%
23%
17%
9%
4%
70%
Susquehanna
County, Town, Well
Median IPs
6.5
Springville
Township
Highest Single Well
IP = 31 mmcf/d
Brooklyn Township
Highest Overall
Town IP = 12
Number of Towns

0.0
2.0
4.0
6.0
8.0
10.0
12.0
1 3 5 7 9 11 13 15 17 19 21 23 25 27 29 31
Number of Towns
Med
ian
To
wn
IP
s (
mm
cf/
d)
102
255
210
44
24
635 Wells
16%
40%
33%
7%
4%
56%
Bradford
County, Town, Well
Median IPs 4.4
Number of Towns
Troy Township
Highest # of Wells
94 IP=3.1

0.0
2.0
4.0
6.0
8.0
10.0
12.0
1 2 3 4 5 6 7 8 9 10 11 12 13 14 15 16 17 18
Number of Towns
Med
ian
To
wn
IP
s (
mm
cf/
d)
9
105
170
102
44
430 Wells
2%
24%
40%
24%
10%
22%
Tioga, PA
County, Town, Well
Median IPs 2.7
Number of Towns
34%

0.0
2.0
4.0
6.0
8.0
10.0
12.0
1 2 3 4 5 6 7
Number Towns
Med
ian
To
wn
IP
s (
mm
cf/
d)
0
0
9
17
11
37 Wells
0%
0%
24%
46%
30% 76%
Potter
County, Town, Well
Median IPs 1.6
Number of Towns

0.0
2.0
4.0
6.0
8.0
10.0
12.0
1 2 3 4
Number of Towns
Med
ian
To
wn
IP
s (
mm
cf/
d)
0
1
5
12
5
23 Wells
0%
4%
23%
50%
23% 73%
McKean
County, Town, Well
Median IPs
1.9
Number of Towns

15
Identify: All Producing Horizontal Wells
Determine: Initial Production (IP)
Project: NY
Compute: County & Town IPs
Systems Engineering Approach
81 Towns
Identify: IP Patterns & Trends
1,540
PA DEP Oil & Gas Reporting Website
Maps & Graphs
4 Years 2009-2012 Download: Well Data
All Data
Publicly Available
Select: Northern Tier PA Counties 6

Identify IP Patterns & Trends
Plot Town Median IPs
on Shale Properties Maps
• TOC
• Thickness
• Depth
• Thermal Maturity
16

Marcellus TOC
7.1 - 31
4.1 - 7.0
2.1 - 4.0
1.1 - 2.0
Median IP (mmcf/d)
0.0 - 1.0
Map Source: Arthur 2011 from MCOR 17

18
Susquehanna Bradford Tioga
Potter
McKean
Map Source: MCOR
Wyoming
Well IPs by Shale Depth
18
7.1 - 31
4.1 - 7.0
2.1 - 4.0
1.1 - 2.0
Town IP
(mmcf/d)
0.0 - 1.0

19
Well IPs vs Shale Depth
0%
20%
40%
60%
80%
100%
120%
2-3 3-4 4-5 5-6 6-7 7-8
Shale Depth (1000 ft)
Perc
en
t o
f W
ells 1%
Projected
8%
41%
38%
38%
6%
29%
38%
27%
40% 59%
1,540 Wells
12%
12% 17% 20%
9% 20% 30%
45% 21%
30%
35%
22%
2.1 – 4.0 1.1 - 2 7.1- 31 4.1 - 7 IP - mmcf/d 0 - 1
2%

20
Bradford Tioga
Map Source: MCOR
Well IPs by Shale Thickness
Potter
McKean
Wyoming
Susquehanna
7.1 - 31
4.1 - 7.0
2.1 - 4.0
1.1 - 2.0
Town IP
(mmcf/d)
0.0 - 1.0

0%
20%
40%
60%
80%
100%
120%
50-100 100-150 150-200 200-250 250-300
Shale Thickness (ft)
Nu
mb
er
of
Wells
21
Well IPs vs Thickness
49%
40% 20%
12% 8%
44% 41%
12%
28% 36%
31%
1,540 Wells
38%
20%
78%
22%
6% 4%
2.1 – 4.0 1.1 - 2 7.1- 31 4.1 - 7 IP - mmcf/d 0 - 1
2% 4% 2%

Map Source: MCOR
Marcellus Shale Thickness
2
63
177
221
110
573 Wells
<1%
11%
31%
38%
19% 51
61
98
51
14
275 Wells
19%
22%
36%
19%
5%
1.8
52
1.6 2.0
76
1.6
4
4.7
3 3.2
3
2.1 30
3.5
1.0
5
0.4
1
0.1 1
1023 Wells
1540 Wells
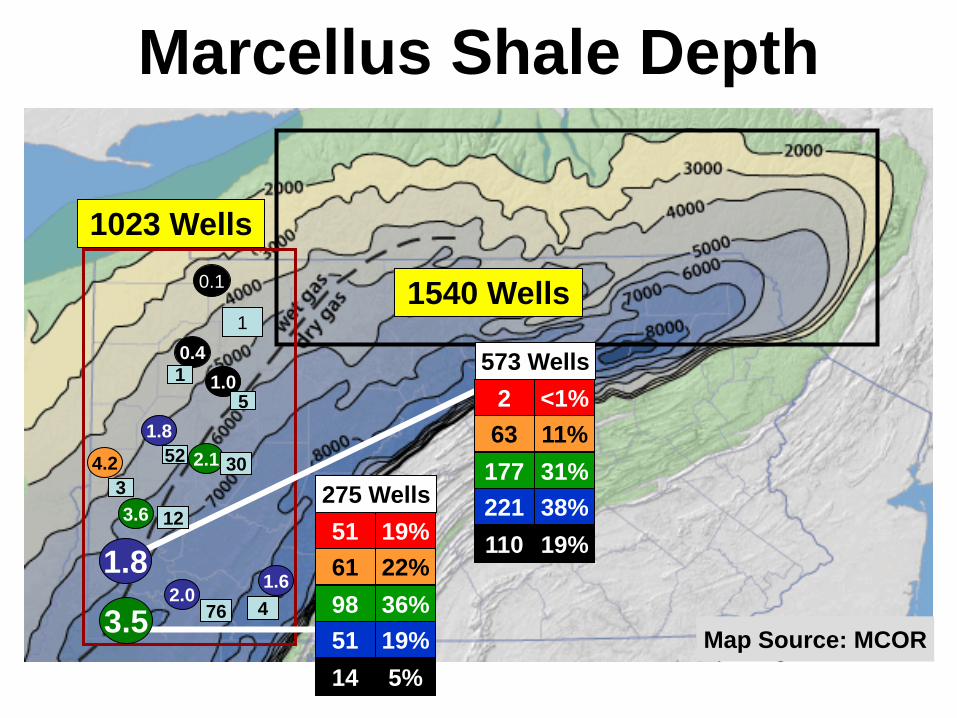
Map Source: MCOR
Marcellus Shale Depth
2.0 76
4.2
3
3.5
51
61
98
51
14
275 Wells
19%
22%
36%
19%
5%
2.1 30
1.8
52
1.0 5
1.6
4
0.4
1
3.6 12
1.8
2
63
177
221
110
573 Wells
<1%
11%
31%
38%
19%
0.1
1
1023 Wells
1540 Wells

24
5000
4000
3000
100 150 300 250 Shale Thickness (ft)
Shale
Depth (ft)
200 50
Well IPs by Thickness & Depth
1.3
50
0.6
9
0.7
18
2.5 18
3.3
3.2
3.9
3.6
166
146 248
140
2.4
71
3.0
40
2.5
45
Number
of Wells
In Zone
5.0
6.8 66
200
7.8 322
Zone Median IP
7000
6000
8000
Washington
Greene 3.5
1.8
Warren
Venango
0.4
0.1

5000
4000
3000
100 150 300 250
Shale
Depth (ft)
200 50
NY Median IP Projections
Shale
Thickness (ft)
2000
-17% -22% -50% -50%
2.5 3.3
3.2
3.9
3.6
5.0
6.8
1.3 0.6
7.8
2.4
3.0 0.7 2.5 Zone Median IP
in PA
Washington
Greene 3.5
1.8
25 8000
7000
6000

5000
4000
3000
100 150 300 250
Shale
Depth (ft)
200 50
NY Median IP Projections
Shale
Thickness (ft)
2000
0.5
0.4
0.1
0.4
0.2
2.0
1.8
2.5
2.1
-17% -22% -50% -50%
2.5 3.3
3.2
3.9
3.6
5.0
6.8
1.3 0.6
7.8
2.4
3.0 0.7 2.5
Zone Median IP
NY Projections
Washington
Greene 3.5
1.8
NY
26 8000
7000
6000

27 Map Source:
MCOR
NY IP Projections on Shale Thickness Map
NY PA
7.1 - 31
4.1 - 7.0
2.1 - 4.0
1.1 - 2.0
Median IP
(mmcf/d)
0.0 - 1.0
NY IP Projections:
County-wide
Part of County
PA Town IPs

Marcellus
Thermal Maturity
Smith & Leone 2009
Immature
Mature
Mature
Over Mature
7.1 - 31
4.1 - 7.0
2.1 - 4.0
1.1 - 2.0
Median IP (mmcf/d)
0.0 - 1.0
Source: Revised Draft SGEIS, Figure 4-11
28
NY IP Projections:
County-wide
Part of County
PA Town IPs