forecasting crop basis using historical averages...
TRANSCRIPT

Journal of Agricultural and Resource Economics 3 1 (3):549-567 Copyright 2006 Western Agricultural Economics Association
Forecasting Crop Basis Using Historical Averages Supplemented with Current Market Information
Mykel R. Taylor, Kevin C. Dhuyvetter, and Terry L. Kastens
This research compares practical methods of forecasting basis, using current market information for wheat, soybeans, corn, and milo (grain sorghum) in Kansas. Though generally not statistically superior, an historical one-year average was optimal for corn, milo, and soybean harvest and post-harvest basis forecasts. Aone-year average was also best for wheat post-harvest basis forecasts, whereas a five-year average was the best method for forecasting wheat harvest basis. Incorporating current market information, defined as basis deviation from historical average, improved the accuracy of post-harvest basis forecasts. A na'ive forecast incorporating current information was oRen the most accurate for post-harvest basis forecasts.
Key words: basis forecast, crop basis, current information, na'ive forecast
Introduction
The futures market can be an efficient and low-cost source of timely information to pro- ducers making crop marketing decisions in any geographic location (Zulauf and Irwin, 1997; Schroeder et al., 1998). Whether producers use the futures market to hedge or forecast local cash prices, the ability to accurately forecast basis is a critical component of the marketing strategy (Tomek, 1997; Hauser, Garcia, and Tumblin, 1990; Kenyon and Kingsley, 1973; Naik and Leuthold, 1991). However, few studies directly address forecasting basis other than to use a simple historical average. A disadvantage of using historical basis to forecast future basis levels is that current market information is not considered (Jiang and Hayenga, 1997). The relative importance of basis in forecasting cash prices from the futures price makes it appropriate to explore methods of improving basis forecasting beyond the simple historical average. One such method, which we consider here, is the inclusion of current basis information in the form of deviations of the present basis level from its historical average.
Basis is defined as the difference between a local cash price and the futures price (cash less futures). Basis reflects the equilibrium condition between the supply of grain in the local market and the demand for grain. Demand for grain is affected by compe- tition, grain storage capacity, and transportation costs to terminal markets, among other factors. Historical average basis provides information on equilibrium points across years for a particular point in time (i.e., calendar week, month). Deviations from this
Mykel R. Taylor is a graduate assistant in the Department of Agricultural and &source Economics, North Carolina State University. Kevin C. Dhuyvetter and Teny L. Kastens are professors, both in the Department of Agricultural Economics, Kansas State University.
Review coordinated by DeeVon Bailey.

550 December 2006 Journal of Agricultural and Resource Economics
historical average in a given year imply market forces differ in that year, and thus fore- casts based solely upon historical averages may be inappropriate. Therefore, i t may be more appropriate to forecast basis using historical averages that are modified to account for current market conditions (i.e., adjustments from a long-term mean).
Given that prices, and hence basis, tend to revert to a long-term mean, likely there is a temporal component to adjustments from that mean. Furthermore, differences in equilibrium adjustment time for local markets may vary by both crop and location. These differences could be in the form of the stability of the equilibrium and the time of adjustment to reach a new or old equilibrium. The stability of the equilibrium will be reflected by the number of years included in the historical average to predict the equilibrium point, while the adjustment time may be reflected by the amount of current information included in the basis forecast.
This empirical research provides a framework for comparing the accuracy of basis forecasting alternatives for producers using historical averages. Wheat, soybeans, corn, and milo (grain sorghum) basis are forecasted for six Kansas locations. While multiple locations could be analyzed whereby location-specific forecasting methods might be identified, the purpose of including multiple locations in this study is so that a general forecasting method recommendation can be made which encompasses the state. Specifi- cally, our objective is to identify a method for forecasting basis that can be generalized across locations. On the other hand, it may be that forecasting method should vary by crop, and thus our analysis does allow for different methods across crops. Because the data are limited to Kansas locations and crops, it should be noted the empirical results here may not apply to other locations. However, the methodology is appropriate for evaluating forecast models for other locations.
The first objective of this study is to determine the appropriate number of years to be used for obtaining an historical average that is a reliable predictor of future basis. Historical averages are often based on three to five years with little justification given as to why these numbers of years are used. Accordingly, this first objective is to examine whether the number of years included in an historical average affects basis forecast accuracy.
The second objective is to determine if the accuracy of basis forecasts can be improved by incorporating current market data, where this current information is measured as the difference between the current nearby basis and its historical average. A naive forecast, where future basis is forecasted to equal current basis, is also considered as a way to incorporate current information.
Through meeting these objectives, recommendations can be made to producers regarding basis models which are based on statistically tested methods. Additionally, helping producers forecast basis so they can use the futures market to obtain price forecasts is consistent with the vast amount of research indicating grain futures are efficient.
Background
A number of studies have examined the factors affecting grain basis (e.g., Garcia and Good, 1983; Kahl and Curtis, 1986; Martin, Groenewegen, and Pidgeon, 1980; Tilley and Campbell, 1988). These studies generally build on the theory of storage as outlined by Working (1949) and include fundamental supply and demand factors. Although these

Taylor, Dhuyvetter, and Kastens Forecasting Crop Basis with Current Information 55 1
studies examined factors affecting basis, none of them explicitly assessed the ability to forecast basis. While understanding and predicting basis is considered to be important for hedging or using the futures market for cash price forecasts, relatively few studies have investigated methods offorecasting basis (Jiang and Hayenga, 1997; Tomek, 1997).
Jiang and Hayenga (1997) compared 10 different basis forecasting models for corn and soybeans at various locations in the United States. The models used in their analysis ranged from a simple three-year historical average to more complex forecasting models. They concluded that forecasting basis using a simple three-year average method can be outperformed by alternative models; however, they also pointed out that the simple historical average method provided a reasonably good forecast. They did not consider alternative numbers of years in the historical average method.
Hauser, Garcia, and Tumblin (1990) compared five different methods of forecasting soybean basis at 10 locations in Illinois. They examined naive forecasts and simple historical averages, which are easy to compute and rely on information that is available at a low cost. The authors also considered more "sophisticated" regression models (see Garcia, Hauser, and Tumblin, 1986), but concluded the simpler models provided the best basis forecasts. Naik and Leuthold (1991) found that predicting expected maturity basis one month ahead of the maturity period was possible using current information, but that the basis prediction accuracy decreases as the forecast horizon increased.
Dhuyvetter and Kastens (1998) built upon previous work by Hauser, Garcia, and Tumblin (1990) by comparing practical methods of forecasting basis for wheat, corn, milo, and soybeans in Kansas. Four was found to be the optimal number of years to use as an average for forecasting wheat basis. A longer-term average (5-7 years) was optimal for corn, milo, and soybeans. They looked at incorporating current market information into forecasts and found basis forecasts were slightly more accurate when incorporating price spreads between futures contracts than using current nearby basis information. However, neither of these methods was better than a simple historical average with time horizons greater than 8-12 weeks.
Tonsor, Dhuyvetter, and Mintert (2004) considered the addition of current information in a model for predicting feeder and live cattle basis. They defined current information to be the deviation of current basis from historical levels on the date the forecast is made. Although accuracy of the basis forecast was improved with the addition of current information, they concluded that the value of the current information declined rapidly as the number of weeks between the forecasting date (vantage point) and the date being forecasted increased. Beyond 12- and 8-week horizons for feeder cattle and live cattle basis forecasts, respectively, there was little value to incorporating current information into the basis forecast.
This study expands the work in grain basis forecasting previously completed by Dhuyvetter and Kastens (1998) by formalizing a basis forecasting model that incorpor- ates current information using a methodology similar to the approach used by Tonsor, Dhuyvetter, and Mintert (2004). However, while the method used here is similar, there is little reason to believe results will necessarily be analogous, as grains are a storable commodity whereas cattle are not. Consequently, this study examines basis forecasts for both harvest and post-harvest time periods. We also revisit the process of determin- ing the optimal number of years to use in an historical basis forecast model by updating the data used in Dhuyvetter and Kastens' previous study.

552 December 2006 Journal of Agricul~ural and Resource Economics
Wheat, soybean, corn, and milo basis are forecasted for six Kansas locations across various time horizons using models based on: (a) alternative historical averages (differ- ent numbers of years), (b ) a na'ive forecast, and (c) historical average plus current basis information. All forecasting methods rely on data that are readily available to producers.
Basis Forecast Models
Nine methods are used to forecast basis for wheat, soybeans, corn, and milo for two points during the crop year: harvest and 24 weeks post-harvest. Multiple vantage points are considered to forecast the two points. Specifically, various pre-harvest forecasts are developed for the basis a t harvest (Harvest), and various post-harvest forecasts are developed for the basis 24 weeks post-harvest (Harvest+24). This study consistently uses basis to mean nearby basis, where "nearby" denotes the futures contract closest to delivery, only avoiding the delivery month.' For example, although December corn futures trade, the corn basis observed in December is cash price in December less March corn futures price on the same day.
The first seven forecast methods are based on historical averages and are given as:
where Basis represents the nearby basis forecast, Basis is observed basis, k refers to location, j denotes the time period being forecasted (Harvest or Harvest+24), t refers to the crop year (1989 through 2005) for which a basis prediction is made, and i refers to the number of years included in the historical average (1,2, ..., 7). There is no subscript indicating the vantage point from which the basis forecast is made (time horizon) since the forecast for a particular week is the same regardless of when the forecast is made. Previous studies considering historical averages as basis forecasts generally used a three- or five-year average. Historical averages from 1-7 years were considered to determine if a shorter- or longer-term average is superior to what is typically recom- mended.
The eighth method of forecasting basis is a nalve forecast, where the forecast for Harvest or Harvest+24 is simply the nearby basis the week the forecast is made. The advantage or appeal of using a nayve basis forecast is that it is a simple method and requires less information than other methods. While a nalve forecast clearly incorpor- ates current information, this approach likely makes more sense for post-harvest forecasts than it does for harvest forecasts because post-harvest forecasts do not span crop years.
The ninth basis forecasting method uses an historical average and incorporates cur- rent information by including an adjustment for how the current nearby basis deviates from its historical average. The underlying idea is that especially strong or especially weak current basis would be expected to carry into future time periods, especially within the crop year. The basis forecast for this method is given by:
' This distinction of "nearby" is consistent with grain elevators that do not price delivery month cash prices off the delivery contract; rather, they step out one contract.

Taylor, Dhuyvetter, and Kastens Forecasting Crop Basis with Current Information 553
where h denotes horizon (number of weeks the vantage point is ahead of the period forecasted), A is a value between 0 and 1 that weights the "amount" of current informa- tion included in the forecast, and all other terms are as defined above. Note that A = 0 gives back the simple historical average method of equation (I), and A = 1 implies that the traditional historical average basis prediction is "fully adjusted" by the amount current basis deviates from its historical average.
Data and Forecasts Developed
Historic data for local elevator cash prices often are not readily available to the public. Therefore, cash prices had to be collected on a weekly basis from newspapers and Data Transmission Network (DTN). Wednesday cash prices for wheat, soybeans, corn, and milo were collected for the first week of the 1982 crop year through the last week of the 2005 crop year. Prices were gathered from six geographically dispersed locations in Kansas for wheat, milo, and soybeans, and five locations for corn.' If a Wednesday happened to fall on a holiday, the Thursday price was used. Nearby futures price data corresponding to the cash price series were collected from the Kansas City Board of Trade for wheat futures and the Chicago Board of Trade for corn and soybean futures. Milo price was converted to dollars per bushel, and milo basis was calculated using the corn futures price. Price data were structured on the basis of four weeks per month. If a month had five Wednesdays, the fourth and fifth weeks' prices were averaged and reported as the fourth week of the month. Missing data were interpolated to ease the computational b ~ r d e n . ~
Because forecasts were developed for each commodity at each location and, because of the large quantity of data, forecasts were made for only two points during the crop year (Harvest and H~rvest+24).~ The seven-year average method requires seven years of historical data, so all out-of-sample forecasts were for weeks in the crop years 1989-2005. For the nalve forecasts and the forecasts using current information, harvest basis was forecasted from vantage points of 4,8, 12, 16,20,24,28, and 32 weeks prior to harvest (collectively referred to as Harvest forecasts). The basis 24 weeks post-harvest was forecasted from vantage points of 4, 8, 12, 16, and 20 weeks prior to that point (collectively referred to as Harvest+24 forecasts). This process was repeated for each location, crop, and year.
Data were collected from Scott City, Beloit, Hutchinson, Topeka, Emporia, and Colby for wheat, soybeans, corn, and milo. Insufficient data were available from Beloit for corn.
Missing data accounted for approximately 3.5% over the entire study time period, and were filled in using proportional changes in corresponding nearby futures prices before and after the missing points. For example, if a cash price in week 2 were missing, but weeks 1 and 3 were present, then the cash price was the average: [(week 2 futures pricelweek 1 futures price * week 1 cash price) + (week 2 futures pricelweek 3 futures price * week 3 cash price)] 12. If contiguous cash prices were absent, the adjustment process was iterated until convergence within $0.000001.
Harvest weeks are the 4th week in June for wheat, the 1st week in October for corn, the 3rd week in October for milo, and the 2nd week in October for soybeans (Kastens and Dhuyvetter, 1999).

554 December 2006 Journal of Agricultural and Resource Economics
Forecast Evaluation Procedures
A series of forecasts is associated with a series of forecast errors. For evaluation, the information embodied in a forecast error series is routinely condensed into a single test statistic such as the sum of squared errors or mean absolute error (MAE) so that alter- native forecasts can be compared in a generalized way. This approach allows painvise comparisons among competing forecast methods. Producers forecasting basis likely are interested in how precise their forecasts are expected to be. Thus, the relevant error series is absolute error. The MAE of each forecasting method was compared, by crop, using a paired t-test. Since the number of basis forecasts examined in this study was large and the objective was to identify a forecasting method that encompasses the state, absolute errors were first aggregated over locations using means. More importantly, using painvise tests without consideration of the likely location-to-location dependence in absolute error differences in a given year would be inappropriate. Yet, aggregating forecast errors across 'locations still allows one to determine if basis can be forecasted more accurately a t certain times of the year.
Table 1 reports the MAE for each of the historical average forecasting methods averaged across locations for the Harvest and Harvest+24 forecast periods. Although the MAE is similar for many of the alternative historical averages, with the exception of Harvest forecasts for wheat and Harvest+24 forecasts for soybeans, the previous year's basis (i.e., a one-year average) resulted in the lowest MAE. Table 2 reports the number of times a particular forecasting method "won" or "lost," where winning is defined as having the lowest MAE for a particular location and year, and losing is defined as having the highest MAE. As observed from table 2, the extremes, i.e., one-year and seven-year averages, tend to both win and lose the most often.5 That is, a one-year (seven-year) average tended either to be the best or worst way to forecast basis for a particular location-year.
To determine ifincorporating current information improved basis forecasts, the "best" historical average was used as the starting point. To obtain the "best" method of fore- casting for each crop, the seven historical-average methods were compared based on statistical significance of painvise t-tests and the magnitude of the MAEs. The intent was to determine a fixed rule that could be formed for both pre- and post-harvest forecasts for a given crop. This rule would simplify exposition in an Extension setting. Unfortunately, a t a 95% confidence level, nothing emerged from the results of the paired t-tests of accuracy to reveal the existence of a dominant forecasting method across crops and forecast period^.^ Consequently, the "best" method was selected as the historical average with the lowest MAE, with one exception-soybean Harvest+24, where a one- year average was used as opposed to the two-year average. This exception was made to maintain consistency across the spring planted crops and also because the one- and two-year averages were not statistically different from each other. Thus, the historical
There was a slight tendency for shorter-term averages to forecast more accurately in the more recent forecasted years. One possible explanation for this finding is structural changes such as the increasing production in South America and ethanol demand influence, which lead to shorter-term relationships being better predictors of the future than longer-term relationships.
Pairwise t-tests of MAE for each location indicated a lack of statistically significant differences between locations. Thus, pairwise t-tests were based upon 17 out-of-sample forecasts using annual values averaged across locations. There were considerably more pairwise statistical differences if the tests were conducted across location-years. However, these tests are inappropriate because of the dependency in forecast error differences that exist across locations in any given year.

Taylor, Dhuyvetter, and Kastens Forecasting Crop Basis with Current Information 555
Table 1. Mean Absolute Errors of Crop Basis Forecast Methods (@/bushel)
Forecast Method "
Description
Wheat: Harvest Harvest+24
Soybeans: Harvest Harvest+24
Corn: Harvest Harvest+24
Milo: Harvest Harvest+24
1 Yr.
9.77 14.74
10.84 10.78
10.62 10.33
11.83 11.13
2 Yrs. 3 Yrs.
8.51 17.26
12.51 10.82
13.47 11.58
14.74 12.26
4 Yrs.
8.03 17.52
12.83 10.92
14.27 12.32
16.04 12.50
5 Yrs.
7.96 17.65
12.60 10.89
14.12 11.83
16.08 12.35
6 Yrs.
8.05 17.26
12.33 10.80
13.64 11.00
15.91 11.70
7 Yrs.
7.97 16.56
12.38 10.22
13.16 10.39
15.63 12.03
"Forecast method refers to number of years used in historical average.
Table 2. Frequency of Mean Absolute Forecast Errors Wins and Losses by Forecast Method
-
Occurrence by Method"
Description 1 Yr. 2 Yrs. 3 Yrs. 4 Yrs. 5 Yrs. 6 Yrs. 7 Yrs. Totalb
Harvest
Wheat: Wins 24 9 20 11 5 10 23 102 Losses 41 24 12 5 2 7 11 102
Soybeans: Wins 36 17 8 8 7 12 14 102 Losses 24 15 12 9 12 9 21 102
Corn: Wins 30 12 12 2 3 6 20 85 Losses 14 4 15 10 8 11 23 85
Milo: Wins 39 16 7 10 8 6 16 102 Losses 28 13 9 7 6 10 29 102
Harvest+24
Wheat: Wins
Losses
Soybeans: Wins
Losses
Corn: Wins Losses
Milo: Wins
Losses
Note: Wins are defmed as minimum MAE in a given year and location, and losses are defined as maximum MAE. " Occurrence is the number of year-locations, and method refers to the number of years used in the historical average
Total is based on 17 years and six locations for wheat, milo, and soybeans, and five locations for corn.

556 December 2006 Journal of Agricultural and Resource Economics
averages considered to supplement with current information were one-year averages for soybeans, corn, and milo for the Harvest and Harvest+24 forecast periods. In the case of wheat, a five-year average was used for Harvest forecasts and a one-year average was used for Harvest+24 forecasts.
The addition of current information to the historical averages was evaluated over the 1989-2005 time period. Once the number of years in the multi-year historical average method was selected for each crop and forecast time period, the optimal percentage of current information [i.e., the I in equation (2)l was solved for in Microsoft ~ x c e l @ by minimizing the in-sample MAE associated with the forecast model. A separate MAE- minimizing I was selected for each forecasting vantage point associated with the two time periods forecasted, but not for each location, nor for each year. That is, a unique I was "picked" whereby the across-year-and-location MAE was minimized. Additionally, I estimates were constrained to be between 0 and 1 to be consistent with the underlying theory.
Results
Multi-Year Historical Average Evaluation
The t-test matrices for the Harvest and Harvest+24 time periods are provided in tables 3-6 for wheat, soybeans, corn, and milo, respectively. The "best" forecasting method for wheat (table 3) was determined to be the five-year average for the harvest period and a one-year average for the post-harvest period. This is based on these methods having the lowest MAE, but it should be noted that none of the methods was statistically different from its paired counterpart a t the 95% confidence level. Using these methods, the MAE was approximately 82 per bushel for Harvest forecasts and 14.72 per bushel for Harvest+24 forecasts. This compares to an MAE of 10.12 per bushel across all weeks of the year for wheat, a s determined by Dhuyvetter and Kastens using a four-year average.
For soybeans (table 4), a one-year average method was selected for both time periods even though the post-harvest period MAE was lowest with a two-year average. The MAE using this method for soybeans was approximately 10.8g per bushel for both Harvest and Harvest+24 forecasts. Dhuyvetter and Kastens found an MAE of 9.52 per bushel across all weeks of the year for soybeans using a seven-year average. A one-year average was selected for both corn and milo. The MAE for corn (table 5) was 10.62 per bushel for Harvest forecasts and 10.32 per bushel for Harvest+24 forecasts. For milo (table 61, the MAE was 11.82 per bushel for Harvest forecasts and 11.12 per bushel for Harvest+24 forecasts. These compare to Dhuyvetter and Kastens' results, with an MAE of 10.82 per bushel across all weeks of the year for milo using a five-year average, and 10.62 per bushel for all weeks of the year for corn using a seven-year average.
The MAEs for the harvest and post-harvest forecasting periods were similar for soybeans, corn, and milo. However, the post-harvest MAE for wheat was considerably higher than for the harvest period. Likely these results are due to the fact that spring- planted crops in Kansas are harvested a t similar times as other states, whereas the Kansas wheat crop is harvested several months prior to wheat in northern states, and hence post-harvest price movements are harder to predict.

Taylor, Dhuyvetter, and Kastens Forecasting Crop Basis with Current Information 557
Table 3. Paired t-Test Matrices for Wheat Basis Forecasts
Basis Forecast Models
Description 1 Yr. 2 Yr. 3 Yr. 4 Yr. 5 Yr. 6 Yr. 7 Yr.
Harvest:
1 Yr. - 0.7137 0.3131 0.1537 0.1240 0.1432 0.1567
2 Yr. - 0.0994 0.0784 0.0574 0.0645 0.0691
3 Yr. - 0.2988 0.2866 0.3878 0.3344
4 Yr. - 0.7720 0.9426 0.8830
5 Yr. - 0.5996 0.9591
6 Yr. - 0.6342
7 Yr. -
MAE (qfbu.) 9.77 9.40 8.51 8.03 7.96 8.05 7.97
Harvest+24:
1 Yr. - 0.3160 0.3934 0.3837 0.3561 0.4315 0.5646
2 Yr. - 0.7194 0.7052 0.6928 0.8346 0.9500
3 Yr. - 0.7849 0.7974 0.9989 0.7351
4 Yr. - 0.8889 0.8619 0.5864
5 Yr. - 0.5734 0.3112
6 Yr. - 0.1943
7 Yr. -
MAE (qfbu.) 14.74 16.72 17.26 17.52 17.65 17.26 16.56
Note: The p-values are associated with the null hypothesis that there is no difference in MAE of two different forecast models.
Table 4. Paired t-Test Matrices for Soybean Basis Forecasts
Basis Forecast Models
Description 1 Yr. 2 Yr. 3 Yr. 4 Yr. 5 Yr. 6 Yr. 7 Yr.
Harvest:
1 Yr.
2 Yr.
3 Yr.
4 Yr.
5 Yr.
6 Yr.
7 Yr.
MAE (qfbu.)
Harvest+24:
1 Yr.
2 Yr.
3 Yr.
4 Yr.
5 Yr.
6 Yr.
7 Yr.
MAE (qfbu.)
Note: Thep-values are associated with the null hypothesis that there is no difference in MAE of two different forecast models.

558 December 2006 Journal of Agricultural and Resource Economics
Table 5. Paired t-Test Matrices for Corn Basis Forecasts
Basis Forecast Models
Description 1 Yr. 2 Yr. 3 Yr. 4 Yr. 5 Yr. 6 Yr. 7 Yr.
Harvest: 1 Yr.
2 Yr.
3 Yr.
4 Yr.
5 Yr.
6 Yr.
7 Yr.
MAE (#/bu.)
Harvest+24: 1 Yr.
2 Yr.
3 Yr.
4 Yr.
5 Yr.
6 Yr.
7 Yr.
MAE (#/bu.)
Note: Thep-values are associated with the null hypothesis that there is no difference in MAE of two different forecast models.
Table 6. Paired t-Test Matrices for Milo Basis Forecasts
Basis Forecast Models
Description 1 Yr. 2 Yr. 3 Yr. 4 Yr. 5 Yr. 6 Yr. 7 Yr.
Harvest: 1 Yr. - 0.3538 0.1603 0.0789 0.1153 0.1379 0.1666
2 Yr. - 0.1206 0.0768 0.1701 0.2479 0.3191
3 Yr. - 0.1195 0.3492 0.5181 0.6525
4 Yr. - 0.9561 0.9149 0.7652
5 Yr. - 0.7805 0.5887
6 Yr. - 0.5323
7 Yr. -
MAE (#/bu.) 11.83 13.10 14.74 16.04 16.08 15.91 15.63
Harvest+24: 1 Yr.
2 Yr.
3 Yr.
4 Yr.
5 Yr.
6 Yr.
7 Yr.
MAE (#/bu.)
Note: Thep-values are associated with the null hypothesis that there is no difference in MAE of two different forecast models.

Taylor, Dhuyvetter, and Kastens Forecasting Crop Basis with Current Information 559
When comparing these results to those found by Dhuyvetter and Kastens in their 1998 study, several important factors emerge. First, the ability to accurately forecast basis with a simple historical average appears to have become slightly more difficult in recent years. Second, and more importantly, the optimal number of years to include in an historical average has decreased, suggesting potential structural changes in these markets. These results suggest the variability of basis apparently has increased, and the value of using longer-term averages to predict future values has diminished. Possible explanations are the larger impact world production currently has on today's U.S. mar- kets (e.g., soybeans) and changing domestic uses such as ethanol (e.g., corn and milo).
Current Information Evaluation
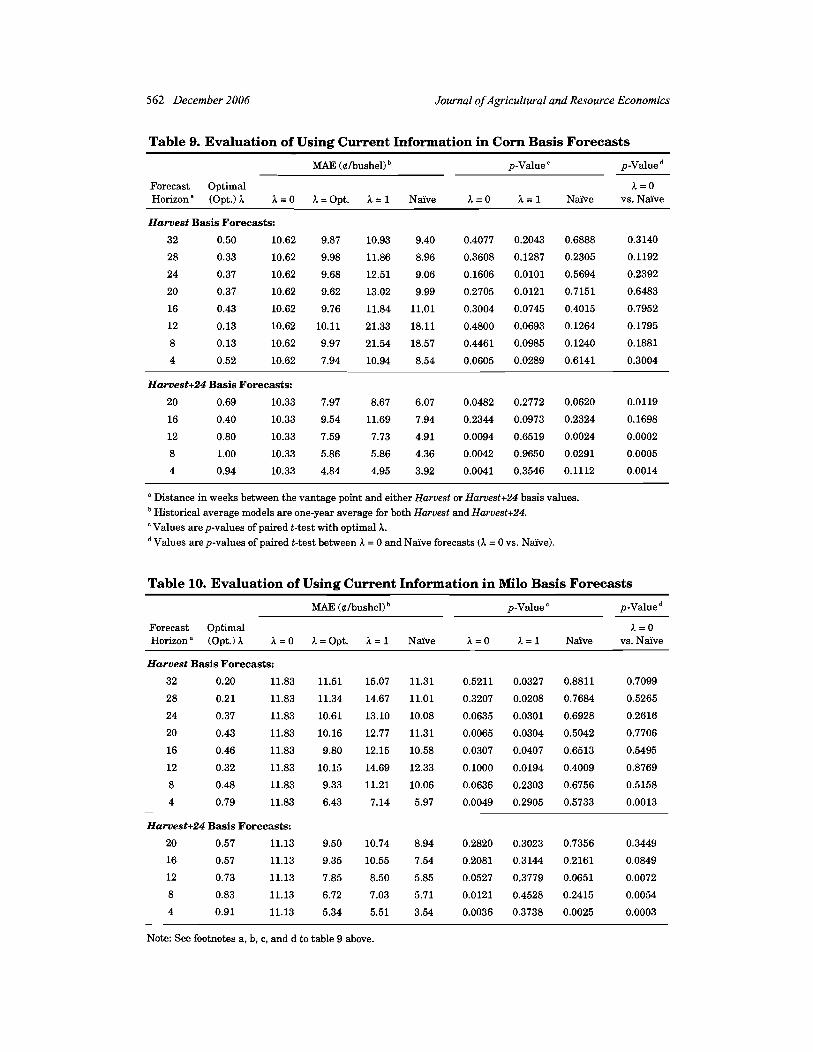
Figure 1 shows the optimal values of I for each crop over the forecast horizons for the Harvest basis forecast, where I was selected ex post for each crop. Paired t-tests were used to identify the statistical significance of the addition of current information into the forecasting model at various weights (I = 0, I = optimal, and I = 1). These t-test results and MAEs are reported in tables 7-10 for wheat, soybeans, corn, and milo, respectively, for the three values of I. Note, I = 0 gives back the simple historical average method of equation (I), and I = 1 denotes the simplistic selection of I that adjusts the traditional historical average basis prediction fully for the amount current basis deviates from its historical value.
For Harvest wheat, I was statistically different from 0 (based on paired t-tests of associated basis MAEs andp-value 5 0.10) for all time horizons greater than 12 weeks before Harvest. Thus, supplementing a five-year average with current information improved the accuracy of basis forecasts. Optimal weights for I ranged from 0.22 to 0.49 across these horizons. No statistical significance was found when incorporating current information in forecasts for the closest time periods (12 weeks and less). This result is exactly opposite of what was expected, i.e., current information is expected to be rela- tively more important at short forecasting horizons. Averaged across all time horizons, the MAE of the optimal I forecasts was 6.8@ per bushel, as compared to an MAE of 8@ per bushel for the I = 0 (simple average) models.
Optimal A's were significantly different from 0 for four and eight weeks prior to Harvest for soybeans and four weeks prior for corn, suggesting current information improved basis forecasts, but only for very short time horizons. The value of I (i.e., amount of current information to include) was considerably higher for corn than for soybeans (0.52 vs. 0.16-0.19). Incorporating current information up to 24 weeks prior to milo Harvest basis forecasts improved forecast accuracy with weights ranging from 0.32 to 0.79. Averaged across time horizons, the MAEs of the optimal I forecasts were 10.4@, 9.6@, and 9.9@ per bushel for soybeans, corn, and milo, respectively. The corres- ponding average MAEs for the I = 0 models were 10.8@, 10.6@, and 11.8@, suggesting improvements in forecast accuracy ranged from almost no improvement to about 2@ per bushel.
Figure 2 shows the optimal values of I for each crop over the forecast horizons for the Harvest+24 forecast. As observed from this graph, the optimal weight to place on current information tends to be higher for post-harvest basis forecasts than for harvest- time basis forecasts. The one conspicuous exception in figure 2 is the 12-weeks-past- harvest forecast for soybeans.

560 December 2006 Journal of Agricultural and Resource Economics
1 I--*-- wheat (5yr) +corn (1-yr) I
Weeks Prior to Harvest
Figure 1. Optimal amount of current information in Harvest forecast
Weeks Past Harvest
Figure 2. Optimal amount of current information in Harvest+24 forecast

Taylor, Dhuyvetter, and Kastens Forecasting Crop Basis with Current Information 56 1
Table 7. Evaluation of Using Current Information in Wheat Basis Forecasts
MAE (elbushel) p-Value ' p-Value
Forecast Optimal h=O Horizon" (Opt.) h h = 0 h =Opt. h = 1 Ndive h = 0 h = 1 Naive vs. Ndive
Harves t Basis Forecasts:
16 0.47 7.96
12 0.21 7.96
8 0.43 7.96
4 0.18 7.96
Harvest+24 Basis Forecasts:
20 0.93 14.74
16 1.00 14.74
12 0.87 14.74
8 1.00 14.74
4 1.00 14.74
" Distance in weeks between the vantage point and either Harvest or Haruest+24 basis values. Historical average models are five-year average for Harvest and one-year average for ~aruest+24.
Values arep-values of paired t-test with optimal h. Values are p-values of paired t-test between h = 0 and Nriive forecasts (1 = 0 vs. Naive).
Table 8. Evaluation of Using Current Information in Soybean Basis Forecasts
MAE (#/bushel)b p-Value ' p-Value
Forecast Optimal h=O Horizon" (Opt.) h h= 0 h =Opt. h = 1 Naive h=O h = 1 Naive vs. Naive
Harves t Basis Forecasts:
32 0.00 10.84
28 0.09 10.84
24 0.13 10.84
20 0.14 10.84
16 0.15 10.84
12 0.09 10.84
8 0.19 10.84
4 0.16 10.84
Harvest+24 Basis Forecasts:
20 0.42 10.78 9.29 11.85 7.95 0.1057 0.0135 0.2639 0.0217
16 0.77 10.78 8.70 9.07 5.65 0.0404 0.2614 0.0009 0.0000
12 0.07 10.78 10.73 13.56 9.24 0.7764 0.0997 0.3526 0.3361
8 0.80 10.78 8.21 8.52 5.29 0.0477 0.4847 0.0001 0.0001
4 0.81 10.78 6.24 6.53 5.87 0.0002 0.4666 0.7329 0.0009
Note: See footnotes a, c, and d to table 7 above. bHistorical average models are one-year average for both Harvest and Harvest+24.
562 December 2006 Journal of Agricultural and Resource Economics
Table 9. Evaluation of Using Current Information in Corn Basis Forecasts
MAE ($/bushel) p-Valuec p-Value
Forecast Optimal h=O Horizon" (Opt.) h h = 0 h = Opt. A. = 1 Naive h = 0 h = 1 Naive vs. Ndive
Harves t Basis Forecasts:
Harvest+24 Basis Forecasts:
20 0.69 10.33 7.97 8.67 6.07 0.0482 0.2772 0.0620 0.0119
16 0.40 10.33 9.54 11.69 7.94 0.2344 0.0973 0.2324 0.1698
12 0.80 10.33 7.59 7.73 4.91 0.0094 0.6519 0.0024 0.0002
8 1.00 10.33 5.86 5.86 4.36 0.0042 0.9650 0.0291 0.0005
4 0.94 10.33 4.84 4.95 3.92 0.0041 0.3546 0.1112 0.0014
" Distance in weeks between the vantage point and either Harvest or Harvest+24 basis values. Historical average models are one-year average for both Harvest and Haruest+24.
'Values are p-values of paired t-test with optimal 1. Values are p-values of paired t-test between 1 = 0 and Ndive forecasts (A. = 0 vs. Naive).
Table 10. Evaluation of Using Current Information in Milo Basis Forecasts
MAE ($/bushel) p-Value ' p-Value
Forecast Optimal h=O Horizon" (Opt.) 1 h = 0 h = Opt. h = 1 Naive h=0 h= 1 Ndive vs. Naive
Harves t Basis Forecasts:
32 0.20 11.83 11.51 15.07 11.31 0.5211 0.0327 0.8811 0.7099
28 0.21 11.83 11.34 14.67 11.01 0.3207 0.0208 0.7684 0.5265
Harvest+24 Basis Forecasts:
20 0.57 11.13 9.50 10.74 8.94 0.2820 0.3023 0.7356 0.3449
16 0.57 11.13 9.35 10.55 7.54 0.2081 0.3144 0.2161 0.0849
12 0.73 11.13 7.85 8.50 5.85 0.0527 0.3779 0.0651 0.0072
8 0.83 11.13 6.72 7.03 5.71 0.0121 0.4528 0.2415 0.0054
4 0.91 11.13 5.34 5.51 3.54 0.0036 0.3738 0.0025 0.0003
Note: See footnotes a, b, c, and d to table 9 above.

Taylor, Dhuyvetter, and Kastens Forecasting Crop Basis with Current Information 563
Another apparent feature from figure 2 is that the I values are trending up over time, indicating weights tend to be higher as the forecasting horizon decreases, i.e., as the forecast vantage point approaches the forecast date (24 weeks after harvest). Because current basis should be a more reliable indicator of future basis when the "future" is closer to the present, this finding is as expected.
As noted above, the paired t-test results and MAEs of the different I weights for the Harvest and Harvest+24 forecasts are provided in tables 7-10 for wheat, soybeans, corn, and milo, respectively. For post-harvest (Harvest+24) wheat basis forecasts, I was statis- tically different from 0 (based on paired t-tests of associated basis MAEs and p-value 5 0.10) for all time horizons considered. Therefore, supplementing the one-year average base forecast (I = 0) with current information significantly improved the accuracy of basis forecasts. Optimal weights for I ranged from 0.87 to 1.00 (constrained maximum) across the horizons. Given the considerably higher MAE for post-harvest basis forecasts compared to harvest basis forecasts (table I), this result is as expected-i.e., incorpor- ating current information into basis forecasts is more beneficial for within-crop-year forecasts than it is across crop years. Averaged across all time horizons, the MAE of the optimal I forecasts was 8.1$ per bushel compared to an MAE of 14.7$ per bushel for the I = 0 model.
Supplementing one-year historical average post-harvest (Harvest+24) basis forecasts for soybeans, corn, and milo generally improved the accuracy of forecasts. The main exception to this was the 12-week-prior forecast for soybeans where the optimal I was only 0.07 and was not statistically different from 0 (p-value of 0.78). Forecast horizons for corn and milo that were not significant a t the 90% level had p-values ranging from 0.20 to 0.28 and optimal weights of 0.40 or higher. Averaged across time horizons, the MAEs of the optimal I forecasts were 8.6$, 7.2$, and 7.8$ per bushel for soybeans, corn, and milo, respectively. The corresponding average MAEs for the base models (I = 0) were 10.8$, 10.3$, and 11.1$, indicatingimprovements in forecast accuracy of about 2$ to 4$ per bushel associated with using current information.
The 12-week-prior forecast for soybeans clearly appears to be an "outlier" of the post- harvest basis forecasts. This time period represents forecasts for basis the second week of April made from the second week of January vantage point. While this is not a time period where one would expect large price swings due to production risk, this time is consistent with the release of the USDA quarterly Grain Stocks report and also when the final estimate of the previous year's crop is reported. Therefore, this result for the 12-week-prior forecast for soybeans may be related to price variability surrounding these reports. However, this same factor also would be expected to impact corn and milo, yet this does not appear to be the case. Another possible explanation is that the South American influence on the U.S. soybean market is much less stable (i.e., predictable) from year to year; consequently, generalizing across methods of forecasting basis is not possible.
Although the results regarding the benefit of incorporating current information into basis forecasts are quite variable, they do follow expectations in some respects. First, including current information is much more beneficial to post-harvest than it is to pre- harvest forecasts of basis, which is consistent with expectations. This is simply because current information in post-harvest forecasts reflects the current crop marketing year, whereas the current information used in harvest basis forecasts reflects a different crop marketing year. Second, weights (I) to place on current information tend to be higher

564 December 2006 Journal of Agricultural and Resource Economics
for shorter-term forecasting horizons. The one crop and forecast period where results were the most unexpected was for the harvest-time basis forecasts for wheat. Weights were similar regardless of time horizon and were somewhat more beneficial for longer- term forecasting horizons.
Because weights on current information were consistently higher for post-harvest forecasts than for harvest forecasts, an important rule for producers can be established if they do not want to use optimal weights to adjust forecasts with current information. For Harvest forecasts, forecasts should not be adjusted using current information, as forecasts with L = 0 (no adjustment) had lower W s than forecasts with L = 1 (full adjustment). This was true for 30 of 32 possible crop-time horizon combinations. In other words, "fully adjusting" historical-average-based harvest forecasts for current informa- tion actually results in worse forecasts. However, post-harvest (Harvest+24) forecasts should be adjusted using current information, as forecasts with L = 1 had lower MAEs than L = 0 forecasts for 22 of 25 possible crop-time horizon combinations. Even if L were not optimized, the arbitrary full information (A = 1) selection still would improve the forecasting accuracy of post-harvest forecasts over no current information. Recall the optimal L was selected ex post and, if this value were used in real-time forecasting, it may not be more accurate than the L = 1 selection.
Nazve Forecast Evaluation
Tables 7-10 report MAEs for naive forecasts by time horizon for the Harvest and Harvest+24 time periods. Using the observed basis as a forecast for harvest-time basis is generally inferior to using an historical average. The W s for naive basis forecasts for Harvest were higher than the historical average without current information (A = 0) for wheat, soybeans, and corn. On the other hand, the across-time-horizons average MAE for post-harvest (Harvest+24) naive forecasts was lower than the MAE from historical average forecasts without current information for all four crops (improvement in accuracy ranged from 3.9@ to 4.9@ per bushel). Furthermore, the MAEs from the naive Harvest+24 forecasts were lower than the historical average forecasts with optimal current information (A = optimal) for soybeans, corn, and milo. Thus, it may be that the best way to incorporate current information into forecasts post-harvest is to simply use a naive forecast. However, this approach is not appropriate for harvest-time basis forecasts.
Alternative Methods of Forecasting Harvest Basis
To this point, it appears the accuracy ofhistorical-average-based basis forecasts for post- harvest time periods can be improved upon by incorporating current information [either as in equation (2) or simply using a nayve forecast]. Unfortunately, these methods seem to offer little benefit regarding forecast accuracy when forecasting harvest basis. I t is not particularly surprising that incorporating current information is less useful pre- harvest than post-harvest, as the basis reflects two different crop years he., current basis is old crop, and harvest basis is new crop). However, the question still remains as to whether there is a way to incorporate current information into harvest-time basis forecasts which will improve upon traditional forecasting methods (i.e., historical averages). One possibility is to estimate econometric models that include fundamental

Taylor, Dhuyvetter, and Kastens Forecasting Crop Basis with Current Information 565
factors impacting basis. However, the purpose of using historical averages is to simplify the forecasting process and use data readily available to farmers. Thus, complex econo- metric models are likely not a pragmatic choice from a producer's perspective.
A piece of information often available from local elevators is a forward contract or new crop bid. These bids are frequently offered beginning six to nine months prior to harvest and then ending at harvest. New crop bids are calculated by elevators to reflect the expected basis at harvest plus a possible additional charge by the local elevator associ- ated with basis risk absorption. Hence, a potential alternative harvest-time basis forecast would be those implied from forward contract bids.
Several studies have examined the cost of forward contracting, where cost of contract- ing is typically defined as the difference between contracted basis and actual basis at harvest (e.g., Brorsen, Coombs, and Anderson, 1995; Elam and Woodworth, 1989; Gasper, 2006; Shi et al., 2005; Townsend and Brorsen, 2000). Defined in this manner, a low cost of contracting suggests the buyer offering the forward contract was able to accurately predict basis. While the cost of contracting reported in these studies varied somewhat, further research into this approach for forecasting harvest-time basis appears warranted-i.e., using a forward-bid-implied basis might be a way to improve the accuracy of basis forecasts at harvest compared to traditional historical-average- based forecasts.
Summary and Implications
Many studies have shown that basis forecasts based on simple historical averages com- pare favorably with more complex forecasting models. However, these studies typically considered only a three-year historical average for forecasting basis. In this study we examined alternative numbers of years to include in an historical average to determine the optimal multi-year historical average for each crop considered. While no rule emerged that was best in all cases, the results suggest using a one-year average basis (i.e., previous year) to forecast the future basis has worked better than longer-term averages. The main exception to this finding was for wheat basis at harvest, where a five-year average resulted in the lowest MAE.
The optimal number of years to include in an historical average determined by this study differed from results of earlier research by Dhuyvetter and Kastens (1998) who examined similar data. Using data from several Kansas locations over the 1989-1997 time period, their analysis suggested a four-year average for wheat and five- to seven- year averages for corn, milo, and soybeans. For the current study, a longer time period was considered (1989-2005, i.e., 17 out-of-sample years) with fewer locations. We deter- mined that shorter historical averages should be used to forecast basis for all crops except wheat at harvest. It should also be noted that basis forecast errors (MAEs) were slightly higher in this study than those reported by Dhuyvetter and Kastens, suggesting basis may be getting more difficult to forecast.
Based on the results of this study, the addition of current information to an historical- average-basis model can improve forecasting accuracy over both the Harvest and Harvest+24 forecasts of basis, but most of the improvement is found for the post-harvest basis forecasts. The Harvest forecasts of basis for soybeans, corn, and milo were only improved for short time horizons (e.g., four to eight weeks), whereas the improvement for wheat was a t longer time horizons and not a t the shorter horizons, which was

566 December 2006 Journal of Agricultural and Resource Economics
unexpected. The post-harvest basis forecasts (Harvest+24) were consistently improved by incorporating current information; and, the optimal amount of that information to include tended to increase as the forecast horizon shortened (i.e., as the time of the forecast is approached by the vantage point). A naive forecast, where future basis is simply predicted to equal the current basis, was not appropriate when forecasting harvest basis, but this method worked quite well for post-harvest basis forecasts. This approach is simpler than the "deviation from historical average" method that was also examined in this research and actually resulted in a lower W in a number of cases.
It is reasonable that post-harvest basis forecasts (Harvest+24) would be improved by current information, because this information incorporates structural forecasting compo- nents such as the size of the harvest. Since current information prior to harvest reflects old crop information and the basis being forecasted represents the new crop, it makes sense that Harvest forecasts are less responsive to the addition of current information. Based on some preliminary research examining the implied harvest-time basis from new crop bids, there may be potential to improve accuracy for Harvest basis forecasting. Future research should consider this approach as it is low cost and easy to use, and thus could provide another practical option to producers for basis forecasting.
[Received March 2005;Jinal revision received August 2006.1
References
Brorsen, W . B., J. Coombs, and K. Anderson. "The Cost o f Forward Contracting Wheat."Agribus.: An Internat. J. ll(July/August 1995):349-354.
Dhuyvetter, K. C., and T. L. Kastens. "Forecasting Crop Basis: Practical Alternatives." In Proceedings of NCR-134 Conference on Applied Commodity Price Analysis, Forecasting, and Market Risk Management, ed., T . C. Schroeder, pp. 49-67. Dept. of Agr. Econ., Kansas State University, Man- hattan, 1998.
Elam, E., and J. Woodworth. "Forward Selling Soybeans with Cash Forward Contracts, Futures Contracts, and Options." Arkansas Bus. and Econ. Rev. 22(1989):11-20.
Garcia, P., and D. L. Good. "An Analysis of the Factors Influencing the Illinois Corn Basis, 1971-1981." In Proceedings of NCR-134 Conference on Applied Commodity Price Analysis, Forecasting, and Market Risk Management, ed., M. Hayenga, pp. 306-326. Dept. ofAgr. Econ., Iowa State University, Ames, 1983.
Garcia, P., R. Hauser, and A. Tumblin. "Corn and Soybean Basis Behavior: An Intertemporal, Cross- Sectional Analysis." In Proceedings of NCR-134 Conference on Applied Commodity Price Analysis, Forecasting, and Market Risk Management, ed., M. Hayenga, pp. 128-142. Dept. ofAgr. Econ., Iowa State University, Ames, 1986.
Gasper, A. "The Cost of Forward Contracting Wheat, Corn, and Soybeans in Kansas." Unpub. M.S. Thesis, Dept. of Agr. Econ., Kansas State University, Manhattan, May 2006.
Hauser, R. J., P. Garcia, and A. D. Tumblin. "Basis Expectations and Soybean Hedging Effectiveness." N. Cent. J. Agr. Econ. 12(1990):125-136.
Jiang, B., and M. Hayenga. "Corn and Soybean Basis Behavior and Forecasting: Fundamental and Alternative Approaches." In Proceedings of NCR-134 Conference on Applied Commodity Price Analysis, Forecasting, and Market Risk Management, ed. B. W . Brorsen, pp. 125-140. Dept. of Agr. Econ., Oklahoma State University, Stillwater, 1997.
Kahl, K. H., and C. E. Curtis, Jr. " A Comparative Analysis of the Corn Basis in Feed Grain Deficit and Surplus Areas." Rev. of Res. in Futures Mkts. 5(1986):220-232.
Kastens, T . L., and K. C. Dhuyvetter. "Post-Harvest Grain Storingand Hedging with Efficient Futures." J. Agr. and Resour. Econ. 24(December 1999):482-505.

Taylor, Dhuyvetter, and Kastens Forecasting Crop Basis with Current Information 567
Kenyon, D. E., and S. E. Kingsley. "An Analysis ofhticipatory Short Hedging Using Predicted Harvest Basis." S. J. Agr. Econ. 5(1973):199-203.
Martin, L., J. L. Groenewegen, and E. Pidgeon. "Factors Affecting Corn Basis in Southwestern Ontario." Amer. J. Agr. Econ. 62(1980):107-112.
Naik, G., and R. M. Leuthold. "A Note on the Factors Affecting Corn Basis Relationships." S. J. Agr. Econ. 23(1991):147-153.
Schroeder, T. C., J . L. Parcell, T. L. Kastens, and K C. Dhuyvetter. "Perceptions of Marketing Strategies: Producers vs. Extension Economists." J. Agr. and Resour. Econ. 23(July 1998):279-293.
Shi, W., S. H. Irwin, D. L. Good, and S. N. Dietz. "Wheat Forward Contract Pricing: Evidence on Forecast Power and Risk Premia." Paper presented at the NCR-134 Conference on Applied Commod- ity Price Analysis, Forecasting, and Market Risk Management, St. Louis, MO, 18-19 April 2005.
Tilley, D. S., and S. K. Campbell. "Performance of the Weekly Gulf-Kansas City Hard-Red Winter Wheat Basis." Amer. J. Agr. Econ. 70(1988):929-935.
Tomek, W. G. "Commodity Futures Prices as Forecasts." Rev. Agr. Econ. 19(1997):2344. Tonsor, G. T., K. C. Dhuyvetter, and J. R. Mintert. "Improving Cattle Basis Forecasting." J. Agr. and
Resour. Econ. 29(August 2004):228-241. Townsend, J. P., and B. W. Brorsen. "Cost of Forward Contracting Hard Red Winter Wheat." J. Agr.
and Appl. Econ. 32(July 2000):89-94. Working, H. "The Theory of the Price of Storage."Amer. Econ. Rev. 39(1949):1254-1262. Zulauf, C. R., and S. H. Irwin. "Market Efficiency and Marketing to Enhance Income of Crop Pro-
ducers." In Proceedings of NCR-134 Conference on Applied Commodity Price Analysis, Forecasting, and Market Risk Management, ed., B. W. Brorsen, pp. 1-25. Dept. of Agr. Econ., Oklahoma State University, Stillwater, 1997.