ford delivers first quarter $1.7b net income, $2.2b adj. … america/us/2018... · ford motor...
TRANSCRIPT

Ford Motor Company 1Q April 25, 2018* See endnote on page 4.
2018 FIRST QUARTER FINANCIAL RESULTS*
Ford Delivers First Quarter $1.7B Net Income,
$2.2B Adj. EBIT; Fitness Actions Improve 2020 Outlook
DEARBORN, Mich., April 25, 2018 – Ford Motor Company today released its first quarter 2018 financial results. The company
delivered increased revenue, up 7 percent year over year, and net income of $1.7 billion, up 9 percent year over year, more than
explained by a lower tax rate. Company adjusted EBIT of $2.2 billion was down from a year ago, due to commodity cost increases
and adverse exchange.
In addition, the company announced that its fitness initiatives are driving an improved outlook. Ford is now targeting an 8 percent
adj. EBIT margin in 2020, two years earlier than previously anticipated. Ford is also targeting its return on invested capital (ROIC) to
substantially increase by 2020.
“We are committed to taking the appropriate actions to drive profitable growth and maximize the returns of our business over the
long term,” said Jim Hackett, president and CEO. “Where we can raise the returns of underperforming parts of our business by
making them more fit, we will. If appropriate returns are not on the horizon, we will shift that capital to where we can play and win.”
The accelerated 2020 targets are enabled by $11.5 billion of cost and efficiency opportunities that span the entire company and
include engineering, marketing and sales, manufacturing, material cost and IT. In addition, Ford expects to improve its capital
efficiency. The company had previously expected to spend about $34 billion in capital from 2019 to 2022 and has now cut that by
$5 billion, to $29 billion over the same period.
“This quarter is in line with expectations and consistent with our outlook for the full year, but we know we can, and must, do better,”
said Bob Shanks, executive vice president and CFO. “The entire team is focused on improving the operational fitness of our
business, as well as meeting and exceeding our accelerated 2020 target of 8 percent margin and ROIC in the high teens.”
Hackett also provided an update to Ford’s strategic framework, declaring that Ford will create long term value by:
• Building a winning portfolio and focusing on products and markets where Ford can win. For example, by 2020, almost
90 percent of the Ford portfolio in North America will be trucks, utilities and commercial vehicles. Given declining consumer
demand and product profitability, the company will not invest in next generations of traditional Ford sedans for North America.
Over the next few years, the Ford car portfolio in North America will transition to two vehicles – the best-selling Mustang and the
all-new Focus Active crossover coming out next year. The company is also exploring new “white space” vehicle silhouettes that
combine the best attributes of cars and utilities, such as higher ride height, space and versatility.
• Making a full commitment to new propulsion choices, including adding hybrid-electric powertrains to high-volume, profitable
vehicles like the F-150, Mustang, Explorer, Escape and Bronco. The company’s battery electric vehicle rollout starts in 2020 with
a performance utility, and it will bring 16 battery-electric vehicles to market by 2022.
• Revenue in the quarter rose 7%; net income and adj. EBIT solid; EPS and
adj. EPS of $0.43, both up year over year
• Balance sheet remains strong with total liquidity of $38.6 billion
• Fitness initiatives have identified an incremental $11.5 billion of cost and efficiency
opportunities, driving accelerated 2020 financial targets
• Now expect 8% adj. EBIT margin by 2020, two years earlier than previous target
• Plan to reduce cumulative capital spending by $5 billion over 2019 - 2022 time frame
• Investor meeting to be held Sept. 26, 2018
Revenue(GAAP)
Net Income (GAAP)
Company Adj. EBIT
(Non-GAAP)
EPS(GAAP)
Adjusted EPS(Non-GAAP)
Company Adj. EBIT Margin (Non-GAAP)
Cash Flows from Operating
Activities(GAAP)
Company Operating Cash Flow
(Non-GAAP)
1Q
2018 $42.0B $1.7B $2.2B $0.43 $0.43 5.2% $3.5B $3.0B
B/(W)
1Q 2017$2.9B $0.1B $(0.3)B $0.03 $0.03 (1.2) ppts $(0.8)B $1.0B
Ford Motor Company 1Q April 25, 20182
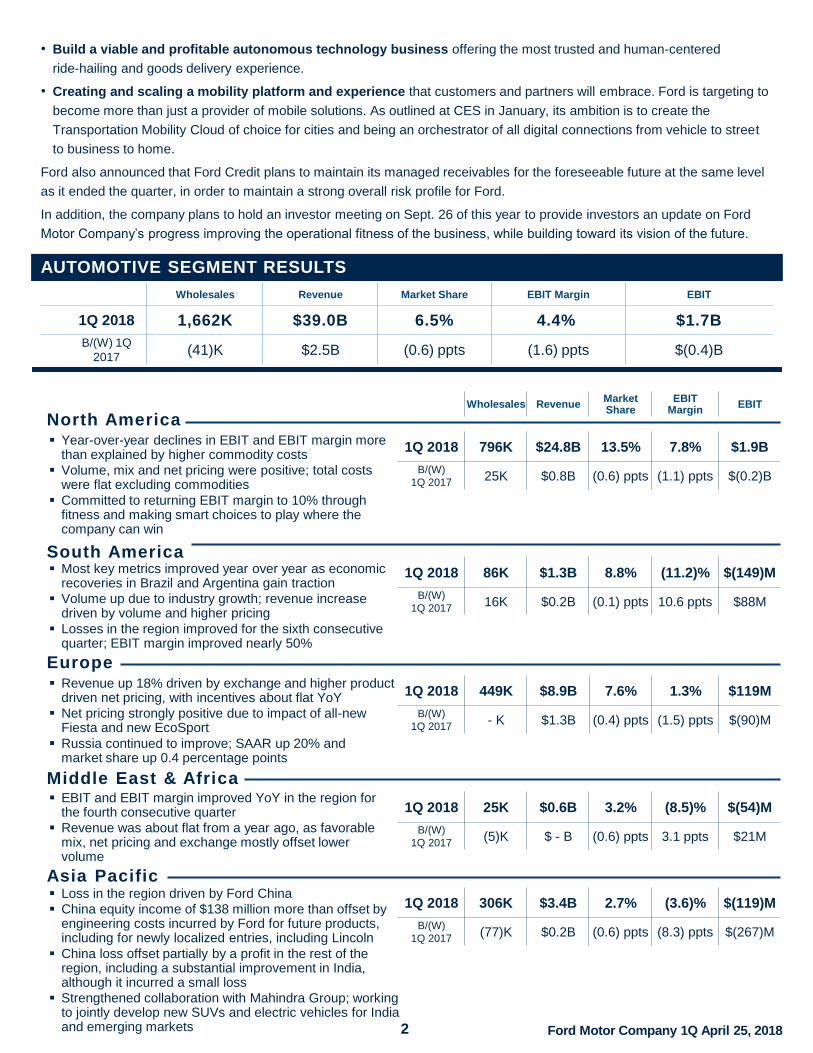
AUTOMOTIVE SEGMENT RESULTS
Wholesales RevenueMarketShare
EBIT Margin
EBIT
• Build a viable and profitable autonomous technology business offering the most trusted and human-centered
ride-hailing and goods delivery experience.
• Creating and scaling a mobility platform and experience that customers and partners will embrace. Ford is targeting to
become more than just a provider of mobile solutions. As outlined at CES in January, its ambition is to create the
Transportation Mobility Cloud of choice for cities and being an orchestrator of all digital connections from vehicle to street
to business to home.
Ford also announced that Ford Credit plans to maintain its managed receivables for the foreseeable future at the same level
as it ended the quarter, in order to maintain a strong overall risk profile for Ford.
In addition, the company plans to hold an investor meeting on Sept. 26 of this year to provide investors an update on Ford
Motor Company’s progress improving the operational fitness of the business, while building toward its vision of the future.
Wholesales Revenue Market Share EBIT Margin EBIT
1Q 2018 1,662K $39.0B 6.5% 4.4% $1.7B
B/(W) 1Q
2017(41)K $2.5B (0.6) ppts (1.6) ppts $(0.4)B
Year-over-year declines in EBIT and EBIT margin more than explained by higher commodity costs
Volume, mix and net pricing were positive; total costs were flat excluding commodities
Committed to returning EBIT margin to 10% through fitness and making smart choices to play where the company can win
Most key metrics improved year over year as economic recoveries in Brazil and Argentina gain traction
Volume up due to industry growth; revenue increase driven by volume and higher pricing
Losses in the region improved for the sixth consecutive quarter; EBIT margin improved nearly 50%
Revenue up 18% driven by exchange and higher product driven net pricing, with incentives about flat YoY
Net pricing strongly positive due to impact of all-new Fiesta and new EcoSport
Russia continued to improve; SAAR up 20% and market share up 0.4 percentage points
EBIT and EBIT margin improved YoY in the region for the fourth consecutive quarter
Revenue was about flat from a year ago, as favorable mix, net pricing and exchange mostly offset lower volume
Loss in the region driven by Ford China
China equity income of $138 million more than offset by engineering costs incurred by Ford for future products, including for newly localized entries, including Lincoln
China loss offset partially by a profit in the rest of the region, including a substantial improvement in India, although it incurred a small loss
Strengthened collaboration with Mahindra Group; working to jointly develop new SUVs and electric vehicles for India and emerging markets
1Q 2018 796K $24.8B 13.5% 7.8% $1.9B
B/(W)
1Q 201725K $0.8B (0.6) ppts (1.1) ppts $(0.2)B
1Q 2018 86K $1.3B 8.8% (11.2)% $(149)M
B/(W)
1Q 201716K $0.2B (0.1) ppts 10.6 ppts $88M
1Q 2018 449K $8.9B 7.6% 1.3% $119M
B/(W)
1Q 2017- K $1.3B (0.4) ppts (1.5) ppts $(90)M
1Q 2018 25K $0.6B 3.2% (8.5)% $(54)M
B/(W)
1Q 2017(5)K $ - B (0.6) ppts 3.1 ppts $21M
1Q 2018 306K $3.4B 2.7% (3.6)% $(119)M
B/(W)
1Q 2017(77)K $0.2B (0.6) ppts (8.3) ppts $(267)M
North America
South America
Europe
Middle East & Africa
Asia Pacific
Ford Motor Company 1Q April 25, 20183
CAUTIONARY NOTE ON FORWARD-LOOKING STATEMENTS
Statements included or incorporated by reference herein may constitute “forward-looking statements” within the meaning of the
Private Securities Litigation Reform Act of 1995. Forward-looking statements are based on expectations, forecasts, and assumptions
by our management and involve a number of risks, uncertainties, and other factors that could cause actual results to differ materially
from those stated, including, without limitation:
• Ford’s long-term competitiveness depends on the successful execution of fitness actions;
• Industry sales volume, particularly in the United States, Europe, or China, could decline if there is a financial crisis, recession, or
significant geopolitical event;
• Ford’s new and existing products and mobility services are subject to market acceptance;
• Ford’s results are dependent on sales of larger, more profitable vehicles, particularly in the United States;
• Ford may face increased price competition resulting from industry excess capacity, currency fluctuations, or other factors;
• Fluctuations in commodity prices, foreign currency exchange rates, and interest rates can have a significant effect on results;
• With a global footprint, Ford’s results could be adversely affected by economic, geopolitical, protectionist trade policies,
or other events;
• Ford’s production, as well as Ford’s suppliers’ production, could be disrupted by labor disputes, natural or man-made disasters,
financial distress, production difficulties, or other factors;
• Ford’s ability to maintain a competitive cost structure could be affected by labor or other constraints;
• Pension and other postretirement liabilities could adversely affect Ford’s liquidity and financial condition;
• Economic and demographic experience for pension and other postretirement benefit plans (e.g., discount rates or investment
returns) could be worse than Ford has assumed;
• Ford’s vehicles could be affected by defects that result in delays in new model launches, recall campaigns, or increased
warranty costs;
• Safety, emissions, fuel economy, and other regulations affecting Ford may become more stringent;
• Ford could experience unusual or significant litigation, governmental investigations, or adverse publicity arising out of alleged
defects in products, perceived environmental impacts, or otherwise;
• Ford’s receipt of government incentives could be subject to reduction, termination, or clawback;
• Operational systems, security systems, and vehicles could be affected by cyber incidents;
• Ford Credit’s access to debt, securitization, or derivative markets around the world at competitive rates or in sufficient amounts
could be affected by credit rating downgrades, market volatility, market disruption, regulatory requirements, or other factors;
• Ford Credit could experience higher-than-expected credit losses, lower-than-anticipated residual values, or higher-than-expected
return volumes for leased vehicles;
• Ford Credit could face increased competition from banks, financial institutions, or other third parties seeking to increase their
share of financing Ford vehicles; and
• Ford Credit could be subject to new or increased credit regulations, consumer or data protection regulations, or other regulations.
We cannot be certain that any expectation, forecast, or assumption made in preparing forward-looking statements will prove
accurate, or that any projection will be realized. It is to be expected that there may be differences between projected and actual
results. Our forward-looking statements speak only as of the date of their initial issuance, and we do not undertake any obligation to
update or revise publicly any forward-looking statement, whether as a result of new information, future events, or otherwise. For
additional discussion, see “Item 1A. Risk Factors” in our Annual Report on Form 10-K for the year ended December 31, 2017, as
updated by subsequent Quarterly Reports on Form 10-Q and Current Reports on Form 8-K.
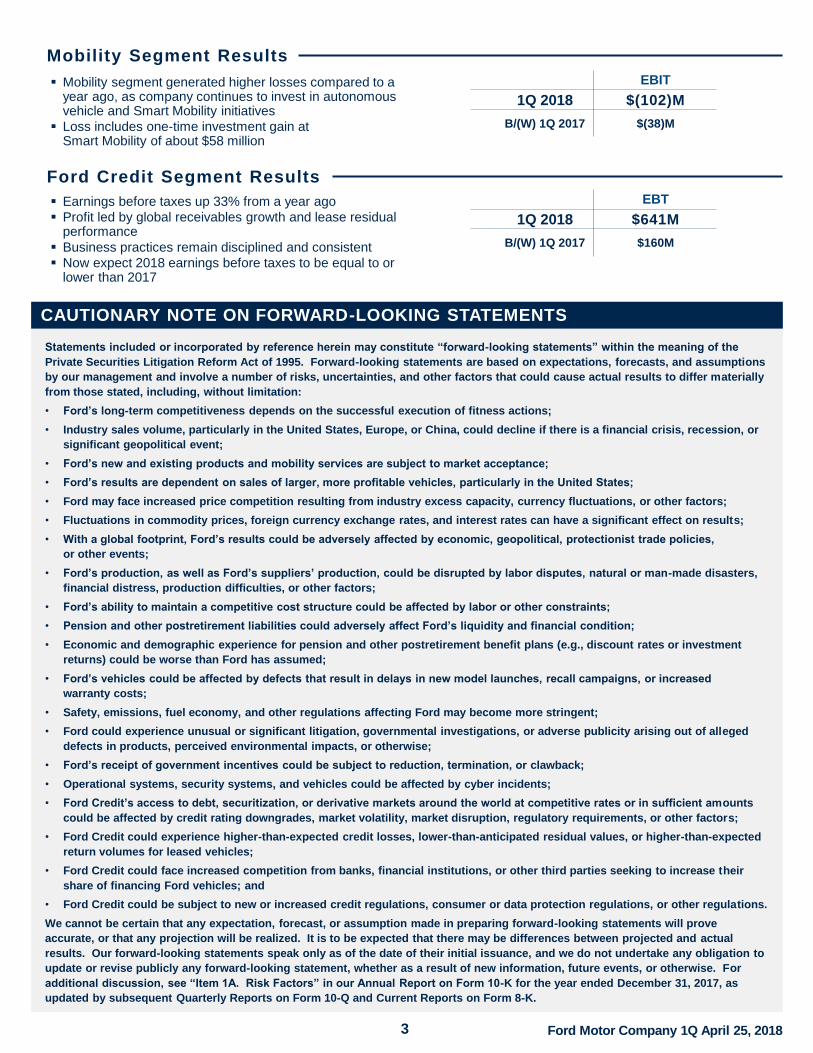
Mobility Segment Results
EBIT
1Q 2018 $(102)M
B/(W) 1Q 2017 $(38)M
Mobility segment generated higher losses compared to a year ago, as company continues to invest in autonomous vehicle and Smart Mobility initiatives
Loss includes one-time investment gain at Smart Mobility of about $58 million
Ford Credit Segment Results
Earnings before taxes up 33% from a year ago
Profit led by global receivables growth and lease residual performance
Business practices remain disciplined and consistent
Now expect 2018 earnings before taxes to be equal to or lower than 2017
EBT
1Q 2018 $641M
B/(W) 1Q 2017 $160M
Ford Motor Company 1Q April 25, 20184
CONFERENCE CALL DETAILS
Ford Motor Company [NYSE:F] and Ford Motor Credit Company release their 2018 first quarter financial results at 4:15 p.m. EDT today.
Following the release, Jim Hackett, Ford president and chief executive officer, and Bob Shanks, Ford executive vice president and chief financial officer, will host a conference call at 5:30 p.m. EDT to discuss the results.
The presentation and supporting materials are available at www.shareholder.ford.com. Representatives of the investment communityand the news media will have the opportunity to ask questions on the call.
Access Information – Wednesday, April 25, 2018
Ford Earnings Call: 5:30 p.m. EDTToll-Free: 1.877.870.8664International: 1.970.297.2423Passcode: Ford EarningsWeb: www.shareholder.ford.com
REPLAY(Available after 9:30 p.m. EDT the day of the event through May 3, 2018)www.shareholder.ford.com
Toll-Free: 1.855.859.2056International: 1.404.537.3406Passcode: 95413411
About Ford Motor CompanyFord Motor Company is a global company based in Dearborn, Michigan. The company designs, manufactures, markets and services afull line of Ford cars, trucks, SUVs, electrified vehicles and Lincoln luxury vehicles, provides financial services through Ford Motor Credit Company and is pursuing leadership positions in electrification, autonomous vehicles and mobility solutions. Ford employs approximately 202,000 people worldwide. For more information regarding Ford, its products and Ford Motor Credit Company, please visit www.corporate.ford.com.
* The following applies to the information throughout this release:
See tables later in this release for the nature and amount of special items, and reconciliations of the non-GAAP financial measures designated as “adjusted” and “Company Operating Cash Flow” to the most comparable financial measures calculated in accordance with U.S. generally accepted accounting principles (“GAAP”).
Wholesale unit sales and production volumes include Ford brand and Jiangling Motors Corporation (“JMC”) brand vehicles produced and sold in China by our unconsolidated affiliates; revenue does not include these sales. See materials supporting the April 25, 2018 conference call at www.shareholder.ford.com for further discussion of wholesale unit volumes.
Ford Motor Company 1Q April 25, 20185
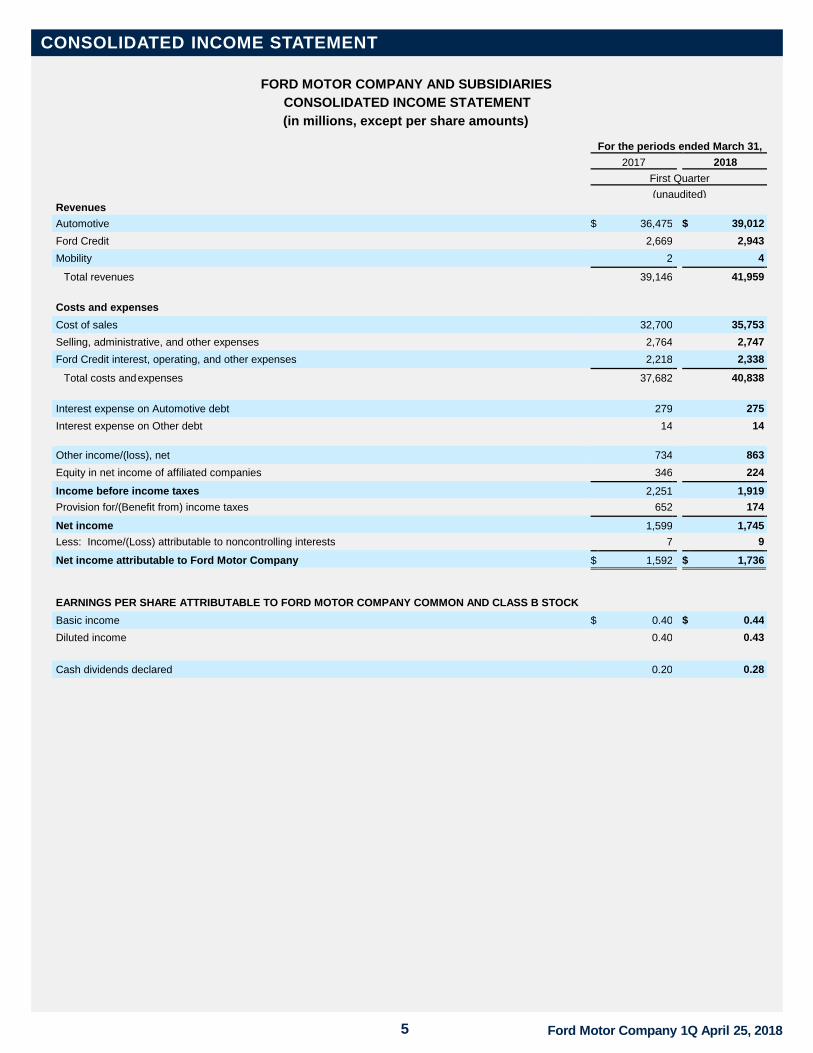
CONSOLIDATED INCOME STATEMENT
FORD MOTOR COMPANY AND SUBSIDIARIES
CONSOLIDATED INCOME STATEMENT
(in millions, except per share amounts)
For the periods ended March 31,
2017 2018
First Quarter
(unaudited)
Revenues Automotive $ 36,475 $ 39,012
Ford Credit 2,669 2,943
Mobility 2 4
Total revenues 39,146 41,959
Costs and expenses
Cost of sales 32,700 35,753
Selling, administrative, and other expenses 2,764 2,747
Ford Credit interest, operating, and other expenses 2,218 2,338
Total costs and expenses 37,682 40,838
Interest expense on Automotive debt 279 275
Interest expense on Other debt 14 14
Other income/(loss), net 734 863
Equity in net income of affiliated companies 346 224
Income before income taxes 2,251 1,919
Provision for/(Benefit from) income taxes 652 174
Net income 1,599 1,745
Less: Income/(Loss) attributable to noncontrolling interests 7 9
Net income attributable to Ford Motor Company $ 1,592 $ 1,736
EARNINGS PER SHARE ATTRIBUTABLE TO FORD MOTOR COMPANY COMMON AND CLASS B STOCK
Basic income $ 0.40 $ 0.44
Diluted income 0.40 0.43
Cash dividends declared 0.20 0.28
Ford Motor Company 1Q April 25, 20186
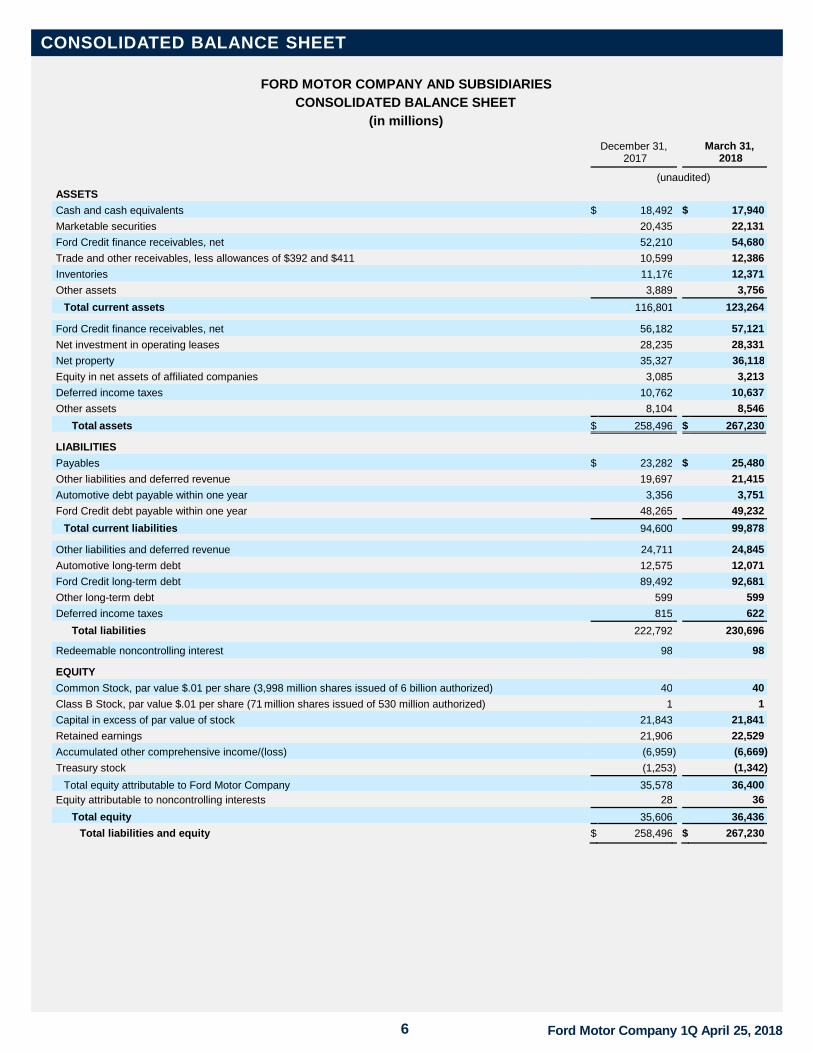
CONSOLIDATED BALANCE SHEET
FORD MOTOR COMPANY AND SUBSIDIARIES
CONSOLIDATED BALANCE SHEET
(in millions)
December 31,
2017 March 31,
2018
(unaudited)
ASSETS Cash and cash equivalents $ 18,492 $ 17,940
Marketable securities 20,435 22,131
Ford Credit finance receivables, net 52,210 54,680
Trade and other receivables, less allowances of $392 and $411 10,599 12,386
Inventories 11,176 12,371
Other assets 3,889 3,756
Total current assets 116,801 123,264
Ford Credit finance receivables, net 56,182 57,121
Net investment in operating leases 28,235 28,331
Net property 35,327 36,118
Equity in net assets of affiliated companies 3,085 3,213
Deferred income taxes 10,762 10,637
Other assets 8,104 8,546
Total assets $ 258,496 $ 267,230
LIABILITIES Payables $ 23,282 $ 25,480
Other liabilities and deferred revenue 19,697 21,415
Automotive debt payable within one year 3,356 3,751
Ford Credit debt payable within one year 48,265 49,232
Total current liabilities 94,600 99,878
Other liabilities and deferred revenue 24,711 24,845
Automotive long-term debt 12,575 12,071
Ford Credit long-term debt 89,492 92,681
Other long-term debt 599 599
Deferred income taxes 815 622
Total liabilities 222,792 230,696
Redeemable noncontrolling interest 98 98
EQUITY Common Stock, par value $.01 per share (3,998 million shares issued of 6 billion authorized) 40 40
Class B Stock, par value $.01 per share (71 million shares issued of 530 million authorized) 1 1
Capital in excess of par value of stock 21,843 21,841
Retained earnings 21,906 22,529
Accumulated other comprehensive income/(loss) (6,959 ) (6,669 )
Treasury stock (1,253 ) (1,342 )
Total equity attributable to Ford Motor Company 35,578 36,400 Equity attributable to noncontrolling interests 28 36
Total equity 35,606 36,436
Total liabilities and equity $ 258,496 $ 267,230
)
)

Ford Motor Company 1Q April 25, 20187
For the periods ended March 31,
2017 2018
First Quarter
(unaudited)
Cash flows from operating activities
Net cash provided by/(used in) operating activities $ 4,336 $ 3,514
Cash flows from investing activities Capital spending (1,706 ) (1,779
Acquisitions of finance receivables and operating leases (13,467 ) (15,683
Collections of finance receivables and operating leases 10,695 12,956
Purchases of equity and debt securities (8,878 ) (7,867
Sales and maturities of equity and debt securities 9,551 6,040
Settlements of derivatives 156 (61
Other (3 ) (150
Net cash provided by/(used in) investing activities (3,652 ) (6,544
Cash flows from financing activities Cash dividends (795 ) (1,113
Purchases of common stock — (89
Net changes in short-term debt 658 (909
Proceeds from issuance of other debt 13,253 16,953
Principal payments on other debt (11,911 ) (12,360
Other (85 ) (68
Net cash provided by/(used in) financing activities 1,120 2,414
Effect of exchange rate changes on cash, cash equivalents, and restricted cash 101 115
Net increase/(decrease) in cash, cash equivalents, and restricted cash $ 1,905 $ (501
Cash, cash equivalents, and restricted cash at January 1 $ 16,019 $ 18,638
Net increase/(decrease) in cash, cash equivalents, and restricted cash 1,905 (501
Cash, cash equivalents, and restricted cash at March 31 $ 17,924 $ 18,137
CONSOLIDATED STATEMENT OF CASH FLOWS
)
)
)
)
)
)
)
)
)
)
)
)
)
FORD MOTOR COMPANY AND SUBSIDIARIES
CONDENSED CONSOLIDATED STATEMENT OF CASH FLOWS
(in millions)
Ford Motor Company 1Q April 25, 20188
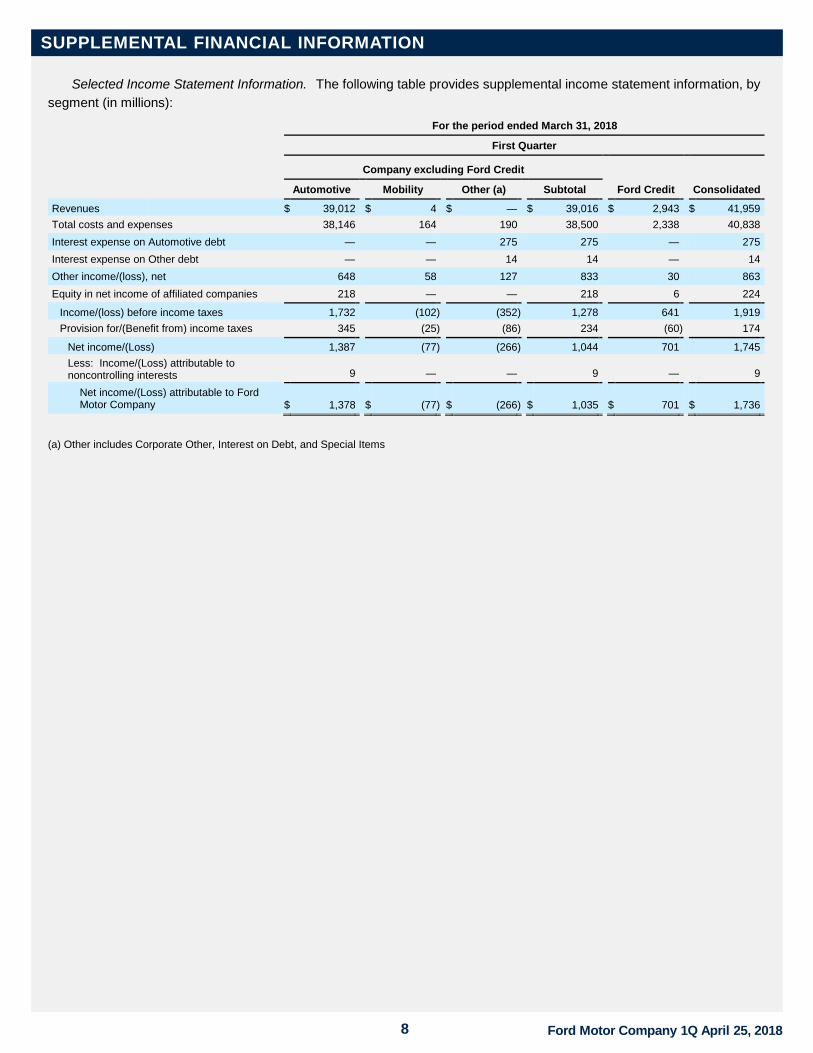
SUPPLEMENTAL FINANCIAL INFORMATION
Selected Income Statement Information. The following table provides supplemental income statement information, by
segment (in millions):
For the year ended December 31, 2017
(unaudited)
Automotive Financial Services
All Other, Special Items, & Adjustments Consolidated
Total revenues $ 145,653 $ 11,113 $ 10 $ 156,776
Total costs and expenses 142,268 9,104 591 151,963
Interest expense on Automotive debt — — 1,133 1,133
Other income/(loss), net 2,705 207 355 3,267
Equity in net income of affiliated companies 1,169 32 — 1,201
Income/(loss) before income taxes 7,259 2,248 (1,359 ) 8,148
Provision for/(Benefit from) income taxes 2,365 (696 ) (1,149 ) 520
Net income/(Loss) 4,894 2,944 (210 ) 7,628
Less: Income/(Loss) attributable to noncontrolling interests 26 — — 26
Net income/(Loss) attributable to Ford Motor Company $ 4,868 $ 2,944 $ (210 ) $ 7,602
For the period ended March 31, 2018
First Quarter
Company excluding Ford Credit
Automotive Mobility Other (a) Subtotal Ford Credit Consolidated
Revenues $ 39,012 $ 4 $ — $ 39,016 $ 2,943 $ 41,959
Total costs and expenses 38,146 164 190 38,500 2,338 40,838
Interest expense on Automotive debt — — 275 275 — 275
Interest expense on Other debt — — 14 14 — 14
Other income/(loss), net 648 58 127 833 30 863
Equity in net income of affiliated companies 218 — — 218 6 224
Income/(loss) before income taxes 1,732 (102 ) (352 ) 1,278 641 1,919
Provision for/(Benefit from) income taxes 345 (25 ) (86 ) 234 (60 ) 174
Net income/(Loss) 1,387 (77 ) (266 ) 1,044 701 1,745
Less: Income/(Loss) attributable to noncontrolling interests 9
—
—
9
—
9
Net income/(Loss) attributable to Ford Motor Company $ 1,378
$ (77 ) $ (266 ) $ 1,035
$ 701
$ 1,736
(a) Other includes Corporate Other, Interest on Debt, and Special Items
Ford Motor Company 1Q April 25, 20189
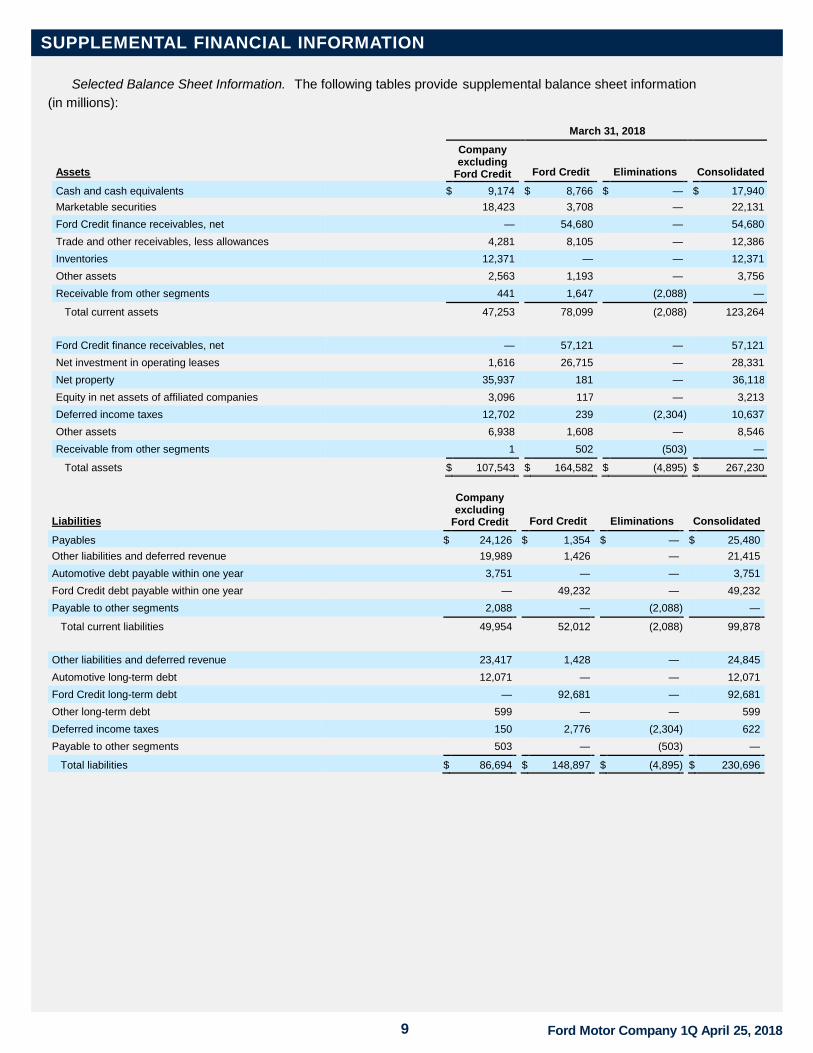
SUPPLEMENTAL FINANCIAL INFORMATIONItem 2. Management ’s Discussion and Analysis of Financial Condition and Results of Operations (Continued)
Selected Balance Sheet Information. The following tables provide supplemental balance sheet information
(in millions):
March 31, 2018
Assets
Company excluding
Ford Credit Ford Credit Eliminations Consolidated
Cash and cash equivalents $ 9,174 $ 8,766 $ — $ 17,940
Marketable securities 18,423 3,708 — 22,131
Ford Credit finance receivables, net — 54,680 — 54,680
Trade and other receivables, less allowances 4,281 8,105 — 12,386
Inventories 12,371 — — 12,371
Other assets 2,563 1,193 — 3,756
Receivable from other segments 441 1,647 (2,088 ) —
Total current assets 47,253 78,099 (2,088 ) 123,264
Ford Credit finance receivables, net — 57,121 — 57,121
Net investment in operating leases 1,616 26,715 — 28,331
Net property 35,937 181 — 36,118
Equity in net assets of affiliated companies 3,096 117 — 3,213
Deferred income taxes 12,702 239 (2,304 ) 10,637
Other assets 6,938 1,608 — 8,546
Receivable from other segments 1 502 (503 ) —
Total assets $ 107,543 $ 164,582 $ (4,895 ) $ 267,230
Liabilities
Company excluding
Ford Credit Ford Credit Eliminations Consolidated
Payables $ 24,126 $ 1,354 $ — $ 25,480
Other liabilities and deferred revenue 19,989 1,426 — 21,415
Automotive debt payable within one year 3,751 — — 3,751
Ford Credit debt payable within one year — 49,232 — 49,232
Payable to other segments 2,088 — (2,088 ) —
Total current liabilities 49,954 52,012 (2,088 ) 99,878
Other liabilities and deferred revenue 23,417 1,428 — 24,845
Automotive long-term debt 12,071 — — 12,071
Ford Credit long-term debt — 92,681 — 92,681
Other long-term debt 599 — — 599
Deferred income taxes 150 2,776 (2,304 ) 622
Payable to other segments 503 — (503 ) —
Total liabilities $ 86,694 $ 148,897 $ (4,895 ) $ 230,696

Ford Motor Company 1Q April 25, 201810
SUPPLEMENTAL FINANCIAL INFORMATIONItem 2. Management ’s Discussion and Analysis of Financial Condition and Results of Operations (Continued)
Selected Cash Flow Information. The following tables provide supplemental cash flow information (in millions):
For the period ended March 31, 2018
First Quarter
Cash flows from operating activities
Company excluding
Ford Credit Ford Credit Eliminations Consolidated
Net cash provided by/(used in) operating activities $ 3,829 $ (315 ) $ — $ 3,514
Cash flows from investing activities
Company excluding
Ford Credit Ford Credit Eliminations Consolidated
Capital spending $ (1,769 ) $ (10 ) $ — $ (1,779 )
Acquisitions of finance receivables and operating leases — (15,683 ) — (15,683 )
Collections of finance receivables and operating leases — 12,956 — 12,956
Purchases of equity and debt securities (5,580 ) (2,287 ) — (7,867 )
Sales and maturities of equity and debt securities 4,618 1,422 — 6,040
Settlements of derivatives (161 ) 100 — (61 )
Other (150 ) — — (150 )
Investing activity (to)/from other segments 1,024 153 (1,177 ) —
Net cash provided by/(used in) investing activities $ (2,018 ) $ (3,349 ) $ (1,177 ) $ (6,544 )
Cash flows from financing activities
Company excluding
Ford Credit Ford Credit Eliminations Consolidated
Cash dividends $ (1,113 ) $ — $ — $ (1,113 )
Purchases of common stock (89 ) — — (89 )
Net changes in short-term debt (128 ) (781 ) — (909 )
Proceeds from issuance of other debt 174 16,779 — 16,953
Principal payments on other debt (204 ) (12,156 ) — (12,360 )
Other (39 ) (29 ) — (68 )
Financing activity to/(from) other segments (153 ) (1,024 ) 1,177 —
Net cash provided by/(used in) financing activities $ (1,552 ) $ 2,789 $ 1,177 $ 2,414
Effect of exchange rate changes on cash, cash equivalents, and restricted cash $ 9 $ 106 $ — $ 115
Ford Motor Company 1Q April 25, 201811
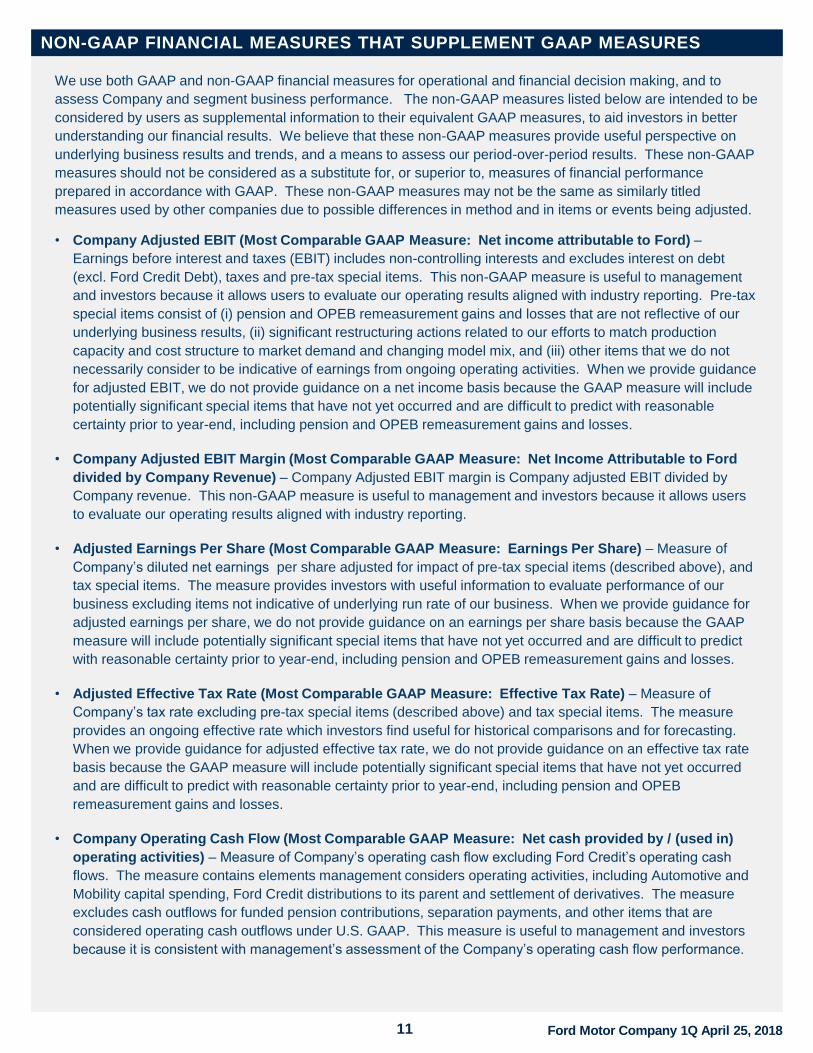
NON-GAAP FINANCIAL MEASURES THAT SUPPLEMENT GAAP MEASURES
We use both GAAP and non-GAAP financial measures for operational and financial decision making, and to
assess Company and segment business performance. The non-GAAP measures listed below are intended to be
considered by users as supplemental information to their equivalent GAAP measures, to aid investors in better
understanding our financial results. We believe that these non-GAAP measures provide useful perspective on
underlying business results and trends, and a means to assess our period-over-period results. These non-GAAP
measures should not be considered as a substitute for, or superior to, measures of financial performance
prepared in accordance with GAAP. These non-GAAP measures may not be the same as similarly titled
measures used by other companies due to possible differences in method and in items or events being adjusted.
• Company Adjusted EBIT (Most Comparable GAAP Measure: Net income attributable to Ford) –
Earnings before interest and taxes (EBIT) includes non-controlling interests and excludes interest on debt
(excl. Ford Credit Debt), taxes and pre-tax special items. This non-GAAP measure is useful to management
and investors because it allows users to evaluate our operating results aligned with industry reporting. Pre-tax
special items consist of (i) pension and OPEB remeasurement gains and losses that are not reflective of our
underlying business results, (ii) significant restructuring actions related to our efforts to match production
capacity and cost structure to market demand and changing model mix, and (iii) other items that we do not
necessarily consider to be indicative of earnings from ongoing operating activities. When we provide guidance
for adjusted EBIT, we do not provide guidance on a net income basis because the GAAP measure will include
potentially significant special items that have not yet occurred and are difficult to predict with reasonable
certainty prior to year-end, including pension and OPEB remeasurement gains and losses.
• Company Adjusted EBIT Margin (Most Comparable GAAP Measure: Net Income Attributable to Ford
divided by Company Revenue) – Company Adjusted EBIT margin is Company adjusted EBIT divided by
Company revenue. This non-GAAP measure is useful to management and investors because it allows users
to evaluate our operating results aligned with industry reporting.
• Adjusted Earnings Per Share (Most Comparable GAAP Measure: Earnings Per Share) – Measure of
Company’s diluted net earnings per share adjusted for impact of pre-tax special items (described above), and
tax special items. The measure provides investors with useful information to evaluate performance of our
business excluding items not indicative of underlying run rate of our business. When we provide guidance for
adjusted earnings per share, we do not provide guidance on an earnings per share basis because the GAAP
measure will include potentially significant special items that have not yet occurred and are difficult to predict
with reasonable certainty prior to year-end, including pension and OPEB remeasurement gains and losses.
• Adjusted Effective Tax Rate (Most Comparable GAAP Measure: Effective Tax Rate) – Measure of
Company’s tax rate excluding pre-tax special items (described above) and tax special items. The measure
provides an ongoing effective rate which investors find useful for historical comparisons and for forecasting.
When we provide guidance for adjusted effective tax rate, we do not provide guidance on an effective tax rate
basis because the GAAP measure will include potentially significant special items that have not yet occurred
and are difficult to predict with reasonable certainty prior to year-end, including pension and OPEB
remeasurement gains and losses.
• Company Operating Cash Flow (Most Comparable GAAP Measure: Net cash provided by / (used in)
operating activities) – Measure of Company’s operating cash flow excluding Ford Credit’s operating cash
flows. The measure contains elements management considers operating activities, including Automotive and
Mobility capital spending, Ford Credit distributions to its parent and settlement of derivatives. The measure
excludes cash outflows for funded pension contributions, separation payments, and other items that are
considered operating cash outflows under U.S. GAAP. This measure is useful to management and investors
because it is consistent with management’s assessment of the Company’s operating cash flow performance.

Ford Motor Company 1Q April 25, 201812
COMPANY EARNINGS PER SHARE RECONCILIATION TO
ADJUSTED EARNINGS PER SHARE
COMPANY NET INCOME RECONCILIATION TO ADJUSTED EBIT (MILS)
Memo:
2017 2018 FY 2017
Net income / (Loss) attributable to Ford (GAAP) 1,592$ 1,736$ 7,731$
Income / (Loss) attributable to non-controlling interests 7 9 26
Net income / (Loss) 1,599$ 1,745$ 7,757$
Less: (Provision for) / Benefit from income taxes (652) (174) (402)
Income / (Loss) before income taxes 2,251$ 1,919$ 8,159$
Less: Special items pre-tax 24 23 (289)
Income / (Loss) before special items pre-tax 2,227$ 1,896$ 8,448$
Less: Interest on debt (293) (289) (1,190)
Adjusted EBIT (Non-GAAP) 2,520 2,185 9,638
Memo:
Revenue (Bils) 39.1$ 42.0$ 156.8$
Adjusted EBIT Margin 6.4% 5.2% 6.1%
1Q
1Q 2017 1Q 2018
Diluted After-Tax Results (Mils)
Diluted after-tax results (GAAP) 1,592$ 1,736$
Less: Impact of pre-tax and tax special items 9 19
Adjusted net income – diluted (Non-GAAP) 1,583$ 1,717$
Basic and Diluted Shares (Mils)
Basic shares (average shares outstanding) 3,976 3,974
Net dilutive options and unvested restricted stock units 23 23
Diluted shares 3,999 3,997
Earnings per share – diluted (GAAP) 0.40$ 0.43$
Less: Net impact of adjustments - -
Adjusted earnings per share – diluted (Non-GAAP) 0.40$ 0.43$
Ford Motor Company 1Q April 25, 201813
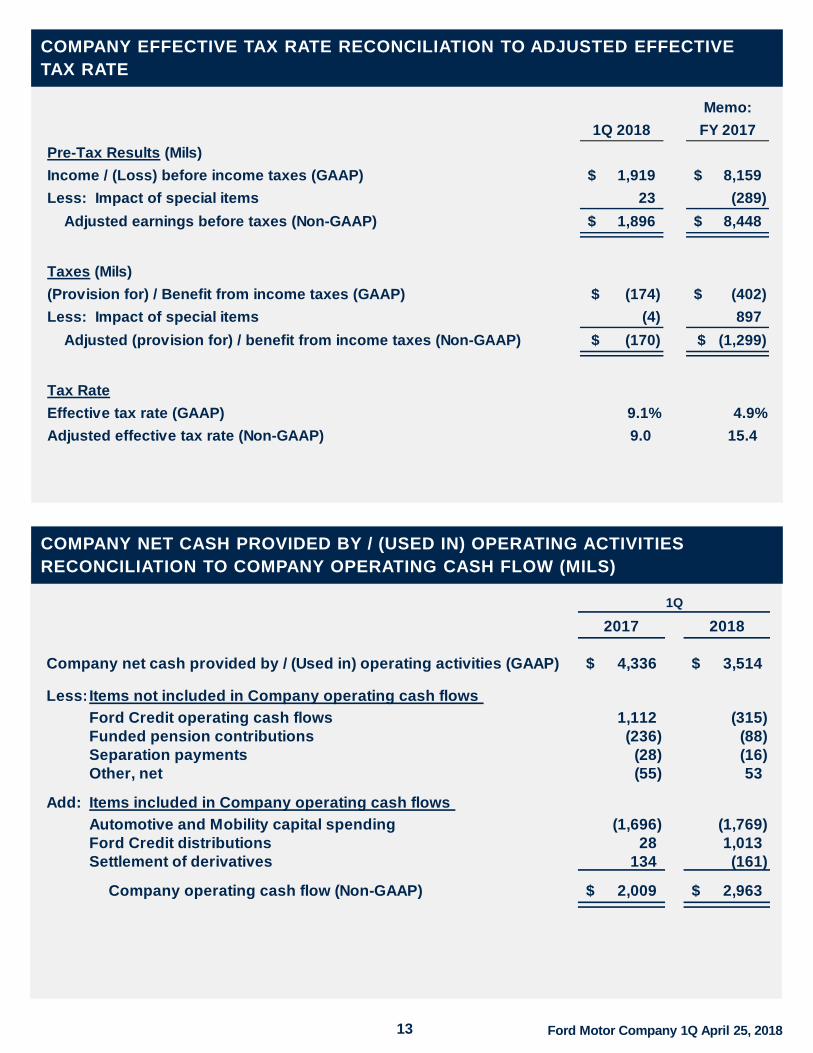
COMPANY EFFECTIVE TAX RATE RECONCILIATION TO ADJUSTED EFFECTIVE
TAX RATE
COMPANY NET CASH PROVIDED BY / (USED IN) OPERATING ACTIVITIES
RECONCILIATION TO COMPANY OPERATING CASH FLOW (MILS)
Memo:
1Q 2018 FY 2017
Pre-Tax Results (Mils)
Income / (Loss) before income taxes (GAAP) 1,919$ 8,159$
Less: Impact of special items 23 (289)
Adjusted earnings before taxes (Non-GAAP) 1,896$ 8,448$
Taxes (Mils)
(Provision for) / Benefit from income taxes (GAAP) (174)$ (402)$
Less: Impact of special items (4) 897
Adjusted (provision for) / benefit from income taxes (Non-GAAP) (170)$ (1,299)$
Tax Rate
Effective tax rate (GAAP) 9.1% 4.9%
Adjusted effective tax rate (Non-GAAP) 9.0 15.4
2017 2018
Company net cash provided by / (Used in) operating activities (GAAP) 4,336$ 3,514$
Less:Items not included in Company operating cash flows
Ford Credit operating cash flows 1,112 (315)
Funded pension contributions (236) (88)
Separation payments (28) (16)
Other, net (55) 53
Add: Items included in Company operating cash flows
Automotive and Mobility capital spending (1,696) (1,769)
Ford Credit distributions 28 1,013
Settlement of derivatives 134 (161)
Company operating cash flow (Non-GAAP) 2,009$ 2,963$
1Q

Ford Motor Company 1Q April 25, 201814
COMPANY SPECIAL ITEMS (MILS)
* Includes related tax effect on special items and tax special items
Memo:
2017 2018 FY 2017
Pension and OPEB gain / (loss)
Year end net pension and OPEB remeasurement loss -$ -$ (162)$
Other pension remeasurement gain - 26 -
Pension curtailment gain - 15 354
Separation-related actions (22) (9) (297)
Other Items
San Luis Potosi plant cancellation 46 - 41
Next-generation Focus footprint change - (9) (225)
Total pre-tax special items 24$ 23$ (289)$
Tax special items (15)$ (4)$ 897$
Memo:
Special items impact on earnings per share* -$ -$ 0.15$
1Q
Ford Motor Company 1Q April 25, 201815
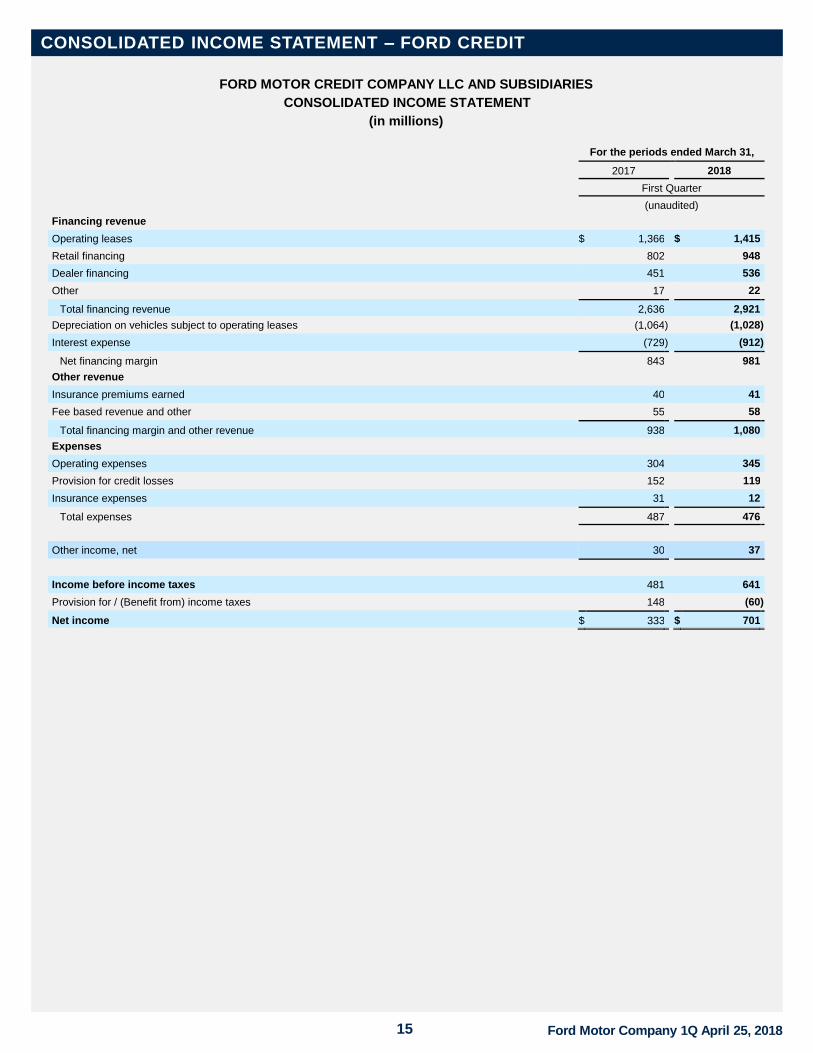
CONSOLIDATED INCOME STATEMENT – FORD CREDIT
FORD MOTOR CREDIT COMPANY LLC AND SUBSIDIARIES
CONSOLIDATED INCOME STATEMENT
(in millions)
For the periods ended March 31,
2017 2018
First Quarter
(unaudited)
Financing revenue
Operating leases $ 1,366 $ 1,415
Retail financing 802 948
Dealer financing 451 536
Other 17 22
Total financing revenue 2,636 2,921
Depreciation on vehicles subject to operating leases (1,064 ) (1,028 )
Interest expense (729 ) (912 )
Net financing margin 843 981
Other revenue
Insurance premiums earned 40 41
Fee based revenue and other 55 58
Total financing margin and other revenue 938 1,080
Expenses
Operating expenses 304 345
Provision for credit losses 152 119
Insurance expenses 31 12
Total expenses 487 476
Other income, net 30 37
Income before income taxes 481 641
Provision for / (Benefit from) income taxes 148 (60 )
Net income $ 333 $ 701

Ford Motor Company 1Q April 25, 201816
CONSOLIDATED BALANCE SHEET – FORD CREDIT
FORD MOTOR CREDIT COMPANY LLC AND SUBSIDIARIES
CONSOLIDATED BALANCE SHEET
(in millions)
December 31,
2017 March 31,
2018
(unaudited)
ASSETS
Cash and cash equivalents $ 9,558 $ 8,766
Marketable securities 2,881 3,708
Finance receivables, net 116,003 120,936
Net investment in operating leases 26,661 26,715
Notes and accounts receivable from affiliated companies 1,076 903
Derivative financial instruments 935 754
Other assets 3,329 3,301
Total assets $ 160,443 $ 165,083
LIABILITIES Accounts payable
Customer deposits, dealer reserves, and other $ 1,171 $ 1,303
Affiliated companies 592 922
Total accounts payable 1,763 2,225
Debt 137,828 141,974
Deferred income taxes 2,386 2,251
Derivative financial instruments 310 794
Other liabilities and deferred income 2,272 2,154
Total liabilities 144,559 149,398
SHAREHOLDER’S INTEREST
Shareholder’s interest 5,227 5,227
Accumulated other comprehensive income / (loss) (419 ) (306 )
Retained earnings 11,076 10,764
Total shareholder’s interest 15,884 15,685
Total liabilities and shareholder’s interest $ 160,443 $ 165,083

Ford Motor Company 1Q April 25, 201817
CONSOLIDATED STATEMENT OF CASH FLOWS – FORD CREDIT
FORD MOTOR CREDIT COMPANY LLC AND SUBSIDIARIES
CONSOLIDATED STATEMENT OF CASH FLOWS
(in millions)
For the Years Ended December 31,
2015 2016 2017
(unaudited)
Cash flows from operating activities
Net income $ 1,363 $ 1,373 $ 3,007
Adjustments to reconcile net income to net cash provided by operations Provision for credit losses 347 547 588
Depreciation and amortization 4,465 5,121 4,928
Amortization of upfront interest supplements (1,078 ) (1,341 ) (1,686 )
Net change in deferred income taxes 1,042 340 (923 )
Net change in other assets 129 (413 ) (606 )
Net change in other liabilities (348 ) 462 480
All other operating activities (210 ) 142 (123 )
Net cash provided by / (used in) operating activities $ 5,710 $ 6,231 $ 5,665
Cash flows from investing activities
Purchases of finance receivables (39,512 ) (37,494 ) (43,232 )
Principal collections of finance receivables 31,560 30,924 37,277
Purchases of operating lease vehicles (14,355 ) (14,441 ) (12,780 )
Proceeds from termination of operating lease vehicles 6,570 7,920 8,538
Net change in wholesale receivables and other short-duration receivables (5,126 ) (1,499 ) (874 )
Purchases of marketable securities (12,199 ) (7,289 ) (5,899 )
Proceeds from sales and maturities of marketable securities 12,704 6,756 6,316
Settlements of derivatives 210 215 (117 )
All other investing activities 20 (164 ) (34 )
Net cash provided by / (used in) investing activities (20,128 ) (15,072 ) (10,805 )
Cash flows from financing activities
Proceeds from issuances of long-term debt 48,124 42,971 44,994
Principal payments on long-term debt (31,474 ) (38,000 ) (39,372 )
Change in short-term debt, net 1,229 3,403 1,195
Cash distributions to parent (250 ) — (406 )
All other financing activities (101 ) (103 ) (105 )
Net cash provided by / (used in) financing activities 17,528 8,271 6,306
Effect of exchange rate changes on cash and cash equivalents (403 ) (239 ) 315
Net increase / (decrease) in cash and cash equivalents $ 2,707 $ (809 ) $ 1,481
Cash and cash equivalents at January 1 $ 6,179 $ 8,886 $ 8,077
Net increase / (decrease) in cash and cash equivalents 2,707 (809 ) 1,481
Cash and cash equivalents at December 31 $ 8,886 $ 8,077 $ 9,558
For the periods ended March 31,
2017 2018
First Quarter
(unaudited)
Cash flows from operating activities Net cash provided by / (used in) operating activities $ 1,460 $ 2,009
Cash flows from investing activities Purchases of finance receivables (9,388 ) (11,085 )
Principal collections of finance receivables 8,880 10,814
Purchases of operating lease vehicles (3,270 ) (3,592 )
Proceeds from termination of operating lease vehicles 2,166 2,481
Net change in wholesale receivables and other short-duration receivables (1,510 ) (3,668 )
Purchases of marketable securities (1,883 ) (2,287 )
Proceeds from sales and maturities of marketable securities 1,479 1,422
Settlements of derivatives 22 100
All other investing activities (11 ) 143
Net cash provided by / (used in) investing activities (3,515 ) (5,672 )
Cash flows from financing activities Proceeds from issuances of long-term debt 13,243 16,779
Principal payments on long-term debt (11,731 ) (12,156 )
Change in short-term debt, net 722 (793 )
Cash distributions to parent (28 ) (1,013 )
All other financing activities (37 ) (28 )
Net cash provided by / (used in) financing activities 2,169 2,789
Effect of exchange rate changes on cash, cash equivalents and restricted cash 58 106
Net increase / (decrease) in cash, cash equivalents and restricted cash $ 172 $ (768 )
Cash, cash equivalents and restricted cash at January 1 $ 8,185 $ 9,682
Net increase / (decrease) in cash, cash equivalents and restricted cash 172 (768 )
Cash, cash equivalents and restricted cash at March 31 $ 8,357 $ 8,914