foraging habitat preferences of bats in relation to food ... · pdf fileserotinus (schreber,...
TRANSCRIPT
113
Folia Zool. – 53(2): 113–128 (2004)
Foraging habitat preferences of bats in relation to food supply and spatial vegetation structures in a western European low mountain range forest
Jürgen KUSCH*, Claudia WEBER, Sylvia IDELBERGER and Tobias KOOB
Department of Ecology, Faculty of Biology, University of Kaiserslautern, Erwin-Schroedinger-Strasse 13/14, 67663 Kaiserslautern, Germany; *e-mail: [email protected]
Received 25 June 2003; Accepted 7 June 2004
A b s t r a c t . The habitat choice of foraging bats depends on the local food supply as well as on vegetation structures that may enable the animals to orientate by echolocation. We examined the associations of bats with different types of landscape elements. Effects of the local insect occurrence, of the canopy structure and of linear vegetation elements on the presence of bats were compared. Bat activity increased with the insect abundance (p = 0.025). Furthermore, regression analysis revealed that bat activity was positively correlated (p = 0.004) with the relative area of open canopy type (clearances, still waters), and vise versa was negatively associated with the area of closed canopy (p = 0.0005). Bat species that predominantly forage in different vertical strata (above or below the canopy), differed in the activity at the various habitat types. Pipistrelle bats and Myotis species favoured open canopy areas (p = 0.007; p = 0.029), whereas Nyctalus species were not significantly more active at this patch type, compared to closed canopy areas (p = 0.0712). Linear characteristics of the vegetation (edges, paths) in general did not regulate the local preferences of bats (p = 0.154), but they corresponded to bat activity in complex structured areas (e.g. clearances with trees; p = 0.008).
Key words: abundance, bat distribution, echolocation, habitat use, prey
Introduction
Foraging animals often move between different types of habitats, like day roosts and nocturnal foraging sites of bats. Differences in the habitat quality like the density of resources may significantly influence the fitness of individuals. Flapping flight of bats in combination with the ultrasonic echolocation is expensive in terms of metabolic cost (A r i t a & F e n t o n 1997, W i n t e r & H e l v e r s e n 1998). According to the theory of an optimal foraging strategy high fitness values of predators should depend on high energy uptake and low metabolic cost during foraging. The extent to which a resource is used should be related to the fitness inputs an animal is expecting from it. Search time for prey should therefore be minimized (M a c A r t h u r & P i a n k a 1966, K r e b s 1978, L u c a s 1983, S t e p h e n s et al. 1986) and patch preferences according to different factors that maximize energy gain often lead to aggregations of consumers in favourable patches (S m i t h 1974, H i l d r e w & T o w n s e n d 1980, T o w n s e n d & H i l d r e w 1980).
Unequal prey distribution requires cues that can be used by animals to find their food resource and help to minimize the foraging cost. Habitat structure is an important determinant of animal movement (C a r t a r & R e a l 1997). Bats experience a trade-off concerning several habitat characteristics that may influence the foraging suitability. 1. Bats should favour foraging in habitats of abundant resources. Some studies on habitat use by

114 115
bats indicated that bats aggregate in patches of highest insect availability (D e J o n g & A h l é n 1991, R a u t e n b a c h et al. 1996, K a l c o u n i s et al. 1999).
2. Spatial orientation marks at a landscape level seem to help finding suitable foraging sites. Bat activity in different patches depended on the complexity of vegetation structures that may represent “land marks” and served as orientation helps (E s t r a d a et al. 1993, B r i g h a m et al. 1997, J u n g et al. 1999, V e r b o o m et al. 1999).
3. Structural features of the vegetation at the stand level may influence the abilities of bats to forage at a patch by echolocation (B r i g h a m et al. 1997, J u n g et al. 1999, E r i c k s o n & W e s t 2003). Spatial complexity of patches, e.g. high tree density, negatively affect foraging activity by bats.
4. Strategies of predator avoidance were discussed for some bat species to influence the selection of foraging habitats, especially of forest edges instead of open areas (E k m a n & D e J o n g 1996, V e r b o o m & S p o e l s t r a 1999).
According to these hypotheses and observations, bat activities do necessarily correlate with a high insect abundance, but in addition depend on the spatial heterogeneity of the habitat. Here, we analyse the factors for patch choice of bats in an European low mountain range forest, and the resulting patterns of bat activity. An overlay of the food availability by other habitat variables, in particular spatial vegetation characteristics, in determining foraging preferences, is evaluated. Concerning the vegetation structure we focused on effects of the canopy structure as well as of linear vegetation elements. At twenty-four forest patches we measured different insect variables, and the quantity and quality of different elements of spatial structures of patches, to differentiate their significance for the foraging habitat preferences of bats. The results should help us understanding their influence on consumer community patterns and interactions in forest ecosystems, and additionally to manage forests a more bat protecting way.
Methods
F i e l d s i t e a n d c l i m a t e d a t a
Bat activity and related characteristics of forest patches were investigated in the area 49°18’–49°28’ N, 7°40’–7°55’ E of the foothills of the Palatinate Forest (“Pfälzerwald”), Germany, close to Kaiserslautern, Rhineland-Palatinate. The region is situated between 200 and 600 m above sea level. An average annual temperature of 8°C and 650–950 mm annual precipitation characterize it. Forests represent 83% of the total area of the Palatinate Forest, which is of 1770 km2 size. Conifers cover 70% of the forest area, with pines (Pinus sylvestris) representing 49% of all trees and spruce (Picea abies) being common. Deciduous forests are beech-dominated (Fagus sylvatica, representing approximately 20% of all trees), interspersed by oaks (Quercus petraea, 8%), hornbeam (Carpinus betulus), and other tree species.
Temperature, relative humidity, wind speed at 2 m above ground, clouds (in values of 25%) and brightness were measured as climate variables at all investigated forest patches along with the bat activity. Days of measurements were chosen exclusively when climate conditions seemed to be favourable for bat foraging. Types of forest patches (and designation in parentheses), where bat activity was measured, were deciduous forests (DF1, 2, 3), mixed forests (MF1, 2, 3), clearings (C1, 2, 3), clearings with some trees (CT1, 2, 3), small forest paths with closed canopy (SMP1, 2, 3), broad forest paths with open canopy

114 115
(BFP1, 2), edges of forest (EF1), edges of lakes without wood (EL1, 2), edges of lakes with wood (ELW1, 2), and edges of lakes with shrubbery (ELS1, 2).
B a t p r e s e n c e a t p a t c h e s a n d f o r a g i n g a c t i v i t y
From April to October of 1999 we measured bat activity at twenty-four different patches of the Palatinate Forest and simultaneously a variety of possibly corresponding biotic and abiotic parameters of the patches. Each of the patches was investigated three times during one night per month. Per night of measurements three different patches were investigated in different order. Measurements always began at half an hour after sunset and lasted approximately 4.5 hours. All investigation nights were chosen to be of relative high temperature (above 10°C at sunset), low wind speed and without rain, because that conditions favour bat activity.
Bat activity at a patch was determined as percentage of time intervals of 20 seconds where bat ultrasonic calls were recorded from total time of 15 minutes per patch and measurement. That means, one time interval with bat presence at a patch corresponded to 2.2% bat activity (“one-zero-sample”-method; according to M a r t i n & B a t e s o n 1986). Simultaneously the release of social calls, and of “final buzzes”, the variation of echolocation calls in short distance to a detected possible insect, was noticed. During final buzzes increasingly shorter distances between individual ultrasonic pulses characterize the echolocation sounds. The rate of final buzzes indicates the foraging activity of bats (R a c e y & S w i f t 1985, V a u g h a n et al. 1996) and may therefore characterize the quality of bat foraging habitats. Foraging activity of the bats was measured by the rate of final buzzes, independent of the success of this predation behaviour. As absolute final buzz rate the percentage of time segments with final buzzes from all time segments was defined. So, ten of hundred time segments with one or more final buzzes per segment represent a final buzz rate of 10%. The relative final buzz rate gives the number of time segments with final buzzes in relation to the number of time segments with bat activity.
The determination of species by echolocation calls only is not possible for all of the bat species that occur in the investigation area. Furthermore during activity measurements it was not possible to store all recordings that were made, because that would have led to an interruption of the measurements of bat presence at consecutive time intervals. Therefore, the echolocation calls were divided into three species groups that significantly differ in their calls audible with the detector. This allowed us to differentiate between the occurrences of species groups at different patches. One represents the genus Pipistrellus; the second is characteristic for species of the genera Nyctalus and Eptesicus, and the species Myotis myotis and Vespertilius murinus. The third type of echolocation calls is of other Myotis species, as well as of species of the genus Plecotus.
Species determination was done by evaluation of large numbers of ultrasonic echolocation and social vocalizations (P f a l z e r & K u s c h 2003) that were recorded separately from activity measurements. Additionally most of the detected bat species were identified by direct observations in roosts (control of bat boxes), and of flying animals.
S o u n d r e c o r d i n g a n d a n a l y s i s f o r g e n u s o r s p e c i e s d i s c r i m i n a t i o n
Bat echolocation and social calls were recorded via a portable ultrasound detector and processor (“Laar bridge box”, BVL VON LAAR, Bottrop, Germany). The CK40 microphone

116 117
of the detector has a flat frequency response for frequencies between 20–80 kHz. Via an amplifier a flat sensitivity of the detector up to 170 kHz is achieved. The signals were digitised in real time by the ultrasound processor that sampled at a rate of 400 kHz and time-expanded 10fold a 5.12 s digitally recorded sequence. This was stored in a memory array of the processor. The resulting sequence, lasting 51.2 seconds, was then replayed and recorded to audiotape on a Sony TCD-D8 DAT-recorder.
The time-expanded recordings were digitised and analysed in a PC at a sampling rate of 22,050 samples/s using the software VOXSCOPE Professional (Avisoft, Berlin). In combination with the 10-fold time expansion, a real-time sampling rate of 220 kHz resulted. Digitised signals were processed through a fast Fourier transformation (FFT) using a 512 points Hamming window. FFTs were calculated with 93.75% time overlap. For species or genus discrimination the oscillograms, frequency spectra and sonagrams were evaluated and compared to reference recordings or descriptions.
We identified at least 13 bat species to occur at the investigated forest patches: Eptesicus serotinus (Schreber, 1774), E. nilssonii (Keyserling et Blasius, 1839), Myotis bechsteinii (Kuhl, 1817), M. daubentonii (Kuhl, 1817), M. myotis (Borkhausen, 1797), M. mystacinus (Kuhl 1817), M. nattereri (Kuhl 1817), Nyctalus leisleri (Kuhl, 1817), N. noctula (Schreber, 1774), Pipistrellus nathusii (Keyserling et Blasius, 1839), P. pipistrellus (Schreber, 1774), P. “pygmaeus” (55 kHz phonic type), and Plecotus spec., with P. auriacus and P. auritus occurring in the investigation area in the Palatinate Forest.
I n s e c t s a n d v e g e t a t i o n v a r i a b l e s a t f o r e s t p a t c h e s
Insects were sampled by light trapping of 20 minutes duration three times per patch in every night when bat activity was measured, similar to R a u t e n b a c h et al. (1996) and G r i n d a l & B r i g h a m (1999). Light trapping was performed immediately after the measurements of bat activity at that patch, in order to avoid an influence on bat activity by the light or by attracted insects. Light traps sampled in 1.5 m height above ground with a light emission spectrum of 320–480 nm wave length (super-actinic lights). Attracted insects fell into 70% ethanol in water.
The biomass of sampled insects was calculated as wet weight according to an index based on the length of individuals (S a g e 1982). Insects were grouped into size classes of 3 mm and the number of insects per size class was counted for each forest patch. Dominance of families in insect communities of different forest patches was calculated as their relative abundance. Similarity of the dominance of families in trapped insect communities was calculated as Renkonen’s coefficient. We estimated the similarity of trapped insect communities at different forest patches by the families occurring at different patches, according to the Sörensen coefficient, as well as using the Wainstein index Kw (Kw=Re x JN; with Re=Renkonen’s coefficient, and JN=Jaccard’s coefficient). Wainstein’s index considers the taxonomical similarity of communities and their dominance structure.
From topographical maps of scale 1:5000 and by measurements and observations at the twenty-four forest locations where bat activities and other variables were investigated, we analysed the vegetation structural parameters at that sites. Parameters were evaluated at a radius of 250 m around the patches. Areas of open canopy (without trees; like clearings and still waters), closed (contiguous) canopy or complex canopy (structured areas; e.g., clearings with trees or shrubbery) and the length of linear elements along or inside the areas were measured.

116 117
S t a t i s t i c a l a n a l y s e s
To compare two samples concerning their mean values for variables (differences between insect parameters at two groups of patches), the nonparametric Mann-Whitney U test was applied. For an analysis of significance of differences between mean values of several sample groups (presence of bats, or final buzz rates at different patches), we used the Kruskal-Wallis H test as nonparametric equivalent to an analysis of variance of multiple groups. As a nonparametric equivalent to the standard correlation coefficient we used Spearman R to analyse a relationship between the variables final buzz rate and the time of presence of bats in a patch.
Linear regression analysis was used to test for significant correlations between bat activity as the dependent variable and different patch features (canopy structure, length of linear vegetation elements, and insect parameters) as independent (predictor) variables. All variables were means of 21 measurements at each of 24 forest patches. The influence of each predictor variable is expressed as a partial regression coefficient, with a surrounding confidence interval. The effect of each predictor on Y-values (bat activity) is summarised as a p-value. A low p-value indicates the predictor has a significant effect on the response variable. The R² statistic summarises how well the regression line fits the relation between Y and X (high values close to 1.0 indicate much variation in Y has been accounted for by the predictors – the regression is a good fit). We tested for a normal distribution of the measurement error in the Y variable and a constant variance over the sampling range.
Results
B a t f l i g h t a n d f o r a g i n g a c t i v i t y d i f f e r e d a m o n g f o r e s t p a t c h e s
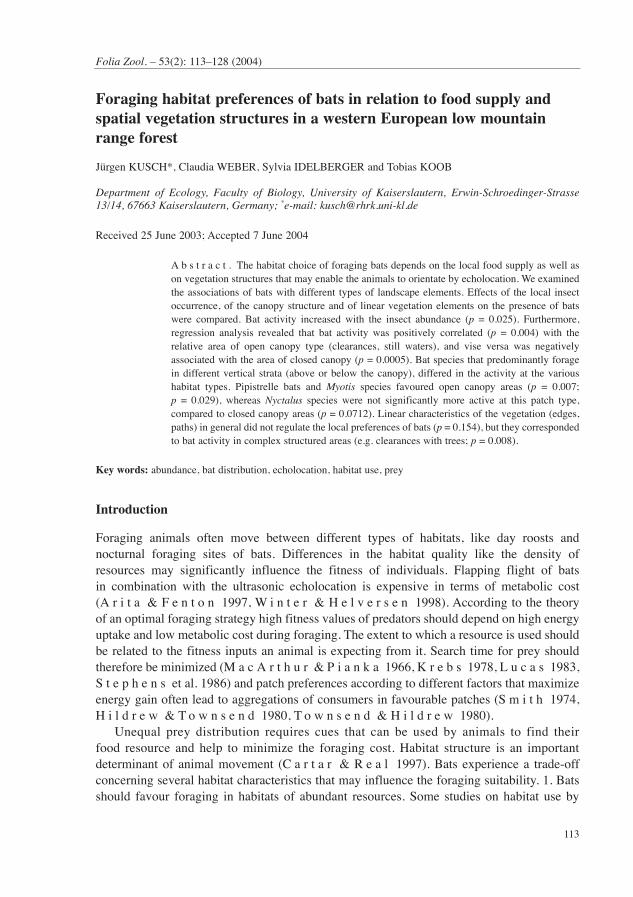
At twenty-four forest patches the mean presence of bats (“bat activity”) during the summer season (from April to October) differed significantly (Kruskal Wallis H test: H = 260.4, k = 2, n = 504, p < 0.001). Bats were most active at borders of forest lakes. Lowest bat activity was detected in three patches lying inside closed mixed forests. Forest patches of intermediate bat activity were clearances, a broad path, and the forest edge. Activities at eight patches were below 10%, 10 patches were visited by bats at 10–50% of the time evaluated, and six places, represented by the lake borders, showed bat activity at more than 50% of time (Fig. 1A).
As was observed for the presence of bats in different forest patches, also their foraging activity differed significantly among locations (Fig. 1B). At lakes the relative final buzz rate was highest, compared to all other patches (Kruskal Wallis H test: H = 280.8; k = 2; n = 504; p < 0.001). Foraging activity increased with increased time of presence at a location. So, at locations where bats were present only short time (low “bat activity”) the bats used this time of presence less for foraging, as at locations, where they were present a longer time. Spearman rank coefficients (rs) of absolute final buzz rates showed a positive correlation of bat’s time of presence and their foraging activity (rs = 0.796; n = 504; t (N-2) = 29.5; p < 0.001) at all forest patches, as at lakes only (rs = 0.693; n = 126; t (N-2) = 10.7; p < 0.001; Fig. 2). At all patches without lakes this correlation was weaker, but also significant (rs = 0.491; n = 378; t (N-2) = 10.9; p < 0.001; Fig. 2).
From 13 bat species that occurred in or nearby the investigated patches (see Methods), Pipistrellus species were most abundant at all. Their activities were highest at lakes
118 119
(57.0 ± 37,1%), compared to a mean of 8.8 ± 16,2 % at all other patches. Myotis species of group 3 or Plecotus spec. were present at lakes at similar values (58.8 ± 32.5%) as Pipistrellus, mean presence at other forest patches was low (1.8 ± 4.5%). Species of the second group (Nyctalus spec., Eptesicus spec., M. myotis) were less present at most locations (mean at lakes: 9.2± 16.1%; at other patches: 1.3 ± 5.2%).
B a t h a b i t a t s d i f f e r e d i n i n s e c t a b u n d a n c e a n d c o m m u n i t y s t r u c t u r e
Insect biomass, as represented by the wet weight of light trapped insects (Fig. 3a), was approximately half the amount (0.233 ± 0.349 g; n = 126) at lakes (patches with high bat activity values) as at all other forest patches (0.400 ± 0.686 g; n = 378; significance of
Fig. 1. Presence (A) and foraging activity (B) of bats at twenty-four different forest patches (Box-Whisker-plots; n = 21 measurements per location). The “bat activity” was measured as the relative number of time intervals (20 seconds) when bat echolocation calls were detected, compared to the total time of investigation at that patch (duration of one measurement was 15 minutes). Foraging activity was measured by the relative final buzz rates. The relative final buzz rate represents the number of time intervals (20 seconds) when bat final buzz echolocation calls were detected, compared to the number of time intervals, when bats were present.

118 119
differences between both groups of patches: Mann Whitney U test, U = 19699.5; n = 126/378; pcor = 0.004). Abundances of insects were not significantly different between the two groups of patches (Mann Whitney U test, U = 21747.5; n = 126/378; pcor = 0.143). At lakes on average 19.3 ± 51.8 insects were light trapped during 20 min per location and sampling, and 9.7 ± 15.5 insects at all other forest patches (Fig. 3b).
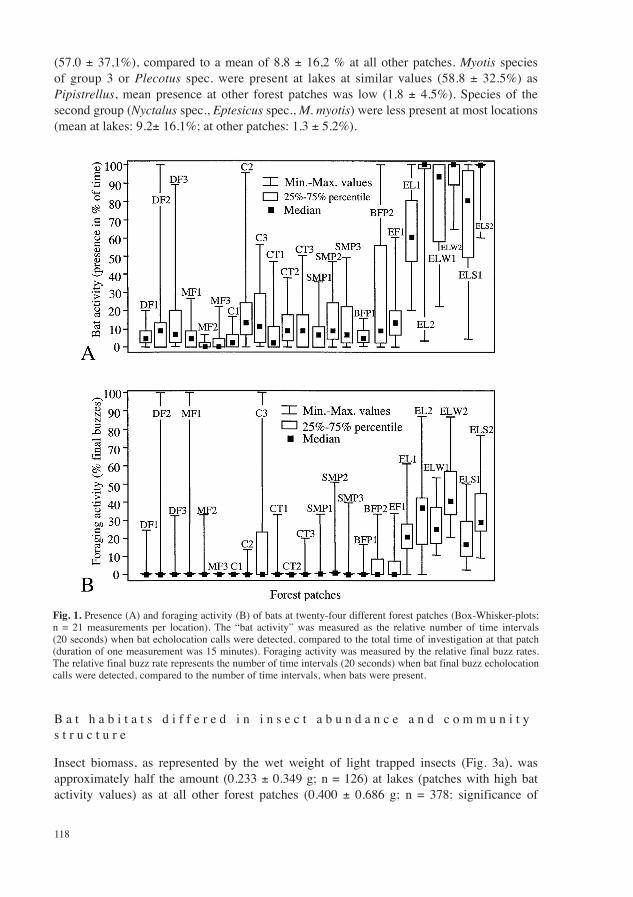
The average body sizes of insects were different at lake patches compared to other forest patches (Fig. 4). The length of 6078 insect individuals was measured and arranged into size classes. At lakes 93% of the light trapped insects were below 9 mm length, and 75% were
Fig. 2. Foraging activity, as measured by the absolute final buzz rate, in correlation to the length of time that bats were present at a location.

120 121
below 3 mm. At other forest patches 65% of the caught insects were below 9 mm, 80% were below 12 mm. Insects below 3 mm represented a minor group at these patches.
The insects that were light trapped at forest locations belonged to 100 families of the 10 insect orders Ephemeroptera, Blattodea, Psocoptera, Rhynchota, Coleoptera, Planipennia, Hymenoptera, Diptera, Trichoptera and Lepidoptera. At lake locations only 52 families of eight orders (Ephemeroptera, Rhynchota, Coleoptera, Planipennia, Hymenoptera, Diptera, Trichoptera und Lepidoptera) were caught, 97 families of all 10 orders were present at the other forest patches (Fig. 5).
Regression analysis revealed that the mean bat activity at different patches (n=24) increased with the mean insect abundance at that patches (p = 0.0250; Table 1). Mean insect biomass or diversity did not positively correlate to the mean bat activity of a forest patch (Table 1).
B a t h a b i t a t u s e d e p e n d s o n t h e s p a t i a l v e g e t a t i o n s t r u c t u r e
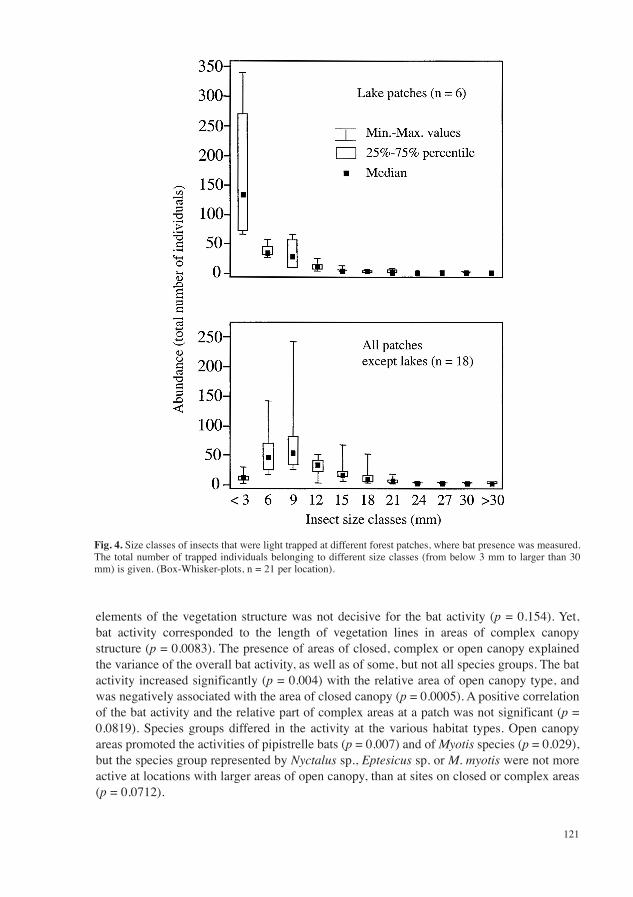
Regression analysis revealed that some vegetation structural parameters (Table 2) correlated with differences of bat activity among forest locations (Table 1). The total length of linear
Fig. 3. Insect biomass (A) and abundance (B) at the forest patches where bat activities were measured. Insects were light trapped directly after the bat presence was measured (n = 21 per location; fifteen minutes duration per trapping).
120 121
elements of the vegetation structure was not decisive for the bat activity (p = 0.154). Yet, bat activity corresponded to the length of vegetation lines in areas of complex canopy structure (p = 0.0083). The presence of areas of closed, complex or open canopy explained the variance of the overall bat activity, as well as of some, but not all species groups. The bat activity increased significantly (p = 0.004) with the relative area of open canopy type, and was negatively associated with the area of closed canopy (p = 0.0005). A positive correlation of the bat activity and the relative part of complex areas at a patch was not significant (p = 0.0819). Species groups differed in the activity at the various habitat types. Open canopy areas promoted the activities of pipistrelle bats (p = 0.007) and of Myotis species (p = 0.029), but the species group represented by Nyctalus sp., Eptesicus sp. or M. myotis were not more active at locations with larger areas of open canopy, than at sites on closed or complex areas (p = 0.0712).
Fig. 4. Size classes of insects that were light trapped at different forest patches, where bat presence was measured. The total number of trapped individuals belonging to different size classes (from below 3 mm to larger than 30 mm) is given. (Box-Whisker-plots, n = 21 per location).

122 123
Fig. 5. Diversity of insect families occurring in light traps at the different forest patches, where bat activity was measured. (Box-Whisker-plots, n = 21 per location).
Table 1. Linear regression analysis of correlations between the total bat activity (%) or the activity of bat species groups as dependent variables and different habitat characteristics as independent variables. Variables are means of 21 measurements per forest site, respectively. N = number of different forest sites, where the variables were repeatedly measured. RC = regression coefficient.
Variable Independent variable N RC SE p R2
Bat activity Insect abundance (individuals)
24 1.7982 0.7473 0.0250 0.21
Bat activity Insect biodiversity (number of families)
24 -14.1292 5.6795 0.0209 0.22
Bat activity Insect biomass (g) 24 -58.7323 28.2237 0.0493 0.16Bat activity Area of open canopy (%) 24 1.3821 0.4248 0.0036 0.32Myotis activity Area of open canopy (%) 24 0.9116 0.3909 0.0293 0.20Nyctalus activity Area of open canopy (%) 24 0.1218 0.0643 0.0712 0.14Pipistrellus activity Area of open canopy (%) 24 0.9262 0.3120 0.0071 0.29Bat activity Area of closed canopy (%) 24 -1.0880 0.2658 0.0005 0.43Bat activity Area of complex canopy (%) 24 0.8087 0.4436 0.0819 0.13Bat activity Linear elements on the total area (km) 24 -23.0624 15.6235 0.1541 0.09Myotis activity Linear elements on the total area (km) 24 -18.3999 13.2617 0.1792 0.08Nyctalus activity Linear elements on the total area (km) 24 -2.1293 2.1482 0.3324 0.04Pipistrellus activity Linear elements on the total area (km) 24 -14.5212 11.2791 0.2113 0.07Bat activity Linear elements on areas of open
canopy (km) 24 7.6726 17.2998 0.6617 0.01
Bat activity Linear elements on areas of closed canopy (km)
24 -46.8645 10.3181 0.0002 0.48
Bat activity Linear elements in areas of complex canopy (km)
24 52.5847 18.1224 0.0083 0.28
Pipistrellus activity Linear elements on areas of complex canopy (km)
24 36.4117 13.0884 0.0109 0.26
Myotis activity Linear elements in areas of complex canopy (km)
24 46.4862 15.0176 0.0053 0.30
Nyctalus activity Linear elements on areas of complex canopy (km)
24 7.0599 2.4280 0.0082 0.28
122 123
Discussion
Insectivorous nocturnal bats face a trade-off between foraging at patches of highest food supply, and spatial constraints related to finding the best patch and foraging by echolocation flight. Variability in perceptual limits can significantly change the distribution of foraging animals and better perceivers are more likely to be found at individually more profitable sites (S p e n c e r et al. 1996). Our results show that the insect abundance as well as the canopy structure of a low mountain range mixed forest significantly influenced the bat activity at different patches. Furthermore our results indicate that open canopy areas represent special habitats that may facilitate the foraging of bats. Linear elements like edges, paths and lake borders were less determining and influenced the bat activity only in special environments (a complex canopy). Three discussed possible functions of structural vegetation elements for bats are orientation clues, special foraging habitats and shelter from wind and/or predators (V e r b o o m & H u i t e m a 1997). So, the selectivity of bats for foraging patches appears
Table 2. Structural vegetation parameters at a 250 m radius around the twenty-four locations of bat activity measurements. Areas of closed, open or complex canopy are given, as well as the relative length of linear structures (paths; roads; edges of forest, clearances, or forest lakes) present in the different area types.
PatchArea types
(%; sum of absolute values = 0.2 km2)Linear elements (%) in different area types
and sum of absolute length (km)
Closed Canopy Open
Complex
Closed Canopy Open
Complex
Sum (km)
DF1 79.0 19.0 2.0 66.0 15.0 19.0 2.702DF2 95.9 4.0 0.0 59.0 41.0 0.0 1.992DF3 66.0 6.0 28.0 38.0 55.0 7.0 2.906MF1 78.2 16.3 5.4 53.0 35.0 12.0 3.142MF2 93.8 5.7 0.5 79.0 21.0 0.0 2.244MF3 88.0 3.0 9.0 82.0 11.0 7.0 1.918C1 94.0 6.0 0.0 73.0 27.0 0.0 2.321C2 78.0 17.0 5.0 51.6 35.8 12.6 3.083C3 93.0 7.0 0.0 60.0 36.0 4.0 2.263CT1 49.0 0.0 51.0 34.0 36.0 30.0 1.961CT2 65.0 8.0 27.0 40.0 55.0 5.0 3.132CT3 79.0 1.0 20.0 42.5 57.5 0.0 1.942SMP1 70.0 0.0 30.0 47.6 38.5 13.9 2.241SMP2 85.0 11.0 4.0 63.0 8.0 29.0 2.967SMP3 99.5 0.5 0.0 85.0 15.0 0.0 2.445BFP1 91.0 9.0 0.0 83.0 17.0 0.0 2.035BFP2 93.0 7.0 0.0 51.0 48.0 0.0 2.399EF1 71.0 9.0 20.0 39.4 28.4 32.2 2.370EL1 42.0 46.0 12.0 39.0 36.0 25.0 1.742EL2 57.8 14.6 27.6 28.0 23.0 49.0 2.335ELW1 66.0 27.0 7.0 53.0 30.0 17.0 1.962ELW2 55.0 12.0 33.0 27.5 37.9 34.6 2.314ELS1 25.7 53.7 20.6 31.0 43.0 26.0 1.937ELS2 47.0 19.0 34.0 19.0 60.0 21.0 2.120
124 125
to be constrained by costs and the possibility of searching for and discriminating between different forage resources.
F o o d s u p p l y d e t e r m i n e s t h e q u a l i t y o f a p a t c h
Highly specialized, non-opportunistic predators, like the barbastelle bat Barbastella barbastellus, relying on a few prey types, must find areas providing their basic prey in abundance. Variables showing a significant positive relationship with habitat use by Barbastelle bats in the Swiss Alps indicated that the biologically most productive parts of the forest were exploited in priority (S i e r r o 1999). The results showed a clear preference by barbastelle bats for richly structured forests. Only few studies in other bat species could show that insect availability and bat presence are directly correlated. Nocturnal patterns of activity by the New Zealand long-tailed bat (Chalinolobus tuberculatus) varied significantly in relation to habitat, season, time of nocturnal measurement, temperature, and invertebrate activity (O ’ D o n n e l l 2000). Most bat passes were along roads within forest, and along forest edges, much less in open grassland and within forest. Analysis of deviance models indicated that habitat, season, minimum overnight temperature, and invertebrate activity contributed to explaining the activities of bats. Invertebrate activity was more significant than minimum temperature in explaining the amount of foraging activity per night, inferring that minimum temperature determines whether bats fly at night, while invertebrate activity determines how long bats feed.
R a u t e n b a c h et al. (1996) quantified bat distribution and activity and measured insect abundance at sites in riverine and dry woodland savannah in the Kruger National Park, South Africa. Bat activity was related significantly to insect abundance, and the data demonstrated the important influence of insects on the activity patterns of insectivorous bats. This is supported by our data on the bat foraging activity in relation to the insect abundance and to bats’ time of presence at patches. The correlations indicate that the bat activity at patches increases with the foraging possibilities, indicating that food supply of patches regulates the bat activity at those sites. Final buzz rates (indicating foraging activities) didn’t show this correlation at all locations investigated. Predominant functions of some patches may be related to the presence of roost sites or to the use as commuting routes.
L o c a l v e g e t a t i o n s t r u c t u r e i n f l u e n c e s t h e p a t c h p r e f e r e n c e s
Our results show that in addition to food resources the spatial vegetation structures of a low mountain range mixed forest significantly influence the use of special patches by foraging bats. Open forest areas like clearances and lakes were most attractive to bats. These findings are consistent with several other studies. Habitats associated with broadleaved woodland and water in Britain were most preferred, while arable land, moor land and improved grassland were strongly avoided (W a l s h & H a r r i s 1996). In special habitat types in wood of southern British Columbia, Canada, bat foraging activity paralleled insect availability, being greatest along edges (G r i n d a l & B r i g h a m 1999). However, in the forest where insect availability was high virtually no bat foraging activity was detected. High foraging rates along edges indicated that bats foraged most efficiently in this habitat type. The results suggested that the spatial complexity of a habitat, in combination with insect availability, influenced the habitat use by foraging bats.

124 125
The wood stand type and vertical strata are important for the habitat use by bats. In the boreal forest of central Saskatchewan echolocation calls across forest types and through the canopy of mature forest were monitored (K a l c o u n i s et al. 1999). There were significantly more bat passes per night of little brown (Myotis lucifugus), northern long-eared (M. septentrionalis), big brown (Eptesicus fuscus) or silver-haired (Lasionycteris noctivagans), and hoary (Lasiurus cinereus) bats in an aspen-white spruce mixed wood forest than in aspen or jack pine (Pinus banksiana) forest. There was no difference in the proportion of feeding buzzes recorded from aspen-white spruce mixed-wood and aspen forest and also no difference in the number of feeding buzzes recorded among three canopy heights.
Three-dimensional structural clutter is a major factor affecting habitat choice by insectivorous bats. B r i g h a m et al. (1997) artificially increased clutter at two sites used by bats without affecting prey availability. The available insect prey did not differ between treatment and control sites, indicating that only the spatial complexity of the habitat type was manipulated. Artificial clutter negatively affected foraging activity by small bats (Myotis sp.), supporting the hypothesis that physical clutter does affect foraging by bats.
The importance of open forest areas like clearances was observed in forest habitats altered by harvesting, also (G r i n d a l & B r i g h a m 1998). In the summer after cutblocks were created forest habitats showed increased bat activity. In contrast to bat activity, insect availability was unaffected by harvesting activities. Forest openings offer opportunities for bats to forage, which may be less possible for many species in dense vegetation.
L i n e a r v e g e t a t i o n e l e m e n t s m a y s e r v e a s o r i e n t a t i o n c l u e s
We observed an importance of linear structures for bat activity in complex structured forest areas. Foraging bats may trade-off between the abundance of insects and the ease of patch finding. R o b i n s o n & S t e b b i n g s (1997) observed that Eptesicus serotinus usually commuted along lines of trees and hedges and over pastures from roost to feeding areas. This resulted in greater distances being travelled than if they had flown by a direct route from roosts to foraging habitats. Linear vegetation features also were selected by bats in several landscapes in Britain, demonstrating the importance of habitat continuity to bats (W a l s h & H a r r i s 1996). The relation between two bat species, the pipistrelle (Pipistrellus pipistrellus) and the serotine (Eptesicus serotinus) and linear landscape elements such as hedgerows, tree lines and tree lanes was studied in an agricultural area in The Netherlands (V e r b o o m & H u i t e m a 1997). The pipistrelle was observed almost entirely close to landscape elements, while serotines more frequently crossed fields and meadows. Serotine activity in these open areas was, however, negatively related to the distance to a landscape element and to wind speed. On a landscape scale the results indicate a more than proportional positive relation between the density of serotine bats and the density of linear landscape elements, whereas this relation was only proportional in the case of the pipistrelle. It was argued, that landscapes with a high density of linear elements have a surplus value for serotine bats. Linear elements may help to find foraging patches and thereby may minimize cost of patch search behaviour. This indicates that bats in agricultural landscapes favour patches with acoustical guiding lines around them.

126 127
S t i l l w a t e r s u r f a c e , l a k e e d g e s a n d o p t i m a l e c h o l o c a t i o n Among the twenty-four forest patches we investigated in the present work, the highest bat activities were measured at forest lakes. In 10 land use types of southwest England the total bat activity was positively correlated with air temperature, and once adjusted for temperature, also was significantly higher over rivers and lakes than over other land use types (V a u g h a n et al. 1997). Bats that use frequency-modulated echolocation calls were recorded in nine of 10 land use types, where rivers and lakes supported high levels of activity of these species. The distribution of foraging Myotis daubentonii and Pipistrellus pipistrellus bats along an upland river was related to the smoothness of the water surface and the extent of bank side vegetation (W a r r e n et al. 2000). It was found that both bat species significantly preferred sections of the river with smooth water surfaces and trees on both banks. The distribution of bats probably correlated with the densities of insects that were higher in sections with trees on both sides and therefore had a smooth water surface. Bat activity may also have been related to the avoidance of noise from rough water areas, which interferes with echolocation. From pond bats (Myotis dasycneme) it is known that they use landscape elements as acoustic landmarks. The bats perceive still water banks by gradually adapting their pulse emissions to the distance to the banks (V e r b o o m et al. 1999).
From these observations we conclude that freshwaters with a smooth surface are favourite foraging patches of some bat species, because they combine three essential characteristics: 1) a relative high insect availability, 2) a simple acoustic environment (without clutter) that facilitates foraging by echolocation, and 3) edges and banks as acoustic landmarks that enable large-scale orientation. Nevertheless, different bat species have more or less specialized foraging strategies. So, there is a close relationship between morphology and diet in some communities of insectivorous bats, and niche differentiation in response to competition should have developed (H e l l e r & H e l v e r s e n 1989, K i n g s t o n et al. 2000). Therefore local ecological factors should play a role in determining the composition and structure of bat communities (A r i t a & F e n t o n 1997), and the small-scale vegetation characteristics of foraging patches decide the distribution of different species at a given patch (for example, some species forage in areas with high level of clutter; P a v e y et al. 2001).
A c k n o w l e d g e m e n t s
We thank Guido P f a l z e r and Helmut J. S c h m i d t (Kaiserslautern, both) and Andreas K i e f e r (Mainz) for support of the work. Helpful comments of two anonymous reviewers are gratefully acknowledged. The work was granted by the Ministerium für Umwelt und Forsten of Rheinland-Pfalz, Mainz.
L I T E R A T U R E
ARITA H. T. & FENTON M. B. 1997: Flight and echolocation in the ecology and evolution of bats. TREE 12: 53–58.
BRIGHAM R. M., GRINDAL S. D., FIRMAN M. C. & MORISSETTE J. L. 1997: The influence of structural clutter on activity patterns of insectivorous bats. Can. J. Zool. 75: 131–136.
CARTAR R. V. & REAL L. A. 1997: Habitat structure and animal movement: the behaviour of bumble bees in uniform and random spatial resource distributions. Oecologia 112: 430–434.

126 127
DE JONG J. & AHLÉN I. 1991: Factors affecting the distribution patterns of bats in Uppland, central Sweden. Holarct. Ecol. 14: 92–96.
EKMAN M. & DE JONG J. 1996: Local patterns of distribution and resource utilization of four bat species (Myotis brandti, Eptesicus nilssoni, Plecotus auritus and Pipistrellus pipistrellus) in patchy and continuous environments. J. Zool. 238: 571–580.
ERICKSON J. L. & WEST S. D. 2003: Associations of bats with local structure and landscape features of forested stands in western Oregon and Washington. Biol. Conserv. 109: 95–102.
ESTRADA A., COATES-ESTRADA R. & MERITT D. 1993: Bat species richness and abundance in tropical rain forest fragments and in agricultural, habitats at Los Tuxtlas, Mexico. Ecography 16: 309–318.
GRINDAL S. D. & BRIGHAM R. M. 1998: Short-term effects of small-scale habitat disturbance on activity by insectivorous bats. J. Wildl. Manage. 62: 996–1003.
GRINDAL S. D. & BRIGHAM R. M. 1999: Impacts of forest harvesting on habitat use by foraging insectivorous bats at different spatial scales. Écoscience 6: 25–34.
HELLER K.-G. & HELVERSEN O. von, 1989: Resource partitioning of sonar frequency bands in rhinolophoid bats. Oecologia 80: 178–186.
HILDREW A. G. & TOWNSEND C. R. 1980: Aggregation, interference and the foraging by larvae of Plectrocnemia conspera (Trichoptera: Polycentropodidae). Anim. Behav. 28: 553–560.
JUNG T. S., THOMPSON I. D., TITMAN R. D. & APPLEJOHN A. P. 1999: Habitat selection by forest bats in relation to mixed-wood stand types and structure in central Ontario. J. Wildl. Manage. 63: 1306–1319.
KALCOUNIS M. C., HOBSON K. A., BRIGHAM R. M. & HECKER K. R. 1999: Bat activity in the boreal forest: Importance of stand type and vertical strata. J. Mammal. 80: 673–682.
KINGSTON T., JONES G., ZUBAID A. & KUNZ T. H. 2000: Resource partitioning in rhinolophid bats revisited. Oecologia 124: 332–342.
KREBS J. R. 1978: Optimal foraging: decision rules for predators. In: Krebs J. R. & Davies N. B. (eds), Behavioural ecology: an evolutionary approach. Blackwell, Oxford: 23–63.
LUCAS J. R. 1983: The role of foraging time constraints and variable prey encounter in optimal diet choice. Am. Nat. 122: 191–209.
MACARTHUR R. H. & PIANKA E. R. 1966: On optimal use of a patchy environment. Am. Nat. 100: 603–609.MARTIN P. & BATESON P. 1986: Measuring behaviour – an introductory guide. University Press, Cambridge. O’DONNELL C. F. J. 2000: Influence of season, habitat, temperature, and invertebrate availability on nocturnal
activity of the New Zealand Long-tailed Bat (Chalinolobus tuberculatus). N. Z. J. Zool. 27: 207–221.PAVEY C. R., GRUNWALD J.-E. & NEUWEILER G. 2001: Foraging habitat and echolocation behaviour of
Schneider’s Leafnosed Bat, Hipposideros speoris, in a vegetation mosaic in Sri Lanka. Behav. Ecol. Sociobiol. 50: 209–218.
PFALZER G. & KUSCH J. 2003: Structure and variability of bat social calls: implications for specificity and individual recognition. J. Zool. 261: 21–33.
RACEY P. A. & SWIFT S. M. 1985: Feeding ecology of Pipistrellus pipistrellus (Chiroptera: Vespertilionidae) during pregnancy and lactation. 1. Foraging behaviour. J. Anim. Ecol. 53: 205–215.
RAUTENBACH I. L., FENTON M. B. & WHITING M. J. 1996: Bats in riverine forests and woodlands – a latitudinal transect in southern Africa. Can. J. Zool. 74: 312–322.
ROBINSON M. F. & STEBBINGS R. E. 1997: Home range and habitat use by the Serotine Bat, Eptesicus serotinus, in England. J. Zool. 243: 117–136.
SAGE R. 1982: Wet and dry-weight estimates of insects and spiders based on lenght. Am. Midl. Nat. 108: 407–411.
SIERRO A. 1999: Habitat selection by Barbastelle Bats (Barbastella barbastellus) in the Swiss Alps (Valais). J. Zool. 248: 429–432.
SMITH J. N. M. 1974: The food searching behaviour of two European thrushes. II. The adaptiveness of the search patterns. Behaviour 49: 1–61.
SPENCER H. G., KENNEDY M. & GRAY R. D. 1996: Perceptual constraints on optimal foraging – the effects of variation among foragers. Evol. Ecol. 10: 331–339.
STEPHENS D. W., LYNCH J. F., SORENSEN A. E. & GORDON C. 1986: Preferences and profitability: theory and experiment. Am. Nat. 127: 533–553.
TOWNSEND C. R. & HILDREW A. G. 1980: Foraging in a patchy environment by a predatory net-spining caddis larva: a test for optimal foraging theory. Oecologia 47: 219–221.
VAUGHAN N., JONES G. & HARRIS S. 1996: Effects of sewage effluent on the activity of bats (Chiroptera: Vespertilionidae) foraging along rivers. Biol. Conserv. 78: 337–343.

128
VAUGHAN N., JONES G. & HARRIS S. 1997: Habitat use by bats (Chiroptera) assessed by means of a broad-band acoustic method. J. Appl. Ecol. 34: 716–730.
VERBOOM B. & HUITEMA H. 1997: The importance of linear landscape elements for the pipistrelle Pipistrellus pipistrellus and the serotine bat Eptesicus serotinus. Landsc. Ecol. 12: 117–125.
VERBOOM B. & SPOELSTRA K. 1999: Effects of food abundance and wind on the use of tree lines by an insectivorous bat, Pipistrellus pipistrellus. Can. J. Zool. 77: 1393–1401.
VERBOOM B., BOONMAN A. M. & LIMPENS H. J. G. A., 1999: Acoustic perception of landscape elements by the pond bat (Myotis dasycneme). J. Zool. 248: 59–66.
WALSH A. L. & HARRIS S. 1996: Foraging habitat preferences of vespertilionid bats in Britain. J. Appl. Ecol. 33: 508–518.
WARREN R. D., WATERS D. A., ALTRINGHAM J. D. & BULLOCK D. J. 2000: The distribution of Daubenton’s bats (Myotis daubentonii) and pipistrelle bats (Pipistrellus pipistrellus) (Vespertilionidae) in relation to small-scale variation in riverine habitat. Biol. Conserv. 92: 85–91.
WINTER Y. & HELVERSEN O. von, 1998: The energy cost of flight: do small bats fly more cheaply than birds? J. Comp. Physiol. Ser. B 168: 105–111.