for the year ended 31 december 2014 - aib personal … · for the year ended 31 december 2014. ......
TRANSCRIPT
Allied Irish Banks p.l.c.
STRICTLY CONFIDENTIAL - COMMERCIALLY SENSITIVE MATERIAL
2014 Annual Financial Results For the year ended 31 December 2014
Allied Irish Banks p.l.c. – Data as at 31/12/2014 2
Important information and forward looking statement
Important Information
AIB has 523,438,445,437 (excluding 35,680,114 treasury shares) ordinary shares in issue, c. 99.8% of which are held by the Ireland Strategic Investment Fund
(ISIF), mainly following the issue of 500 billion ordinary shares to the National Pensions Reserve Fund Commission (the predecessor to the ISIF) at €0.01
per share in July 2011. Based on the number of ordinary shares currently in issue and the closing share price of 3 March 2015, AIB trades on a valuation
multiple of c. 6x (excluding the 2009 preference shares) the net asset value (NAV) of the Group as at 31 December 2014. The Group continues to note that
the median for comparable European banks is c. 1x NAV.
This presentation should be considered with AIB’s Annual Financial Report for 2014 and all other relevant market disclosures, copies of which can be found
at the following link:
investorrelations.aib.ie
Forward-looking statement
This document contains certain forward-looking statements with respect to the financial condition, results of operations and business of AIB Group and
certain of the plans and objectives of the Group. These forward-looking statements can be identified by the fact that they do not relate only to historical or
current facts. Forward-looking statements sometimes use words such as ‘aim’, ‘anticipate’, ‘target’, ‘expect’, ‘estimate’, ‘intend’, ‘plan’, ‘goal’, ‘believe’, ‘may’,
‘could’, ‘will’, ‘seek’, ‘continue’, ‘should’, ‘assume’, or other words of similar meaning. Examples of forward-looking statements include, among others,
statements regarding the Group’s future financial position, capital structure, Government shareholding in the Group, income growth, loan losses, business
strategy, projected costs, capital ratios, estimates of capital expenditures, and plans and objectives for future operations. Because such statements are
inherently subject to risks and uncertainties, actual results may differ materially from those expressed or implied by such forward-looking information. By
their nature, forward-looking statements involve risk and uncertainty because they relate to events and depend on circumstances that will occur in the
future. There are a number of factors that could cause actual results and developments to differ materially from those expressed or implied by these
forward-looking statements. These are set out in the Principal Risk and Uncertainties on pages 51 to 56 in the 2014 Annual Financial Report. In addition to
matters relating to the Group’s business, future performance will be impacted by Irish, UK and wider European and global economic and financial market
considerations. Any forward-looking statements made by or on behalf of the Group speak only as of the date they are made. The Group cautions that the
list of important factors on pages 51 to 56 of the 2014 Annual Financial Report is not exhaustive. Investors and others should carefully consider the
foregoing factors and other uncertainties and events when making an investment decision based on any forward-looking statement.

3
Welcome
Chairman
Richard Pym

Allied Irish Banks p.l.c. – Data as at 31/12/2014 4
Table of contents
Group Progress & Performance 5
2014 Full Year Financials 11
Asset Quality 26
Delivering our Strategy 29
Overall Summary 33
Appendix 35

5
Group Progress & Performance
Chief Executive Officer
David Duffy
Allied Irish Banks p.l.c. – Data as at 31/12/2014 6
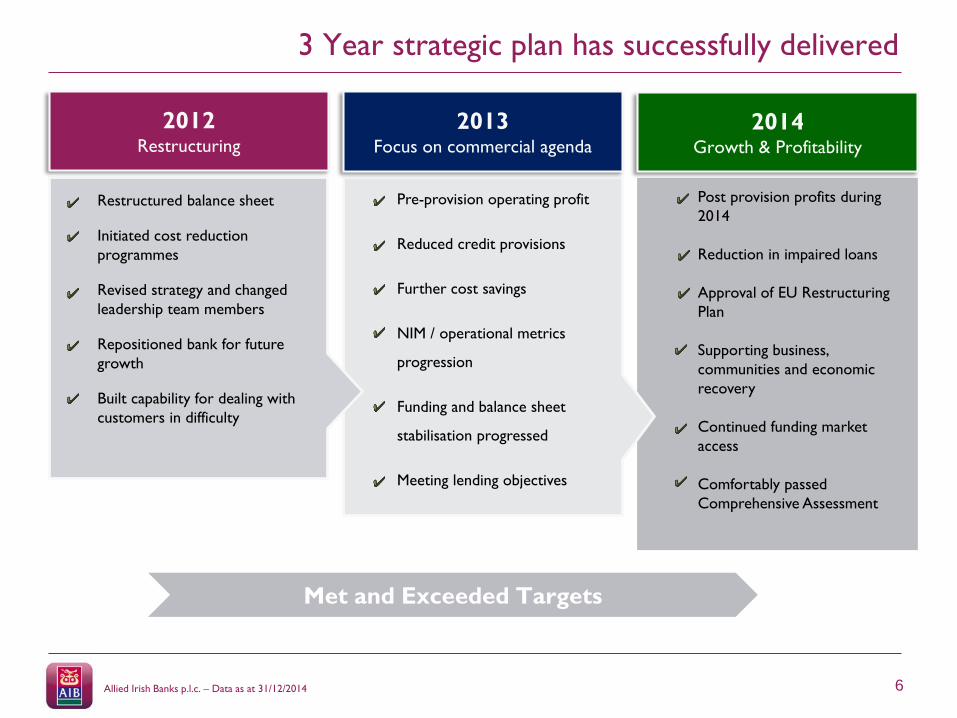
3 Year strategic plan has successfully delivered
2013Focus on commercial agenda
2014Growth & Profitability
2012Restructuring
₋ Restructured balance sheet
₋ Initiated cost reduction
programmes
₋ Revised strategy and changed
leadership team members
₋ Repositioned bank for future
growth
₋ Built capability for dealing with
customers in difficulty
₋ Pre-provision operating profit
₋ Reduced credit provisions
₋ Further cost savings
₋ NIM / operational metrics
progression
₋ Funding and balance sheet
stabilisation progressed
₋ Meeting lending objectives
Post provision profits during
2014
Reduction in impaired loans
Approval of EU Restructuring
Plan
Supporting business,
communities and economic
recovery
Continued funding market
access
Comfortably passed
Comprehensive Assessment
Met and Exceeded Targets
Allied Irish Banks p.l.c. – Data as at 31/12/2014 7
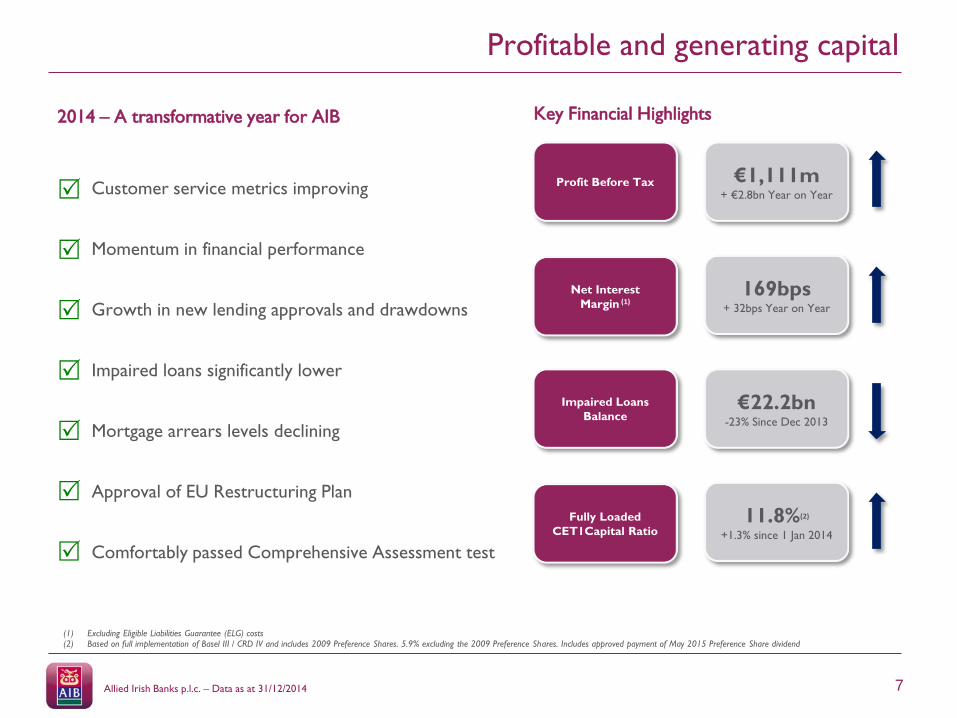
Profitable and generating capital
€1,111m+ €2.8bn Year on Year
€22.2bn-23% Since Dec 2013
169bps+ 32bps Year on Year
11.8%(2)
+1.3% since 1 Jan 2014
Profit Before Tax
Impaired Loans
Balance
Net Interest
Margin (1)
Fully Loaded
CET1Capital Ratio
(1) Excluding Eligible Liabilities Guarantee (ELG) costs(2) Based on full implementation of Basel III / CRD IV and includes 2009 Preference Shares. 5.9% excluding the 2009 Preference Shares. Includes approved payment of May 2015 Preference Share dividend
2014 – A transformative year for AIB
• Customer service metrics improving
• Momentum in financial performance
• Growth in new lending approvals and drawdowns
• Impaired loans significantly lower
• Mortgage arrears levels declining
• Approval of EU Restructuring Plan
• Comfortably passed Comprehensive Assessment test
Key Financial Highlights

Allied Irish Banks p.l.c. – Data as at 31/12/2014 8
Supporting our customers and economic recovery
Summary
• Leading market shares in core Irish target markets
- Targeting €7 – 10bn in lending per annum
• Lending approvals and drawdowns increased during 2014
- Approvals include significant restructuring activity in FSG
as impaired loans are reduced and migrated back to
performing grades
• Group asset yield increased to 2.94% in H2 2014 (2.83% in H2
2013) in part due to the margin on new lending volumes
ROI Mortgage Drawdowns
Corporate / Business Lending (Ex UK) c.€2.5bn+ 51% Year on Year
c.€1.3bn+34% Year on Year
UK Drawdowns c.€1.7bn+75% Year on Year
€bn
Dec 2013 Dec 2014
8,578
11,300
2,9504,208
1,017
1,886
940
1,645
9,595
13,186
3,890
5,853
0
3,000
6,000
9,000
12,000
15,000
2013 2014 2013 2014
ROI UK
€mLending
Approvals
Lending
Drawdowns
ROI Personal Lending Drawdowns c.€0.4bn+29% Year on Year
2014 Lending Statistics
44.311.2
10.2
44.1
10.4
8.9
Net Loans by Operating Segment
Domestic Core Bank AIB UK FSG
Overall Lending Drawdowns c.€5.9bn+50% Year on Year
(1)
(1) Lending figures in the Republic of Ireland includes Corporate Banking North America(2) Lending figures in the UK includes refinancing
(2)

Allied Irish Banks p.l.c. – Data as at 31/12/2014 9
Delivering solutions for customers in financial difficulty
(1) By number of accounts
• Significant momentum in implementing sustainable solutions with
customers in difficulty
• Overall impaired loans down 23% as restructuring activity
accelerates
- Impaired loans lower across all major loan categories
• Arrears levels in ROI mortgage portfolio have decreased significantly
• 27% increase in the number of mortgage accounts in some form of
forbearance
• Continued reduction in impaired volumes a key priority for 2015
Summary
BTL Arrears -7% in 2014
-18% in 2014
Owner Occupier Arrears -22% in 2014
Overall Arrears Levels
Arrears in RoI Mortgage Portfolio (1)
28.9
22.2
15.0
20.0
25.0
30.0
Dec 13 Dec 14
%
Specific Provisions / Impaired Loan Coverage Ratio
55% 51%
Impaired loans€bn
Non Mortgage Restructure Progress
• Non mortgage customers typically have exposures across a
number of asset classes including SME debt, associated property
exposures and buy-to-let mortgages
• Met or exceeded our restructuring targets for non mortgage
customers during 2014
- Majority of offered restructures are expected to complete
during 2015
• €4.7bn of non mortgage loans subject to forbearance measures at
December 2014

Allied Irish Banks p.l.c. – Data as at 31/12/2014 10
Further progress towards medium term targets
Original Medium
Term Target2013 2014 Status Update
Fully Loaded CET 1 Capital Ratio >10% 10.5%(1) 11.8%(1) On track
Net Interest Margin
(Ex Eligible Liabilities Guarantee)>2% 1.37% 1.69% On track
Cost / Income Ratio <50% 76%(2) 55%(2) On track
Credit Impairment Charge <65bps 224bps
(22)bps
46bps excl. FSG
On track
Loan /Deposit Ratio 100% - 120% 100% 99% On track
(1) Based on full implementation of Basel III / CRD IV and includes 2009 Preference Shares. 5.9% excluding Preference Shares at 31 December 2014. 2014 ratio includes the approved payment of the May 2015 Preference Share dividend. Discussions are ongoing with Department of Finance in respect of capital structure considerations
(2) Excludes exceptional cost items. 2014 income includes income from balance sheet actions and realisations in the period.
11
2014 Full Year Financials
Chief Financial Officer
Mark Bourke

Allied Irish Banks p.l.c. – Data as at 31/12/2014 12
Momentum in financial performance
(2,529)
(1,904)
188
(3,000)
(2,500)
(2,000)
(1,500)
(1,000)
(500)
-
500
2012 2013 2014
Total provisions (charge) / writeback
(3,729)
(1,687)
1,111
-4,000
-2,000
0
2,000
2012 2013 2014
Profit/(loss) before taxation from continuing
operations
€m€m
1,041851 767
707
619 636
1,748
1470 1,403
0
600
1,200
1,800
2012 2013 2014
Operating expenses (1)
Staff costs Other costs
1,4241,924
2,530
1.22%
1.37%
1.69%
1.27%
1.54%
1.89%
-0.10%
0.40%
0.90%
1.40%
1.90%
0
1,000
2,000
3,000
2012 2013 2014
Operating Performance
Operating Income NIM (excl. ELG)
NIM (excl ELG and NAMA bonds)
123% 55%
%
76%
(1) Excluding exceptional items
€m
Cost / Income Ratio (1)
€m

Allied Irish Banks p.l.c. – Data as at 31/12/2014 13
Balance sheet significantly stronger
115%
100% 99%
90%
100%
110%
120%
Dec-12 Dec-13 Dec-14
LDR % Funding Profile
LDR Customer accounts
€64bn €66bn €64bn
22.2
12.7
3.4
-
5.0
10.0
15.0
20.0
25.0
Dec-12 Dec-13 Dec-14
€bn Monetary Authority Funding
29.4 28.9
22.2
15.0
20.0
25.0
30.0
Dec 12 Dec 13 Dec 14
15.0%16.4%
10.5%11.8%
0%
6%
12%
18%
01-Jan-14 Dec-14 01-Jan-14 Dec-14
Transitional CET 1 ratio Fully loaded CET 1 ratio(1)
%
Specific Provisions / Impaired Loan Coverage Ratio
52% 55% 51%
Impaired loans€bn
(I) Based on full implementation of Basel III / CRD IV and includes 2009 Preference Shares
€

Allied Irish Banks p.l.c. – Data as at 31/12/2014 14
Key metrics contributing to improved performance
Overall Summary
• Growth in sustainable operating performance
• Profit before tax of €1.1bn, a €2.8bn improvement on
2013
• Key financial metrics trending positive
- Net interest income increased
- 2014 income includes income from balance
sheet actions and realisations in the period
- Further reduction in operating costs
- Net writeback of provisions reflecting improved
economic environment and momentum in
restructuring activity
Future Focus
• Continue to lend prudently into a recovering economy
• Positive outlook for asset growth on a medium term
basis
FY FY Change
Summary income statement (€m) 2013 2014 %
Net interest income 1,345 1,687 25
Other income 579 843 46
Total operating income 1,924 2,530 31
Total operating expenses (1) (1,470) (1,403) -5
Operating profit/(loss) before provisions 454 1,127 148
Provisions (1,904) 188 –
Associated undertakings 7 23 _
Profit on disposals 2 6
Operating profit / (loss) before exceptionals (1,441) 1,344 –
Exceptional items (246) (233) –
Profit/(loss) before tax from continuing operations (1,687) 1,111 –
Metrics
Net Interest Margin (Excluding ELG) 1.37% 1.69%
Cost income ratio (1) 76% 55%
Return on Equity (21.8%) 8.0%(2)
Return on Assets (1.3%) 0.8%
(1) Excludes exceptional costs. 2014 income includes income from balance sheet actions and realisations in the period.(2) Profit attributable to ordinary shareholders after deduction of the annual dividend on the 2009 Preference Shares.

Allied Irish Banks p.l.c. – Data as at 31/12/2014 15
Improving net interest income
Year Ended 31 Dec 2013 Year Ended 31 Dec 2014
Average
balance Interest
Average
Rate
Average
balance Interest Average Rate
€m €m % €m €m %
Assets
Loans and receivables to customers 69,902 2,326 3.33 65,391 2,237 3.42
NAMA senior bonds 16,743 130 0.78 12,569 80 0.64
Financial Investments AFS 18,621 652 3.50 19,444 567 2.92
Other interest earning assets 5,738 19 0.33 5,966 22 0.36
Net Interest on swaps 36 91
Average interest earning assets 111,004 3,163 2.85 103,370 2,997 2.90
Non interest earning assets 9,635 8,237
Total Assets 120,639 3,163 111,607 2,997
Liabilities and shareholders’ equity
Deposits by banks 26,242 123 0.47 18,515 46 0.25
Customer accounts 51,669 968 1.87 48,944 637 1.30
Subordinated liabilities 1,311 241 18.38 1,401 256 18.30
Other debt issued 8,622 313 3.63 8,921 312 3.49
Average interest earning liabilities 87,844 1,645 1.87 77,781 1,251 1.61
Non interest earning liabilities 21,975 22,426
Shareholders’ equity 10,820 11,400
Total liabilities and shareholders equity 120,639 1,645 111,607 1,251
Net interest income excluding ELG 1,518 1.37 1,746 1.69
ELG (173) (0.16) (59) (0.06)
Net interest income including ELG 1,345 1.21 1,687 1.63
Overall Summary
• Overall net interest income increased by
25% year on year
• Average interest earning assets down 7%
with a €166m reduction in interest earned
- Average rate on assets increased by
5bps to 290bps
• Average interest earning liabilities decreased
11% in the year as the cost of liabilities
continued to reduce
- Average rate on interest earning
liabilities decreased by 26bps to
161bps in the period
- Liability costs reduced by 24% or
€394m
• ELG costs reduced by €114m to €59m for
2014
• Overall NIM (1) in 2014 of 1.69%
- Increase of 32bps from 2013
(1) Excluding Eligible Liabilities Guarantee (ELG)
Allied Irish Banks p.l.c. – Data as at 31/12/2014 16
Translating into continued momentum in NIM
3.33%
1.87%
3.42%
1.30%
1.00%
1.50%
2.00%
2.50%
3.00%
3.50%
Customer Loans Customer Accounts
2013
2014
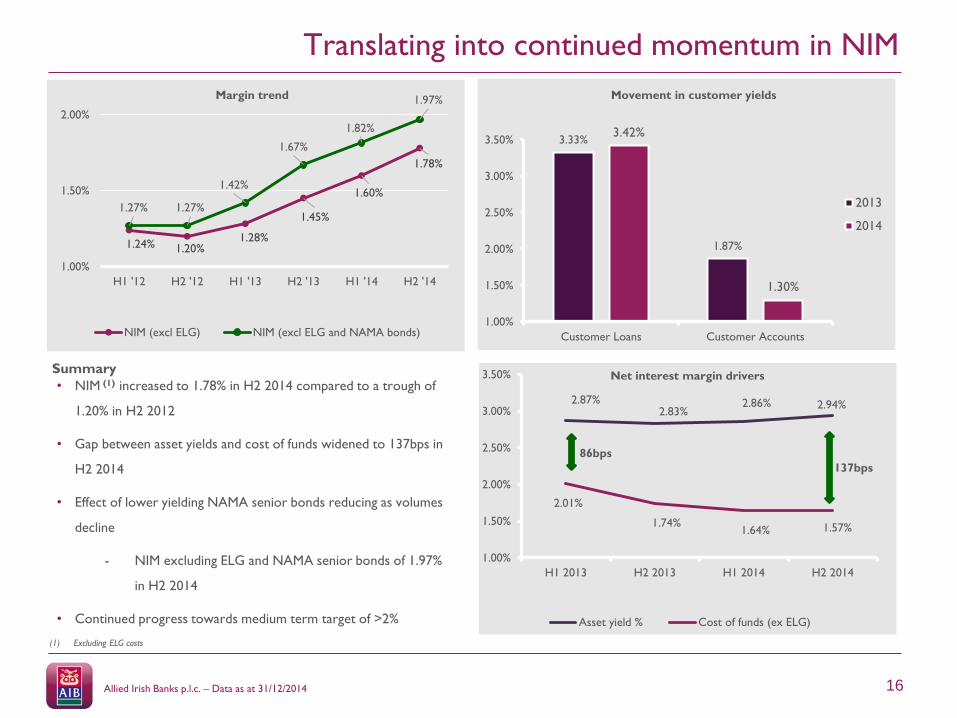
• NIM (1) increased to 1.78% in H2 2014 compared to a trough of
1.20% in H2 2012
• Gap between asset yields and cost of funds widened to 137bps in
H2 2014
• Effect of lower yielding NAMA senior bonds reducing as volumes
decline
- NIM excluding ELG and NAMA senior bonds of 1.97%
in H2 2014
• Continued progress towards medium term target of >2%
Summary
(1) Excluding ELG costs
1.24% 1.20%1.28%
1.45%
1.60%
1.78%
1.27% 1.27%
1.42%
1.67%
1.82%
1.97%
1.00%
1.50%
2.00%
H1 '12 H2 '12 H1 '13 H2 '13 H1 '14 H2 '14
NIM (excl ELG) NIM (excl ELG and NAMA bonds)
Margin trend Movement in customer yields
2.87%2.83%
2.86% 2.94%
2.01%
1.74%1.64% 1.57%
1.00%
1.50%
2.00%
2.50%
3.00%
3.50%
H1 2013 H2 2013 H1 2014 H2 2014
Asset yield % Cost of funds (ex ELG)
Net interest margin drivers
86bps
137bps

Allied Irish Banks p.l.c. – Data as at 31/12/2014 17
Other income significantly higher year on year
Summary
Other income of €843m was 46% higher year on year
comprising:
• Net fee and commission income of €390m was 3%
higher vs. 2013
• 2014 also benefited from €437m of income from
balance sheet actions and realisations in the period
compared to €93m in 2013
- Net profit on disposal of AFS securities
o €181m compared to €31m in 2013
- Re-estimating the timing of cash flows on
NAMA senior bonds
o €132m compared to €62m in 2013
- Settlements and other gains
o €124m in 2014
579
843
2013 2014
Other Income €m
FY FY
Other income (€m) 2013 2014 Change
Net fee and commission income 378 390 3%
Net profit on disposal of AFS securities 31 181 484%
Re-estimating the timing of cash flows
on NAMA senior bonds 62 132 113%
Settlements and other gains - 124 NM
Other 108 16 -85%
Total other operating income 579 843 46%
Allied Irish Banks p.l.c. – Data as at 31/12/2014 18
Continued focus on cost efficiencies
13,429
11,431 11,047
6,000
8,000
10,000
12,000
14,000
Dec-12 Dec-13 Dec-14
Full Time Employees (2)
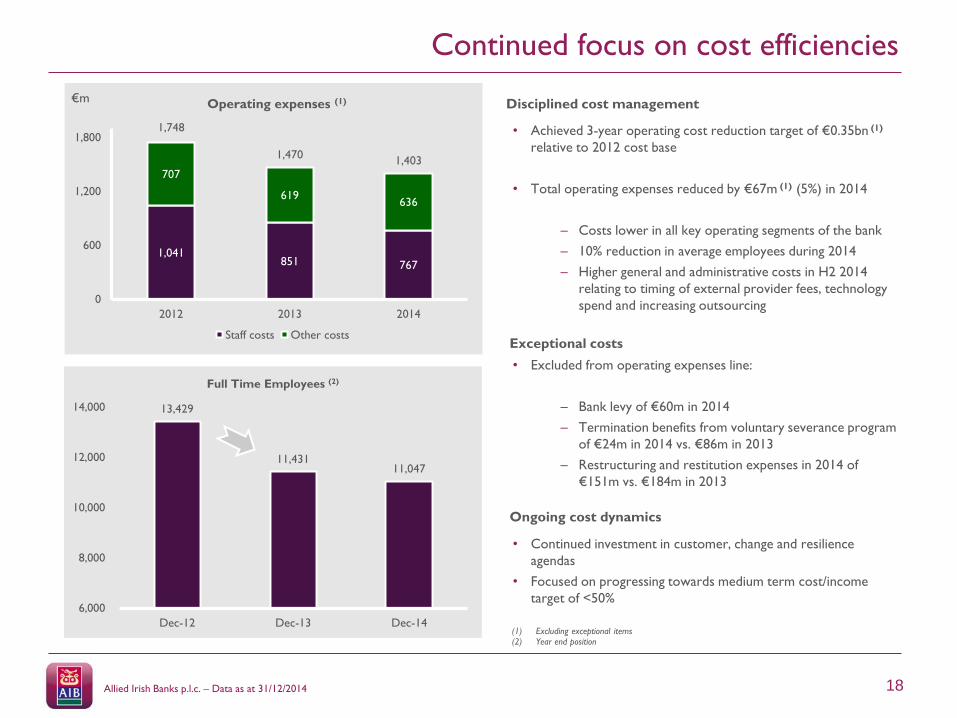
• Achieved 3-year operating cost reduction target of €0.35bn (1)
relative to 2012 cost base
• Total operating expenses reduced by €67m (1) (5%) in 2014
– Costs lower in all key operating segments of the bank
– 10% reduction in average employees during 2014
– Higher general and administrative costs in H2 2014
relating to timing of external provider fees, technology
spend and increasing outsourcing
Disciplined cost management
• Excluded from operating expenses line:
– Bank levy of €60m in 2014
– Termination benefits from voluntary severance program
of €24m in 2014 vs. €86m in 2013
– Restructuring and restitution expenses in 2014 of
€151m vs. €184m in 2013
• Continued investment in customer, change and resilience
agendas
• Focused on progressing towards medium term cost/income
target of <50%
Exceptional costs
Ongoing cost dynamics
1,041851 767
707
619636
1,748
1,4701,403
0
600
1,200
1,800
2012 2013 2014
Operating expenses (1)
Staff costs Other costs
€m
(1) Excluding exceptional items(2) Year end position
Allied Irish Banks p.l.c. – Data as at 31/12/2014 19
Aggregate writeback of provisions during 2014
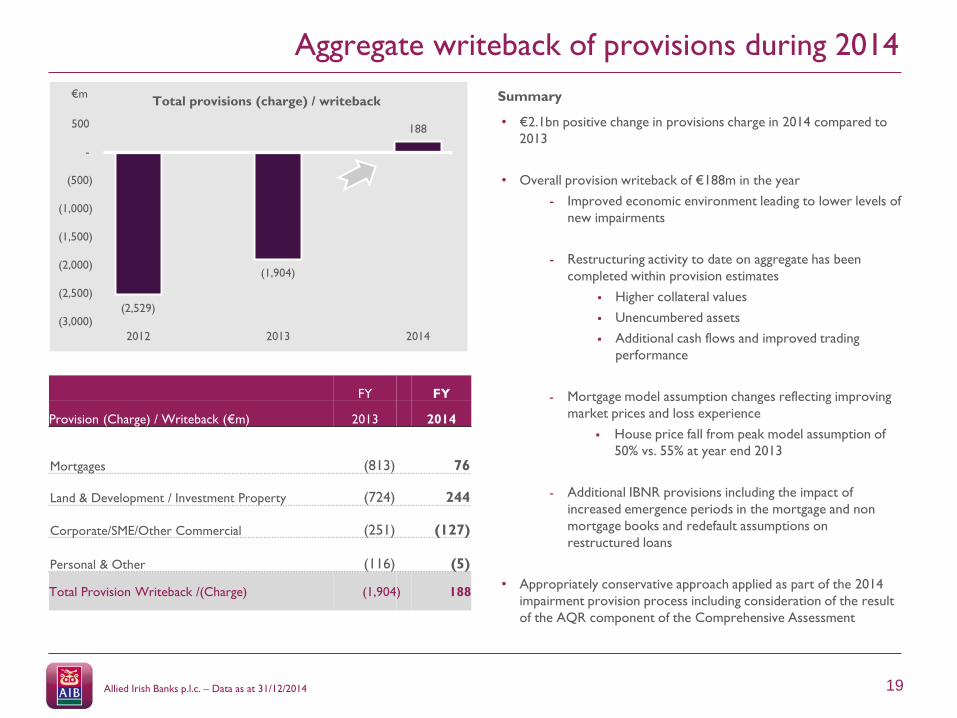
• €2.1bn positive change in provisions charge in 2014 compared to
2013
• Overall provision writeback of €188m in the year
- Improved economic environment leading to lower levels of
new impairments
- Restructuring activity to date on aggregate has been
completed within provision estimates
Higher collateral values
Unencumbered assets
Additional cash flows and improved trading
performance
- Mortgage model assumption changes reflecting improving
market prices and loss experience
House price fall from peak model assumption of
50% vs. 55% at year end 2013
- Additional IBNR provisions including the impact of
increased emergence periods in the mortgage and non
mortgage books and redefault assumptions on
restructured loans
• Appropriately conservative approach applied as part of the 2014
impairment provision process including consideration of the result
of the AQR component of the Comprehensive Assessment
Summary
FY FY
Provision (Charge) / Writeback (€m) 2013 2014
Mortgages (813) 76
Land & Development / Investment Property (724) 244
Corporate/SME/Other Commercial (251) (127)
Personal & Other (116) (5)
Total Provision Writeback /(Charge) (1,904) 188
(2,529)
(1,904)
188
(3,000)
(2,500)
(2,000)
(1,500)
(1,000)
(500)
-
500
2012 2013 2014
Total provisions (charge) / writeback€m
Allied Irish Banks p.l.c. – Data as at 31/12/2014 20
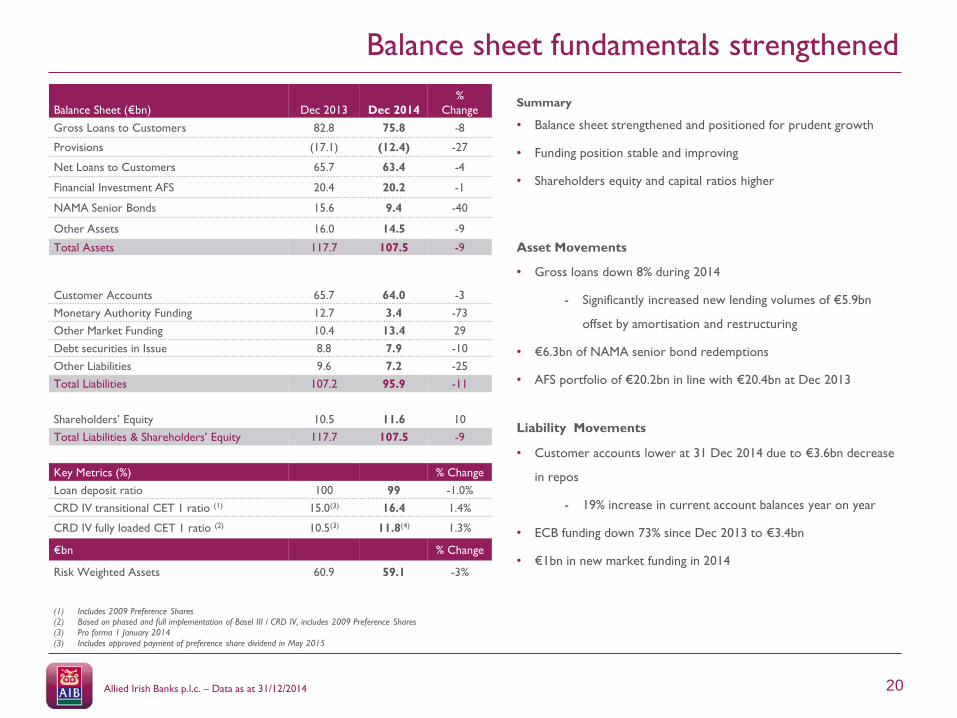
Balance sheet fundamentals strengthened
Balance Sheet (€bn) Dec 2013 Dec 2014
%
Change
Gross Loans to Customers 82.8 75.8 -8
Provisions (17.1) (12.4) -27
Net Loans to Customers 65.7 63.4 -4
Financial Investment AFS 20.4 20.2 -1
NAMA Senior Bonds 15.6 9.4 -40
Other Assets 16.0 14.5 -9
Total Assets 117.7 107.5 -9
Customer Accounts 65.7 64.0 -3
Monetary Authority Funding 12.7 3.4 -73
Other Market Funding 10.4 13.4 29
Debt securities in Issue 8.8 7.9 -10
Other Liabilities 9.6 7.2 -25
Total Liabilities 107.2 95.9 -11
Shareholders’ Equity 10.5 11.6 10
Total Liabilities & Shareholders’ Equity 117.7 107.5 -9
Key Metrics (%) % Change
Loan deposit ratio 100 99 -1.0%
CRD IV transitional CET 1 ratio (1) 15.0(3) 16.4 1.4%
CRD IV fully loaded CET 1 ratio (2) 10.5(3) 11.8(4) 1.3%
€bn % Change
Risk Weighted Assets 60.9 59.1 -3%
(1) Includes 2009 Preference Shares(2) Based on phased and full implementation of Basel III / CRD IV, includes 2009 Preference Shares
(3) Pro forma 1 January 2014
(3) Includes approved payment of preference share dividend in May 2015
Summary
• Balance sheet strengthened and positioned for prudent growth
• Funding position stable and improving
• Shareholders equity and capital ratios higher
Asset Movements
• Gross loans down 8% during 2014
- Significantly increased new lending volumes of €5.9bn
offset by amortisation and restructuring
• €6.3bn of NAMA senior bond redemptions
• AFS portfolio of €20.2bn in line with €20.4bn at Dec 2013
Liability Movements
• Customer accounts lower at 31 Dec 2014 due to €3.6bn decrease
in repos
- 19% increase in current account balances year on year
• ECB funding down 73% since Dec 2013 to €3.4bn
• €1bn in new market funding in 2014

Allied Irish Banks p.l.c. – Data as at 31/12/2014 21
Earning loan book stabilising
Customer Loans (€bn) Earning Loans Impaired Loans Gross Loans
Specific
Provisions
IBNR
Provisions Net Loans
Opening Balance (1 January 2014) 53.9 28.9 82.8 (15.9) (1.2) 65.7
New lending volumes 5.9 0.0 5.9 0.0 0.0 5.9
New impaired loans (1.6) 1.6 0.0 (0.5) 0.0 (0.5)
Restructures and writeoffs (1) 1.1 (6.6) (5.5) 5.3 0.0 (0.2)
Redemptions of existing loans (6.6) (1.9) (8.5) 0.0 0.0 (8.5)
Foreign exchange movements 0.8 0.3 1.1 (0.1) 0.0 1.0
Other movements 0.1 (0.1) 0.0 (0.1) 0.1 0
Closing Balance (31 Dec 2014) 53.6 22.2 75.8 (11.3) (1.1) 63.4
Summary
• Earning loan book broadly stable in the period
- New lending increased to €5.9bn
- €1.1bn increase in performing loans as a result of
restructuring activity
- €0.8bn increase due to FX movements
- Offset by redemptions of €6.6bn and new to impaired
loans of €1.6bn
• Redemptions continued to be in excess of new lending in the
period despite significant growth in new lending
82.8
53.9
28.9
75.8
53.6
22.2
Gross Loans Performing Loans Impaired Loans
Loan book movements
Dec-13 Dec-14
€bn
(1) Includes non contractual writeoffs(2) Includes refinancing in the UK
(2)

Allied Irish Banks p.l.c. – Data as at 31/12/2014 22
Falling balance sheet provisions and impairments
Balance Sheet Provisions Movements – Dec 2014 (€m)
01-Jan-14 DCB AIB UK FSG Total
Specific 2,401 2,070 11,427 15,898
IBNR 828 132 225 1,185
Total 3,229 2,202 11,652 17,083
Income Statement Impairment Charge in Period
Specific 308 129 (512) (75)
IBNR (105) (59) 61 (103)
Total (2) 203 70 (451) (178)
Impairment Charge/Avg Loans 43bps 54bps (229bps) (22bps)
Amounts Written Off / Other (1)
Total (408) (469) (3,622) (4,499)
31 Dec 14 DCB AIB UK FSG Total
Specific 2,310 1,718 7,287 11,315
IBNR 714 85 292 1,091
Total 3,024 1,803 7,579 12,406
(1) Includes €150m in exchange related adjustments and €6m in recoveries on amounts written off in previous periods. (2) Loan book charge in period – excludes €7m loans to banks provisioning release.
Credit provision summary
• Balance sheet provisions decreased by €4.7bn to €12.4bn
- Specific provisions of €11.3bn down from €15.9bn
- IBNR provisions of €1.1bn down from €1.2bn
- Significant increase in provision write offs as part of
restructuring process and also includes writeoffs where
further recovery considered unlikely
• Specific provision / impaired loans cover reduced to 51% from
55% in 2013 mainly driven by:
- write offs of provisions within portfolios with higher
provision cover
- writebacks from restructuring activity
• Impairment writeback /average loans of 22bps in 2014
- Charge of 46bps excluding FSG
Allied Irish Banks p.l.c. – Data as at 31/12/2014 23
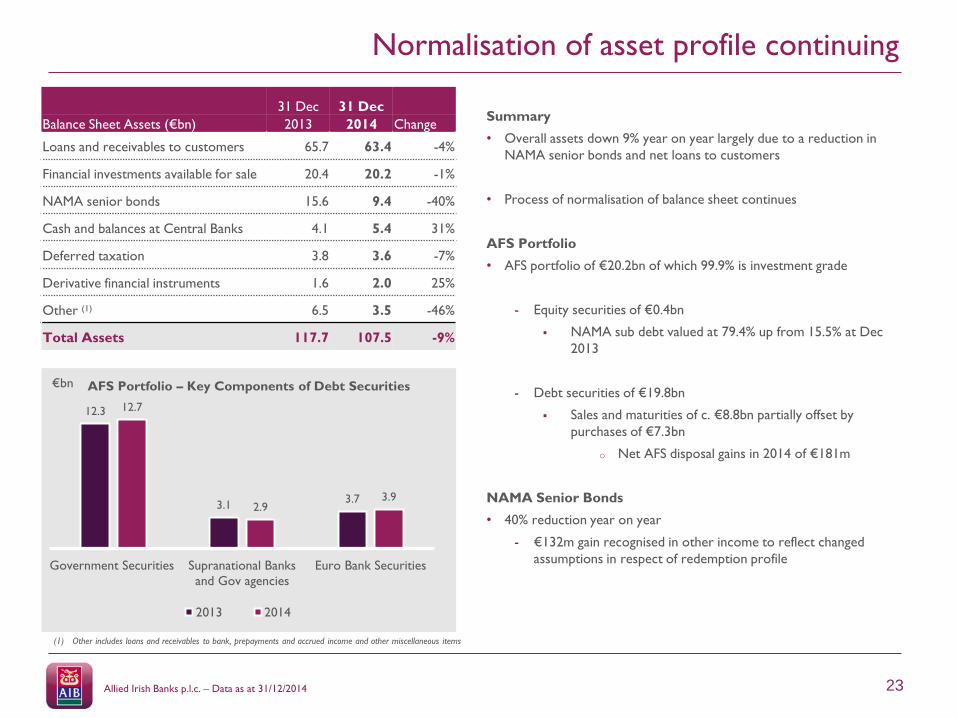
Normalisation of asset profile continuing
12.3
3.13.7
12.7
2.93.9
Government Securities Supranational Banks
and Gov agencies
Euro Bank Securities
AFS Portfolio – Key Components of Debt Securities
2013 2014
€bn
31 Dec 31 Dec
Balance Sheet Assets (€bn) 2013 2014 Change
Loans and receivables to customers 65.7 63.4 -4%
Financial investments available for sale 20.4 20.2 -1%
NAMA senior bonds 15.6 9.4 -40%
Cash and balances at Central Banks 4.1 5.4 31%
Deferred taxation 3.8 3.6 -7%
Derivative financial instruments 1.6 2.0 25%
Other (1) 6.5 3.5 -46%
Total Assets 117.7 107.5 -9%
Summary
• Overall assets down 9% year on year largely due to a reduction in
NAMA senior bonds and net loans to customers
• Process of normalisation of balance sheet continues
AFS Portfolio
• AFS portfolio of €20.2bn of which 99.9% is investment grade
- Equity securities of €0.4bn
NAMA sub debt valued at 79.4% up from 15.5% at Dec
2013
- Debt securities of €19.8bn
Sales and maturities of c. €8.8bn partially offset by
purchases of €7.3bn
o Net AFS disposal gains in 2014 of €181m
NAMA Senior Bonds
• 40% reduction year on year
- €132m gain recognised in other income to reflect changed
assumptions in respect of redemption profile
(1) Other includes loans and receivables to bank, prepayments and accrued income and other miscellaneous items

Allied Irish Banks p.l.c. – Data as at 31/12/2014
Funding profile strengthened
63%13%
21%
3%
Customer Accounts CapitalWholesale Funding Monetary Authority Funding
31 Dec 201431 Dec 2013
Summary
• Overall liabilities down 11% year on year as monetary authority funding
levels decreased significantly
Customer Accounts (1)
• Largest component of funding at 63% -- up 3% year on year
- Excluding repos, customer account volumes higher due to an
increase in current account balances of 19%
Wholesale Funding
• Deposits by central banks and banks down 27% with monetary authority
funding down 73% to €3.4bn
- Includes €1.9bn of TLTRO (3)
• Other debt securities of €7.9bn, down 10% in the year due to maturities
and debt buybacks
- Two debt issues in 2014 totalling €1bn
- €750m ACS issuance in Jan 2015
- c. 65% of debt securities in issue have a maturity profile greater
than 1 year
Retirement Benefit Liabilities
• Increase mainly driven by reduction in the discount rate used in actuarial
assumptions to value the Irish DB schemes liabilities from 3.9% to 2.2%
Basel III Liquidity Requirements (2)
• Net stable funding ratio: c.112%
• Liquidity coverage ratio: c.116%
(1) Includes repos(2) Includes the impact of regulatory guidance on the treatment of NAMA bonds
(3) Targeted longer term refinancing operations
Funding Profile
60%
11%
17%
12%
31 Dec 31 Dec
Balance Sheet Liabilities (€bn) 2013 2014 Change
Customer Accounts 65.7 64.0 -3%
Deposits by Central Banks & Banks 23.1 16.8 -27%
Debt Securities in Issue 8.8 7.9 -10%
Derivative Financial Instruments 2.0 2.3 19%
Retirement benefit liabilities 0.2 1.2 -
Subordinated liabilities & other capital
instruments 1.4 1.5 7%
Other 6.0 2.2 -63%
Total Liabilities 107.2 95.9 -11%
24

Allied Irish Banks p.l.c. – Data as at 31/12/2014 25
Capital ratios increasing
9,717
3,640
678
280
1,369
206
6,974
0
2,000
4,000
6,000
8,000
10,000
Dec 2014transitional
DTA PensionReserves
Payment of2015 Pref Div
AFS CCN FairValue /Other
Dec 2014 fullyloaded
Capital Structure Considerations
• Discussions ongoing with Department of Finance in respect of
- the €3.5bn 2009 Preference Shares and €1.6bn of Contingent
Capital Notes
- a possible significant consolidation in the number of ordinary
shares outstanding
CET 1Transitional Ratio +1.4%
• Increase in CET1 capital of €0.6bn, reflecting
- €0.9bn attributable profits in 2014
- €0.1bn due to disposal of Ark Life
- €(0.28bn) deduction for approved 2009 Preference Share cash
dividend in May 2015
- €(0.2bn) impact in respect of increased pension deficit
• Decrease in RWA of €1.8bn, reflecting reduction in credit risk
CET 1 Fully Loaded Ratio +1.3%
• Increase in CET1 Capital of €0.6bn, includes
- €0.9bn attributable profits in 2014
- €0.7bn AFS reserve gains
- (€0.9bn) impact of pension deficit
- €(0.28bn) deduction for approved 2009 Preference Share cash
dividend in May 2015
(1) Based on phased and full implementation of Basel III / CRD IV, includes Preference Shares and approved preference share dividend in 2015
(2) Based on full implementation of Basel III / CRD IV, includes Preference Shares but excludes approved
preference share dividend in 2015
16.4%(1)
11.8%(1)
Movement from Transitional to Fully Loaded CET 1
15.0%16.4%
10.5%11.8%
0%
6%
12%
18%
01-Jan-14 Dec-14 01-Jan-14 Dec-14
5.9% excluding
preference
shares
Transitional CET 1 ratio
Fully loaded CET 1 ratio (1)
12.3%(2)280
Transitional Basis 1 Jan 14 Dec 14
Total Capital Ratio 17.2% 18.1%
RWAs €60.9bn €59.1bn
As % of assets 52% 55%

26
Asset Quality

Allied Irish Banks p.l.c. – Data as at 31/12/2014 27
Improvement in asset quality
(1) Definitions of criticised loans contained on Appendix slide No 41(2) Includes refinancing in the UK
• Significant progress and momentum in restructuring customers in
financial difficulty
• Pace of formation of new impaired loans slowed reflecting improved
economic conditions
• €5.9bn in new lending during 2014
• Net loans decreased by €2.3bn (4%) since Dec 2013 to €63.4bn
– Combination of loan redemption, restructuring of impaired
loans and increased new lending
– Performing loan book broadly stable in the year
• Residential mortgages remains the largest component of loan book at
56% of net loans
• Impaired loans reduced by €6.7bn in 2014
– Reductions evident across all loan portfolios
– Reflective of extensive engagement with customers to
restructure facilities, redemptions and provision writeoffs
– Total criticised¹ loans, including impaired loans, decreased by
c.€7.8bn
- Decrease in watch and impaired categories, increase in
vulnerable, in part due to restructuring of impaired loans
Summary
56%
5%
15%
17%
7%
Residential Mortgages Other Personal Property and Construction
SME Corporate
Net loan book profile by value
Dec 2014Dec 2013
37%
17%
23% 15%5%
2%1%
ROI Mortgages Land & Development Investment Property
SME/Other commercial Personal Corporate
UK Mortgages
Dec 2014 Impaired Loans - Sector profile
56%
5%
17%
16%
6%
(2)

Allied Irish Banks p.l.c. – Data as at 31/12/2014 28
Impaired balances lower in all major loan books
Note: Contractors of €368m (Dec ’13: €404m) are included in land & development, and housing associations of €440m (Dec ’13: €427m) are included in investment property.
December 2013
€m
ROI
mortgages
Land &
development
Investment
property
SME / Other
commercialPersonal Corporate
UK
mortgagesTotal
Loans and receivables to customers 38,151 6,301 13,409 13,779 4,291 4,307 2,613 82,851
Impaired 8,788 5,523 7,631 4,775 1,423 476 295 28,911
Impairment charge (Full Year P&L) 822 259 465 221 125 30 (9) 1,913
Balance sheet provisions (Specific + IBNR) 3,796 4,288 4,150 3,239 1,147 307 156 17,083
Specific provisions / Impaired loans (%) 36% 77% 51% 66% 77% 48% 44% 55%
Total provisions / Total loans (%) 10% 68% 31% 24% 27% 7% 6% 21%
December 2014
€m
ROI
mortgages
Land &
development
Investment
property
SME / Other
commercialPersonal Corporate
UK
mortgagesTotal
Loans and receivables to customers 36,324 4,436 11,101 12,889 3,837 4,723 2,522 75,832
Impaired 8,217 3,661 5,175 3,395 1,044 378 292 22,162
Impairment charge (Full Year P&L) (93) (50) (194) 81 15 46 17 (178)
Balance sheet provisions (Specific + IBNR) 3,256 2,774 2,878 2,308 768 251 171 12,406
Specific provisions / Impaired loans (%) 33% 75% 53% 61% 69% 50% 52% 51%
Total provisions / Total loans (%) 9% 63% 26% 18% 20% 5% 7% 16%

29
Delivering our Strategy
Chief Executive Officer
David Duffy
Group Chief Operating Officer
Stephen White

Allied Irish Banks p.l.c. – Data as at 31/12/2014
Clear strategic direction
Our
VisionTo be a customer driven bank, recognised as a leading consumer brand
Our
Strategic
Objectives
Serve through our
omni channel
distribution model
Understand
our
customers’
needs
Continuously
innovate to provide
suitable solutions
for customers
Relentlessly
deliver
simplification and
digitisation
Supporting economic recovery
Progress towards medium term targets
Prudently manage our balance sheet
Enabled by employee engagement and our brand values
30
Allied Irish Banks p.l.c. – Data as at 31/12/2014 31
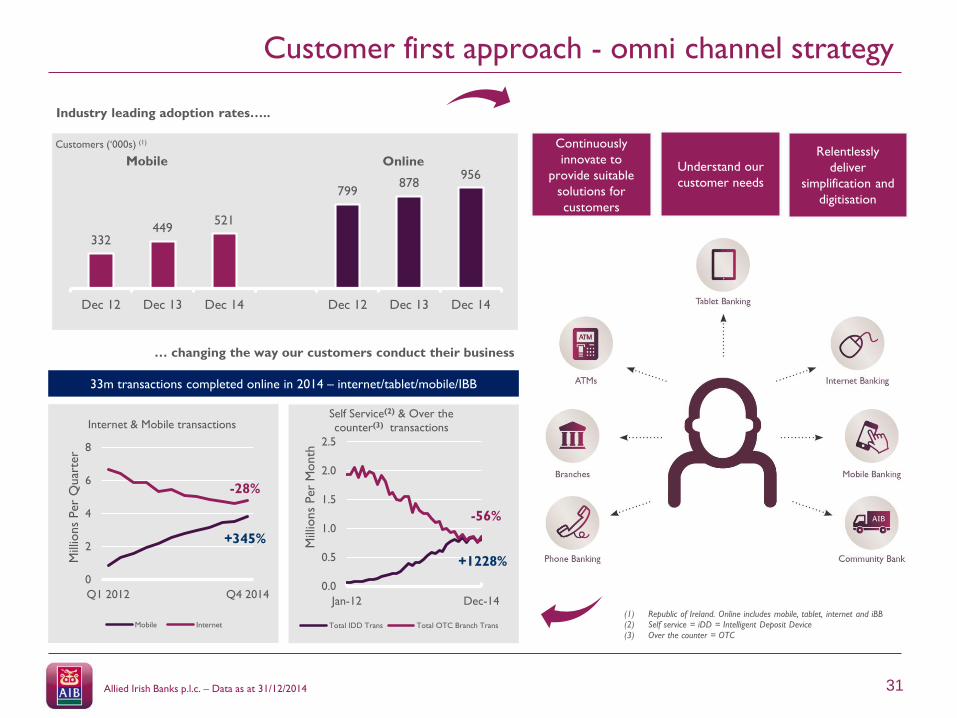
Customer first approach - omni channel strategy
Industry leading adoption rates…..
… changing the way our customers conduct their business
(1) Republic of Ireland. Online includes mobile, tablet, internet and iBB(2) Self service = iDD = Intelligent Deposit Device
(3) Over the counter = OTC
Customers (‘000s) (1) Continuously
innovate to
provide suitable
solutions for
customers
Understand our
customer needs
Relentlessly
deliver
simplification and
digitisation
0
2
4
6
8
Q1 2012 Q4 2014
Mill
ions
Per
Quar
ter
Internet & Mobile transactions
Mobile Internet
Mobile
332449
521
799878
956
Dec 12 Dec 13 Dec 14 Dec 12 Dec 13 Dec 14
Online
0.0
0.5
1.0
1.5
2.0
2.5
Jan-12 Dec-14
Mill
ions
Per
Month
Self Service(2) & Over the
counter(3) transactions
Total IDD Trans Total OTC Branch Trans
33m transactions completed online in 2014 – internet/tablet/mobile/IBB
+345%
-28%
-56%
+1228%
Allied Irish Banks p.l.c. – Data as at 31/12/2014 32
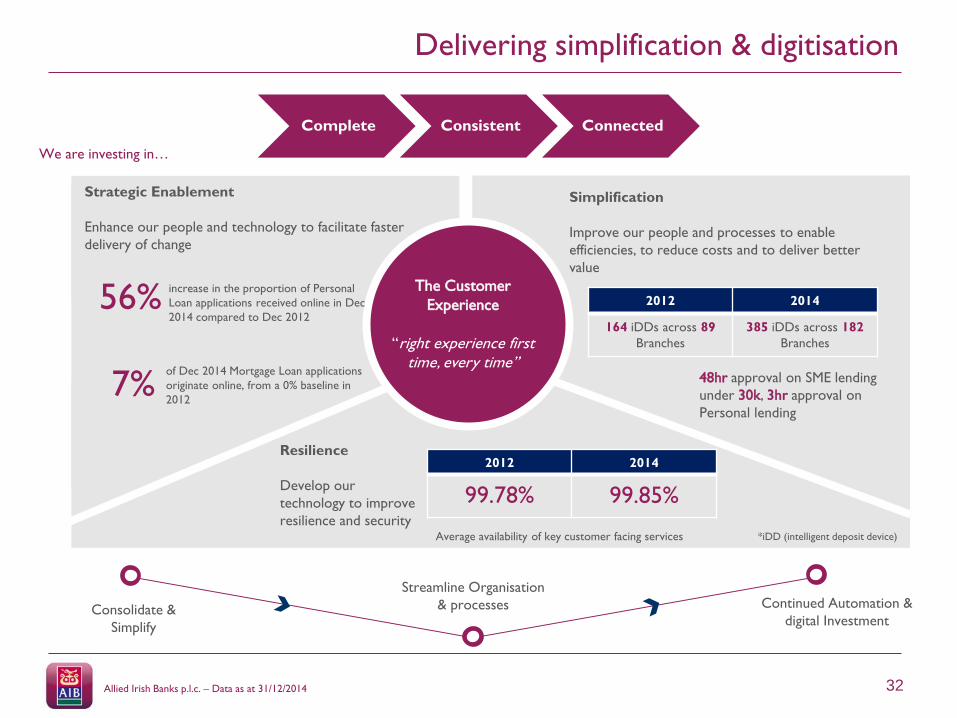
Delivering simplification & digitisation
Consolidate &
Simplify
Streamline Organisation
& processes
We are investing in…
Continued Automation &
digital Investment
Complete Consistent Connected
Strategic Enablement
Enhance our people and technology to facilitate faster
delivery of change
7%
56%
Resilience
Develop our
technology to improve
resilience and securityAverage availability of key customer facing services
Simplification
Improve our people and processes to enable
efficiencies, to reduce costs and to deliver better
value
*iDD (intelligent deposit device)
48hr approval on SME lending
under 30k, 3hr approval on
Personal lending
2012 2014
164 iDDs across 89
Branches
385 iDDs across 182
Branches
The Customer
Experience
“right experience first time, every time”
of Dec 2014 Mortgage Loan applications
originate online, from a 0% baseline in
2012
increase in the proportion of Personal
Loan applications received online in Dec
2014 compared to Dec 2012
2012 2014
99.78% 99.85%

33
Overall summary
Allied Irish Banks p.l.c. – Data as at 31/12/2014 34
Positive trajectory and delivering strategic objectives
• Momentum in financial performance
• On track to deliver medium term targets
• Clear, customer driven, strategic direction
• Strong and well positioned franchise
• Leading market shares in Irish core target markets
• Lending demand and volumes growing
• Focused on continued reduction in impaired loans
• Capital structure considerations being progressed
35
Appendix

Allied Irish Banks p.l.c. – Data as at 31/12/2014
STRICTLY CONFIDENTIAL - COMMERCIALLY SENSITIVE MATERIAL
36
Leading Irish bank, operating in strengthening economies
Domestic Core Bank
• AIB and EBS brands
• c.2.3 million customers
• c.270 branches / outlets
• 10 business centres
• Joint venture with An Post
• Personal, business and corporate markets
• New York Corporate banking office
AIB UK
First Trust Bank
• c.280k customers
• Personal and business target markets
• c.30 branches
AIB GB
• c.85k customers
• Personal, Business & Corporate
• c.16 locations
Financial Solutions Group
• Dedicated to supporting business and personal customers in financial difficulty
• Restructuring process well progressed
• 1,600 dedicated staff supported by colleagues throughout the network
Our Strategic ObjectivesContinuously innovate to
provide suitable solutions
for customers
Understand our
customers’ needs
Domestic
Core BankAIB UK
Financial Solutions
Grouponline “Log-Ons” in
2014
140 million c.15,500 SME Start-ups
supported in 2014
c.155,000personal loans
drawn down in 2014
c.60,000current accounts
opened in 2014
Serve through our omni
channel distribution
model
Deliver relentless
simplification and
digitisation
Personal Market in Ireland

37
Positive domestic economic conditions and outlook
0.2
4.54.0 4.0
0.0
2.5
5.0
2013 2014 (f) 2015 (f) 2016 (f)
ROI GDP (% change in real terms)
3.3
4.03.5 3.5
0.0
2.5
5.0
2013 2014 (f) 2015 (f) 2016 (f)
ROI GNP (% change in real terms)
13.1
11.39.8
8.8
0.0
5.0
10.0
15.0
2013 2014 2015 (f) 2016 (f)
Average Unemployment Rate (%)5.7
3.9
2.5
1.5
0.0
2.0
4.0
6.0
2013 2014 (f) 2015 (f) 2016 (f)
Irish Government Budget Deficit (% GDP)
Sources: Central statistics office, AIB economic research unit.
Allied Irish Banks p.l.c. – Data as at 04/03/2014

Allied Irish Banks p.l.c. – Data as at 31/12/2014 38
Measured and balanced return to funding markets
Funding transactions since regaining market access
2012 2013 2014 2015
ACS
Issuance
Nov 2012
ACS
Issuance Jan
2013
ACS
Issuance
Sept 2013
Cr. Card
Secured
Funding
Oct 2013
Senior
Unsecured
Nov 2013
ACS
Issuance
March 2014
Senior
Unsecured
April 2014
ACS
Issuance
January
2015
Issuer AIB Mortgage
Bank
AIB Mortgage
Bank
AIB Mortgage
Bank
AIB AIB AIB Mortgage
Bank
AIB AIB Mortgage
Bank
Ratings Baa1/A/A Baa1/A/A Baa1/A/A N/A B1/BB/BBB Baa1/A/A B1/BB/BBB A3 / A / A
Pricing
Date
28 November
2012
22 January
2013
3 September
2013
31 October
2013
20 November
2013
19 March
2014
8 April 2014 27th January
2015
Tenor 3-year 3.5-year 5-year 2-year 3-year 7-year 5-year 7-year
Size €500m €500m €500m €500m €500m €500m €500m €750m
Reoffer
Spread
MS + 270bp MS + 185bp MS + 180bp Not disclosed MS +235bp MS +95bp MS +180bp MS+27bps
Coupon 3.125%
annually
2.625%
annually
3.125%
annually
Not disclosed 2.875%
annually
2.33% annually 2.75%
annually
0.625%
annually

Allied Irish Banks p.l.c. – Data as at 31/12/2014 39
Available for sale portfolio
10.3
0.80.2 0
1.6
9.1
0.51.3 1.2 0.9
Irish
Government
Securities
France Italy Spain Rest of
World
Components of Government Securities
2013 2014
Debt Securities
• AFS portfolio of €20.2bn of which 99.9% is investment grade
- Dec 2013: €20.4bn
• Total debt securities portfolio* decreased to €19.8bn
- Dec 2013: €20.3bn
• Sales and maturities of c. €8.8bn partially offset by purchases of
€7.3bn
− Decrease in Irish Sovereign (€1.2bn)
− Purchase of Spanish and Italian sovereign bonds
(€2.2bn)
− Net AFS disposal gains in 2014 of €181m
*Excludes equity securities
12.3
3.13.7
12.7
2.93.9
Government Securities Supranational Banks
and Gov agencies
Euro Bank Securities
Key Components of Debt Securities
2013 2014
• Excludes NAMA senior bonds of c.€9.4bn
• No credit provisions held against the debt securities portfolio
• Increase in fair value of debt securities
- Tightening of Irish sovereign spreads and impact of
lower rates on fixed rate security holdings
Equity Securities
• Equity securities of €0.4bn includes NAMA subordinated
Bonds
− Increase in fair value of €0.3bn during 2014
€bn €bn
Summary
Allied Irish Banks p.l.c. – Data as at 31/12/2014 40
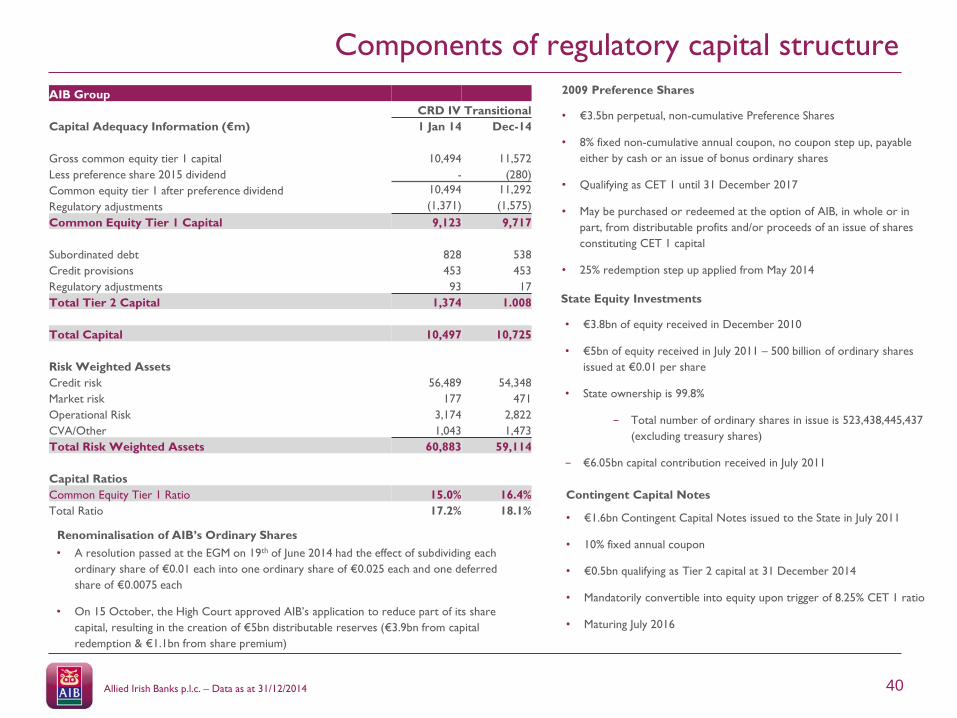
Components of regulatory capital structure
• €3.5bn perpetual, non-cumulative Preference Shares
• 8% fixed non-cumulative annual coupon, no coupon step up, payable
either by cash or an issue of bonus ordinary shares
• Qualifying as CET 1 until 31 December 2017
• May be purchased or redeemed at the option of AIB, in whole or in
part, from distributable profits and/or proceeds of an issue of shares
constituting CET 1 capital
• 25% redemption step up applied from May 2014
2009 Preference Shares
• €3.8bn of equity received in December 2010
• €5bn of equity received in July 2011 – 500 billion of ordinary shares
issued at €0.01 per share
• State ownership is 99.8%
− Total number of ordinary shares in issue is 523,438,445,437
(excluding treasury shares)
− €6.05bn capital contribution received in July 2011
State Equity Investments
• €1.6bn Contingent Capital Notes issued to the State in July 2011
• 10% fixed annual coupon
• €0.5bn qualifying as Tier 2 capital at 31 December 2014
• Mandatorily convertible into equity upon trigger of 8.25% CET 1 ratio
• Maturing July 2016
Contingent Capital Notes
• A resolution passed at the EGM on 19th of June 2014 had the effect of subdividing each
ordinary share of €0.01 each into one ordinary share of €0.025 each and one deferred
share of €0.0075 each
• On 15 October, the High Court approved AIB’s application to reduce part of its share
capital, resulting in the creation of €5bn distributable reserves (€3.9bn from capital
redemption & €1.1bn from share premium)
Renominalisation of AIB’s Ordinary Shares
AIB Group
CRD IV Transitional
Capital Adequacy Information (€m) 1 Jan 14 Dec-14
Gross common equity tier 1 capital 10,494 11,572
Less preference share 2015 dividend - (280)
Common equity tier 1 after preference dividend 10,494 11,292
Regulatory adjustments (1,371) (1,575)
Common Equity Tier 1 Capital 9,123 9,717
Subordinated debt 828 538
Credit provisions 453 453
Regulatory adjustments 93 17
Total Tier 2 Capital 1,374 1.008
Total Capital 10,497 10,725
Risk Weighted Assets
Credit risk 56,489 54,348
Market risk 177 471
Operational Risk 3,174 2,822
CVA/Other 1,043 1,473
Total Risk Weighted Assets 60,883 59,114
Capital Ratios
Common Equity Tier 1 Ratio 15.0% 16.4%
Total Ratio 17.2% 18.1%

Allied Irish Banks p.l.c. – Data as at 31/12/2014 41
Criticised Loans and Definitions
7.0 6.8 5.2
6.3 6.16.6
29.4 28.9
22.2
0
9
18
27
36
45
Dec-12 Dec-13 Dec-14
Credit profile – criticised loans (1)
Watch Vulnerable Impaired
42.741.8
34.0
Watch The credit is exhibiting weakness but with the
expectation that existing debt can be fully repaid from
normal cash flows.
Vulnerable Credit where repayment is in jeopardy from normal
cash flows and may be dependent on other sources.
Impaired A loan is impaired if there is objective evidence of
impairment as a result of one or more events that
occurred after the initial recognition of the asset (a ‘loss
event’) and that loss event (or events) has an impact
such that the present value of future cash flows is less
than the current carrying value of the financial asset or
group of assets and requires an impairment provision to
be recognised in the income statement.
€bn

Allied Irish Banks p.l.c. – Data as at 31/12/2014
STRICTLY CONFIDENTIAL - COMMERCIALLY SENSITIVE MATERIAL
42
FSG - Momentum in restructuring activity
21.8 16.4
(4.5)
(0.9)
Dec 2013 Restructuring Redemptions
(incl fx)
Dec 2014
FSG balance sheet metrics (€bn)
Dec
2013
Dec
2014
%
Change
Gross loans 21.8 16.4 -25
Net loans 10.2 8.9 -13
FSG contribution statement (€m) 2013 2014%
Change
€m €m
Net interest income before ELG 204 230 13
ELG (14) (9) -36
Net interest income 190 221 16
Other income 25 72 188
Total operating income 215 293 36
Total operating expenses (161) (147) -9
Operating contribution before provisions 54 146 170
Total (provisions) / Writeback (906) 454 -
Operating contribution (852) 600 -
Associated undertakings (3) - -
Contribution before exceptional items (855) 600 -
% % Change
Cost income ratio 75 50 -25
€bn FSG Gross Loan Movement
Summary
• €5.4bn reduction in gross loans due to restructuring activity and
amortisation
- Case by case restructuring
- Net provisions writeback of €454m reflecting debt restructuring
and lower additional provisions in the period
- Writebacks driven in part by increasing asset values, improved
trading performance and additional assets / cash introduced at
point of restructure
• Lower levels of new impairments due to improved economic environment
• FSG also manages mortgage arrears from an operational perspective
- Number of accounts in arrears down 18% in ROI portfolio in
2014
- Targets met for both sustainable solutions offered and concluded

Allied Irish Banks p.l.c. – Data as at 31/12/2014 43
RoI owner occupier mortgages – arrears significantly lower
56%34%
10%
Variable Tracker Fixed
4.55.1 5.0
0.0
2.0
4.0
6.0
Dec 12 Dec 13 Dec 14
%
Specific Provisions / Impaired Loan Coverage Ratio
27% 32% 28%
Impaired Loans (€bn) Summary
• 85% of the RoI mortgage portfolio is owner occupier (1)
• 83% of the portfolio is neither past due nor impaired (1)
• Increase in house prices, 16.3% in the year to 31 December 2014
• Arrears levels down 22% in 2014 due to increased restructuring and
lower levels of new arrears(1)
• Provision assumptions include a 50% house price fall from peak,
forced sale discount, disposal costs
• Decrease in specific coverage from 32% to 28%, mainly due to an
improvement in house price fall from peak assumptions of 55% to
50% and impact of restructuring
456
563
(6)-50
150
350
550
2012 2013 2014
Impairment charge/ Writeback€m
(1) Number of Accounts
Asset profile components Dec 14
€29.6bn (4% decrease)
Allied Irish Banks p.l.c. – Data as at 31/12/2014 44
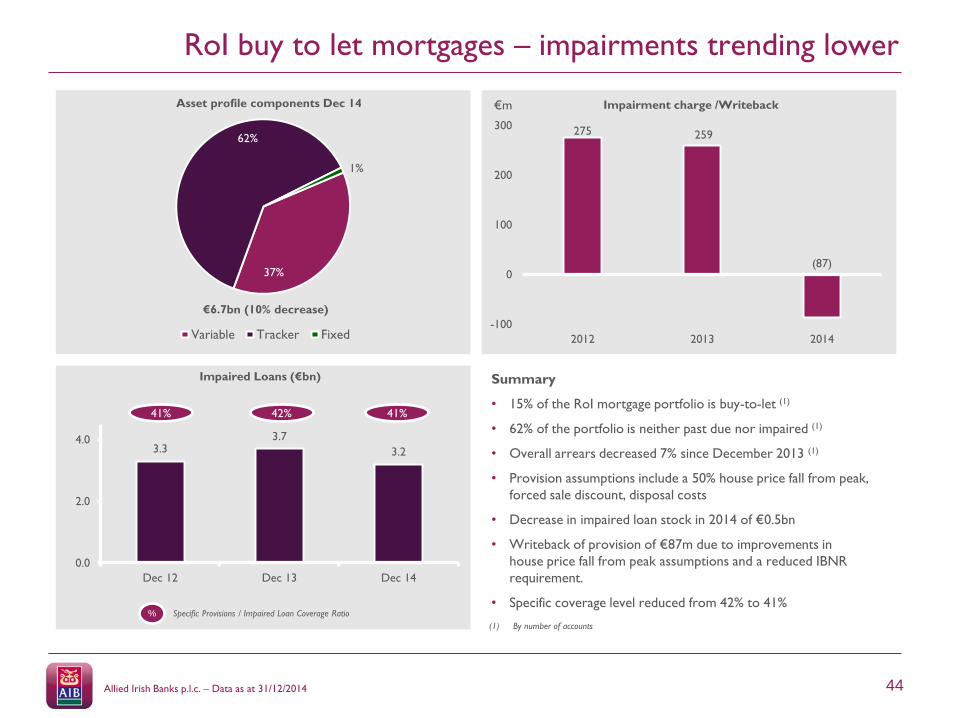
RoI buy to let mortgages – impairments trending lower
275 259
(87)
-100
0
100
200
300
2012 2013 2014
Impairment charge /Writeback
37%
62%
1%
Variable Tracker Fixed
3.33.7
3.2
0.0
2.0
4.0
Dec 12 Dec 13 Dec 14
%
Specific Provisions / Impaired Loan Coverage Ratio
41% 42% 41%
Impaired Loans (€bn)
Asset profile components Dec 14
Summary
• 15% of the RoI mortgage portfolio is buy-to-let (1)
• 62% of the portfolio is neither past due nor impaired (1)
• Overall arrears decreased 7% since December 2013 (1)
• Provision assumptions include a 50% house price fall from peak,
forced sale discount, disposal costs
• Decrease in impaired loan stock in 2014 of €0.5bn
• Writeback of provision of €87m due to improvements in
house price fall from peak assumptions and a reduced IBNR
requirement.
• Specific coverage level reduced from 42% to 41%
€m
(1) By number of accounts
€6.7bn (10% decrease)

Allied Irish Banks p.l.c. – Data as at 31/12/2014 45
781724
(244)-400
-200
0
200
400
600
800
2012 2013 2014
26%
69%
2%3%
Land & Development Investment Property
Contractors Housing Associations
13.8 13.2
8.8
0.0
4.0
8.0
12.0
16.0
Dec 12 Dec 13 Dec 14
%
Specific Provisions / Impaired Loan Coverage Ratio
56% 62% 62%
Asset profile components Dec 2014 Impairment charge / Writeback
Impaired Loans (€bn)
Property and construction – 33% reduction in impaired loans
Summary
• Increase in demand and values in Irish property market, albeit off a low
base
- Demand remains particularly evident in prime locations,
lower in secondary areas
• Overall portfolio has reduced by 21% since Dec 13 mainly due to
restructuring and repayments from asset sales
• Impaired loans reduced by €4.3bn to €8.8bn
- Rate of new impairments continuing to decrease
• Investment property portfolio reduced by €2.3bn to €10.7bn in the
year due to restructuring and repayment of debt
• Land and development portfolio of €4.1bn, 76% of which is in Ireland
- 86% is impaired with 75% specific provision cover
€15.5bn (21% decrease)
€m

Allied Irish Banks p.l.c. – Data as at 31/12/2014 46
517
221
81
0
200
400
600
2012 2013 2014
13%
16%
21%
50%
Agriculture Retail/Wholesale
Hotel & licensed premises Other / Services
5.24.8
3.4
0.0
2.0
4.0
6.0
Dec 12 Dec 13 Dec 14
Summary
%
Specific Provisions / Impaired Loan Coverage Ratio
60% 66% 61%
Asset profile components Dec 2014 Impairment Charge
Impaired Loans (€bn)
SME / other commercial – 29% reduction in impaired loans
• 65% of portfolio is in ROI and 35% in the UK
- Concentrated in sectors that are dependent on respective
domestic economies
• Improving macroeconomic indicators are starting to positively impact demand
for credit and overall asset quality
• Increase in satisfactory loans mainly due to new drawdowns exceeding
amortisation
• €1.5bn reduction in criticised loans to €5.8bn as a result of restructure and
repayments
- Impaired loans are €3.4bn, a reduction of 29% on Dec 13
- Specific provision cover decreased to 61% mainly due to write
offs of provisions for loans with higher provision cover and the
impact of restructures
- Full year impairment charge down 63% to €81m
€12.9bn (6% decrease)
€m

Allied Irish Banks p.l.c. – Data as at 31/12/2014 47
Asset quality stabilising in corporate and personal loan books
90%
2%
0%
8%
Satisfactory Watch
Vulnerable Impaired
803
476
378
0
300
600
900
Dec 12 Dec 13 Dec 14
58%
6%
9%
27%
Satisfactory Watch
Vulnerable Impaired
1,431 1,423
1,044
0
400
800
1200
1600
Dec 12 Dec 13 Dec 14
Summary
Summary
Corporate Lending €4.7bn
Dec 2014 - Asset quality profile
Dec 2014 - Asset quality profile
Impaired Loans
Impaired Loans
%
Specific Provisions / Impaired Loan Coverage Ratio
74% 77% 69%
%
Specific Provisions / Impaired Loan Coverage Ratio
60% 48% 50% • Overall portfolio increased by €0.4bn (+10%)
• Criticised loans decreased by €0.3bn (-38%) since
Dec 13
- Impaired loans of €0.4bn at Dec 2014,
down from €0.5bn in 2013.
- Specific provision cover of 50%
- Impairment charge for 2014 of €46m
versus €30m in 2013
• Overall portfolio reduction of €0.5bn (-11%) to
€3.8bn
- €2.9bn in loans and overdrafts
- €0.9bn in credit card facilities
• Level of satisfactory credit quality loans has
remained stable with debt amortisation offset by
new lending
• Criticised loans decreased by €0.5bn ( -22%) since
Dec 2013 mainly in FSG
- Impaired loans of €1.0bn at Dec 2014
down 27%
- Impairment charge for 2014 of €15m
decreased by 88% compared to 2013
Personal Lending €3.8bn
€m
€m

Allied Irish Banks p.l.c. – Data as at 31/12/2014 48
ROI Mortgages - Stock of forbearance measures
December 2014 December 2013 Change %
Forbearance Type by Mortgage Number Balance (€m) Number Balance (€m) Number Balance
Interest Only 5,626 1,034 7,465 1,538 -25% -33%
Reduced payment (greater than interest only) 2,162 446 2,818 608 -23% -27%
Payment moratorium 862 127 462 77 87% 65%
Arrears capitalisation 17,050 2,741 9,993 1,908 71% 44%
Term Extension 6,378 710 7,043 769 -9% -8%
Split mortgages 2,399 372 236 35 917% 963%
Voluntary sale for loss 550 53 ND ND NA NA
Low fixed interest rate 377 59 ND ND NA NA
Positive equity solution 228 23 ND ND NA NA
Other 18 5 140 15 NM NM
Total 35,650 €5,570 28,157 €4,950 27% 13%
Allied Irish Banks p.l.c. – Data as at 31/12/2014 49
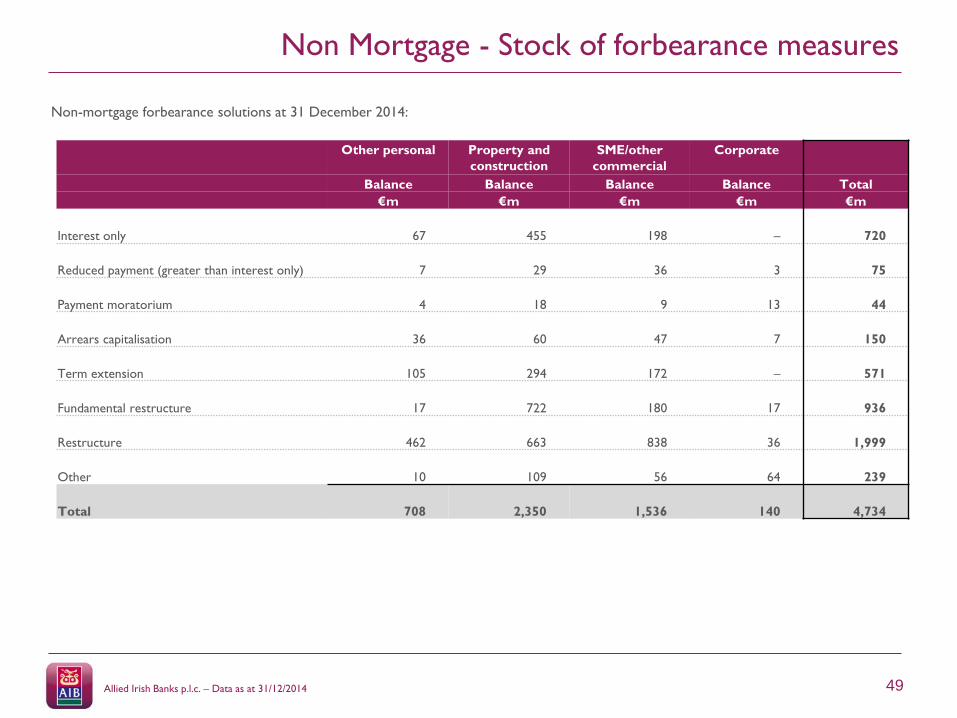
Non Mortgage - Stock of forbearance measures
Other personal Property and
construction
SME/other
commercial
Corporate
Balance Balance Balance Balance Total
€m €m €m €m €m
Interest only 67 455 198 – 720
Reduced payment (greater than interest only) 7 29 36 3 75
Payment moratorium 4 18 9 13 44
Arrears capitalisation 36 60 47 7 150
Term extension 105 294 172 – 571
Fundamental restructure 17 722 180 17 936
Restructure 462 663 838 36 1,999
Other 10 109 56 64 239
Total 708 2,350 1,536 140 4,734
Non-mortgage forbearance solutions at 31 December 2014: