for the week ending december 21, the ocean freight rate ... · pdf filegrain transportation...
TRANSCRIPT

A weekly publication of the Agricultural Marketing Service
www.ams.usda.gov/GTR
December 28, 2017
Contents
Article/
Calendar
Grain
Transportation
Indicators
Rail
Barge
Truck
Exports
Ocean
Brazil
Mexico
Grain Truck/Ocean
Rate Advisory
Datasets
Specialists
Subscription
Information
--------------
The next
release is January 4, 2018
Preferred citation: U.S. Dept. of Agriculture, Agricultural Marketing Service. Grain Transportation Report.December 28, 2017.
Web: http://dx.doi.org/10.9752/TS056.12-28-2017
Grain Transportation Report
Contact Us
WEEKLY HIGHLIGHTS
Cold Weather May Impact Barge Logistics
Much of the central and eastern United States is experiencing extremely cold weather and sub-freezing temperatures that may form
significant ice accumulations on the Upper Mississippi and Illinois Rivers. The ice formations can restrict lock transit and narrow
navigation channels. As a result of the freeze-up, river levels have dropped, especially at St. Louis, MO, where the river gage is
forecast to drop from 2.0 feet on December 26 to -2.2 feet by January 4. Gage height is a measurement of river elevation the U.S.
Army Corps of Engineers (Corps) uses at various locations on individual rivers and refers to the number of feet above or below a
reference point on the river bank. It does not refer to the depth of the river and varies by location. The Corps, U.S. Coast Guard and
river representatives have formed a joint committee that places restrictions (e.g., depth of draft for barges) on river traffic when the
gage at St. Louis declines to -3.5 feet. In the event of possible extreme low water levels, the Corps has procedures to release water
from upstream dams that have the potential to increase water levels.
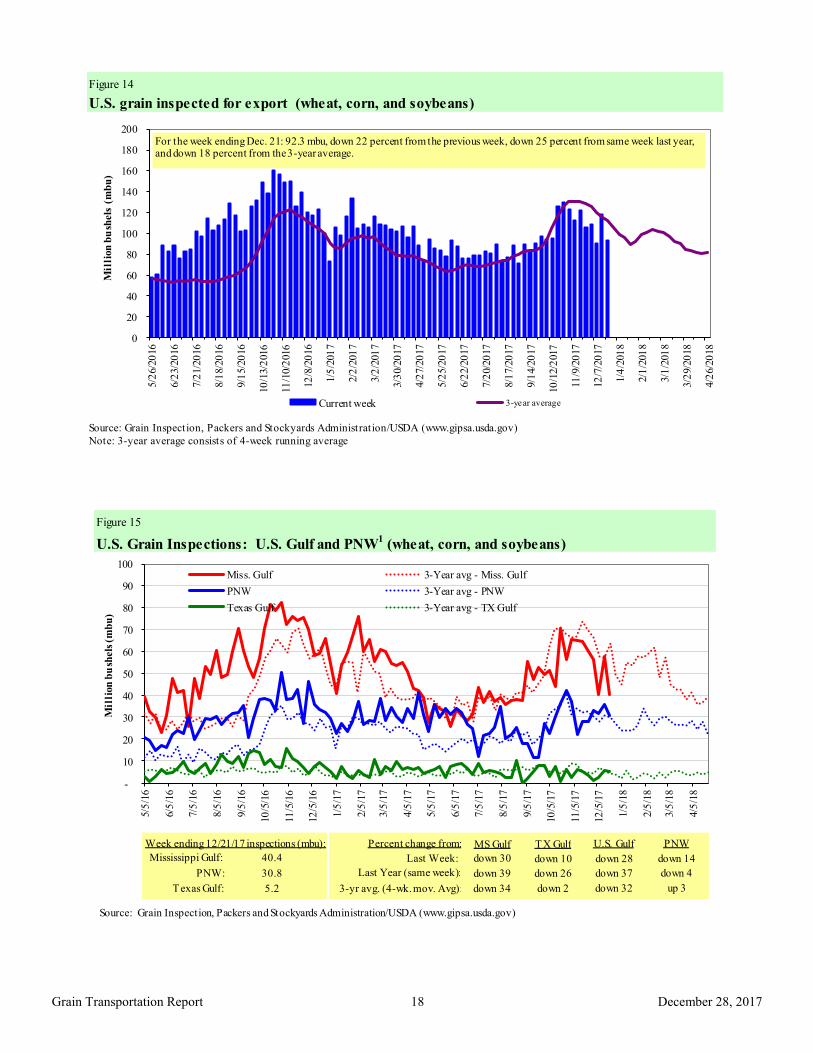
Soybean, Wheat, and Corn Inspections All Decline from Previous Week
For the week ending December 21, total inspections of grain (corn, wheat, and soybeans) for export from all major U.S. export regions
fell to 2.47 million metric tons (mmt), down 22 percent from the previous week, down 25 percent from the same time last year, and
down 18 percent from the 3-year average. The decrease in total grain inspections consisted of a 28 percent decline in soybean
inspections, a 21 percent decline in wheat inspections, and a 4 percent decline in corn inspections. Mississippi Gulf grain inspections
declined 30 percent, and Pacific Northwest (PNW) inspections declined 15 percent.
Transportation Board Annual Meeting: January 7 to 11
The Transportation Research Board’s 97th Annual Meeting will be held January 7-11, 2018 in Washington, DC. The meeting program
covers all transportation modes and has over 5,000 presentations in nearly 800 sessions and workshops. These sessions and workshops
address topics of interest to policy makers, administrators, practitioners, researchers, and representatives of government, industry, and
academic institutions. A number of presentations focus on agricultural and grain transportation, including those organized under the
following sessions (among others): “From Farm to Table: Multimodal Opportunities and Challenges of Moving the World's Food,”
“Trade, Food, and Freight—How Changing Trends in Production and Consumption Affect Movement of Food Exports and Imports,”
and “Agriculture Commodity Data: Challenges and Applications.”
Snapshots by Sector
Export Sales
For the week ending December 14 unshipped balances of wheat, corn, and soybeans totaled 35.5 mmt, down 18 percent from the
same time last year. Net weekly wheat export sales were .796 mmt, up 35 percent from the previous week. Net corn export sales
were 1.6 mmt, up 80 percent from the previous week, and net soybean export sales were 1.7 mmt for the same period, up 20 percent
from the previous week.
Rail
U.S. Class I railroads originated 23,571 grain carloads for the week ending December 16, down 1 percent from the previous week,
down 3 percent from last year, and down 1 percent from the 3-year average.
Average January shuttle secondary railcar bids/offers per car were $27 below tariff for the week ending December 21, up $60 from
last week, and $452 lower than last year. There were no non-shuttle bids/offers this week.
Barge For the week ending December 23, barge grain movements totaled 630,186 tons, 22 percent lower than the previous week, and down
2 percent from the same period last year.
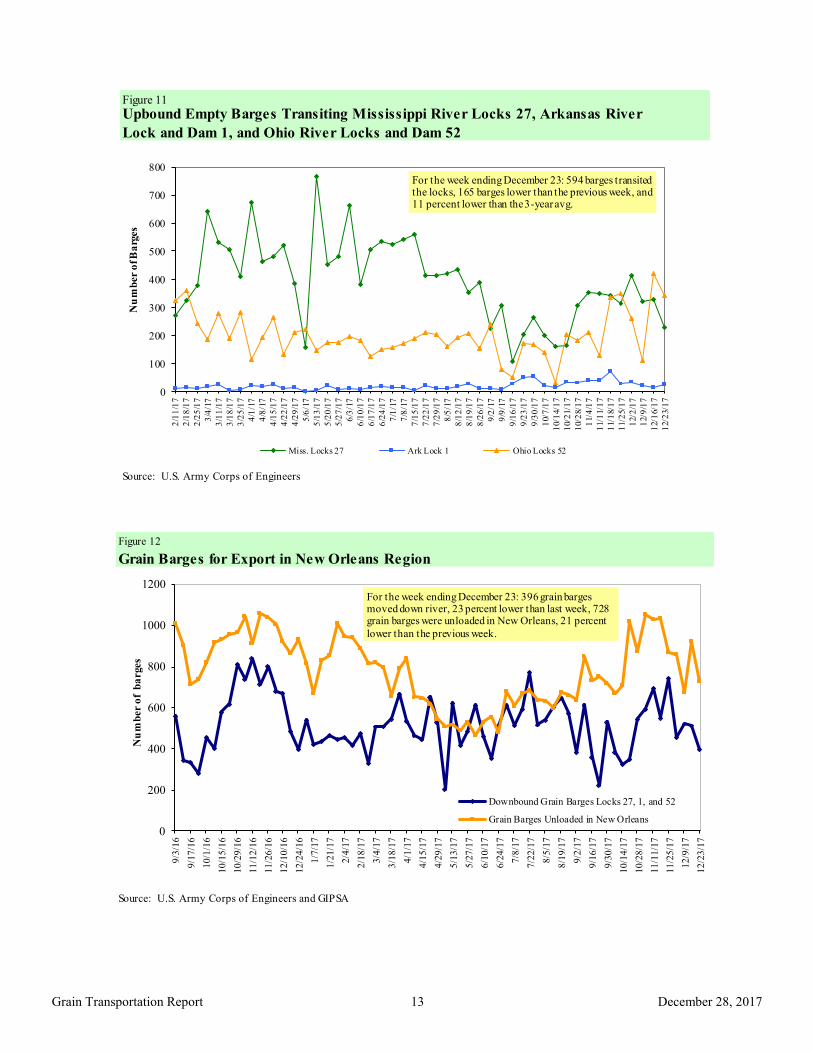
For the week ending December 23, 396 grain barges moved down river, down 23 percent from last week. 728 grain barges were
unloaded in New Orleans, 21 percent lower than the previous week.
Ocean
For the week ending December 21, 31 ocean-going grain vessels were loaded in the Gulf, 34 percent less than the same period last
year. Forty-nine vessels are expected to be loaded within the next 10 days, 23 percent less than the same period last year.
For the week ending December 21, the ocean freight rate for shipping bulk grain from the Gulf to Japan was $44.25 per metric ton,
down 3 percent from the previous week. The cost of shipping from the PNW to Japan was $24.75 per metric ton, down 2 percent from
the previous week.
Fuel
During the week ending December 25, average diesel fuel prices increased 0.2 cents from the previous week at $2.90 per gallon, 36
cents above the same week last year.
December 28, 2017
Grain Transportation Report 2
Feature Article/Calendar
To Our Readers:
We sincerely appreciate our readers and their continued support this past year. USDA’s Grain Transportation Report
(GTR) team recognizes the U.S. grain business is highly competitive, fast paced, and ever evolving. We know the
industry’s need for timely and high quality information is essential for making good transportation and marketing decisions
and that an efficient and well informed grain industry is critical to U.S. agriculture and our Nation’s economy. Thus, our
team aspires to provide the U.S. grain industry with up-to-date, timely, and insightful information throughout the year in the
GTR to assist the industry in making sound decisions. In addition to the GTR, we also provide other timely information and
analysis relevant to the transportation of agricultural products. For example, our staff gave several presentations at
conferences and stakeholder groups to emphasize the importance of transportation to agriculture. In addition, several
cooperating universities also wrapped-up research funded by AMS, such as a study modeling the transportation costs of
international containerized soybean exports and a study of grain basis behavior during transportation disruptions.
Overall Recap
A quick high-level recap of the year shows that a majority of the Midwest experienced a relatively mild winter in 2017 with
occasional periods of record warmth accompanied by brief episodes of rain or snow, with fewer than normal delays and
disruptions. However, there were weather-related rail disruptions in the west and Upper Plains States during the early part
of the year. This temporarily reduced carloads and increased the number of outstanding car orders. In the spring, barge
traffic saw disruptions with high water conditions and delays caused by lock and dam repairs. The impact of Hurricane
Harvey later in the year slowed traffic in the Texas Gulf.
Despite the logistics issues grain transportation overcame many obstacles in 2017, but nevertheless fell short of reaching
the levels achieved in 2016. For example, year-to-date (through December 16, 2017) grain carloads originated by U.S.
Class I railroads are 2.5 percent lower than a year ago. As of week 51, total grain barge tonnages in 2017 reached 42.4
million tons, 5 percent lower than last year’s total annual tonnage.
Despite an uptick in the ocean freight rates during the year, grain exports and grain loading activities in the U.S. Gulf and
the Pacific Northwest (PNW) were strong throughout the year. Year-to-date ocean-going grain vessels, loaded or waiting to
load in the U.S. Gulf and PNW, were 2,338 and 959—4 and 30 percent more than the previous year, respectively.
2017 Agricultural Transportation Overview
Even with a record soybean crop and near-record corn crop, late 2017 did not have major transportation problems
sometimes associated with large crops. Key developments and observations in 2017 are highlighted below.
Grain Inspections: U.S. inspections of grain for export were strong during the first half of 2017, but began to slow down
after that period, despite the fall harvest of corn and soybeans. Year-to-date inspections of corn and soybeans are down 7
and 5 percent, respectively, from last year due in part to increased export competition, but wheat inspections are up 13
percent.
Rail: With high grain stocks in December 2016 (see January 26, 2017 GTR), U.S. Class I rail grain shipments set monthly
volume records in March and May of 2017 at 117,988 and 116,679 carloads, respectively. However, the high premiums in
the secondary railcar market that began with the 2016 record corn and soybean harvest (and continued through March of
2017) did not reemerge with the 2017 harvest. Compared to the previous year, weekly average October shuttle rates per car
were almost $1,000 less on BNSF Railway (BNSF) and $700 less on Union Pacific Railway (UP) between August and
October. Weekly average November shuttle rates per car were almost $600 less on BNSF and $200 less on UP between
August and November. By the end of November, average secondary shuttle rates were trading at a $100 to $300 discount to
the tariff rate, indicating surplus capacity for grain railcars. Contributing factors to railcar availability during this year’s
harvest included reduced soybean exports and the slower pace and smaller harvest of this year’s corn crop. As a result,
weekly grain carloadings averaged only 89 percent of the comparable amount recorded for last year between October and
the first half of December. In addition, railroads did not experience any major transportation disruptions during the 2017
harvest, which helped keep the supply of grain cars balanced with shipper demand.
Railroads also dealt with various weather-related disruptions in 2017. Beginning in late 2016 and continuing through the
first quarter of 2017, the western railroads—BNSF, UP, and Canadian Pacific Railway—faced severe winter conditions,
with heavy snow, track washouts, and landslides (see February 23, 2017 GTR). Much of this was concentrated in the Upper
Great Plains and Pacific Northwest region. In late August and early September, Hurricanes Harvey and Irma temporarily
affected rail operations in the Texas Gulf and Florida, but despite these challenges, rail service for the 2017 grain harvest
was relatively smooth

December 28, 2017
Grain Transportation Report 3
Barge: The Midwest experienced a relatively mild winter with occasional periods of record warmth accompanied by brief
episodes of rain or snow. This resulted in generally normal navigation conditions throughout early 2017. However, by
spring, persistent rainfall caused high water conditions that slowed and sometimes halted navigation on portions of the
Nation’s inland waterways. Continued rain produced constant high water throughout much of June. As July began, falling
river levels throughout the Midwest caused navigation delays as river operations adjusted to the lower water levels. At Ohio
River Locks and Dam (L&D) 52, structural problems began that would impact navigation for the rest of the year. In
addition, on-going repairs at La Grange L&D on the Illinois River would also slow traffic. During December, dredging
activities to remove underwater rock formations delayed barge traffic on the Mississippi River between St. Louis and the
mouth of the Ohio River. As of week 51 (December 23), calendar-year-to-date grain barge tonnages on the locking portions
of the Mississippi, Ohio, and Arkansas Rivers reached 40.3 million tons, 5 percent lower than last year’s 51-week total.
However, from September through November (first quarter of 2017-18 crop year), marketing year–to-date tonnages
amounted to 5.9 million tons, 15 percent lower than the same period a year ago. The recent decline is due in part to stronger
than expected competition from South America in the soybean market.
Ocean: Ocean freight rates for shipping bulk commodities, including grain, increased during the year due to strong iron ore
and grain trade demand, but as of mid-December, rates still remained significantly below the historical highs of 2008
because the bulk shipping market is flooded with excess vessel supply. Despite the increase in ocean freight rates, ocean-
going grain vessel loading activity out of the U.S. Gulf and Pacific Northwest continued to be strong. As of December 14,
the Gulf-to-Japan Panamax rate was $45.50 per metric ton (mt)—24 percent more than the same period a year earlier, and
13 percent above the 4-year average. The Pacific Northwest-to-Japan rate was $25.25 per mt—up 31 percent from the
beginning of the year, and 2 percent above the 4-year average.
Happy New Year
We are thankful for another great year and look forward to continuing to serve our readers in the years ahead. We sincerely
hope the insight and analysis we provide have helped you to make informed transportation and marketing decisions. We
thank all industry and government representatives who regularly and voluntarily provide us with the necessary information
and data to produce this report. We wish you a healthy and prosperous New Year!
Sincerely,
The Grain Transportation Report Team
December 28, 2017
Grain Transportation Report 4
Grain Transportation Indicators
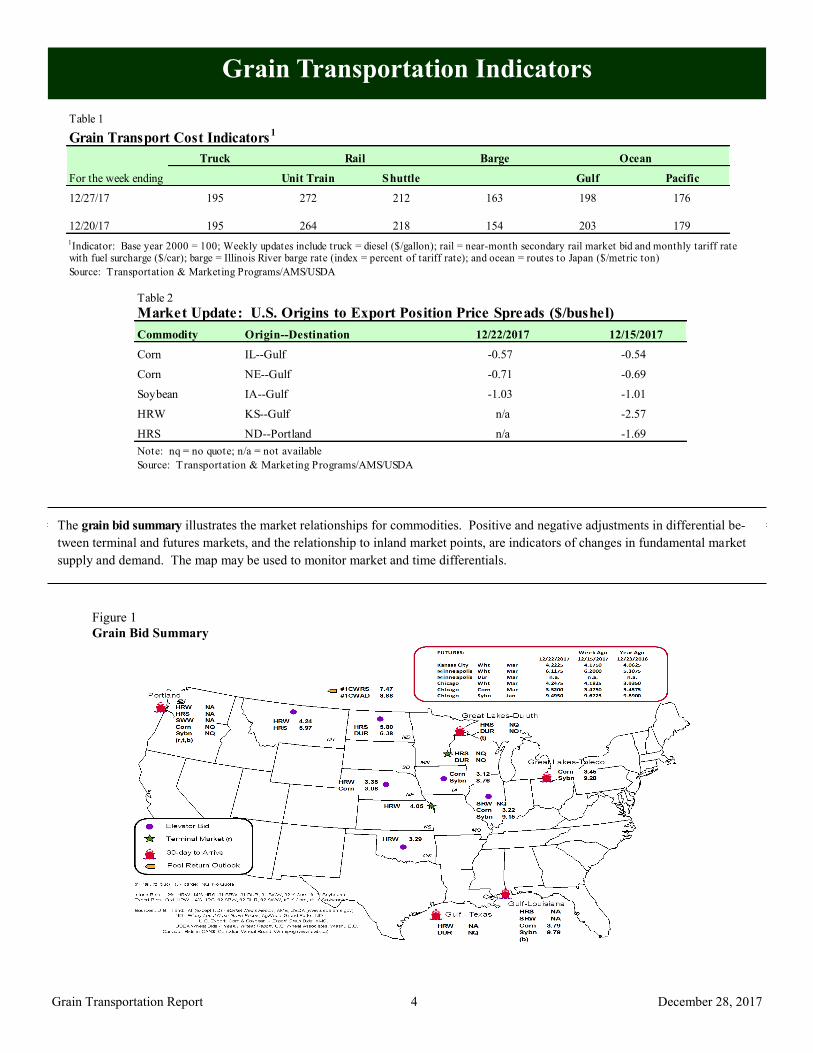
The grain bid summary illustrates the market relationships for commodities. Positive and negative adjustments in differential be-
tween terminal and futures markets, and the relationship to inland market points, are indicators of changes in fundamental market
supply and demand. The map may be used to monitor market and time differentials.
Table 1
Grain Transport Cost Indicators1
Truck Barge Ocean
For the week ending Unit Train Shuttle Gulf Pacific
12/27/17 195 272 212 163 198 1760 % - 10 0 % 5% - 3 % - 2 %
12/20/17 195 264 218 154 203 179
1Indicator: Base year 2000 = 100; Weekly updates include truck = diesel ($/gallon); rail = near-month secondary rail market bid and monthly tariff rate with fuel surcharge ($/car); barge = Illinois River barge rate (index = percent of tariff rate); and ocean = routes to Japan ($/metric ton)
Source: Transportation & Marketing Programs/AMS/USDA
Rail
Table 2
Market Update: U.S. Origins to Export Position Price Spreads ($/bushel)
Commodity Origin--Destination 12/22/2017 12/15/2017
Corn IL--Gulf -0.57 -0.54
Corn NE--Gulf -0.71 -0.69
Soybean IA--Gulf -1.03 -1.01
HRW KS--Gulf n/a -2.57
HRS ND--Portland n/a -1.69
Note: nq = no quote; n/a = not available
Source: Transportation & Marketing Programs/AMS/USDA
Figure 1
Grain Bid Summary

December 28, 2017
Grain Transportation Report 5
Rail Transportation
Railroads originate approximately 24 percent of U.S. grain shipments. Trends in these loadings are indicative of
market conditions and expectations.
Figure 2
Rail Deliveries to Port
0
1,000
2,000
3,000
4,000
5,000
6,000
7,000
8,000
9,000
10,000
07
/03/1
3
08
/28/1
3
10
/23/1
3
12
/18/1
3
02
/12/1
4
04
/09/1
4
06
/04/1
4
07
/30/1
4
09
/24/1
4
11
/19/1
4
01
/14/1
5
03
/11/1
5
05
/06/1
5
07
/01/1
5
08
/26/1
5
10
/21/1
5
12
/16/1
5
02
/10/1
6
04
/06/1
6
06
/01/1
6
07
/27/1
6
09
/21/1
6
11
/16/1
6
01
/11/1
7
03
/08/1
7
05
/03/1
7
06
/28/1
7
08
/23/1
7
10
/18/1
7
12
/13/1
7
02
/07/1
8
04
/04/1
8
05
/30/1
8
Ca
rlo
ad
s -
4-w
eek
ru
nn
ing
average
Pacific Northwest: 4 wks. ending 12/20--down 4% from same period last year; up 9% from 4-year average
Texas Gulf: 4 wks. ending 12/20--down 56% from same period last year; down 41% from the 4-year average
Miss. River: 4 wks. ending 12/20--down 55% from same period last year; down 66% from 4-year average
Cross-border: 4 wks. ending 12/16--up 17% from same period last year; up 31% from 4-year average
Source: Transportation & Marketing Programs/AMS/USDA
Table 3
Rail Deliveries to Port (carloads)1
Mississippi Pacific Atlantic & Cross-Border
For the Week Ending Gulf Texas Gulf Northwest East Gulf Total Week ending Mexico3
12/20/2017p
518 1,447 6,794 413 9,172 12/16/2017 2,264
12/13/2017r
360 1,021 7,120 399 8,900 12/9/2017 1,705
2017 YTDr
28,572 75,429 283,759 21,723 409,483 2017 YTD 117,488
2016 YTDr
36,167 85,728 294,447 27,825 444,167 2016 YTD 105,264
2017 YTD as % of 2016 YTD 79 88 96 78 92 % change YTD 112
Last 4 weeks as % of 20162
45 44 96 32 75 Last 4wks % 2016 117
Last 4 weeks as % of 4-year avg.2
34 59 109 33 85 Last 4wks % 4 yr 131
Total 2016 36,925 86,992 299,932 28,728 452,577 Total 2016 92,982
Total 2015 29,054 60,819 239,029 26,730 355,632 Total 2015 97,7361
Data is incomplete as it is voluntarily provided2 Compared with same 4-weeks in 2016 and prior 4-year average. 3 Cross-border weekly data is approximately 15 percent below the Association of American Railroads' reported weekly carloads received by Mexican railroads
to reflect switching between KCSM and FerroMex.
YTD = year-to-date; p = preliminary data; r = revised data; n/a = not available
Source: Transportation & Marketing Programs/AMS/USDA
December 28, 2017
Grain Transportation Report 6
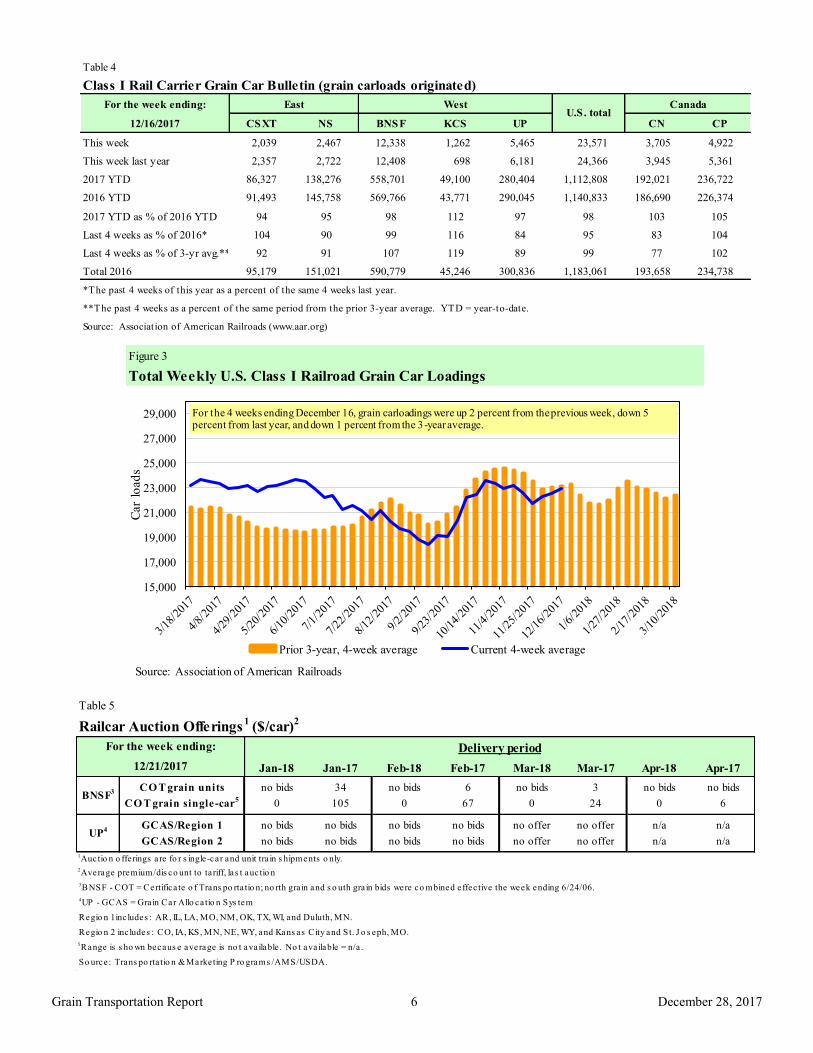
Table 4
Class I Rail Carrier Grain Car Bulletin (grain carloads originated)
For the week ending:
12/16/2017 CSXT NS BNSF KCS UP CN CP
This week 2,039 2,467 12,338 1,262 5,465 23,571 3,705 4,922
This week last year 2,357 2,722 12,408 698 6,181 24,366 3,945 5,361
2017 YTD 86,327 138,276 558,701 49,100 280,404 1,112,808 192,021 236,722
2016 YTD 91,493 145,758 569,766 43,771 290,045 1,140,833 186,690 226,374
2017 YTD as % of 2016 YTD 94 95 98 112 97 98 103 105
Last 4 weeks as % of 2016* 104 90 99 116 84 95 83 104
Last 4 weeks as % of 3-yr avg.** 92 91 107 119 89 99 77 102
Total 2016 95,179 151,021 590,779 45,246 300,836 1,183,061 193,658 234,738
*The past 4 weeks of this year as a percent of the same 4 weeks last year.
**The past 4 weeks as a percent of the same period from the prior 3-year average. YTD = year-to-date.
Source: Association of American Railroads (www.aar.org)
East WestU.S. total
Canada
Figure 3
Total Weekly U.S. Class I Railroad Grain Car Loadings
15,000
17,000
19,000
21,000
23,000
25,000
27,000
29,000
Car
load
s
Prior 3-year, 4-week average Current 4-week average
For the 4 weeks ending December 16, grain carloadings were up 2 percent from the previous week, down 5 percent from last year, and down 1 percent from the 3-year average.
Source: Association of American Railroads
Table 5
Railcar Auction Offerings1
($/car)2
Jan-18 Jan-17 Feb-18 Feb-17 Mar-18 Mar-17 Apr-18 Apr-17
CO T grain units no bids 34 no bids 6 no bids 3 no bids no bids
CO T grain single-car5 0 105 0 67 0 24 0 6
GCAS/Region 1 no bids no bids no bids no bids no offer no offer n/a n/a
GCAS/Region 2 no bids no bids no bids no bids no offer no offer n/a n/a
1Auctio n o fferings a re fo r s ingle-car and unit tra in s hipments o nly.2Average premium/dis co unt to ta riff, las t auc tio n
3BNSF - COT = Certifica te o f Trans po rta tio n; no rth gra in and s o uth gra in bids were co mbined effec tive the week ending 6/24/06.
4UP - GCAS = Grain Car Allo ca tio n Sys tem
Regio n 1 inc ludes : AR, IL, LA, MO, NM, OK, TX, WI, and Duluth, MN.
Regio n 2 inc ludes : CO, IA, KS, MN, NE, WY, and Kans as City and St. J o s eph, MO.
5Range is s ho wn becaus e average is no t ava ilable . No t ava ilable = n/a .
So urce : Trans po rta tio n & Marketing P ro grams /AMS/USDA.
UP4
Delivery period
BNSF3
For the week ending:
12/21/2017

December 28, 2017
Grain Transportation Report 7
The secondary rail market information reflects trade values for service that was originally purchased from the railroad carrier as
some form of guaranteed freight. The auction and secondary rail values are indicators of rail service quality and demand/
supply.
Figure 4
Bids/Offers for Railcars to be Delivered in January 2018, Secondary Market
-200
0
200
400
600
800
1000
1200
6/1
/201
7
6/1
5/20
17
6/2
9/20
17
7/1
3/20
17
7/2
7/20
17
8/1
0/20
17
8/2
4/20
17
9/7
/201
7
9/2
1/20
17
10/5
/20
17
10
/19/2
017
11/2
/20
17
11
/16/2
017
11
/30/2
017
12
/14/2
017
12
/28/2
017
1/1
1/20
18
Aver
age
pre
miu
m/d
isco
unt
to t
arif
f
($/c
ar)
Shuttle Non-Shuttle
Shuttle prior 3-yr avg. (same week) Non-Shuttle prior 3-yr avg. (same week)12/21/2017
Non-shuttle bids include unit-train and single-car bids. n/a = not available.Source: Transportation & Marketing Programs/AMS/USDA
n/a
UPBNSF
$83
n/a
-$138Shuttle
Non-Shuttle
There were no Non-Shuttle bids/offers this week.
Average Shuttle bids/offers rose $60 this week and are at the peak.
Figure 5
Bids/Offers for Railcars to be Delivered in February 2018, Secondary Market
-200
-100
0
100
200
300
400
500
600
700
6/2
9/20
17
7/1
3/20
17
7/2
7/20
17
8/1
0/20
17
8/2
4/20
17
9/7
/201
7
9/2
1/20
17
10/5
/20
17
10
/19/2
017
11/2
/20
17
11
/16/2
017
11
/30/2
017
12
/14/2
017
12
/28/2
017
1/1
1/20
18
1/2
5/20
18
2/8
/201
8
Aver
age
pre
miu
m/d
isco
unt
to t
arif
f
($/c
ar)
Shuttle Non-Shuttle
Shuttle prior 3-yr avg. (same week) Non-Shuttle prior 3-yr avg. (same week)12/21/2017
Non-shuttle bids include unit-train and single-car bids. n/a = not available.Source: Transportation & Marketing Programs/AMS/USDA
n/a
UPBNSF
$50
n/a
n/aShuttle
Non-Shuttle
There were no Non-Shuttle bids/offers this week.
There were no Shuttle bids/offers last week. Average Non-Shuttle bids/offers this week are at the peak.

December 28, 2017
Grain Transportation Report 8
Figure 6
Bids/Offers for Railcars to be Delivered in March 2018, Secondary Market
-300
-200
-100
0
100
200
300
400
500
600
700
7/2
7/20
17
8/1
0/20
17
8/2
4/20
17
9/7
/201
7
9/2
1/20
17
10/5
/20
17
10
/19/2
017
11/2
/20
17
11
/16/2
017
11
/30/2
017
12
/14/2
017
12
/28/2
017
1/1
1/20
18
1/2
5/20
18
2/8
/201
8
2/2
2/20
18
3/8
/201
8
Aver
age
pre
miu
m/d
isco
unt
to t
arif
f
($/c
ar)
Shuttle Non-Shuttle
Shuttle prior 3-yr avg. (same week) Non-Shuttle prior 3-yr avg. (same week)12/21/2017
Non-shuttle bids include unit-train and single-car bids. n/a = not available.Source: Transportation & Marketing Programs/AMS/USDA
n/a
UPBNSF
-$150
n/a
n/aShuttle
Non-Shuttle
There were no Non-Shuttle bids/offers this week.
There were no Shuttle bids/offers last week. Average Non-Shuttle bids/offers this week are at the peak.
Table 6
Weekly Secondary Railcar Market ($/car)1
Jan-18 Feb-18 Mar-18 Apr-18 May-18 Jun-18
BNSF-GF n/a n/a n/a n/a n/a n/a
Change from last week n/a n/a n/a n/a n/a n/a
Change from same week 2016 n/a n/a n/a n/a n/a n/a
UP-Pool n/a n/a n/a n/a n/a n/a
Change from last week n/a n/a n/a n/a n/a n/a
Change from same week 2016 n/a n/a n/a n/a n/a n/a
BNSF-GF 83 50 (150) n/a n/a n/a
Change from last week 58 n/a n/a n/a n/a n/a
Change from same week 2016 (817) n/a n/a n/a n/a n/a
UP-Pool (138) n/a n/a n/a n/a n/a
Change from last week 62 n/a n/a n/a n/a n/a
Change from same week 2016 (88) n/a n/a n/a n/a n/a
1Average premium/dis co unt to ta riff, $ /car-las t week
No te : Bids lis ted are market INDICATORS o nly & are NOT guaranteed prices ,
n/a = no t ava ilable ; GF = guaranteed fre ight; P o o l = guaranteed po o l
So urces : Trans po rta tio n and Marketing P ro grams /AMS/USDA
Data fro m J ames B. J o iner Co ., Tradewes t Bro kerage Co .
No
n-s
hu
ttle
For the week ending:
12/21/2017
Sh
utt
le
Delivery period

December 28, 2017
Grain Transportation Report 9
The tariff rail rate is the base price of freight rail service, and together with fuel surcharges and any auction and secondary rail
values constitute the full cost of shipping by rail. Typically, auction and secondary rail values are a small fraction of the full
cost of shipping by rail relative to the tariff rate. High auction and secondary rail values, during times of high rail demand or
short supply, can exceed the cost of the tariff rate plus fuel surcharge.
Table 7
Tariff Rail Rates for Unit and Shuttle Train Shipments1
Percent
Tariff change
December, 2017 Origin region3
Destination region3
rate/car metric ton bushel2
Y/Y4
Unit train
Wheat Wichita, KS St. Louis, MO $3,883 $71 $39.26 $1.07 4
Grand Forks, ND Duluth-Superior, MN $4,143 $0 $41.14 $1.12 0
Wichita, KS Los Angeles, CA $7,050 $0 $70.01 $1.91 1
Wichita, KS New Orleans, LA $4,540 $125 $46.32 $1.26 4
Sioux Falls, SD Galveston-Houston, TX $6,786 $0 $67.39 $1.83 5
Northwest KS Galveston-Houston, TX $4,816 $137 $49.18 $1.34 4
Amarillo, TX Los Angeles, CA $5,021 $190 $51.75 $1.41 5
Corn Champaign-Urbana, IL New Orleans, LA $3,931 $141 $40.44 $1.03 8
Toledo, OH Raleigh, NC $6,344 $0 $63.00 $1.60 5
Des Moines, IA Davenport, IA $2,258 $30 $22.72 $0.58 1
Indianapolis, IN Atlanta, GA $5,446 $0 $54.08 $1.37 5
Indianapolis, IN Knoxville, TN $4,540 $0 $45.08 $1.15 5
Des Moines, IA Little Rock, AR $3,609 $88 $36.71 $0.93 3
Des Moines, IA Los Angeles, CA $5,327 $255 $55.43 $1.41 4
Soybeans Minneapolis, MN New Orleans, LA $3,631 $127 $37.32 $1.02 2
Toledo, OH Huntsville, AL $5,287 $0 $52.50 $1.43 5
Indianapolis, IN Raleigh, NC $6,460 $0 $64.15 $1.75 5
Indianapolis, IN Huntsville, AL $4,764 $0 $47.31 $1.29 5
Champaign-Urbana, IL New Orleans, LA $4,745 $141 $48.52 $1.32 7
Shuttle Train
Wheat Great Falls, MT Portland, OR $3,953 $0 $39.26 $1.07 0
Wichita, KS Galveston-Houston, TX $4,171 $0 $41.42 $1.13 8
Chicago, IL Albany, NY $5,663 $0 $56.24 $1.53 3
Grand Forks, ND Portland, OR $5,611 $0 $55.72 $1.52 0
Grand Forks, ND Galveston-Houston, TX $5,931 $0 $58.90 $1.60 0
Northwest KS Portland, OR $5,812 $224 $59.94 $1.63 5
Corn Minneapolis, MN Portland, OR $5,000 $0 $49.65 $1.26 0
Sioux Falls, SD Tacoma, WA $4,960 $0 $49.26 $1.25 0
Champaign-Urbana, IL New Orleans, LA $3,731 $141 $38.45 $0.98 9
Lincoln, NE Galveston-Houston, TX $3,700 $0 $36.74 $0.93 0
Des Moines, IA Amarillo, TX $3,970 $110 $40.52 $1.03 3
Minneapolis, MN Tacoma, WA $5,000 $0 $49.65 $1.26 0
Council Bluffs, IA Stockton, CA $4,820 $0 $47.86 $1.22 2
Soybeans Sioux Falls, SD Tacoma, WA $5,600 $0 $55.61 $1.51 0
Minneapolis, MN Portland, OR $5,650 $0 $56.11 $1.53 0
Fargo, ND Tacoma, WA $5,500 $0 $54.62 $1.49 0
Council Bluffs, IA New Orleans, LA $4,775 $162 $49.03 $1.33 7
Toledo, OH Huntsville, AL $4,352 $0 $43.22 $1.18 3
Grand Island, NE Portland, OR $5,710 $229 $58.98 $1.61 61A unit train refers to shipments of at least 25 cars. Shuttle train rates are generally available for qualified shipments of
75-120 cars that meet railroad efficiency requirements.
2Approximate load per car = 111 short tons (100.7 metric tons): corn 56 lbs./bu., wheat and soybeans 60 lbs./bu.
3Regional economic areas are defined by the Bureau of Economic Analysis (BEA)
4Percentage change year over year calculated using tariff rate plus fuel surcharge
Tariff plus surcharge per:Fuel
surcharge
per car
December 28, 2017
Grain Transportation Report 10
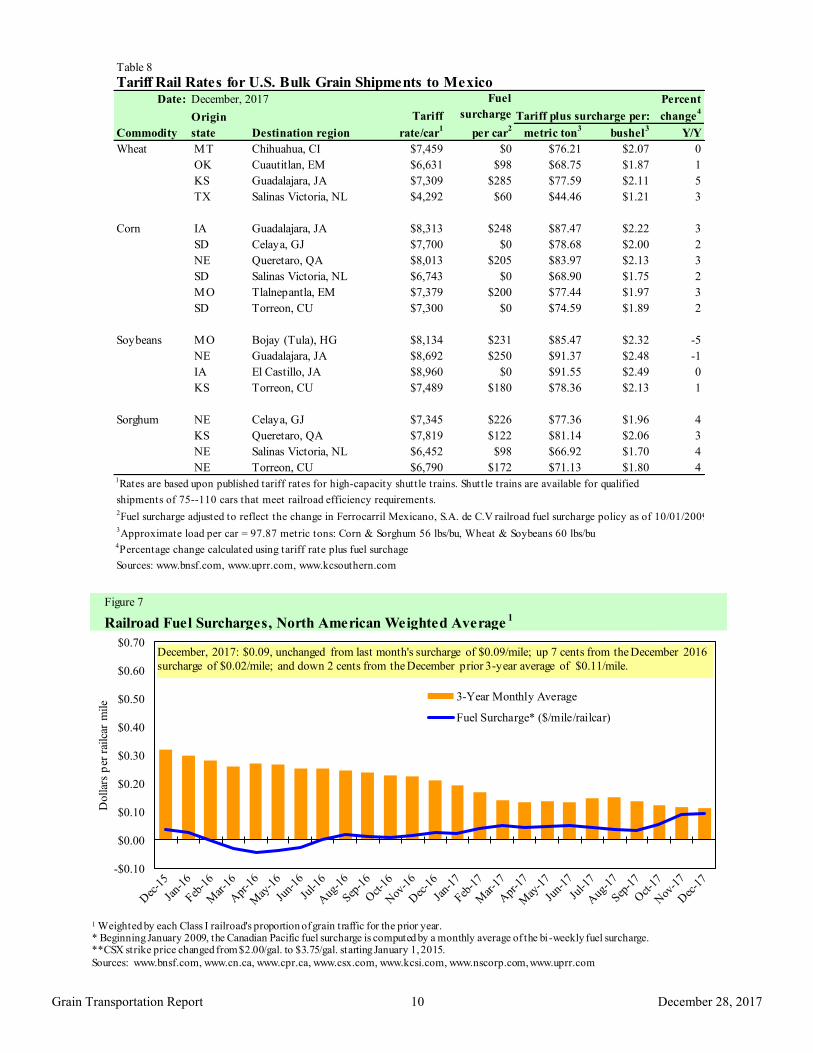
Table 8
Tariff Rail Rates for U.S. Bulk Grain Shipments to MexicoDate: Percent
Tariff change4
Commodity Destination region rate/car1
metric ton3 bushel
3Y/Y
Wheat MT Chihuahua, CI $7,459 $0 $76.21 $2.07 0
OK Cuautitlan, EM $6,631 $98 $68.75 $1.87 1
KS Guadalajara, JA $7,309 $285 $77.59 $2.11 5
TX Salinas Victoria, NL $4,292 $60 $44.46 $1.21 3
Corn IA Guadalajara, JA $8,313 $248 $87.47 $2.22 3
SD Celaya, GJ $7,700 $0 $78.68 $2.00 2
NE Queretaro, QA $8,013 $205 $83.97 $2.13 3
SD Salinas Victoria, NL $6,743 $0 $68.90 $1.75 2
MO Tlalnepantla, EM $7,379 $200 $77.44 $1.97 3
SD Torreon, CU $7,300 $0 $74.59 $1.89 2
Soybeans MO Bojay (Tula), HG $8,134 $231 $85.47 $2.32 -5
NE Guadalajara, JA $8,692 $250 $91.37 $2.48 -1
IA El Castillo, JA $8,960 $0 $91.55 $2.49 0
KS Torreon, CU $7,489 $180 $78.36 $2.13 1
Sorghum NE Celaya, GJ $7,345 $226 $77.36 $1.96 4
KS Queretaro, QA $7,819 $122 $81.14 $2.06 3
NE Salinas Victoria, NL $6,452 $98 $66.92 $1.70 4
NE Torreon, CU $6,790 $172 $71.13 $1.80 41Rates are based upon published tariff rates for high-capacity shuttle trains. Shuttle trains are available for qualified
shipments of 75--110 cars that meet railroad efficiency requirements.2Fuel surcharge adjusted to reflect the change in Ferrocarril Mexicano, S.A. de C.V railroad fuel surcharge policy as of 10/01/2009
3Approximate load per car = 97.87 metric tons: Corn & Sorghum 56 lbs/bu, Wheat & Soybeans 60 lbs/bu
4Percentage change calculated using tariff rate plus fuel surchage
Sources: www.bnsf.com, www.uprr.com, www.kcsouthern.com
Fuel
surcharge
per car2
Tariff plus surcharge per:Origin
state
December, 2017
Figure 7
Railroad Fuel Surcharges, North American Weighted Average1
-$0.10
$0.00
$0.10
$0.20
$0.30
$0.40
$0.50
$0.60
$0.70
Do
llar
s p
er r
ailc
ar m
ile
3-Year Monthly Average
Fuel Surcharge* ($/mile/railcar)
December, 2017: $0.09, unchanged from last month's surcharge of $0.09/mile; up 7 cents from the December 2016
surcharge of $0.02/mile; and down 2 cents from the December prior 3-year average of $0.11/mile.
1 Weighted by each Class I railroad's proportion of grain traffic for the prior year. * Beginning January 2009, the Canadian Pacific fuel surcharge is computed by a monthly average of the bi -weekly fuel surcharge.**CSX strike price changed from $2.00/gal. to $3.75/gal. starting January 1, 2015.
Sources: www.bnsf.com, www.cn.ca, www.cpr.ca, www.csx.com, www.kcsi.com, www.nscorp.com, www.uprr.com
December 28, 2017
Grain Transportation Report 11
Barge Transportation
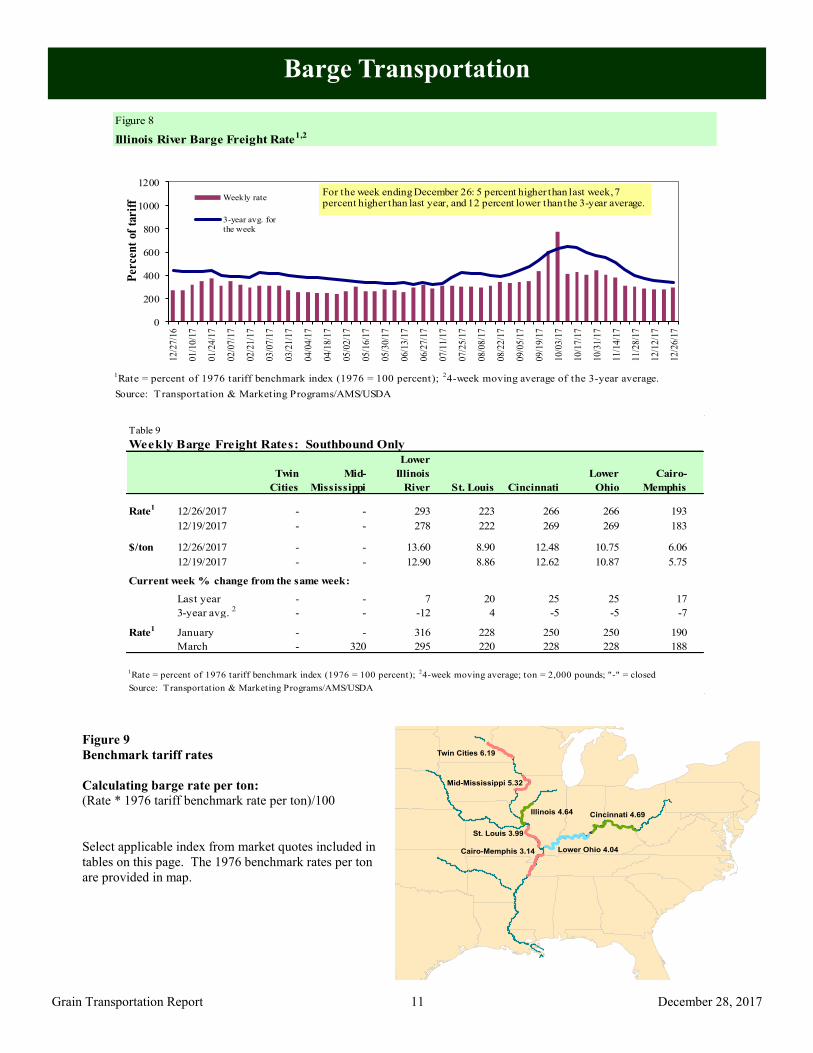
Figure 9
Benchmark tariff rates
Calculating barge rate per ton:
(Rate * 1976 tariff benchmark rate per ton)/100
Select applicable index from market quotes included in
tables on this page. The 1976 benchmark rates per ton
are provided in map.
Twin Cities 6.19
Mid-Mississippi 5.32
St. Louis 3.99
Cairo-Memphis 3.14
Illinois 4.64 Cincinnati 4.69
Lower Ohio 4.04
Figure 8
Illinois River Barge Freight Rate1,2
1Rate = percent of 1976 tariff benchmark index (1976 = 100 percent);
24-week moving average of the 3-year average.
Source: Transportation & Marketing Programs/AMS/USDA
0
200
400
600
800
1000
120012/2
7/1
6
01/1
0/1
7
01/2
4/1
7
02/0
7/1
7
02/2
1/1
7
03/0
7/1
7
03/2
1/1
7
04/0
4/1
7
04/1
8/1
7
05/0
2/1
7
05/1
6/1
7
05/3
0/1
7
06/1
3/1
7
06/2
7/1
7
07/1
1/1
7
07/2
5/1
7
08/0
8/1
7
08/2
2/1
7
09/0
5/1
7
09/1
9/1
7
10/0
3/1
7
10/1
7/1
7
10/3
1/1
7
11/1
4/1
7
11/2
8/1
7
12/1
2/1
7
12/2
6/1
7
Per
cen
t of
tar
iff Weekly rate
3-year avg. for
the week
For the week ending December 26: 5 percent higher than last week, 7 percent higher than last year, and 12 percent lower thanthe 3-year average.
Table 9
Weekly Barge Freight Rates: Southbound Only
Twin
Cities
Mid-
Mississippi
Lower
Illinois
River St. Louis Cincinnati
Lower
Ohio
Cairo-
Memphis
Rate1
12/26/2017 - - 293 223 266 266 193
12/19/2017 - - 278 222 269 269 183
$/ton 12/26/2017 - - 13.60 8.90 12.48 10.75 6.06
12/19/2017 - - 12.90 8.86 12.62 10.87 5.75
Current week % change from the same week:
Last year - - 7 20 25 25 17
3-year avg. 2
- - -12 4 -5 -5 -7-2 6 6
Rate1
January - - 316 228 250 250 190
March - 320 295 220 228 228 188
Source: Transportation & Marketing Programs/AMS/USDA
1Rate = percent of 1976 tariff benchmark index (1976 = 100 percent);
24-week moving average; ton = 2,000 pounds; "-" = closed

December 28, 2017
Grain Transportation Report 12
Figure 10
Barge Movements on the Mississippi River1 (Locks 27 - Granite City, IL)
1 The 3-year average is a 4-week moving average.
Source: U.S. Army Corps of Engineers
0
200
400
600
800
1,000
1,200
1,40007
/02/1
6
07
/16/1
6
07
/30/1
6
08
/13/1
6
08
/27/1
6
09
/10/1
6
09
/24/1
6
10
/08/1
6
10
/22/1
6
11
/05/1
6
11
/19/1
6
12
/03/1
6
12
/17/1
6
12
/31/1
6
01
/14/1
7
01
/28/1
7
02
/11/1
7
02
/25/1
7
03
/11/1
7
03
/25/1
7
04
/08/1
7
04
/22/1
7
05
/06/1
7
05
/20/1
7
06
/03/1
7
06
/17/1
7
07
/01/1
7
07
/15/1
7
07
/29/1
7
08
/12/1
7
08
/26/1
7
09
/09/1
7
09
/23/1
7
10
/07/1
7
10
/21/1
7
11
/04/1
7
11
/18/1
7
12
/02/1
7
12
/16/1
7
12
/30/1
7
01
/13/1
8
1,0
00
to
ns
Soybeans
Wheat
Corn
3-Year Average
For the week ending December 23: up 6 percent fromlast year and 36 percent lower than the 3-yravg.
Table 10
Barge Grain Movements (1,000 tons)
For the week ending 12/23/2017 Corn Wheat Soybeans Other Total
Mississippi River
Rock Island, IL (L15) 0 0 0 0 0
Winfield, MO (L25) 66 5 18 0 89
Alton, IL (L26) 269 6 97 0 372
Granite City, IL (L27) 254 6 102 0 362
Illinois River (L8) 207 3 63 0 274
Ohio River (L52) 49 22 156 5 232
Arkansas River (L1) 0 15 21 0 36
Weekly total - 2017 302 44 279 5 630
Weekly total - 2016 226 35 371 9 640
2017 YTD1
21,920 2,182 15,859 359 40,320
2016 YTD 23,721 1,998 16,341 344 42,405
2017 as % of 2016 YTD 92 109 97 104 95
Last 4 weeks as % of 20162
89 71 78 199 84
Total 2016 24,136 2,030 16,668 344 43,178
2 As a percent of same period in 2016.
Source: U.S. Army Corps of Engineers
Note: Total may not add exactly, due to rounding
1 Weekly total, YTD (year-to-date) and calendar year total includes Miss/27, Ohio/52, and Ark/1; "Other" refers to oats, barley,
sorghum, and rye.
December 28, 2017
Grain Transportation Report 13
Figure 11
Source: U.S. Army Corps of Engineers
Upbound Empty Barges Transiting Mississippi River Locks 27, Arkansas River
Lock and Dam 1, and Ohio River Locks and Dam 52
0
100
200
300
400
500
600
700
8002
/11
/17
2/1
8/1
7
2/2
5/1
7
3/4
/17
3/1
1/1
7
3/1
8/1
7
3/2
5/1
7
4/1
/17
4/8
/17
4/1
5/1
7
4/2
2/1
7
4/2
9/1
7
5/6
/17
5/1
3/1
7
5/2
0/1
7
5/2
7/1
7
6/3
/17
6/1
0/1
7
6/1
7/1
7
6/2
4/1
7
7/1
/17
7/8
/17
7/1
5/1
7
7/2
2/1
7
7/2
9/1
7
8/5
/17
8/1
2/1
7
8/1
9/1
7
8/2
6/1
7
9/2
/17
9/9
/17
9/1
6/1
7
9/2
3/1
7
9/3
0/1
7
10/
7/1
7
10/
14/
17
10/
21/
17
10/
28/
17
11/
4/1
7
11/
11/
17
11/
18/
17
11/
25/
17
12/
2/1
7
12/
9/1
7
12/
16/
17
12/
23/
17
Nu
mb
er o
f B
arg
es
Miss. Locks 27 Ark Lock 1 Ohio Locks 52
For the week ending December 23: 594 barges transited the locks, 165 barges lower than the previous week, and 11 percent lower than the 3-year avg.
Figure 12
Grain Barges for Export in New Orleans Region
Source: U.S. Army Corps of Engineers and GIPSA
0
200
400
600
800
1000
1200
9/3
/16
9/1
7/1
6
10
/1/1
6
10
/15
/16
10
/29
/16
11
/12
/16
11
/26
/16
12
/10
/16
12
/24
/16
1/7
/17
1/2
1/1
7
2/4
/17
2/1
8/1
7
3/4
/17
3/1
8/1
7
4/1
/17
4/1
5/1
7
4/2
9/1
7
5/1
3/1
7
5/2
7/1
7
6/1
0/1
7
6/2
4/1
7
7/8
/17
7/2
2/1
7
8/5
/17
8/1
9/1
7
9/2
/17
9/1
6/1
7
9/3
0/1
7
10/1
4/1
7
10/2
8/1
7
11
/11
/17
11
/25
/17
12
/9/1
7
12
/23
/17
Downbound Grain Barges Locks 27, 1, and 52
Grain Barges Unloaded in New Orleans
Nu
mb
er o
f b
arges
For the week ending December 23: 396 grain bargesmoved down river, 23 percent lower than last week, 728grain barges were unloaded in New Orleans, 21 percent
lower than the previous week.

December 28, 2017
Grain Transportation Report 14
The weekly diesel price provides a proxy for trends in U.S. truck rates as diesel fuel is a significant expense for truck grain move-
ments.
Truck Transportation
Table 11
Change from
Region Location Price Week ago Year ago
I East Coast 2.904 0.007 0.331
New England 2.943 0.019 0.332
Central Atlantic 3.068 0.008 0.381
Lower Atlantic 2.782 0.004 0.304
II Midwest2 2.854 0.001 0.365
III Gulf Coast3 2.708 0.011 0.287
IV Rocky Mountain 2.948 -0.010 0.432
V West Coast 3.312 -0.015 0.505
West Coast less California 3.026 -0.018 0.299
California 3.539 -0.013 0.668
Total U.S. 2.903 0.002 0.363
1Diesel fuel prices include all taxes. Prices represent an average of all types of diesel fuel.
2Same as North Central 3Same as South Central
Source: Energy Information Administration/U.S. Department of Energy (www.eia.doe.gov)
Retail on-Highway Diesel Prices, Week Ending 12/25/2017 (US $/gallon)
Figure 13
Weekly Diesel Fuel Prices, U.S. Average
Source: Retail On-Highway Diesel Prices, Energy Information Administration, Dept. of Energy
$2.54 $2.90
2
2.1
2.2
2.3
2.4
2.5
2.6
2.7
2.8
2.9
3
6/26
/201
7
7/3/
2017
7/10
/201
7
7/17
/201
7
7/24
/201
7
7/31
/201
7
8/7/
2017
8/14
/201
7
8/21
/201
7
8/28
/201
7
9/4/
2017
9/11
/201
7
9/18
/201
7
9/25
/201
7
10/2
/201
7
10/9
/201
7
10/1
6/20
17
10/2
3/20
17
10/3
0/20
17
11/6
/201
7
11/1
3/20
17
11/2
0/20
17
11/2
7/20
17
12/4
/201
7
12/1
1/20
17
12/1
8/20
17
12/2
5/20
17
$ pe
r ga
llon
Last Year Current YearFor the week ending December 25, fuel prices increased 0.2 cents
from the previous week at $2.90 per gallon, 36 cents above the
same week last year.

December 28, 2017
Grain Transportation Report 15
Grain Exports
Table 12
U.S. Export Balances and Cumulative Exports (1,000 metric tons)
Wheat Corn Soybeans Total
For the week ending HRW SRW HRS SWW DUR All wheat
Export Balances1
12/14/2017 2,252 727 1,636 1,287 58 5,959 15,845 13,696 35,499
This week year ago 1,994 644 2,435 1,094 149 6,316 19,634 17,289 43,239
Cumulative exports-marketing year 2
2017/18 YTD 5,249 1,136 3,372 2,942 214 12,913 9,479 25,841 48,233
2016/17 YTD 6,153 1,132 4,084 2,284 230 13,882 14,711 29,622 58,215
YTD 2017/18 as % of 2016/17 85 100 83 129 93 93 64 87 83
Last 4 wks as % of same period 2016/17 104 91 68 118 39 90 77 78 79
2016/17 Total 11,096 2,285 7,923 4,254 484 26,042 41,864 51,156 119,062
2015/16 Total 5,538 3,057 6,285 3,551 670 19,101 45,564 49,821 114,4861 Current unshipped (outstanding) export sales to date
2 Shipped export sales to date; new marketing year now in effect for wheat, corn, and soybeans
Note: YTD = year-to-date. Marketing Year: wheat = 6/01-5/31, corn & soybeans = 9/01-8/31
Source: Foreign Agricultural Service/USDA (www.fas.usda.gov)
Table 13
Top 5 Importers 1 of U.S. Corn
For the week ending 12/14/2017 % change Exports3
2017/18 2016/17 current MY 3-year avg
Current MY Last MY from last MY 2014-2016 - 1,000 mt -
Mexico 9,329 9,465 (1) 12,297
Japan 4,103 4,883 (16) 11,450
Korea 1,091 3,029 (64) 4,494
Colombia 1,842 2,132 (14) 4,179
Peru 1,485 1,467 1 2,693
Top 5 Importers 17,849 20,975 (15) 35,113
Total US corn export sales 25,324 34,345 (26) 49,308
% of Projected 52% 59%
Change from prior week2
1,558 1,251
Top 5 importers' share of U.S. corn
export sales 70% 61% 71%
USDA forecast, December 2017 48,982 58,346 (16)
Corn Use for Ethanol USDA
forecast, December 2017 140,335 138,151 2
1Based on FAS Marketing Year Ranking Reports for 2015/16 - www.fas.usda.gov; Marketing year (MY) = Sep 1 - Aug 31.
3FAS Marketing Year Ranking Reports - http://apps.fas.usda.gov/export-sales/myrkaug.htm; 3-yr average
2Cumulative Exports (shipped) + Outstanding Sales (unshipped), FAS Weekly Export Sales Report, or Export Sales
Query--http://www.fas.usda.gov/esrquery/. Total commitments change (net sales) from prior week could include
revisions from previous week's outstanding sales or accumulated sales.
December 28, 2017
Grain Transportation Report 16
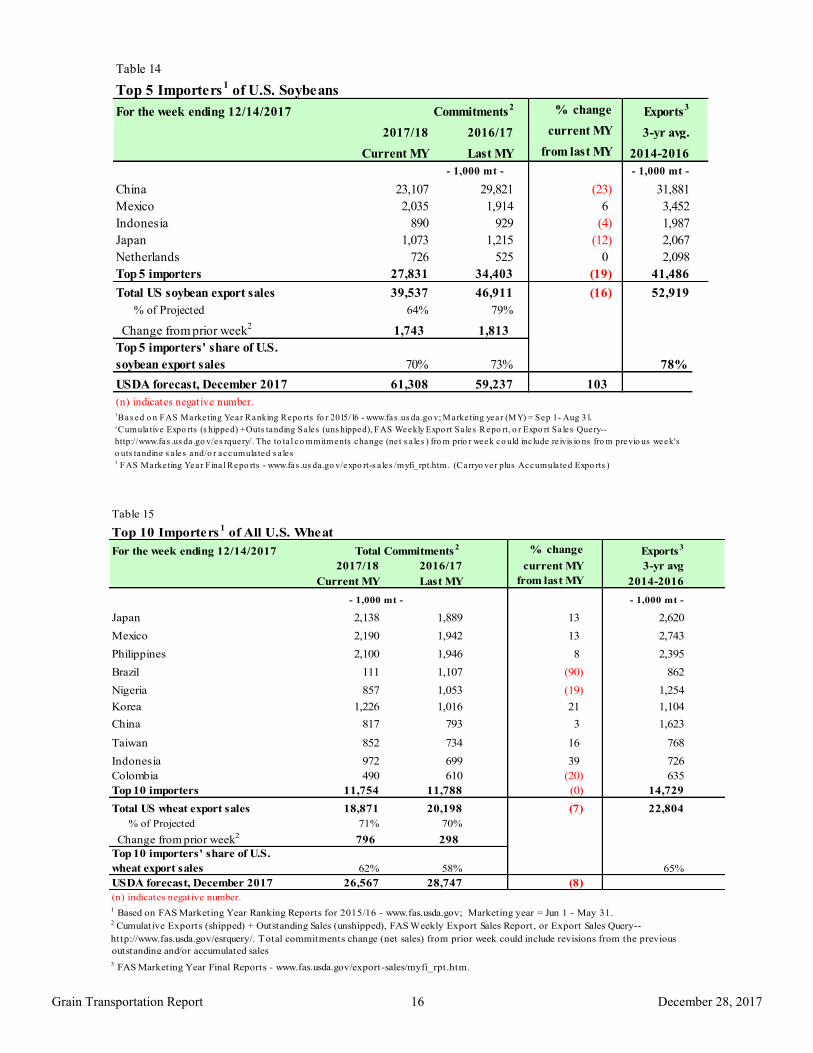
Table 14
Top 5 Importers1 of U.S. Soybeans
For the week ending 12/14/2017 % change
Exports3
2017/18 2016/17 current MY 3-yr avg.
Current MY Last MY from last MY 2014-2016
- 1,000 mt - - 1,000 mt -
China 23,107 29,821 (23) 31,881
Mexico 2,035 1,914 6 3,452
Indonesia 890 929 (4) 1,987
Japan 1,073 1,215 (12) 2,067
Netherlands 726 525 0 2,098
Top 5 importers 27,831 34,403 (19) 41,486
Total US soybean export sales 39,537 46,911 (16) 52,919
% of Projected 64% 79%
Change from prior week2
1,743 1,813
Top 5 importers' share of U.S.
soybean export sales 70% 73% 78%
USDA forecast, December 2017 61,308 59,237 103
1Bas ed o n FAS Marketing Year Ranking Repo rts fo r 2015/16 - www.fas .us da .go v; Marketing year (MY) = Sep 1 - Aug 31.
Total
Commitments2
3 FAS Marketing Year Fina l Repo rts - www.fas .us da .go v/expo rt-s a les /myfi_rpt.htm. (Carryo ver plus Accumula ted Expo rts )
(n) indicates negative number.
2Cumula tive Expo rts (s hipped) + Outs tanding Sales (uns hipped), FAS Weekly Expo rt Sa les Repo rt, o r Expo rt Sa les Query--
http://www.fas .us da .go v/es rquery/. The to ta l co mmitments change (ne t s a les ) fro m prio r week co uld inc lude re ivis io ns fro m previo us week's
o uts tanding s a les and/o r accumula ted s a les
Table 15
Top 10 Importers1 of All U.S. Wheat
For the week ending 12/14/2017 % change Exports3
2017/18 2016/17 current MY 3-yr avg
Current MY Last MY from last MY 2014-2016
- 1,000 mt -
Japan 2,138 1,889 13 2,620
Mexico 2,190 1,942 13 2,743
Philippines 2,100 1,946 8 2,395
Brazil 111 1,107 (90) 862
Nigeria 857 1,053 (19) 1,254
Korea 1,226 1,016 21 1,104
China 817 793 3 1,623
Taiwan 852 734 16 768
Indonesia 972 699 39 726
Colombia 490 610 (20) 635
Top 10 importers 11,754 11,788 (0) 14,729
Total US wheat export sales 18,871 20,198 (7) 22,804
% of Projected 71% 70%
Change from prior week2
796 298
Top 10 importers' share of U.S.
wheat export sales 62% 58% 65%
USDA forecast, December 2017 26,567 28,747 (8)
1 Based on FAS Marketing Year Ranking Reports for 2015/16 - www.fas.usda.gov; Marketing year = Jun 1 - May 31.
outstanding and/or accumulated sales
Total Commitments2
3 FAS Marketing Year Final Reports - www.fas.usda.gov/export-sales/myfi_rpt.htm.
(n) indicates negative number.
2 Cumulative Exports (shipped) + Outstanding Sales (unshipped), FAS Weekly Export Sales Report, or Export Sales Query--
http://www.fas.usda.gov/esrquery/. Total commitments change (net sales) from prior week could include revisions from the previous
- 1,000 mt -

December 28, 2017
Grain Transportation Report 17
The United States exports approximately one-quarter of the grain it produces. On average, this includes nearly 45 percent of U.S.-grown
wheat, 35 percent of U.S.-grown soybeans, and 20 percent of the U.S.-grown corn. Approximately 58 percent of the U.S. export grain ship-
ments departed through the U.S. Gulf region in 2016.
Table 16
Grain Inspections for Export by U.S. Port Region (1,000 metric tons)
For the Week Ending Previous Current Week 2017 YTD as
12/21/17 Week1
as % of Previous 2016 YTD* % of 2016 YTD Last Year Prior 3-yr. avg.
Pacific Northwest
Wheat 283 448 63 14,615 12,101 121 127 152 12,325
Corn 200 105 191 10,680 11,819 90 51 110 12,009
Soybeans 341 419 82 13,046 14,078 93 87 93 14,447
Total 824 972 85 38,340 37,998 101 89 110 38,782
Mississippi Gulf
Wheat 49 45 110 4,171 3,467 120 64 80 3,480
Corn 268 327 82 28,351 31,078 91 64 74 31,420
Soybeans 763 1,173 65 32,043 34,176 94 85 82 35,278
Total 1,080 1,545 70 64,566 68,722 94 77 80 70,178
Texas Gulf
Wheat 142 85 168 6,285 5,878 107 56 78 6,019
Corn 0 0 n/a 733 1,669 44 31 47 1,669
Soybeans 0 73 0 292 1,105 26 51 52 1,105
Total 142 158 90 7,310 8,652 84 52 68 8,792
Interior
Wheat 20 35 57 1,696 1,503 113 156 142 1,543
Corn 131 191 68 8,663 7,106 122 118 135 7,197
Soybeans 111 95 116 5,414 4,508 120 122 123 4,577
Total 261 322 81 15,772 13,118 120 123 131 13,317
Great Lakes
Wheat 25 45 57 711 1,186 60 55 76 1,186
Corn 0 3 0 192 584 33 5 13 584
Soybeans 43 0 n/a 890 910 98 57 48 910
Total 68 48 143 1,793 2,681 67 49 57 2,681
Atlantic
Wheat 0 0 n/a 46 315 15 1 2 315
Corn 0 0 n/a 32 294 11 n/a 643 294
Soybeans 92 127 73 1,959 2,201 89 85 87 2,269
Total 92 127 73 2,038 2,809 73 81 84 2,878
U.S. total from ports1
Wheat 520 658 79 27,524 24,451 113 93 117 24,867
Corn 599 626 96 48,651 52,551 93 67 87 53,173
Soybeans 1,350 1,887 72 53,643 56,978 94 86 86 58,587
Total 2,469 3,170 78 129,819 133,979 97 82 91 136,6271 Data includes revisions from prior weeks; some regional totals may not add exactly due to rounding.
Source: Grain Inspection, Packers and Stockyards Administration/USDA (www.gipsa.usda.gov); YTD= year-to-date; n/a = not applicable
Last 4-weeks as % of:
Port Regions 2016 Total*2017 YTD*
December 28, 2017
Grain Transportation Report 18
Figure 14
U.S. grain inspected for export (wheat, corn, and soybeans)
Source: Grain Inspection, Packers and Stockyards Administration/USDA (www.gipsa.usda.gov)
Note: 3-year average consists of 4-week running average
0
20
40
60
80
100
120
140
160
180
200
5/2
6/2
016
6/2
3/2
016
7/2
1/2
016
8/1
8/2
016
9/1
5/2
016
10/1
3/2
016
11/1
0/2
016
12
/8/2
016
1/5
/201
7
2/2
/201
7
3/2
/201
7
3/3
0/2
017
4/2
7/2
017
5/2
5/2
017
6/2
2/2
017
7/2
0/2
017
8/1
7/2
017
9/1
4/2
017
10/1
2/2
017
11
/9/2
017
12
/7/2
017
1/4
/201
8
2/1
/201
8
3/1
/201
8
3/2
9/2
018
4/2
6/2
018
Mil
lion
bu
shels
(m
bu
)
Current week 3-year average
For the week ending Dec. 21: 92.3 mbu, down 22 percent from the previous week, down 25 percent from same week last year, and down 18 percent from the 3-year average.
Figure 15
U.S. Grain Inspections: U.S. Gulf and PNW1 (wheat, corn, and soybeans)
-
10
20
30
40
50
60
70
80
90
100
5/5
/16
6/5
/16
7/5
/16
8/5
/16
9/5
/16
10/5
/16
11/5
/16
12/5
/16
1/5
/17
2/5
/17
3/5
/17
4/5
/17
5/5
/17
6/5
/17
7/5
/17
8/5
/17
9/5
/17
10/5
/17
11/5
/17
12/5
/17
1/5
/18
2/5
/18
3/5
/18
4/5
/18
Mil
lion
bu
shels
(m
bu
)
Miss. Gulf 3-Year avg - Miss. Gulf
PNW 3-Year avg - PNW
Texas Gulf 3-Year avg - TX Gulf
Source: Grain Inspection, Packers and Stockyards Administration/USDA (www.gipsa.usda.gov)
Last Week:
Last Year (same week):
3-yr avg. (4-wk. mov. Avg):
MS Gulf TX Gulf U.S. Gulf PNW
down 30
down 39
down 34
down 10
down 26
down 2
down 28
down 37
down 32
down 14
down 4
up 3
Percent change from:Week ending 12/21/17 inspections (mbu):
Mississippi Gulf:
PNW:
Texas Gulf:
40.4
30.8
5.2

December 28, 2017
Grain Transportation Report 19
Ocean Transportation
Figure 16
U.S. Gulf Vessel Loading Activity
0
10
20
30
40
50
60
70
08
/03
/20
17
08
/10
/20
17
08
/17
/20
17
08
/24
/20
17
08/3
1/2
017
09/0
7/2
017
09/1
4/2
017
09/2
1/2
017
09/2
8/2
017
10/0
5/2
017
10/1
2/2
017
10/1
9/2
017
10/2
6/2
017
11/0
2/2
017
11/0
9/2
017
11/1
6/2
017
11/2
3/2
017
11/3
0/2
017
12/0
7/2
017
12/1
4/2
017
12
/21
/20
17
Nu
mb
er
of
ve
ssel
s
Loaded Last 7 Days Due Next 10 days Loaded 4 Year Average
Source:Transportation & Marketing Programs/AMS/USDA1U.S. Gulf includes Mississippi, Texas, and East Gulf.
For the week ending December 21 Loaded Due Change from last year -34.0% -23.4%
Change from 4-year avg. -25.7% -16.2%
Table 17
Weekly Port Region Grain Ocean Vessel Activity (number of vessels)
Pacific
Gulf Northwest
Loaded Due next
Date In port 7-days 10-days In port
12/21/2017 52 31 49 12
12/14/2017 34 39 54 15
2016 range (21..62) (27..55) (40..87) (6..27)
2016 avg. 43 40 62 15
Source: Transportation & Marketing Programs/AMS/USDA

December 28, 2017
Grain Transportation Report 20
Figure 17
Grain Vessel Rates, U.S. to Japan
Data Source: O'Neil Commodity Consulting
0
5
10
15
20
25
30
35
40
45
50
Nov
. 15
Jan.
16
Mar
. 16
May
16
July
16
Sept
. 16
Nov
. 16
Jan.
17
Mar
. 17
May
17
July
17
Sept
. 17
Nov
. 17
US
$/m
etri
c to
n
Spread Gulf vs. PNW to Japan Rate Gulf to Japan Rate PNW to Japan
Gulf PNW Spread Ocean rates for November '17 $43.13 $24.44 $18.69 Change from November '16 28.0% 30.8% 24.6%
Change from 4-year avg. 6.2% 10.3% 1.3%
Table 18
Ocean Freight Rates For Selected Shipments, Week Ending 12/23/2017
Export Import Grain Loading Volume loads Freight rate
region region types date (metric tons) (US$/metric ton)
U.S. Gulf China Heavy Grain Jan 1/10 60,000 45.50
U.S. Gulf China Heavy Grain Dec 15/20 60,000 44.00
U.S. Gulf China Heavy Grain Dec 10/20 60,000 43.25
U.S. Gulf China Heavy Grain Nov 27/Dec 5 47,700 40.50
U.S. Gulf China Heavy Grain Nov 20/30 66,000 41.25
U.S. Gulf China Heavy Grain Nov 20/30 66,000 42.00
U.S. Gulf China Heavy Grain Nov 15/25 65,000 43.85
U.S. Gulf China Heavy Grain Nov 10/20 66,000 43.75
U.S. Gulf China Heavy Grain Nov 10/15 66,000 40.25
U.S. Gulf China Heavy Grain Nov 1/10 66,000 42.00
U.S. Gulf China Heavy Grain Nov 1/10 66,000 41.75
U.S. Gulf China Heavy Grain Nov 1/10 66,000 41.25
U.S. Gulf China Heavy Grain Nov 1/10 66,000 42.00
U.S. Gulf China Heavy Grain Nov 1/10 66,000 41.50
U.S. Gulf Dakar Wheat Nov 20/30 7,500 73.89*
U.S. Gulf Somali Sorghum Dec 1/10 10,640 192.10*
PNW China Heavy Grain Dec 23/30 60,000 22.25
PNW China Heavy Grain Dec 15/24 60,000 23.75
PNW South Korea Heavy Grain Dec 14/20 60,000 24.00
Brazil China Heavy Grain Dec 1/10 60,000 31.90
Brazil China Heavy Grain Nov 20/30 60,000 33.75
Brazil China Heavy Grain Nov 1/10 60,000 31.90
Brazil China Heavy Grain Oct 25/Nov 10 60,000 32.50
Brazil S. Korea Heavy Grain Nov 22/29 63,000 33.25
Rates shown are per metric ton (2,204.62 lbs. = 1 metric ton), F.O.B., except where otherwise indicated; op = option *50 percent of food aid from the United States is required to be shipped on U.S.-flag vessels.
Source: Maritime Research Inc. (www.maritime-research.com)
December 28, 2017
Grain Transportation Report 21
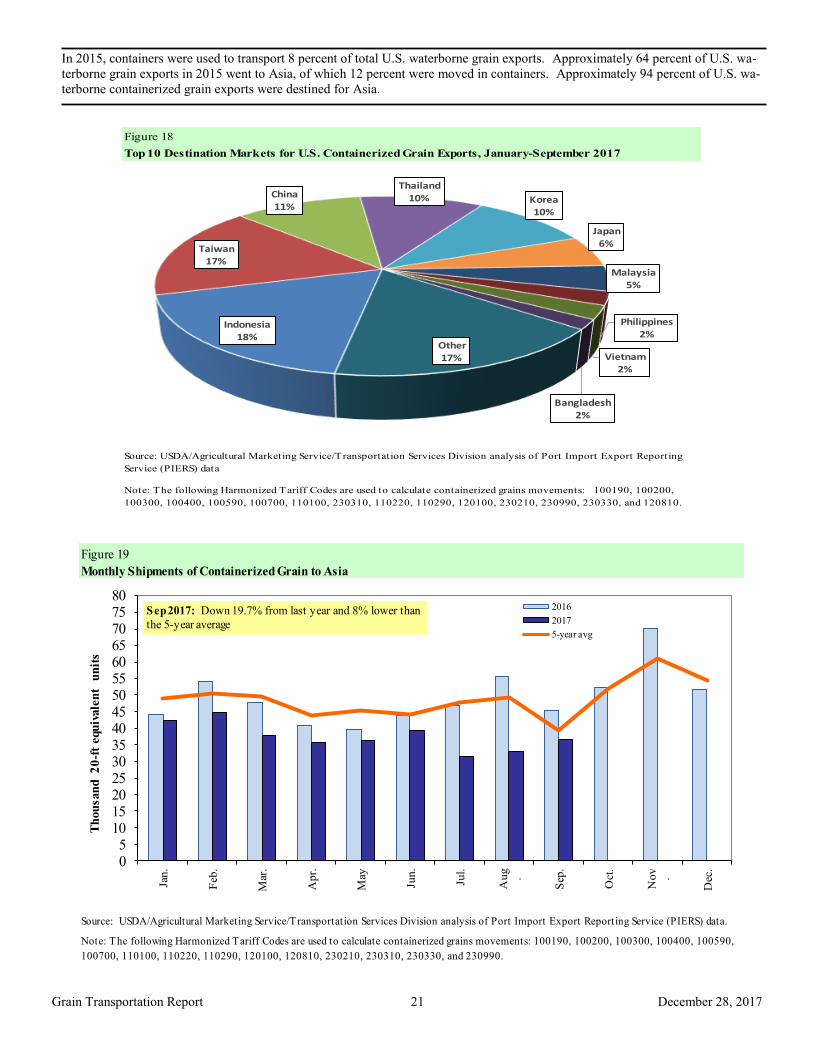
In 2015, containers were used to transport 8 percent of total U.S. waterborne grain exports. Approximately 64 percent of U.S. wa-
terborne grain exports in 2015 went to Asia, of which 12 percent were moved in containers. Approximately 94 percent of U.S. wa-
terborne containerized grain exports were destined for Asia.
Figure 18
Top 10 Destination Markets for U.S. Containerized Grain Exports, January-September 2017
Source: USDA/Agricultural Marketing Service/Transportation Services Division analysis of Port Import Export Reporting
Service (PIERS) data
Note: The following Harmonized Tariff Codes are used to calculate containerized grains movements: 100190, 100200,
100300, 100400, 100590, 100700, 110100, 230310, 110220, 110290, 120100, 230210, 230990, 230330, and 120810.
Indonesia18%
Taiwan17%
China11%
Thailand10% Korea
10%
Japan
6%
Malaysia5%
Philippines2%
Vietnam2%
Bangladesh2%
Other17%
Figure 19
Monthly Shipments of Containerized Grain to Asia
Source: USDA/Agricultural Marketing Service/Transportation Services Division analysis of Port Import Export Reporting Service (PIERS) data.
Note: The following Harmonized Tariff Codes are used to calculate containerized grains movements: 100190, 100200, 100300, 100400, 100590,
100700, 110100, 110220, 110290, 120100, 120810, 230210, 230310, 230330, and 230990.
05
101520253035404550556065707580
Jan.
Feb
.
Mar
.
Ap
r.
May
Jun
.
Jul.
Au
g
.
Sep
.
Oct
.
Nov
.
Dec
.
Th
ou
san
d
20
-ft
equ
ivale
nt
un
its
2016
2017
5-year avg
Sep 2017: Down 19.7% from last year and 8% lower than
the 5-year average

December 28, 2017
Grain Transportation Report 22
Coordinators
Surajudeen (Deen) Olowolayemo [email protected] (202) 720 - 0119
Pierre Bahizi [email protected] (202) 690 - 0992
Adam Sparger [email protected] (202) 205 - 8701
Weekly Highlight Editors
Surajudeen (Deen) Olowolayemo [email protected] (202) 720 - 0119
April Taylor [email protected] (202) 720 - 7880
Nicholas Marathon [email protected] (202) 690 - 4430
Grain Transportation Indicators
Surajudeen (Deen) Olowolayemo [email protected] (202) 720 - 0119
Rail Transportation
Adam Sparger [email protected] (202) 205 - 8701
Johnny Hill [email protected] (202) 690 - 3295
Jesse Gastelle [email protected] (202) 690 - 1144
Peter Caffarelli [email protected] (202) 690 - 3244
Barge Transportation
Nicholas Marathon [email protected] (202) 690 - 4430
April Taylor [email protected] (202) 720 - 7880
Matt Chang [email protected] (202) 720 - 0299
Truck Transportation
April Taylor [email protected] (202) 720 - 7880
Sergio Sotelo [email protected] (202) 756 - 2577
Grain Exports
Johnny Hill [email protected] (202) 690 - 3295
Ocean Transportation
Surajudeen (Deen) Olowolayemo [email protected] (202) 720 - 0119
(Freight rates and vessels)
April Taylor [email protected] (202) 720 - 7880
(Container movements)
Subscription Information: Send relevant information to [email protected] for an electronic
copy (printed copies are also available upon request).
Preferred citation: U.S. Dept. of Agriculture, Agricultural Marketing Service. Grain Transportation Report.
December 28, 2017. Web: http://dx.doi.org/10.9752/TS056.12-28-2017
Contacts and Links
In accordance with Federal civil rights law and U.S. Department of Agriculture (USDA) civil rights regulations and policies, the USDA, its
Agencies, offices, and employees, and institutions participating in or administering USDA programs are prohibited from discriminating based on
race, color, national origin, religion, sex, gender identity (including gender expression), sexual orientation, disability, age, marital status, family/
parental status, income derived from a public assistance program, political beliefs, or reprisal or retaliation for prior civil rights activity, in any
program or activity conducted or funded by USDA (not all bases apply to all programs). Remedies and complaint filing deadlines vary by pro-
gram or incident.
Persons with disabilities who require alternative means of communication for program information (e.g., Braille, large print, audiotape, American
Sign Language, etc.) should contact the responsible Agency or USDA's TARGET Center at (202) 720-2600 (voice and TTY) or contact USDA
through the Federal Relay Service at (800) 877-8339. Additionally, program information may be made available in languages other than English.
To file a program discrimination complaint, complete the USDA Program Discrimination Complaint Form, AD-3027, found online at How to
File a Program Discrimination Complaint and at any USDA office or write a letter addressed to USDA and provide in the letter all of the infor-
mation requested in the form. To request a copy of the complaint form, call (866) 632-9992. Submit your completed form or letter to USDA by:
(1) mail: U.S. Department of Agriculture, Office of the Assistant Secretary for Civil Rights, 1400 Independence Avenue, SW, Washington, D.C.
20250-9410; (2) fax: (202) 690-7442; or (3) email: [email protected].