for the six months ended 30 june 2017 - santam the santam business portfolio 4 market context 8...
TRANSCRIPT
REVIEWED INTERIM REPORT
FOR THE SIX MONTHSENDED 30 JUNE 2017

4 The Santam business portfolio
4 Market context
8 Financial results
46 Capital management
50 Group strategy and priorities
55 Reviewed interim report for Santam Ltd and its subsidiaries for the
six months ended 30 June 2017
TABLE OF CONTENTS
P R E S E N T A T I O N T O A N A L Y S T S S A N T A M L T D A N D I T S S U B S I D I A R I E SReviewed interim report for the six months ended 30 June 2017

2
The Santam business portfolio
Market context
Financial results
Capital management
Group strategy and priorities
CONTENTS
CLICK TO EDIT MASTER
CLICK TO EDIT MASTER TITLE STYLE
PRESENTED BY LIZÉ LAMBRECHTS AND HENNIE NELFINANCIAL RESULTS FOR THE SIX MONTHS ENDED 30 JUNE 2017

3
4
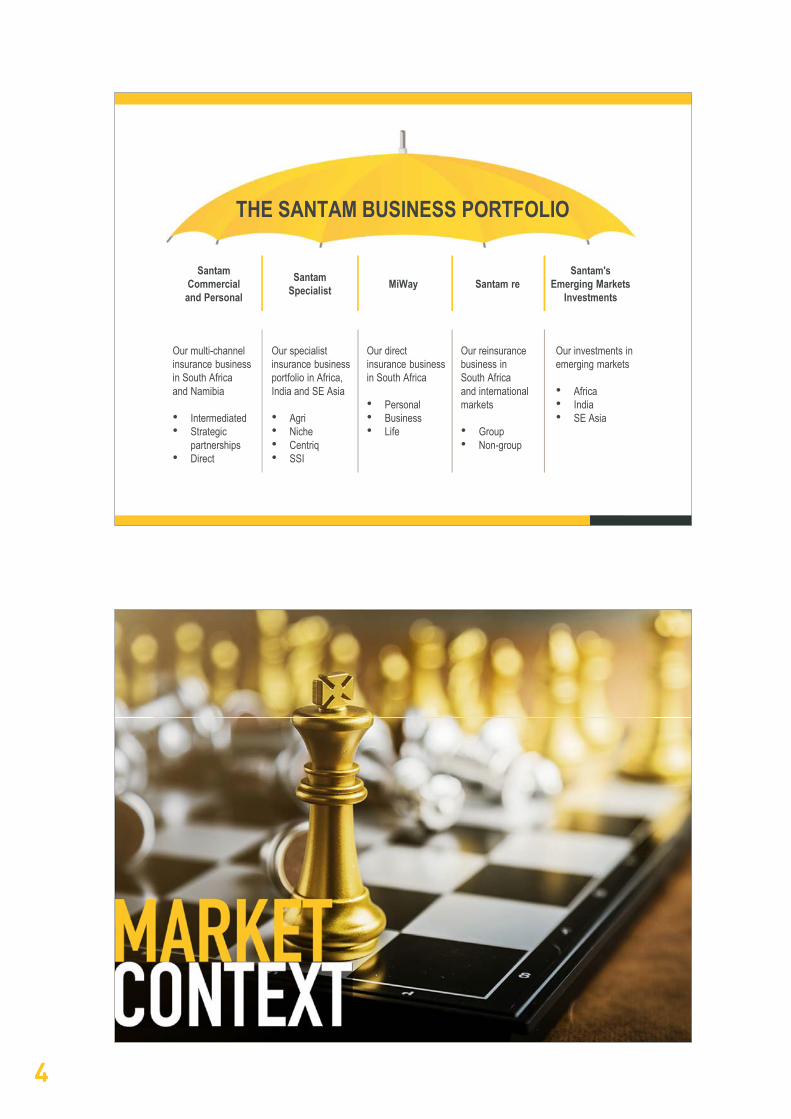
Santam Commercial
and Personal
Santam Specialist MiWay
Santam Re
Our multi-channel insurance business in South Africa and Namibia
• Intermediated• Strategic
partnerships• Direct
Our specialist insurance business portfolio in Africa, India and SE Asia
• Agri• Niche• Centriq• SSI
Our direct insurance business in South Africa
• Personal • Business• Life
Our reinsurance business in South Africa and internationalmarkets
• Group• Non-group
Our investments in emerging markets
• Africa• India• SE Asia
Santam's Emerging Markets
InvestmentsSantam re
THE SANTAM BUSINESS PORTFOLIO

5
6
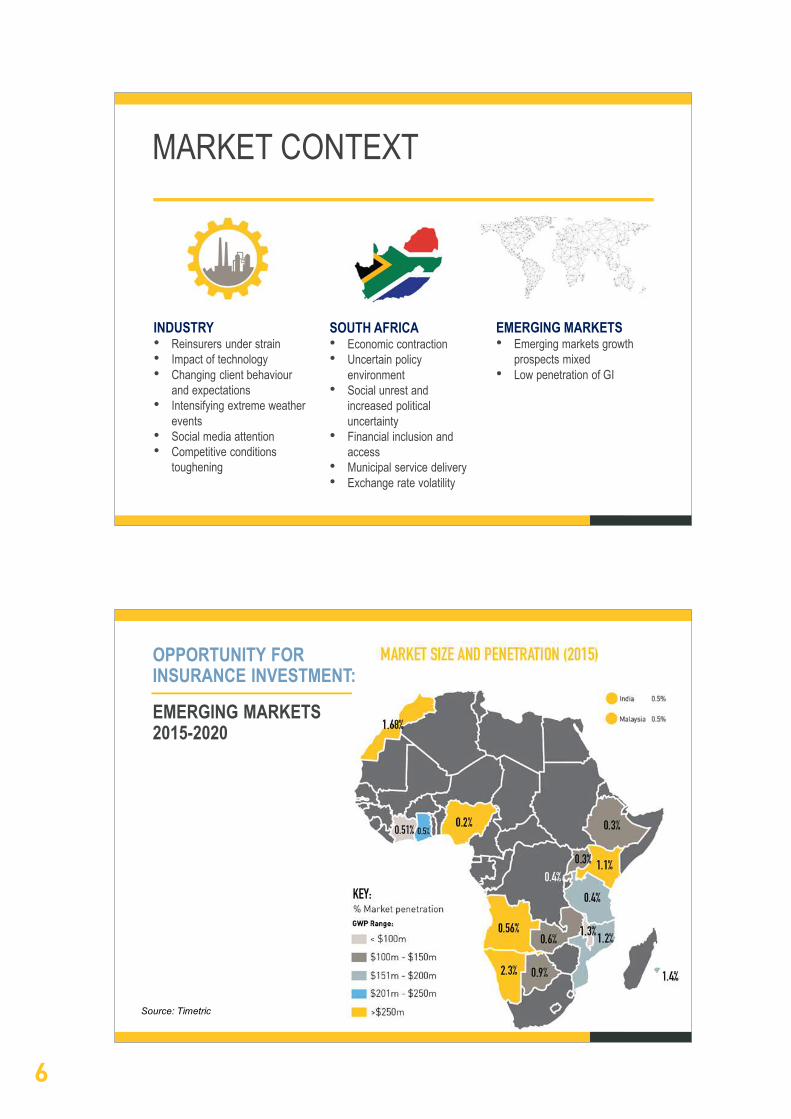
Source: Timetric
OPPORTUNITY FOR INSURANCE INVESTMENT:
EMERGING MARKETS2015-2020
INDUSTRY• Reinsurers under strain• Impact of technology • Changing client behaviour
and expectations• Intensifying extreme weather
events• Social media attention• Competitive conditions
toughening
EMERGING MARKETS• Emerging markets growth
prospects mixed• Low penetration of GI
SOUTH AFRICA• Economic contraction• Uncertain policy
environment• Social unrest and
increased political uncertainty
• Financial inclusion and access
• Municipal service delivery• Exchange rate volatility
MARKET CONTEXT

7
8
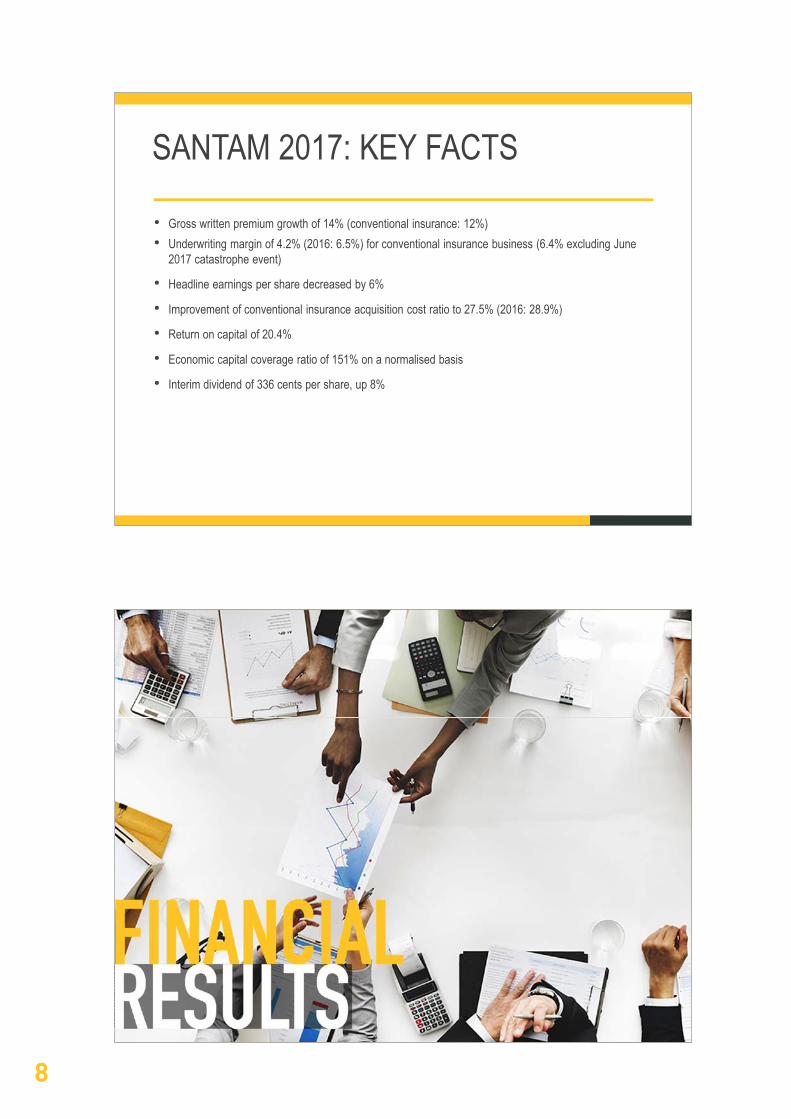
SANTAM 2017: KEY FACTS
• Gross written premium growth of 14% (conventional insurance: 12%)• Underwriting margin of 4.2% (2016: 6.5%) for conventional insurance business (6.4% excluding June
2017 catastrophe event)
• Headline earnings per share decreased by 6%
• Improvement of conventional insurance acquisition cost ratio to 27.5% (2016: 28.9%)
• Return on capital of 20.4%
• Economic capital coverage ratio of 151% on a normalised basis
• Interim dividend of 336 cents per share, up 8%

9
10
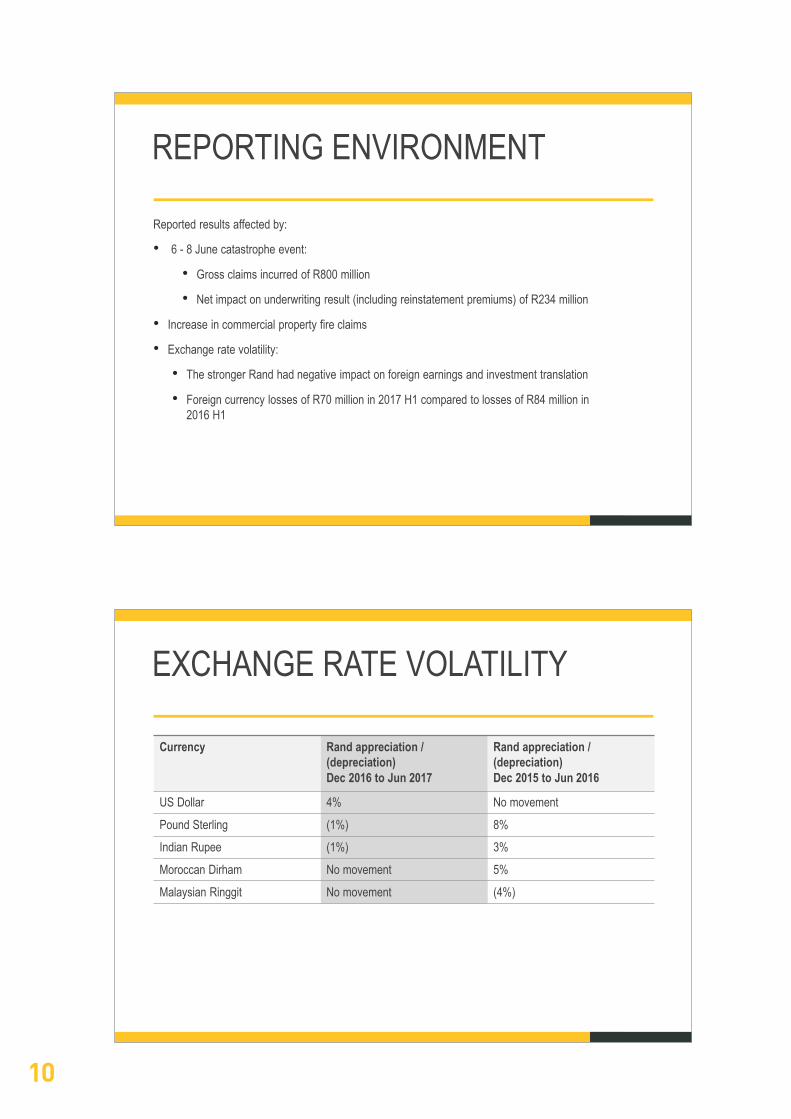
EXCHANGE RATE VOLATILITY
Currency Rand appreciation /(depreciation)Dec 2016 to Jun 2017
Rand appreciation / (depreciation) Dec 2015 to Jun 2016
US Dollar 4% No movement
Pound Sterling (1%) 8%
Indian Rupee (1%) 3%
Moroccan Dirham No movement 5%
Malaysian Ringgit No movement (4%)
REPORTING ENVIRONMENT
Reported results affected by:
• 6 - 8 June catastrophe event:
• Gross claims incurred of R800 million
• Net impact on underwriting result (including reinstatement premiums) of R234 million
• Increase in commercial property fire claims
• Exchange rate volatility:
• The stronger Rand had negative impact on foreign earnings and investment translation
• Foreign currency losses of R70 million in 2017 H1 compared to losses of R84 million in 2016 H1

11
12
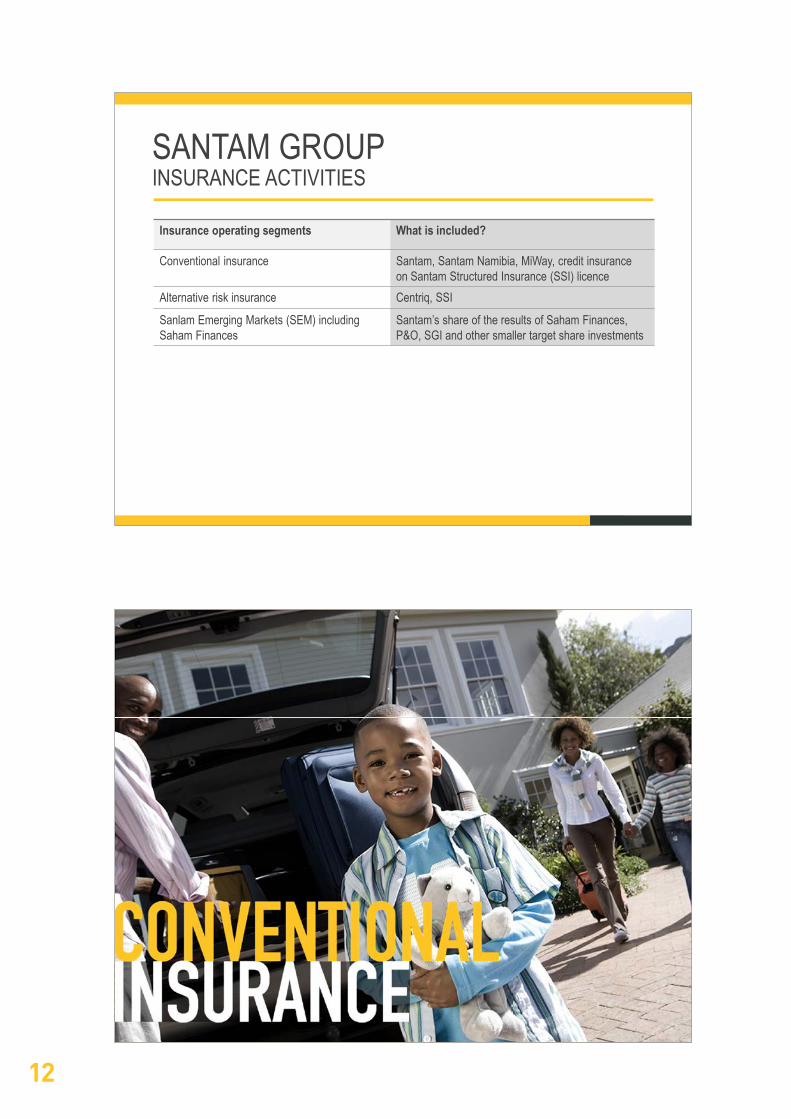
SANTAM GROUPINSURANCE ACTIVITIES
Insurance operating segments What is included?
Conventional insurance Santam, Santam Namibia, MiWay, credit insurance on Santam Structured Insurance (SSI) licence
Alternative risk insurance Centriq, SSI
Sanlam Emerging Markets (SEM) including Saham Finances
Santam’s share of the results of Saham Finances, P&O, SGI and other smaller target share investments

13
14
Jun 2017 R'm
% of NEP
Jun 2016 R'm
% of NEP
2017/2016
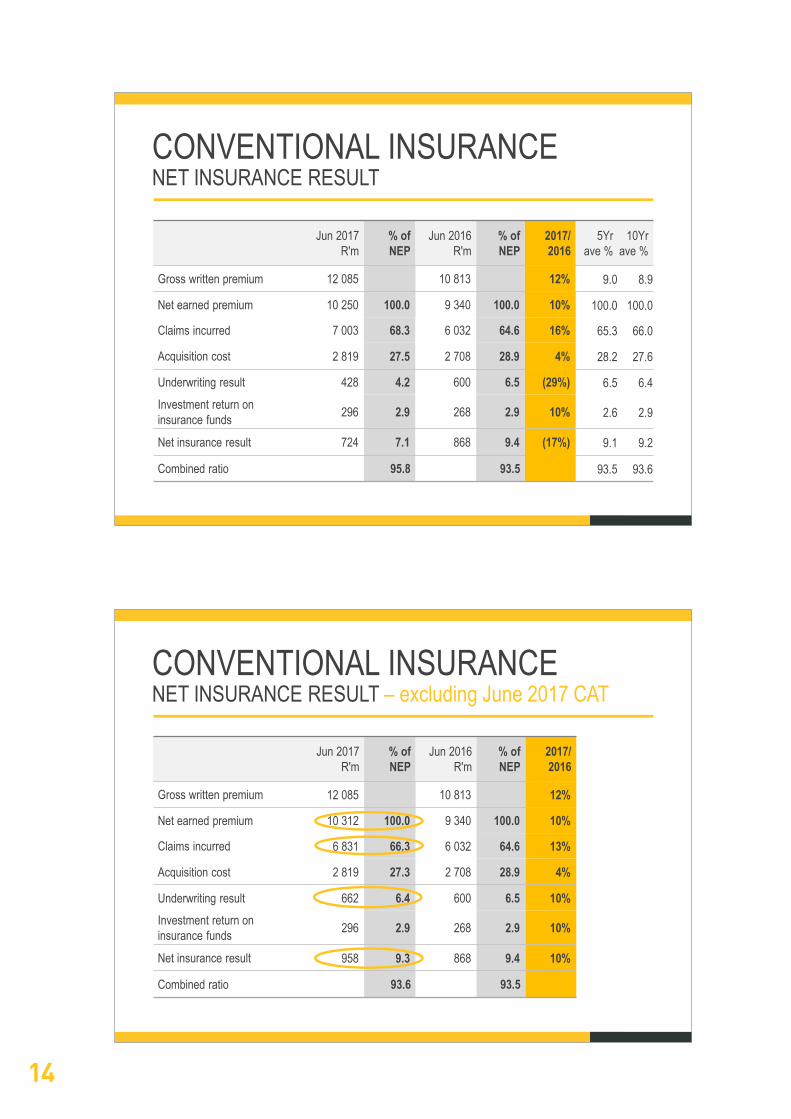
Gross written premium 12 085 10 813 12%
Net earned premium 10 312 100.0 9 340 100.0 10%
Claims incurred 6 831 66.3 6 032 64.6 13%
Acquisition cost 2 819 27.3 2 708 28.9 4%
Underwriting result 662 6.4 600 6.5 10%Investment return on insurance funds 296 2.9 268 2.9 10%
Net insurance result 958 9.3 868 9.4 10%
Combined ratio 93.6 93.5
CONVENTIONAL INSURANCE NET INSURANCE RESULT – excluding June 2017 CAT
Jun 2017 R'm
% of NEP
Jun 2016 R'm
% of NEP
2017/2016
5Yr ave %
10Yr ave %
Gross written premium 12 085 10 813 12% 9.0 8.9
Net earned premium 10 250 100.0 9 340 100.0 10% 100.0 100.0
Claims incurred 7 003 68.3 6 032 64.6 16% 65.3 66.0
Acquisition cost 2 819 27.5 2 708 28.9 4% 28.2 27.6
Underwriting result 428 4.2 600 6.5 (29%) 6.5 6.4Investment return on insurance funds 296 2.9 268 2.9 10% 2.6 2.9
Net insurance result 724 7.1 868 9.4 (17%) 9.1 9.2
Combined ratio 95.8 93.5 93.5 93.6
CONVENTIONAL INSURANCE NET INSURANCE RESULT

15
16
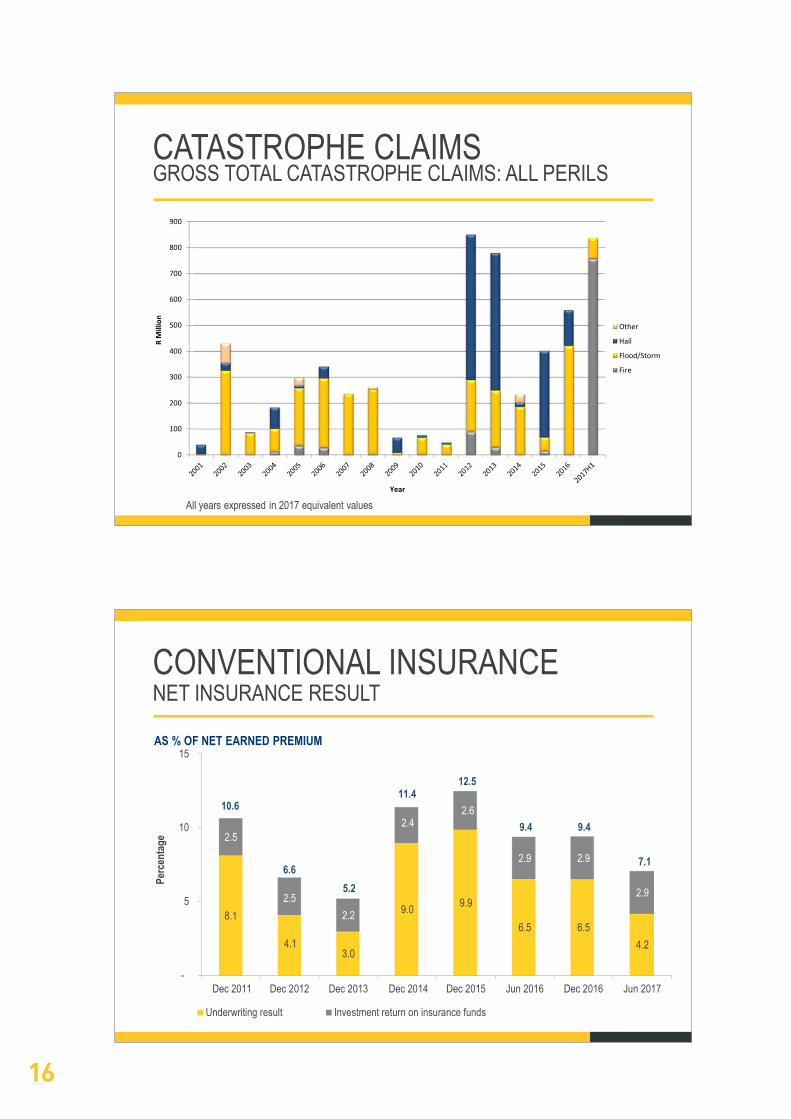
CONVENTIONAL INSURANCENET INSURANCE RESULT
AS % OF NET EARNED PREMIUM
8.1
4.13.0
9.0 9.9
6.5 6.54.2
2.5
2.52.2
2.42.6
2.9 2.9
2.9
-
5
10
15
Dec 2011 Dec 2012 Dec 2013 Dec 2014 Dec 2015 Jun 2016 Dec 2016 Jun 2017
Perc
enta
ge
Underwriting result Investment return on insurance funds
5.2
9.4
12.511.4
6.6
10.6
7.1
9.4
CATASTROPHE CLAIMSGROSS TOTAL CATASTROPHE CLAIMS: ALL PERILS
0
100
200
300
400
500
600
700
800
900
R M
illio
n
Year
Other
Hail
Flood/Storm
Fire
All years expressed in 2017 equivalent values

17
18
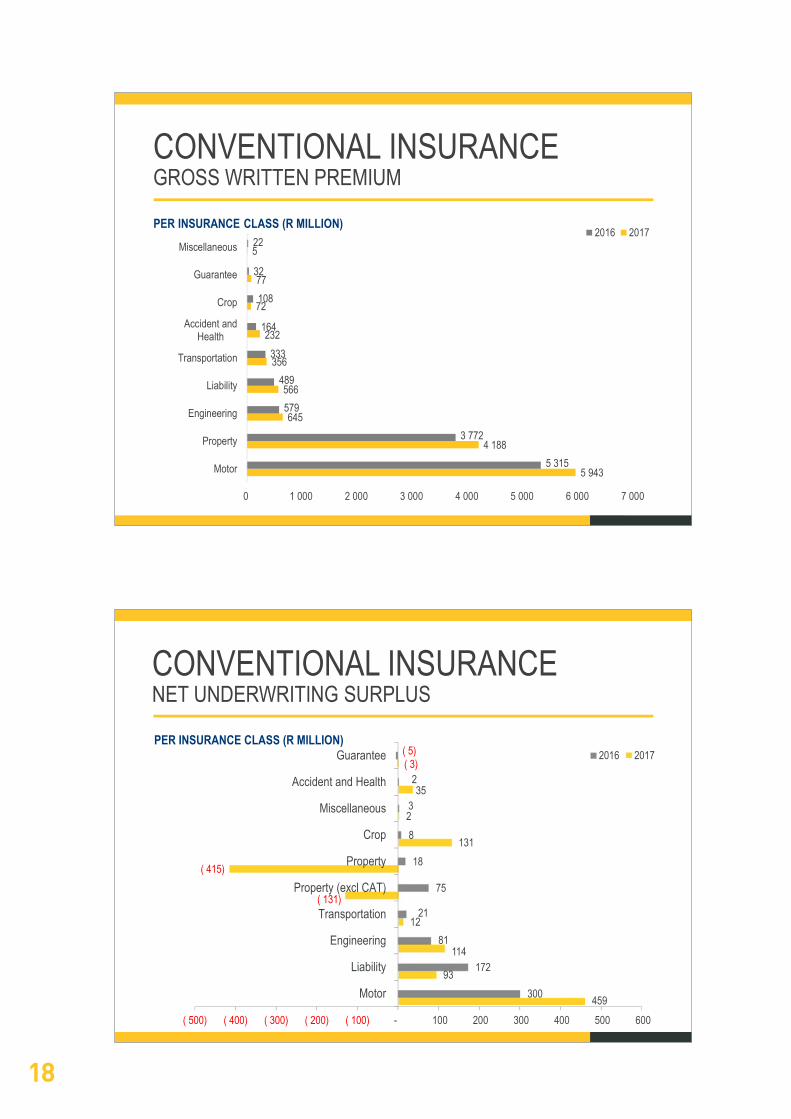
CONVENTIONAL INSURANCENET UNDERWRITING SURPLUS
PER INSURANCE CLASS (R MILLION)
459
93
114
12
( 131)
( 415)
131
2
35
( 3)
300
172
81
21
75
18
8
3
2
( 5)
( 500) ( 400) ( 300) ( 200) ( 100) - 100 200 300 400 500 600
Motor
Liability
Engineering
Transportation
Property (excl CAT)
Property
Crop
Miscellaneous
Accident and Health
Guarantee 2016 2017
PER INSURANCE CLASS (R MILLION)
CONVENTIONAL INSURANCEGROSS WRITTEN PREMIUM
5 943
4 188
645
566
356
232
72
77
5
5 315
3 772
579
489
333
164
108
32
22
0 1 000 2 000 3 000 4 000 5 000 6 000 7 000
Motor
Property
Engineering
Liability
Transportation
Accident andHealth
Crop
Guarantee
Miscellaneous2016 2017

19
20
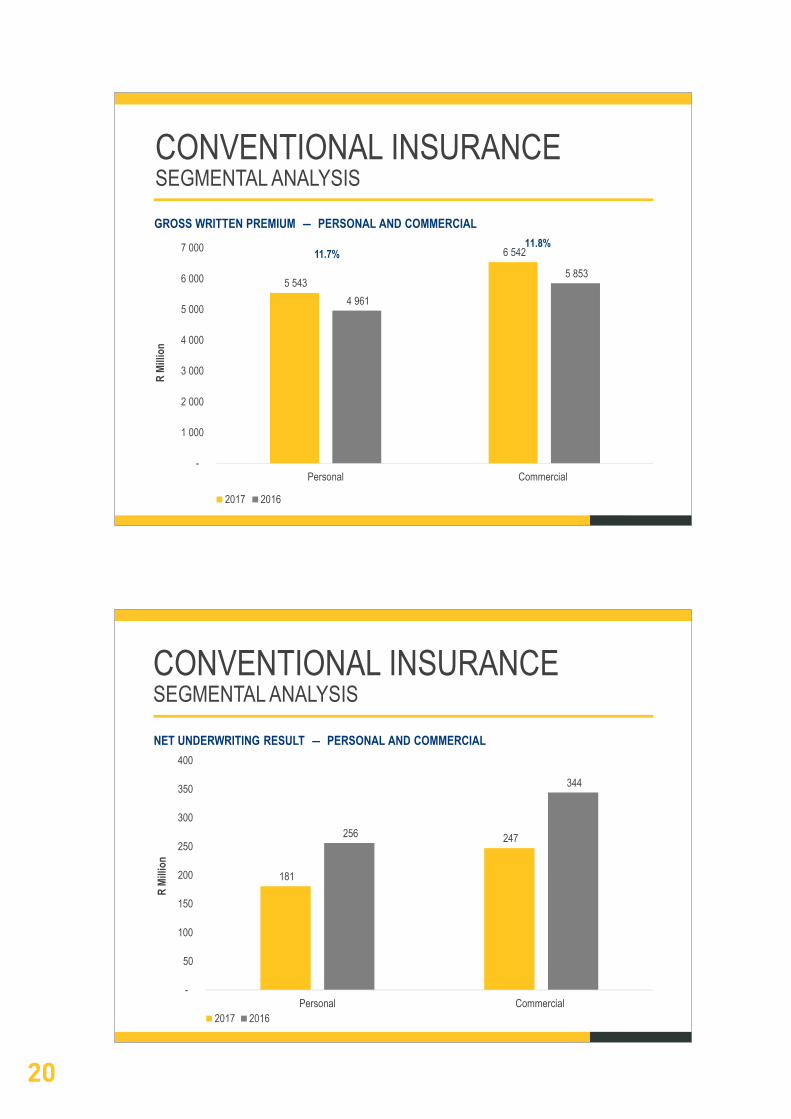
CONVENTIONAL INSURANCESEGMENTAL ANALYSIS
NET UNDERWRITING RESULT ― PERSONAL AND COMMERCIAL
181
247 256
344
-
50
100
150
200
250
300
350
400
Personal Commercial
R Mi
llion
2017 2016
CONVENTIONAL INSURANCESEGMENTAL ANALYSIS
GROSS WRITTEN PREMIUM ― PERSONAL AND COMMERCIAL
5 543
6 542
4 961
5 853
-
1 000
2 000
3 000
4 000
5 000
6 000
7 000
Personal Commercial
R Mi
llion
2017 2016
11.8%11.7%

21
22
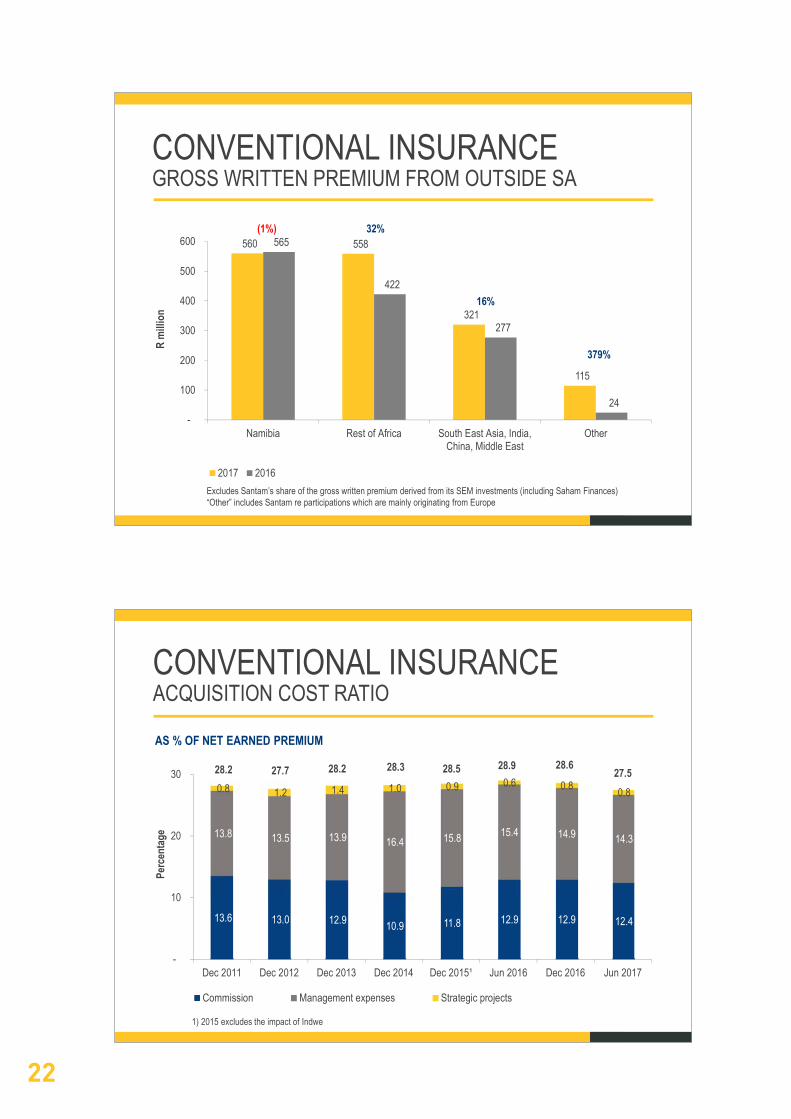
AS % OF NET EARNED PREMIUM
CONVENTIONAL INSURANCEACQUISITION COST RATIO
13.6 13.0 12.9 10.9 11.8 12.9 12.9 12.4
13.8 13.5 13.9 16.4 15.8 15.4 14.9 14.3
0.8 1.2 1.4 1.0 0.9 0.6 0.8 0.8
-
10
20
30
Dec 2011 Dec 2012 Dec 2013 Dec 2014 Dec 2015¹ Jun 2016 Dec 2016 Jun 2017
Perc
enta
ge
Commission Management expenses Strategic projects
28.2 27.7 28.2 28.3 28.5 27.528.628.9
1) 2015 excludes the impact of Indwe
CONVENTIONAL INSURANCEGROSS WRITTEN PREMIUM FROM OUTSIDE SA
Excludes Santam’s share of the gross written premium derived from its SEM investments (including Saham Finances)“Other” includes Santam re participations which are mainly originating from Europe
560 558
321
115
565
422
277
24 -
100
200
300
400
500
600
Namibia Rest of Africa South East Asia, India,China, Middle East
Other
R m
illion
2017 2016
(1%) 32%
16%
379%

23

24
CONVENTIONAL INSURANCESIZE OF INSURANCE FUNDS
5 483 6 266 6 449 6 774
7 489 6 809
7 279 7 442
-
2 000
4 000
6 000
8 000
Dec 2011 Dec 2012 Dec 2013 Dec 2014 Dec 2015 Jun 2016 Dec 2016 Jun 2017
R m
illion
CONVENTIONAL INSURANCEREINSURANCE AS % OF GROSS EARNED PREMIUM
7.3
9.9
11.8
18.3 18.2 18.6 18.6
-
2
4
6
8
10
12
14
16
18
20
Dec 2011 Dec 2012 Dec 2013 Dec 2014 Dec 2015 Dec 2016 Jun 2017
Perc
enta
ge

25

26
CONVENTIONAL INSURANCEASSETS BACKING NET INSURANCE FUNDS
5 943 5 959 5 540
1 111 996 940
388 324 328
-
2 000
4 000
6 000
8 000
Jun 2017 Dec 2016 Jun 2016
R m
illion
Rand US Dollar Other currencies (mainly Namibian dollar)
7 442
6 8097 279
CURRENCY MIX
CONVENTIONAL INSURANCEINSURANCE FUNDS AS % OF GROSS EARNED PREMIUM
35.9 37.135.4
33.5 34.3
30.2 30.9 29.9
-
10
20
30
40
Dec 2011 Dec 2012 Dec 2013 Dec 2014 Dec 2015 Jun 2016 Dec 2016 Jun 2017
Perc
enta
ge

27
28
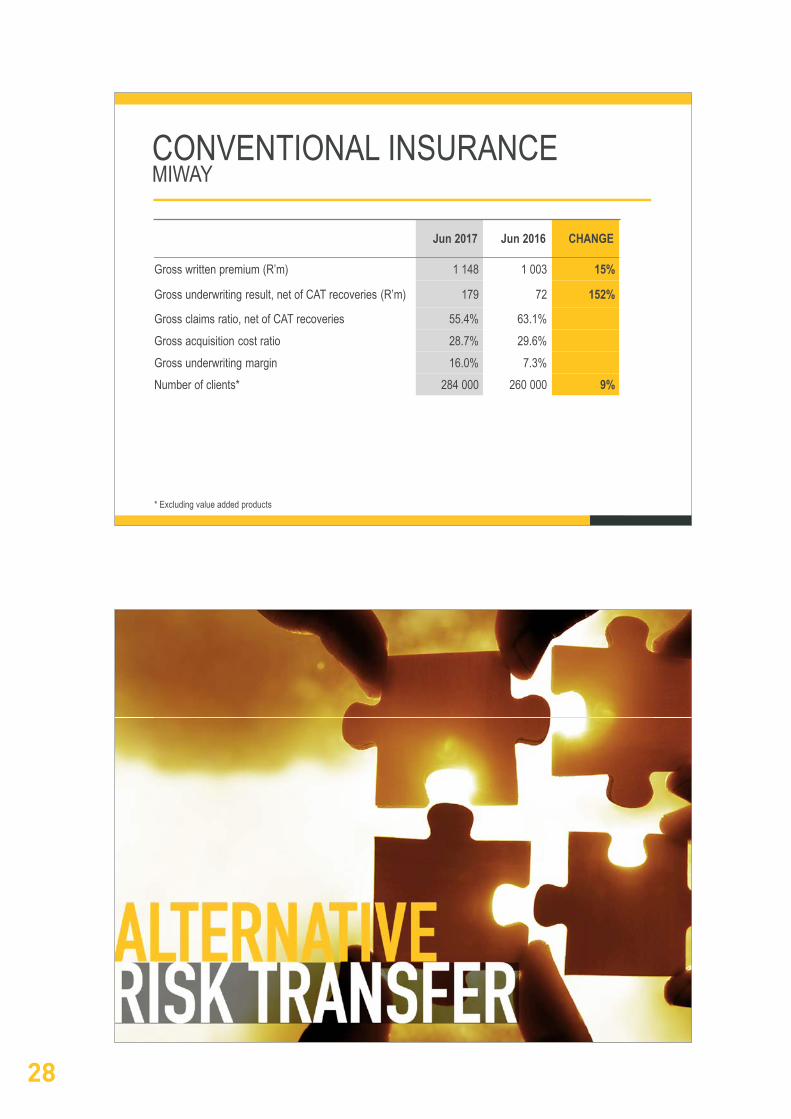
Jun 2017 Jun 2016 CHANGE
Gross written premium (R’m) 1 148 1 003 15%
Gross underwriting result, net of CAT recoveries (R’m) 179 72 152%
Gross claims ratio, net of CAT recoveries 55.4% 63.1%Gross acquisition cost ratio 28.7% 29.6%Gross underwriting margin 16.0% 7.3%Number of clients* 284 000 260 000 9%
CONVENTIONAL INSURANCEMIWAY
* Excluding value added products

29
30
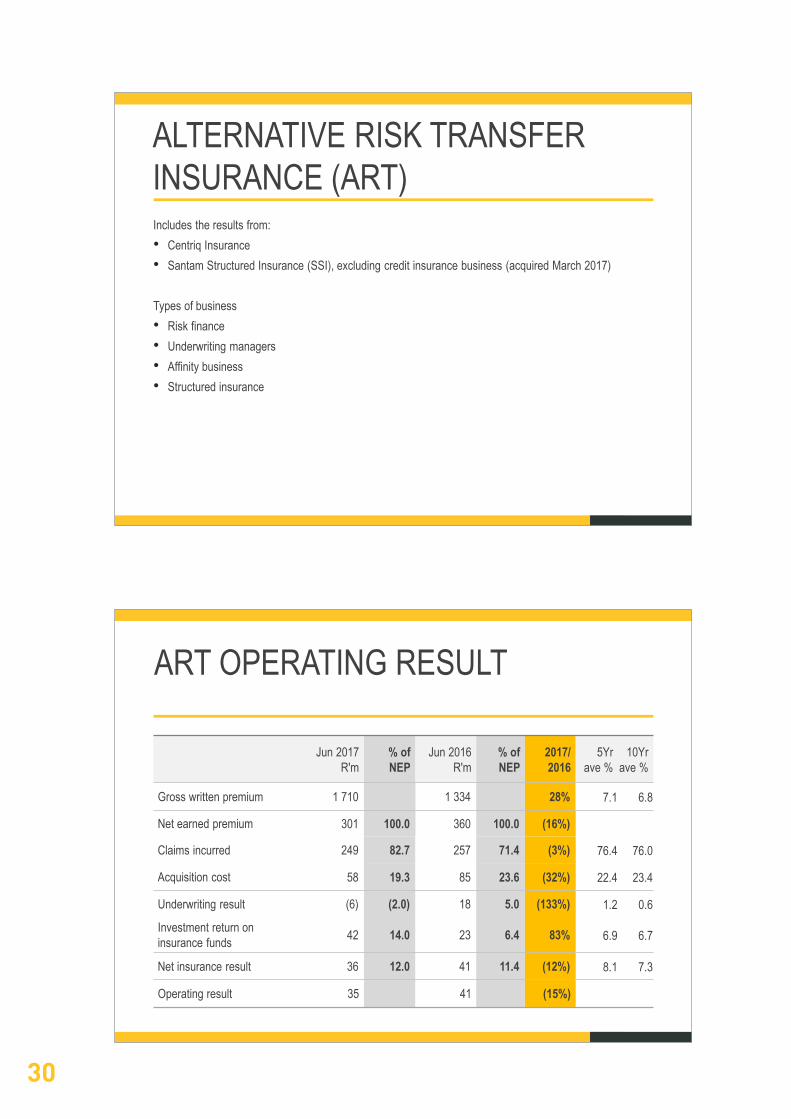
ART OPERATING RESULT
Jun 2017 R'm
% of NEP
Jun 2016 R'm
% of NEP
2017/2016
5Yr ave %
10Yr ave %
Gross written premium 1 710 1 334 28% 7.1 6.8
Net earned premium 301 100.0 360 100.0 (16%)
Claims incurred 249 82.7 257 71.4 (3%) 76.4 76.0
Acquisition cost 58 19.3 85 23.6 (32%) 22.4 23.4
Underwriting result (6) (2.0) 18 5.0 (133%) 1.2 0.6
Investment return on insurance funds 42 14.0 23 6.4 83% 6.9 6.7
Net insurance result 36 12.0 41 11.4 (12%) 8.1 7.3
Operating result 35 41 (15%)
ALTERNATIVE RISK TRANSFER INSURANCE (ART)Includes the results from:• Centriq Insurance• Santam Structured Insurance (SSI), excluding credit insurance business (acquired March 2017)
Types of business• Risk finance• Underwriting managers• Affinity business• Structured insurance

31

32
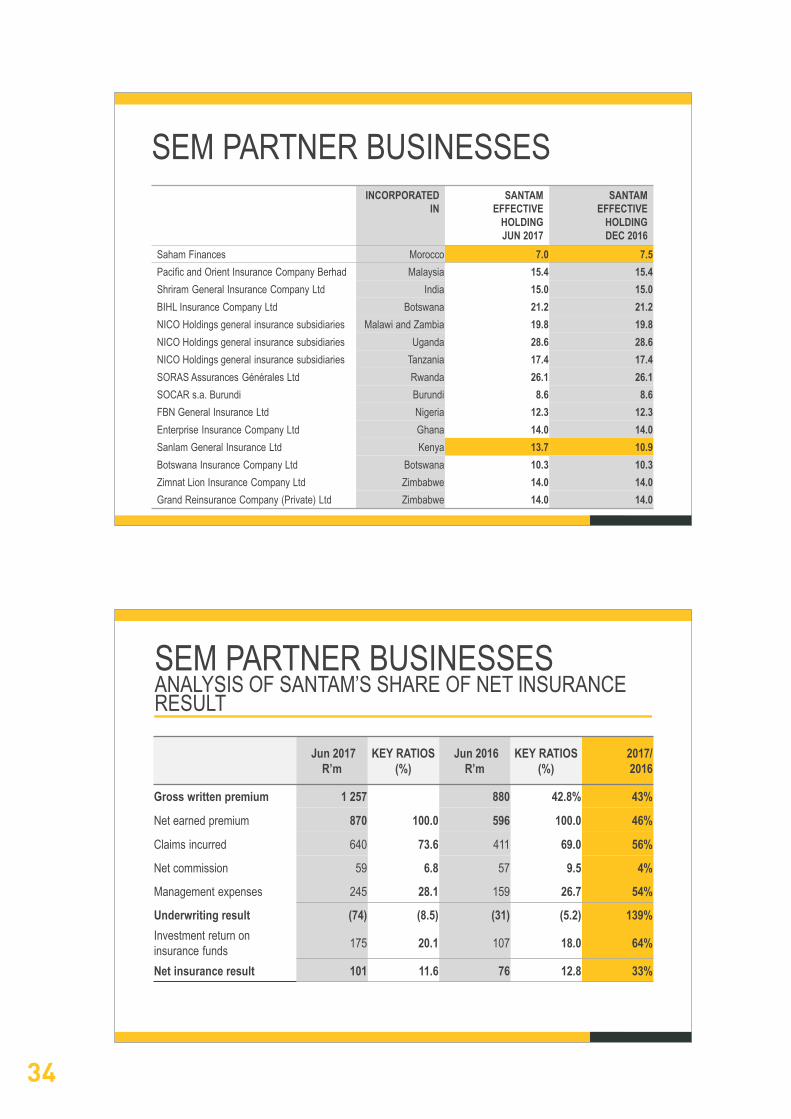
SEM PARTNER BUSINESSES
• Saham Finances • Effective interest of 7% held through SAN JV• Operates in 26 countries in Africa and the Middle East• Main insurance business:
• Morocco• Lebanon• Ivory Coast• Angola• Nigeria – Continental Re
• SEM Participation investments• SGI (India)• P&O (Malaysia)• 12 investments in African partner businesses

33
34
SEM PARTNER BUSINESSESANALYSIS OF SANTAM’S SHARE OF NET INSURANCE RESULT
Jun 2017R’m
KEY RATIOS (%)
Jun 2016R’m
KEY RATIOS(%)
2017/2016
Gross written premium 1 257 880 42.8% 43%
Net earned premium 870 100.0 596 100.0 46%
Claims incurred 640 73.6 411 69.0 56%
Net commission 59 6.8 57 9.5 4%
Management expenses 245 28.1 159 26.7 54%
Underwriting result (74) (8.5) (31) (5.2) 139%Investment return on insurance funds 175 20.1 107 18.0 64%
Net insurance result 101 11.6 76 12.8 33%
INCORPORATED IN
SANTAMEFFECTIVE
HOLDING JUN 2017
SANTAM EFFECTIVE
HOLDING DEC 2016
Saham Finances Morocco 7.0 7.5Pacific and Orient Insurance Company Berhad Malaysia 15.4 15.4 Shriram General Insurance Company Ltd India 15.0 15.0 BIHL Insurance Company Ltd Botswana 21.2 21.2 NICO Holdings general insurance subsidiaries Malawi and Zambia 19.8 19.8 NICO Holdings general insurance subsidiaries Uganda 28.6 28.6 NICO Holdings general insurance subsidiaries Tanzania 17.4 17.4 SORAS Assurances Générales Ltd Rwanda 26.1 26.1 SOCAR s.a. Burundi Burundi 8.6 8.6 FBN General Insurance Ltd Nigeria 12.3 12.3Enterprise Insurance Company Ltd Ghana 14.0 14.0 Sanlam General Insurance Ltd Kenya 13.7 10.9Botswana Insurance Company Ltd Botswana 10.3 10.3Zimnat Lion Insurance Company Ltd Zimbabwe 14.0 14.0Grand Reinsurance Company (Private) Ltd Zimbabwe 14.0 14.0
SEM PARTNER BUSINESSES

35
36
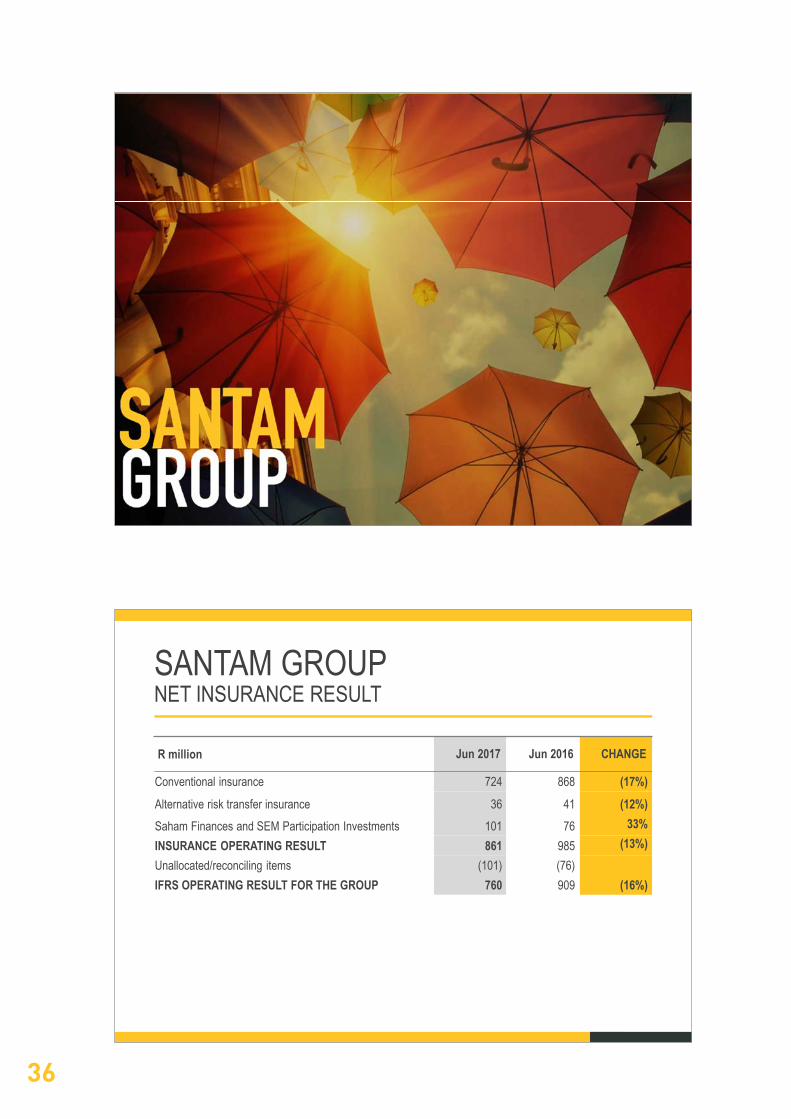
R million Jun 2017 Jun 2016 CHANGE
Conventional insurance 724 868 (17%)Alternative risk transfer insurance 36 41 (12%)Saham Finances and SEM Participation Investments 101 76 33%INSURANCE OPERATING RESULT 861 985 (13%)Unallocated/reconciling items (101) (76)IFRS OPERATING RESULT FOR THE GROUP 760 909 (16%)
SANTAM GROUPNET INSURANCE RESULT

37
38
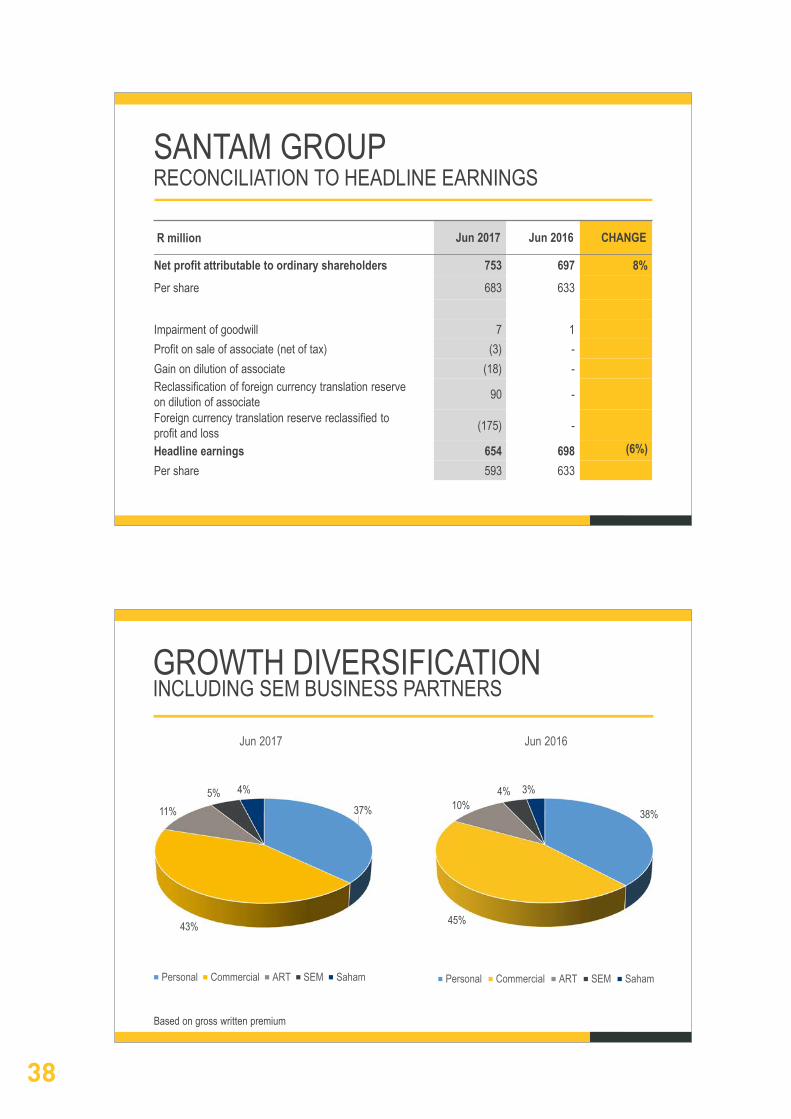
GROWTH DIVERSIFICATIONINCLUDING SEM BUSINESS PARTNERS
37%
43%
11%5% 4%
Jun 2017
Personal Commercial ART SEM Saham
38%
45%
10%4% 3%
Jun 2016
Personal Commercial ART SEM Saham
Based on gross written premium
R million Jun 2017 Jun 2016 CHANGE
Net profit attributable to ordinary shareholders 753 697 8%Per share 683 633
Impairment of goodwill 7 1Profit on sale of associate (net of tax) (3) -Gain on dilution of associate (18) -Reclassification of foreign currency translation reserveon dilution of associate 90 -
Foreign currency translation reserve reclassified toprofit and loss (175) -
Headline earnings 654 698 (6%)Per share 593 633
SANTAM GROUPRECONCILIATION TO HEADLINE EARNINGS

39
40
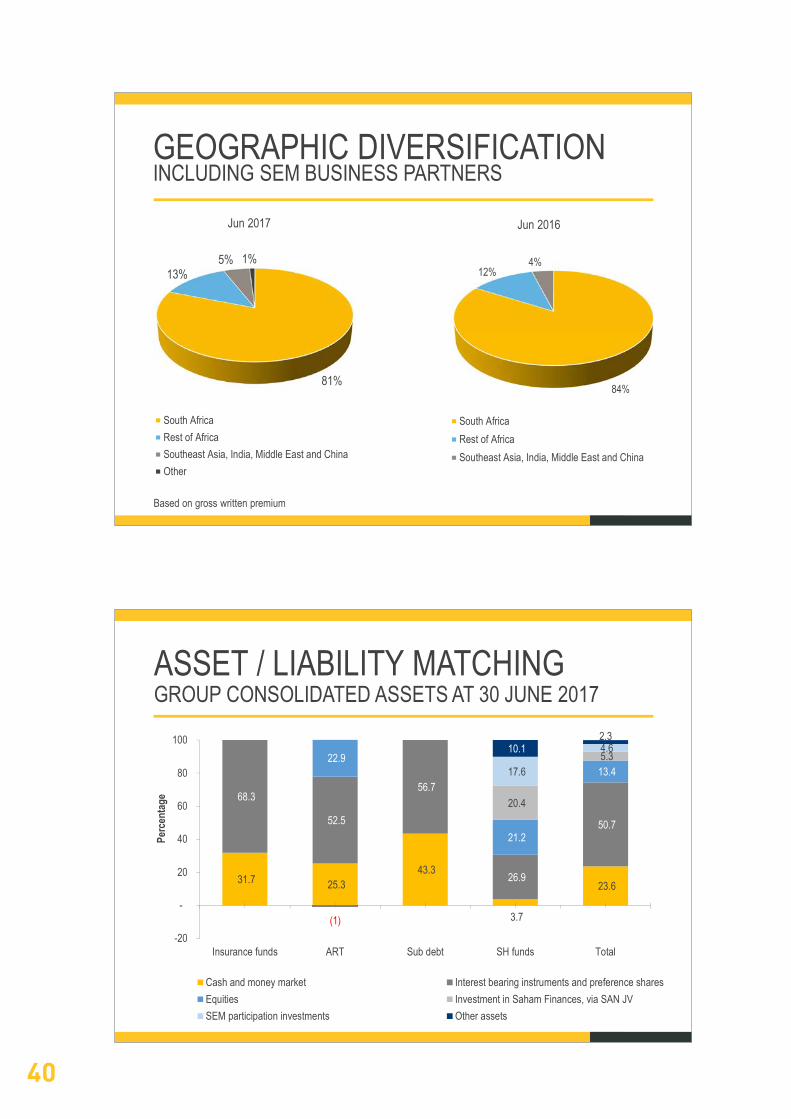
ASSET / LIABILITY MATCHINGGROUP CONSOLIDATED ASSETS AT 30 JUNE 2017
31.7 25.3 43.3
3.7
23.6
68.3
52.5
56.7
26.9
50.7
22.9
21.2
13.4
20.4
5.3 17.6
4.6
(1)
10.1 2.3
-20
-
20
40
60
80
100
Insurance funds ART Sub debt SH funds Total
Perc
enta
ge
Cash and money market Interest bearing instruments and preference sharesEquities Investment in Saham Finances, via SAN JVSEM participation investments Other assets
GEOGRAPHIC DIVERSIFICATIONINCLUDING SEM BUSINESS PARTNERS
81%
13%5% 1%
Jun 2017
South AfricaRest of AfricaSoutheast Asia, India, Middle East and ChinaOther
84%
12%4%
Jun 2016
South AfricaRest of AfricaSoutheast Asia, India, Middle East and China
Based on gross written premium

41
42
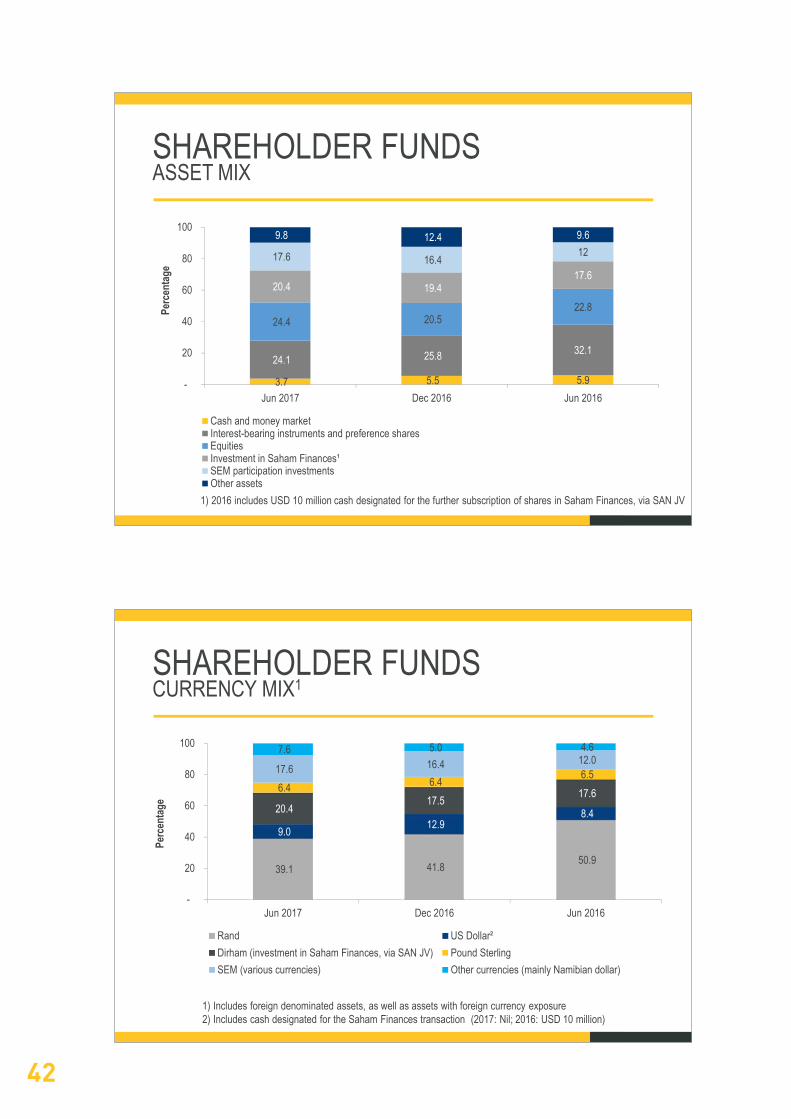
SHAREHOLDER FUNDSCURRENCY MIX1
39.1 41.8 50.9
9.0 12.9 8.4 20.4
17.5 17.6 6.4 6.4 6.5 17.6 16.4 12.0 7.6 5.0 4.6
-
20
40
60
80
100
Jun 2017 Dec 2016 Jun 2016
Perc
enta
ge
Rand US Dollar²Dirham (investment in Saham Finances, via SAN JV) Pound SterlingSEM (various currencies) Other currencies (mainly Namibian dollar)
1) Includes foreign denominated assets, as well as assets with foreign currency exposure2) Includes cash designated for the Saham Finances transaction (2017: Nil; 2016: USD 10 million)
SHAREHOLDER FUNDSASSET MIX
3.7 5.5 5.9
24.1 25.8 32.1
24.4 20.5 22.8
20.4 19.4 17.6
17.6 16.4 12
9.8 12.4 9.6
-
20
40
60
80
100
Jun 2017 Dec 2016 Jun 2016
Perc
enta
ge
Cash and money marketInterest-bearing instruments and preference sharesEquitiesInvestment in Saham Finances¹SEM participation investmentsOther assets
1) 2016 includes USD 10 million cash designated for the further subscription of shares in Saham Finances, via SAN JV

43
44
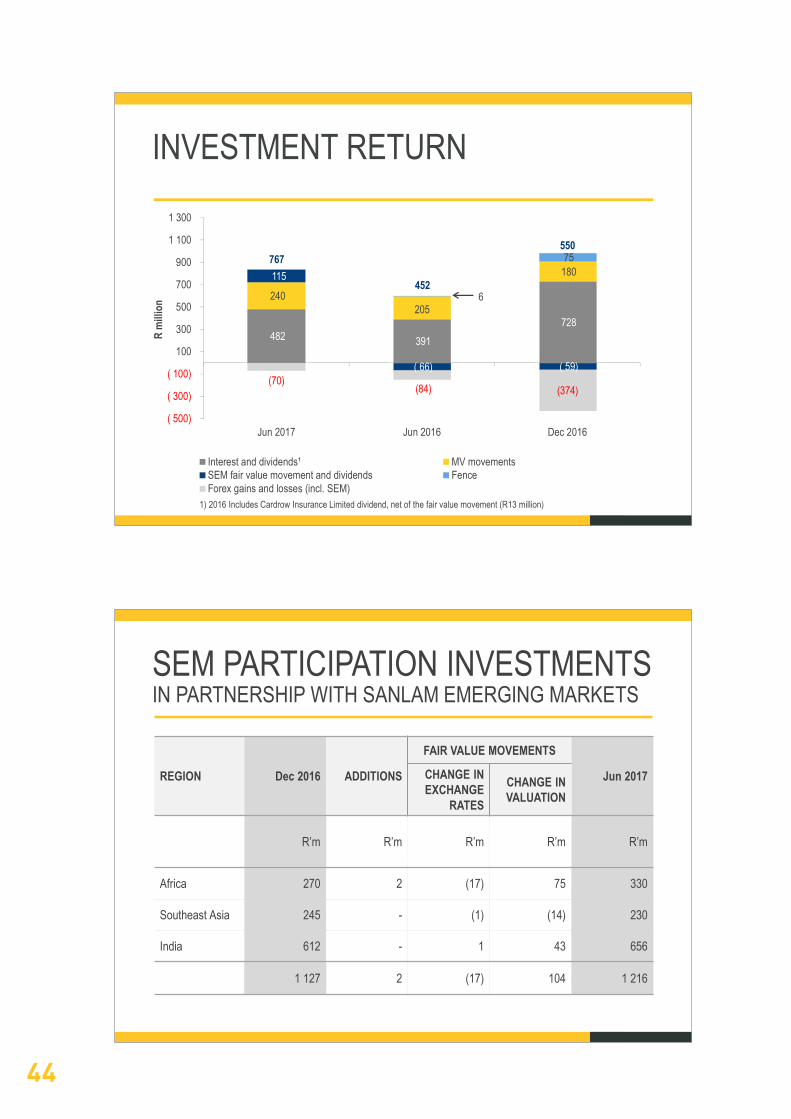
REGION Dec 2016 ADDITIONS
FAIR VALUE MOVEMENTS
Jun 2017CHANGE IN EXCHANGE
RATES
CHANGE IN VALUATION
R’m R’m R’m R’m R’m
Africa 270 2 (17) 75 330
Southeast Asia 245 - (1) (14) 230
India 612 - 1 43 656
1 127 2 (17) 104 1 216
SEM PARTICIPATION INVESTMENTSIN PARTNERSHIP WITH SANLAM EMERGING MARKETS
INVESTMENT RETURN
1) 2016 Includes Cardrow Insurance Limited dividend, net of the fair value movement (R13 million)
482 391 728
240 205
180 115
( 66) ( 59)
6
75
(70)(84) (374)
( 500)
( 300)
( 100)
100
300
500
700
900
1 100
1 300
Jun 2017 Jun 2016 Dec 2016
R m
illion
Interest and dividends¹ MV movementsSEM fair value movement and dividends FenceForex gains and losses (incl. SEM)
452
767550

45
46
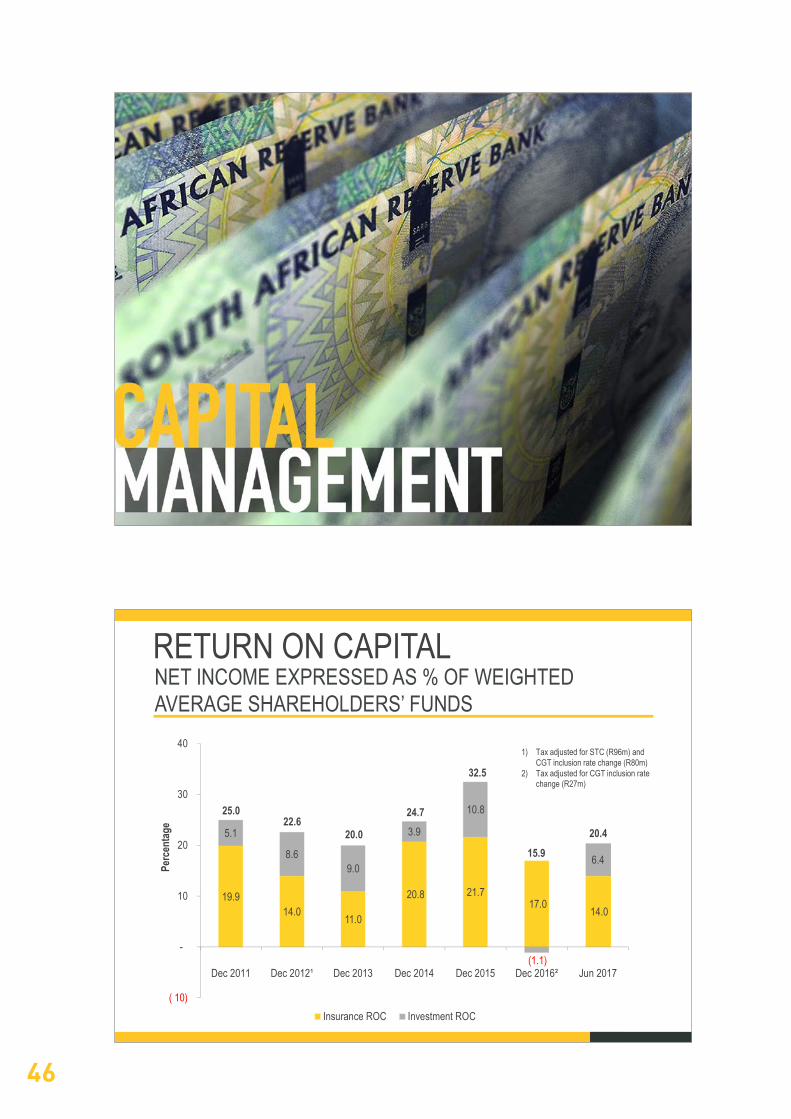
19.9 14.0 11.0
20.8 21.717.0 14.0
5.1
8.6 9.0
3.9
10.8
(1.1)
6.4
( 10)
-
10
20
30
40
Dec 2011 Dec 2012¹ Dec 2013 Dec 2014 Dec 2015 Dec 2016² Jun 2017
Perc
enta
ge
Insurance ROC Investment ROC
20.0
24.7
32.5
22.625.0
15.920.4
RETURN ON CAPITAL
1) Tax adjusted for STC (R96m) and CGT inclusion rate change (R80m)
2) Tax adjusted for CGT inclusion rate change (R27m)
NET INCOME EXPRESSED AS % OF WEIGHTED AVERAGE SHAREHOLDERS’ FUNDS

47
48
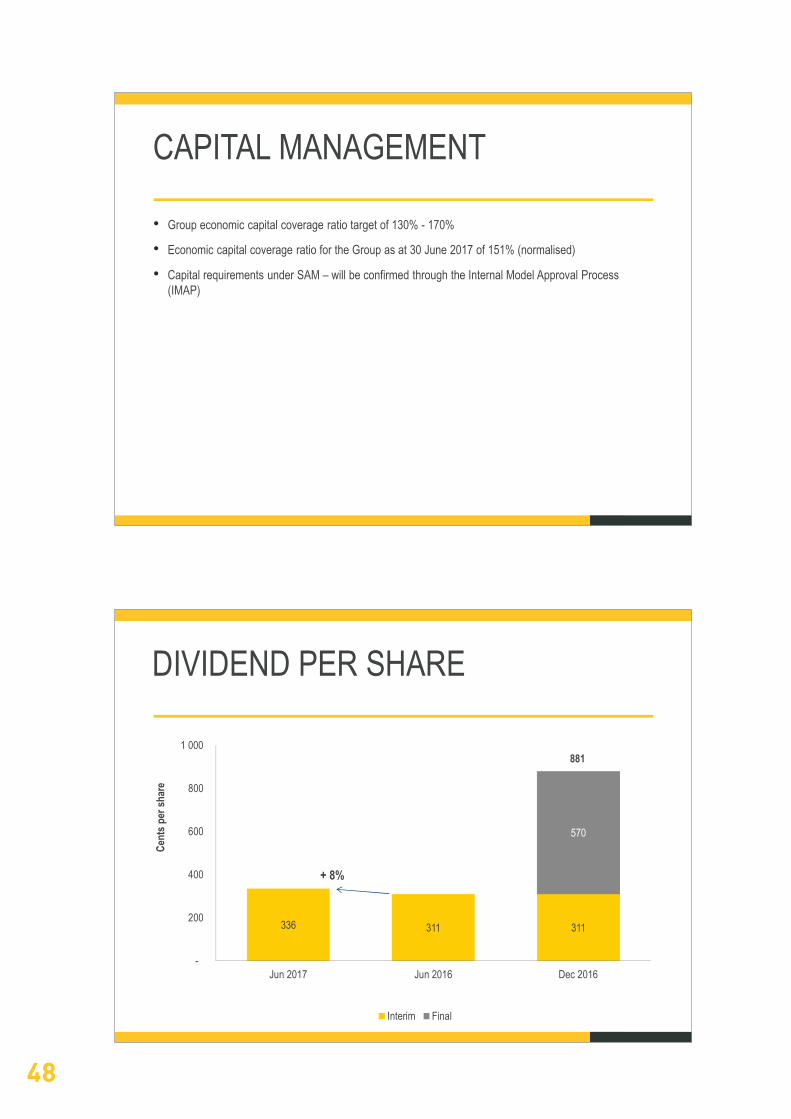
DIVIDEND PER SHARE
336 311 311
570
-
200
400
600
800
1 000
Jun 2017 Jun 2016 Dec 2016
Cent
s per
shar
e
Interim Final
+ 8%
881
CAPITAL MANAGEMENT
• Group economic capital coverage ratio target of 130% - 170%
• Economic capital coverage ratio for the Group as at 30 June 2017 of 151% (normalised)
• Capital requirements under SAM – will be confirmed through the Internal Model Approval Process (IMAP)

49
50
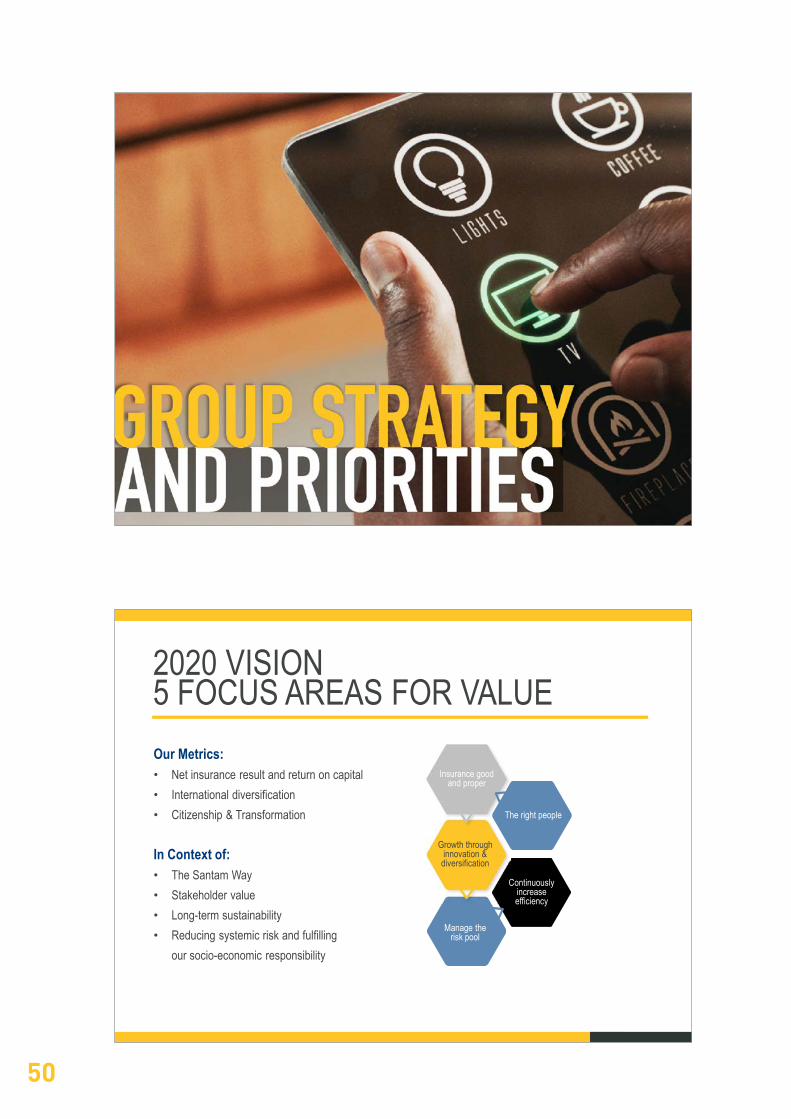
Our Metrics:• Net insurance result and return on capital• International diversification • Citizenship & Transformation
In Context of:• The Santam Way• Stakeholder value• Long-term sustainability• Reducing systemic risk and fulfilling
our socio-economic responsibility
2020 VISION5 FOCUS AREAS FOR VALUE
Growth through innovation &
diversification
Manage therisk pool
Continuouslyincreaseefficiency
The right people
Insurance good and proper

51
52
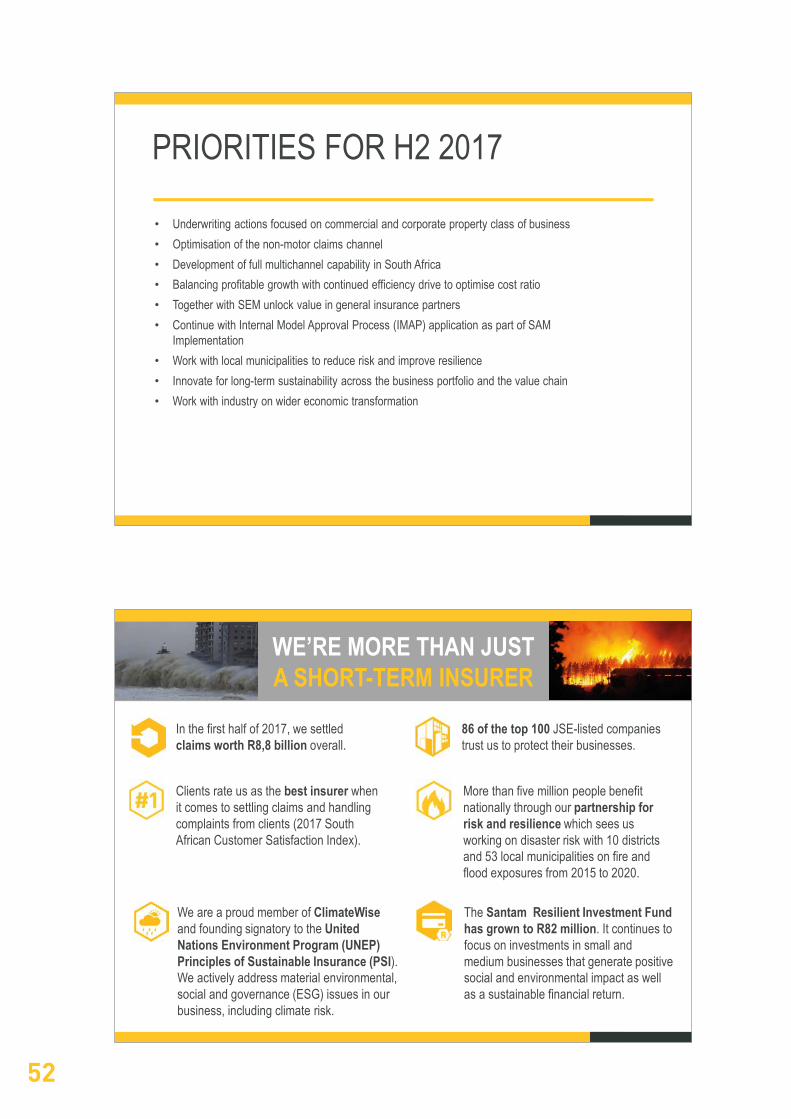
WE’RE MORE THAN JUST A SHORT-TERM INSURER
The Santam Resilient Investment Fund has grown to R82 million. It continues to focus on investments in small and medium businesses that generate positive social and environmental impact as well as a sustainable financial return.
We are a proud member of ClimateWiseand founding signatory to the United Nations Environment Program (UNEP) Principles of Sustainable Insurance (PSI). We actively address material environmental, social and governance (ESG) issues in our business, including climate risk.
Clients rate us as the best insurer when it comes to settling claims and handling complaints from clients (2017 South African Customer Satisfaction Index).
More than five million people benefit nationally through our partnership for risk and resilience which sees us working on disaster risk with 10 districts and 53 local municipalities on fire and flood exposures from 2015 to 2020.
In the first half of 2017, we settled claims worth R8,8 billion overall.
86 of the top 100 JSE-listed companies trust us to protect their businesses.
PRIORITIES FOR H2 2017
• Underwriting actions focused on commercial and corporate property class of business • Optimisation of the non-motor claims channel• Development of full multichannel capability in South Africa• Balancing profitable growth with continued efficiency drive to optimise cost ratio• Together with SEM unlock value in general insurance partners• Continue with Internal Model Approval Process (IMAP) application as part of SAM
Implementation• Work with local municipalities to reduce risk and improve resilience• Innovate for long-term sustainability across the business portfolio and the value chain• Work with industry on wider economic transformation

53
54

55
REVIEWED INTERIM REPORTFOR THE SIX MONTHSENDED 30 JUNE 2017
57 SALIENT FEATURES
58 FINANCIAL REVIEW
62 INDEPENDENT AUDITOR’S REVIEW REPORT
63 CONSOLIDATED STATEMENT OF FINANCIAL POSITION
64 CONSOLIDATED STATEMENT OF COMPREHENSIVE INCOME
65 CONSOLIDATED STATEMENT OF CHANGES IN EQUITY
66 CONSOLIDATED STATEMENT OF CASH FLOWS
67 NOTES TO THE INTERIM FINANCIAL STATEMENTS
TABLE OF CONTENTS
57
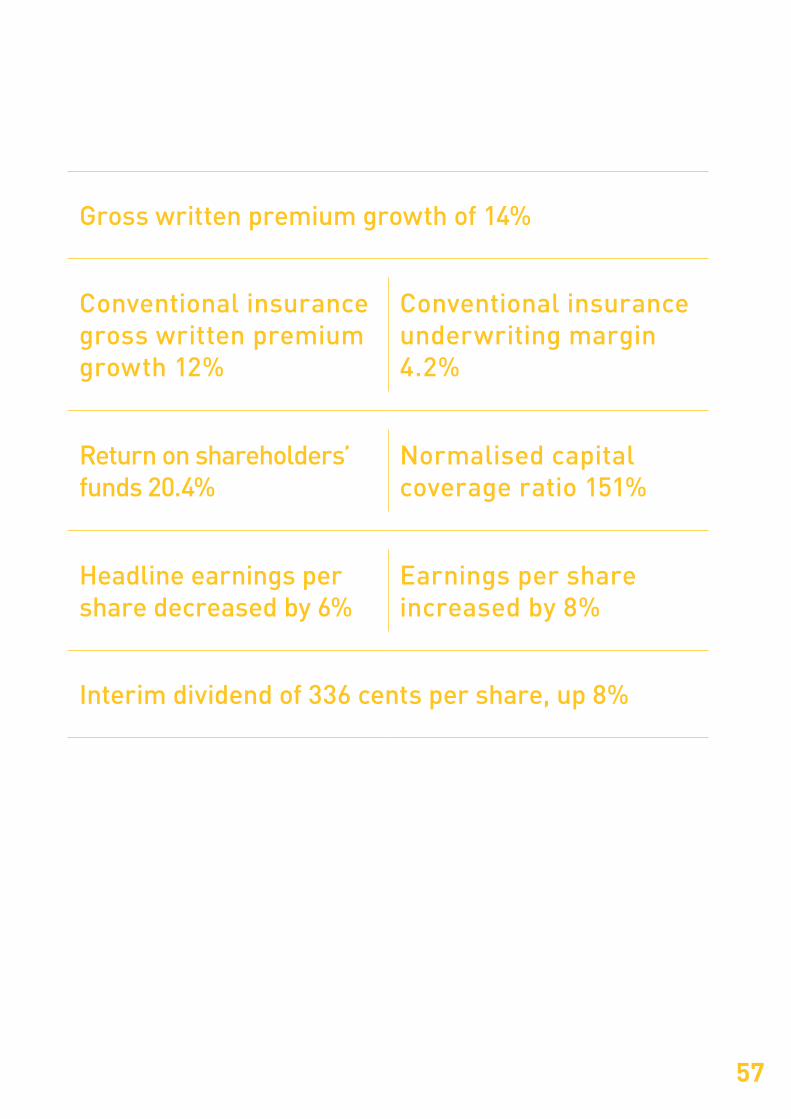
Gross written premium growth of 14%
Conventional insurance gross written premium growth 12%
Conventional insurance underwriting margin 4.2%
Return on shareholders’ funds 20.4%
Normalised capital coverage ratio 151%
Headline earnings per share decreased by 6%
Earnings per share increased by 8%
Interim dividend of 336 cents per share, up 8%
58
FINANCIAL REVIEWThe Santam group reported excellent growth of 14%, but lower underwriting results, for the six-month period to 30 June 2017.
The group has revised the presentation of its insurance results in the following segments:
– Conventional insurance business written on insurance licences controlled by the group;
– Alternative Risk Transfer insurance business written on insurance licences controlled by the group; and
– Santam’s share of the insurance results of the Sanlam Emerging Markets (SEM) general insurance businesses (including Saham Finances).
The group’s conventional insurance book achieved excellent gross written premium growth of 12% and a net underwriting margin of 4.2% (2016: 6.4%),
which was at the bottom end of the group’s target range of 4% to 8%. The alternative risk transfer insurance segment grew by 28% following the
acquisition of RMB Structured Insurance (rebranded to Santam Structured Insurance) and achieved solid operating results. The SEM general insurance
businesses delivered improved operating results.
Investment income, inclusive of fair value movements on financial assets and liabilities, of R918 million was significantly higher than the R555 million
reported in the comparative period in 2016. The increase was mainly due to foreign currency gains on the winding up of Santam International,
increased interest income following the growth in interest-bearing assets, and the positive fair value adjustments on the listed and unlisted
investment portfolios.
The lower underwriting profit compared to 2016 was the key driver of the 6% drop in headline earnings per share. An annualised return on capital
of 20.4% was achieved. The normalised economic capital coverage ratio was 151% – close to the mid-point of the target range of 130% to 170%.
CONVENTIONAL INSURANCEThe conventional insurance business reported a net underwriting margin of 4.2% compared to the 6.4% reported in 2016. The current period
margin was impacted by significant catastrophe claims, as well as several large commercial fire claims, while excellent gross premium growth
of 12% (2016: 6%) was achieved, including a book acquisition, which contributed growth of 1.4%. The focus on international diversification
continued to reflect positively on growth with gross written premium from outside of South Africa written on the Santam Ltd licence increasing
by 21% to R1 554 million (2016: R1 288 million).
The property class reported growth of 11% on the back of solid growth in the corporate property business in addition to the acquisition of a new
block of commercial business. The motor class grew by 12%, which benefitted from 15% growth reported by MiWay (gross written premium of
R1 148 million; 2016: R1 003 million), and strong growth in the commercial and personal lines intermediated business.
The liability class reported an increase in gross written premiums of 16% as it was positively impacted by growth in the specialist, commercial
and reinsurance businesses. Engineering also reported double-digit growth of 11%, despite continued economic pressure negatively impacting
construction projects. Growth in business from outside South Africa contributed to this result.
The accident and health class reported growth of 41%, mainly driven by growth in Santam Re as well as the travel insurance business.
On 6 June 2017, and through to 8 June 2017, a severe storm hit the Western Cape that resulted in extensive property damage in
Cape Town and environs, and a devastating fire-storm in the Southern Cape (including large parts of Knysna, Brenton-on-Sea, and parts
of Plettenberg Bay) destroyed a large number of properties in its wake. Nearly 10 000 people were evacuated and seven people died. Over
1 000 firefighters eventually brought the fires under control. The total insured damage has been estimated at around R3 billion, with economic
losses (taking uninsured property into account) at significantly higher levels.
This was by far the worst catastrophe event in South African insurance history, with Santam client claims totalling around R800 million, of which
R72 million related to the Cape Town property damage. The impact on the group’s net underwriting results, including reinsurance reinstatement
premiums, was R234 million. The net underwriting margin, excluding the impact of this catastrophe event, was 6.4%. It was also the most severe
wildfire in South African history since the so-called ‘Great Fire of 1869’, which, incidentally, burnt a similar region of the Southern Cape. Experts
have concluded that the extreme wind, severe drought conditions, coupled with the extremely hot ambient conditions conspired to create this
extraordinary event.
It is during such times of extreme loss and hardship that the real value of insurance comes to the fore. Santam’s claims team responded almost
immediately and set up a temporary fit-for-purpose office in Knysna, which sent out mobile assessment vehicles, and was available on the ground
to help clients through the myriad of practical challenges that arise after such a devastating event.
It is Santam’s view that it was the same weather system that caused the strong winds and damage in Cape Town that caused the rapid spreading
and development of the extreme bush fires along the Knysna coast. The original cause of the fires, which ignited into vast bush fires as the result
of the weather system, is still the subject of various investigations. This uncertainty creates complications in agreeing these losses with our
reinsurance markets as one event or two events, but it remains Santam’s view that these losses are to be treated as one event. Despite our view,
given the uncertainty around this event, we have accounted for the losses as two events in these financial results.
59
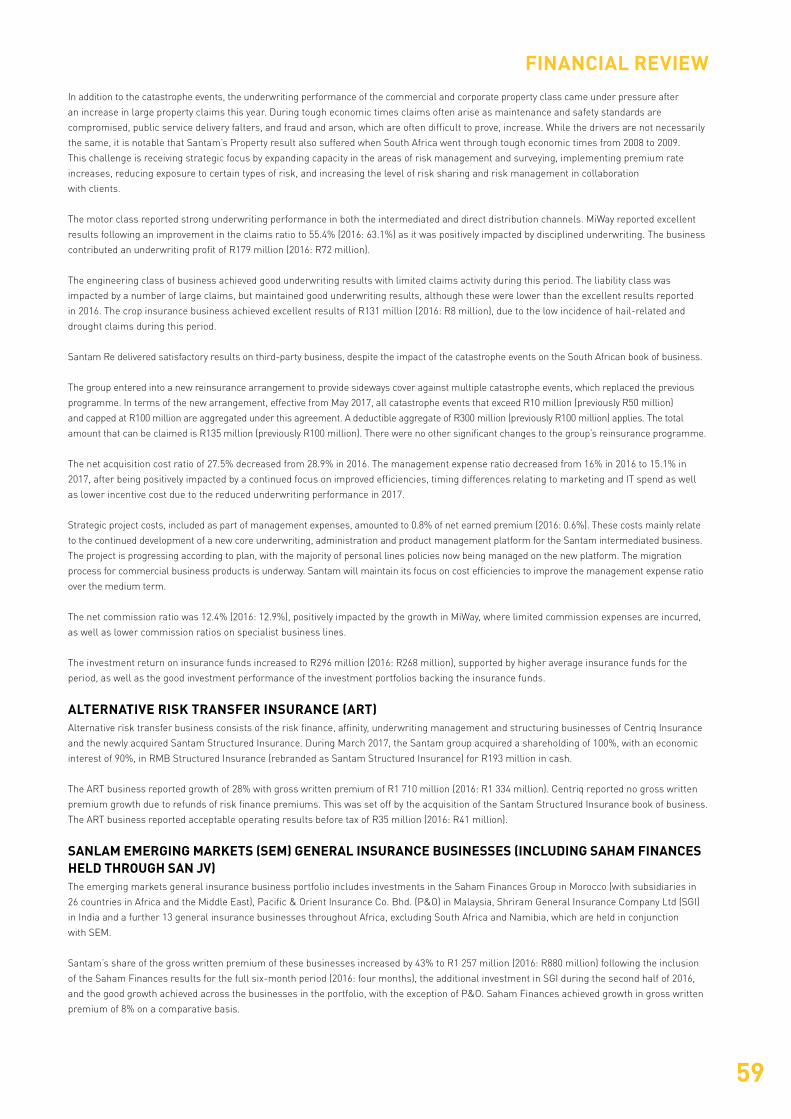
In addition to the catastrophe events, the underwriting performance of the commercial and corporate property class came under pressure after
an increase in large property claims this year. During tough economic times claims often arise as maintenance and safety standards are
compromised, public service delivery falters, and fraud and arson, which are often difficult to prove, increase. While the drivers are not necessarily
the same, it is notable that Santam’s Property result also suffered when South Africa went through tough economic times from 2008 to 2009.
This challenge is receiving strategic focus by expanding capacity in the areas of risk management and surveying, implementing premium rate
increases, reducing exposure to certain types of risk, and increasing the level of risk sharing and risk management in collaboration
with clients.
The motor class reported strong underwriting performance in both the intermediated and direct distribution channels. MiWay reported excellent
results following an improvement in the claims ratio to 55.4% (2016: 63.1%) as it was positively impacted by disciplined underwriting. The business
contributed an underwriting profit of R179 million (2016: R72 million).
The engineering class of business achieved good underwriting results with limited claims activity during this period. The liability class was
impacted by a number of large claims, but maintained good underwriting results, although these were lower than the excellent results reported
in 2016. The crop insurance business achieved excellent results of R131 million (2016: R8 million), due to the low incidence of hail-related and
drought claims during this period.
Santam Re delivered satisfactory results on third-party business, despite the impact of the catastrophe events on the South African book of business.
The group entered into a new reinsurance arrangement to provide sideways cover against multiple catastrophe events, which replaced the previous
programme. In terms of the new arrangement, effective from May 2017, all catastrophe events that exceed R10 million (previously R50 million)
and capped at R100 million are aggregated under this agreement. A deductible aggregate of R300 million (previously R100 million) applies. The total
amount that can be claimed is R135 million (previously R100 million). There were no other significant changes to the group’s reinsurance programme.
The net acquisition cost ratio of 27.5% decreased from 28.9% in 2016. The management expense ratio decreased from 16% in 2016 to 15.1% in
2017, after being positively impacted by a continued focus on improved efficiencies, timing differences relating to marketing and IT spend as well
as lower incentive cost due to the reduced underwriting performance in 2017.
Strategic project costs, included as part of management expenses, amounted to 0.8% of net earned premium (2016: 0.6%). These costs mainly relate
to the continued development of a new core underwriting, administration and product management platform for the Santam intermediated business.
The project is progressing according to plan, with the majority of personal lines policies now being managed on the new platform. The migration
process for commercial business products is underway. Santam will maintain its focus on cost efficiencies to improve the management expense ratio
over the medium term.
The net commission ratio was 12.4% (2016: 12.9%), positively impacted by the growth in MiWay, where limited commission expenses are incurred,
as well as lower commission ratios on specialist business lines.
The investment return on insurance funds increased to R296 million (2016: R268 million), supported by higher average insurance funds for the
period, as well as the good investment performance of the investment portfolios backing the insurance funds.
ALTERNATIVE RISK TRANSFER INSURANCE (ART)Alternative risk transfer business consists of the risk finance, affinity, underwriting management and structuring businesses of Centriq Insurance
and the newly acquired Santam Structured Insurance. During March 2017, the Santam group acquired a shareholding of 100%, with an economic
interest of 90%, in RMB Structured Insurance (rebranded as Santam Structured Insurance) for R193 million in cash.
The ART business reported growth of 28% with gross written premium of R1 710 million (2016: R1 334 million). Centriq reported no gross written
premium growth due to refunds of risk finance premiums. This was set off by the acquisition of the Santam Structured Insurance book of business.
The ART business reported acceptable operating results before tax of R35 million (2016: R41 million).
SANLAM EMERGING MARKETS (SEM) GENERAL INSURANCE BUSINESSES (INCLUDING SAHAM FINANCES HELD THROUGH SAN JV)The emerging markets general insurance business portfolio includes investments in the Saham Finances Group in Morocco (with subsidiaries in
26 countries in Africa and the Middle East), Pacific & Orient Insurance Co. Bhd. (P&O) in Malaysia, Shriram General Insurance Company Ltd (SGI)
in India and a further 13 general insurance businesses throughout Africa, excluding South Africa and Namibia, which are held in conjunction
with SEM.
Santam’s share of the gross written premium of these businesses increased by 43% to R1 257 million (2016: R880 million) following the inclusion
of the Saham Finances results for the full six-month period (2016: four months), the additional investment in SGI during the second half of 2016,
and the good growth achieved across the businesses in the portfolio, with the exception of P&O. Saham Finances achieved growth in gross written
premium of 8% on a comparative basis.
FINANCIAL REVIEW

60
Santam’s share of the net insurance result of these businesses increased to R101 million compared to R76 million in 2016. The portfolio
of businesses achieved a net insurance margin of 11.6% compared to the 12.8% reported in 2016. The performance of Saham Finances and SGI
were in line with the business plans; however, P&O continues to experience negative growth in competitive market conditions while maintaining an
acceptable underwriting margin.
The Sanlam Group entered into an agreement in June 2017 to dispose of its various interests in the Enterprise Group in Ghana. In terms of the
co-investment arrangement with SEM, Santam, which has an economic interest of 14% in Enterprise Insurance Company (EIC), will also dispose
of its interest in Enterprise Insurance Company Ltd for R106 million.
Effective 10 May 2017, SEM and Santam, through SAN JV, acquired a further 16.6% interest in Saham Finances via a subscription for new
shares for US$351 million (R4.8 billion). Santam’s share of the purchase price, including transaction costs, was US$11 million (R152 million).
Santam’s ability to participate in the transaction was limited due to the size of the investment already held by Santam in SAN JV. The investment in
SAN JV comprised 20.4% of Santam’s shareholder funds at 30 June 2017 (December 2016: 17.5%) making it the largest strategic investment held
by Santam. Santam’s interest in SAN JV therefore diluted to 15% (previously 25%). The dilution of Santam’s interest in SAN JV did not affect any of
its existing shareholder rights.
INVESTMENT RESULTSListed equities achieved a return of 3.9% for the six months to June 2017, thereby outperforming the SWIX benchmark of 3.3%. The Santam
group’s interest exposure is managed in enhanced cash and active income portfolios. The interest portfolios comfortably exceeded their
STeFI-related benchmarks.
Positive fair value movements (excluding the impact of currency movements) of R104 million (2016: negative movement of R71 million) in Santam’s
interest in SEM’s general insurance businesses in Africa, India and Southeast Asia contributed to the improved investment performance.
Net earnings from associated companies of R54 million increased from the R45 million reported in 2016. SAN JV (Saham Finances) contributed
equity-accounted earnings of R26 million (2016: R29 million).
During June 2017, the company successfully issued additional unsecured subordinated debt to the value of R1 billion in anticipation of the
redemption of the R1 billion subordinated debt issued in 2007, which is callable in September 2017.
PROSPECTSTrading conditions remain very competitive in a low-growth economic environment. Real annual GDP contracted by 0.7% in the first quarter
following a contraction in the economy in the fourth quarter of 2016, which resulted in a technical recession. Inflation (average CPI) of 5.1% was
reported at the end of the second quarter. The repo rate was lowered by 25 basis points in July 2017 following the 75 basis points increase
in 2016. The decrease in the repo rate will marginally impact interest income for the group.
In April 2017, Standard & Poor’s (S&P) decreased Santam’s international counterparty credit and insurance financial strength rating from BBB to
BBB-, in line with their local currency sovereign rating on South Africa (BBB-, negative). On a national scale basis, Santam’s counterparty credit
rating remained unchanged at zaAAA following the recalibration of South Africa’s National scale ratings by S&P on 3 August 2017.
The group’s focus remains on growing profitably in South Africa and to increase its international diversification through the Santam Specialist
Business and Santam Re. International diversification is supported by close collaboration with the SEM general insurance businesses, which
utilises the extensive emerging markets footprint to source new business opportunities. Santam continues to focus strategically on supporting the
development of the SEM general insurance businesses by allocating appropriate technical resources. In South Africa, continued focus is placed on
the development of Santam’s full multichannel capability.
Santam will maintain its focus on cost efficiencies to improve the management expense ratio over the medium term. The investment market is
likely to remain uncertain. Continued high volatility is expected on interest-bearing instruments. The increased exposure to non-rand-denominated
business further increases foreign exchange volatility for the group.
The group economic capital requirement at 30 June 2017, based on the Santam internal model, amounted to R5.9 billion. The normalised
economic capital coverage ratio, assuming a sub-debt of R2 billion, was 151%, which was close to the mid-point of the target range
of 130% to 170%.
We remain committed to efficient capital management.
FINANCIAL REVIEW
61
FINANCIAL REVIEW
EVENTS AFTER THE REPORTING PERIODThe group entered into a zero-cost collar on 31 July 2017 over R1.2 billion of listed equity investments, and locked in an investment return of 10.5%
for the year to date, with further upside participation (excluding dividends) of 2.2%. The structure matures on 21 December 2017.
There have been no other material changes in the affairs or financial position of the company and its subsidiaries since the statement of financial
position date.
DECLARATION OF ORDINARY DIVIDEND (NUMBER 127)Notice is hereby given that the board has declared a gross interim dividend of 336 cents per share (2016: 311 cents per share).
Shareholders are advised that the last day to trade “cum dividend” will be Tuesday, 19 September 2017. The shares will trade “ex dividend” from the
commencement of business on Wednesday, 20 September 2017. The record date will be Friday, 22 September 2017, and the payment date will be
Tuesday, 26 September 2017. Certificated shareholders may not dematerialise or rematerialise their shares between Wednesday, 20 September 2017
and Friday, 22 September 2017, both dates inclusive.
The interim dividend has been declared from income reserves and will be subject to dividends tax. The amount per share, subject to the
withholding of dividends tax at a maximum rate of 20%, is therefore 336 cents per share. A net interim dividend of 268.80 cents per share will apply
to shareholders liable for dividends tax at a rate of 20%, and 336 cents per share for shareholders that qualify for complete exemption therefrom.
The issued ordinary share capital as at 30 August 2017 is 115 131 417 shares. The company’s income tax reference number is 9475/144/71/4.
In terms of the dividends tax legislation, the dividends tax amount due will be withheld and paid over to the South African Revenue Service (SARS)
by a nominee company, stockbroker or Central Security Depository Participant (CSDP) (collectively Regulated Intermediary) on behalf of shareholders.
However, all shareholders should declare their status to their Regulated Intermediary as they may qualify for a reduced dividends tax rate or they
may even be exempt from dividends tax.
APPRECIATIONThe board would like to extend its gratitude to Santam’s management, employees, intermediaries and other business partners for their efforts
and contributions during the period.
PREPARATION AND PRESENTATION OF THE FINANCIAL STATEMENTSThe preparation of the independently reviewed interim financial statements was supervised by the chief financial officer of Santam Ltd,
HD Nel CA(SA).
GG Gelink L LambrechtsChairman Chief executive officer
30 August 2017
62
INDEPENDENT AUDITOR’S REVIEW REPORT
TO THE SHAREHOLDERS OF SANTAM LTDWe have reviewed the condensed consolidated interim financial statements of Santam Ltd in the accompanying interim report, which comprise the
condensed consolidated statement of financial position as at 30 June 2017 and the related condensed consolidated statements of comprehensive
income, changes in equity and cash flows for the six months then ended, and selected explanatory notes.
DIRECTORS’ RESPONSIBILITY FOR THE INTERIM FINANCIAL STATEMENTSThe directors are responsible for the preparation and presentation of these interim financial statements in accordance with the International
Financial Reporting Standard, (IAS) 34 Interim Financial Reporting, the SAICA Financial Reporting Guides as issued by the Accounting Practices
Committee and Financial Pronouncements as issued by the Financial Reporting Standards Council and the requirements of the Companies Act of
South Africa, and for such internal control as the directors determine is necessary to enable the preparation of interim financial statements that
are free from material misstatement, whether due to fraud or error.
AUDITOR’S RESPONSIBILITYOur responsibility is to express a conclusion on these interim financial statements. We conducted our review in accordance with International
Standard on Review Engagements 2410, Review of Interim Financial Information Performed by the Independent Auditor of the Entity. ISRE 2410
requires us to conclude whether anything has come to our attention that causes us to believe that the interim financial statements are not
prepared in all material respects in accordance with the applicable financial reporting framework. This standard also requires us to comply with
relevant ethical requirements.
A review of interim financial statements in accordance with ISRE 2410 is a limited assurance engagement. We perform procedures, primarily
consisting of making inquiries of management and others within the entity, as appropriate, and applying analytical procedures, and evaluate the
evidence obtained.
The procedures in a review are substantially less than and differ in nature from those performed in an audit conducted in accordance with
International Standards on Auditing. Accordingly, we do not express an audit opinion on these interim financial statements.
CONCLUSIONBased on our review, nothing has come to our attention that causes us to believe that the accompanying condensed consolidated interim financial
statements of Santam Ltd for the six months ended 30 June 2017 are not prepared, in all material respects, in accordance with the International
Financial Reporting Standard, (IAS) 34 Interim Financial Reporting, the SAICA Financial Reporting Guides as issued by the Accounting Practices
Committee and Financial Pronouncements as issued by the Financial Reporting Standards Council and the requirements of the Companies Act of
South Africa.
PricewaterhouseCoopers IncDirector: Zuhdi Abrahams
Registered auditor
Cape Town
30 August 2017

63
Reviewed at Reviewed at Audited at
30 June 2017 30 June 2016 31 Dec 2016
Notes R million R million R million
ASSETSNon-current assets
Property and equipment 125 96 106
Intangible assets 860 837 885
Deferred income tax 63 124 105
Investment in associates and joint ventures 1 782 1 702 1 536
Financial assets at fair value through income
Equity securities 6 4 633 2 788 2 581
Debt securities 6 12 796 10 911 10 849
Reinsurance assets 7 279 164 140
Deposit with cell owner 141 231 163
Total non-current assets 20 679 16 853 16 365
Current assetsCell owners’ and policyholders’ interest 8 4 7
Financial assets at fair value through income
Equity securities 6 106 – –
Derivatives 6 6 6 1
Short-term money market instruments 6 2 665 1 981 1 361
Reinsurance assets 7 5 678 3 953 4 349
Deposit with cell owner 48 61 56
Deferred acquisition costs 425 410 469
Loans and receivables including insurance receivables 6 3 997 3 322 3 754
Income tax assets 33 17 19
Cash and cash equivalents 4 118 2 241 2 887
Non-current assets held for sale 8 – 125 8
Total current assets 17 084 12 120 12 911
Total assets 37 763 28 973 29 276
EQUITY AND LIABILITIESCapital and reserves attributable to the company’s equity holders
Share capital 103 103 103
Treasury shares (463) (460) (472)
Other reserves (113) 240 (41)
Distributable reserves 7 374 7 958 7 286
6 901 7 841 6 876
Non-controlling interest 475 461 469
Total equity 7 376 8 302 7 345
Non-current liabilitiesDeferred income tax 229 217 101
Financial liabilities at fair value through income
Debt securities 6 2 021 2 005 2 005
Derivatives 6 – 1 –
Cell owners’ and policyholders’ interest 1 206 1 060 1 153
Insurance liabilities 7 1 701 1 423 1 312
Reinsurance liability relating to cell owners 141 231 163
Total non-current liabilities 5 298 4 937 4 734
Current liabilitiesFinancial liabilities at fair value through income
Debt securities 6 1 047 48 48
Investment contracts 6 1 639 84 101
Derivatives 6 – 9 –Financial liabilities at amortised cost
Collateral guarantee contracts 6 134 104 123
Cell owners’ and policyholders’ interest 1 779 – –
Insurance liabilities 7 15 917 11 577 12 284
Reinsurance liability relating to cell owners 48 61 56
Deferred reinsurance acquisition revenue 214 183 273
Provisions for other liabilities and charges 98 83 71
Trade and other payables including insurance payables 6 4 132 3 407 4 093
Current income tax liabilities 81 178 148
Total current liabilities 25 089 15 734 17 197
Total liabilities 30 387 20 671 21 931
Total shareholders’ equity and liabilities 37 763 28 973 29 276
CONSOLIDATED STATEMENT OF FINANCIAL POSITION
64
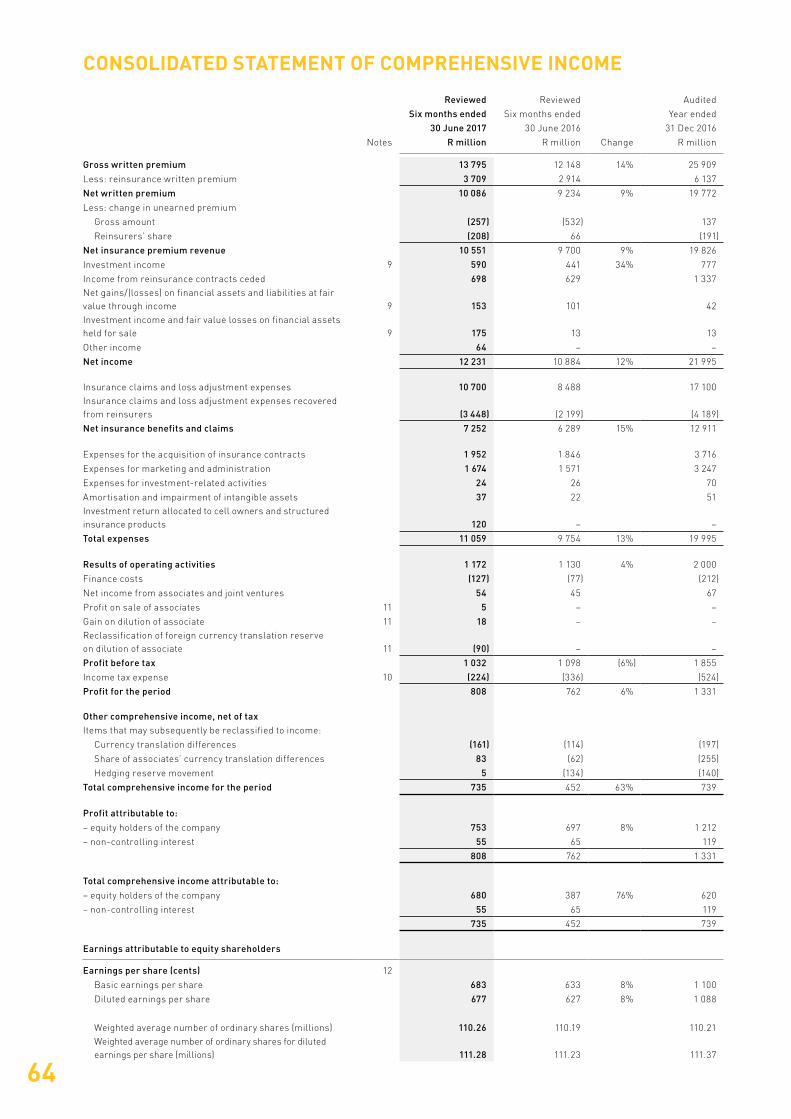
CONSOLIDATED STATEMENT OF COMPREHENSIVE INCOME
Reviewed Reviewed Audited
Six months ended Six months ended Year ended
30 June 2017 30 June 2016 31 Dec 2016
Notes R million R million Change R million
Gross written premium 13 795 12 148 14% 25 909
Less: reinsurance written premium 3 709 2 914 6 137
Net written premium 10 086 9 234 9% 19 772
Less: change in unearned premium
Gross amount (257) (532) 137
Reinsurers’ share (208) 66 (191)
Net insurance premium revenue 10 551 9 700 9% 19 826
Investment income 9 590 441 34% 777
Income from reinsurance contracts ceded 698 629 1 337 Net gains/(losses) on financial assets and liabilities at fair value through income 9 153 101 42 Investment income and fair value losses on financial assets held for sale 9 175 13 13
Other income 64 – –
Net income 12 231 10 884 12% 21 995
Insurance claims and loss adjustment expenses 10 700 8 488 17 100Insurance claims and loss adjustment expenses recovered from reinsurers (3 448) (2 199) (4 189)
Net insurance benefits and claims 7 252 6 289 15% 12 911
Expenses for the acquisition of insurance contracts 1 952 1 846 3 716
Expenses for marketing and administration 1 674 1 571 3 247
Expenses for investment-related activities 24 26 70
Amortisation and impairment of intangible assets 37 22 51Investment return allocated to cell owners and structured insurance products 120 – –
Total expenses 11 059 9 754 13% 19 995
Results of operating activities 1 172 1 130 4% 2 000
Finance costs (127) (77) (212)
Net income from associates and joint ventures 54 45 67
Profit on sale of associates 11 5 – –
Gain on dilution of associate 11 18 – –Reclassification of foreign currency translation reserve on dilution of associate 11 (90) – –
Profit before tax 1 032 1 098 (6%) 1 855
Income tax expense 10 (224) (336) (524)
Profit for the period 808 762 6% 1 331
Other comprehensive income, net of taxItems that may subsequently be reclassified to income:
Currency translation differences (161) (114) (197)
Share of associates’ currency translation differences 83 (62) (255)
Hedging reserve movement 5 (134) (140)
Total comprehensive income for the period 735 452 63% 739
Profit attributable to:– equity holders of the company 753 697 8% 1 212
– non-controlling interest 55 65 119
808 762 1 331
Total comprehensive income attributable to:– equity holders of the company 680 387 76% 620
– non-controlling interest 55 65 119
735 452 739
Earnings attributable to equity shareholders
Earnings per share (cents) 12
Basic earnings per share 683 633 8% 1 100
Diluted earnings per share 677 627 8% 1 088
Weighted average number of ordinary shares (millions) 110.26 110.19 110.21Weighted average number of ordinary shares for diluted earnings per share (millions) 111.28 111.23 111.37
65
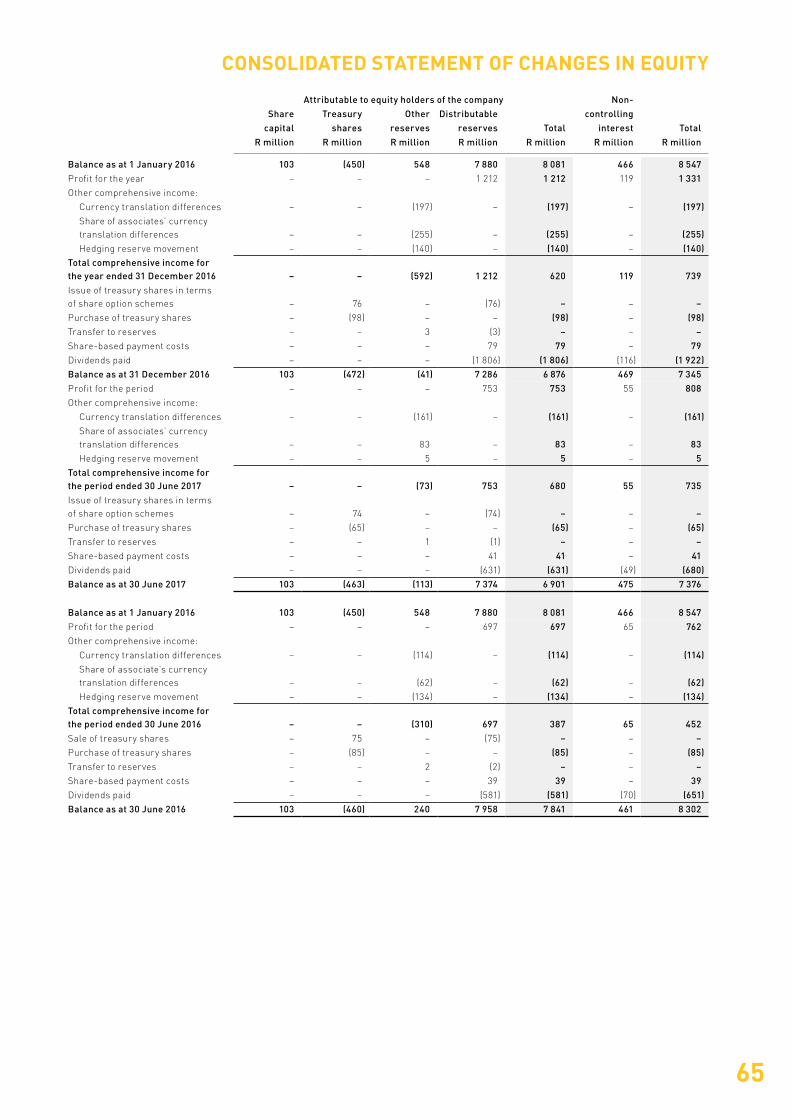
Attributable to equity holders of the company Non-Share Treasury Other Distributable controlling
capital shares reserves reserves Total interest TotalR million R million R million R million R million R million R million
Balance as at 1 January 2016 103 (450) 548 7 880 8 081 466 8 547 Profit for the year – – – 1 212 1 212 119 1 331 Other comprehensive income:
Currency translation differences – – (197) – (197) – (197)Share of associates’ currency translation differences – – (255) – (255) – (255)Hedging reserve movement – – (140) – (140) – (140)
Total comprehensive income for the year ended 31 December 2016 – – (592) 1 212 620 119 739 Issue of treasury shares in terms of share option schemes – 76 – (76) – – – Purchase of treasury shares – (98) – – (98) – (98)Transfer to reserves – – 3 (3) – – – Share-based payment costs – – – 79 79 – 79Dividends paid – – – (1 806) (1 806) (116) (1 922)Balance as at 31 December 2016 103 (472) (41) 7 286 6 876 469 7 345Profit for the period – – – 753 753 55 808Other comprehensive income:
Currency translation differences – – (161) – (161) – (161)Share of associates’ currency translation differences – – 83 – 83 – 83Hedging reserve movement – – 5 – 5 – 5
Total comprehensive income for the period ended 30 June 2017 – – (73) 753 680 55 735 Issue of treasury shares in terms of share option schemes – 74 – (74) – – – Purchase of treasury shares – (65) – – (65) – (65)Transfer to reserves – – 1 (1) – – – Share-based payment costs – – – 41 41 – 41Dividends paid – – – (631) (631) (49) (680)Balance as at 30 June 2017 103 (463) (113) 7 374 6 901 475 7 376
Balance as at 1 January 2016 103 (450) 548 7 880 8 081 466 8 547 Profit for the period – – – 697 697 65 762 Other comprehensive income:
Currency translation differences – – (114) – (114) – (114)Share of associate’s currency translation differences – – (62) – (62) – (62)Hedging reserve movement – – (134) – (134) – (134)
Total comprehensive income for the period ended 30 June 2016 – – (310) 697 387 65 452 Sale of treasury shares – 75 – (75) – – – Purchase of treasury shares – (85) – – (85) – (85)Transfer to reserves – – 2 (2) – – – Share-based payment costs – – – 39 39 – 39 Dividends paid – – – (581) (581) (70) (651)Balance as at 30 June 2016 103 (460) 240 7 958 7 841 461 8 302
CONSOLIDATED STATEMENT OF CHANGES IN EQUITY
66
CONSOLIDATED STATEMENT OF CASH FLOWS
Reviewed Reviewed Audited
Six months ended Six months ended Year ended
30 June 2017 30 June 2016 31 Dec 2016
Notes R million R million R million
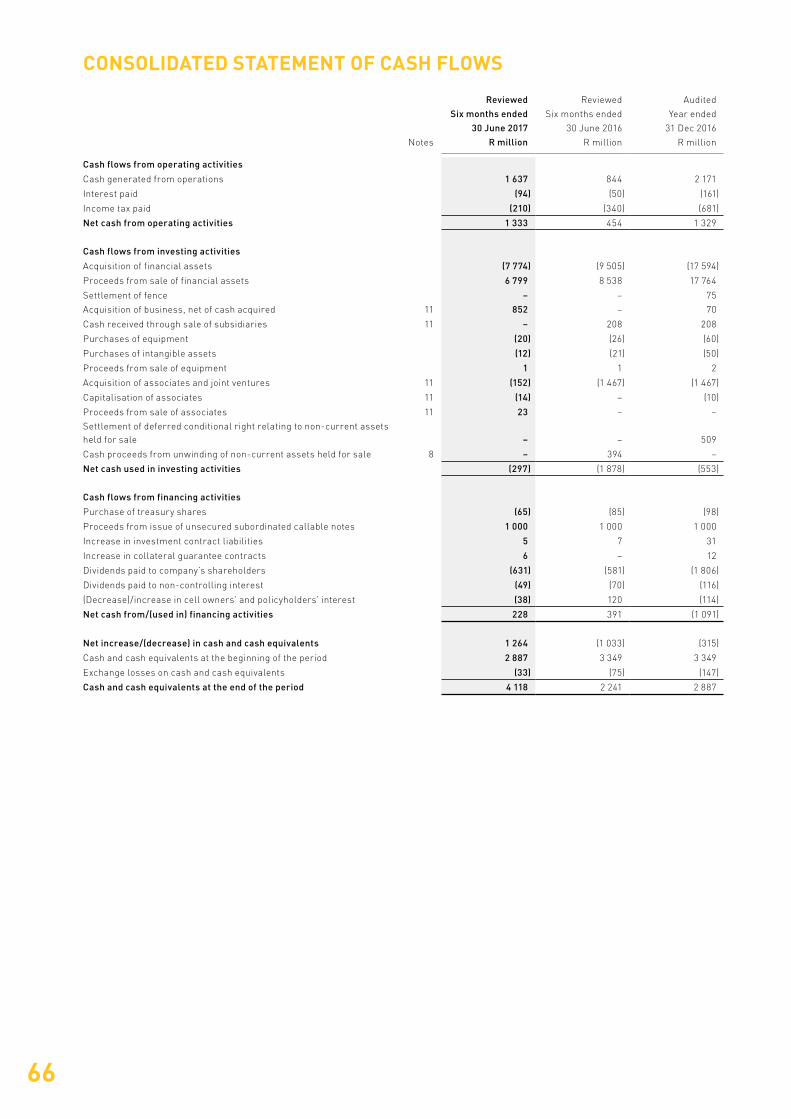
Cash flows from operating activities
Cash generated from operations 1 637 844 2 171
Interest paid (94) (50) (161)
Income tax paid (210) (340) (681)
Net cash from operating activities 1 333 454 1 329
Cash flows from investing activities
Acquisition of financial assets (7 774) (9 505) (17 594)
Proceeds from sale of financial assets 6 799 8 538 17 764
Settlement of fence – – 75
Acquisition of business, net of cash acquired 11 852 – 70
Cash received through sale of subsidiaries 11 – 208 208
Purchases of equipment (20) (26) (60)
Purchases of intangible assets (12) (21) (50)
Proceeds from sale of equipment 1 1 2
Acquisition of associates and joint ventures 11 (152) (1 467) (1 467)
Capitalisation of associates 11 (14) – (10)
Proceeds from sale of associates 11 23 – –
Settlement of deferred conditional right relating to non-current assets held for sale – – 509
Cash proceeds from unwinding of non-current assets held for sale 8 – 394 –
Net cash used in investing activities (297) (1 878) (553)
Cash flows from financing activities
Purchase of treasury shares (65) (85) (98)
Proceeds from issue of unsecured subordinated callable notes 1 000 1 000 1 000
Increase in investment contract liabilities 5 7 31
Increase in collateral guarantee contracts 6 – 12
Dividends paid to company’s shareholders (631) (581) (1 806)
Dividends paid to non-controlling interest (49) (70) (116)
(Decrease)/increase in cell owners’ and policyholders’ interest (38) 120 (114)
Net cash from/(used in) financing activities 228 391 (1 091)
Net increase/(decrease) in cash and cash equivalents 1 264 (1 033) (315)
Cash and cash equivalents at the beginning of the period 2 887 3 349 3 349
Exchange losses on cash and cash equivalents (33) (75) (147)
Cash and cash equivalents at the end of the period 4 118 2 241 2 887
67
NOTES TO THE INTERIM FINANCIAL STATEMENTS
1. Basis of preparationThe condensed consolidated interim financial statements are prepared in accordance with International Financial Reporting Standards, IAS 34 – Interim Financial Reporting, the SAICA Financial Reporting Guides as issued by the Accounting Practices Committee and Financial Pronouncements as issued by the Financial Reporting Standards Council and the requirements of the Companies Act of South Africa.
2. Accounting policiesThe accounting policies applied in the preparation of the condensed consolidated interim financial statements are in terms of IFRS and are consistent with those accounting policies applied in the preparation of the previous consolidated annual financial statements, except for:
The following new IFRSs and/or IFRICs were effective for the first time from 1 January 2017: – Amendment to IAS 7 – Statement of Cash Flows – Amendment to IAS 12 – Income Taxes
There was no material impact on the condensed consolidated interim financial statements identified.
Of the standards that are not yet effective, management expects IFRS 9 and IFRS 17 to have an impact on the group. IFRS 9 addresses classification and measurement of financial assets and replaces the multiple classification and measurement models in IAS 39 with a single model that has only two classification categories: amortised cost and fair value. Based on management’s current assessment, the impact is not expected to be material.
IFRS 17 establishes the principles for the recognition, measurement, presentation and disclosure of insurance contracts within the scope of the standard. IFRS 17 was issued in May 2017 and applies to annual reporting periods beginning on or after 1 January 2021. Management is currently busy with a detailed assessment of the impact of this standard.
3. EstimatesThe preparation of condensed consolidated interim financial statements requires management to make judgements, estimates and assumptions that affect the application of accounting policies and the reported amounts of assets and liabilities, income and expenses. Actual results may differ from these estimates.
In preparing these condensed consolidated interim financial statements, the significant judgements made by management in applying the group’s accounting policies and the key sources of estimation uncertainty are the same as those that applied to the consolidated annual financial statements for the year ended 31 December 2016.
4. Risk managementThe group’s activities expose it to a variety of financial risks: market risk (including price risk, interest rate risk, foreign currency risk and derivatives risk), credit risk and liquidity risk. Insurance activities expose the group to insurance risk (including pricing risk, reserving risk, accumulation risk and reinsurance risk). The group is also exposed to operational risk and legal risk.
The capital risk management philosophy is to maximise the return on shareholders’ capital within an appropriate risk framework.
The condensed consolidated interim financial statements do not include all risk management information and disclosure required in the annual financial statements and should be read in conjunction with the group’s annual financial statements as at 31 December 2016.
There have been no material changes in the risk management policies since 31 December 2016.
68
NOTES TO THE INTERIM FINANCIAL STATEMENTS
5. Segment informationOperating segments are reported in a manner consistent with the internal reporting provided to the chief operating decision-maker. The chief operating decision-maker, who is responsible for allocating resources and assessing performance of the operating segments, has been identified as the chief executive officer, supported by the group executive committee.
The group conducts mainly insurance and investment activities.
Insurance activities: The group has revised the presentation of its insurance results in the following segments:
– Conventional insurance business written on insurance licences controlled by the group. – Alternative risk transfer insurance business written on insurance licences controlled by the group. – Santam’s share of the insurance results of the Sanlam Emerging Markets general insurance businesses, including SAN JV (Saham Finances).
It is further analysed by insurance class. Operating segments are aggregated based on quantitative and/or qualitative significance. The performance of insurance activities is based on gross written premium as a measure of growth, with net underwriting result as measure of profitability.
As noted above, the presentation of insurance activities has been enhanced subsequent to the acquisition of SSI (refer to note 11). The comparative information has been restated to provide the information in the same enhanced format.
Investment activities:Investment activities are all investment-related activities undertaken by the group. Due to the nature of the activities conducted, investment activities are considered to be one operating segment. Investment activities are measured based on net investment income.
Growth is measured for strategic investments based on the gross written premium generated by the underlying businesses. The underwriting and investment return on insurance funds are provided for each of the underlying components included in the insurance segment for consideration by the chief operating decision-maker. With regard to the SEM and SAN JV (Saham Finances) insurance business, this information is considered to be a reallocation of fair value movements recognised on the SEM target shares as well as equity-accounted earnings on the investments in associates and joint ventures. It is also included as reconciling items in order to reconcile to the consolidated statement of comprehensive income. Overall profitability is measured based on net investment income and fair value movements from SEM target share investments and net income from associates and joint ventures.
Given the nature of the operations, there is no single external client that provides 10% or more of the group’s revenues.
The investment return on insurance funds is calculated based on the day-weighted effective return realised by the group on the assets held to cover the group’s net insurance working capital requirements.
Insurance business denominated in foreign currencies is covered by foreign denominated bank accounts and investment portfolios. Foreign exchange movements on underwriting activities are therefore offset against the foreign exchange movements recognised on the bank accounts and investment portfolios.
The Santam BEE transaction costs are unrelated to the core underwriting and investment performance of the group. Therefore, these costs are disclosed as unallocated activities.
Santam Ltd is domiciled in South Africa. Geographical analysis of the gross written premium and non-current assets and liabilities is based on the countries in which the business is underwritten or managed. Non-current assets comprise goodwill and intangible assets, property and equipment, investments in associates and joint ventures and SEM target shares (included in financial assets).
69
NOTES TO THE INTERIM FINANCIAL STATEMENTS
Business activity (continued)
Investment TotalReconciling
and unallocatedIFRSTotal
R million R million R million R million
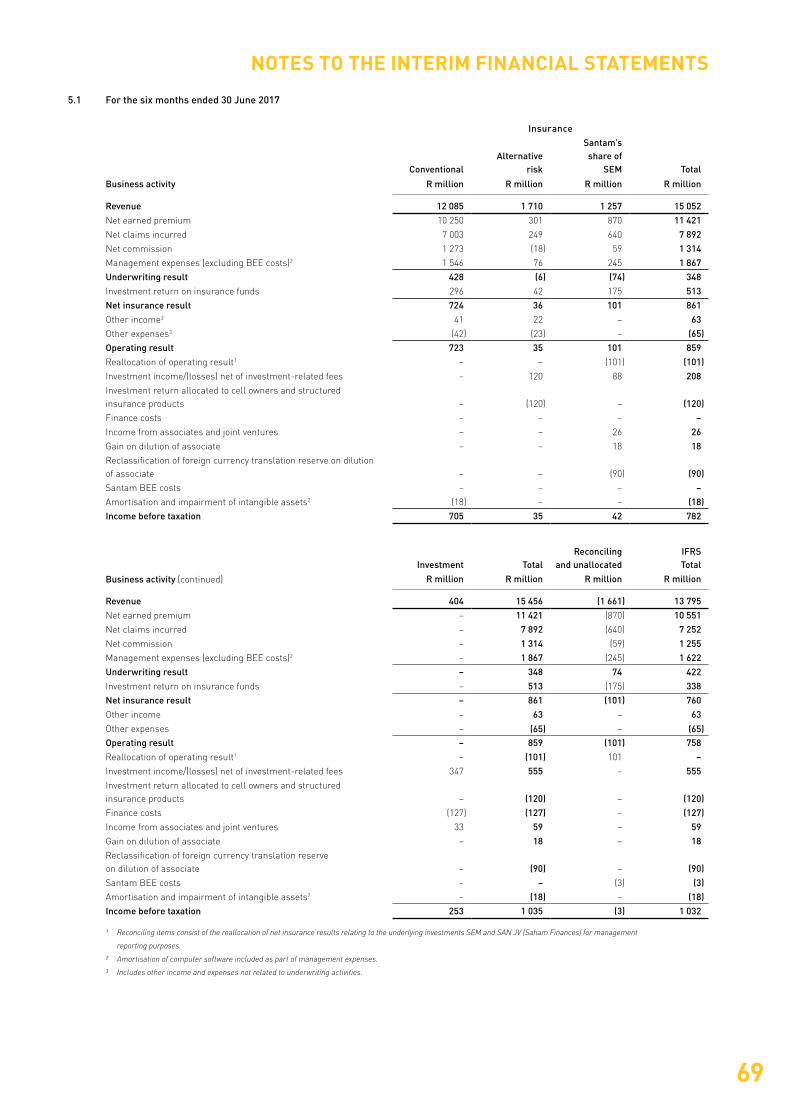
Revenue 404 15 456 (1 661) 13 795 Net earned premium – 11 421 (870) 10 551 Net claims incurred – 7 892 (640) 7 252 Net commission – 1 314 (59) 1 255 Management expenses (excluding BEE costs)2 – 1 867 (245) 1 622Underwriting result – 348 74 422Investment return on insurance funds – 513 (175) 338Net insurance result – 861 (101) 760Other income – 63 – 63Other expenses – (65) – (65)Operating result – 859 (101) 758Reallocation of operating result1 – (101) 101 –Investment income/(losses) net of investment-related fees 347 555 – 555Investment return allocated to cell owners and structured insurance products – (120) – (120)Finance costs (127) (127) – (127)Income from associates and joint ventures 33 59 – 59Gain on dilution of associate – 18 – 18Reclassification of foreign currency translation reserve on dilution of associate – (90) – (90)Santam BEE costs – – (3) (3)Amortisation and impairment of intangible assets2 – (18) – (18)Income before taxation 253 1 035 (3) 1 032
1 Reconciling items consist of the reallocation of net insurance results relating to the underlying investments SEM and SAN JV (Saham Finances) for management
reporting purposes.
2 Amortisation of computer software included as part of management expenses.
3 Includes other income and expenses not related to underwriting activities.
5.1 For the six months ended 30 June 2017
Insurance
Business activity
ConventionalAlternative
risk
Santam’sshare of
SEM Total
R million R million R million R million
Revenue 12 085 1 710 1 257 15 052 Net earned premium 10 250 301 870 11 421 Net claims incurred 7 003 249 640 7 892 Net commission 1 273 (18) 59 1 314 Management expenses (excluding BEE costs)2 1 546 76 245 1 867Underwriting result 428 (6) (74) 348Investment return on insurance funds 296 42 175 513Net insurance result 724 36 101 861Other income3 41 22 – 63Other expenses3 (42) (23) – (65)Operating result 723 35 101 859Reallocation of operating result1 – – (101) (101)Investment income/(losses) net of investment-related fees – 120 88 208Investment return allocated to cell owners and structured insurance products – (120) – (120)Finance costs – – – – Income from associates and joint ventures – – 26 26Gain on dilution of associate – – 18 18Reclassification of foreign currency translation reserve on dilution of associate – – (90) (90)Santam BEE costs – – – – Amortisation and impairment of intangible assets2 (18) – – (18)Income before taxation 705 35 42 782
70
NOTES TO THE INTERIM FINANCIAL STATEMENTS
5. Segment information (continued)
5.1 For the six months ended 30 June 2017 (continued)
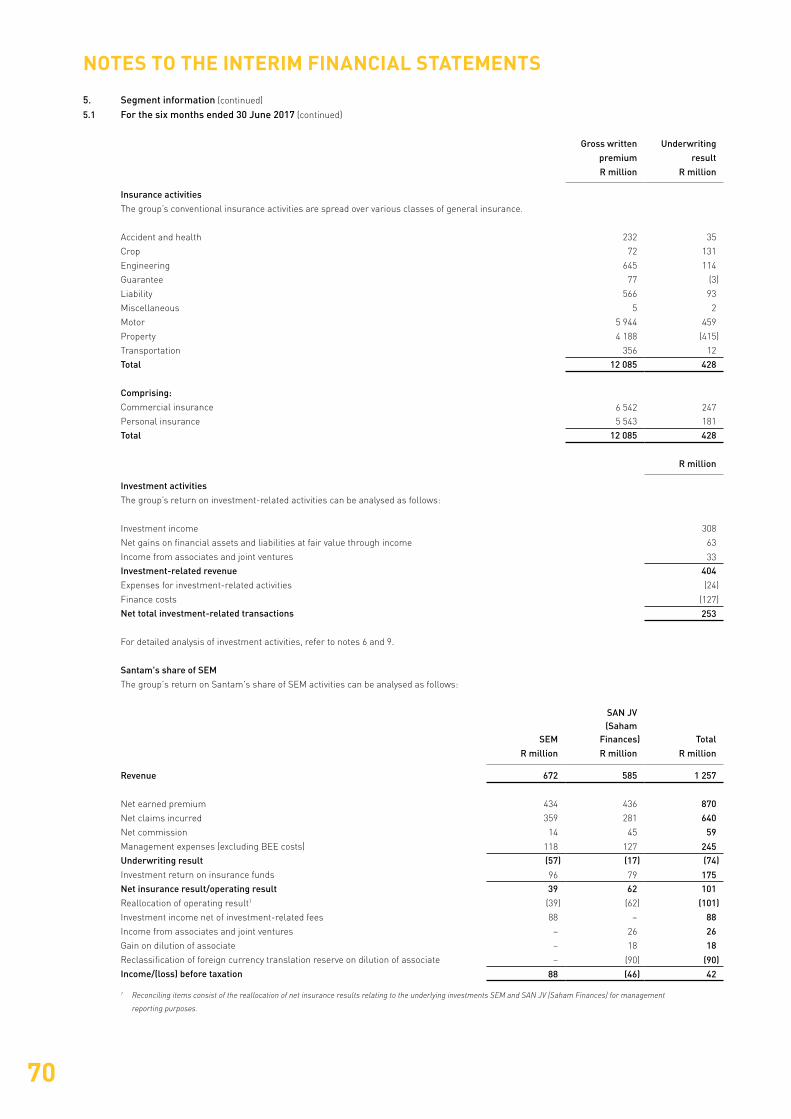
Gross written Underwriting premium result R million R million
Insurance activitiesThe group’s conventional insurance activities are spread over various classes of general insurance.
Accident and health 232 35
Crop 72 131
Engineering 645 114
Guarantee 77 (3)
Liability 566 93
Miscellaneous 5 2
Motor 5 944 459
Property 4 188 (415)
Transportation 356 12
Total 12 085 428
Comprising:Commercial insurance 6 542 247Personal insurance 5 543 181
Total 12 085 428
R million
Investment activitiesThe group’s return on investment-related activities can be analysed as follows:
Investment income 308
Net gains on financial assets and liabilities at fair value through income 63
Income from associates and joint ventures 33Investment-related revenue 404Expenses for investment-related activities (24)
Finance costs (127)Net total investment-related transactions 253
For detailed analysis of investment activities, refer to notes 6 and 9.
Santam's share of SEMThe group's return on Santam's share of SEM activities can be analysed as follows:
SEM
SAN JV (Saham
Finances) Total R million R million R million
Revenue 672 585 1 257
Net earned premium 434 436 870 Net claims incurred 359 281 640 Net commission 14 45 59 Management expenses (excluding BEE costs) 118 127 245 Underwriting result (57) (17) (74)Investment return on insurance funds 96 79 175 Net insurance result/operating result 39 62 101 Reallocation of operating result1 (39) (62) (101)Investment income net of investment-related fees 88 – 88 Income from associates and joint ventures – 26 26 Gain on dilution of associate – 18 18 Reclassification of foreign currency translation reserve on dilution of associate – (90) (90)Income/(loss) before taxation 88 (46) 42
1 Reconciling items consist of the reallocation of net insurance results relating to the underlying investments SEM and SAN JV (Saham Finances) for management
reporting purposes.
71
NOTES TO THE INTERIM FINANCIAL STATEMENTS
Business activity (continued)
Investment TotalReconciling
and unallocated Total
R million R million R million R million
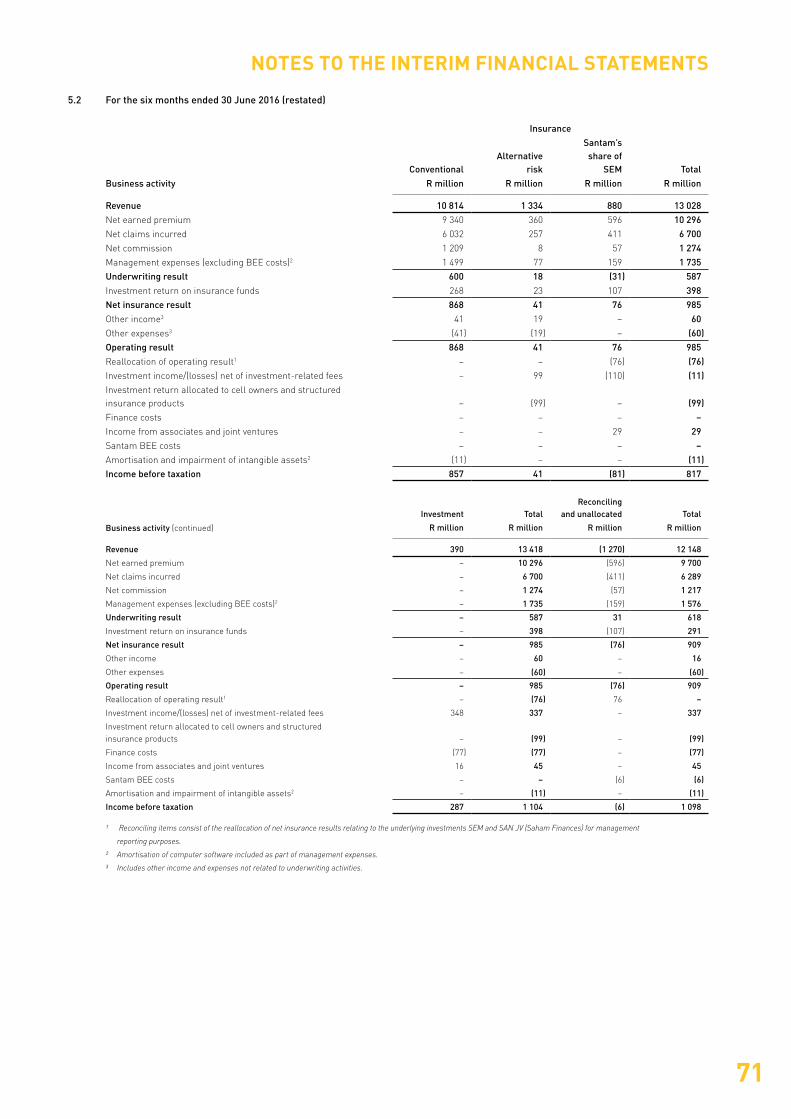
Revenue 390 13 418 (1 270) 12 148
Net earned premium – 10 296 (596) 9 700
Net claims incurred – 6 700 (411) 6 289
Net commission – 1 274 (57) 1 217
Management expenses (excluding BEE costs)2 – 1 735 (159) 1 576
Underwriting result – 587 31 618
Investment return on insurance funds – 398 (107) 291
Net insurance result – 985 (76) 909
Other income – 60 – 16
Other expenses – (60) – (60)
Operating result – 985 (76) 909
Reallocation of operating result1 – (76) 76 –
Investment income/(losses) net of investment-related fees 348 337 – 337
Investment return allocated to cell owners and structured insurance products – (99) – (99)
Finance costs (77) (77) – (77)
Income from associates and joint ventures 16 45 – 45
Santam BEE costs – – (6) (6)
Amortisation and impairment of intangible assets2 – (11) – (11)
Income before taxation 287 1 104 (6) 1 098
1 Reconciling items consist of the reallocation of net insurance results relating to the underlying investments SEM and SAN JV (Saham Finances) for management
reporting purposes.
2 Amortisation of computer software included as part of management expenses.
3 Includes other income and expenses not related to underwriting activities.
5.2 For the six months ended 30 June 2016 (restated)
Insurance
Business activityConventional
Alternativerisk
Santam’s share of
SEM TotalR million R million R million R million
Revenue 10 814 1 334 880 13 028 Net earned premium 9 340 360 596 10 296 Net claims incurred 6 032 257 411 6 700 Net commission 1 209 8 57 1 274 Management expenses (excluding BEE costs)2 1 499 77 159 1 735Underwriting result 600 18 (31) 587 Investment return on insurance funds 268 23 107 398Net insurance result 868 41 76 985Other income3 41 19 – 60Other expenses3 (41) (19) – (60)Operating result 868 41 76 985Reallocation of operating result1 – – (76) (76)Investment income/(losses) net of investment-related fees – 99 (110) (11) Investment return allocated to cell owners and structured insurance products – (99) – (99)Finance costs – – – – Income from associates and joint ventures – – 29 29Santam BEE costs – – – – Amortisation and impairment of intangible assets2 (11) – – (11)Income before taxation 857 41 (81) 817

72
NOTES TO THE INTERIM FINANCIAL STATEMENTS
5. Segment information (continued)
5.2 For the six months ended 30 June 2016 (restated) (continued)
Gross writtenpremiumR million
Underwriting result
R million
Insurance activitiesThe group’s conventional insurance activities are spread over various classes of general insurance.
Accident and health 164 2
Crop 108 8
Engineering 579 81
Guarantee 32 (5)
Liability 489 172
Miscellaneous 22 3
Motor 5 315 300
Property 3 772 18
Transportation 333 21
Total 10 814 600
Comprising:Commercial insurance 5 853 344
Personal insurance 4 961 256
Total 10 814 600
R million
Investment activitiesThe group’s return on investment-related activities can be analysed as follows:
Investment income 150
Net gains on financial assets and liabilities at fair value through income 224
Income from associates and joint ventures 16
Investment-related revenue 390 Expenses for investment-related activities (26)
Finance costs (77)
Net total investment-related transactions 287
For detailed analysis of investment activities, refer to notes 6 and 9.
Santam's share of SEMThe group's return on Santam's share of SEM activities can be analysed as follows:
SEM
SAN JV (Saham
Finances) Total R million R million R million
Revenue 489 391 880
Net earned premium 296 300 596 Net claims incurred 212 199 411 Net commission 22 35 57 Management expenses (excluding BEE costs) 83 76 159 Underwriting result (21) (10) (31)Investment return on insurance funds 42 65 107Net insurance result/operating results 21 55 76Reallocation of operating result1 (21) (55) (76)Investment loss net of investment-related fees (110) – (110)Income from associates and joint ventures – 29 29 (Loss)/income before taxation (110) 29 (81)
1 Reconciling items consist of the reallocation of net insurance results relating to the underlying investments SEM and SAN JV (Saham Finances) for management
reporting purposes.
73
NOTES TO THE INTERIM FINANCIAL STATEMENTS
Business activity (continued)
Investment TotalReconciling
and unallocatedIFRSTotal
R million R million R million R million
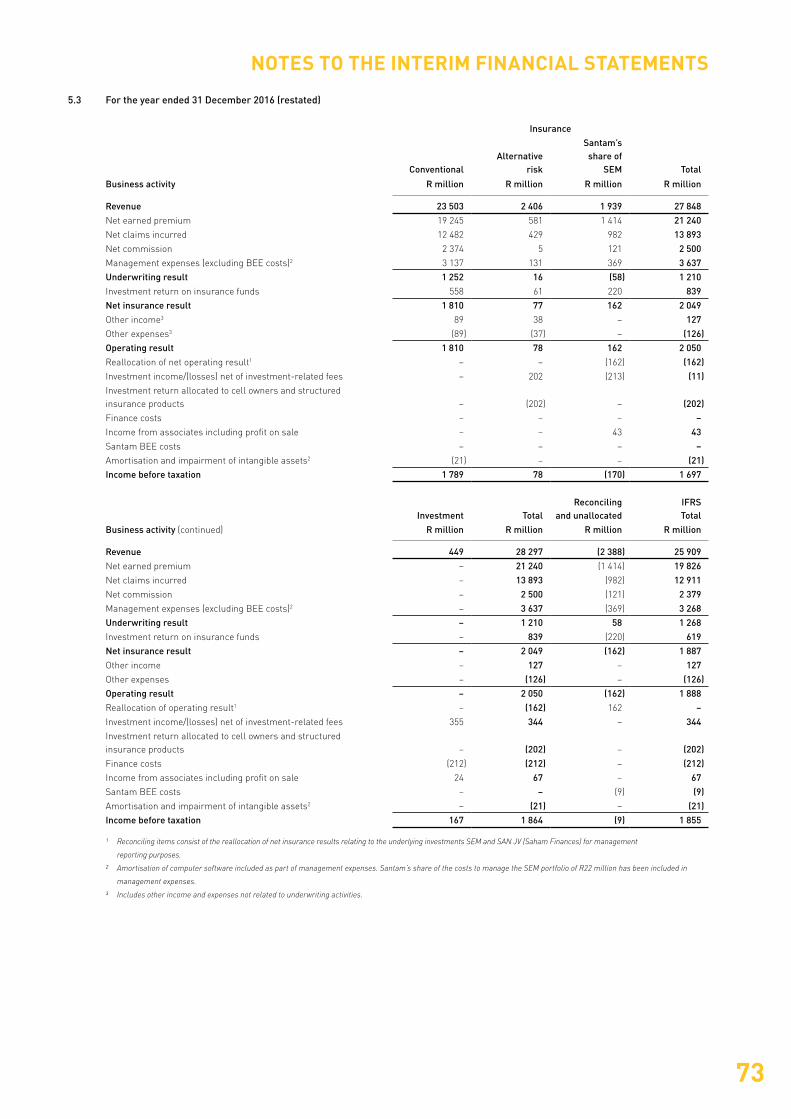
Revenue 449 28 297 (2 388) 25 909 Net earned premium – 21 240 (1 414) 19 826 Net claims incurred – 13 893 (982) 12 911 Net commission – 2 500 (121) 2 379 Management expenses (excluding BEE costs)2 – 3 637 (369) 3 268 Underwriting result – 1 210 58 1 268 Investment return on insurance funds – 839 (220) 619 Net insurance result – 2 049 (162) 1 887 Other income – 127 – 127Other expenses – (126) – (126)Operating result – 2 050 (162) 1 888 Reallocation of operating result1 – (162) 162 – Investment income/(losses) net of investment-related fees 355 344 – 344 Investment return allocated to cell owners and structured insurance products – (202) – (202)Finance costs (212) (212) – (212)Income from associates including profit on sale 24 67 – 67 Santam BEE costs – – (9) (9)Amortisation and impairment of intangible assets2 – (21) – (21)Income before taxation 167 1 864 (9) 1 855
1 Reconciling items consist of the reallocation of net insurance results relating to the underlying investments SEM and SAN JV (Saham Finances) for management
reporting purposes.
2 Amortisation of computer software included as part of management expenses. Santam’s share of the costs to manage the SEM portfolio of R22 million has been included in
management expenses.
3 Includes other income and expenses not related to underwriting activities.
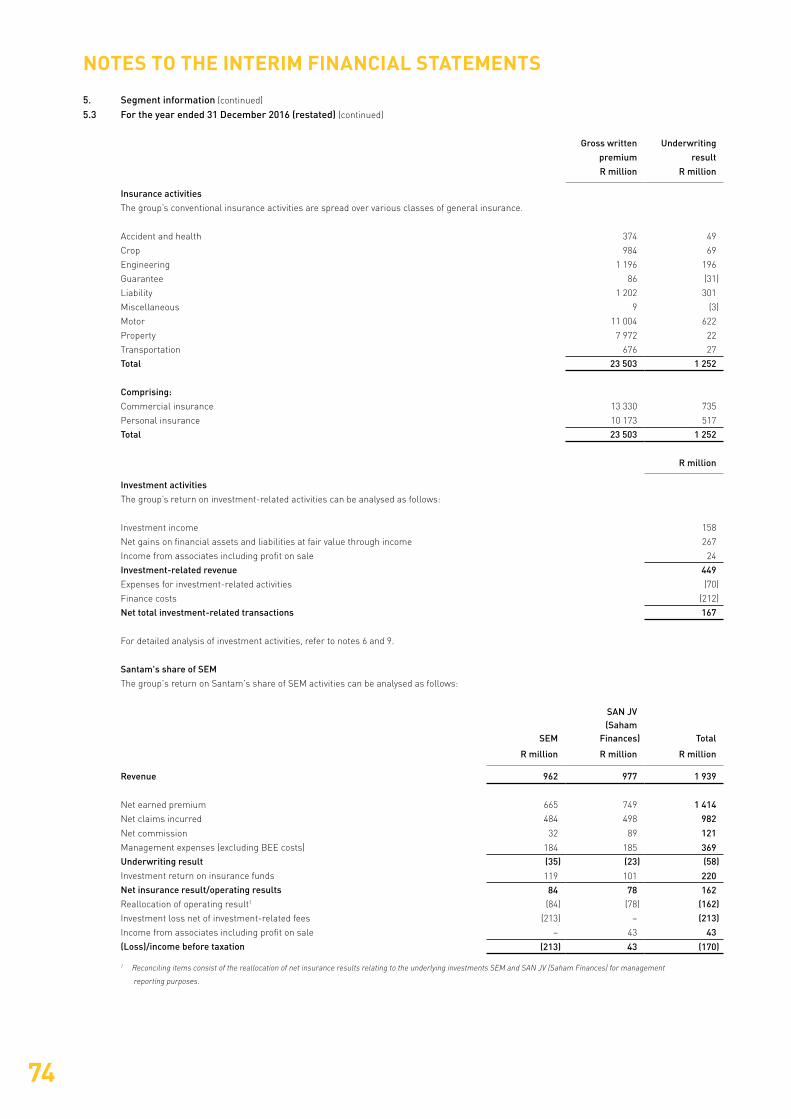
5.3 For the year ended 31 December 2016 (restated)
Insurance
Business activity
ConventionalAlternative
risk
Santam’s share of
SEM Total
R million R million R million R million
Revenue 23 503 2 406 1 939 27 848 Net earned premium 19 245 581 1 414 21 240 Net claims incurred 12 482 429 982 13 893 Net commission 2 374 5 121 2 500 Management expenses (excluding BEE costs)2 3 137 131 369 3 637 Underwriting result 1 252 16 (58) 1 210 Investment return on insurance funds 558 61 220 839Net insurance result 1 810 77 162 2 049 Other income3 89 38 – 127 Other expenses3 (89) (37) – (126)Operating result 1 810 78 162 2 050 Reallocation of net operating result1 – – (162) (162)Investment income/(losses) net of investment-related fees – 202 (213) (11)Investment return allocated to cell owners and structured insurance products – (202) – (202)Finance costs – – – – Income from associates including profit on sale – – 43 43Santam BEE costs – – – – Amortisation and impairment of intangible assets2 (21) – – (21)Income before taxation 1 789 78 (170) 1 697
74
NOTES TO THE INTERIM FINANCIAL STATEMENTS
5. Segment information (continued)
5.3 For the year ended 31 December 2016 (restated) (continued)
Gross written Underwriting premium result R million R million
Insurance activitiesThe group’s conventional insurance activities are spread over various classes of general insurance.
Accident and health 374 49
Crop 984 69
Engineering 1 196 196
Guarantee 86 (31)
Liability 1 202 301
Miscellaneous 9 (3)
Motor 11 004 622
Property 7 972 22
Transportation 676 27
Total 23 503 1 252
Comprising:Commercial insurance 13 330 735
Personal insurance 10 173 517
Total 23 503 1 252
R million
Investment activitiesThe group’s return on investment-related activities can be analysed as follows:
Investment income 158
Net gains on financial assets and liabilities at fair value through income 267
Income from associates including profit on sale 24
Investment-related revenue 449Expenses for investment-related activities (70)
Finance costs (212)
Net total investment-related transactions 167
For detailed analysis of investment activities, refer to notes 6 and 9.
Santam's share of SEMThe group's return on Santam's share of SEM activities can be analysed as follows:
SEM
SAN JV (Saham
Finances) Total
R million R million R million
Revenue 962 977 1 939
Net earned premium 665 749 1 414 Net claims incurred 484 498 982
Net commission 32 89 121 Management expenses (excluding BEE costs) 184 185 369 Underwriting result (35) (23) (58)Investment return on insurance funds 119 101 220Net insurance result/operating results 84 78 162Reallocation of operating result1 (84) (78) (162)Investment loss net of investment-related fees (213) – (213)Income from associates including profit on sale – 43 43 (Loss)/income before taxation (213) 43 (170)
1 Reconciling items consist of the reallocation of net insurance results relating to the underlying investments SEM and SAN JV (Saham Finances) for management
reporting purposes.
75
NOTES TO THE INTERIM FINANCIAL STATEMENTS
Reviewed at Reviewed at Audited at
30 June 2017 30 June 2016 31 Dec 2016
R million R million R million
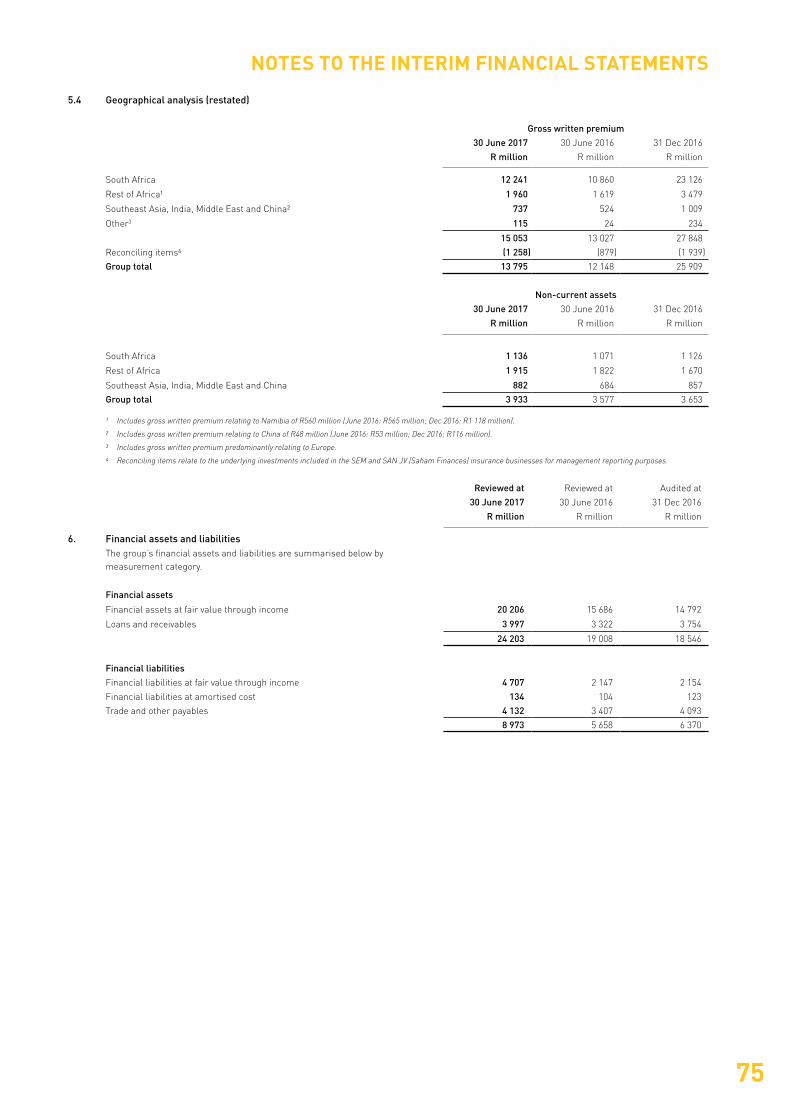
6. Financial assets and liabilitiesThe group’s financial assets and liabilities are summarised below by measurement category.
Financial assets
Financial assets at fair value through income 20 206 15 686 14 792
Loans and receivables 3 997 3 322 3 754
24 203 19 008 18 546
Financial liabilities Financial liabilities at fair value through income 4 707 2 147 2 154
Financial liabilities at amortised cost 134 104 123
Trade and other payables 4 132 3 407 4 093
8 973 5 658 6 370
5.4 Geographical analysis (restated)
Gross written premium 30 June 2017 30 June 2016 31 Dec 2016
R million R million R million
South Africa 12 241 10 860 23 126
Rest of Africa1 1 960 1 619 3 479
Southeast Asia, India, Middle East and China2 737 524 1 009
Other3 115 24 234
15 053 13 027 27 848
Reconciling items4 (1 258) (879) (1 939)
Group total 13 795 12 148 25 909
Non-current assets 30 June 2017 30 June 2016 31 Dec 2016
R million R million R million
South Africa 1 136 1 071 1 126
Rest of Africa 1 915 1 822 1 670
Southeast Asia, India, Middle East and China 882 684 857
Group total 3 933 3 577 3 653
1 Includes gross written premium relating to Namibia of R560 million (June 2016: R565 million; Dec 2016: R1 118 million).
2 Includes gross written premium relating to China of R48 million (June 2016: R53 million; Dec 2016: R116 million).
3 Includes gross written premium predominantly relating to Europe.
4 Reconciling items relate to the underlying investments included in the SEM and SAN JV (Saham Finances) insurance businesses for management reporting purposes.

76
NOTES TO THE INTERIM FINANCIAL STATEMENTS
6. Financial assets and liabilities (continued)
Financial instruments measured at fair value on a recurring basisThe table below analyses financial instruments, carried at fair value through income, by valuation method. There were no significant changes in the valuation methods applied since 31 December 2016. The different levels have been defined as follows:
– Level 1: Quoted prices (unadjusted) in active markets for identical assets or liabilities. – Level 2: Input other than quoted prices included within level 1 that is observable for the asset or liability, either directly (that is, prices),
or indirectly (that is, derived from prices). Listed bonds that did not trade actively during a financial period are classified as level 2 financial instruments. The fair value of level 2 instruments is predominantly determined using discounted cash flow models based on market observable input.
– Level 3: Input for the asset or liability that is not based on observable data (that is, unobservable input).
All government and corporate bonds were transferred from level 1 to level 2 during the second half of 2016 based on management's assessment of an active market for debt instruments. There were no significant transfers between level 1 and level 2 during the current period.
All derivative instruments are classified as investments held for trading. The rest of the investment portfolio is designated as financial assets at fair value through income based on the principle that the entire portfolio is managed on a fair value basis and reported as such to the investment committee.
30 June 2017 Level 1 Level 2 Level 3 TotalFinancial assets at fair value through income R million R million R million R million
Equity securities
Quoted
Listed 2 830 – – 2 830 Unitised funds – 632 – 632 Irredeemable preference shares 6 – – 6
Unquoted – – 1 271 1 271Total equity securities 2 836 632 1 271 4 739Debt securities
Quoted
Government and other bonds – 3 453 – 3 453 Collateralised securities – 449 – 449 Unit-linked investments – 593 – 593 Money market instruments more than one year – 2 696 – 2 696 Equity-linked notes – 246 – 246
Unquoted
Government and other bonds – 251 – 251 Collateralised securities – 526 – 526 Money market instruments more than one year – 4 372 – 4 372 Redeemable preference shares – 185 25 210
Total debt securities – 12 771 25 12 796 Derivative instruments
Exchange traded futures – 6 – 6 Interest rate swaps1 – – – –
Total derivative instruments – 6 – 6 Short-term money market instruments – 2 665 – 2 665 Total financial assets at fair value through income 2 836 16 074 1 296 20 206
1 Carrying value as at 30 June 2017 is less than R1 million.
Financial liabilities at fair value through income
Debt securities – 3 068 – 3 068 Investment contracts – 1 639 – 1 639Total financial liabilities at fair value through income – 4 707 – 4 707
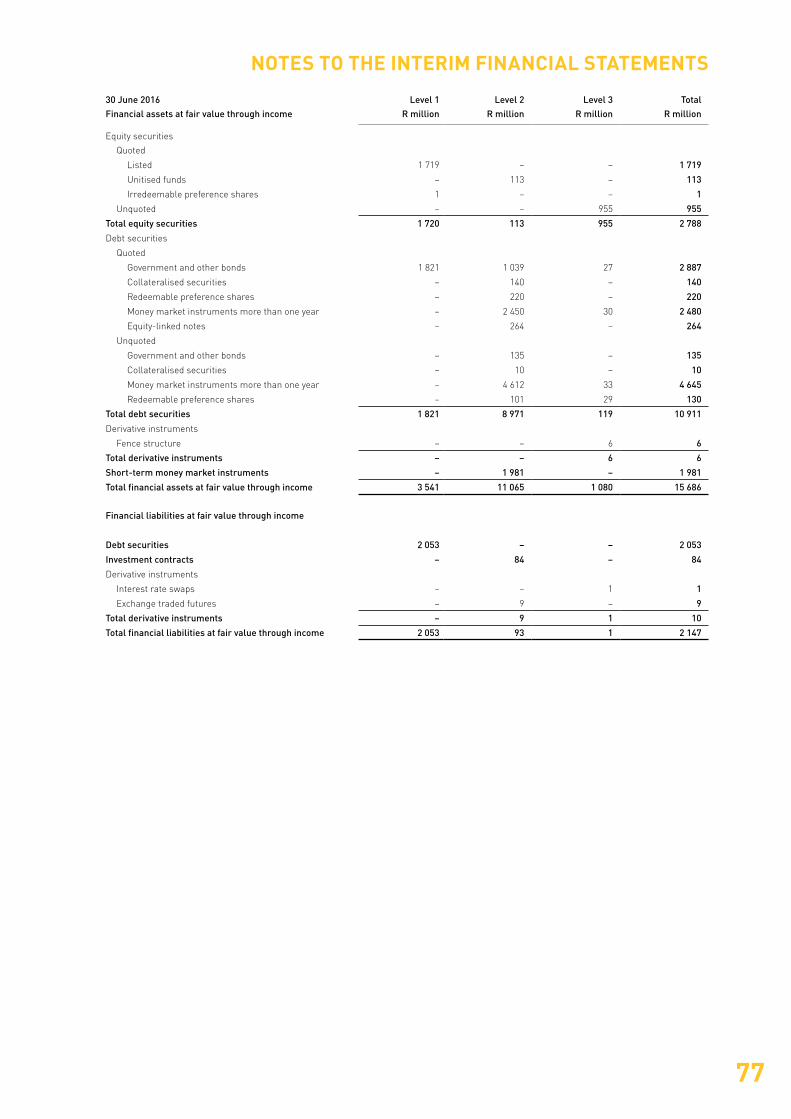
77
NOTES TO THE INTERIM FINANCIAL STATEMENTS
30 June 2016 Level 1 Level 2 Level 3 TotalFinancial assets at fair value through income R million R million R million R million
Equity securities
Quoted
Listed 1 719 – – 1 719
Unitised funds – 113 – 113
Irredeemable preference shares 1 – – 1
Unquoted – – 955 955
Total equity securities 1 720 113 955 2 788
Debt securities
Quoted
Government and other bonds 1 821 1 039 27 2 887
Collateralised securities – 140 – 140
Redeemable preference shares – 220 – 220
Money market instruments more than one year – 2 450 30 2 480
Equity-linked notes – 264 – 264
Unquoted
Government and other bonds – 135 – 135
Collateralised securities – 10 – 10
Money market instruments more than one year – 4 612 33 4 645
Redeemable preference shares – 101 29 130
Total debt securities 1 821 8 971 119 10 911
Derivative instruments
Fence structure – – 6 6
Total derivative instruments – – 6 6
Short-term money market instruments – 1 981 – 1 981
Total financial assets at fair value through income 3 541 11 065 1 080 15 686
Financial liabilities at fair value through income
Debt securities 2 053 – – 2 053
Investment contracts – 84 – 84
Derivative instruments
Interest rate swaps – – 1 1
Exchange traded futures – 9 – 9
Total derivative instruments – 9 1 10
Total financial liabilities at fair value through income 2 053 93 1 2 147
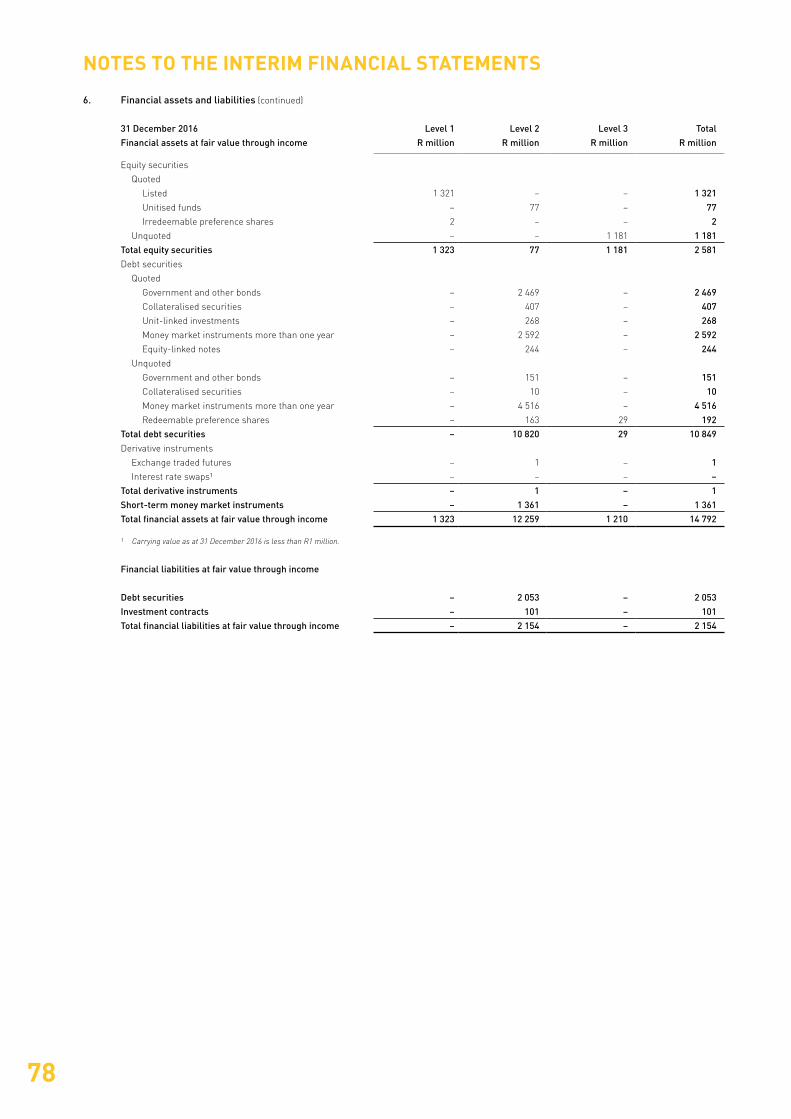
78
6. Financial assets and liabilities (continued)
31 December 2016 Level 1 Level 2 Level 3 TotalFinancial assets at fair value through income R million R million R million R million
Equity securities
Quoted
Listed 1 321 – – 1 321 Unitised funds – 77 – 77Irredeemable preference shares 2 – – 2
Unquoted – – 1 181 1 181Total equity securities 1 323 77 1 181 2 581 Debt securities
Quoted
Government and other bonds – 2 469 – 2 469 Collateralised securities – 407 – 407 Unit-linked investments – 268 – 268 Money market instruments more than one year – 2 592 – 2 592 Equity-linked notes – 244 – 244
Unquoted
Government and other bonds – 151 – 151 Collateralised securities – 10 – 10 Money market instruments more than one year – 4 516 – 4 516 Redeemable preference shares – 163 29 192
Total debt securities – 10 820 29 10 849 Derivative instruments
Exchange traded futures – 1 – 1 Interest rate swaps1 – – – –
Total derivative instruments – 1 – 1 Short-term money market instruments – 1 361 – 1 361 Total financial assets at fair value through income 1 323 12 259 1 210 14 792
1 Carrying value as at 31 December 2016 is less than R1 million.
Financial liabilities at fair value through income
Debt securities – 2 053 – 2 053 Investment contracts – 101 – 101 Total financial liabilities at fair value through income – 2 154 – 2 154
NOTES TO THE INTERIM FINANCIAL STATEMENTS
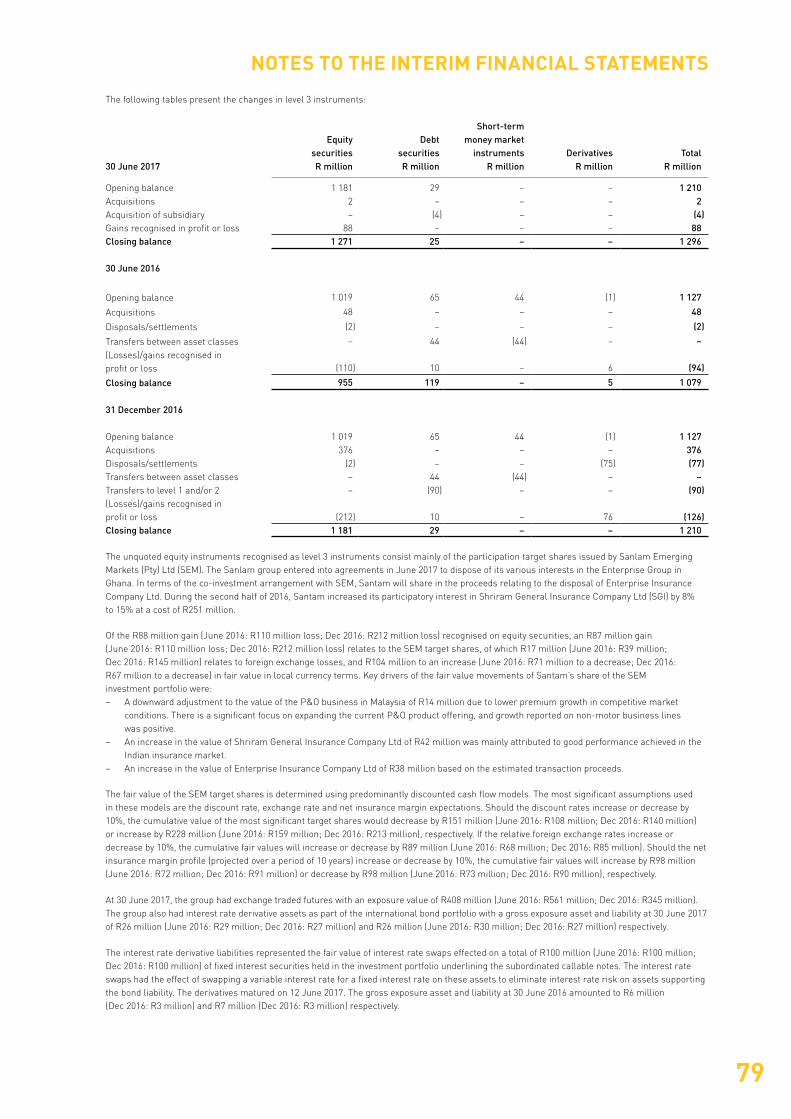
79
NOTES TO THE INTERIM FINANCIAL STATEMENTS
The following tables present the changes in level 3 instruments:
Short-term Equity Debt money market
securities securities instruments Derivatives Total 30 June 2017 R million R million R million R million R million
Opening balance 1 181 29 – – 1 210 Acquisitions 2 – – – 2 Acquisition of subsidiary – (4) – – (4)Gains recognised in profit or loss 88 – – – 88Closing balance 1 271 25 – – 1 296
30 June 2016
Opening balance 1 019 65 44 (1) 1 127
Acquisitions 48 – – – 48
Disposals/settlements (2) – – – (2)
Transfers between asset classes – 44 (44) – – (Losses)/gains recognised in profit or loss (110) 10 – 6 (94)
Closing balance 955 119 – 5 1 079
31 December 2016
Opening balance 1 019 65 44 (1) 1 127 Acquisitions 376 – – – 376 Disposals/settlements (2) – – (75) (77)Transfers between asset classes – 44 (44) – – Transfers to level 1 and/or 2 – (90) – – (90)(Losses)/gains recognised in profit or loss (212) 10 – 76 (126)Closing balance 1 181 29 – – 1 210
The unquoted equity instruments recognised as level 3 instruments consist mainly of the participation target shares issued by Sanlam Emerging Markets (Pty) Ltd (SEM). The Sanlam group entered into agreements in June 2017 to dispose of its various interests in the Enterprise Group in Ghana. In terms of the co-investment arrangement with SEM, Santam will share in the proceeds relating to the disposal of Enterprise Insurance Company Ltd. During the second half of 2016, Santam increased its participatory interest in Shriram General Insurance Company Ltd (SGI) by 8% to 15% at a cost of R251 million.
Of the R88 million gain (June 2016: R110 million loss; Dec 2016: R212 million loss) recognised on equity securities, an R87 million gain (June 2016: R110 million loss; Dec 2016: R212 million loss) relates to the SEM target shares, of which R17 million (June 2016: R39 million; Dec 2016: R145 million) relates to foreign exchange losses, and R104 million to an increase (June 2016: R71 million to a decrease; Dec 2016: R67 million to a decrease) in fair value in local currency terms. Key drivers of the fair value movements of Santam’s share of the SEM investment portfolio were:
– A downward adjustment to the value of the P&O business in Malaysia of R14 million due to lower premium growth in competitive market conditions. There is a significant focus on expanding the current P&O product offering, and growth reported on non-motor business lines was positive.
– An increase in the value of Shriram General Insurance Company Ltd of R42 million was mainly attributed to good performance achieved in the Indian insurance market.
– An increase in the value of Enterprise Insurance Company Ltd of R38 million based on the estimated transaction proceeds.
The fair value of the SEM target shares is determined using predominantly discounted cash flow models. The most significant assumptions used in these models are the discount rate, exchange rate and net insurance margin expectations. Should the discount rates increase or decrease by 10%, the cumulative value of the most significant target shares would decrease by R151 million (June 2016: R108 million; Dec 2016: R140 million) or increase by R228 million (June 2016: R159 million; Dec 2016: R213 million), respectively. If the relative foreign exchange rates increase or decrease by 10%, the cumulative fair values will increase or decrease by R89 million (June 2016: R68 million; Dec 2016: R85 million). Should the net insurance margin profile (projected over a period of 10 years) increase or decrease by 10%, the cumulative fair values will increase by R98 million (June 2016: R72 million; Dec 2016: R91 million) or decrease by R98 million (June 2016: R73 million; Dec 2016: R90 million), respectively.
At 30 June 2017, the group had exchange traded futures with an exposure value of R408 million (June 2016: R561 million; Dec 2016: R345 million). The group also had interest rate derivative assets as part of the international bond portfolio with a gross exposure asset and liability at 30 June 2017 of R26 million (June 2016: R29 million; Dec 2016: R27 million) and R26 million (June 2016: R30 million; Dec 2016: R27 million) respectively.
The interest rate derivative liabilities represented the fair value of interest rate swaps effected on a total of R100 million (June 2016: R100 million; Dec 2016: R100 million) of fixed interest securities held in the investment portfolio underlining the subordinated callable notes. The interest rate swaps had the effect of swapping a variable interest rate for a fixed interest rate on these assets to eliminate interest rate risk on assets supporting the bond liability. The derivatives matured on 12 June 2017. The gross exposure asset and liability at 30 June 2016 amounted to R6 million (Dec 2016: R3 million) and R7 million (Dec 2016: R3 million) respectively.

80
6. Financial assets and liabilities (continued)During 2007, the company issued unsecured subordinated callable notes to the value of R1 billion in two tranches. The fixed effective rate for the R600 million issue was 8.6% and 9.6% for the second tranche of R400 million, representing the R203 companion bond plus an appropriate credit spread at the time of the issues. The fixed coupon rate, based on the nominal value of the issues, amounts to 8.25% and for both tranches the optional redemption date is 15 September 2017. Between the optional redemption date and final maturity date of 15 September 2022, a variable interest rate (JIBAR-based plus additional margin) will apply. It is the group’s intention to redeem both tranches on 15 September 2017.
During April 2016, the company issued additional unsecured subordinated callable notes to the value of R1 billion in two equal tranches of fixed and floating rate notes. The effective rate for the floating rate notes represents the three-month JIBAR plus 245 basis points, while the rate for the fixed rate notes amounted to 11.77%. The floating rate notes have an optional redemption date of 12 April 2021 with a final maturity date of 12 April 2026, and the fixed rate notes an optional redemption date of 12 April 2023 with a final maturity date of 12 April 2028.
During June 2017, the company issued additional unsecured subordinated callable floating rate notes to the value of R1 billion in anticipation of the redemption of the R1 billion subordinated debt issued in 2007. The effective interest rate for the floating rate notes represents the three-month JIBAR plus 210 basis points. The notes have an optional redemption date of 27 June 2022 with a final maturity date of 27 June 2027.
Per the conditions set by the Regulator, Santam is required to maintain liquid assets equal to the value of the callable notes until maturity. The callable notes are therefore measured at fair value to minimise undue volatility in the statement of comprehensive income. The fair value of the fixed rate notes is calculated using the yield provided by BESA and adding accrued interest. The fair value of the floating rate notes is calculated using the price provided by BESA and adding accrued interest.
In May 2016, a zero-cost fence structure was entered into based on the SWIX 40, providing 10% downside protection from the implementation level of 10 621, with upside participation (excluding dividends) of 10.3%. The structure matured on 15 December 2016 (resulting in a realised gain of R75 million) and was not renewed. These were economic hedges over R1 billion of the listed equity portfolio.
On 31 July 2017, a zero-cost collar structure on equities to the value of R1.2 billion was entered into based on the SWIX 40, providing full downside protection from the implementation level of 10 972, with upside participation (excluding dividends) of 2.2%. The structure will mature on 21 December 2017.
Reviewed at Reviewed at Audited at30 June 2017 30 June 2016 31 Dec 2016
R million R million R million
7. Insurance liabilities and reinsurance assetsGross insurance liabilitiesLong-term insurance contracts
– claims reported and loss adjustment expenses 39 8 25
– claims incurred but not reported 44 30 42
General insurance contracts
– claims reported and loss adjustment expenses 9 031 6 972 6 789
– claims incurred but not reported 2 242 1 762 1 873
– unearned premiums 6 262 4 228 4 867
Total gross insurance liabilities 17 618 13 000 13 596
Non-current liabilities 1 701 1 423 1 312
Current liabilities 15 917 11 577 12 284
Recoverable from reinsurersLong-term insurance contracts– claims reported and loss adjustment expenses 17 4 6 – claims incurred but not reported 12 7 12 General insurance contracts– claims reported and loss adjustment expenses 4 304 2 781 2 835 – claims incurred but not reported 467 289 329 – unearned premiums 1 157 1 036 1 307 Total reinsurers’ share of insurance liabilities 5 957 4 117 4 489
Non-current assets 279 164 140Current assets 5 678 3 953 4 349
Net insurance liabilitiesLong-term insurance contracts
– claims reported and loss adjustment expenses 22 4 19
– claims incurred but not reported 32 23 30
General insurance contracts
– claims reported and loss adjustment expenses 4 727 4 191 3 954
– claims incurred but not reported 1 775 1 473 1 544
– unearned premiums 5 105 3 192 3 560
Total net insurance liabilities 11 661 8 883 9 107
NOTES TO THE INTERIM FINANCIAL STATEMENTS
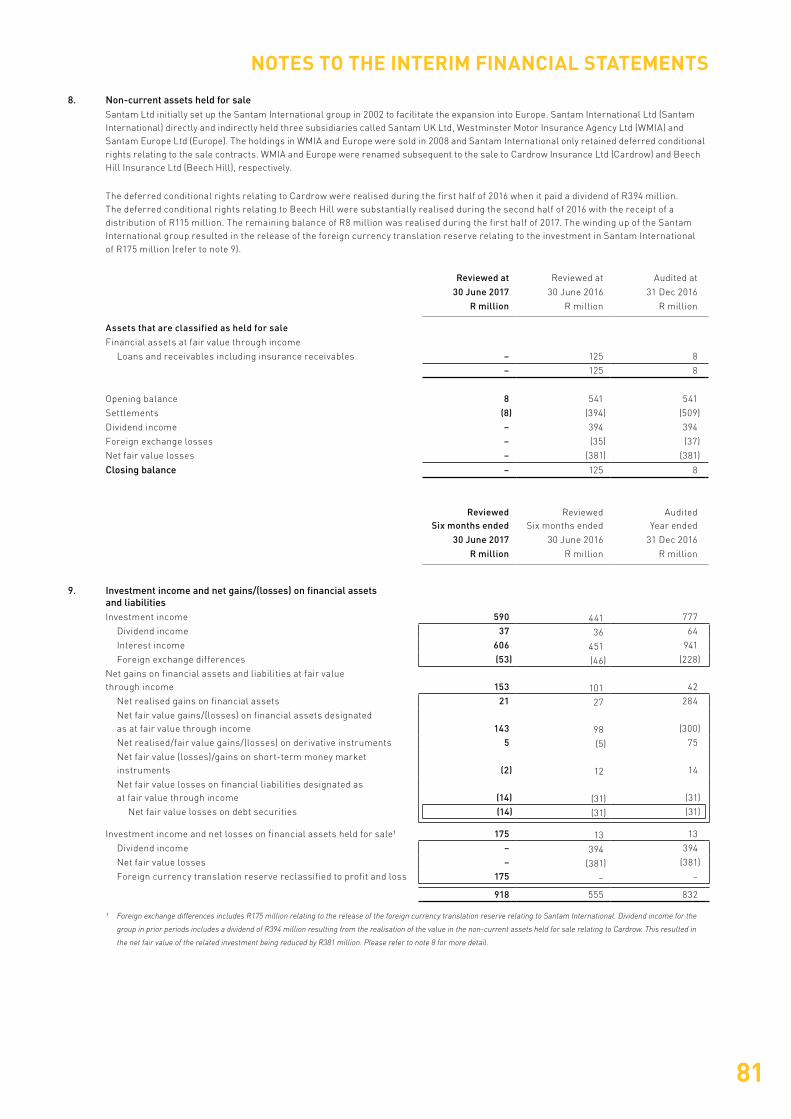
81
8. Non-current assets held for saleSantam Ltd initially set up the Santam International group in 2002 to facilitate the expansion into Europe. Santam International Ltd (Santam International) directly and indirectly held three subsidiaries called Santam UK Ltd, Westminster Motor Insurance Agency Ltd (WMIA) and Santam Europe Ltd (Europe). The holdings in WMIA and Europe were sold in 2008 and Santam International only retained deferred conditional rights relating to the sale contracts. WMIA and Europe were renamed subsequent to the sale to Cardrow Insurance Ltd (Cardrow) and Beech Hill Insurance Ltd (Beech Hill), respectively.
The deferred conditional rights relating to Cardrow were realised during the first half of 2016 when it paid a dividend of R394 million. The deferred conditional rights relating to Beech Hill were substantially realised during the second half of 2016 with the receipt of a distribution of R115 million. The remaining balance of R8 million was realised during the first half of 2017. The winding up of the Santam International group resulted in the release of the foreign currency translation reserve relating to the investment in Santam International of R175 million (refer to note 9).
Reviewed at Reviewed at Audited at
30 June 2017 30 June 2016 31 Dec 2016
R million R million R million
Assets that are classified as held for saleFinancial assets at fair value through income
Loans and receivables including insurance receivables – 125 8
– 125 8
Opening balance 8 541 541
Settlements (8) (394) (509)
Dividend income – 394 394
Foreign exchange losses – (35) (37)
Net fair value losses – (381) (381)
Closing balance – 125 8
ReviewedSix months ended
ReviewedSix months ended
AuditedYear ended
30 June 2017 30 June 2016 31 Dec 2016
R million R million R million
9. Investment income and net gains/(losses) on financial assets and liabilitiesInvestment income 590 441 777
Dividend income 37 36 64
Interest income 606 451 941
Foreign exchange differences (53) (46) (228)
Net gains on financial assets and liabilities at fair value through income 153 101 42
Net realised gains on financial assets 21 27 284
Net fair value gains/(losses) on financial assets designated as at fair value through income 143 98 (300)
Net realised/fair value gains/(losses) on derivative instruments 5 (5) 75
Net fair value (losses)/gains on short-term money market instruments (2) 12 14
Net fair value losses on financial liabilities designated as at fair value through income (14) (31) (31)
Net fair value losses on debt securities (14) (31) (31)
Investment income and net losses on financial assets held for sale1 175 13 13
Dividend income – 394 394
Net fair value losses – (381) (381)
Foreign currency translation reserve reclassified to profit and loss 175 – –
918 555 832
1 Foreign exchange differences includes R175 million relating to the release of the foreign currency translation reserve relating to Santam International. Dividend income for the
group in prior periods includes a dividend of R394 million resulting from the realisation of the value in the non-current assets held for sale relating to Cardrow. This resulted in
the net fair value of the related investment being reduced by R381 million. Please refer to note 8 for more detail.
NOTES TO THE INTERIM FINANCIAL STATEMENTS
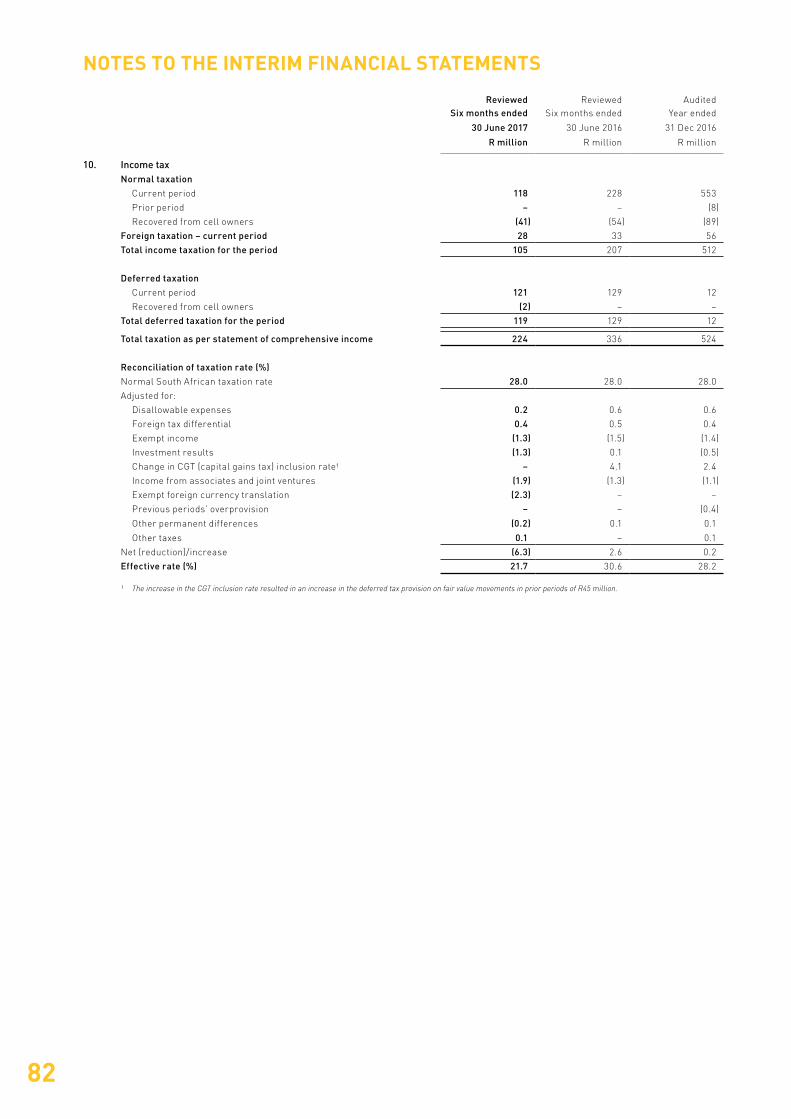
82
NOTES TO THE INTERIM FINANCIAL STATEMENTS
ReviewedSix months ended
ReviewedSix months ended
AuditedYear ended
30 June 2017 30 June 2016 31 Dec 2016
R million R million R million
10. Income taxNormal taxation
Current period 118 228 553
Prior period – – (8)
Recovered from cell owners (41) (54) (89)
Foreign taxation – current period 28 33 56
Total income taxation for the period 105 207 512
Deferred taxationCurrent period 121 129 12
Recovered from cell owners (2) – –
Total deferred taxation for the period 119 129 12
Total taxation as per statement of comprehensive income 224 336 524
Reconciliation of taxation rate (%)Normal South African taxation rate 28.0 28.0 28.0
Adjusted for:
Disallowable expenses 0.2 0.6 0.6
Foreign tax differential 0.4 0.5 0.4
Exempt income (1.3) (1.5) (1.4)
Investment results (1.3) 0.1 (0.5)
Change in CGT (capital gains tax) inclusion rate1 – 4.1 2.4
Income from associates and joint ventures (1.9) (1.3) (1.1)
Exempt foreign currency translation (2.3) – –
Previous periods’ overprovision – – (0.4)
Other permanent differences (0.2) 0.1 0.1
Other taxes 0.1 – 0.1
Net (reduction)/increase (6.3) 2.6 0.2
Effective rate (%) 21.7 30.6 28.2
1 The increase in the CGT inclusion rate resulted in an increase in the deferred tax provision on fair value movements in prior periods of R45 million.

83
NOTES TO THE INTERIM FINANCIAL STATEMENTS
11. Corporate transactions2017AcquisitionsSantam Structured Insurance (Pty) LtdDuring March 2017, the Santam group acquired a shareholding of 100% in RMB-SI Investments (Pty) Ltd (now Santam Structured Insurance (Pty) Ltd (SSI)) for R193 million in cash. Key SSI management obtained a 10% economic participation interest in SSI at acquisition date for R20 million. The 10% participatory interest is included as a liability under provisions.
R million
Details of the assets and liabilities acquired (based on provisional purchase price allocation) are as follows:Property and equipment 15
Investment in associates and joint ventures 17
Financial assets at fair value through income 4 341
Reinsurance assets 391
Deferred acquisition costs 9
Loans and receivables including insurance receivables 519
Cash and cash equivalents 1 045
Deferred income tax (86)
Cell owners' interest (1 849)
Financial liabilities at fair value through income (1 551)
Insurance liabilities (2 242)
Deferred reinsurance acquisition revenue (2)
Provisions for other liabilities and charges (30)
Trade and other payables including insurance payables (350)
Current income tax liabilities (14)
Net asset value acquired 213
Long-term incentive scheme (20)
Purchase consideration paid 193
SAN JV (RF) (Pty) LtdEffective 10 May 2017, SEM and Santam through its investment in SAN JV (RF) (Pty) Ltd (SAN JV), acquired a further 16.6% interest in Saham Finances via a subscription for new shares for US$351 million (R4.8 billion). Santam’s share of the purchase price, including transaction costs, was US$11 million (R152 million). Santam’s interest in SAN JV therefore diluted to 15% (previously 25%). As a result of the dilution, R90 million of the foreign currency translation reserve relating to SAN JV was released to profit or loss. An R18 million gain on dilution was also recognised.
Professional Provident Society Short-term Insurance Company Ltd (PST)During March 2017 and June 2017 a pro rata recapitalisation took place in terms of which Santam injected a further R8.3 million and R5.4 million respectively into the company.
Disposals
Paladin Underwriting Managers (Pty) LtdDuring January 2017, the group sold its 40% shareholding in Paladin Underwriting Managers (Pty) Ltd for R23 million. The net profit realised was R5 million and capital gains tax of R2 million was recognised.
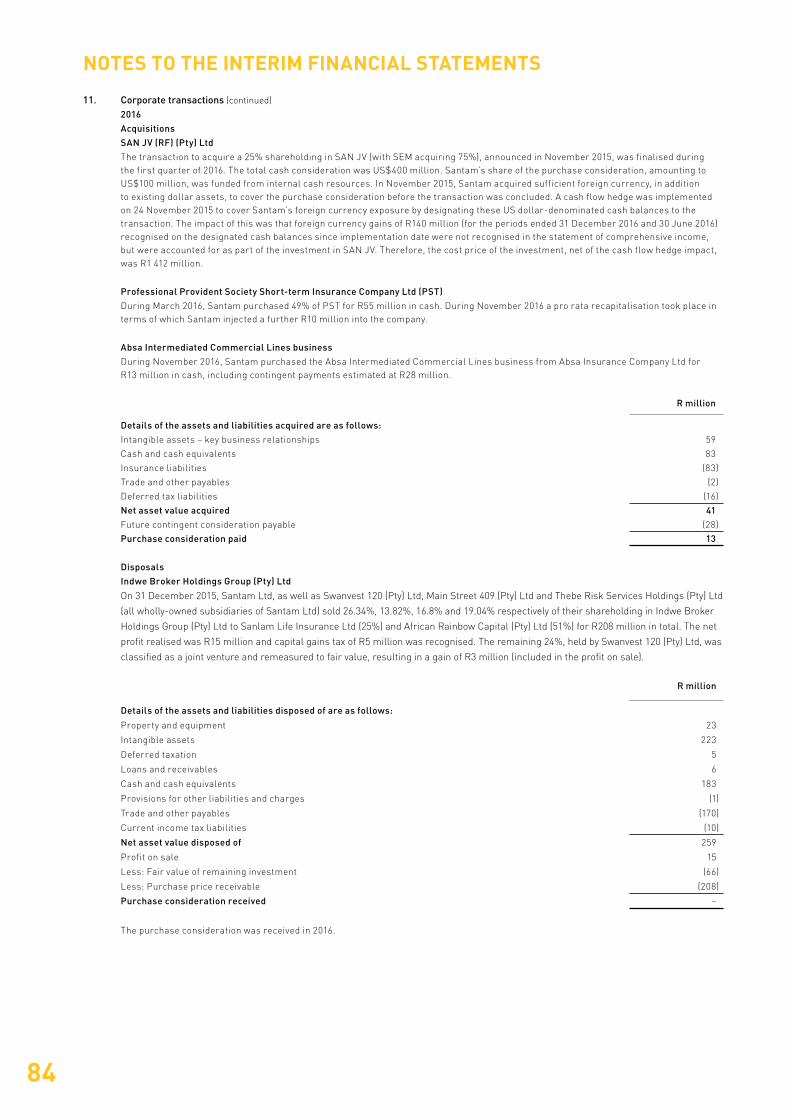
11. Corporate transactions (continued)
2016AcquisitionsSAN JV (RF) (Pty) LtdThe transaction to acquire a 25% shareholding in SAN JV (with SEM acquiring 75%), announced in November 2015, was finalised during the first quarter of 2016. The total cash consideration was US$400 million. Santam’s share of the purchase consideration, amounting to US$100 million, was funded from internal cash resources. In November 2015, Santam acquired sufficient foreign currency, in addition to existing dollar assets, to cover the purchase consideration before the transaction was concluded. A cash flow hedge was implemented on 24 November 2015 to cover Santam’s foreign currency exposure by designating these US dollar-denominated cash balances to the transaction. The impact of this was that foreign currency gains of R140 million (for the periods ended 31 December 2016 and 30 June 2016) recognised on the designated cash balances since implementation date were not recognised in the statement of comprehensive income, but were accounted for as part of the investment in SAN JV. Therefore, the cost price of the investment, net of the cash flow hedge impact, was R1 412 million.
Professional Provident Society Short-term Insurance Company Ltd (PST)During March 2016, Santam purchased 49% of PST for R55 million in cash. During November 2016 a pro rata recapitalisation took place in terms of which Santam injected a further R10 million into the company.
Absa Intermediated Commercial Lines businessDuring November 2016, Santam purchased the Absa Intermediated Commercial Lines business from Absa Insurance Company Ltd for R13 million in cash, including contingent payments estimated at R28 million.
R million
Details of the assets and liabilities acquired are as follows:Intangible assets – key business relationships 59
Cash and cash equivalents 83
Insurance liabilities (83)
Trade and other payables (2)
Deferred tax liabilities (16)
Net asset value acquired 41 Future contingent consideration payable (28)
Purchase consideration paid 13
DisposalsIndwe Broker Holdings Group (Pty) Ltd
On 31 December 2015, Santam Ltd, as well as Swanvest 120 (Pty) Ltd, Main Street 409 (Pty) Ltd and Thebe Risk Services Holdings (Pty) Ltd
(all wholly-owned subsidiaries of Santam Ltd) sold 26.34%, 13.82%, 16.8% and 19.04% respectively of their shareholding in Indwe Broker
Holdings Group (Pty) Ltd to Sanlam Life Insurance Ltd (25%) and African Rainbow Capital (Pty) Ltd (51%) for R208 million in total. The net
profit realised was R15 million and capital gains tax of R5 million was recognised. The remaining 24%, held by Swanvest 120 (Pty) Ltd, was
classified as a joint venture and remeasured to fair value, resulting in a gain of R3 million (included in the profit on sale).
R million
Details of the assets and liabilities disposed of are as follows:
Property and equipment 23
Intangible assets 223
Deferred taxation 5
Loans and receivables 6
Cash and cash equivalents 183
Provisions for other liabilities and charges (1)
Trade and other payables (170)
Current income tax liabilities (10)
Net asset value disposed of 259
Profit on sale 15
Less: Fair value of remaining investment (66)
Less: Purchase price receivable (208)
Purchase consideration received –
The purchase consideration was received in 2016.
NOTES TO THE INTERIM FINANCIAL STATEMENTS
84
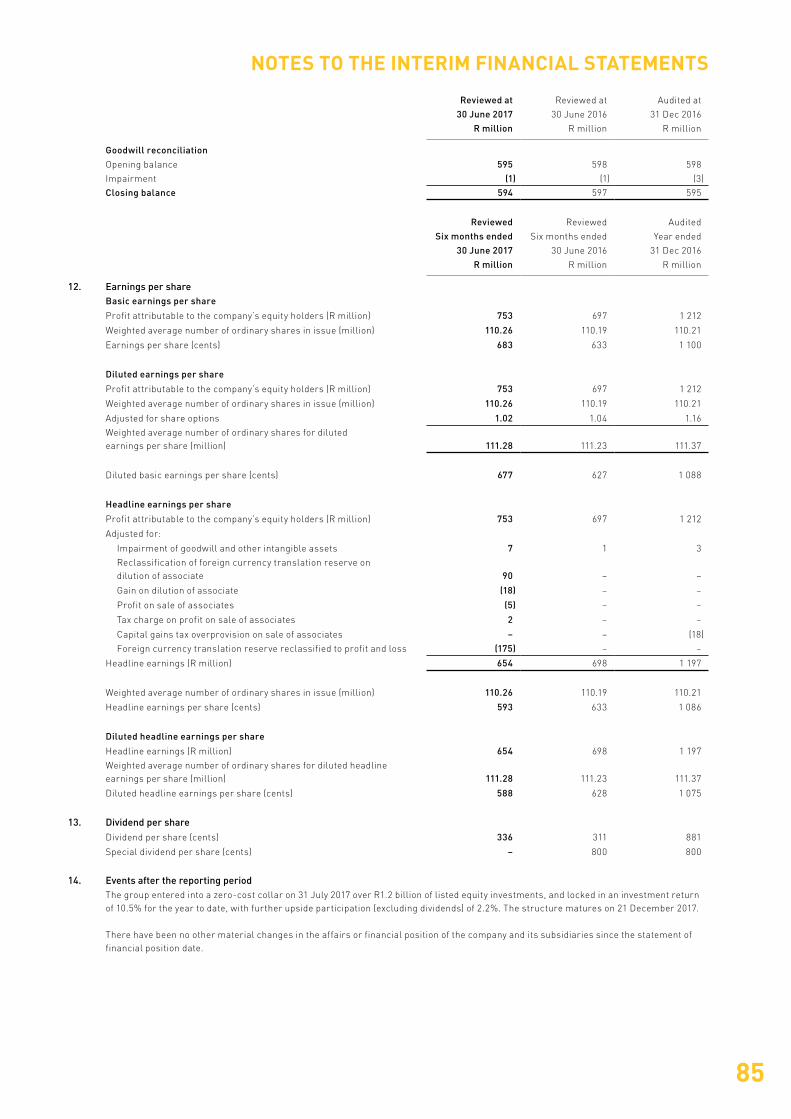
85
Reviewed at Reviewed at Audited at
30 June 2017 30 June 2016 31 Dec 2016
R million R million R million
Goodwill reconciliationOpening balance 595 598 598
Impairment (1) (1) (3)
Closing balance 594 597 595
Reviewed Reviewed Audited
Six months ended Six months ended Year ended
30 June 2017 30 June 2016 31 Dec 2016
R million R million R million
12. Earnings per shareBasic earnings per share
Profit attributable to the company’s equity holders (R million) 753 697 1 212
Weighted average number of ordinary shares in issue (million) 110.26 110.19 110.21
Earnings per share (cents) 683 633 1 100
Diluted earnings per share
Profit attributable to the company’s equity holders (R million) 753 697 1 212
Weighted average number of ordinary shares in issue (million) 110.26 110.19 110.21
Adjusted for share options 1.02 1.04 1.16
Weighted average number of ordinary shares for diluted earnings per share (million) 111.28 111.23 111.37
Diluted basic earnings per share (cents) 677 627 1 088
Headline earnings per share
Profit attributable to the company’s equity holders (R million) 753 697 1 212
Adjusted for:
Impairment of goodwill and other intangible assets 7 1 3
Reclassification of foreign currency translation reserve on dilution of associate 90 – –
Gain on dilution of associate (18) – –
Profit on sale of associates (5) – –
Tax charge on profit on sale of associates 2 – –
Capital gains tax overprovision on sale of associates – – (18)
Foreign currency translation reserve reclassified to profit and loss (175) – –
Headline earnings (R million) 654 698 1 197
Weighted average number of ordinary shares in issue (million) 110.26 110.19 110.21
Headline earnings per share (cents) 593 633 1 086
Diluted headline earnings per share
Headline earnings (R million) 654 698 1 197
Weighted average number of ordinary shares for diluted headline earnings per share (million) 111.28 111.23 111.37
Diluted headline earnings per share (cents) 588 628 1 075
13. Dividend per shareDividend per share (cents) 336 311 881
Special dividend per share (cents) – 800 800
14. Events after the reporting periodThe group entered into a zero-cost collar on 31 July 2017 over R1.2 billion of listed equity investments, and locked in an investment return of 10.5% for the year to date, with further upside participation (excluding dividends) of 2.2%. The structure matures on 21 December 2017.
There have been no other material changes in the affairs or financial position of the company and its subsidiaries since the statement of financial position date.
NOTES TO THE INTERIM FINANCIAL STATEMENTS


ADMINISTRATION
Santam is an authorised financial services provider (licence number 3416).
GREYMATTER & FINCH # 11155
NON-EXECUTIVE DIRECTORSB Campbell, BTPKM Gamedze, GG Gelink (chairman),
IM Kirk, MLD Marole, NV Mtetwa, Y Ramiah,
MJ Reyneke, PE Speckmann, HC Werth
EXECUTIVE DIRECTORSL Lambrechts (chief executive officer),
HD Nel (chief financial officer)
COMPANY SECRETARYM Allie
TRANSFER SECRETARIESComputershare Investor Services (Pty) Ltd
Rosebank Towers, 15 Biermann Avenue, Rosebank 2196
PO Box 61051, Marshalltown 2107
Tel: 011 370 5000
Fax: 011 688 7721
www.computershare.com
SANTAM HEAD OFFICE AND REGISTERED ADDRESS1 Sportica Crescent
Tyger Valley, Bellville 7530
PO Box 3881, Tyger Valley 7536
Tel: 021 915 7000
Fax: 021 914 0700
www.santam.co.za
Registration number: 1918/001680/06
ISIN: ZAE000093779
JSE share code: SNT
NSX share code: SNM
SPONSORInvestec Bank Ltd

INSURANCE GOOD AND PROPERwww.santam.co.za