for the sharon steel corporation fairmont coke works … · expanded site investigation work plan...
TRANSCRIPT

Expanded Site InvestigationWork Plan
for theSharon Steel CorporationFairmont Coke Works SiteFairmont, WV
prepared for submission to:U.S. Environmental Protection Agency841 Chestnut StreetPhiladelphia, Pennsylvania 19107 EFAprepared on Befuiff of;Exxon Company, U.S.A.P.O. Box 728Linden, NJ 07036
preparedlyICF Kaiser Engineers, Inc.Gateway View Plaza1600 West Carson StreetPittsburgh, PA 15219-1031
IGF KAISER
A R I O I 3 2 I

Expanded Site InvestigationWork Plan
for theSharon Steel CorporationFairmont Coke Works SiteFairmont, WV
prepared for submission to:U.S. Environmental Protection Agency841 Chestnut StreetPhiladelphia, Pennsylvania 19107
prepared on Befiaifof:Exxon Company, U.S.A.P.O. Box 728Linden, Nj 07036
preparedlyICF Kaiser Engineers, Inc.Gateway View Plaza1600 West Carson StreetPittsburgh, PA15219-W31
ICF KAISER
Auust 1998A R I O I 3 2 2

1 TABLE OF CONTENTS
Section Page
GLOSSARY OF ABBREVIATIONS AND DEFINITION OF TERMS,,,,,,.,......,......,,.,,,,,,....iv
1.0 INTRODUCTION..................................,1.1 ESIOBJECTIVES....,......,,........,,,...,,,,,,.,.,......,.,.,.,,..,,,,.....,..,,,,,,,!.!1.2 TECHNICAL APPROACH,,.................,,,..,,,,.,,...,.,,,........,,,,,....,..,.,,,l-2
1.2.1 Work Plan Development.,,,,,,,,,,.,,,,,,,,..,,,..,,...,,.,.,....,.,,,.,. 1-21.2.2 Work Plan Content.,,,.,.,.....,,,.........,,.........,..,,,,...,,,....,,,,,,,,., 1-3
2.0 SITE BACKGROUND AND PHYSICAL SETTING ..........................................................2-12.1 LOCATION ...........,.,,..,.....,,,........,,,,,,.,,,........,,,,,,....,,.......,,,,,.,,,2-l
2.2.1 Regional Geology ...,....,,...,,,,,,,,,,,.,,,,......,,,,,....,,,,...,..,,...,,2-l2.2.1.1 Soils .,,,.........,,,.......,,.,,..,,,,,.........,.,,,,,,...,,....,,,...,,.2-l2.2.1.2 Bedrock,,,.........,.........,.,,.,,.,,,,,,,...,,,,.,..............,,,.,..,2-2
2.2.2 SiteGeoIogy,..,.,,..,,.....,,......,,,,..,,.,,,,,,.....,,,..,,,.,,..,.........,,2-32.2.3 Hydrogeology...,....,,.......,,,,.....,,,.,,,,,.,,,,..,,,.......,,...,,.,.,,.,,2-3
2.2.3.1 Shallow Groundwater,,,,,,,,,.,,....,,,..,,...........,,,,,,,,,,,,2-32.2.3.2 Bedrock,.......,.......,,,,,...,,,,,...,,,,..,.......................,,,,.,,,2-4
2.2.4 Surface Water ,...........,,,..,....,,......,..,,,,,,,.,,,,,.......,...........,,.......2-42.3 SITEHISTORY,..,,,,,,,.,,,,,,,..,,...,,..,,...,,,..,..,.,,,....,,..,,,,,,,,....2-4
2.3.1 History of the Fairmont Coke Works.,,,,.....,,,,.....,,................,,,,,,,,.2-52.3.2 Typical Coke Manufacturing Processes and Waste Generation......,...,,,.,.,,.2-6
2.4 PREVIOUS INVESTIGATIONS................................................................................^^2.4.1 Environmental Reconnaissance Report...,,,,,,,,,......,,.,.,,,,,,,,,,,,,2-82.4.2 Remedial Site Waste Disposal Design Report,,,,,,,,,,,,,,,,.,,,,....,.,.2-92.4.3 CERCLA Immediate Removal Assessment ....................................................2-102.4.4 Phase II RCRA Facility Assessment ..............................................................2-112.4.5 Emergency Removal Action.....................................................................2-112.4.6 Extent of Contamination Survey ....................................................................2-15
3.0 SITE REGULATORY FRAMEWORK, RA AND EE/CA SCREENING.........................3-13.1 POTENTIALLY APPLICABLE OR RELEVANT AND APPROPRIATE
REQUIREMEOTS..,,,,,,,.,.,,,....,.,,.,,.,,..,,,.,,,,.,,.,,,.,,.,,,,,,,,,,3-13.2 POTENTIAL PATHWAYS OF CONTAMINANT MIGRATION / PRELIMINARY
RISK ANALYSIS 3-23.3 PRELIMINARY IDENTIFICATION OF REMEDIAL ALTERNATIVES ,,,,,..,,,3-2
4.0 WORK PLAN RATIONALE ................................................................™...4.1 POTENTIAL SOURCE AREA DELINEATION...........,..,..,,.,,..,,.....,,,,,,,,,4-14.2 DATA GAP ASSESSMENT ,.............,..........,,,.........,,,,.......,...,,.,.......,,,,..,4-2
4.2.1 Data Gap -Investigation Areas ...„,.......................,„,..,......,„.,......,,r..,...,4-24.2.2 Data Gap - Characterization Areas ,......„....,......,„....„........,,,.,,,,,,,,4-34.2.3 Data Gap - Confirmation Areas .,.............,.,.,.......,,,,,,,,,,,,..,,,,,,,4-3
4.3 AREAS NOT INCLUDED IN THE RI SAMPLING PROGRAM .....,..,..,,,,,,,,,4-34.3.1 Forest and Undisturbed Areas......................................................,,,,,,,,,,4-3
Sharon Steel, ESI WP i Final70812-20-C August 1998
A R I O I 3 2 3

TABLE OF CONTENTS (Continued)
Section Page
4.3.2 Side Drainages to the Unnamed Tributary ........................................................4-44.3.3 SiteBuildings..................................................................................................4-44.3.4 Monongahela River .........................................................................................4-5
4.4 SAMPLE COLLECTION AND ANALYSIS......................................;........................4-54.4.1 Analytical Parameters......................................................................................4-54.4.2 Sample Types,............................................,....................................................4-7
4.5
5.0 REMEDIAL INVESTIGATION TASKS ............ .......«.....™...............................................5-l5.1 PROJECT PLANS ..................................................................................................... .5-1
5.1.1 Field Sampling Plan.........................................................................................5-l5.1.2 Quality Assurance Project Plan......................................................... ........ .......5-25.1.3 Healtii and Safety Plan ....................................................................................5-25.1.4 Community Relation Plan ......................................................................... .......5-2
5.2 FIELD INVESTIGATION...........................................................................................5-25.2.1 SoilSampling..................................................................................................5-3
5.2.1.1 Areas of Investigation ................................................................... ......5-35.2.1.2 Areas of Characterization....................,...............................................5-45.2.1.3 Areas of Confirmation.........................................................................5-5
5.2.2 Monitoring Well Installation and Sampling .................................................... ..5-55.2.3 Surface Water, Sediment, and Seep Sampling ..................................................5-65.2.4 Aquifer Testing ...............................................................................................5-65.2.5 SiteSurvey.........................................................................,............................5-65.2.6 Wetland Delineation Survey.............................................................................5-7
5.3 SAMPLE ANALYSIS / VALIDATION ......................................................................5-85.4 DATAEVALUATION................................................................................................5-85.5 RISK ASSESSMENT .................................................................................................5-8
6.0 ESISCHEDULE..............................................^^
7.0 PROJECT MANAGEMENT....™.................................™
8.0 REFERENCES.................................................™
List of Figures
Figure Page2-1 SiteUcationMap..............^^^2-2 Site Location and Topographic Map............................................................................................2-212-3 Former River Channel and Schematic Cross-Section Locations ....................................................2-222-4 Schematic Cross Sections A-A* and B-B' ....................................................................................2-232-5 Cross Section Location Map........................................................................................................ 2-242-6 Geological Cross Section C-C' ....................................................................................................2-252-7 Geological Cross Sections D-D' and E-E'...............................................................................-...2-26
Sharon Steel, ESI WP ii Final70812-20-C August 1998
A R I O I 3 2 U

fABLE OF CONTENTS (Continue^
Section page
List of Figures - Continued
2-8 Extent of Contamination Survey Sampling Locations ..................................................................2-27
4-1 Soil SamplingU>catioos.....................»4-2 Monitoring Well Locations..........................................................................................................4-244-3 Surface Water and Sediment Sampling Location ..........................................................................4-25
6-1 Remedial Investigation Schedule....................................................................................................6-2
7-1 Project Organization......................................................................................................................7-3
List of Tables
2-1 General Stratigraphy of the Upper Section of the Conemaugh Series in West Virginia ..................2-172-2 SWMUDescriptions...................................................................................................................2-18
4-1 Summary of Sampling and Analysis at the Light Oil Storage Area .................................................4-94-2 Summary of Sampling and Analysis at the Former Production Area .............................................4-104-3 Summary of Sampling and Analysis at the Former Coke Ovens....................................................4-l 14-4 Summary of Sampling and Analysis at the Existing North Landfill...............................................4-124-5 Summary of Sampling and Analysis at the Existing South Landfill...............................................4-134-6 Summary of Sampling and Analysis at the Existing Impoundment................................................4-144-7 Summary of Sampling and Analysis at the Existing Waste Sludge and Breeze Storage Area......... 4-154-8 Summary of Sampling and Analysis at the Former Breeze Washout Area.....................................4-164-9 Summary of Sampling and Analysis at the Former Sludge Storage Area.......................................4-174-10 Summary of Sampling and Analysis at the Former Oxidation Impoundment ................................4-184-11 Summary of Sampling and Analysis at Unnamed Tributaries......................................................4-194-12 Summary of Sampling and Analysis at the Coal/Coke Yard Drainage..........................................4-204-13 Summary of Sampling and Analysis at the Light Oil Storage Drainage........................................4-214-14 Monitoring Well Location Rationale...........................................................................................4-22
5-1 Summary of Sampling and Analysis at the Sharon Steel Corporation Site....................................... 5-9
List of Appendices
Appendix PageA Summary of Historical Laboratory Data....................................................................................... A-l
Sharon Steel, ESI WP Hi Final70812-20-C August 1998
A R I O I 3 2 5

GLOSSARY OF ABBREVIATIONS AND DEFINITION OF TERMS
AOC Administrative Order of ConsentARARS Applicable or Relevant and Appropriate RequirementsBNA Base-Neutral/Acid ExtractablesBTEX benzene, toluene, ethylbenzene, and xyleneCERCLA Comprehensive Environmental Response, Compensation, and Liability Act of
1980CLP Contract Laboratory ProgramCPAH Carcinogenic Polynuclear Aromatic HydrocarbonsCRP Community Relations PlanDQO Data Quality ObjectivesEE/CA Engineering Evaluation/Cost AnalysisESI Expanded Site InvestigationFIT Field Investigation TeamFOL Field Operations LeaderFS Feasibility StudyFSP Field Sampling PlanHSL Hazardous Substance ListHASP Health and Safety PlanMCLs Maximum Contaminant LevelsMSL Mean Sea LevelNAAQS National Ambient Air Quality StandardsNCP National Contingency PlanNPDES National Pollution Discharge Elimination SystemNPL National Priority ListPAH Polycyclic Aromatic HydrocarbonsPCB Polychlorinated BiphenylsPOTW Publicly-Owned Treatment WorksPRP Potentially Responsible PartiesRA Risk AssessmentRBC Risk Based ConcentrationRCRA Resource Conservation and Recovery ActRJ Remedial InvestigationROD Record of DecisionSAP Sampling and Analysis PlanSARA Superfund Amendment and Reauthorization Act of 1986SDWA Safe Drinking Water ActSVOC Semi-Volatile Organic CompoundTAL Target Analyte ListTCL Target Compound ListUSEPA United States Environmental Protection AgencyUSGS United States Geological SurveyVOC Volatile Organic CompoundWVDEP West Virginia Department of Environmental Protection
Sharon Steel, ESI WP70812-20-C
IV FinalAugust 1998
A R I O I 3 2 6

a
IGF KAISERWorUwiJt Excellence in Meeting Client NeeJt
A R I O I 3 2 7

1.0 INTRODUCTION
This Work Plan for an Expanded Site Investigation (ESI) of the Sharon Steel Corporation-Fairmont CokeWorks Site (the Site) in Fairmont, West Virginia has been prepared by ICF Kaiser Engineers Inc. (ICF
Kaiser) for Exxon Company, USA (Exxon). This ESI Work Plan is submitted as initial fulfillment ofSection VIII of Administrative Order on Consent (AOC) III-97-103-DC, executed by the United StatesEnvironmental Protection Agency (USEPA) and Exxon on September 23, 1997. The ESI is beingconducted to gather information to support potential remediation of the site. This Work Plan has beenprepared in accordance with the Rl/FS guidelines presented in the National Contingency Plan published inthe Federal Register (March 8, 1990), Section 121 of the Comprehensive Environmental Response,
Compensation, and Liability Act (CERCLA) as amended by the Superfund Amendments andReauthorization Act (SARA), and the Interim Final Guidance Document for Conducting Remedial
Investigations and Feasibility Studies under CERCLA.
This Work Plan is intended to be used in conjunction with three other plans prepared for the ESI scope ofwork. These plans are:
• Field Sampling Plan (FSP)• Quality Assurance Project Plan (QAPjP)• Site-Specific Health and Safety Plan (HASP)A Community Relations Plan (CRP) will be submitted by Exxon following resolution of the pending
Project XL proposal.
l.i ESI OBJECTIVES
The ESI is designed to investigate the nature and extent of contamination present at the Site as needed toconduct the risk assessment, and to determine the physical characteristics of the Site. The data gatheredduring the ESI will also serve as a basis for an Engineering Evaluation/Cost Analysis (EE/CA) to beconducted, if necessary. The RA will serve as the link between the ESI and EE/CA, it is used to evaluatepotential risks posed to appropriate human and ecological receptors by contaminants found in the ESI.
Sharon Steel, ESI WP 1-1 Final70812-20-C August 1998
A R I O I 3 2 8

The basic objectives of the ESI are to:
• Confirm Potential Sources of Contamination identified by USEPA during the Emergency RemovalAction (ERA) and the Extent of Contamination (HOC) study. Potential source areas as identifiedby USEPA which could release contaminants to the environment will be confirmed.
• Define the Nature and Extent of Contamination. The nature and extent of contamination will bedefined by the types of contaminants present and their distribution in the environment as needed toconduct the RA.
• Define Potential Pathways of Migration. The potential exposure pathways and transportmechanisms by which contaminants could potentially migrate will be assessed.
• Provide Input to the RA and EE/CA process, if necessary. Information gathered during the ESIportion will provide a foundation for the RA and EE/CA(s), if necessary.
1.2 TECHNICAL APPROACH
In order to meet its objectives, the ESI is structured to determine the nature and extent of contamination
present at the Site as needed to conduct the risk assessment, while at the same time, gathering basicgeologic and hydrologic information about the Site. The ESI scope includes tasks for Site reconnaissance,
drilling, sampling and logging of borings, monitoring well installation, surface water and sedimentsampling, augering and sampling of shallow soils, and groundwater and surface seep sampling. Theprocedures to accomplish these tasks are described in detail in the FSP. The samples obtained will beanalyzed using USEPA Contract Laboratory Program (CLP) protocols for volatile organic compounds(VOCs), semi-volatile organic compounds (SVOCs), polychlorinated biphenyls (PCBs), pesticides, heavymetal compounds (metals), and cyanide. A complete summary of the sample analytical parameter
requirements is included in the QAPjP. Based on the analytical results, contaminants of potential concernwill be identified for the Site.
1.2.1 Work Plan Development
This work plan was prepared in accordance with current USEPA guidance. Documents used in thepreparation of this ESI Work Plan included:
• Interim Final Guidance on Preparing Superfund Decision Documents (USEPA, 1989);
• Remedial Action at Waste Disposal Sites (USEPA, 1985);
• Guidance on Oversight of Potentially Responsible Party Remedial Investigations and FeasibilityStudies, Volume I, and Volume II (USEPA, 1991);
• Superfitnd Exposure Assessment Manual (USEPA, 1998);
Sharon Steel, ESI WP 1-2 Final70812-20-C August 1998
A R I O I 3 2 9

• Risk Assessment Guidance for Super/und, Volumes I and 21(USEPA, 1989);and
• Ecological Risk Assessment Guidance for Superfiand: Process for Designing and ConductingEcological Risk Assessments, Interim Final (USEPA, 1997)
• Guidance for Conducting Remedial Investigations and Feasibility Studies under CERCLA,(USEPA, 1998)
In addition to these guidance documents, this Work Plan is based on extensive review of the site-specificinvestigation documents listed in the references section. These site-specific documents include prior SiteInvestigation reports and waste disposal designs, as well as results of sampling and analyses performed bythe USEPA during a removal action in 1994 and 1995. In addition to historic documents, an extensive,detailed Site reconnaissance was undertaken by ICF Kaiser in 1998, including review of historic aerial
photographs, discussions with past Site workers and regulatory officials, and field survey of Site features
and structures. The environmental setting and current conceptual models of the Site were developed duringthese reviews.
1.2.2 Work Plan Content
This Work Plan consists of eight sections, of which this introduction is Section 1.0. Section 2.0 contains adiscussion of the Site's background and physical setting, and the initial evaluation of existing data. Adiscussion of ARARs, the Risk Assessment, and Feasibility Study is presented in Section 3.0.
Section 4.0 presents the sampling rationale to be used to achieve the ESI objectives. Section 5.0 presentsan overall description of each of the RI tasks, and includes a discussion of specific sampling locations andanalyses to be performed. Detailed descriptions and procedures of each of the ESI field tasks is presented
in the FSP.
Section 6.0 shows the anticipated schedule for the ESI tasks. Section 7.0 presents the project management
team and their responsibilities. A references section included as Section 8.0 provides a list of referencesused to develop this Work Plan.
Sharon Steel, ESI WP 1-3 Final70812-20-C August 1998
A R I O I 3 3 0

Section 2
COCO
CD
cc.

2.0 SITE BACKGROUND AND PHYSICAL SETTING
2.1 LOCATION
The Sharon Steel Corporation-Fairmont Coke Works Site (the Site) is located on approximately 93 acres of
land in the eastern portion of the town of Fairmont, Marion County, West Virginia (Figure 2-1). Only
approximately 45 acres were used for industrial purposes during the plant's operation from 1920 to 1979.The Site is located in a relatively flat upland valley, approximately 1,600 feet west of the MonongahelaRiver, on land that is zoned for industrial use (Figure 2-2). Residential and industrial areas are present to
the north, east, and south sides. The industries present include Westinghouse Electric and Owens-Illinois
Company. Residences are present within 200 feet of the north side and on the east side of the Site. The
area west of the Site is mostly undeveloped, although part of it is bordered by a Big John's Salvage
(formerly Reilly Tar and Chemical).
2.2 ENVIRONMENTAL SETTING
2.2.1 Regional Geology
2.2.1.1 Soils
The Site sits on a former meander of the Monongahela River (Figure 2-3). The river course likely changedto its present channel prior to the advance of glacial ice during the Pleistocene. The abandoned channel
then filled with organic debris and fine grained materials (silts and clays) that washed down from the
surrounding hillsides. During the Pleistocene, ice dammed the Ohio River forming a lake that flooded a
vast portion of the current Monongahela River Valley. This former lake covered the present Site area.
Sediments that washed into the lake from the valley walls settled to the bottom forming a layer of silty sandin the former Monongahela Vailey. When the ice melted at the close of the Pleistocene, the lake drained
and subsequent erosion of the land surface removed most of the lake sediments.
During construction of the former coke works, fill, consisting of fine silts and coal cinders, appears to have
been placed to level the Site. In the former drainage courses, these fill materials may be up to 20 feet thick.Across the center of the Site, the fill material may be thin or absent.
Two schematic cross sections are provided, Sections A-A' and B-B' (Figures 2-3), to illustrate our currentunderstanding of the regional geologic setting of the Site. Section A-A' (Figure 2-4) is a section cut parallelto the former river channel and Section B-B' (Figure 2-4) is cut perpendicular to the former channel. These
Sharon Steel, ESI WP 2-1 Final70812-20-C August 1998
A R I O I 3 3 2

sections show that bedrock is expected to be encountered at depths up to 70 feet below land surface (bis) in
the middle of the former channel and to be lying at the surface on the valley margins. The expected
elevation of the base of the former river channel is approximately 940 feet above mean sea level (msl).
This places the former channel 60 feet above the current Monongahela River elevation (approximately 880
feet msl). Alluvium fills the former river channel up to an elevation of approximately 980 feet msl.
Consequently, river alluvium likely varies in thickness from absent on the valley margins to more than 40
feet thick in the center of the Site above the valley axis. The alluvium consists of sand becoming coarse
grained (sands and gravels) at depth, and some coarse grained remnants, elongated parallel to the former
channel, may be present within the alluvial deposit.
Above the alluvial sediments are fine grained organic rich silts and clays that were laid down in the former
channel after the river changed coarse, but before the valley was flooded. These fine grained materials are
present at elevations from 1,000 feet msl down to the top of the alluvium (980 feet msl). The lake
sediments, comprised of silt and sand then lie on top of the organic rich silts and clays from approximately
1,000 feet msl up to 1,010 feet msl. Post Pleistocene erosion has removed the lake sediments and the
underlying meander fill sediments from the flanks of the meander scar to the northwest and southwest.
This erosional surface likely exposes the alluvium at the surface on either side of the Site. This erosionalsurface was leveled during construction of the coke works, when fill material was placed to fill in the
existing drainage ways.
2.2.1.2 Bedrock
The Site is underlain by bedrock of the Conemaugh Group. The units that comprise this group areidentified on Table 2-1. These three units each contain shale and coal seams. Depth to bedrock is up to
70 feet along the axis of the former river channel, but bedrock lies at the surface along the valley walls.The top 15 to 20 feet of bedrock is reported to be highly weathered, but this weathered zone likely occurs
on the hills north and south of the Site. The bedrock present beneath the Site is an erosional surface and,
therefore, it is likely to be unweathered, competent rock. Structural contours drawn on the base of the
Pittsburgh Coal (top of the Conemaugh Group) indicate the bedrock dips toward the Northwest (Strike N35° E) at approximately 3°.
Sharon Steel, ESI WP 2-2 Final70812-20-C August 1998
A R I O I 3 3 3

2.2.2 Site Geology
Three geologic cross sections C-C, D-D', and E-E', (Figures 2-5, 2-6, and 2-7) have been prepared fromboring logs made by D'Appolonia and from the cross sections included in D'Appolonia's 1980 SiteCharacterization report (D'Appolonia, 1980). These sections illustrate how the regional geology depicted
in Figures 2-3 and 2-4 is reflected beneath the Site. The base of the former channel is filled with silty sand,sand, and sand and gravel. The hydraulic conductivity of these sediments likely varies from 10"3 to 10'5
centimeters per second (cm/sec). The hydraulic conductivity in the alluvium was demonstrated to be
10"3 cm/sec (D'Appolonia, 1981). This former river alluvium is up to 40 feet thick near the centerline ofthe former river channel, pinches out near the valley margins and likely outcrops at or near the surface,both down stream and up stream from the Site (see schematic cross section B-B').
Above the river alluvium are the fine grained silts and clays thought to have accumulated in the formerriver channel after the channel cut its present course and abandoned this former channel. These materialsare much finer grained, contain significant natural organic material, and have significantly lower hydraulicconductivity (expected in the range from 10'5 down to 10'7 cm/sec. This fine grained unit is generally 10 toIS feet thick and lies directly on the bedrock surface at the valley margins.
An isolated lens of silty sand lies above the silty clay meander fill deposit in the center of the Site. This is
believed to be the former lake sediments. Post glacial erosion has stripped these sediments off the surface,
both on the southeast and the northwest margins of the Site. Above these sediments are fill that was placedto level the Site. The fill varies in thickness from thin or absent, where it overlies the former lake sands, toover 20 feet thick where past drainage ditches were filled in. The fill is comprised of silty clays, silts, silty
sand, and cinders. The hydraulic conductivity of the fill is expected to vary widely, from as low as 10"s
cm/sec where the material is fine grained, up to 10"' cm/sec where the fill is comprised of cinders.
2.2.3 Hvdrogeologv
2.2.3.1 Shallow Groundwater
Groundwater is present in the fill and shallow lake sand at depths of four to fourteen feet below currentground surface, perched on the under lying silty clay. In the deep alluvial sand, groundwater is found at adepth of fifty feet below ground surface. The 10 to 40 feet of silty clay that separates the two sandy unitsappears to be unsaturated. Groundwater from both the deeper alluvium and the shallow lake sands likely
Sharon Steel, ESI WP 2-3 Final70812-20-C August 1998
f l R I O I 3 3 l *

discharges at the surface both to the northwest and southeast of the Site. Percolation of groundwater
through the silty clay unit is expected to be very limited.
2.2.3.2 Bedrock
Hydrogeology of the Conemaugh group under the Site was investigated with 14 borings. Pressure tests
were conducted in all 14 test holes to evaluate the hydraulic conductivity of this rock. The average value of
the hydraulic conductivity measured was 10"s cm/sec (D'Appolonia, 1981). Regionally, the bedrock
aquifer yields 1 to 400 gallons/minute to wells, with an average of 16 gallon/min. Bedrock dips towards
the Monongahela River, so groundwater movement is expected to be in this direction.
Depth to groundwater in the bedrock has been categorized using structural geology maps and stratigraphic
sections of the area. Based on the structural map of the base elevation of the Pittsburgh Coal, the bedrock
at the site lies approximately 100 feet below the top of the Conemaugh Series (Table 2-1). Using this
guideline, surface bedrock at the site consists of a sandy red shale overlying the Connellsville sandstone
unit. The Connellsville sandstone is expected to be water bearing and should be encountered within 40 feet
of the top of the bedrock based on the average 40 feet thickness of the shale unit. Thus, bedrock
groundwater is expected to be encountered within the top 40 feet of bedrock at the Site.
2.2.4 Surface Water
Surface water leaves the Site via several storm sewers to the southeast and via an unnamed tributary to the
Monongahela to the northwest. The unnamed tributary accepts flow from three other small on-site surface
water channels and from off-site sources. A surface water channel with its headwaters on a hill southwestof the Site enters the unnamed tributary below Oxidation Impoundment No. 2. The second surface water
channel flows southeast to northwest along the south landfill, and then into Oxidation Impoundment No. 2.
The third also flows southeast to northwest, and receives runoff from the north face of the North Landfill
before flowing into Oxidation Impoundment No. 2.
2.3 SITE HISTORY
The following subsection (Section 2.3.1) describes the history of the Fairmont Coke Works. This is
followed by a description of a typical coke manufacturing process (Section 2.3.2) to aid in the identification
of potential source areas and waste streams.
Sharon Steel, ESI WP 14 Final70812-20-C August 1998
A R I O I 3 3 5

2.3.1 History of the Fairmont Coke Works
Domestic Coke Corporation (Domestic), a fully-owned subsidiary of Standard Oil of New Jersey (the
current Exxon Corporation), purchased the original site in 1918. The land was conveyed the next day to the
United States Ordinance Department "for the construction and/or operation of a sixty oven by-product coke
plant for the making of toluol (toluene) and other products". The land with improvements was re-conveyed
to Domestic in 1920, at which time Domestic began producing coke at the facility. Initially, the primaryfunction of the facility was the refinement of light oils from coal with coke a principal by-product. Withthe onset of World War II, the primary emphasis changed to the production of coke for the manufacturing
of steel for the war effort (Weston, 1995).
In 1948, Sharon Steel Corporation (Sharon Steel) purchased the coke works, and operated it until 1979.
The coke works has not been used since 1979 (Kearney, 1986). The coke works consisted of coke ovens,coal and coke handling facilities, by-products recovery structures, coal tar tanks, other product andproduction intermediate tanks, gas scrubbers, and machinery and equipment maintenance buildings. The
plant processed about 1,000 tons of coal daily to produce coke. By-products included coal tar, phenol,ammonium sulfate, benzene, toluene, xylene, and coke oven gas (Keamey, 1986).
Many of the by-products of coke manufacturing were sold to nearby businesses. Coal tar was sold to ReillyTar and Chemical (Big John's Salvage) and coke oven gas was sold to neighboring businesses such as
Owens Coming and Phillips Lighting (Weston, 1995).
Plant wastes were disposed of on-site in landfills, sludge ponds or waste piles. Since 1920, solid wastes
were deposited in two on-site landfills: the North Landfill and the South Landfill. Since the early 1960s,
process water from the coke plant was treated in two wastewater oxidation impoundments: Oxidation
Impoundment #1 and Oxidation Impoundment #2. The impoundments were constructed along a former
creek channel on the west end of the plant production area. Sludge from the oxidation impoundments was
periodically removed and placed in two areas: the Redeposited Sludge pit located at the base of the SouthLandfill and the Upper Sludge Pit a bermed area created north of Oxidation Impoundment #2 (Keamey,
1986).
Tar sludge from the oil recovery operations was placed in a pit referred to as the Waste Tar Pit, located inthe central plant area (northeast area of the property) near the decanter tanks. Breeze (fine grained residue
from coal and coke handling) was deposited in the Breeze Pile, adjacent to the North Landfill. Surface
Sharon Steel, ESI WP 2-5 Final70812-20-C August 1998
A R I O I 3 3 6

water runoff carried an estimated 12,000 cubic yards of breeze from the breeze pike down slope to the
Breeze Washout Area, a low-lying drainage way that parallels the entire length of the North Landfill(Kearney, 1986).
2.3.2 Typical Coke Manufacturing Processes and Waste Generation
From 1910 until the depression era, a number of by-product coke ovens were built initially for the World
War I war effort, including this facility. The need for coal tar dyes as chemical intermediates, explosives,
raw and intermediate materials, and coke for steel making fueled this expansion of by-product recovery
coke ovens. In the recovery ovens, coal was charged into slot type retorts constructed of silica and clay
refractories, where it was destructively distilled in the absence of air to make coke. The evolving gases
underwent a variety of clean up and recovery steps. These recovery processes captured valuable products
for sale or removed residuals that interfered with the combustion or distribution of the coal gas. The
recovery processes consisted of cooling and scrubbing for tar removal, scrubbing for naphthalene removal,ammonia, and light oil collection, and chemical conversion for sulfur removal.
In the process of capturing these products a number of residuals were produced. These may have included
the following:
• Sludges,• Spent iron oxide,• Coke breeze and off-grade coke, and• Process residuals (light oil, sulfate, tar, naphthalene, iron filings, wash oil muck)
Sludges associated with the coke plant can consist of tar, oil, lime, acid, and caustic materials. Tar
sludges, heavy hydrocarbons entrained with fine coal or coke solids, were accumulated in collecting mains,
decanter tanks, and in other portions of the gas cleaning area. The majority of this material was generated
from the tar decanter tanks but it could also be found in the coke oven gas collecting mains atop the ovens
and in gas mains throughout the by-product area. Tar sludges could also be found as residuals in tar
storage tanks, ammonia liquor tanks, and tar dehydrator tanks. Coal tars principally contain poly-nuclear
aromatic hydrocarbons, phenolics, and small amounts of aromatic hydrocarbons.
Lime sludges were generated in ammonia removal from excess waters generated during the coking cycle.
Ammonia was stripped from the excess waters (oil/water mixture also known as flushing liquor or
ammonia liquor) in an ammonia still, reintroduced into the gas stream, and reclaimed as ammonium sulfate.
Sharon Steel, ESI WP 2-6 Final70812-20-C August 1998
A R I O I 3 3 7

These liquors contained both free ammonia salts (carbonate, sulfide, cyanide, carbamate, etc.) and fixed
salts (chloride, thiocyanate, thiosulfate, sulfate, etc.). The free ammonia and free acid gases were steam
stripped in the free ammonia still. The stripped liquors were then mixed with a base, such as lime (a
carbonate), which reacts chemically with the fixed ammonia compounds in the liquors to change them to
free ammonia compounds. The treated liquor was sent back to the ammonia still where the free ammonia
was then steam stripped as mentioned above. The stripped liquors were sent to a settling basin where the
lime was settled from the waste stream. The waters were typically used for coke quenching while the lime
was disposed of. The disposed lime sludges typically contain small quantities of cyanide and sulfur
compounds.
Acid sludges were generated both at the gas scrubbing ammonia saturators and in the light oil washing
plant. Sludges at the ammonia saturators would have consisted of ammonia sulfate, tar, and dilute sulfuric
acid. They were generated when fine tar mists were scrubbed out of the gas stream during the ammoniaremoval process and polymerized. They collected on and in tanks at the saturators and at the mother liquor
tank where they were removed and disposed.
Oil sludges would be generated in the wash oil (straw oil) purification process. A small portion of the
circulating wash oil, used to extract the light oils (BTX) from the gas stream, would be passed through a
rcboiler where it would be heated and volatilized. Entrained solid particles and polymerized oils wouldcook out of the oil stream in this reboiler and form an oily muck. The muck was then used as a bulk
density stabilizer on coal charged to the ovens or disposed. Acid sludges were also generated in the light oil
washing plant. Crude light oils were acid washed to remove impurities prior to the light oils being
processed as benzol or motor fuel. Caustic sludges were also generated at this point from a neutralizationprocess.
Spent iron oxide waste material was generated in the purifiers used to remove hydrogen sulfide from cokeoven gas. This was done by passing the gas through a hydrated iron oxide, producing ferric sulfide. Spent
oxide was regenerated by contact with air producing reactivated iron oxide and sulfur. Cycles of foulingand regeneration were continued until the oxide was fouled by traces of tar in the gas, or the iron reactedwith cyanide to produce ferrocyanides. At this point, the spent iron oxide was discarded and replaced. The
iron oxide beds consisted of two or three layers of iron oxide mixed with wood shavings, saw dust, or
corncobs to provide better gas contact and to reduce pressure drop. Purifier wastes are easily recognized
because of blue staining imparted by ferrocyanides. Other vessel packing similar to the iron oxide may
Sharon Steel, ESI WP 2-7 Final70812-20-C August 1998
A R I O I 3 3 8

also be present. Many of the vessels were packed with iron filings to enhance adsorption of gaseous
products. During vessel maintenance, some of these vessel internals were typically discarded.
Coke breeze and off-specification coke are relatively stable wastes but may gradually leach trace metals
that were present in the coal. Breeze is defined as any by-product material that is 1/4 inch or less in
diameter and has no fixed chemical composition. These matenals were generated due to poor operational
practices, improper coal selection, or from the abrasion of coke. Brick from oven maintenance and repairs
may have generated various silica and clay refractory waste. These were usually crushed and disposed on
site.
Process residuals from spillage or leakage may also be identified in coke plant waste. These may include
tar, ammonium sulfate, oils, and sulfur compounds. Appreciable quantities of these materials are unlikely
to be present in waste materials, however, since they were valuable commodities and could usually berecovered.
2.4 PREVIOUS INVESTIGATIONS
Several environmental investigations have been conducted at the site since 1980, including an emergency
removal action by the USEPA. The following subsections summarize the findings of these investigations.
Tables that summarize the laboratory results obtained during these investigations are provided inAppendix A.
2.4.1 Environmental Reconnaissance Report
An Environmental Reconnaissance of the Fairmont Coke Works was performed by Sharon Steel during
1979-1980 (D'AppoIonia, 1980). Twenty soil samples were collected to evaluate cyanide and phenol
contamination. Nine groundwater samples (six shallow groundwater and three deep groundwater) and 14
surface water samples (from three site drainages) were collected to determine water quality.
The nine groundwater and fourteen surface water samples were analyzed for temperature, pH, dissolved
oxygen and specific conductivity at the time of sampling; acidity, alkalinity and Eh prior to shipping to the
laboratory; and water quality analyses (metals, selected anions, dissolved oxygen, COD, TOC, oil and
grease, nitrogen, phenols) at the laboratory. One groundwater sample (shallow depth from a piezometer
located between the LOS and By-Products Area) and one surface water sample collected from the process
water sewer outfall were analyzed for benzene, toluene and xylene.
Sharon Steel, ESI WP 2-8 Final70812-20-C August 1998
A R I O I 3 3 9

The 20 soil samples were analyzed for cyanide and phenol, with some of the samples also analyzed for
sulfur/sulfate, iron, oil and grease, and acid/base, neutralization and acidity potentials. Results of the soil
sampling indicated that cyanide levels were not significant (average concentration 1.9 mg/kg, ranges < 0.5
mg/kg to 7.5 mg/kg) and, except for one boring, phenol results were less than 2.5 mg/kg. The high phenol
results (562-662 mg/kg) were from the tar pit area, where one sample had an oil and grease concentrationof 733 mg/kg.
The benzene concentration in the shallow groundwater sample was 95.8 ug/L, while the concentration of
toluene and xylene was less than 4 ug/L. The concentration of benzene, toluene, and xylene in the outfallsample were below 4 ug/1. The outfall sample was also analyzed for semivolatile organic compounds and
polynuclear aromatic hydrocarbon (PAHs), with six compounds detected along with phenol and Bis-(2-
ethylmethyl) -phthalate.
Conclusions drawn by D'Appolonia based on the groundwater and surface water sampling were as follows:
• ' Water quality along the northern drainage channel was considered "poor."
• Water quality along the eastern drainage channel was considered "good."• Groundwater quality was generally "good."• Groundwater quality in the vicinity of the tar pit area was "poor."• The coal pile, LOS area and tar pit area were adding to the acidity of the surface water.
• Phenol and cyanide contamination was minimal.• Oil and grease levels at some sampling points (southern portion of the property) were attributable
to the "natural degradation of organic detritus (leaves, grass, etc.)."• There was very little variation in water quality between the upper and lower groundwater zones.
2.4.2 Remedial Site Waste Disposal Design Report
Sharon Steel conducted additional geologic and hydrogeologic studies at the Site during 1981. The purpose
of the studies was to investigate the subsurface conditions in the immediate waste disposal areas. Theresults of this investigation were presented in the Remedial Site Waste Disposal Design Report
(D'Appolonia, 1981).
The investigation included drilling 19 soil borings and installing 9 piezometers. Soils were classified and
sampled to evaluate the subsurface material. Also, hydraulic pressure (packer) tests were performed to
Sharon Steel, ESI WP 2-9 Final70812-20-C August 1998
A R I O I 3 U O

determine the permeability of the subsurface materials. Hydraulic conductivity was measured at 10°
centimeters per second (cm/s) in the alluvial sands and 10"! cm/s in the bedrock. (D'Appolonia, 1981)
In addition to the above Site investigations, a search was performed to determine if deep mining in the area
may increase the potential for ground subsidence. It was determined that local deep mine operations did
"not appear to exist for the proposed waste disposal area" or the Site in general. The report also stated that
"the potential for future deep mining appears to be minimal." (D'Appolonia, 1981)
2.4.3 CERCLA Immediate Removal Assessment
A CERCLA Immediate Removal Assessment was conducted in 1983, revealing significant soil and
groundwater contamination in the vicinity of the oxidation impoundments and a highly acid runoff from the
breeze pile. No immediate threats to human health were noted and immediate removal actions under
CERCLA were not determined to be appropriate at the Site. (Kearney, 1986)
Thirteen (13) Solid Waste Management Units (SWMUs) were identified during the assessment. These
included (Kearney, 1986)
• SWMU 1-South Landfill
• SWMU 2- North Landfill
• SWMU 3- Oxidation Pond #1
• SWMU 4- Oxidation Pond #2
• SWMU 5-Breeze Pile• SWMU 6- Breeze Washout Area
• SWMU 7-Waste Tar Pit
• SWMU 8- Light Oil Area
• SWMU 9- Redeposited Sludge Area (pond)• SWMU 10- Upper Sludge Pond
• SWMU 11- Drainage Sluiceway• SWMU 12- Benzol Scrubber Area
• SWMU 13-Gas Holder
Sharon Steel, ESI WP 2-10 Final70812-20-C August 1998
A R I O I 3 U

2.4.4 Phase II RCRA Facility Assessment
On behalf of the USEPA, a Phase II RCRA Facility Assessment (RFA) was performed by AT. Keamey,
Inc. (Keamey) and The Earth Technology Corporation (Earth Tech) in 1986. Results of the RFA were
presented in the Phase II RCRA Facility Assessment Report (Keamey, 1986).
The Phase II RFA identified six additional SWMUs to the ones identified in the preliminary assessment, asfollows:
• SWMU 14- Unpurified Gas Holder
• SWMU 15-Benzol Area
• SWMU 16- Gas Purifier Tanks
• SWMU 17- Tie Treating Area
• SWMU 18- Phenol Recovery Plant Area• SWMU 19- Wastewater Pipes
It was also noted that, although the facility is not within a flood prone region, extensive flooding of the Site
occurred in November 1995. Table 2-2 presents descriptions of each SWMU and lists managed wastes at
each, as presented in the Phase II RFA Report.
Of the above SWMUs, it was concluded in the Phase II RFA that no Further action was necessary for the
following SWMUs:
SWMU 11 - Drainage SluicewaySWMU 12 - Benzol Scrubber AreaSWMU 13-Gas HolderSWMU 14 - Unpurified Gas HolderSWMU 16 - Gas Purifier TanksSWMU 19 - Wastewater Pipes
2.4.5 Emergency Removal Action
In May 1993, the USEPA began an emergency removal action at the Site. The emergency removal action
was initiated with the detonation of two jars of crystallized picric acid and the lab packing of approximately
250 containers of unknown lab chemicals (May 26-28, 1993), and concluded with the stabilization and
Sharon Steel, ESI WP 2-11 Final708I2-20-C August 1998
A R I O I 3 U 2

solidification of process sludges from Oxidation Ponds #1 and #2 (September 14 - December 18, 1995).
Final grading and hydroseeding was completed August 2, 1996.
The following summary of the emergency removal action was drawn from the daily pollution reports
(POLREPs) prepared by the USEPA Region HI On-Scene Coordinator (OSC) or the associated Federal
On-Scene Coordinator's After Action Report (AAR) (USEPA, 1996) unless noted.
The emergency removal action was initiated in May 1993 with an emergency stabilization of the on-Site
laboratory building, which consisted of securing small containers of lab chemicals in the laboratory
building on Site. During these activities, two jars of crystallized picric acid (an explosive) were detonated
under the supervision of the WVDEP and a WV State Fire Marshall. Additionally, all sample containers
were segregated, with known chemicals being lab packaged and unknown materials set aside for remote
opening. All of the unknowns were opened without incident, generating three drums of mixed waste. All
packaged materials were staged within the laboratory building on Site for future disposal.
During the segregation of the chemicals, a significant amount of spilled mercury was found on the counter
top of one room in the laboratory building (Building AE). The door of the room was secured. The mercury
was subsequently removed and containerized for recovery.
Activities on Site resumed in December 1993 with a Site inventory of all vessels. Included in the inventory
were buildings, tanks, vessels, sumps, and drums. On December 18-19, 1993, the Emergency ResponseCleanup Services (ERCS) contractor stenciled numbers on all 51 buildings for identification purposes. No
correlation between building names and numerical designations was found in the USEPA fries, however,
some numerical designations are still visible on the remaining Site structures. All entries in the POLREPs
and AAR used these building numerical designations. Correlations between numerical designations and
building names have been made where possible.
During December 1993, contents of all accessible tanks were sampled. Several tanks identified during the
inventory could not be sampled at this time because they were inaccessible, primarily due to the dangers to
personnel from the poor condition of surrounding structures.
Sharon Steel, ESI WP 2-12 Final70812-20-C August 1998
A R I O I 3 U 3

Activities on Site resumed in February 1994 and continued until December of that year. Highlights of these
activities included:
• Completed inspections of all Site buildings;• Cleaned debris from within buildings and generally across the Site;• Completed drum inventory;• Categorized hazardous materials discovered on Site;• Inventoried of all transformers, electrical switches and capacitors;• Dismantled Site structures, including vessels, buildings, tanks, and piping;• Removed hazardous waste from Site, including tar, product, contaminated water, and asbestos;
• Removed non-hazardous waste from Site, including scrap metal• Stabilized and implemented erosion control measures at outfalls;• Removed material from the Breeze Washout Area;• Consolidated waste in the North Landfill; and
• General Site grading to control surface drainage.
Transformers, capacitors and electrical switches were tested for PCBs. All capacitors and many of
switches and transformers tested positive for PCBs. The PCB-containing oil (about 650 gallons) was
bulked for disposal.
Two buildings, other than the laboratory (Building AE), were identified in the POLREPs as primary
staging for hazardous and potentially hazardous materials: Building AT (identified as the Machine Shop
during the Site Survey) was used for the staging of drums and sheared tanks (such as those from the Tar
Storage Area), and Building AJ (identified as the By-Products Building during the Site Survey) was used
for the staging of asbestos containing materials. Building AW was used to store brick removed from
Building AZ; and Building AZ was in turn used to stage scrap metal and sheared tanks. (It is assumed that
the material staged in Building AZ was non-hazardous because it was not staged in Building AT). In April
1994, a scrap staging area was set up in a "central location on Site."
In order to dismantle tank ZZT31 (the gas holder tank), water from the tank was pumped into the basement
of Buildings BM and BL (identified as the Track Hoppers in the Coal Yard during the Site Survey). The
transfer was performed through existing Site water lines from May 24, 1994 through June 1, 1994. This
was done to gain freeboard and to determine if "low-level benzene volatilized during the transfer." The June
9, 1994 POLREP indicates that benzene concentrations in the water transferred to Buildings BM and BL
Sharon Steel, ESI WP 2-13 Final70812-20-C August 1998
A R I O I 3 1 + U

was 0.071 mg/L while the water in ZZT31 contained 0.52 mg/L benzene. (There was no mention of the
removal of the water from Buildings BM and BL.) An entry on September 23, 1994 states that "ERCS
isolated a leaking hydrant line which was flooding the area adjacent to ZZT31.
On June 21, 1994, ZZT31 was estimated to contain 1.5 million gallons of benzene contaminated water.
From June 27, 1994 through July 20, 1994, approximately 26,100 gallons of emulsified oil was recovered
from tank ZZT31. The remaining benzene-contaminated water was aerated to decrease benzene
concentrations to acceptable limits, allowing for disposal to the City of Faimiont's Publicly Owned
Treatment Works (POTVV). Aeration continued from July 22, 1994 through September 27, 1994.
Discharge was initiated on October 7, 1994 and completed by November 11, 1994.
Dust control measures were implemented periodically during 1994. During June of that year, mention was
made of pumping water from the basement of Building AI for this purpose.
Earth work (removal of breeze washout material, consolidation of the North Landfill, and Site grading) wasinitiated in September 1994. Consolidation of the North Landfill included relocating material from the
western end of the landfill and spreading it across the eastern end. Contaminated soils were excavated
(scraped) from the polisher, purifier, and breeze washout areas to a central staging area. From the central
staging area, contaminated soils were transported to the North Landfill for consolidation.
General Site grading across the entire property was performed to facilitate storm water drainage. An entry
on September 21, 1994 indicated that the Site grading uncovered "visually contaminated soils (blue)
remaining in the purifier area." The soils were left in place after analytical data indicated "the risk posed byleaving the soil in place, if any," was "acceptable." Information was not included in the report regarding
the nature of the analysis performed nor the results of the analysis. During the same period, the material at
the "Upper Sludge Pit" and "Pit #2" (believed to be the same location, Upper Sludge Impoundment) was
removed in preparation for storage of the breeze washout material in this area.
Beginning October 19, 1994 and continuing to November 11, 1994, the breeze washout material was
removed from the Breeze Washout Area and consolidated in the "Upper Sludge Impoundment."Approximately 12,000 cubic yards of breeze material was placed in the impoundment and covered with a
60-millimeter high-density polyethylene (HOPE) liner (Weston, 1995). While not specifically stated in the
POLREPs or the AAR, it was implied that the original sludge removed from this area was re-entered in this
Sharon Steel, ESI WP 2-14 Final708I2-20-C August 1998

area after the breeze was placed. Excavation, backfilling and final grading was completed December 22,1994, concluding this segment of the emergency removal action.
On-Site activities resumed in March 1995 with trenching in the Light Oil Storage (LOS) area to determine
subsurface sampling locations. Trenching in the LOS area indicated floating product on the groundwater at
a depth of approximately 3 feet below ground surface.
Additional Site grading was accomplished to control storm water drainage. One highlight was the
observance of Earth Day (4/21/95), during which EPA personnel and subcontractors were joined by
students and teachers from local schools, and volunteers from the community, for tree planting activities,
implemented as part of the erosion control measures.
Also during early to mid 1995, general Site cleanup activities were performed (e.g., wood and brick
removal). In addition, tank 2ZT31 was dismantled. From July 25, 1995 to August 3, 1995, ERCS
removed the unstable northeastern toe of the North Landfill, redistributing the material in the south and
west sections of the landfill. This was done "to minimize the potential of slope failure of the northern slope
of the North Landfill into the Breeze Washout Area."
In August 1995, more erosion control measures were implemented, included the slope stabilization of the
South Landfill. Additionally, pilot studies were performed for the stabilization of the sludge from Oxidation
Pond #1. From September to December 1995, sludges from Oxidation Pond #1 and Oxidation Pond #2
were solidified and transported off Site for disposal at a RCRA non-hazardous waste landfill. A total of
8,764 tons were solidified from Oxidation Pond #1 and 25,618 tons from Oxidation Pond #2. These efforts
were completed on December 18, 1995.
During July 1996, a crew was mobilized to the Site for final grading and hydroseeding. These activities,
and the emergency removal action were terminated on August 2, 1996.
2.4.6 Extent of Contamination Survey
In April 1994, USEPA conducted an Extent of Contamination Survey by sampling the nodes of a fixed grid
established across the Site for shallow (0 to 4 feet) soil samples. A primary 200-foot by 200-foot grid wasestablished across the entire Site and the western third of the Site was further subdivided into a 50-foot by
50-foot grid. In general, soil samples containing tar, especially those from tar disposal areas (landfills,
Sharon Steel, ESI WP 2-15 Final70812-20-C August 1998
A R I O I 3 U 6

oxidation impoundments) had high levels of PAHs and elevated levels of VOCs and heavy metals. Soil
samples from the LOS and vicinity had elevated BTEX and naphthalene concentrations (Weston, 1995).
Random sampling across the Site indicated that outside of the primary source areas, the soils were
relatively free of contamination. The exceptions were any soil sample containing tar (indicating that the
presence of tar is the significant factor) and sporadic elevated lead levels. Table 2 presents a summary of
the EOC findings in areas outside of the ESI investigation areas.
BTEX compounds were present in surface waters draining from the LOS Area and from the North Landfill
area. Also, discharge from Oxidation Pond #2 (SWMU 4) had elevated levels of cyanide, total suspended
solids, iron, magnesium, and zinc. Air sampling concluded that airborne contamination was insignificant.
EOC sampling occurred prior to the removal of sludges from the oxidation impoundments and prior to the
general Site grading. Therefore, direct correlation of the soil data is not possible.
Sharon Steel, ESI WP 2-16 Final70812-20-C August 1998
A R I O I 3 U 7

TABLE 2-1
GENERAL STRATIGRAPHY OF THEUPPER SECTION OF THE CONEMAUGH SERIES IN WEST VIRGINIA
Lithologic Description
Underclay and ShaleSandstone Massive, Lower PittsburghShale, GrayLimestone, Upper PittsburghCoal, Little PittsburghUnderclay and Gray ShaleLimestone, Lower PittsburghShale, Sandy and RedSandstone, Massive, Brown, Pebbly,ConnellsvilleCoal, Little ClarksburgUnderclay, Clay Shale, ClarksburgSandstone, Massive, Mottled withPeroxide of Iron, Lenticular, Quarriedat Morgantown, Lower ConnellsvilleLimestone, Gray and Hard, ClarksburgShale, Sandy and Red, Clarksburg RedsSandstone, Massive, MorgantownCoal, Elk LickUnderclay and ShaleLimestone, Dark Gray, Elk LickCoal, West MilfordShale, Sandy and Red, BirminghamSandstone, Massive, Pebbly,Lenticular. Grafton
Thickness (ft)
5353417104030
1520
5 to 153740295
2" to l '1020
Total Thickness (ft)
5404347485565105135
136141161
176213253255264269270280300
Sharon Steel, ESI WP70812-20-C
2-17
A R I O I 3 4 8Final
August 1998
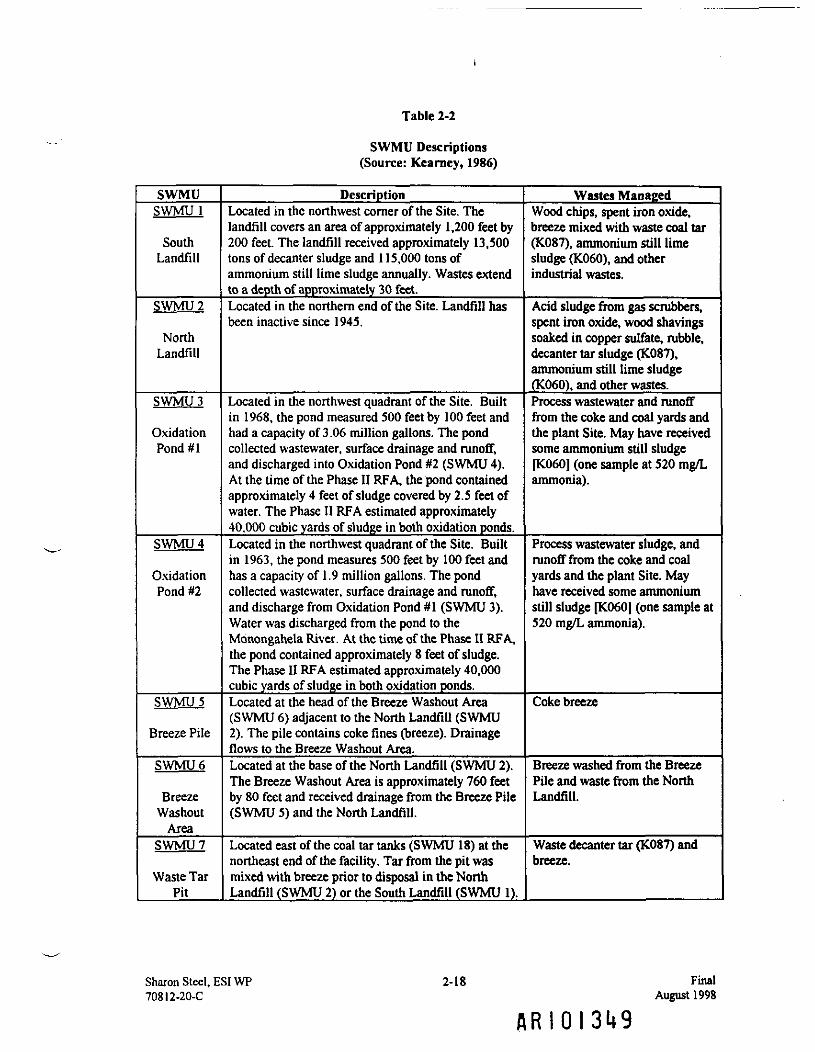
Table 2-2
SWMU Descriptions(Source: Kearney, 1986)
SWMU Description Wastes ManagedSWMU1
SouthLandfill
Located in the northwest corner of the Site. Thelandfill covers an area of approximately 1,200 feet by200 feet. The landfill received approximately 13,500tons of decanter sludge and 115,000 tons ofammonium still lime sludge annually. Wastes extendto a depth of approximately 30 feet._________
Wood chips, spent iron oxide,breeze mixed with waste coal tar(K087), ammonium still limesludge (K.060), and otherindustrial wastes.
SWMU 2
NorthLandfill
Located in the northern end of the Site. Landfill hasbeen inactive since 1945.
Acid sludge from gas scrubbers,spent iron oxide, wood shavingssoaked in copper sulfate, rubble,decanter tar sludge (K087),ammonium still lime sludge(KQ60). and other wastes.___
SWMU 3
OxidationPond#l
Located in the northwest quadrant of the Site. Builtin 1968, the pond measured 500 feet by 100 feet andhad a capacity of 3.06 million gallons. The pondcollected wastewater, surface drainage and runoff,and discharged into Oxidation Pond #2 (SWMU 4).At the time of the Phase IIRFA, the pond containedapproximately 4 feet of sludge covered by 2.5 feet ofwater. The Phase II RFA estimated approximately40.000 cubic yards of sludge in both oxidation ponds.
Process wastewater and runofffrom the coke and coal yards andthe plant Site. May have receivedsome ammonium still sludge[K060] (one sample at 520 mg/Lammonia).
SWMU 4
OxidationPond #2
Located in the northwest quadrant of the Site. Builtin 1963, the pond measures 500 feet by 100 feet andhas a capacity of 1.9 million gallons. The pondcollected wastewater, surface drainage and runoff,and discharge from Oxidation Pond #1 (SWMU 3).Water was discharged from the pond to theMonongahela River. At the time of the Phase II RFA,the pond contained approximately 8 feet of sludge.The Phase II RFA estimated approximately 40,000cubic yards of sludge in both oxidation ponds.____
Process wastewater sludge, andrunoff from the coke and coalyards and the plant Site. Mayhave received some ammoniumstill sludge [K060] (one sample at520 mg/L ammonia).
SWMU 5
Breeze Pile
Located at the head of the Breeze Washout Area(SWMU 6) adjacent to the North Landfill (SWMU2). The pile contains coke fines (breeze). Drainageflows to the Breeze Washout Area.
Coke breeze
SWMU 6
BreezeWashout
Area
Located at the base of the North Landfill (SWMU 2).The Breeze Washout Area is approximately 760 feetby 80 feet and received drainage from the Breeze Pile(SWMU 5) and the North Landfill.
Breeze washed from the BreezePile and waste from the NorthLandfill.
SWMU 7
Waste TarPit
Located east of the coal tar tanks (SWMU 18) at thenortheast end of the facility. Tar from the pit wasmixed with breeze prior to disposal in the NorthLandfill (SWMU 2) or the South Landfill (SWMU 1).
Waste decanter tar (K087) andbreeze.
Sharon Steel, ESI WP70812-20-C
2-18 FinalAugust 1998
A R I O I 3 4 9

SWMUSWMU8
Light OilArea
SWMU 9
RcdepositedSludge AreaSWMU 10
UpperSludge PondSWMU 11
DischargeSluicewaySWMU 12
BenzolScrubber
AreaSWMU 13
Gas HolderSWMU 14
UnpurifiedGas HolderSWMU 15
Benzol AreaSWMU 16
Gas PurifierTanks
SWMU 17
Tie TreatingArea
SWMU 18
PhenolRecovery
Plant AreaSWMU 19
WastewaterPipes
Description1.5 acre area located near the plant entrance. Thearea was used to recover oil products from the cokingprocess.
An area approximately 100 feet by 50 feet, located atthe base of the South Landfill (SWMU 1).
An area approximately 100 feet by 200 feet, locatedon a hillside to the north of Oxidation Pond #2(SWMU 4).
An aluminum sluiceway at the western edge of theBreeze Pile (SWMU 5). The Discharge Sluicewaycarries surface water runoff from the Site.
Located in the middle of the production area. Twosteel scrubbers approximately 10 feet in diameter and80 feet in height. Associated with the scrubbers werethree 8,500 gallon tanks.
Located at the north end of the Site. A 200,000 cubicfoot gas holder used to store purified coke gas.
Located in the center of the plant. A 75,000 cubicfoot (40 feet high by 20 feet in diameter) steel gasholder used to store coke oven gas prior to transfer tothe purifier tanks.Located adjacent to and west of the Light Oil Area(SWMU 8).
Located at the north end of the Site. Four 20-footdiameter steel tanks filled with wood chipsimpregnated with copper sulfate. Spent wood chipswere landfilled on-Site (SWMUs 1 and 2).Located at the northwest edge of the facility. The areaconsisted of a creosote tank and tie treating tank forsoaking railroad ties in creosote.
Located in the north plant area.
Underground 24 to 36 inch concrete pipes drain theplant area and discharge to the oxidation ponds(SWMUs 3 and 4).
Wastes ManagedRecovered oil products (crude stillresidue, distilled heavy solvents,distilled light oil, fresh wash oil,benzene and naphthalene) andhighly acid waste from therecovery operations.Sludge from the oxidation ponds.
Sludge from the oxidation ponds.
Runoff from a large portion of theSite.
Acid sludge (from the scrubbers)and unknown wastes.
Coke gas and associatedcondensates.
Unpurified coke oven gas andassociated condensates.
Benzene and associateddistillation fractions.
Copper sulfate, wood chips andcoke oven gas condensates.
Creosote (U051).
Coal tar (K087), ammonia stillsludge (K060), phenol, caustics,acids, and distillates associatedwith phenol production.
Plant runoff. D'Appolonia (1980)claimed the tar pit (SWMU 7)drains into the pipes.
Sharon Steel, ESI WP70812-20-C
2-19 FinalAugust 1998
& R I O I 3 5 0

REFERENCE:U.S.G.S. TOPOGRAPHIC MAPS FAIRMONT EASTQUADRANGLE, wv. DATED: 1958, PHOTOREVISED: 1975FAIRMONT WEST QUADRANGLE. WV. DATED: 1958.PHOTOREVISED: 1976SCALE: 1" - 2000'
SHARON STEEL CORPORATIONFAIRMONT COKE WORKS SITE
ICF KAISER
FIGURE 2-1
SITE LOCATION MAP
DATE: 3/5/98SCALE: r-20001
DR.: BRENT
E/F NO.: 90151002
Sharon Steel, ESI WP70812-20-C
2-20
A R I O I 3 5 IFinal
August 1998

EPA REGION IIISUPERFUNO DOCUMENT MANAGEMENT SYSTEM
OOC JBPAGE *_/ S0/35SL
IMAGERY COVERUNSCANNABLB ITEM
SITE NAME
OPERABLE UNIT
ADMINISTRATIVE RECORDS* SECTION VOLUME
REPORT OR DOCUMENT TITLE
DATE OF DOCUMENT
DESCR1PTON OF IMAGERY
NUMBER AND TYPE OF iMAfigRY ITEM(S)

^FORMER71RIVER CHANNEL*f •*'-5s4sss5a»j«i v^?
REFERENCE:U.S.G.S. TOPOGRAPHIC MAPS FAIRMONT EASTQUADRANGLE, WV. DATED: 1958,.PHOTOREVISED: 1976FAIRMONT WEST QUADRANGLE, WV, DATED: 1958.PHOTOREVISED: 1976SCALE: 1" « 2000'
SHARON STEEL CORPORATIONFAIRMONT COKE WORKS SITE
ICF KAISER
FIGURE 2-3FORMER RIVER CHANNEL AND
SCHEMATIC CROSS-SECTION LOCATIONS
DATE: 3/23/98
SCALE: r-2000' E/F NO.: 90151003
OR.: BRENT
Sharon Steel, ESI WP70812-20-C
2-22 A R I O I 3 5 3 FinalAugust 1998

CJen
!u
ELEVATION (FEET)
CD
lloo1
ELEVATION (FEET)
ELEVATION (FEET)
ELEVATION (FEET)

TOWN OFFAIRMONT
JOB NO: 7081300100 PLOT SCM£: 1-490
SVKIfD tut 3/4/M REVISED: 3/30/M
NOTE:ALL LOCATIONS ARE APPROMUATE.BORNGS MSTAUED GY O'APPOLONHAND SHARON STCEL D'ApPOLONU1980 AND 1981.
300 400 FEET
SHARON STEEL CORPORATIONFAIRMONT COKE WORKS SHE
FAIRMONT, WEST VIRGINIA
ICP KAISER ENGINEERSPITTSBURGH. PA
| FIGURE 2-5
CROSS SECTION LOCATION MAP
DATE: 3/4/98SCALE: AS NOTED
DR.: B. SNYDERRLE NAME: 20155011
Shmi 3M, E5IWT 1-14 ARIOI35519H

joe MO: 7M12001 PUT scwf: 1-tSWrtED ON: 3/S/M RCWSfD: 8/17/16
1020 -
940 -
APPROXIMATE EXISTINGGROUND SURFACE
ty'/fa^^r^f/-'/,'/''/'; y\ OXIDATION—i 1^^V^^V^ f - f^\ POND 2 I \
*^^^^^TTL3$^3£DV& ^**^S!fI n^ 'X '*^^^^"' ^MO
LEGEND:VERTICAL EXAGGERATION 10X
ELEVATION OF GROUNDWATERPOSITION OF WELL SCREENLOCATION OF WELL ORTEST BORING (DASHEDWHERE PROJECTED)
SECTION C-C*VERTICAL SCALE HORIZONTAL SCALE
10 20 FEET 100
(LOOKING SOUTH)
100 200 FIET
FILL SR.TY CLAY
[ | SAND |- t* sj SANDSTONE
cn ^ E SHALE
REFERENpEjMOCHF1ED FROM D'APPOLOMA. DRAWING NUMBER 79-659-E1DATE APRIL 2. 1980.
1. ALL CONTACTS APPROXIMATE; DASHEDWHERE INFERRED.
2. WATER LEVELS TAKEN ON 6/5/80.
SHARON STEEL CORPORATIONFAKMONT COKE WORKS SITE
FAIRUONT. WEST VIRGINIA
KAISER ENGINEERSPITTSBURGH. PA
[FIGURE 2-6GEOLOGICAL CROSS SECTION C-C'
DATE: 3/4/98SCALE: AS NOTED
DR.: B. SNYDERRLE NAME: 20155009
iStad,ESIWF7W12-2CH;
A R I O I 3 5 6

JOB NO: 70612001
STM1ED Ot
PLOT SCMC 1-1
KVtSED: 6/17/9*
Dtwo
1020
1010
1000
MO
MO
930
D'1030
POOMEIER V-« SCTL BOHHC B-C HgOMETPt P-» sat
VERTICAL EXAGGERATION 10X
SECTION D-D'VERTICAL SCALE HORIZONTAL SCALE
LEGEND:
I———ELEVATION OF GROUNOWATERffl———POSITION OF WELL SCREEN
20 FEET 100
(LOOKING SOUTH)
LOCATION OF WELL OR TESTBORING (DASHED WHERE PROJECTED)
EHEH
FILL
SAND
'J( SILTY CLAY
,J SANDSTONE
SHALE
100 200 FEET
1. ALL CONTACTS APPROXIMATE: DASHEDWHERE INFERRED.
2. WATER LEVELS FOR PCZOUETER SS-4AND V-4 WERE TAKEN ON 5-7-81.ALL OTHER WATER LEVELS TAKEN ON6-5-80-
REFERENCE:BORING LOGS FROM D'APPOLONIA ENVIRONMENTALRECONNAISSANCE 1980 AND D'APPOLONA REMEDIALSITE WASTE DISPOSAL 1981. CROSS SECTION D-D'MODIFIED FROM D'APPOLONIA 1981.
-I—^. •—- tM.——,—•**- * -**- V.-.
VERTICAL EXAGGERATION 10X
SECTION E-E'VERTICAL SCALE HORIZONTAL SCALE
1O 20 FEET 100
(LOOKING SOUTH)
100 200 FEET
E*MUO
1010
•70
SHARON STEEL CORPORATIONFAIRMONT COKE WORKS SITE
FAIRUONT, WEST VIRGINIA
IGF KAISER ENGINEERSPITTSBURGH. PA
[FIGURE 2-7GEOLOGICAL CROSS SECTIONS
D-D1 AMD E-E'
DATE: 3/4/98__ DR.: B. 5NYDERSCALE AS NOTED RLE NAME: 2015501Q
FwdStern Sted. ESI WP70U2-WC
A R I O I 3 5 7

EPA REGION IIISUPERFUNO DOCUMENT MANAGEMENT SYSTEM
OOC IDPAGE *
IMAGERY COVER 3HFF TITEM
SITE NAME
OPERABLE UNIT PI
ADMINISTRATIVE RECORDS- SECTION
REPORT OR DOCUMENT TiTLB
t
DATE OF DOCUMENT F>*L
DESCRIPTON OP iMAQERY
oi
NUMBER AND TYPE OP IMAGERY ITEM(S),

IGF KAISERwiJe ExctlUnet in Meeting Clitnt Nttdt
A R I O I 3 5 9

3.0 SITE REGULATORY FRAMEWORK, RA AND EE/CA SCREENING
In order to determine what data needs must be met in the performance of the ESI, data quality objectives(DQOs) for the ESI were established. The DQOs were determined by several factors, including, but notlimited to: potential Applicable or Relevant and Appropriate Requirements (ARARs) that must beconsidered in establishing action levels and clean-up criteria; potential migration pathways that may exist atthe site; potential remedial action objectives; and the associated remedial alternatives which may meetthese objectives. The following section describes ICF Kaiser's preliminary review of data pertaining toeach of these factors. A full evaluation of site-specific ARARs will be included with the EE/CA workplan(s).
Upon completion of the ESI, all data obtained will be evaluated in light of their adequacy for completion ofthe risk assessment and EE/CA tasks. The associated impacts of remaining data gaps, if any, will beassessed at that time.
3.1 POTENTIALLY APPLICABLE OR RELEVANT AND APPROPRIATEREQUIREMENTS
One of the primary considerations in the development of remedial action alternatives for sites governed byCERCLA is the degree of public health or environmental protection afforded by each remedy. EPA policyrequires that in the process of developing and selecting remedial action alternatives, consideration must begiven to actions that attain or exceed potential ARARs, as defined by the National Oil and HazardousSubstances Pollution Contingency Plan (NCP) and the Superfund Amendments and Reauthorization Act(SARA). The purpose of this requirement is to make CERCLA response actions consistent with otherpertinent Federal and state environmental requirements.
SARA defines an ARAR as:
• Any promulgated standard, requirement, criterion, or limitation under Federal environmental law.• Any promulgated standard, requirement, criterion, or limitation under a state environmental or
facility siting law that is more stringent than the associated Federal standard, requirement,criterion, or limitation.
Potentially applicable requirements are federal public health and environmental requirements that arelegally applicable to a remedial action if that action was not undertaken pursuant to CERCLA. Forexample, if hazardous waste treatment, storage, or disposal activities were undertaken under an approved
Sharon Steel, ESI WP 3-1 Final70812-20-C August 1998
A R 1 0 1 3 6 0

RCRA permit, applicable regulations promulgated under RCRA would be available to legally define the \^required waste management activities. Potentially relevant and appropriate requirements will be federalpublic health and environmental requirements that apply to circumstances sufficiently similar to thoseencountered at CERCLA sites, where their application, although not legally required, would beappropriate. In addition, SARA requires that state ARARs be considered during the selection of remedialalternatives, if they are more stringent than federal requirements. EPA has also indicated that "other"criteria, advisories, and guidelines (CAGs), while not ARARs, should be considered in devising remedialalternatives. The applicability, relevance, and appropriateness of any Federal, State, or local requirementswill be determined as the ESI, EE/CA(s), and Project XL programs continue.
3.2 POTENTIAL PATHWAYS OF CONTAMINANT MIGRATION / PRELIMINARY RISKANALYSIS
Following determination of Site physical characteristics and delineation of contaminated areas, a riskassessment will be conducted. The objective of the RA will be to determine the magnitude and probabilityof actual or potential risk to public health, welfare, or the environment due to contaminants released fromthe site. This assessment will include:
• Identification of chemicals of potential concern based on toxicity, persistence, mobility, andquantity present
• Identification of points of potential ecological or human exposure.• Identification of potential complete exposure pathways and relevant receptor pathways.• Characterization of potential receptors• Extent of risk and the likelihood of such risk occurring
The RA work to be completed is currently being developed and will be described in the forthcoming RAWork Plan. The work plan will include a discussion of potential receptors and exposure pathways. Themethodologies to be used and criteria for assessing risk will also be provided.
3.3 PRELIMINARY IDENTIFICATION OF REMEDIAL ALTERNATIVES
Remedial alternatives identification are currently undefined and will be completed as part of the EE/CAWork Plan(s).
Sharon Steel, ESI WP 3-2 Final70812-20-C August 1998
A R I O I 3 6 I

Section 4
cc I^ 5^^ eCMV£>CO
O
0=

4.0 WORK PLAN RATIONALE s^>
The goal of the ESI Work Plan is to assure that sufficient data are collected during the ESI to determine thenature and extent of contamination at the site as needed to evaluate site risk. Prior to development of thisWork Plan, ICF Kaiser conducted several site reconnaissance visits and reviewed alt available documentspertaining to previous site work and investigations. These data were used to develop both the site historyand conceptual model and to determine the scope of the ESI investigations. Data sources used to developthis information consist of
• Previous investigation reports prepared by D'Appolonia (for Sharon Steel Corporation)and Weston, Kearney, and Earth Technology Corporation (for USEPA)
• USEPA records of the removal action• USGS topographic quadrangle maps• Discussions with former Sharon Steel employees• On-site inspections of the site and its features.
In general, our approach to investigating the Site is to combine historical, operational, and environmentalinformation already known from the sources listed above with sampling information collected during the RI .<to determine the nature and extent of contamination present at the Site. The significance of any observedcontamination will be addressed in the Risk Assessment phase of this program.
The remainder of this section of the Work Plan explains, in more detail, our rationale for samples that areproposed for collection as part of the ESI. Subsection 4.1 outlines the eight specific areas where ESI
sampling will occur. Subsection 4.2 discusses the data gaps associated with these areas. Subsection 4.3outlines those portions of the Site where no further sampling is deemed necessary, Subsection 4.4 describesthe overall sampling program, including sample locations and analyses. Subsection 4.5 provides the DataQuality Objectives for the ESI.
4.1 POTENTIAL SOURCE AREA DELINEATION
Based upon the historic data summary in Section 2.0, a total of 8 potential source areas (PSAs) wereidentified based on their prior use and the types of materials stored there.
The areas of proposed ESI sampling consist of the former process areas, the solid waste disposal areas, andthe surface impoundment. These eight areas or PSAs, are shown on Figure 2-8 and consist of:
Sharon Steel, ESI WP 4-1 Final70812-20-C August 1998
A R I Q I 3 6 3

• Area 1 - Former Light Oil Storage Area• Area 2 - Former Production Area• Area 3 - Former Coke Ovens• Area 4A - Existing North Landfill• Area 4B - Existing South Landfill• Area 5 * Former Breeze Washout Area• Area 6 - Existing Impoundment - (formerly Oxidation Impoundment No. 2)• Area 7 • Existing Waste Sludge and Breeze Storage Area • (formerly the Upper Sludge Pit)• Area 8A - Former Sludge Storage Area (formerly the Redeposited Sludge Pit)• Area 8B - Former Oxidation Impoundment No. 1
These eight PSAs include all the known process and waste disposal areas previously identified andencompass all existing SWMUs.
4.2 DATA GAP ASSESSMENT
To identity data gaps associated with the eight PSAs defined from historic plant operations, the PSAs werecategorized according to their past use. Three different categories of data gaps were found to exist; PSAswhich had not been fully investigated, PSAs which had waste materials that had not been fullycharacterized, and PSAs where confirmation of the completeness of past waste removal activities had notoccurred. These categories are discussed below. .
4.2.1 Data Gap - Investigation Areas
Areas of the site where past plant operations may have potentially impacted soil and groundwater in thepast are designated as investigation areas. Area 1, Area 2, and Area 3 are included in this category. All ofthese areas were active during past plant operations and processed or stored chemicals that may constitute
- . ' * * 'current sources of contamination. Previous Site sampling investigations have shown the potential forcontamination to exist in these areas but a comprehensive investigative sampling program within each areahas not been performed (Weston, 1995). Thus, a data gap exists for determining the presence or absence ofpotential contaminants within the Areas and their nature and extent. . These areas are being sampled withenough detail to delineate and characterize any potential sources located within each area. In addition,downgradient groundwater monitoring wells will be used to monitor any potential groundwater .sourcesoriginating from each area.
Sharon Steel, ESI WP 4-2 Final70812-20-C August 1998
AR I 01361;

4.2.2 Data Gap - Characterization Areas
Areas of the site where the disposal of process wastes occurred in the past are designated ascharacterization areas. Area 4 A, Area 4B, Area 6 and Area 7 are included in this category. Alt of theseareas received waste materials during past plant operations which remain today and may constitute sourcesof contamination. Previous Site sampling investigations have shown that wastes exist in these areas(Weston, 1995). However, a data gap exists for determining the nature and extent of waste materialswithin these Areas. These areas are being sampled with sufficient detail to define the horizontal and lateralextents of the wastes and to obtain information on the waste fbrm(s) located within each area. In addition,downgradient groundwater monitoring wells will be used to monitor any potential groundwatercontamination originating from each area.
4.2.3 Data Can - Confirmation Areas
Areas of the site where the removal of process wastes has been known to occur are designated as
confirmation areas. Area 5, Area 8A, and Area SB are included in this category. All of these areasreceived waste materials during past plant operations but had the waste materials removed from themduring Sharon Steel plant operations or during the US HP A removal action. Following waste removal, theareas were filled with clean borrow materials from the Site. Previous Site sampling has not confirmed theabsence of waste within each area following its removal. Thus, a data gap exists for determining whetherall waste materials have been removed from these Areas. Confirmatory sampling of these areas will occur
to verify the complete removal of the previously existing waste. An attempt will be made to characterizethe historic (native) land surfaces and not the fill materials deposited during the USEPA removal action. Ifwaste forms are encountered at sampling locations, samples will be taken to characterize the nature of thewaste materials.
4.3 AREAS NOT INCLUDED IN THE RI SAMPLING PROGRAM
4.3.1 Forest and Undisturbed Areas
The site aerial photographic analysis shows a hillside area on the west side of the site that has remainedundeveloped since plant inception and is located topographically higher than the production portion of theSite. The aerial photographs from 1938 to the present indicate that these hillsides remained undevelopedexcept for the presence of a natural gas pipeline running along the hill slopes and a water line running fromthe Monongahela River to the production buildings. A visual reconnaissance of this area in February 1998
Sharon Steel, ESI WP 4-3 Final70812-20-C August 1998
A R I O I 3 6 5

showed no visible evidence of development and no visible evidence of current or historical adverseenvironmental stress. Historic plant process and construction drawings also indicate the water pipeline wasused as ah intake line from the Monongaheia River. Visual reconnaissance confirmed this was the case.The physical pipeline has been abandoned and no evidence of past or current contamination was foundupon examination of the pipeline path. This area of the site will be excluded from further evaluation, butmay be used for future determination of site background conditions if deemed necessary. If needed, thiswill be presented in a separate tetter to USEPA for their approval.
4.3.2 Side Drainages to the Unnamed Tributary
The unnamed tributary which drains the western portion of the site and discharges into the MonongaheiaRiver has two side drainages which enter along its northern side. Both of these side drainages were foundto originate on the adjacent property of Big John's Salvage Yard (Big John's). These tributaries are notconsidered part of the Fairmont Site ESI, but will be evaluated as off-site contributors to the unnamedtributary, the investigation of which is part of the ESI. The easternmost side drainage receivescontributions from both Big John's and from storm sewer and/or road runoff from Bellview Avenue. Thewesternmost side drainage only receives contributions from Big John's. Both of the side drainages showsigns of staining and evidence of contaminants that originated from Big John's. This includes iridescentsheens, solid tar, stains, and chemical odors which are present upstream of their confluence with theunnamed tributary. These drainages, although appearing to be environmentally impacted, are not affectedby the former Sharon Steel site and are thus excluded from site discharge investigations. They will,however, be investigated to determine off-site contributions to the unnamed tributary.
4.3.3 Site Buildings
Demolition of the buildings currently present on the site will be performed over the course of three years.As part of the demolition program and separate from the ESI, a visual inspection of the building basements,if present, will be conducted to determine the presence of any free product and/or contained chemicals (i.e.,chemical substances in tanks, vessels, equipment, etc. The volume of any existing free product will beestimated and a sample of the free product collected, if feasible. No sample will be taken if the liquid isbelieved to be surface water that has pooled within the exposed basement area. If no free product exists,visual indications of prior spillage of chemicals in the basement, if any will be recorded. The informationfrom these inspections will be reviewed and the need for the analysis of any collected free product and/orfurther evaluation will be determined during the demolition/disposal phase. Any contained chemicals
Sharon Steel, ESI WP 4-4 Final70812-20-C August 1998
A R I D 1366

within the building interiors will be removed prior to building demolition. This task is being completedoutside of the scope of the ESIWP.
4.3.4 Mononeahela River
The Monongahela River is located to the west of the Site and receives discharge from the unnamedtributary on the northwest side of the Site. The river also receives discharges from Big John's through thesame unnamed tributary, including a large tar spill that occurred at Big John's in the late 1970's.
It is Exxon's position that the Monongahela River should be excluded from the evaluation due to thedifficulty in discerning any potential impact of the Site on the river from those due to other upstream
sources of contamination, as well as impacts from activities at Big John's. In addition, it is Exxon's beliefthat any past impacts on the river due to the Site would have been attenuated by this time. The riversediments would have also been homogenized due to flooding and potential dredging of the river along itsreach.
EPA has communicated to Exxon its intention to sample the Monongahela River and to use the dataobtained as part of the Agency's evaluation of potential impacts resulting from the site.
4.4 SAMPLE COLLECTION AND ANALYSIS
4.4.1 Analytical Parameters
The processes conducted at the Sharon Steel Corporation-Fairmont Coke Works Site (coking, gasification,distillation, purification, chemical synthesis) are the apparent source of some of the contamination presenton-site. Coal and coal by-products may contain PAHs, volatile and semi-volatile organics, some metals,and cyanide. Transformers previously stored on-site at limited locations contained PCB oils.
The previous sampling conducted on-site during the USEPA removal action found PAHs, benzene, andsome metals including arsenic, beryllium, and lead. Other compounds were found with lesser frequencyand in concentrations lower than the USEPA Risk Based Concentration (RBC) values. Data were onlyobtained from site shallow soils and sediments; no deep soil or groundwater data were collected.
Based on the EPA and earlier site investigations, the following analyses will be performed for samplescollected during the ESI based on their media type and location:
Sharon Steel, ESI WP 4-5 Final70812-20-C August 1998
H R I O I 3 6 7

• Volatile organic compounds (CLP-SOW-OLM03.2)• Semi-volatile organic compounds (CLP-SOW-OLM03.2)• Pesticides (CLP-SOW-OLM03.2)• Polychlorinatedbiphenyls (CLP-SOW-OLM03.2)• Metals (total and dissolved) (CLP-SOW-ILM04.0)• Cyanide (CLP-SOW-ILM04.0)• Nitrate (EPA 600-352)• Sulfate (SW846-9038)• Chloride (SW846-9250)• Total organic carbon (TOC) (SW846-9060)• Grain size (ASTMD2434)
All sample media will be analyzed for VOCs, semi-VOCs, and cyanide. Shallow soil samples locatedwithin Area 2: Former Production Area will be analyzed for PCBs. Soils and sediment samples will beanalyzed for total metals while groundwater, surface water, and seep samples will be analyzed for bothtotal and dissolved metals. All sediment samples wilt be analyzed for TOC and grain size.
In addition to the laboratory analyses, a number of field parameters will be obtained while samplingactivities are occurring. These parameters are:
• pH (waters)• Temperature (waters)• Specific conductance (waters)• Turbidity (waters)• Dissolved oxygen (waters)• Oxidation - reduction potential (waters)• Color (soils)• Iron II (waters) • via Hach Test Kit (Method 8008)• Alkalinity (waters)-via Hach Test Kit (Method 8221)
Natural attenuation parameters consist of all the water field parameters listed above and nitrate, sulfate,and chloride by laboratory analysis.
Sharon Steel, ESI WP 4-6 Final70812-20-C August 1998
A R I O I 3 6 8

4.4.2 Sample Types
Soils
Soil sampling conducted during the ESI consists of both shallow and deep soil samples. For the purposesof chemical analysis, shallow soils are defined as the interval from 0 to 6 inches, excluding the plant rootzone; deep soils are defined as the interval below 6 inches and above the water table.
Soils encountered during monitoring well installation, although not currently targeted for analysis, will besampled if contamination is suspected following visual and field screening.
Tables 4-1 through 4-13 provide details of soil samples to be collected from the individual areas.
Groundwater
Groundwater samples will be obtained from three different strata during the ESI: the shallow overburden
zone, the intermediate alluvial sands above the bedrock, and the deep bedrock beneath the unconsolidatedmaterials. Cluster well locations were chosen at regular intervals across the site at 15 locations (Table 4-14 lists the justification for each location). Each of these locations is to have both a shallow andintermediate groundwater monitoring well installed. In addition, eight (8) of these locations were chosen toalso have deep bedrock wells installed. In locations where the intermediate alluvial sands are not present,the intermediate wells will not be installed. In addition to these regularly spaced well locations, twoadditional shallow monitoring wells are targeted for installation in the light oil storage area to characterizethat area of concern. Light non-aqueous phase liquid (LNAPL) monitoring will be conducted in all wells.
Dense non-aqueous phase liquid (DNAPL) monitoring well be performed only if detected during wellinstallation or if determined likely to be present following the initial round of groundwater sampling bycomparing the results to chemical solubility levels.
Surface Water /Seeps
Surface water sampling will be conducted in Area 6: Existing Impoundment and the three site drainages:the unnamed tributary to the Monongahela, the light oils storage area drainage, and the coal / coke yarddrainage. Each drainage will have a minimum of two samples taken in order to classify the surface waterdischarges. In addition, two side drainages originating from Big John's Salvage Yard that feed into theunnamed tributary will also be sampled to determine off-site contributions to the unnamed tributary.
Sharon Steel, ESI WP 4-7 Final70812-20-C August 1998
A R 1 0 I 3 6 9

Seep sampling will occur at known seep locations on-site. Currently, five seep locations have been located:two from the south landfill, two from the sludge storage area, and one adjacent to the light oils storage area.
Sediment
Sediment sampling will occur at all surface water sampling locations in conjunction with collection ofsurface water samples. If necessary, surface water sampling locations will be moved to a nearby sedimentcontaining area in order to maintain parity of samples. Like the surface water samples, if significant levelsof contamination are found, additional samples may be proposed in order to close data gaps. If needed, thisproposal will be a letter addendum to the ESI Work Plan, and will follow the same procedures used in theESI.
4.5 DATA QUALITY OBJECTIVES
Data Quality Objectives (DQOs) were established for this program to ensure that the data collected aresufficient and of adequate quality for their intended uses. Data collected using portable instruments istypically used for gross engineering determinations or for health and safety considerations. Field analysesperformed using portable instruments are generally not subjected to strict QA/QC procedures and aretherefore only used to determine the presence or absence of specific compounds for screening or health andsafety purposes. Data generated by laboratories using standard EPA analytical methods and datavalidation protocols are used for risk assessment, feasibility studies or remedial design, and in any situationwhere legally defensible data is necessary. Specific data quality objectives for the analyses to be performedduring the ESI are described in the QAPjP.
Sharon Steel, ESI WP 4^ Final70812-20-C August 1998
f t R I O I 3 7 0

TABLE 4-1
SUMMARY OF SAMPLING AND ANALYSIS AT THE FORMER LIGHT OIL STORAGE AREA
AreaNo. 1
Light OilStorage Area
Sample Media
Shallow Soil
PotentiallyContaminated Soil *
Deep Soil
Groundwater
Number ofSamples
3
3
3
8(2 Rounds)
Location - Description
Targeted Soil Sampling Locations
Targeted Soil Boring Locations
Targeted Soil Boring Locations
MW-3SMW-3IMW-4SMW-5S
Laboratory Analysis
VOCsSVOCs
Total MetalsCyanideVOCsSVOCs
Total MetalsCyanideVOCs
SVOCsTotal Metals
CyanideVOCsSVOCs
Total and Dissolved MetalsCyanide
PesticidesField Parameters
Natural Attenuation Parameters
* Note: Sample displaying the highest potential for being contaminated by visual classification and PID readings.
Sharon Steel. ESI WP"-20-C
4-9
IFinal
August/ **

c c c
TABLE 4-2
SUMMARY OF SAMPLING AND ANALYSIS AT THE FORMER PRODUCTION AREA
AreaNo. 2
ProductionArea
Sample Media
Shallow Soil
PotentiallyContaminated Soil *
Deep Soil
Groundwater
Number ofSamples
12
12
12
12(2 Rounds)
Location - Description
Targeted Soil Boring Locations
Targeted Soil Boring Locations
Targeted Soil Boring Locations
MW-6SMW-6IMW-6DMW7-SMW-7IMW-7D
Laboratory Analysis
VOCsSVOCsPCBs
Total MetalsCyanideVOCsSVOCs
Total MetalsCyanideVOCsSVOCs
Total MetalsCyanideVOCsSVOCs
Total and Dissolved MetalsCyanide
PesticidesField Parameters
Natural Attenuation Parameters
3O
CD
CO-Jro
Note: Sample displaying the highest potential for being contaminated by visual classification and PID readings.
Sharon Steel, ESI WP70812-20-C
4-10 FinalAugust 1998

TABLE 4-3
SUMMARY OF SAMPLING AND ANALYSIS AT THE FORMER COKE OVENS
AreaNo. 3
Coke Ovens
Sample Media
Shallow Soil
Mest-PotentiallyContaminated Soil *
Deep Soil
Number ofSamples
7
7
7
Location - Description
Targeted Soil Boring Locations
Targeted Soil Boring Locations
Targeted Soil Boring Locations
Laboratory Analysis
VOCsSVOCs
Total MetalsCyanideVOCsSVOCs
Total MetalsCyanideVOCsSVOCs
Total MetalsCyanide
* Note: Sample displaying the highest potential for being contaminated by visual classification and PID readings.
CD
CO^JCO
Sharon Steel, ESI WP'-20-C
4-11 FinalAugust/ **

c c c
TABLE 4-4
SUMMARY OF SAMPLING AND ANALYSIS AT THE EXISTING NORTH LANDFILL
AreaNo.4ANorth
Landfill
Sample Media
Waste Material
Number ofSamples
5
Location - Description
Test Pit Locations
Laboratory Analysis
VOCsSVOCs
Total MetalsCyanide
oCO
Sharon Steel, ESI WP70812-20-C
4-12 FinalAugust 1998

TABLE 4-5
SUMMARY OF SAMPLING AND ANALYSIS AT THE EXISTING SOUTH LANDFILL
AreaNo. 4BSouth
Landfill
Sample Media
Waste Material
Seeps
Number ofSamples
5
2
Location - Description
Test Pit Locations
SP-3andSP-4
Laboratory Analysis
VOCsSVOCs
Total MetalsCyanideVOCs
SVOCsTotal and Dissolved Metals
CyanideField Parameters
CD
CO-*Jcn
Sharon Steel, ESI WP•-20-C
4-13 FinalAugust

c c c
TABLE 4-6
SUMMARY OF SAMPLING AND ANALYSIS AT THE EXISTING IMPOUNDMENT
AreaNo. 6
Impoundment
Sample Media
Sediment
Surface Water
Number ofSamples
3
3
Location - Description
SS-10,SS-H,andSS-12
SS-10,SS-ll,andSS-12
Laboratory Analysis
VOCsSVOCs
Total MetalsCyanide
TOCGrain Size
VOCsSVOCs
Total and Dissolved MetalsCyanide
Field Parameters
=0
CD
CO
Sharon Steel, ESI WP70812-20-C
4-14 FinalAugust 1998

CD
CO
TABLE 4-7
SUMMARY OF SAMPLING AND ANALYSIS AT THE EXISTING WASTE SLUDGE AND BREEZE STORAGE AREA
AreaNo. 7
Waste Sludgeand Breeze
Storage Area
Sample Media
Shallow Soil
Deep Soil
Seeps
Number ofSamples
3
3
2
Location - Description
Targeted Soil Boring Locations
Targeted Soil Boring Locations
SP-I and SP-2
Laboratory Analysis
VOCsSVOCs
Total MetalsCyanideVOCs
SVOCsTotal Metals
CvanidcVOCs
SVOCsTotal and Dissolved Metals
CyanideField Parameters
Sharon Steel, ESI WP">.-20-C7C
4-15 FinalAugust ""18

c c c
TABLE 4-8
SUMMARY OF SAMPLING AND ANALYSIS AT THE FORMER BREEZE WASHOUT AREA
AreaNo. 5Breeze
WashoutArea
Sample Media
Soil/WasteMaterial
Sediment
Surface Water
Groundwater
Number ofSamples
5
1
1
8(2 Rounds)
Location - Description
Targeted Soil Boring Locations
SS-13
SS-13
MW-8SMW-8I
MW-12SMW-12I
Laboratory Analysis
VOCsSVOCs
Total MetalsCyanideVOCs
SVOCsTotal Metals
CyanideTOC
Grain SizeVOCsSVOCs
Total and Dissolved MetalsCyanide
Field ParametersVOCsSVOCs
Total and Dissolved MetalsCyanide
PesticidesField Parameters
Natural Attenuation Parameters
=0
oCO
CD
Sharon Steel, ESI WP70812-20-C
4-16 FinalAugust 1998

TABLE 4-9
SUMMARY OF SAMPLING AND ANALYSIS AT THE FORMER SLUDGE STORAGE AREA
Area8A
SludgeStorage Area
Sample Media
Soil/WasteMaterial
Number ofSamples
3
Location - Description
Targeted Soil Sampling Locations
Laboratory Analysis
VOCsSVOCs
Total MetalsCyanide
CO
Sharon Steel, ESI WP'-20-C
4-177P ^-
FinalAugust;"*X

c c c
TABLE 4-10
SUMMARY OF SAMPLING AND ANALYSIS AT THE FORMER OXIDATION IMPOUNDMENT
AreaNo.8B
OxidationImpoundment
Sample Media
Soil/WasteMaterial
Sediment
Surface Water
Number ofSamples
4
2
2
Location - Description
Targeted Soil Locations
SS-14andSS-15
SS-14andSS-15
Laboratory Analysis
VOCsSVOCs
Total MetalsCyanideVOCsSVOCs
Total MetalsCyanide
TOCGrain Size
VOCsSVOCs
Total and Dissolved MetalsCyanide
Field Parameters
CD
ooCD
Sharon Steel. ESI WP70812-20-C
4-18 FinalAugust 1998

TABLE 4-11
SUMMARY OF SAMPLING AND ANALYSIS AT UNNAMED TRIBUTARIES
Area
UnnamedTributaries
Sample Media
Sediment
Surface Water
Number ofSamples
11
11
Location - Description
SS-1, SS-2, SS-3, SS-4, SS-5, SS-6, SS-7,SS-8, SS-9, SS-16,andSS-17
SS-1, SS-2, SS-3, SS-4, SS-5, SS-6, SS-7,SS-8, SS-9, SS-16, and SS-17
Laboratory Analysis
VOCsSVOCs
Total MetalsCyanide
TOCGrain Size
VOCsSVOCs
Total and Dissolved MetalsCyanide
Field Parameters
oCO00
Sharon Steel, ESI WP'-20-CI '•
4-19 FinalAugusl I/

c c c
TABLE 4-12
SUMMARY OF SAMPLING AND ANALYSIS AT THE COAL/COKE YARD DRAINAGE
Area
Coal/CokeYard
Drainage
Sample Media
Sediment
Surface Water
Number ofSamples
4
4
Location - Description
SS-20, SS-21, SS-22, and SS-23
SS-20, SS-21, SS-22, and SS-23
Laboratory Analysis
VOCsSVOCs
Total MetalsCyanide
TOCGrain Size
VOCsSVOCs
Total and Dissolved MetalsCyanide
Field Parameters
COoo
Sharon Steel, ESI WP70812-2W:
4-20 FinalAugust 1998

TABLE 4-13
SUMMARY OF SAMPLING AND ANALYSIS AT THE LIGHT OIL STORAGE DRAINAGE
Area
Light OilStorage
Drainage
Sample Media
Seeps
Sediment
Surface Water
Number ofSamples
1
2
2
Location - Description
SP-5
SS-18andSS-19 .
SS-18andSS-l9
Laboratory Analysis
VOCsSVOCs
Total and Dissolved MetalsCyanide
Field ParametersVOCs
SVOCsTotal Metals
CyanideTOC
Grain SizeVOCsSVOCs
Total and Dissolved MetalsCyanide
Field Parameters
CD
COGOCO
Shuron Suwl, ESI WP20-C7<r
4-21 FinalAugust

TABLE 4-14
MONITORING WELLLOCATION
RATIONALE
Monitoring Well ClusterMW-1
MW-2, 3, 4, and 5MW-6and7
MW-8
MW-9MW-10MW-11MW-12MW-13MW-14MW-15MW-I6MW-17
Area MonitoredDowngradient General SiteWithin and Downgradient of Former Light Oil Storage AreaWithin Former Production AreaDowngradient Former Production Area, Near Property Margin, andUpgradient North LandfillDowngradient General Site and Upgradient South LandfillDowngradient South Landfill and Upgradient Former Oxidation LagoonsDowngradient Former Production Areas and North LandfillDowngradient North Landfill and Within Former Breeze Washout AreaDowngradient South LandfillDowngradient North Landfill and Former Breeze Washout AreaDowngradient Former Oxidation LagoonsDowngradient Sludge Storage AreaBackground
Sharon Steel. ESI WP70812-20-C
4-22
A R I O I 3 8 UFinal
August 1998

TABLE 4-4
SUMMARY OF SAMPLING AND ANALYSIS AT THE EXISTING NORTH LANDFILL
AreaNo.4ANorth
Landfill
Sample Media
Waste Material
Number ofSamples
5
Location - Description
Test Pit Locations
Laboratory Analysis
VOCsSVOCs
Total MetalsCyanide
COCOen
Sharon Steel, ESI WP-20-C
4-12 Final
\ August

c c c
TABLE 4-5
SUMMARY OF SAMPLING AND ANALYSIS AT THE EXISTING SOUTH LANDFILL
AreaNo.4BSouth
Landfill
Sample Media
Waste Material
Seeps
Number ofSamples
5
2
Location - Description
Test Pit Locations
SP-3andSP-4
Laboratory Analysis
VOCsSVOCs
Total MetalsCyanideVOCsSVOCs
Total and Dissolved MetalsCyanide
Field Parameters
CDCOGO
Sharon Steel, ESI WP70812-20-C
4-13 FinalAugust 1998

TABLE 4-6
SUMMARY OF SAMPLING AND ANALYSIS AT THE EXISTING IMPOUNDMENT
AreaNo. 6
Impoundment
Sample Media
Sediment
Surface Water
Number ofSamples
3
3
Location - Description
SS-10,SS-ll,andSS-12
SS-10, SS-ll,andSS-12
Laboratory Analysis
VOCsSVOCs
Total MetalsCvanide
TOCGrain Size
VOCsSVOCs
Total and Dissolved MetalsCyanide
Field Parameters
CD
COCD
Sharon Steel, ESI WP 4-14
i '-Final
August }

c c c
TABLE 4-7
SUMMARY OF SAMPLING AND ANALYSIS AT THE EXISTING WASTE SLUDGE AND BREEZE STORAGE AREA
AreaNo. 7
Waste Sludgeand Breeze
Storage Area
Sample Media
Shallow Soil
Deep Soil
Seeps
Number ofSamples
3
3
2
Location - Description
Targeted Soil Boring Locations
Targeted Soil Boring Locations
SP-1 and SP-2
Laboratory Analysis
VOCsSVOCs
Total MetalsCyanideVOCsSVOCs
Total MetalsCyanideVOCsSVOCs
Total and Dissolved MetalsCyanide
Field Parameters
COCD00
Sharon Steel. ESI WP70812-20-C
4-15 FinalAugust 1998

TABLE 4-8
SUMMARY OF SAMPLING AND ANALYSIS AT THE FORMER BREEZE WASHOUT AREA
AreaNo. 5Breeze
WashoutArea
Sample Media
Soil/WasteMaterial
Sediment
Surface Water
Groundwater
Number ofSamples
5
1
1
8(2 Rounds)
Location - Description
Targeted Soil Boring Locations
SS-13
SS-13
MW-8SMW-8I
MW-12SMW-12I
Laboratory Analysis
VOCsSVOCs
Total MetalsCyanideVOCs
SVOCsTotal Metals
CyanideTOC
Grain SizeVOCsSVOCs
Total and Dissolved MetalsCyanide
Field ParametersVOCs
SVOCsTotal and Dissolved Metals
CyanidePesticides
Field ParametersNatural Attenuation Parameters
CO00
Sharon Steel, ESI WP'-20-C
4-16 FinalAugust S

c c
TABLE 4-9
SUMMARY OF SAMPLING AND ANALYSIS AT THE FORMER SLUDGE STORAGE AREA
Area8A
SludgeStorage Area
Sample Media
Soil/WasteMaterial
Number ofSamples
3
Location - Description
Targeted Soil Sampling Locations
Laboratory Analysis
VOCsSVOCs
Total MetalsCyanide
3D
CD
COUDO
Sharon Steel, ESI WP70812-20-C
4-17 FinalAugust 1998

TABLE 4-10
SUMMARY OF SAMPLING AND ANALYSIS AT THE FORMER OXIDATION IMPOUNDMENT
AreaNo. SB
OxidationImpoundment
Sample Media
Soil/WasteMaterial
Sediment
Surface Water
Number ofSamples
4
2
2
Location - Description
Targeted Soil Locations
SS-14andSS-15
SS-14andSS-15
Laboratory Analysis
VOCsSVOCs
Total MetalsCyanideVOCsSVOCs
Total MetalsCyanide
TOCGrain Size
VOCsSVOCs
Total and Dissolved MetalsCyanide
Field Parameters
ID
Sharon Steel, ESI WP
I '•4-18 Final
August V
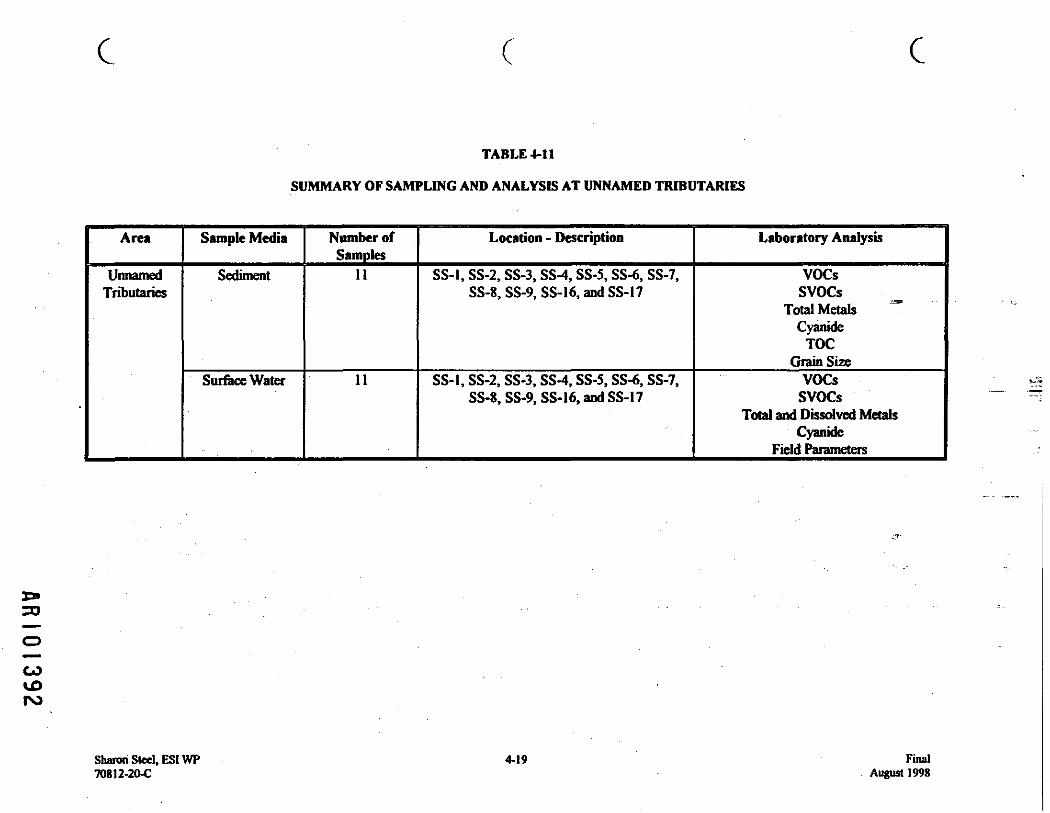
c c
TABLE 4-11
SUMMARY OF SAMPLING AND ANALYSIS AT UNNAMED TRIBUTARIES
Area
UnnamedTributaries
Sample Media
Sediment
Surface Water
Number ofSamples
I t
11
Location - Description
SS-1, SS-2, SS-3, SS^t, SS-5, SS-6, SS-7,SS-8, SS-9, SS-16, and SS-17
SS-1, SS-2, SS-3, SS-4, SS-5, SS-6, SS-7,SS-8, SS-9, SS-16, and SS-17
Laboratory Analysis
VOCsSVOCs _
Total MetalsCyanide
TOCGrain Size
VOCsSVOCs
Total and Dissolved MetalsCyanide
Field Parameters
oCO
ro
Sharori Steel, ESI WP708J2-20-C
4-19 FinalAugust 1998

TABLE 4-12
SUMMARY OF SAMPLING AND ANALYSIS AT THE COAL/COKE YARD DRAINAGE
Area
Coal/CokeYard
Drainage
Sample Media
Sediment
Surface Water
Number ofSamples
4
4
Location - Description
SS-20, SS-2I, SS-22, and SS-23
SS-20, SS-21, SS-22, and SS-23
Laboratory Analysis
VOCsSVOCs
Total MetalsCyanide
TOCGrain Size
VOCsSVOCs
Total and Dissolved MetalsCyanide
Field Parameters
COUDCO
Sharon Steel, ESI WP?r
4-20 FinalAugust/ "*

c c
TABLE 4-13
SUMMARY OF SAMPLING AND ANALYSIS AT THE LIGHT OIL STORAGE DRAINAGE
Area
Light OilStorage
Drainage
Sample Media
Seeps
Sediment
Surface Water
Number ofSamples
1
2
2
Location - Description
SP-5
SS-18andSS-19
SS-18andSS-19
Laboratory Analysis
VOCsSVOCs
Total and Dissolved MetalsCyanide
Field ParametersVOCsSVOCs
Total MetalsCyanide
TOCGrain Size
VOCsSVOCs
Total and Dissolved MetalsCyanide
Field Parameters _, —
COID
Sharon Steel. ESI WP70812-20-C
4-21 FinalAugust 1998

TABLE 4-14
MONITORING WELLLOCATION
RATIONALE
Monitoring Well ClusterMW-1
MW-2, 3, 4, and 5MW-6 and 7
MW-8
MW-9MW-10MW-11MW-12MW-13MW-1 4MW-1 5MW-16MW-17
Area MonitoredDowngradient General SiteWithin and Downgradient of Former Light Oil Storage AreaWithin Former Production AreaDowngradient Former Production Area, Near Property Margin, andUpgradient North LandfillDowngradient General Site and Upgradient South LandfillDowngradient South Landfill and Upgradient Former Oxidation LagoonsDowngradient Former Production Areas and North LandfillDowngradient North Landfill and Within Former Breeze Washout AreaDowngradient South LandfillDowngradient North Landfill and Former Breeze Washout AreaDowngradient Former Oxidation LagoonsDowngradient Sludge Storage AreaBackground
Sharon Steel, ESI WP70812-20-C
4-22 FinalAugust 1998
A R I O I 3 9 5

CPA REGION IIISUPERFUND DOCUMENT MANAGEMENT SYSTEM
DOC IDPAGE
HEBIUNSCANNABLg
SITE NAME t &L
OPERABLE UNIT _Dl*
ADMINISTRATIVE RECORDS* SECTION ^ VOLUME HL
REPORT OR DOCUMENT TITLE
DATE OF DOCUMENT /J
DESCR1PTON OP IMAGERY.
NUMBER AND TYPE OP IMAGERY ITEM/«I /

EPA REGION IIISUPERFUND DOCUMENT MANAGEMENT SYSTEM
oocPAGE tfIMAGERY COVER ?HrrT
UN8CANNABLB
SITE NAME
OPERABLE UNIT
ADMINISTRATIVE RECORDS* SECTION-^ VQLUMg OH
REPORT OR DOCUMENT Tl'
tx
DATE OF DOCUMENT 3-~A
DESCRIPTON OF IMAGERY
TLB^tport: £v&
Vi
<-*-4 " fSJM@ni'twr/na UhsH
-
NUMBER AND TYPE OF IMAGERY ITEM(S) / W
. o .,^flnrJ^^L D } C*-
s%Q fsijfxr\f
i$c#nnibLe ffloufl

EPA REGION IIISUPERFUND DOCUMENT MANAGEMENT SYSTEM
DOC IBPAGE «
IMAGERY COVERUN8CANNABLB ITPM
SITE NAME Ttirmnunt &L_
OPERABLE UNIT QjL
ADMINISTRATIVE RECORDS- 8ECTION_Zl_VOt.UME
REPORT OR DOCUMENT TITLB
DATE OP
DESCRIPTON OP IMAGERY.
NUMBER AND TYPE OP IMAGERY ITEM(8) I

Section 5
I
5r
Ioc

5,0 REMEDIAL INVESTIGATION TASKS
The specific tasks leading to the completion of the ESI are discussed following. As stated in Section 1.1,the ESI is designed to investigate the nature and extent of contamination present at the Site. This programis used to determine the physical characteristics of the Site and local area and obtain information to conductrisk assessment and feasibility study, if necessary. To accomplish this goal, a set of project plans andcontrol documents have been prepared in conjunction with this Work Plan to accomplish the individual ESItasks. The purpose of these plans and the extent of planned field activities are presented in the followingsections.
5.1 PROJECT PLANS
In addition to this Work Plan, additional plans prepared for the ESI include the Field Sampling Plan (FSP),the Quality Assurance Project Plan (QAPjP), and the Health and Safety Plan (HASP). A CommunityRelations Plan (CRP) may be developed as part of the Project XL program as agreed by USEPA in theirMarch 20, 1998 letter. The purpose of these plans is to describe standard procedures needed for fieldinvestigations, data collection, and analysis and interpretation of data. The procedures have beendeveloped to: , • •
• Ensure that data collected during the ESI will be technically accurate, representative of currentfield conditions, and legally defensible.
• Ensure that the health and safety of the field staff is adequately protected during on-site fieldactivities. ,
• Ensure the consistency, continuity, and accuracy of analytical protocols used.The project plans have been developed for concurrent use and are intended to be complementary plans tothis Work Plan.
5.1.1 Field Sampling Plan
The FSP describes the procedures to be used for collection of all field data during the ESI program. Fieldtasks during the ESI consist of collection of soil, groundwater, surface water (including seeps), andsediment samples; monitoring well installation; aquifer testing; soil logging; and surface fieldreconnaissance. The FSP includes sample collection and analysis protocols as well as procedures forsample labeling, sealing of shipping containers, storage of samples, and shipment along with chain-of-custody procedures. In addition, the standard EPA analytical methods to be used are identified.
Sharon Steel. ESI WP 5-1 Final70812-20-C August 1998
A R I O I U O O

5.1.2 Quality Assurance Project Plan
The QAPjP is a separate document and describes the procedures necessary to ensure the accuracy,precision, representativeness, completeness, and comparability of the data collected during the ESI. Theseprocedures include field instrument performance and calibration checks; documentation of fieldobservations and data collection; and documentation of sample preservation and shipment Field QCmethodologies such as preparation of sample blanks, duplicates, and trip blanks are also identified, alongwith required laboratory procedures regarding compilation, reporting, and archiving of data.
5.1.3 Health and Safety Plan
The HASP for the ESI describes the procedures necessary for conduct of field activities at the Site. TheHASP was developed following review of all applicable site data indicating the types of constituentspotentially encountered on-site. In addition, a site survey was conducted to physically assess the Sitestructures and areas of concern. The plan is based on ICF Kaiser's overall Health and Safety Program andis consistent with the applicable OSHA requirements found in sections of 29 CFR 1910, for generalindustry, and 29 CFR 1926, for the construction industry.
5.1.4 Community Relation Plan
The CRP describes the community relations program to be implemented during the ESI, EE/CA processand clean-up activities at the Site. The purpose of a CRP is to involve the local community and otherinterested persons in the decision-making process for the Site. The CRP for this site is currently beingscoped and will be developed pending the outcome of the Project XL proposal for the Site.
5.2 FIELD INVESTIGATION
Field investigations to be conducted during the ESI consist of general site investigation tasks and samplingof environmental media. Section 4.3 discussed the scope and rationale behind the environmental mediasampling. A summary of all environmental media samples is discussed below. Table 5-1 identifies ESIsamples to be obtained and their analyses. The FSP describes in detail the methods to be used forobtaining, storing, and shipping the samples for laboratory analysis. A summary of the sampling and siteinvestigation tasks is presented below.
Sharon Steel, ESI WP 5-2 Final70812-20-C August 1998
A R I D 11*01

5.2.1 Soil Sampling
Soil samples will be obtained from six potential source areas outlined in Section 4.1. For the purposes ofthe soil investigation, potential source areas have been divided into three soil sampling categories asdiscussed in Section 4.2:
• Areas of investigation,• Areas of characterization, and '• Areas of confirmation.
Soil sampling in each of these three categories will occur differently in order to address the specific dataneeds of each area. Soil analyses to be performed on all soil samples obtained will be for VOCs, SVOCs,heavy metals, and cyanide. In addition, all soil samples from the shallow (0 to 6 inch) sampling locationswithin Area 2: Former Production Area will be analyzed for PCBs due to the past use and storage oftransformers within this potential source area.
5.2.1.1' Areas of Investigation
*, Potential source areas that are considered areas of investigation to determine the presence or absence ofcontamination are: Area I: Former Light Oil Storage Area, Area 2: Former Production Area, and Area 3:Former Coke Ovens. Area 1 will be sampled at 3 locations, Area 2 at 12 locations (with 2 of the 12locations coming from the former waste tar pit [SWMU 7]), and Area 3 at 7 locations. Soil sampling willoccur by collecting soil samples continuously from the land surface to the first water table and screeningthe soils visually and with a photo-ionization detector (PID). If the water table is not encountered within 15
feet of the land surface, and the field screening indicates that the soil is not contaminated, then the boringwill be terminated at 15 feet. Following visual and PID screening, a minimum of 3 sampling intervals willbe chosen for laboratory analysis.
The soil sample collected from zero to 6 inch below the surface at all locations will be submitted forlaboratory analysis. Another sample for analysis will come from the most potentially contaminated zoneencountered, as determined by visual classification and PID readings. The third sample will be taken fromapparently unaffected soils below die potentially contaminated zone, as determined by field screeningcriteria. In this way, both the vertical extent and the composition of any potentially contaminated zone canbe determined. If multiple contaminated zones are detected within the same borehole, additional sampleswill be added at the discretion of the field geologist to enable classification of all contaminated zones
Sharon Steel, ESI WP 5-3 Final70812-20-C August 1998
A R I O U 0 2

encountered. In areas where field screening yields no discernible differences in zones* the proposed soil \^sampling depths will be the zone directly above the first water table and the zone midway between theground surface and the first water table.
5.2.1.2 Areas of Characterization
Potential source areas that are considered areas of characterization to delineate and determine the wasteform(s) stored within them are: Area 4A: Existing North Landfill, Area 4B: Existing South LandfillArea 7: Existing Waste Sludge and Breeze Storage Area, and Area 6: Existing Impoundment.
Areas 4A and 4B will both be investigated with trenches made using a backhoe to determine the horizontaland vertical extent of waste materials within each landfill. Area 4A may also contain a former on-siteincinerator based on prior facility maps. Trenching locations have been chosen in order to define themargins of the fill at the top and the toe of each filled area and at either end. Additional trenches wilt beadded if needed to define the extent of the fill or moved if needed to enable the delineation of the filled area.Excavated materials will be visually described and screened with a PID. Based on this screening, samplesfor laboratory analysis will be selected based on variation in waste composition and characteristics. Aminimum of 5 samples will be taken from each landfill based on the composition of the waste materials.Additional samples will be added at the discretion of the field geologist to characterize the variation inlandfill contents.
Area 7 will be characterized by using hand coring tools to obtain a continuous core sample at threelocations within the storage area from the surface down to native materials underlying the wastes. Core
samples will be characterized both visually and using a PID. Samples for laboratory analysis wilt beselected based on the field screening conducted to determine the different waste forms encountered. Aminimum of 6 samples wilt be obtained from the storage area, 2 from each location. At the discretion ofthe field geologist, additional core samples may be added or sampling locations moved to enable morecomplete characterization of the waste materials encountered.
Area 6 will not be characterized by soil sampling, but will have surface water and sediment samplesconducted as discussed in Section 5.2.3.
Sharon Steel, ESI WP 5-4 Final70812-20-C August 1998
A R I D 11*03

v , 5.2.1.3 Areas o f ConfirmationPotential source areas where sampling will be done to confirm the removal of wastes during previous siteactivities are: Area 5: Former Breeze Washout Area, Area 8A: Former Sludge Storage Area, and Area8B: Former Oxidation Impoundment No. 1. Area 5 will be sampled at 5 locations, Areas 8A will besampled at 3 locations and 8B will each be sampled at 4 locations. In each location, soil samples forlaboratory analysis will be obtained to verify that wastes have been removed. Soil corings will be madeusing hand or power coring tools to collect a continuous core to a depth of 5 feet at each location. If nativesoils or old fill have not been encountered in the first 5 feet, the coring will be advanced in minimum 1 footincrements until native materials are reached. The former land surface will be determined by the fieldgeologist based on examination of the soil composition and structure. Soils will then be field screenedvisually and using a PID. If field screening indicates a potentially contaminated zone, that interval will besampled and cored until the bottom of the waste is reached. If field screening and PID analysis indicatesthat the soils encountered are not contaminated, the soil samples obtained for analysis will be a compositefrom the 1 foot interval above and the 1 foot interval below the native soils. If waste is encountered, arepresentative sample of the waste will be sent for laboratory analysis.
5.2.2 Monitoring Well Installation and Sampling
Monitoring wells will be installed to sample groundwater in the three saturated zones present at the site.Well locations were chosen to evaluate groundwater downgradient of areas of concern and to determinegroundwater flow patterns across the site. Wells will be installed using hollow stem augers, air hammer,air rotary, or other appropriate methods and will consist of 2-inch diameter PVC. Intermediate and deepmonitoring wells will be double and triple cased, respectively, to ensure no cross contamination is possible.Deep monitoring wells will be installed in the first water bearing strata, but in no case deeper than 50 feetinto the bedrock to be able to monitor groundwater from water bearing zones potentially affected by sitedisposal practices. Well installation procedures are presented in the FSP.
Groundwater sampling will be done using low-flow sampling procedures according to the standardspresented in the FSP. Sampling will be done following well installation and development, and will be donein simultaneous sampling rounds occurring over several days. Two rounds of groundwater sampling willbe conducted, with a 30 day gap between rounds. The first round will be analyzed for VOCs, SVOCs,total metals, dissolved metals, cyanide, pesticides, and natural attenuation parameters. Following receipt ofthe first round results, the second round analyte list may be reduced, following approval by USEPA to doso.
Sharon Steel, ESI WP 5-5 Final70812-20-C August 1998
A R I O U O U

5.2.3 Surface Water. Sediment, and Seen Sampling
Surface water and sediment samples will be collected from 23 locations in the Site tributaries and drainagesduring a single sampling event (Figure 4-3). Three of the sampling locations are within Area 6: TheExisting Impoundment. Surface water samples will be strictly grab type samples, while sediment sampleswill be collected to a depth of six inches using the procedures discussed in the FSP. These surface waterand sediment samples will be used to evaluate the surface water quality in the Site tributaries and to gaininsight into the potential migration of contaminants in the surface water and/or sediments. These data willbe compared to Ambient Water Quality Criteria (AWQC) standards for surface water and Soil RiskConcentration (RBC) numbers (USEPA, I99S) for sediment to evaluate any potential impact to humanhealth. As part of the wetlands delineation, an ecological habitat survey of the Site tributaries will beconducted to determine the applicability of the EPA Region III BTAG ecological screening levels in theevaluation of the surface water and sediment data.
Seep samples will be grab samples obtained at the five seep locations existing on-site. These seep sampleswill be used to evaluate leachate generated from areas of potential concern and to determine its relativecontribution to surface water discharge. Only the aqueous leachate wilt be sampled from the seeps.
5.2.4 Aouifer Testing
Slug testing of selected wells installed will be performed to evaluate the hydraulic conductivity of thegeologic materials. Four wells representative of the materials within the shallow zone and four wellsrepresentative of the intermediate zone will be chosen for analysis following their installation. Eightbedrock wells will be slug tested to determine the hydraulic conductivity of the bedrock. Slug testing
procedures are described in the FSP.
5.2.5 Site Survey
Following installation of all monitoring wells and completion of all surface soil, seep, and surface waterand sediment sampling, a survey will be performed of site sampling locations. The site survey will tie thelocations to the topographic survey of the site containing locations of major site features. All monitoringwell and sampling locations will be surveyed. Monitoring wells will be surveyed to the nearest 0.01 feetvertically and 0.1 feet horizontally. The latitude and longitude coordinates in degrees, minutes, and secondsto the nearest second will also be provided along with the method used to determine the coordinates for eachwell installed. All other sampling locations will be surveyed to the nearest 0.1 feet vertically and
Sharon Steel. ESI WP 5-6 Final70812-20-C August 1998
• A R I O U 0 5

horizontally. Surveying will be performed by a surveyor licensed in the State of West Virginia. Surveydata will be presented in both electronic (CAD) and paper form. A site topographic and feature survey hasbeen completed prior to sampling in order to develop a detailed site map at the start of the ESI.
5.2.6 Wetland Delineation Survey
A delineation of wetlands will be conducted by a wetlands delineator mutually acceptable to Exxon, theUSEPA and the WVDEP. The methodology in the U.S. Army Corps, of Engineers Wetlands DelineationManual, (Environmental Laboratory, 1987) will be used to identity wetland areas. This delineation will belimited to the former Sharon Steel property.
It is recognized that some wetland areas were formed as a result of site grading/contouring from theUSEPA's interim removal actions at the site. The delineation study will differentiate between thosewetland areas which are native to the property existing prior to USEPA's interim removal actions asopposed to those wetland areas resulting from the removal action. While all wetland areas will bedelineated, those resulting from USEPA's interim removal action will be considered non-jurisdictionalwetlands and will not be included in the inventory of wetlands existing on the former Sharon Steel property.
Prior to field work, a review of pertinent site information will be conducted. This will include a review ofall available site specific data on flooding and observed marshes and creeks, etc. Further, it will include thereview of the appropriate USGS 7.5 minute topographical maps (USGS), county wide soil survey maps(NRCS, 1982), a list of hydric soils for West Virginia (NRCS 1998), and the US Fish and Wildlife ServiceNational Wetland Inventory maps (USFWS 1987a, 1987b, 1990a, and 1990b). Any potential wetlandareas identified in these data sources will be noted for further evaluation in a field level survey.
After review of all available data sources, a field level survey will be conducted on all of the potentialwetland areas identified in the initial data gathering phase. This phase will also included a survey of allother areas of the site in order to assure the delineation of all on-site wetland areas. If wetland areas aredetermined to be present, the wetland boundaries will be clearly marked on-site and will be placed onavailable site mapping. All pertinent wetland data will be collected and recorded to evaluate the naturaland man-made wetlands present on-site. Wetlands will be classified based on the three criteria described inthe delineation manual: hydrophilic vegetation, hydric soils, and wetland hydrology.
Sharon Steel, ESI WP 5-7 Final70812-20-C August 1998
A R I O U 0 6

5.3 SAMPLE ANALYSIS/VALIDATION
Samples collected during the ESI will be submitted to the environmental laboratory to be analyzed for thecompounds listed in Tables 4-1 to 4-13 and summarized in Table 5-1. VOCs, SVOCs, PCBs, pesticides,metals, and cyanide will be analyzed using standard USEPA protocols as described in the QAPjP. Natural
attenuation parameters for groundwater will consist of nitrate, sulfate, and chloride via laboratory analysisand dissolved oxygen (DO), oxidation-reduction potential (ORP), pH, temperature, specific conductance,iron II, and alkalinity via field instruments and test kits. Laboratory data will be transmitted to the project
team in the formats specified in the QAPjP, and will include all the supporting documentation necessary topermit a detailed evaluation of the data quality as discussed in the QAPjP. Data validation and verificationwill be performed according to the procedures in the QAPjP.
5.4 DATA EVALUATION
Upon completion of the field investigation portion of the ESI and after receipt of the validated analytical
information, data generated will be evaluated to determine if the objectives of the ESI have been met. Datafrom boring logs will be used to develop cross sections and plot the thickness of unconsolidated overburdenand bedrock topography. Soil sampling analyses will be tabulated and plotted to determine the lateral andvertical extent of potential contaminants. Groundwater quality data from the monitoring wells will also betabulated and plotted to determine the types, extent, and distribution of any contaminants present in the Sitegroundwater. Groundwater flow paths will also be evaluated using potentiometric head data collected fromthe monitoring wells. The surface water and sediment data will be evaluated to determine if sitecontaminants could impact adjacent areas.
Based on the preceding data evaluation, an evaluation of the completeness of the data set will be made todetermine if the ESI objectives have been met. If necessary, additional investigative activities may berecommended to fill data gaps and provide additional site-specific information.
5.5 RISK ASSESSMENT
Discussions of the goals, procedures, and assumptions of the RA will be discussed in the forthcomingRAWP. The RAWP will be developed pending the outcome of the Project XL proposal for the Site.
Sharon Steel, ESI WP 5-8 Final70812-20-C August 1998
A R I O U 0 7

c cTABLE 5-1
SUMMARY OF SAMPLING AND ANALYSIS AT THE SHARON STEEL CORPORATION SITE
SAMPLEMEDIA
Constituent ofConcern
VOCsSVOCsPCBs
PesticidesTotal Metals
Dissolved MetalsCyanide
Duplicates (AllParameters)3
Trip Blanks(VOCs Only)
Field Blanks (AllParameters)3
Field ParametersNatural
AttenuationTOC
Grain Size
Method
CLP-SOWOLMD3.2CLP-SOWOLMD3.2CLP-SOWOLMD3.2CLP-SOWOLMD3.2CLP-SOW ILM D4.0CLP-SOW ILM D4.0CLP-SOW ILM D4.0
CLP-SOW OLMD3.2
SW 846-9060ASTMD2434
Shallow SoilSamples (0-
6")252512
25
25
2
Deep SoilSamples(6"+)4
6969
69
69
4
Groundwater1
Samples
8080
80808080
5
SedimentSamples
2323
23
23
2
Surface WaterSamples
2323
232323
2
Seep Samples
55
555
1
1 per VOC2 shipment
2 4 5
80
2
2323
2
23
1
5
CD
OCO
'Assumes 2 rounds of groundwater samples (40 samples per round).2Onry one per cooler containing samples for VOCs even if various sample media are contained in the cooler.3PCBs will be analyzed for 1 duplicate, I Field Blank, and one MS/MSD sample during the Shallow Soil Sampling Program."Deep soil samples include waste material and potentially contaminated soil samples.
Snaron Steel, ESI WP70812-20-C
5-9 FinalAugust 1998

IGF KAISERWorUwiJe Excellent* in Meeting Client Ntedt
A R I O U O S

6.0 ESI SCHEDULE
Figure 6-1 presents the anticipated schedule for the Site's ESI. Each of the tasks presented in the ESIWork Plan has been scheduled and will be tracked during the course of the investigation. A summary ofwork completed along with an updated project schedule will be presented in the form of a MonthlyProgress Report. This report will also discuss project work to be completed during the next month and anyvariances or changes in site condition encountered which affect the ESI's scope or schedule.
Sharon Steel, ESI WP 6-1 Final708I2-20-C August 1998
A R I O U I O

Figure 6-1 : Expanded Site Investigation ScheduleExxon Corporation - Fairmont Coke Works
o12
3
4
S
•
7
•
"
10
11
12
11
14
15
1*
17
tt
11
*
21
22
23
24
26
.21
27
21
2*
Jt
31
32
33
M
at
*
TMkltom.Nobea o( Expanded Site InvtMigalion Work Pbjn Approv*
Vendor PracuramaM / Schoduang
Nob* EPA of Fftld *M*tio*»m
EPA/WVDEP Meeting - FadeTete ExecrfiM of Wo* Plan
COMMBI RaWtana Plan PreparattaH
Preparation of Drat CRP
Draft CRP SubmtMd to EPA
EPA Review
Review of EPA Commente
Final CRP Rented
FM! CRP SubmHed to EPA
ComriNnty RaMiona Plan Approved
Eipjwia)if Sito lm*Mti0Mi0tt HsUPiQ v*i
Kf Kaieer Mabfeatton to Site and FfcM Sea*
tMng f Soi Semplng
Montaring WHMaMkM
ShatawSolSampfing
Deep Sol Sampfag
Surface WaMSadkiianbSaap Sampfcg
UonaarinaMMOaMlopMM
WaHandeDafMMion
Honlonng «Wi Slug TaaHnB
S..SUMT
Gmndweter Samptag - Round 1
Laboratory Analysfe
Sa* SicwvlaM ft CWQC
CF Katoar DamaMBzaeon *om SM
Graundmiar Samping - Round 2
Laboratory Analy** - Rovnd 2
Data Raductigii / Analy* otFMd Oala
ftapinHien of FiaU SHnmarv Report
EPAIWWDEP Review of Field Program FMtag*
EPArWUDEPHaaang
EBCAWoriiPbw
PraparaaM or pral EECA Wtok Plan
Onft Work Ptai SubmMed to EPA
OurOd
I4d
M
id
10M
20d
Od
40d
Sd
lOd
Od
3M
IJOd
9d
SOd
SOd
Sd
Sd
Sd
40d
Sd
4d
5d
Wd
90d
64d
Id
KM
23d
7M
20d
MM
W
Md
MM
Od
Startwtmvim
•mm•cam•nmanm
FMWimm
ansmaaimvzam1/2MO
•camaoans: aoim•asmiio4m12/1/M
i2/i4mi2«sm•mm•aim•asmtnont
ioasmiiom1UM>
loasmion2mi2oami2aim
vi/ggwim•aimW1*99
2am2om
11/30M
202m
3O2M
sammm
sum7OtlM
n/zsmiioomu/i«e
i2H4mtosmtnim•asm12MM
12WM
iaaamiiAm
1W13W
i2ftamlOnw,
izoimi2asm
V14M
3nimiMm1/14199
2/1 smsum3W99
3MHB
4aomsi3m
7/nm7aom70»9
1MeAug ( Sep I Ott | Nov | DM J e n | F « b | M a r j A p r | M * y | J u n | J u l
4yt--
p* ——— *
r
| B>AnWDEP Meattnf - f aeMaw EMC«He« of Work Pton
3
t•r
h& ' "
I I
————————————————————— Tlrl . I»L-
afl4-
ML - ;i — iI ——— H f-i-i
D , . " • f -
•UI —— I i .
-H WH i*
V .j —— iL , ; . . .
= 4 I : '
H I
,. *]
tfl h : ;t h i !
^EPMWDetMeel*
I h•

Section 7 \
Ed
ICM
^rCD
or

7.0 PROJECT MANAGEMENT
The project organization for the Sharon Steel Corporation Coke Works ESI is presented in Figure 7-1.
The ICF Kaiser Project Manager (PM), Doug Taylor, has primary responsibility for the development andimplementation of the ES! and possible EE/CA, including coordination among the Health and SafetyOfficer, the Project QA Officer, and the ESI Task Leaders. The PM identifies staff requirements, directs,and monitors site progress, ensures implementation of quality procedures and adherence to applicable codesand regulations, and is responsible for project performance within the established budget and schedule.The Project Manger also coordinates the activities of the task leaders, support staff, development of bidpackages, acquisition of engineering or specialized technical support, and all other aspects of the day-to-day activities associated with the project. The PM is responsible for communication of progress reports tothe Exxon PM and EPA. The ICF Kaiser PM reports directly to the Exxon PM.
The Project Quality Assurance Officer (QAO), Dick McCracken is responsible for overall project quality,including development of the generic program and project QA/QC plans, review of specific task QA/QCprocedures, review of laboratory, vendor and subcontractor plans and procedures, review of draft and finalreports, and auditing of specific tasks at established intervals. The QA/QC officer reports directly to theICF Kaiser Project Manager.
The Investigation Lead, Frank Markert, is responsible for development and implementation of the ESIWork Plan and associated documents. The ESI lead will be responsible for the implementation of the fieldinvestigation, the analysis, interpretation, and presentation of data acquired at the site, and the preparationof the draft and final ESI Reports. The ESI lead will also coordinate data needs and data transfer to theRA task. The ESI lead reports to the ICF Kaiser PM and will work with the RA leads.
The Data Management Lead, Troy Blair, will be responsible for incoming analytical data packages andcreation of Site informational databases. The Data Management lead will work with the QC/QC officerand the ESI lead to ensure consistent data packages are developed for data validation/verification. TheData Management Lead will also provide Site data to the RA leads.
The Risk Assessment Task Leader, Katherine Super, reports to and will work directly with the ICF KaiserPM. The Risk Assessment Task Leader also will work closely with the ESI Task Leader to ensure that thefield investigation generates the type and quantity of data necessary for use in the risk assessment. The
Sharon Steel. ESI WP 7-1 Final70812-20-C August 1998
A R I O U I 3

Risk Assessment Task leader will direct the toxicity assessment, exposure assessment, riskcharacterization, and derivation of clean-up goals. The Risk Assessment Task Leader will coordinatepreparation of appropriate sections of the draft and final ESI report.
Sharon Steel, ESI WP 7-2 Final70812-20-C August 1998

Figure 7-1£ § Project Organization£ 1 Sharon Steel Corp. - Fairmont Coke Works Remedial Investigation1
Corporate Health
D. Welshons, CSP
1
ExxonPrnj rt ManagerArr/KjrC/W7xW)D 1
———— . ———— 1 i1 Data Usability Analytical Laboratory
~ Assessmentr~ * *r .- Accufesf LobofatonesICF Kaiser Grdrfenf Corpofafion
Project Manager • ;D. Taybr,PE mmmmmmmmm\mmmmmmmmmmmmmmml
Quality Assurance 1 . ,P. McCracken, CHMM I
5 1— t>— Remedial InvestigationCD Lead— F. Markert, PE, PC
C/l• • • • • —— • Site Safety
> ^— Field Team Leadere
— **i ^™ Geology / Hydrogeology<o 5oo S.
••• Fate & Transport
i i i
1 Feasibility Study 1 Data 1 Risk AssessmentLead 1 Management 1 Leader
L Martin, PE 1 T. Blair 1 K. Super, DABT
II MSI. I'HH
c c c

I1 ! " • '
1 ? :M
ICF KAISERWorldwide Excellence in Meeting Client Need)
A R I O U 1 6

8.0 REFERENCES
AT. Keamy, Inc. and The Earth Technology Corporation. (1986) Phase II RCRA Facility Assessment ofShown Steel, Fairmont, West Virginia. Prepared for USEPA Region III, Philadelphia,Pennsylvania.
D'Appolonia Consulting Engineers. (1980) Environmental Reconnaissance Report for Fairmont CokeWorks, Fairmont, West Virginia. Prepared for Sharon Steel Corporation, Sharon, Pennsylvania.
D'Appolonia Consulting Engineers. (1981) Remedial Site Waste Disposal Report for Fairmont CokeWorks, Fairmont, West Virginia. Prepared for Sharon Steel Corporation, Sharon, Pennsylvania.
Environmental Response Team. (1983,) Preliminary Site Assessment, Sharon Steel Coke Works,Fairmont, West Virginia. Prepared for USEPA Region II!, Philadelphia, Pennsylvania.
Roy F. Weston, Inc. (1991) Site Assessment Trip Report, Sharon Steel Fairmont Coke Plant, Fairmont,Marion County, West Virginia. Prepared for USEPA Region III, Philadelphia, Pennsylvania.
Roy F. Weston. Inc. (1995) Extent of Contamination Report, Sharon Steel Fairmont Coke Plant,Fairmont, Marion County, West Virginia. Prepared for USEPA Region HI, Philadelphia,Pennsylvania.
US Department of Health & Human Services. (1997) Public Health Assessment for Sharon SteelCorporation, Fairmont, Marion County, West Virginia.
USEPA. (1985) Remedial Action at Waste Disposal Sites.
USEPA (1987,) Data Quality Objectives for Remedial Response Activities - Development Process(EPA/540/G-87/003).
USEPA. (1988) Guidance for Conducting Remedial Investigations and Feasibility Studies UnderCERCLA.
USEPA. (1988) Superjund Exposure Assessment Manual.
USEPA (1989) Guide for Conducting Treatability Studies Under CERCLA (EPA/540/2-89/058).
USEPA (1989) Guidance on Preparing Superjund Decision Documents (EPA/540/G-89/007).
USEPA (1989) Risk Assessment Guidance for Superjund, Volumes I and II.
USEPA. (1990) Guidance on Remedial actions at Superjund Sites with PCB Contamination (OSWERDirective No. 9355.4-01).
USEPA. (1991) Guidance on Oversight of Potentially Responsible Party Remedial Investigations andFeasibility Studies, Volumes I and II (EPA/540/G-91/010 and 01 Oa).
Sharon Steel, ESI WP 8-1 Final70812-20-C August 1998

USEPA. (1992) Guidance on Data Usability in Risk Assessment, Part A.
USEPA. (1993-1996) Fairmont Coke Works POLREP Reports, Fairmont, Marion County, WestVirginia.
USEPA. (1994) Aerial Photographic Site Analysis, Fairmont Coke Works, Fairmont, West Virginia(EPA/TS-PIC-94144).
USEPA Region III. (1995) Innovative Approaches to Data Validation.
USEPA Region HI. (1996) Federal On-Scene Coordinator's After Action Report for Fairmont CokeWorks Site, Fairmont, Marion County, West Virginia: 20 May 1993 - 02 August, 1996.
USEPA Region III. (1997) Administrative Order on Consent for Remedial Investigation / FeasibilityStudy, Sharon Steel Corporation - Fairmont Coke Works, Fairmont, West Virginia, Docket No,U1-97-103-DC.
USEPA. (1997) Interim Final Ecological Risk Assessment Guidance for Superjund: Process forDesigning and Conducting Ecological Risk Assessments.
US Geological Survey. (1976) Fairmont East Quadrangle, West Virginia and Fairmont WestQuadrangle, West Virginia Topographic Maps, Dated 1958, Photo revised 1976, Scale I" »2000'.
Sharon Steel. ESI WP 8-2 Final70812-20-C . August 1998
A R I O U I 8

IGF KAISERin Mtttinf ClitntNetJt
A R I O I U 9

APPENDIX A
SUMMARY OF HISTORICAL LABORATORY DATA
A R I O U 2 0

Table A-lConstituents Detected in Soil Samples Collected from Potential Source Areas - Environmental Reconnaisance
Falrmont Coke Works(Original Data Presented In D'Appolonla, 1980)
Constituent Units
PHAcid/Base PotentialNeutralization PotentialFizzAmenable Cyanide mg/kgMonamenable Cyanide mg/kgPhenol mg/kgTotal Iron mg/kg
PSA 2 * Former ProductionArea
Frequencyof
Detection1 /11/1I / I1 /12 /21/22 /2
Rang* ofConcentrations
7.1•K>.31.20
2.0 - 7.54.0
0.25-1.25Not Analyzed
PSA 4A - North Landfill
Frequencyof
Detection
Range ofConcentrations
Not AnalyzedNot AnalyzedNot AnalyzedNot Analyzed
1 / 11 / 11 / 11 / 1
9.02.0
0.352050
PSA SB - Former OxidationImpoundment No. 1
Frequencyof
Detection
Range ofConcentrations
Not AnalyzedNot AnalyzedNot AnalyzedNot Analyzed
0 / 10 / 11/1
Not DetectedNot Detected
0.63Not Analyzed
No samples were collected from the following Potential Source Areas
PSA 1 - Former Light Oil Storage AreaPSA 3 • Foimer Coke OvensPSA 4B-South LandfillPSA 5 • Former Breeze Washout AreaPSA 6 - Existing ImpoundmentPSA 7 - Existing Waste Sludge and Breeze Storage AreaPSA 8A - Former Sludge Storage Area
Constituents analyzed during Ails Investigation
The above list comprises the entire analyte list.
Sharon Steel, ESI WP70812-20-C
FinalAugust 1998
A R I O U 2 I

Table A-2 rConstituents Detected in Groundwater Samples Collected - Environmental Reconnaisance
Fairmont Coke Works ,(Original Data Presented in D'Appolonia, 1980)
Constituent
TemperaturepHPhenalthalein AlkalinityTotal AlkalinityAcidityDissolved OxygenChemical Oxygen DemandTotal Organic CarbonOil and GreaseAmmonia NitrogenKjeldahl NitrogenNitrateChloride:luoridePhenolsSulfateAmenable Cyanideslonamenable CyanideEhSpecific ConductanceTotal Suspended SolidsTotal Dissolved SolidsTotal SolidsFiltered MetalsArsenicBariumCadmiumCalciumChromiumCopperIronLeadMagnesiumManganeseMercuryPotassiumSeleniumSilverSodiumZinc
Shallow AquiferFrequency ofDetection In
Samples
18/1823/230/2323/230/238/8
12/2021/2215/2318/2321/2318/2322/2222/2222/2322/2219/2315/2313/1323/237/7
23/237 /7
Range ofDetected SampleConcentrations
9.0 - 14.06.6-7.9
Units
°C
Not Detected70-370 mg/L
Not Detected1.4-8.52-3321-61000.6-160.1-6600.1-9900.1-8.21.5-23600.02-1.00.002 - 407-10000.08-2.10.05 - 8.4
+4,01- +462355 - 12100
2 - 23700116-10840261-24400
mg/Lmg/Lmg/Lmg/Lmg/Lmg/Lmg/Lmg/Lmg/Lmg/Lmg/Lmg/Lmg/LmV
umhos/cmmg/Lmg/Lmg/L
7/228/220/2222/224/2215/2319/221/23
22/2223/232/2322/229/220/2223/2317/23
0.001-0.0100.12-14
mg/Lmg/L
Not Detected57-325
0.01-0.030.01-0.160.02 - 38
0.17.3 - 1450.76 - 30
0.0006-0.00160.9-29
0.001*0.020
mg/Lmg/Lmg/Lmg/Lmg/Lmg/Lmg/Lmg/Lmg/Lmg/L
Not Detected7.7-52
0.02 - 2.61mg/Lmg/L
Intermediate/Deep AquiferFrequency ofDetection In
Samples
15/1519/191/1919/191/198/8
12/1618/1813/1917/1918/1910/1918/1919/1919/1918/1914/1911/19 .10/1019/197 /7
19/197 /7
Range ofDetected SampleConcentrations
12.0 - 15.06.3-9.5
3070 - 220
203.6-7.34-1701-1720.5-440.1-6.60.4-380.1-5.41.0-59
0.03 - 0.400.002-0.22
4-4250.1-2.00.3 - 7.0
462- +391151 - 12501-31400105-810
106-31800
Units
°C
mg/Lmg/Lmg/Lmg/Lmg/Lmg/Lmg/Lmg/Lmg/Lmg/Lmg/Lmg/Lmg/Lmg/Lmg/Lmg/LmV
umhos/cmmg/Lmg/Lmg/L
6/1914/192/1919/193/197/1919/191/19
19/1919/192/1919/198/190/1919/197/19
0.001-0.1010.10-2.5
0.002-0.00517 - 155
0.018-0.030.01-0.070.03-11
0.103.0-32
0.17-3.950.0006-0.0006
1.1-1150.001-0.012
mg/Lmg/Lmg/Lmg/Lmg/Lmg/Lmg/Lmg/Lmg/Lmg/Lmg/Lmg/Lmg/L
Not Detected6.9-58
0.01-0.06mg/Lmg/L
Sharon Steel, ESI WP70812-20-C
FinalAugust 1998
A R I O U 2 2

Table A-3Constituents Detected in Soil Samples Collected from Potential Source Areas - Phase II RCRA Facility Assessment
Fairmont Coke Works(Original Data Presented in Kearney, 1986)
PSA 6 - Existing Impoundment
Constituent
Frequencyof
Detection
Range ofConcentrations
Volatile* (mg/kff)BenzeneChlorofonnMethylene chlorideretrachloroetheneTolueneMetals (rag/kg)ArsenicBerylliumCadmiumChromiumCopperLeadMercuryNickelZinc
3/31/43/41/43/4
0.74 - 10.21.07
0.30-1.840.129
0.38 - 9.83
2/43/42/44 / 44/43/43/44 /44 / 4
12-180.8-12 - 2
13-425-3543-590.6 - 1.2
9-3263 - 330
Miscellaneous (mg/kff)Total CyanideTotal PhenolicsSulfide
4/44 / 44 / 4
3.3 - 2201.3-161-59
Constituent
Frequencyof
Detection
Range ofConcentrations
Stmivolatiles (ma/kg)AcenaphtheneAcenaphthyleneAnthraceneBenzo(a)anthraceneBenzo(a)pyreneBenzo(b)fluorantheneBenzo(ghi)peryleneBenzoOOfluorantheneChryseneDibenzo(aji)anthraceneFluorantheneFluoreneIndeno{ 1 ,2,3-cd)pyreneNaphthalenePhenanthrenePyrene
Pesticides and PCBs
1/41/42/42/43 /43 /42 / 43 /43 / 41/43/43 /42/44/43 /43 /4
295909
119-15686.7 - 1380109 - 402
61.1-469081-608
16.9-130017.4 - 2040
4026.4 - 36309.0-221039 - 238
3.17-864033.2-412021.3 - 2520
None Detected
No samples were collected from the following Potential Source Areas
PSA 1 - Former Light Oil Storage AreaPSA 2 - Former Production AreaPSA 3 - Former Coke OvensPSA 4A- North LandfillPSA 4B- South LandfillPSA 5 - Former Breeze Washout AreaPSA 7 - Existing Waste Sludge and Breeze Storage AreaPSA 8A - Former Sludge Storage AreaPSA 8B - Former Oxidation Impoundment No. 1
Sharon Steel, ESI WP70812-20-C
FinalAugust 1998
AR 10 11423

Table A-3Constituents Detected in Soil Samples Collected from Potential Source Areas - Phase II RCRA Facility Assessment
. . „ . . • „ . Falrmont Coke Works ^> (Original Data Presented in Kearney, 1986)
Constituents analyzed during this Investigation
Volatile*1,1,1-Trichloroethane1,1,2,2-Tetrachloroethane1, 1,2-Trichloroethane1,1 -Dichloroethane.1,1-DichIoroethenc1,2,3-Trichloropropane1,2-Dichloroethane1,2-Dichloropropane1,3 -Dichloropropene2-Chloroethyl vinyl etherAcroleinAciylonitrileBenzenebis(Chloromethyl)etherBromodichloromelhaneBromoformBromomethaneCarbon TetrachlorideChlorobenzeneChlorobromomethancChloroethaneChloroformChloromethaneDichlorodtfluoromethaneEthylbenzeneMethylene chlorideTetrachloroetheneToluenetrans-l,2-DichJoroetheneTrichJoroetheneTrichlorofluoromethaneVinyl chloride
NOTE:
Toluene • Boti Italicindicates constituent wasdetected.
Results can be found inthe individual PSAsections of the table.
SemivoIatUei1,2,4-Trichlorobenzene1,2-Dichlorobenzene1.2-Diphenylhydrazine1.3-Dichlorobenzene1.4-Dichlorobenzene2,2'-oxybis( 1 -Chloropropane)2.3.7,8-TCDD2,4,6-Trichlorophenol2,4-Dichlorophenol2,4-Dimethylphenol2,4-Dinitrophenol2,4-Dinitrotoluene2,6-Dinitrotoluene2-Chloronaphthalene2-Chlorophenol3,3'-Dichlorobenzidine4.6-Dinitro-2-methylphenol4-Bromophenyl phenyl ether4-Chloro-3-methylphenol4-CWorodiphenylether4-NitrophenolAcenaphtheneAcenaphthyleneAnthraceneBenzidineBento(a)anthraceneBento(a)pyreneBenzo(b)jbtoranthene
Beni0(k)fluorantheneBis(2-ch!oroethoxy) methaneBis(2<hloroethyl) etherBis(2-ethylhcxyl) phthalateButyl benzyl phthalateChryseneDlbento(a,h)anthraceneDicthyl phthalateDimethyl phthalateEH-n-butyl phthalateDi-o-octyl phthalateFluoranlheneFtuoreneHexachlorobutadiene
Pesticides4,4'-DDD4,4'-DDE4,4'-DDTAldrinalpha-BHCChlordanebeta-BHCdelta-BHCDieldrinEndosulfan IEndosulfan IIEndosulfan SulfateEndrinEndrin aldehydegamma-BHC (Lindane)HeptachlorHeptachlor epoxideToxaphene
PCBsAroclor 1016Aroclor 1221Aroclor 1232Aroclor 1242Aroclor 1248Aroclor 1254Aroclor 1260
SemhrolatUes (continued)HexachlorocyclopentadieneHexachloroethanc
IsophoroneNaphthaleneNitrobenzeneM-NitrosodimethylamineN-Nitroso-Di-n-propylamineN-NitrosodiphenylaminePentachlorophenolPhenanthrenePhenolPyrene
MetalsAntimonyArsenicBerylliumCadmiumChromiumCopperleadMercuryNickelSeleniumSilverThalliumZinc
MiscellaneousTotal CyanideTotal Phenolic*Sulflde
Sharon Steel. ESI WP70812-20-C
FinalAugust 1998
A R I O U 2 1 *

Table A-4Constituents Detected in Soil Samples Collected from Potendal Source Areas - Extent of Contamination Survey
Fairmont Coke Works(Original Data Presented In Weston, 1985)
PSA 1 - Former Light OU Storage Area
Constituent
Frequencyof
DetectionVolatile* (me/kg)1,1,1 -Trichloroethane2-Butanone (MEK)AcetoneBenzeneCarbon DisulfideChlorobenzeneChloroformEthylbenzenetfethylene chlorideStyreneTolueneTotal XylenesTrichloroethene
1/61/63/64/60/61/60/62/60/61/63/63/62/6
Semtvolatiles (rag/kg)2.4-Dimethylphenol2-Methylnaphthalene2-Methylphenol4-MethylphenolAcenaphtheneAcenaphthyleneAnthracene3enzo(a)anthracene3enzo(a)pyrene3enzo(b)fluoranthene3enzo(ghi)perylene3enzo(k)nuorantheneBis(2-ethylhexy1) phthalatc3utyl benzyl phthalate-arbazoleChryseneDibenzo(a,h)anthraceneDibcnzoftiranDiethyl phthalateDi-n-butyl phthalateFluorantheneFluorene[ndeno( 1 ,2,3-cd)pyreneNaphthaleneN-nitrosodiphenylaminePhenanthrenePhenolPvrene
0/53 / 51/51/50/50 /51 /53 / 53 /52/51/52/50/50/50/53/50/52/50/51/54 /51/51/53/50/55/50/54 /5
Range ofConcentrations
0.007 J2.0
0.006 B - 0.009 B0,004 J - 30Not Detected
0.56 JNot Detected0.23 J - 23
Not Detected0.73 J
. 3.2-301.6-150
0.004 J- 0.49 J
Not Detected0.058 J - 32
0.1 J0.12J
Not DetectedNot Detected
1.2J0.022 J - 0.39 J0.026 J - 0.4 J0.024 J - 0.85 J
0.460.02 J- 0.65 JNot DetectedNot DetectedNot Detected0.022 J - l . O JNot Detected0.76 J- 2.8 JNot Detected
0.032 J0.045 J - 2.0 J
5.0 J0.36 J
1.2- 450 JNot Detected0.021 J- 6.0 JNot Detected0.029 J - l . 7 J
Constituent
Frequencyof
DetectionPesticides (tag/kg)4,4'-DDD4,4'-DDE4,4'-DDTAldrinalpha-Chlordanedelta-BHCDietdrinEndosulfan IEndosulfan IIEndosulfan SulfateEndrinEndrin aldehydeEndrin ketonegamma-ChlordaneHeptachlor epoxideMethoxychlorPCBs (mxflcg)
1/50/50/51/51/50/50/5
/515151515151515
0/5
Range ofConcentrations
0.01 JNot DetectedNot Detected
0.0047 J0.0061 J
Not DetectedNot Detected
0.024 J0.032 J0.0 19 J0.0 12 J0.031 J0.0 18 J0.0068 J0.012 J
Not DetectedNone Detected
Metals (mR/kg)AluminumAntimonyArsenicBariumBerylliumCadmiumCalciumChromiumCobaltCopperCyanideIronLeadMagnesiumManganeseMercuryNickelPotassiumSeleniumSilverSodiumThalliumVanadiumZinc
3 /30/33 / 33 / 33 /31 / 33 /33/33/33/31/33/33/33/33 /32 /33/33/32 /31/33 / 30/33 /33 / 3
2600-9900Not Detected
1.5-42.726.6 - 99.40.26 B- 1.2
2.8410-22600
5.3 - 7.73.4-5.3
7.2-62.26.4
8170 • 179005.6-280
402 - 2080103-485
0.05-0.136.5-12.3
351 B- 6040.83-1.3
2.146.4 B - 278Not Detected
6.7-9.330.9-1860
Sharon Steel, ESI WP70812-20-C
FinalAugust 1998
A R I O U 2 5

Table A-4Constituents Detected In Soli Samples Collected from Potential Source Areas - Extent of Contamination Survey
. Falrmont Coke Works •! {' * (Original Data Presented In Weston, 1985)
PSA Z • Former Production Area
Constituent
Frequencyof
DetectionVolatile* (me/kg)1,1,1 -Trichloroethane2-Butanone (MEK)AcetoneBenzeneCarbon DisulfideChlorobenzeneChloroformBthylbenzene^ethylene chlorideStyreneTolueneTotal Xylenesrrichloroethene
0/102/107/108/102/100/100/101/106/100/107/105/100/10
Semlvolatiles (mg/kg)2,4-DimethyIphenol2-Methylnaphthalene2-Methylphenol4-MethylphenolAcenaphtheneAcenaphthyleneAnthracene3enzo(a)anthracene3enzo(a)pyrencBenzo(b)fluorantheneBenzo(ghi)pervlene3enzo(k)fluorantheneBis(2-ethylhexyl) phthalateButyl benzyl phthalateCarbazole~hryseneDibenzoCaJOanthraceneDibenzofuranDiethyl phthalateDi-n-butyl phthalateFluorantheneFluoreneIndeno( 1 ,2,3*cd)pyreneNaphthaleneM-nitrosodiphenylaminePhenanthrenePhenolPyrene
2/106/104/104/104/105/106/107/106/106/105/106/104/101/106/107/105/107/101/104/107/106/105/109/101/107/104/107/10
Range ofConcentrations
Not Detected0.003 J- 0.004 J0.008 J- 0.0510.00 1J- 0.57
0.002 J- 0.002 JNot DetectedNot Detected
0.009 J0.009 B- 0.092Not Detected
0.002 J- 0.0540.0009 J- 0.13Not Detected
0.041 J- 1.5 J0.013 J- 12 J0.025 J - l . 8 J0.088 J- 2.9 J0.043 J-0. 18 J
O.I9J-39J0.44J-9IJ
0.007 J - 160 J0.075 J- 130 J0.12 J-l 10 J0.42 J - 55 J
0.097 J- 120 J0.009 B- 0.029 B
0.006 B0.24 J - 9.7 J
0.006 J- 130 J0.11 J- 23 J0.005 J- 34 J
0.013 B0.007 B-0. 12 B
0.01 B- 460 JO. I3J -41J0.34 J- 62 J0.042 J- 47 J
0.14J0.014 J- 220 J0.045 J- 3.0 J0.008 B - 330 J
Constituent
Frequency•f
DetectionPesticides (me/kg)4,4'-DDD4,4'-DDE4,4'-DDTAldrinalpha-Chlordanedelta-BHCOieldrinEndosulfan IEndosulfan IIEndosulfan SulfateEndrinEndrin aldehydeEndrin ketonegamma*ChlordaneHeptachlor epoxideMethoxychlorPCBsfmEfc*)
0/103/101/105/101/102/101/105/100/100/102/101/101/102/102/104/10
Range ofConcentrations
Not Detected0.0023 J- 0.02 1 J
0.055 J0.0005 1J- 0.24 J
0.22 J0.0046 J- 0.034 J
0.063 J0.00062 J - 3.5 J
Not DetectedNot Detected
0.0066 J- 0.097 J0.05 1J0.21 J
0.0043 J- 0.0082 J0.00043 J- 0.027 J0.001 IB -0.33 J
None DetectedMetals (me/ke)AluminumAntimonyArsenicBariumBerylliumCadmiumCalciumChromiumCobaltCopperCyanideIronLeadMagnesiumManganeseMercuryNickelPotassiumSeleniumSilverSodiumThalliumVanadiumZinc
10/100/4
10/1010/109/102/1010/1010/1010/1010/105/1010/1010/1010/1010/107/1010/1010/104/106/1010/101/1010/1010/10
2780 - 9620Not Detected
3.4 - 20.326.5*1540.32-1.21.1-2.2
177 B- 23800 B9.5-30.61.7-28.47.1-97.80.76-115
11500-10100010.4-261
566 B- 2220 B45,9-7710.08-0.624.5-79.3
344 B - 12200.62-1.9
0.55- 6.2 K77.9 B- 1210 B
2.49.9 - 108
4 1.3 J- 828
Sharon Steel, ESI WP70812-20-C
FinalAugust 1998
A R I O U 2 6

Table A-4Constituents Detected in Soil Samples Collected from Potential Source Areas - Extent of Contamination Survey
Fairmont Coke Works(Original Data Presented In Weston, 1985)
PSA4A- North Landfill
Constituent
Frequencyof
DetectionVolatile* (me/kg)1,1,1 -Trichloroethane2-Butanone (MEK)AcetoneBenzeneCarbon Disulfide"hlorobenzeneChlorofomiEthylbenzenevlethylene chlorideStyreneTolueneTotal XylenesTrichloroethene
Range ofConcentrations
Not AnalyzedNot AnalyzedNot AnalyzedNot AnalyzedNot AnalyzedNot AnalyzedNot AnalyzedNot AnalyzedNot AnalyzedNot AnalyzedNot AnalyzedNot AnalyzedNot Analyzed
Semtvolatiks (ing/kg)2,4-Dimethylphenol2-Methylnaphthalene2-Methylphenol4-MethylphcnolAcenaphtheneAcenaphthyleneAnthraceneBenzo(a)anthracene3enzo(a)pyrene3enzo(b)fluoranthene3enzo(fthi)perylene3enzo0c)fluoiantheneBis(2-ethylhexyl) phthalateButyl benzyl phthalate^arbazole-hryseneDibenzo(a,h)anthraceneDibenzofiiranDiethyl phthalateDi-n-butyl phthalateFluorantheneFluoreneIndeno(l,2,3-cd)pyreneNaphthaleneN-nitrosodiphenylaminePhenanthrenePhenolPyrene
0 / 1l / l0 /10 / 10 / 11 / 11 /11 / 1l / l1 /11 /11/10 /10 /11 / 11 /11 /11/10/10/11/11 /11 / 11 / 10 /11 / 10/11/1
Not Detected4.0 J
Not DetectedNot DetectedNot Detected
7.7 J11J6161562856
Not DetectedNot Detected
1.2 J6112J
2.4 JNot DetectedNot Detected
1103.3 J33
6.8 JNot Detected
40Not Detected
130
Constituent
Frequencyof
DetectionPesticides (ing/kg)4,4'-DDD4,4'-DDE4.4'-DDTAldrinalpha-Chlordanedelta-BHCDieldrinEndosulfan IEndosulfan IIEndosulfan SulfateEndrinEndrin aldehydeEndrin ketonegamma-ChlordaneHeptachlor epoxideMethoxychlorPCBs (mg/kff)Metals (ms/kg)AluminumAntimonyArsenicBariumBerylliumCadmiumCalciumChromiumCobaltCopperCyanideIronLeadMagnesiumManganeseMercuryNickelPotassiumSeleniumSilverSodiumThalliumVanadiumZinc
0/10 / 10 / 11 /11 /10 / 11 / 11 /11/10 /10 / 11 / 11 /10 / 11/11 / 1
Range ofConcentrations
Not DetectedNot DetectedNot Detected
0.039 J0.029 J
Not Detected0.024 J0.62 J0.049 J
Not DetectedNot Detected
0.062 J0.089 J
Not Detected0.026 J0.17J
None Detected
3/31/33/33/33/30/33/33 /33/33/33/33 /33/33/33 /32 / 33/33/32/30/33/30 / 33 / 33 /3
\1070 - 6960
6.1 L2.4 • 8.7
62.5 - 2860.1 B -0.43
Not Detected484 - 224008.4-26.33.3-7.4
10.7 - 38.63.9-193
14300-563003.4-133
56.8 - 7897.7-94.80.33-0.552.8 - 9.0
218-31500.98 -1. 9 BNot Detected62.9 B • 767Not Detected
6.6-86.18.4 B- 39
Sharon Steel, ESI WP70812-20-C
FinalAugust 1998
AR IOU27

Table A-4Constituents Detected In Soil Samples Collected from Potential Source Areas - Extent of Contamination Survey
.. , • Falrmont Coke Works A : •-, f• (Original Data Presented biWeston,1985)
PSA4B- South Landfill
Constituent
Frequencyof
DetectionVolatlles (me/kg)1,1,1-Trichlorocthane2-Butanone (MEK)AcetoneBenzeneCarbon Disulfide2hlorobenzeneChloroformEthylbenzenevlethylene chlorideStyreneTolueneTotal Xylenesrrichloroethene
0/51/53/54 /52/50/51/54 /52/52/54 /54/50/5
SemlvolatUes (ing/kg)2,4-Dimethylphenol2-Methylnaphthalene2-Methylphenol4-MethylphenolAcenaphtheneAcenaphthyleneAnthracene3enzo(a)anthraceneBenzo(a)pyrene3enzo(b)fluorantheneBenzo(ghi)perylene3enzo(k)fluorantheneBis(2-ethylhexyl) phthalateButyl benzyl phthalateCarbazoleChrvseneDibcnzo(a,h)anthraceneDibenzoruranDielhyl phthalateDi-n-butyl phthalateFluorantheneFluoreneIndencK 1 ,2,3-cd)pyreneNaphthaleneN-nitrosodiphenylaminePhenanthrenePhenolPyrene
0/54 /50/52/52/54/55 /55/55/55/54 /55/51/50/54 /55/54/54 /51/50/55/54/54 /55/50/55/51/55/5
Range ofConcentrations
Not Detected0.02 J
0.017 B -0.07 B0.008 J - 760
0.006 J- 0.023Not Detected
0.004 J0.004 J- 24
0.009 B- 0.01 B0.006 J- 1.1 J0.03 J- 8900.049 J- 310Not Detected
Not Detected1.8 J -2600 JNot Detected
0.053 J- 370 J0.12 J -0.66 J
0.094 J- 8100 J0.27 J - 10000 J0.35 J - 5200 J0.26J-4000J0.25 J - 3000 J0.17 J- 1500 J0.31 J- 3500 J
0.65 BNot Detected
0.11J-3800J0.36 J- 4400 J0.065J-500J0.39 J- 6300 J
0.039 JNot Detected
0.9 J- 17000 J0.5 J- 8600 J0.16 J- 1700 J3.8 J- 18000 JNot Detected1.8 J- 27000 J
570 J0.59 J- 11000 J
Constituent
Frequencyof
DetectionPesticides (me/kg)4,4'-DDD4,4'-DDE4,4'-DDTAldrinalpha-Chlordanedelta-BHCDieldrinEndosulfan IEndosulfan IIEndosulfan SulfateBndrinEndrin aldehydeEndrin ketonefUmma-ChlordaneHeptachlor epoxideMethoxychlcrPCBs (me/kg)
1/54 /52/54/53/52/51/55/53/50/54/53/54 /51/54/53/5
Range ofConcentrations
0.074 J0.03 J- 0.26 J0.096 J -0.15 J0.02J-0.15J0.023 J- 0.97 J0.047 J- 0.067 J
0.18J0.004 J-4.1J0.038 J-0. 16 JNot Detected
0.026 J- 0.26 J0.027 J-0. 12 J0.071 J- 0.34 J
0.02 J0.0069-0. 13 J0.16J-0.53J
None DetectedMetals (mg/kc)AluminumAntimonyArsenicBariumBerylliumCadmiumCalciumChromiumCobaltCopperCyanideIronLeadMagnesiumManganeseMercuryNickelPotassiumSeleniumSilverSodiumThalliumVanadiumZinc
5/53/55/55/55/51/55/55/55/55/55/55/55/55/55/54/55/55/54/50/55/53/55/55/5
2040-77004.8 L- 14.6 L
4.4-38.536.9-1760.27-0.88
0.992870-21800
15.7 - 1064.9-29.49.1-161
10.7 - 141019500-193000
25.2 - 161139-75660-7790.34-2.415.8-84.3166B-941
1.3-2.7Not Detected
232-5910.92-1.76.7-52.832.6 - 173
Sharon Steel, ESI WP70812-20-C
FinalAugust 1998
A R I O I I » 2 8

Table A-4Constituents Detected in Soil Samples Collected from Potential Source Areas - Extent of Contamination Survey
Fairmont Coke Works(Original Data Presented in Weston, 1985)
PSA 5 - Former Breeze Washout Area
Constituent
Frequencyof
DetectionVolatiles (mgflcg)1,1,1 -Trichloroethane2-Butanone (MEK)AcetoneBenzeneCarbon DisulfidewhlorobenzeneChloroformithylbenzenevlethylene chlorideStyreneTolueneTotal Xylenesfrichloroethene
0/10 / 10 / 10/10 /10 / 10 /10/11 / 10 / 10 / 10 / 10 / 1
Semivolatiles (mjj/kg)2,4-Dimethylphenol2-Methylnaphthalene2-Methylphenol4-McthylphenolAcenaphtheneAcenaphthyleneAnthracene3enzo(a)anthracene3enzo(a)pyrene3enzo(b)fluoranthene3enzo(gthi)perylene3enzo(k)nuorantheneBis(2-ethylhexvl) phthalateButyl benzyl phthalateCarbazoleChryseneDibenzo(a,h)anthraceneDibenzofuranDiethyl phthalateDi-n-butyl phthalateFluorantheneFluoreneEndeno(l,2,3-cd)pyreneNaphthalenetf-nitrosodiphenylaminePhenanthrenePhenolPyrene
0 /11 / 10/10 / 10 / 10 /10/11/11 / 10 / 10 / 11 / 11 / 10 / 10/11/10 / 10 / 10/10/11 / 10/10 /11 /10/11 / 10 / 11/1
Range ofConcentrations
Not DetectedNot DetectedNot DetectedNot DetectedNot DetectedNot DetectedNot DetectedNot Detected
0.004 BNot DetectedNot DetectedNot DetectedNot Detected
Not Detected0.008 J
Not DetectedNot DetectedNot DetectedNot DetectedNot Detected
0.023 J0.019 J
Not DetectedNot Detected
0.039 J0.045 J
Not DetectedNot Detected
0.024 JNot DetectedNot DetectedNot DetectedNot Detected
0.034 JNot DetectedNot Detected
0.014 JNot Detected
0.015 JNot Detected
0.027 J
Constituent
Frequencyof
DetectionPesticides (mgflcg)4,4'-DDD4,4'-DDE4,4'-DDTAldrinalpha-Chlordanedelta-BHCDieldrinEndosulfan IEndosulfan IIEndosulfan SulfateEndrinEndrin aldehydeEndrin ketonegamma-ChlordaneHeptachlor epoxideMethoxychlorPCBs (mg/kg)
0 / 10 / 10/10/10 / 10/10 /10/10 / 10/10 /10 / 10 / 10 / 10 / 11 / 1
Range ofConcentrations
Not DetectedNot DetectedNot DetectedNot DetectedNot DetectedNot DetectedNot DetectedNot DetectedNot DetectedNot DetectedNot DetectedNot DetectedNot DetectedNot DetectedNot Detected
0.002 BNone Detected
Metals (nig/kg)AluminumAntimonyArsenicBariumBerylliumCadmiumCalciumChromiumCobaltCopperCyanideIronLeadMagnesiumManganeseMercuryNickelPotassiumSeleniumSilverSodiumThalliumVanadiumZinc
1 / 10 / 11/11 / 10 /10 / 11 /1I / I1 /11 / 10/11/11 /11/11/10/11/11/10 / 10 / 11/10 / 11 / 11 /1
17300Not Detected
7.459.7
Not DetectedNot Detected
72.218.54.113.7
Not Detected1890015.6161054.8
Not Detected9.51080
Not DetectedNot Detected
37.4 BNot Detected
31.847.2
Sharon Steel, ESI WP70812-20-C
f l R I O U 2 9
FinalAugust 1998

Table A-4i , Constituents Detected hi Soil Samples Collected from Potential Source Areas - Extent of Contamination Survey
: Falrmont Coke Works '$•'$." (Original Data Presented In We*ton, 1985)
No samples were collected from the following Potential Source Areas
PSA 3 - Former Coke OvensPSA 6 - Existing ImpoundmentPSA 7 - Existing Waste Sludge and Breeze Storage AreaPSA 8A - Former Sludge Storage AreaPSA SB - Former Oxidation Impoundment No. 1
Sharon Steel, ESI WP . . Final70812-20-C August'1998
A R I O U 3 0

Table A-4Constituents Detected in Soil Samples Collected from Potential Source Areas - Extent of Contamination Survey
Fairmont Coke Works(Original Data Presented in Weston, 1985)
Constituents analyzed during this investigation
VoUHlesI, lt I- TrichlorocthaneI,1,2,2-Tetrachloroethane1, 1,2-Trichloroethane1,1 -Dichloroethane1,1 -Dichloroethene1,2-Dichloroethane1,2-Dichioroethene (Total)1,2-Dichloropropane2-Bulanone (MEK)2-Hexanone4-Methyl-2-pentanoneAcetoneBenzeneBromodichloromethaneBromoformBromomethaneCarbon BisulfideCarbon TetrachlorideChlorobemeneChloroethaneChloroformChloromethanecis-l,3-DichloropropeneDibromochloromethaneEthylbenzeneMethylene chlorideStyreneTetrachloroetheneTolueneTotal XylenesTrichloroetheneVinyl chloride
NOTE:
Toluene - Bold Italicindicates constituent wasdetected at one or moreof the PSAs.
Results can be found inthe individual PSAsections of the table.
Semivolatiles1,2,4-Trichlorobenzene1.2-Dichlorobenzene1.3-Dichlorobenzene1,4;EHchlorobenzene2,2'-oxybis( 1 -Chloropropane)2.4.5-Trichlorophenol2.4.6-Trichlorophenol2,4-DichIorophenol2,4-Dimethylphenol2,4-Dinitrophenol2,4-DinitrotoIuene2,6-DinitrotoIuene2-Chloronaphthalene2-Chlorophenol2-Methylnaphthatene2-MethyIphenol2-Nitroaniline2-Nitrophenol3,3'-Dichlorobenzidine3-Nitroaniline4,6-Dinitro-2-methyIphenol4-Bromophenyl phenyl ether4-Chloro-3 -methylphenol4-Chloroaniline4-Chlorodiphenylether4-Methylphenoi4-Nitroaniline4-NitrophenolAcenaphtheneA cenaphtkyleneAnthraceneBenzo(a)anthraceneBenzo(a)pyreneBento(b)jtuorantheneBenz0(ghi)peryleneBenzo(k)fbtorantheneBis(2-chloroethoxy) methaneBis(2-chloroethyl) etherBis(2-ethythexyt) phthalateButyl benzyl phthalateCarbazoleChryseneDibento(a,h)anthraceneDibemofuran
PesHcldes4,4'-DDD4,4'-DDE4,4'~DDTAldrinalpha-BHCalpha-Chlordanebeta-BHCdelta-BHCDieldrinEndosulfan IEndosulfan IIEndosulfan SulfateEndrinEndrin aldehydeEndrin ketonegamma-BHC (Lindane)gamma-ChlordaneHeptachlorHeptachlor epoxideMethoxychlorToxaphene
PCBsAroclor 1016Aroclor 1221Aroclor 1232Aroclor 1242Aroctor 1248Aroclor 1254Aroclor 1260
MetabAluminumAntimonyArsenicBariumBerylliumCadmiumCalciumChromiumCobaltCopperCyanideIronLeadMagnesiumManganeseMercuryNickelPotassiumSeleniumSilverSodiumThalliumVanadiumZinc
Semivolatiles (continued)Die thyt phthalate H-Nitroso-Di-n-propylamine
Indeno(l,2,3~cd)pyreneIsophoroneNaphthaleneNitrobenzeneN-nitrosodiphenylaminePentachlorophenol
Dimethyl phthalateDi-n-buty I phthalateDi-n-octyl phthalateFluorantheneFluoreneHexachlorobenzeneHexachlorobutadieneHexachlorocyclopentadieneHexachloroe thane
PhenanthrenePhenolPyrene
Sharon Steel, ESIWP70812-20-C
FinalAugust 1998
A R I O U 3