for south bay high school - partnering for positive changefor south bay high school address: 4025 w....
TRANSCRIPT

Page 2 of 17
For South Bay High School Address: 4025 W. 226th Street, Torrance, CA 90505 Phone: 310-373-4556 Principal: Timothy M. Chandler Grade Span: 6-12
By February 1 of each year, every school in California is required by state law to publish a School Accountability Report Card (SARC). The SARC contains information about the condition and performance of each California public school. Under the Local Control Funding Formula (LCFF) all local educational agencies (LEAs) are required to prepare a Local Control and Accountability Plan (LCAP), which describes how they intend to meet annual school-specific goals for all pupils, with specific activities to address state and local priorities. Additionally, data reported in an LCAP is to be consistent with data reported in the SARC.
➢ For more information about SARC requirements, see the California Department of Education (CDE) SARC Web page at http://www.cde.ca.gov/ta/ac/sa/.
➢ For more information about the LCFF or LCAP, see the CDE LCFF Web page at http://www.cde.ca.gov/fg/aa/lc/.
➢ For additional information about the school, parents/guardians and community members should contact the school principal or the district office.
DataQuest
DataQuest is an online data tool located on the CDE DataQuest Web page at http://dq.cde.ca.gov/dataquest/ that contains additional information about this school and comparisons of the school to the district and the county. Specifically, DataQuest is a dynamic system that provides reports for accountability (e.g., test data, enrollment, high school graduates, dropouts, course enrollments, staffing, and data regarding English learners). Internet Access
Internet access is available at public libraries and other locations that are publicly accessible (e.g., the California State Library). Access to the Internet at libraries and public locations is generally provided on a first-come, first-served basis. Other use restrictions may include the hours of operation, the length of time that a workstation may be used (depending on availability), the types of software programs available on a workstation, and the ability to print documents. Throughout this document the letters DPL mean data provided by the LEA, and the letters DPC mean data provided by the CDE.
California Department of Education
School Accountability Report Card Reported Using Data from the 2016–17 School Year
Page 3 of 17
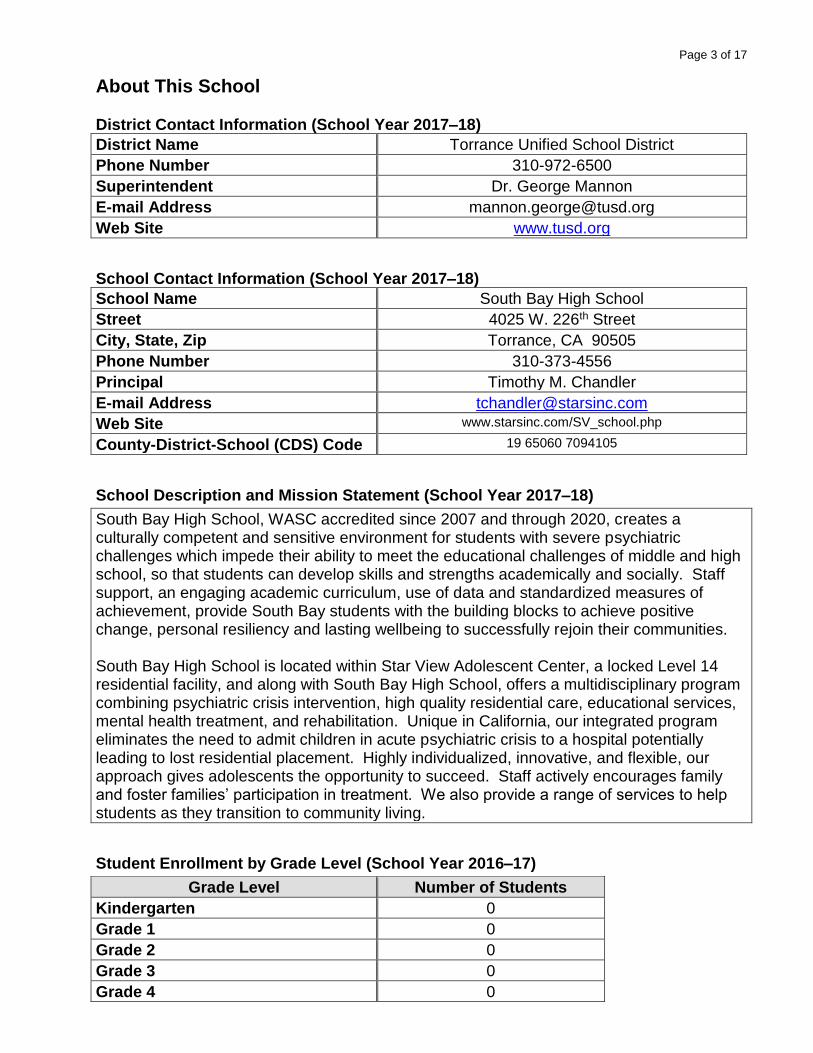
About This School District Contact Information (School Year 2017–18)
District Name Torrance Unified School District
Phone Number 310-972-6500
Superintendent Dr. George Mannon
E-mail Address [email protected]
Web Site www.tusd.org
School Contact Information (School Year 2017–18)
School Name South Bay High School
Street 4025 W. 226th Street
City, State, Zip Torrance, CA 90505
Phone Number 310-373-4556
Principal Timothy M. Chandler
E-mail Address [email protected]
Web Site www.starsinc.com/SV_school.php
County-District-School (CDS) Code 19 65060 7094105
School Description and Mission Statement (School Year 2017–18)
South Bay High School, WASC accredited since 2007 and through 2020, creates a culturally competent and sensitive environment for students with severe psychiatric challenges which impede their ability to meet the educational challenges of middle and high school, so that students can develop skills and strengths academically and socially. Staff support, an engaging academic curriculum, use of data and standardized measures of achievement, provide South Bay students with the building blocks to achieve positive change, personal resiliency and lasting wellbeing to successfully rejoin their communities. South Bay High School is located within Star View Adolescent Center, a locked Level 14 residential facility, and along with South Bay High School, offers a multidisciplinary program combining psychiatric crisis intervention, high quality residential care, educational services, mental health treatment, and rehabilitation. Unique in California, our integrated program eliminates the need to admit children in acute psychiatric crisis to a hospital potentially leading to lost residential placement. Highly individualized, innovative, and flexible, our approach gives adolescents the opportunity to succeed. Staff actively encourages family and foster families’ participation in treatment. We also provide a range of services to help students as they transition to community living.
Student Enrollment by Grade Level (School Year 2016–17)
Grade Level Number of Students
Kindergarten 0
Grade 1 0
Grade 2 0
Grade 3 0
Grade 4 0

Page 4 of 17
Grade 5 0
Grade 6 2
Grade 7 4
Grade 8 8
Ungraded Elementary 0
Grade 9 14
Grade 10 17
Grade 11 21
Grade 12 25
Ungraded Secondary 0
Total Enrollment 91
Student Enrollment by Student Group (School Year 2016–17)
Student Group Percent of
Total Enrollment
Black or African American 25%
American Indian or Alaska Native 1%
Asian 4%
Filipino 0
Hispanic or Latino 43%
Native Hawaiian or Pacific Islander 0
White 18%
Two or More Races 9%
Socioeconomically Disadvantaged 100%
English Learners 2%
Students with Disabilities 100%
Foster Youth 100%
A. Conditions of Learning
State Priority: Basic
The SARC provides the following information relevant to the State priority: Basic (Priority 1):
• Degree to which teachers are appropriately assigned and fully credentialed in the subject area and for the pupils they are teaching;
• Pupils have access to standards-aligned instructional materials; and
• School facilities are maintained in good repair Teacher Credentials
Teachers School
2015–16 School
2016–17 School
2017–18 District 2017–18
With Full Credential 4 3 4 DPC

Page 5 of 17
Without Full Credential 1 2 2 2
Teaching Outside Subject Area of Competence (with full credential)
DPL DPL DPL DPL

Page 6 of 17
Teacher Misassignments and Vacant Teacher Positions
Indicator 2015–16 2016–17 2017–18
Misassignments of Teachers of English Learners
0 1 DPC
Total Teacher Misassignments* 0 1 DPC
Vacant Teacher Positions 1 1 DPC
Note: “Misassignments” refers to the number of positions filled by teachers who lack legal authorization to teach that grade level, subject area, student group, etc.
* Total Teacher Misassignments includes the number of Misassignments of Teachers of English Learners. Quality, Currency, Availability of Textbooks and Instructional Materials (School Year 2017–18) Year and month in which the data were collected: 12/2017 .
Subject
Textbooks and Instructional
Materials/year of Adoption
From Most Recent
Adoption?
Percent Students Lacking Own
Assigned Copy
Reading/Language Arts Holt 2012 Yes 0
Mathematics Glencoe 2014 Yes 0
Science Pearson 2104 Yes 0
History-Social Science Glencoe 2007 Yes 0
Foreign Language Pearson 2014 Yes 0
Health Holt 2004 Yes 0
Visual and Performing Arts Davis 2004 Yes 0
Science Laboratory Equipment (grades 9-12)
N/A N/A N/A
Note: Cells with N/A values do not require data. School Facility Conditions and Planned Improvements
The school has an on-site maintenance department and housekeeping services. The school is cleaned daily and routine inspections occur.

Page 7 of 17
School Facility Good Repair Status
Using the most recently collected FIT data (or equivalent), provide the following:
• Determination of repair status for systems listed
• Description of any needed maintenance to ensure good repair
• The year and month in which the data were collected
• The overall rating Year and month of the most recent FIT report: 12/2017
System Inspected
Repair Needed and Action Taken or Planned
Good Fair Poor
Systems: Gas Leaks, Mechanical/HVAC, Sewer
X Replaced 100% HVAC units
Interior: Interior Surfaces X Monthly Painting
Cleanliness: Overall Cleanliness, Pest/ Vermin Infestation
X Landscaping Renovation
Electrical: Electrical X
Restrooms/Fountains: Restrooms, Sinks/ Fountains
X
Safety: Fire Safety, Hazardous Materials
X
Structural: Structural Damage, Roofs
X
External: Playground/School Grounds, Windows/ Doors/Gates/Fences
X Newly installed fencing
Overall Facility Rate
Year and month of the most recent FIT report: 12/2017
Overall Rating Exemplary Good Fair Poor
x

Page 8 of 17
B. Pupil Outcomes
State Priority: Pupil Achievement
The SARC provides the following information relevant to the State priority: Pupil Achievement (Priority 4):
• Statewide assessments (i.e., California Assessment of Student Performance and Progress [CAASPP] System, which includes the Smarter Balanced Summative Assessments for students in the general education population and the California Alternate Assessments [CAAs] for English language arts/literacy [ELA] and mathematics given in grades three through eight and grade eleven. Only eligible students may participate in the administration of the CAAs. CAAs items are aligned with alternate achievement standards, which are linked with the Common Core State Standards [CCSS] for students with the most significant cognitive disabilities); and
• The percentage of students who have successfully completed courses that satisfy the requirements for entrance to the University of California and the California State University, or career technical education sequences or programs of study.
CAASPP Test Results in ELA and Mathematics for All Students Grades Three through Eight and Grade Eleven
Subject
Percentage of Students Meeting or Exceeding the State Standards
School District State
2015–16 2016–17 2015–16 2016–17 2015–16 2016–17
English Language Arts/Literacy (grades 3-8 and 11)
DPC DPC DPC DPC DPC DPC
Mathematics (grades 3-8 and 11)
DPC DPC DPC DPC DPC DPC
Note: Percentages are not calculated when the number of students tested is ten or less, either because the number of students in this category is too small for statistical accuracy or to protect student privacy.

Page 9 of 17
CAASPP Test Results in ELA by Student Group Grades Three through Eight and Grade Eleven (School Year 2016–17)
Student Group
Total
Enrollment Number Tested
Percent Tested
Percent Met or
Exceeded
All Students DPC DPC DPC DPC
Male DPC DPC DPC DPC
Female DPC DPC DPC DPC
Black or African American
DPC DPC DPC DPC
American Indian or Alaska Native
DPC DPC DPC DPC
Asian DPC DPC DPC DPC
Filipino DPC DPC DPC DPC
Hispanic or Latino DPC DPC DPC DPC
Native Hawaiian or Pacific Islander
DPC DPC DPC DPC
White DPC DPC DPC DPC
Two or More Races DPC DPC DPC DPC
Socioeconomically Disadvantaged
DPC DPC DPC DPC
English Learners DPC DPC DPC DPC
Students with Disabilities
DPC DPC DPC DPC
Students Receiving Migrant Education Services
DPC DPC DPC DPC
Foster Youth DPC DPC DPC DPC
Note: ELA test results include the Smarter Balanced Summative Assessment and the CAA. The “Percent Met or Exceeded” is calculated by taking the total number of students who met or exceeded the standard on the Smarter Balanced Summative Assessment plus the total number of students who met the standard (i.e., achieved Level 3–Alternate) on the CAAs divided by the total number of students who participated in both assessments. Note: Double dashes (--) appear in the table when the number of students is ten or less, either because the number of students in this category is too small for statistical accuracy or to protect student privacy. Note: The number of students tested includes all students who participated in the test whether they received a score or not; however, the number of students tested is not the number that was used to calculate the achievement level percentages. The achievement level percentages are calculated using only students who received scores.
Page 10 of 17
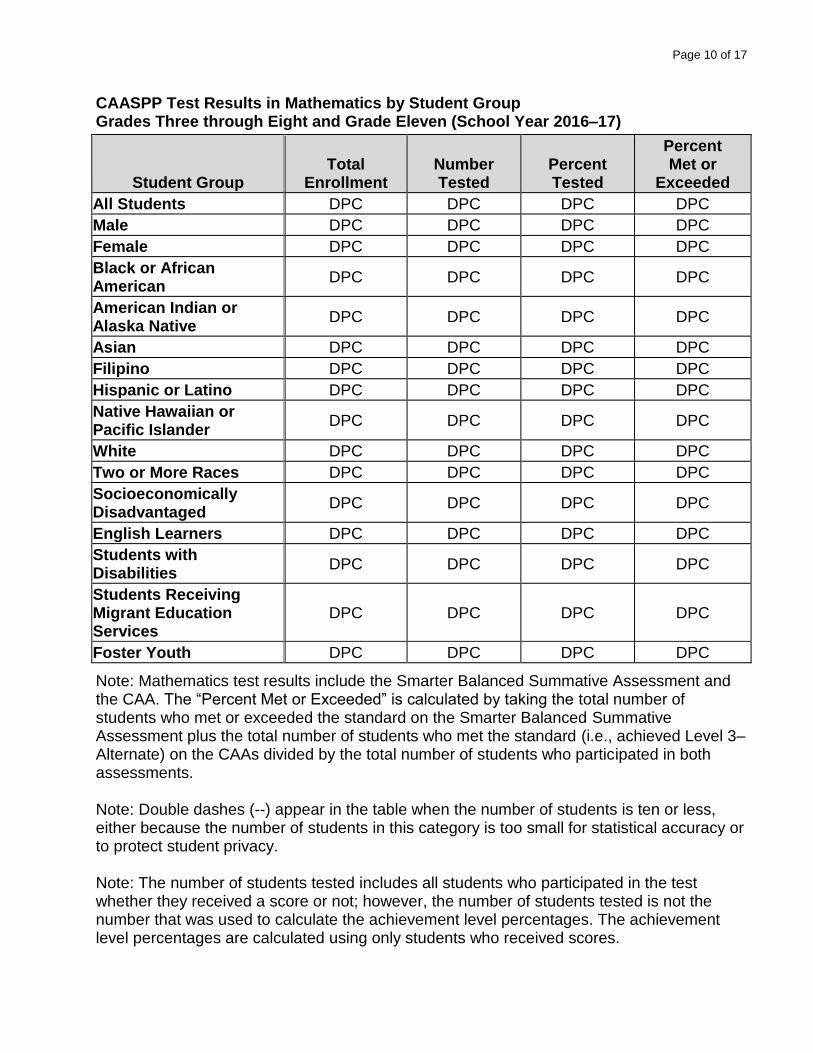
CAASPP Test Results in Mathematics by Student Group Grades Three through Eight and Grade Eleven (School Year 2016–17)
Student Group
Total
Enrollment Number Tested
Percent Tested
Percent Met or
Exceeded
All Students DPC DPC DPC DPC
Male DPC DPC DPC DPC
Female DPC DPC DPC DPC
Black or African American
DPC DPC DPC DPC
American Indian or Alaska Native
DPC DPC DPC DPC
Asian DPC DPC DPC DPC
Filipino DPC DPC DPC DPC
Hispanic or Latino DPC DPC DPC DPC
Native Hawaiian or Pacific Islander
DPC DPC DPC DPC
White DPC DPC DPC DPC
Two or More Races DPC DPC DPC DPC
Socioeconomically Disadvantaged
DPC DPC DPC DPC
English Learners DPC DPC DPC DPC
Students with Disabilities
DPC DPC DPC DPC
Students Receiving Migrant Education Services
DPC DPC DPC DPC
Foster Youth DPC DPC DPC DPC
Note: Mathematics test results include the Smarter Balanced Summative Assessment and the CAA. The “Percent Met or Exceeded” is calculated by taking the total number of students who met or exceeded the standard on the Smarter Balanced Summative Assessment plus the total number of students who met the standard (i.e., achieved Level 3–Alternate) on the CAAs divided by the total number of students who participated in both assessments. Note: Double dashes (--) appear in the table when the number of students is ten or less, either because the number of students in this category is too small for statistical accuracy or to protect student privacy. Note: The number of students tested includes all students who participated in the test whether they received a score or not; however, the number of students tested is not the number that was used to calculate the achievement level percentages. The achievement level percentages are calculated using only students who received scores.

Page 11 of 17
CAASPP Test Results in Science for All Students Grades Five, Eight, and Ten
Subject
Percentage of Students Scoring at Proficient or Advanced
School District State
2014–15 2015–16 2014–15 2015–16 2014–15 2015–16
Science (grades 5, 8,and 10)
DPC DPC DPC DPC DPC DPC
Note: Science test results include California Standards Tests (CSTs), California Modified Assessment (CMA), and California Alternate Performance Assessment (CAPA) in grades five, eight, and ten. Note: Scores are not shown when the number of students tested is ten or less, either because the number of students in this category is too small for statistical accuracy or to protect student privacy. Note: The 2016-17 data are not available. The California Department of Education is developing a new science assessment based on the Next Generation Science Standards for California Public Schools (CA NGSS). The new California Science Test (CAST) was piloted in spring 2017. The CST and CMA for Science will no longer be administered. Career Technical Education Programs (School Year 2016–17)
Students are prepared to enter the workforce through curriculum in basic skills and consumer math, the facility’s Independent Living Program (ILP) and vocational class offerings which allow students the opportunity to develop skills necessary for the workforce. In addition, select students may participate in on-site work experience opportunities with support provided from the mental health treatment services program.
Page 12 of 17
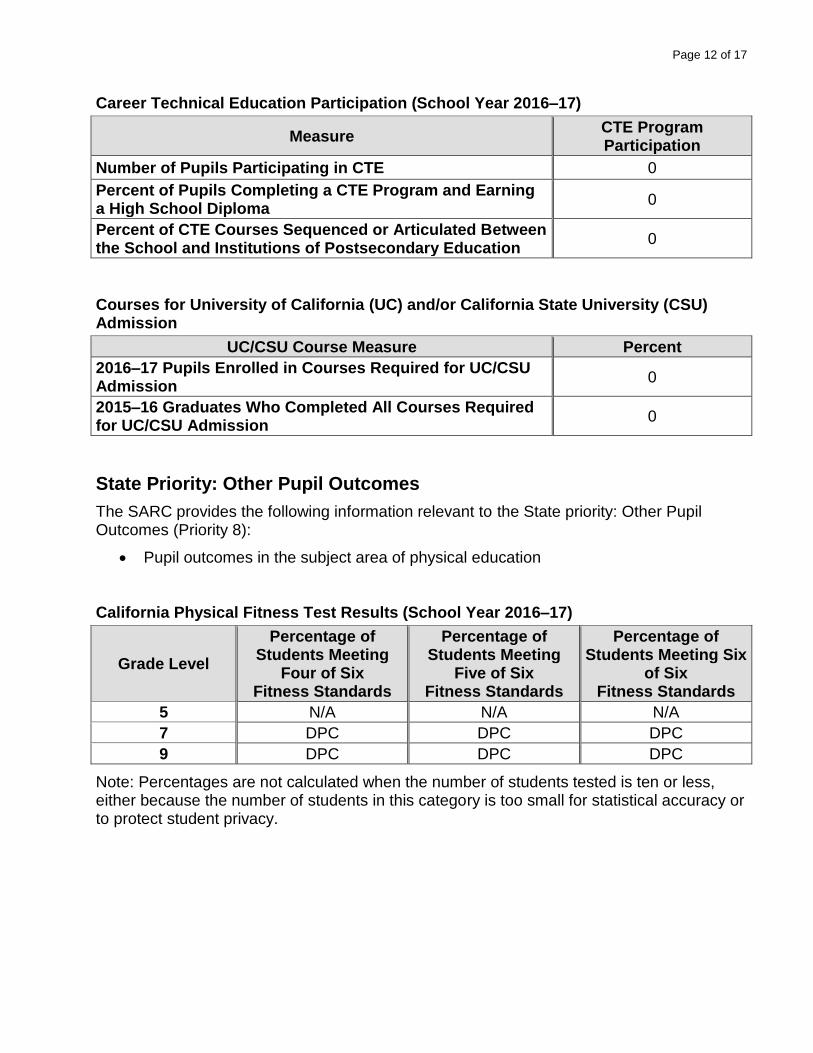
Career Technical Education Participation (School Year 2016–17)
Measure CTE Program Participation
Number of Pupils Participating in CTE 0
Percent of Pupils Completing a CTE Program and Earning a High School Diploma
0
Percent of CTE Courses Sequenced or Articulated Between the School and Institutions of Postsecondary Education
0
Courses for University of California (UC) and/or California State University (CSU) Admission
UC/CSU Course Measure Percent
2016–17 Pupils Enrolled in Courses Required for UC/CSU Admission
0
2015–16 Graduates Who Completed All Courses Required for UC/CSU Admission
0
State Priority: Other Pupil Outcomes
The SARC provides the following information relevant to the State priority: Other Pupil Outcomes (Priority 8):
• Pupil outcomes in the subject area of physical education
California Physical Fitness Test Results (School Year 2016–17)
Grade Level
Percentage of Students Meeting
Four of Six Fitness Standards
Percentage of Students Meeting
Five of Six Fitness Standards
Percentage of Students Meeting Six
of Six Fitness Standards
5 N/A N/A N/A
7 DPC DPC DPC
9 DPC DPC DPC
Note: Percentages are not calculated when the number of students tested is ten or less, either because the number of students in this category is too small for statistical accuracy or to protect student privacy.

Page 13 of 17
C. Engagement
State Priority: Parental Involvement
The SARC provides the following information relevant to the State priority: Parental Involvement (Priority 3):
• Efforts the school district makes to seek parent input in making decisions for the school district and each schoolsite
Opportunities for Parental Involvement (School Year 2017–18)
Parental and family involvement is important and welcomed, including IEP meetings held within 30 days of enrollment and annually thereafter, as well as open houses and programs facilitated by mental health and educational staff. School staff is available for parent conferences which are scheduled through the school secretary at 310-373-4556 ext. 132. In addition, Star View Adolescent Center employs a full time parent partner to ensure that parental access and input regarding a child’s educational experience can occur.
State Priority: Pupil Engagement
The SARC provides the following information relevant to the State priority: Pupil Engagement (Priority 5):
• High school dropout rates; and
• High school graduation rates Dropout Rate and Graduation Rate (Four-Year Cohort Rate)
Indicator
School District State
2013–14
2014–15
2015–16
2013–14
2014–15
2015–16
2013–14
2014–15
2015–16
Dropout Rate N/A N/A N/A DPC DPC DPC DPC DPC DPC
Graduation Rate
50% 33% 45% DPC DPC DPC DPC DPC DPC

Page 14 of 17
Completion of High School Graduation Requirements – Graduating Class of 2016 (One-Year Rate)
Student Group School District State
All Students 4 DPC DPC
Black or African American 1 DPC DPC
American Indian or Alaska Native 0 DPC DPC
Asian 0 DPC DPC
Filipino 0 DPC DPC
Hispanic or Latino 3 DPC DPC
Native Hawaiian or Pacific Islander DPC DPC
White 0 DPC DPC
Two or More Races 0 DPC DPC
Socioeconomically Disadvantaged 0 DPC DPC
English Learners 0 DPC DPC
Students with Disabilities 0 DPC DPC
Foster Youth 4 DPC DPC
State Priority: School Climate
The SARC provides the following information relevant to the State priority: School Climate (Priority 6):
• Pupil suspension rates;
• Pupil expulsion rates; and
• Other local measures on the sense of safety Suspensions and Expulsions
Rate
School District State
2014–15
2015–16
2016–17
2014–15
2015–16
2016–17
2014–15
2015–16
2016–17
Suspensions 0 0 0 DPC DPC DPC DPC DPC DPC
Expulsions 0 0 0 DPC DPC DPC DPC DPC DPC

Page 15 of 17
School Safety Plan (School Year 2017–18) South Bay High School students are supervised 100% of the day, and school staff monitor students during all school activities. A school safety plan covers the actions school personnel should take in emergency situations. All classrooms and school offices are connected by an overhead intercom. South Bay High School utilizes an efficient fire and disaster protections program that requires long-range planning. A program has been developed to protect the students, staff and visitors from emergency situations. The conduct and action of trained personnel during the first few minutes of an emergency may not only save lives and property, but will also ensure the security of our livelihood. In instituting this program, administration and supervisors will be responsible to ensure that all employees are completely informed and trained and that each employee knows his/her duties or responsibilities in the event of a fire, disaster, or other emergency. Fire Drills occur monthly and an earthquake preparedness drill occurs annually. Key elements of the school safety plan:
1. A safe and orderly environment conducive for learning. 2. Disaster procedures
3. Sexual Harassment policy
4. Child Abuse reporting procedures.

Page 16 of 17
D. Other SARC Information The information in this section is required to be in the SARC but is not included in the state priorities for LCFF. Federal Intervention Program (School Year 2017–18)
Indicator School District
Program Improvement Status DPC DPC
First Year of Program Improvement DPC DPC
Year in Program Improvement DPC DPC
Number of Schools Currently in Program Improvement
N/A DPC
Percent of Schools Currently in Program Improvement
N/A DPC
Note: Cells with NA values do not require data. Average Class Size and Class Size Distribution (Elementary)
Grade Level
Avg. Class Size
2014–15 Number of Classes*
Avg. Class Size
2015–16 Number of Classes*
Avg. Class Size
2016–17 Number of Classes*
1-20 21-32 33+ 1-20 21-32 33+ 1-20 21-32 33+
K DPC DPC DPC DPC DPC DPC DPC DPC DPC DPC DPC DPC
1 DPC DPC DPC DPC DPC DPC DPC DPC DPC DPC DPC DPC
2 DPC DPC DPC DPC DPC DPC DPC DPC DPC DPC DPC DPC
3 DPC DPC DPC DPC DPC DPC DPC DPC DPC DPC DPC DPC
4 DPC DPC DPC DPC DPC DPC DPC DPC DPC DPC DPC DPC
5 DPC DPC DPC DPC DPC DPC DPC DPC DPC DPC DPC DPC
6 DPC DPC DPC DPC DPC DPC DPC DPC DPC DPC DPC DPC
Other DPC DPC DPC DPC DPC DPC DPC DPC DPC DPC DPC DPC
* Number of classes indicates how many classes fall into each size category (a range of total students per class).

Page 17 of 17
Average Class Size and Class Size Distribution (Secondary)
Subject Avg. Class Size
2014–15 Number of Classes*
Avg. Class Size
2015–16 Number of Classes*
Avg. Class Size
2016–17 Number of Classes*
1-22 23-32 33+ 1-22 23-32 33+ 1-22 23-32 33+
English 12 5 0 0 12 5 0 0 12 5 0 0
Mathematics
12 5 0 0 12 5 0 0 12 5 0 0
Science 12 5 0 0 12 5 0 0 12 5 0 0
Social Science
12 5 0 0 12 5 0 0 12 5 0 0
* Number of classes indicates how many classrooms fall into each size category (a range of total students per classroom). At the secondary school level, this information is reported by subject area rather than grade level.
Academic Counselors and Other Support Staff (School Year 2016–17)
Title Number of FTE*
Assigned to School
Average Number of Students per
Academic Counselor
Academic Counselor 1 60
Counselor (Social/Behavioral or Career Development)
0 N/A
Library Media Teacher (Librarian) 0 N/A
Library Media Services Staff (Paraprofessional)
0 N/A
Psychologist 1 60
Social Worker 0 N/A
Nurse 0 N/A
Speech/Language/Hearing Specialist .2FTE 10
Resource Specialist (non-teaching) 0 N/A
Other 6 12
Note: Cells with N/A values do not require data. * One Full Time Equivalent (FTE) equals one staff member working full time; one FTE could also represent two staff members who each work 50 percent of full time.

Page 18 of 17
Expenditures Per Pupil and School Site Teacher Salaries (Fiscal Year 2015–16)
Level Total
Expenditures Per Pupil
Expenditures Per Pupil
(Restricted)
Expenditures Per Pupil
(Unrestricted)
Average Teacher Salary
School Site
Please contact Natalie Spiteri at
[email protected] for further information
Please contact Natalie Spiteri at
[email protected] for further information
Please contact Natalie Spiteri at
[email protected] for further information
Please contact Natalie Spiteri at
[email protected] for further information
District N/A N/A DPL DPC
Percent Difference – School Site and District
N/A N/A DPL DPL
State N/A N/A DPC DPC
Percent Difference – School Site and State
N/A N/A DPL DPL
Note: Cells with N/A values do not require data. Types of Services Funded (Fiscal Year 2016–17)
South Bay High School services are funded locally through Torrance USD Special Education funding for all students in foster care, and externally through home LEAs for directly placed students. South Bay High School provides all services per students’ IEPs, including specialized academic instruction, psychological testing, counseling, and speech and language services.
Teacher and Administrative Salaries (Fiscal Year 2015–16)
Category District Amount
State Average For Districts
In Same Category
Beginning Teacher Salary DPC DPC
Mid-Range Teacher Salary DPC DPC
Highest Teacher Salary DPC DPC
Average Principal Salary (Elementary) DPC DPC
Average Principal Salary (Middle) DPC DPC
Average Principal Salary (High) DPC DPC
Superintendent Salary DPC DPC
Percent of Budget for Teacher Salaries DPC DPC
Percent of Budget for Administrative Salaries DPC DPC
For detailed information on salaries, see the CDE Certificated Salaries & Benefits Web page at http://www.cde.ca.gov/ds/fd/cs/.

Page 19 of 17
Advanced Placement (AP) Courses (School Year 2016–17)
Subject Number of
AP Courses Offered* Percent of Students
In AP Courses
Computer Science DPC N/A
English DPC N/A
Fine and Performing Arts DPC N/A
Foreign Language DPC N/A
Mathematics DPC N/A
Science DPC N/A
Social Science DPC N/A
All Courses DPC DPC
Note: Cells with N/A values do not require data. * Where there are student course enrollments of at least one student. Professional Development
The primary focus for development training is on behavioral support for students with severe emotional disturbance to facilitate academic learning. In addition, staff is encouraged to attend workshops and conferences that support strategies for active academic engagement for students with learning challenges. All students enrolled in South Bay High School have IEPs and Behavioral Intervention Plans, and staff professional develop target methodologies to support student learning in the most restrictive environment in the State of California, while ensuring continual safety of the student population.