for producing (methane) from archive/files/merge/vol-14... · 44 - an economic comparison of...
TRANSCRIPT
- 4 4 -
AN ECONOMIC COMPARISON O F PROCESSES FOR PRODUCING PIPELINE GAS (METHANE) FROM COAL
J. P . Henry, Jr. and €3. M. Louks Stanford Research I n s t i t u t e
Menlo Park, Ca l i fo rn ia 9 4 0 2 5
An impending shortage of n a t u r a l gas i n t h e United S t a t e s has led t o in t ens ive bench s c a l e research i n e f f o r t s t o develop processes f o r preparing p i p e l i n e q u a l i t y gas (methane) from coal a t competitive c o s t s . Funding of the research has been provided by the Office o f Coal Research, t he American Gas Association, and p r i v a t e organizat ions. Processes under development d i f f e r i n t h e method by which steam-carbon r eac t ion hea t i s added. The following l i s t i d e n t i f i e s the most notable processes and t h e method each process uses for steam-carbon reduction h e a t addi t ion.
Process Hot carbonate
Super high pressure C . S . G .
Continuous Steam-Iron
Hygas
Developer M. W. Kellogg Co.
Bituminous Coal Research Consolidation Coal
F u e l Gas Associates
I n s t i t u t e of Gas Technology
Heat Addition By Sensible heat of molten s a l t
Combustion of pure oxygen I n - s i t u exothermic
chemical r eac t ion
chemical r eac t ion E l e c t r i c power and
i n - s i t u exothermic I chemical r eac t ion 1
I n - s i t u exothermic I
The processes under development are reviewed and t h e i r r e l a t i v e economics explained by a p re sen ta t ion of t h e thermochemistry of r eac t ions u t i l i z e d i n preparing methane from coal .

- 45 - HYDROGEN: A KEY TO THE ECONOMICS
OF PIPELINE GAS FROM COAL
C. L. Tsa ros
I
Institute of G a s Technology Chicago, Illinois 60616
INTRODUCTION
The objective in manufacturing supplemental pipeline gas is to produce high- heating-value gas that is completely interchangeable with natural g a s - essentially methane. monoxide o r iner t diluents l ike carbon dioxide o r nitrogen cannot be tolerated.
BASIC PROCESS CONSIDERATIONS
Large amounts of low-heating-value constituents like hydrogen or carbon
The basic problem in making methane f r o m coal is to raise the H2/C ratio. A typical bituminous coal may contain 75% carbon and 5% hydrogen, a Hz/C mole rat io of 0.4:l; the same ra t io fo r methane is 2:l. To achieve this ra t io i t is neces- s a ry to either add hydrogen o r r e j ec t carbon. The mos t efficient way is to add hydrogen. The hydrogen in the coal can supply about 25-30% of the required hydrogen, but the bulk mus t come b y the decomposition of water, the only economi- ca l source of the huge quantities needed fo r supplemental gas.
There are two basic methods for adding hydrogen to coal: In the f i rs t , or indirect, method, coal reac ts (by Reaction 1) with steam to f o r m synthesis g a s -mainly hy- drogen and carbon monoxide.
C + H2O + CO + Hz (1)
This reaction is highly endothermic and r equ i r e s combustion of carbon with oxygen, o r some other heat source.
i I The CO and H2 then r eac t catalytically to fo rm methane:
CO + 3Hz + CH4 + HzO (2 1 I P r i o r to methanation, part of the CO is made to react with m o r e water to in-
c r ease the H2/C0 ratio.
CO t HzO -+ H2 t C02 ( 3 ) I
In the second, or direct , method, methane is formed direct ly by the destructive 1 hydrogenation of coal by the reaction:
C + 2H2 CH4 (4)
I The indirect method is inherently l e s s efficient because in the procesq water is decomposed in Reactions 1 and 3. A portion of the hydrogen product is then con- ver ted back to water by Reaction 2. Reaction 2 i s m o r e exothermic than Reaction 4. Since Reaction 2 is car r ied out at a much lower tempera ture than Reaction 1, this heat i s not available. Decomposition of an increased amount of water also consumes m o r e energy in the indirect than in the d i rec t method.
The major effort a t IGT has been in hydrogasification, now called the HYGAS Process , because of the originally high oxygen consumption and cos ts of the syn- thesis-gas methanation route.

- 4 6 -
PROCESS ECONOMICS
P r o c e s s economic studies have been ca r r i ed out in conjunction with the develop- m e n t program a t IGT for pipeline gas f rom coal. A number of different process designs have been prepared in which the p r i ce of gas was reduced f rom the level of $1.00 to $0.50/million Btu. The mos t important effects on the cost of product gas have resul ted f r o m the way hydrogen is generated or utilized in the hydrogasifier; hydrogen has been the key factor in reducing the pr ice of gas.
The original studies cover a per iod of about 10 yea r s and have somewhat different p rocess and cost bases. In this paper the resu l t s of seven different pipeline gas plant economic evaluations are compared. An at tempt has been made to adjust these to a common and more cu r ren t bas i s for capital and operating costs. Coal costs a r e assumed to be uniform a t 16. lk/mil l ion Btu. product-gas heating value.
1. Synthesis-gas methanation
2. Hydrogasification of coal by a hydrogen/char ra t io of 300% of stoichiometric
3. Pa r t i a l hydrogasification with 50% of the stoichiometric hydrogen ra te
4. Hydrogasification with steam-hydrogen mixtures
5. Hydrogen by the s team-i ron p rocess
6. Hydrogen f rom synthesis gas generated by electrothermal gasification
7. Hydrogasification with synthesis gas
The plant size i s 250 billion Btu of The seven studies a r e -
The data presented in th i s paper have all been derived f rom the earlier studies to which the cited re ferences refer. Because of the adjustments in capacity and cos t index made t o get a be t te r bas i s for comparison, the costs differ somewhat f r o m the originals. Sulfur by-product c red i t has not been included because of differ- ent sulfur contents for some of the coals used.
Several simple flow d iag rams have been prepared to i l lustrate the different p rocess schemes. Table 1 gives pertinent data; F igures 1 and 2 show the cost of g a s in relation to different hydrogen schemes and net production ra tes . comparison,gas p r i ces shown a r e based on the same utility-type accounting pro- cedure. The basic assumptions are 1) 20-year straight-line depreciation, 2) 7% r e tu rn on rate base (end-of-year undepreciated book value plus working capital), 3 ) 5 % interest on debt, 4) 65:35 debdequity ratio, and 5 ) 48% Fede ra l income tax. This r e su l t s in a n average annual re turn on outstanding equity for the cases shown ranging f rom 9.3 to 9.5%.
To permit
Return on equity is calculated as follows: Debt re t i rement is 5% of the initial debt. Annual depreciation exceeds annual debt re t i rement by a constant amount, which is called the surplus . This surp lus is used to reduce the outstanding equity, which r e su l t s i n a l inear ly decreasing outstanding equity. To calculate average percent re turn on equity, the 20-year average ne t income is divided by the 20-year average outstanding equity.
In te res t ra tes are present ly high; even with some reduction in the future, they wi l l probably be higher than 5%. interest , the re turn on r a t e base will also have to be raised. F o r a second set of gas pr ices , we have r a i sed financial fac tors to a 7.5% in te res t r a t e and a 10.1- 10.2% average annual r e tu rn on equity. are as before. This r equ i r e s a rate of r e tu rn of 9 % on the rate base, f rom which both debt and equity r e t u r n are paid.
To maintain at t ract ive re turn on equity a t higher
The income tax rate and debtlequity ratio


- 4 % -
Depending on the investment level, the effect of the higher financial factors is to r a i se gas pr ice f r o m 1.9b to 4.5k/million Btu for the investment range covered.
Indirect Methanation - Synthesis-Gas Methanation (Case 1 ) I The f i r s t process , methanation of synthesis gas generated by Texaco steam-
oxygen suspension gasification of coal,' is shown in Figure 3. Gas made this way is expensive because of the high oxygen requirement and the low thermal efficiency. F o r a 250 billion Btu/day plant, 12,500 tonslday of oxygen a r e needed for genera- tion of 985 million SCF/day of hydrogen equivalent (CO t H2). Investment is $240 million; product gas cos ts approximately SOb/million Btu, depending on financial factors .
Direct Hydrogenation
The r e s t of the studies a r e based on the d i rec t hydrogenation of coal char to methane discussed above. of major s teps in hydrogen usage that have occurred in the development of the HYGAS Process .
They represent a h i s tor ica l and process economic study
Use of Excess Hydrogen (Case 2)
The f i r s t economic evaluation for hydrogasification was based on pilot plant data in which a large excess of hydrogen - 300% of the stoichiometric hydrogenlchar ra t io - i s fed to the hydrogasifier' in a fluidized-bed reac tor (Figure 4). Nearly complete gasification is achieved. A separate coal s t r eam flows to the gasifier where synthesis gas for hydrogen production is generated. step, a low-temperature carbonization process , i s m o r e severe than the simpler air oxidation used in IGT's l a t e r work. More hydrogen and other volatile mat ter is los t in the low-temperature carbonization, requir ing more net hydrogen input.
The coal pretreatment
I I With excess hydrogen, the hydrogasifier effluent contains CH2/H2 in a 0.32: 1
ratio, which i s upgraded to a rat io of 8.7:l by low-temperature separation. processing step contributes about 15b/million Btu to the pr ice of gas. and investment are slightly higher than for synthesis-gas methanation, even though the overal l efficiency is higher, because of the higher investment. Even though the net hydrogen rate is l e s s than half that f o r synthesis-gas methanation, thus cutting oxygen consumption in half, the l a rge excess of hydrogen used in the hydrogasifier r equ i r e s a compensating expense in cryogenic separation and prepurification.
This G a s pr ice
P a r t i a l Hydrogasification With Less Than Stoichiometric Hydrogen (Case 3)
Fu r the r development of hydrogasification showed that i t is advantageous to hydro- gasify only the m o r e react ive fract ions of the coal and to use the less reactive residue1 char for hydrogen manufacture. By the use of a moving bed, a solids down- flow-gas upflow reactor , and a hydrogenlchar ra t io only 50% of the stoichiometric, a high-Btu gas is produced in the h y d r ~ g a s i f i e r . ~ In Case 3 the hydrogasifier terr- pe ra tu re ranged f r o m 1350°F a t the top of the bed to 1600°F a t the bottom. The same cha r pretreatment method w a s used. A lower temperature and a reduced h y d r o g e d c h a r feed ra t io r e su l t i n a high-Btu gas, eliminating the need for low- temperature separation. Partial conversion of the char reduces the ne t hydrogen input because more coal m u s t p a s s through the reactor , yielding m o r e volatile mat ter . Compared to C a s e 2 the investment is reduced 15% and the efficiency is ra i sed to 60%. Savings in equipment and higher efficiency combine to lower gas pr ice by 136- 14Clmillion Btu.
F igure 5 gives a genera l flow sheet for pipeline gas by par t ia l hydrogasification with spent hydrogasifier c h a r as the basis f o r hydrogen manufacture. Steam is needed in all cases, but a l ternat ive methods employ air, oxygen, o r electricity as a basic input. I

- 49 - Figure 6 gives the basic scheme for hydrogen generation by the Texaco-type
1 steam oxygen suspension gasification of spent char. (Cases 1-4) of the seven p rocess economic on the system used in Reference 5. A s discussed below, e lectr ic i ty can a l so be u s e d a s a heat source. To avoid a repetitive flow sheet, both oxygen and electricity a r e shown as alternatives; however, the use of e lectr ic i ty is not a p a r t of the Texa- co Process .
This method i s used in four studies. In a l l cases cos ts are based
Hydrogasification With Steam-Hydrogen Mixture (F igures 5 and 6)
An important process and economic development was the successful use of steam in the hydrogasifier. In the current concept, s team and hydrogen in approximately equal amounts a r e fed to a high-temperature fluidized bed where the above reactions (1. 3, and 4) occur. Since the steam-carbon react ion (1) is strongly endothermic and the hydrogen- carbon react ion (4) strongly exothermic, heat effects tend to balance, and there is not the problem of heat removal that ex is t s when only Reaction 4 occurs. Steam ac t s a s a moderator since, a s the tempera ture r i s e s because of Reaction 4, the ra te of Reaction 1 increases . Steam decomposition generates hydrogen in situ, thus reducing the s ize of the hydrogen section and lowering the pr ice of gas. The hydrogen feedlchar ratio i s reduced to about 33% of the stoichiometric value. When s team is used, the hydrogasifier effluent contains m o r e carbon monoxide and re- qui res m o r e subsequent methanation than when hydrogen alone is used. th i rds of the total methane is made in the hydrogasifier compared to over 90% for Cases 2 and 3. However, the cos t of increased methanation is m o r e than compen- sated for by the other cost reductions resulting f rom the use of steam.
I
About two-
A s shown in Table 1, four of the p rocesses utilize steam with the hydrogen-rich g-as. In all these cases the hydrogasifier consis ts of two stages: a low-temperature f i r s t stage of 1300" - 1500" F t o obtain a high methane yield f r o m the volatile mat te r i n the coal and a high-temperature fluidized-bed second stage of 1700"-1800"F to produce methane and effect the s team-coal reaction. A l l four of the p rocess designs a r e based on the s a m e coal rate, coal preparation, and hydrogasification s teps de- rived f r o m the design in Reference 6. Major differences a r e in the hydrogen section.
The economic effect of introducing s team into the hydrogasifier is shown by C a s e s 3 and 4: Investment is lowered b y 25%. In both cases hydrogen is derived f rom synthesis g a s made by Texaco-type steam-oxygen gasification of spent char. When pa r t of the hydrogen is made in the hydrogasifier, the p r i ce of gas is shown to be reduced by 10d- l l # /mi l l i on Btu; net hydrogen is reduced by 30%. Case 4 is derived f rom Reference 5 with modifications, as discussed above, based on Reference 6.
i i I
The 10# differential is confirmed by other studies.
Hydrogen by the Steam-Iron P r o c e s s (Case 5) (Fuel G a s Associates)
The expense of using oxygen to make hydrogen has stimulated in te res t in alter- 1 native methods. potential for significant cost reduction. It involved the t ransfer of the oxygen in water to a s t r eam of i ron plus reduced i ron oxide that flows between oxidizer and reductor. A s t r eam of hydrogen and unreacted s team flows f rom the oxidizer direct ly to the hydrogasifier. Spent hydrogasifier char r eac t s with s team and air to make a producer gas that regenerates the i ron oxide. Since this gas is not p a r t of the pro- duct, a i r can replace oxygen. Power for air compression and other plant require- ments is provided by an expansion turbine powered by spent reductor gas. Savings in investment contribute most to the 106 reduction in gas p r i ce f r o m 656 to 5561 million Btu. power generation a r e greatly reduced. A s pa r t of the pipeline gas f rom coal plant, hydrogen by the s team-iron process cos ts about .ZOd/lOOO C F compared to 291 f o r hydrogen by steam-oxygen gasification.
The continuous s team-iron process , shown in F igure 7, offers
1
, The hydrogen r a t e i s the same, but the cos ts of hydrogen and onsite
- 50 -
Hydrogen by the Elec t ro thermal P rocess (Case 6)
Another alternative to steam-oxygen gasification i s the electrothermal process (Figure 6). Here res i s tance heating of a fluidized bed of char operating at 1800"- 1900°F supplies the heat fo r the s team-carbon reaction, and the s team serves both as a reactant and a fluidizing medium. eliminated, and the reducing g a s is not diluted by CO, f rom combustion. Power mus t be relatively low cost. of 3 mills/kWhr. a magnetohydrodynamic or a conventional s team turbine system. Such a system would be adjacent to and integrated with the pipeline g a s plant and could benefit f rom the use of hot char t r ans fe r r ed directly as fuel to a fluidized boiler. Hydrogen by this method costs m o r e than by the s team-iron process . is ve ry sensit ive to the cos t of power. A change of 1 mil l /kWhr will change the gas pr ice by 3.3b/million Btu.
Compression of high-purity oxygen is
Our economics a r e based on a purchased power cos t There is enough spent char to supply needed electricity by ei ther
The pr ice of pipeline g a s
Hydrogasification With Synthesis Gas4 (Case 7 )
Feeding raw, hot synthesis gas instead of hydrogen can substantially reduce the p r i ce of pipeline gas. We have shown the economic effect a s applied to the electro- thermal process (F igure 8). The synthesis gas i s essentially CO and H,. As H2 is consumed in the hydrogasifier, CO reacts with the s team present to f rom more H,. Because of the lower hydrogen par t ia l pressure, a l a rge r reac tor column i s needed, but i t s cost is largely balanced by the elimination of the hydrogen preheat system necessary when cold hydrogen is used. of the CO shift and purification sections needed to make high-purity hydrogen and in savings in offsite equipment.
Major cos t reductions a r e i n the elimination
Gas pr ice is reduced b y 5.5C-bClmillion Btu.
SUMMARY
Important process changes have occurred in the development of the H Y G A S P ro - The investment for a 250 billion Btu/ cess , resulting in much improved economics.
day plant has been reduced f r o m over $250 million to $120 million. Plan€ efficiency has r i s en f rom 50% to 70%. When computed on a comparable basis, these changes have resul ted in reductions in the pr ice of gas f r o m approximately 90C to 55k/ million Btu. These p r o c e s s changes a r e summarized as follows:
P r o c e s s Change P r i c e Reduction,
$/lo6 Btu
P a r t i a l Hydrogasification With 50% vs. 300% of Stoichiometric 14 Hz/Char Ratio (Case 3 )
Use of Steam in the Hydrogasifier (Case 4)
Use of Steam-Iron P r o c e s s for Hz (Case 5)
10-11
10-11
9- 10 Hydrogasification With Electrothermally Generated Synthesis Gas
Hydrogasification with electrothermally generated synthesis gas and 0.36lkWhr power (Case 6) reduces pipeline-gas pr ice by 96-l0d/mil l ion Btu f rom Case 4, with synthesis gas instead of hydrogen accounting for about 5.56-66. Gas pr ice i s then about the s a m e as with hydrogen by the s team-iron process .
The basic IGT scheme as present ly conceived cons is t s of th ree s tages of coal conversion a s shown in F igure 8: genation stage, either f r ee fal l o r upflow, for conversion of the volatile ma t t e r ; 2 ) a fluidized-bed second hydrogenation stage where steam and synthesis gas r eac t a t 1700"- 1850°F to produce methane, CO, and H,; and 3) a third- stage fluidized-bed
1) a low-temperature (1300"-1500"F) f i r s t hydro-

- 51 - I gasifier a t 1800"-1900"F where spent char is converted to synthesis gas containing
methane by electricity and lo r oxygen.
ACKNOWLEDGMENT
The work reported here in is under the cosponsorship of the Amer ican Gas Association and the U.S. Department of the Interior, Office of Coal Research. Pe rmis s ion of the sponsors to publish this paper is greatly appreciated.
REFERENCES CITED
1. Heffner, W. H. e t al., "Pipeline Gas F r o m Bituminous Coal via Suspension Gasi- fication and Catalytic Synthesis of Methane, I' Study CE-60-207. W. Kellogg Co., 1960 (Unpublished r epor t to Amer ican G a s Association).
2. Heffner, W. H. et al., "Pipeline Gas F r o m Bituminous Coal v ia Hydrogasification, It
Study C E - 6 1 - 2 1 r N e w York: M. W. Kellogg Co., 1961 (Unpublished repor t to American Gas Association).
3. Khan, A. R.. Feldkirchner, H. L. and Joyce, T. J., "Techno-Economic Evalua- tions of Hydrogasification of Coal and Char." Chicago: Institute of Gas Tech- nology, 1964 (Unpublished repor t to American Gas Association).
New York: M.
4. Knabel, S. J. and Tsaros, C. L., "Process Design and Cost Es t imate for a 258 Billion Btu/Day Pipeline Gas P lan t - Hydrogasification Using Synthesis Gas Generated by Electrothermal Gasification of Spent Char," R&D Re t. No. 22, Interim Rept. -- No. 3. Washington, D.C.: Office of Coal R e s d 7 7 -
5. Tsaros, G. L., Knabel, S. J. and Sheridan, L. A., "F'rocess Design and Cost Es t imate for Production of 265 Million SCF/Day of Pipeline Gas b y the Hydro- gasification of Bituminous Coal," R&D Rept. No. 22, G t e r i m Rept.-No. -- 1.. Washington, D.C.: Office of Coal Research, m 5 r
6. Tsaros, C. L., Knabel, S. J. and Sheridan, L. A., "Process Design and Cost Es t imate for Production of 266 Million SCF/Day of Pipeline Gas by the Hydro- gasification of Bituminous Coal - Hydrogen by the Steam-Iron P rocess , I 1 R&D Rept. No. 22, Interim Rept. _.- No. 2. Washington, D.C.: Office of Coal R e s e x , m--

- 5 2 -
-
v)
c3 a
90
80
70
60
50
LL 0
STEAM-02 GASIFICATION SYNTHESIS-GAS METHANATION
- 300% OF STOICH HZ TO - HYDROGASIFICATION , LOW-TEMPERATURE SEPARATION TO UP- GRADE PRODUCT GAS
0
H 2 + C 0 BY STEAM-O2 SUSPENSION GASIFICATION
- -
ALL HYDROGASIFICATION FOLLOWED - - HYDROGASIFIER BY CLEANUP METHANATION 3 3 % OF STOICH
WITH HIGH-SULFUR C W L .GAS PRICES FOR STEAM-ELECTROTHERMAL HYDROGASlFlCATlQN WILL BE ABOUT - GASIFICATION 2 ( I IO6 BCu LOWER FOR $ 201 TON
SULFUR
-
P H2 BY STEAM- IRON PROCESS
I I I I I 1 I I
W 2 a n W c3
W
a a 2 a a w >
Figure 1. E F F E C T O F Hz P L U S CO GENERATION RATE AND METHOD ON PRICE O F PIPELINE GAS FROM COAL ESTIMATED ON A COMPARABLE BASIS (Initial Debt - 65%. Interest at 5%, Return on Rate Base - 7%, F e d e r a l Income Tax - 48%,
Coal Cost- 16.1C/106 Btu)

- 53 -
5c
IO0
H 2 BY STEAM - IRON PROCESS
I I 1 I I I I I
@ 90 0 . *
In (3
LL
a
0 80 W
[L u a W l3 2 70
P W
[L
W > a
* 6 C ::
300% OF STOICH H p TO HYDROGASIFICATION . LOW-TEMPERATURE SEPARATION TO UP-
." GRADE PRODUCT GAS
STEAM - 0 2 GASIFICATION SYNTHESIS-GAS METHANATION
!
H 2 + C 0 BY STEAM-OZ SUSPENSION GASIFICATION 50 % OF STOICH H p -
ALL HYDROGASIFICATION FOLLOWED BY CLEANUP METHANATION -
A FLUIDIZED-BED WITH HIGH-SULFUR COAL.GAS PRICES FOR STEAM-ELECTROTHERMAL HYDROGASIFICATION WILL BE ABOUT - GASIFICATION 2 */IO6 Bfu LOWER. FOR S 2 0 / T O N
SULFUR - sy~\~EsEsIs A I 0.3 d/kWhr
P
Figure 2. E F F E C T O F Hz PLUS CO GENERATION RATE AND METHOD ON PRICE O F PIPELINE GAS FROM COAL ON A COMPARABLE BASIS (Initial Debt - 65$,
Interest a t 7.5%, Return on Rate B a s e - 9%, F e d e r a l Income Tax - 48%, Coal Cost - 16.1C/106 Btu)

- 54 -
1
OXYGEN
COMPRESSION
I PIPELINE GAS, 916 B ltU
~ HYDROGEN . L
ISCF ,
COMPRESSION ASH
c HYDROGEN RECYCI E i 1 960 X IO6 SCFIDAY PIPELINE GAS
9 3 4 BtuISCF, 1000 PSlQ
NET HYDROGEN 470 X 10' SCF/DAY
F i g u r e 3. PIPELINE GAS FROM COAL B Y METHANATION O F SYNTHESIS GAS
SECTION 450 QSlp -
Figure 4; PIPELINE GAS FROM COAL B Y HYDROGASIFICATION WITH EXCESS HYDROGEN (300% of Stoichiometric)

- 55 -
METHANATION
t 550'- WOOF PURIFICATION
I
HYDRO-
13000- 185OoF -, GAS I FlCATlON PRETREAT- SPENT CHAR GROUND
COAL MENT 1000 - 1500 PI lQ 75OoF. 2 PIIQ A PIPELINE GAS
I 930-950 B~uISCF. ?
I I 1 1000 PSlQ
A-70633
Figure 5. PIPELINE GAS FROM COAL BY HYDROGASIFICATION WITH LESS THAN STOICHIOMETRIC HYDROGEN; HYDRQGEN MANUFACTURE BASED ON SPENT
CHAR WITH AIR, OXYGEN, AND ELECTRICITY AS ALTERNATIVES I
HYDROGASIF IER CHAR
1 I I I I
i
I I
I \
I t
Figure 6. HYDROGEN GENERATION BY STEAM-OXYGEN OR STEAM-ELECTROTHERMAL GASIFICATION O F HYDROGASIFIER CHAR

- 5 6 - SPENT PRODUCER GAS
&--I HYDROGASIFIER CHAR
1100 psig. 9M.F
H GENERATOR 1200 P l l Q
LOW-Btu FUEL W BY-PROWCT STEAM
COMPRESSOR EXPANSION TURBINE
A-7OeW
Figure 7. HYDROGEN GENERATION BY THE STEAM-IRON PROCESS BASED O N HYDROGASIFIER CHAR
COz. HZS.ORCANIC S
PURIFICATION
PRETREATED COAL 4 1300.- I 1500°F
p : E I HYDRO-
GASIFICATION
RAW SYNTHESIS GAS
GASIFIER lBOO.-RO(rF -- -----
I I I I - 1
POWER ASn GENERATION
1 PIPELINE GAS 937 BtulSCF 1000 Drlq
A770638
Figure 8. HYDROGASIFICATION WITH SYNTHESIS GAS

- 57 -
OPTINlZATION OF FIXED BED GIAl'EI<-GAS SHIFT C0NVI:I;TEl: 1'01: PRODUCTIOX OF PIPE1,INE GAS
C. Y . Wen and 11. N. K i m
Department of Chemical Engineering West Virg in ia Univers i ty Morgantown, Vest V i r g i n i a
. 1. INTRODUC'I'ION
With t h e growing shor tage of n a t u r a l gas , development of process for t h e product ion of high BTU gas from c o a l becomes more a t t r a c t i v e , and is now under ex tens ive i n v e s t i g a t i o n s , most of which are sponsored by t h e O f f i c e of Coal Research, Department of t h e I n t e r i o r . for product ion of t h e p i p e l i n e gas c o n s i s t s of s e v e r a l u n i t processes such a s g a s i f i c a t i o n , water-gas s h i f t conversion, gas p u r i f i c a t i o n and methanation. I n t h e present s t u c y , t h e water-gas s h i f t conversion process of a l a r g e coinmercial s c a l e i s opt in ized i n connection wi th t h e primary g a s i f i c a t i o n and methanation processes . The o b j e c t i v e i s t o search t h e most economical scheme f o r s h i f t conversion by which t h e e f f l u e n t g a s €rom t h e g a s i f i e r can be processed t o achieve a proper hydrogen- to- carbon monoxide r a t i o f o r methanation a t a la ter s t a g e . Condi t ions and compositions of r a y gas vary depcndir.g on t h e d i f f e r e n t primary g a s i f f - c a t i o n processes from which i t emerges. ob ta inable , tvo cases a r e s e l e c t e d a s shown i n Table 1. w i l l meet t h e fol lorr ing requi renents imposed on methanation: (1) product ion r a t e of p i p e l i n e ges i s 250 :< lo9 BTU/day; gas is more than 900 ETU/SCF.
The o v e r a l l systeni
I Among t h e v a r i o u s gas compositicns These s e l e c t i o n s
( 2 ) hea t ing v a l u e of p i p ? l i n e i I
2. REACTIOX K I N E T I C S I
A . Rate Equat ions
The s t o i c h j o n w t r i c r e l a t i o n of water-gas s h i f t r e a c t i o n i s expressed by
(1) 2 CO + H 0 = C 0 2 + B
2
In a d d i t i o n t o t h e above r e a c t i o n , theraodynamically i t i s p o s s i b l e t h a t s c v e r a l o ther s i d e r e a c t i o n s may t a k e p lace among t h e components of CO, H20, 112, C 0 2 , CM4 and o ther hydrocarbons. These r e a c t i o n s involve t h c nietliane forr ia t ion and t h e carbon depos i t ion . P r e s e n t l y however t h e tiel 1 developed conimel-cia1 iron-chromium-oxide c a t a l y s t i s employed under t h r sui:al)le steam to gas r a t i o which i s obtained b a + d on cqu ' l i - brium cons~cicraLions, shoving a s a ~ i s f a c t o r y s e l e c t i v i t y i n most w,~ter- gas shif t convcis inn proccsses . In t h i s s t u d y t h c r c f o r c only r e a c t i o n (1) wj 1 1 bc of p i i n n r y ii,iport.~ncc.
1

- 58 -
Among t h e d i f f ecc .n t typcr; of water-gas shi . f t rate. ccpat ionn proposcd s o f a r , the f i r s t o rd i :~ ' equa t ion of 1~aupirlile.r [ ] . I ] , Mars [13 ] , t l i e . second order equat ion of >loo [1.5], and tlie e s p o n c n t i a l foi-iu of equat ion of 1~oI i l . t~ro and otlicirs [[I] C?KC noteworthy. revievcd the cxperj.ilienta1 r e s u l t s obtained by previous i n v e s t i g a t o r s , and concluclctl t h a t the pscudo f i r s t o r d e r ra te cquat ion i s quite. abequqte i n m o s t cases .
w h i c h i s pa:ticularly iaiportant a t higli tempcratures .
l'hc r e c e n t paper of r\utliven[IS]
T h i s equat ion seeins t o have more f l e x i b i l i t y ttian , others s i n c e i t j.nc1.ud.t~ the po re dif iusj .on e f f e c t of c a t a l y s t ,
Tablc 1. Flow Rates and Compositions of Feed and Procuct Gases
Low CO Casc
-I-- - __-_I _I___- __ --_ Feed Product (dry b a s i s )
-*_ lb-mol c /hr - mole. % _T-.---_- 1.b-mol.c/hu ~-~ mole X
CO 9209.0 11.78 H20 19155 .S 24.50 .
17817.4 22.79 11567.3 14.79
CH4 19721.0 25.22
716.3 0.92
I1 2 co2
N2
6446.3
20580.1 14330.0 19721 .b
71.6.3
-- 1.0.43
33.31 23.19 31.91
I. 1.6
--
61793.7 100.00 T o t a l 78186.8 100.00
I n l e t Teciperature: 1000°F Pressure : 1100 p s i a -____________________ ~ _ _ _______I
co H2°
c02 CH4
N?
2
T o t a l
31850.6 35.32 11 767.5 13.04
19220.3 21 -30 12002.9 13.30 14591 . 7 16.17
784.5 0.87
9021 7.5 100.00
12421.7 -- 38649.2
31431..8 14591.7
784.5
97878.9
12.69
39.49
32.11 14.91
CI.RCI
100.00
--

- 59 -
. . ? , J-n the prcsc:nt s t -ut ly , thr. pscudo f i r s t o rdc r r a t e ‘ e q u a t i o n is
cons j - s tcn t ly used rcgar t l lcss of opcrati.ng conditi.ous. ~iowevcr, tlic rcsult obtained front, the second ordcr equa t ion of G i r d l c r [ 7 ] i s also presentccl f o r conipariso~i. The ,two types of ra te equa t ions a re sumniarizcd as follo~s:
(a). Pseudo f i r s t o rde r rate equa t ion
- 3- = ko (p-p,) d t
or i n an i n t e g r a t e d form
( 2)
- I n ( l -X /Xe) = k,t = k / S (3) aP v
The v a l u e of Ka as iol lows: P
i s obtained from i n t r i n s i c ca ta l -ys t a c t i v i t y , k,
I
k, = 1079 exp(-27300/KT)
k, = e S RT k, 1 P P
= 0.069 ( ~ / 6 7 3 ) ~ ’ *
= 0.5dp (k, /De 1 1/2 1 1
(b). Second o rde r r a t e equat ion
k 1 exb(1.5.95 - 17500/XT)
E. Mass and flcat T rans fe r IGitliin C a t a l y s t Bed
Since the water-gas s h i f t r e a c t i o n i s comparatively slow and modera:cly exotherniic, t h e d i f fsrc:?.-cc i.n tercperature and concen t r a t ion betx.Jecn bulk phase of gas and c a t a l y s t s u r f a c e is not expectcd t o be vcry g r e a t . TI!+ #-?!I b, s!:2\.i!: n : l m c y ; C - l l . r -c f - l l - . . - The - - - . - - . - - - . . - - - may be estititntcd b y : ,
. - .... . ... - .. -. . “ “ . y L ’ L L L “ “ “1 L I C - C , i C c !
Tc- T b = z rsAll/(tl Y P r d 2 ) (1 3 )

- 60 - where h and bulk’phase, and can be c a l c u l a t e d from (231
is tfie h e a t t r a n s f e r c o e f f i c i e n t between t!;e p a r t i c l e sur face
= ( N ~ , ) * ’ ~ h /(C G) = 0.989 (dpG/e) -0.41 JH P P
(14)
The maximum temperature d i f f e r e n c e w i l l r e s u l t from t h e maximum r e a c t i o n rate. The c a l c u l a t i o n based on t h e v a l u e , rC = 6 lb-mole CO/(hz cu. f t . cat.), G = 7000 Ib / (hr . sq . f t . ) shows approximately ?Tc-Tb)”3’F. Such a n e g l i g i b l y small tempera ture d i f f e r e n c e was a l s o repor ted e a r l i e r [ll] , 1131. The temperature g r a d i e n t w i t h i n a ‘ c a t a l y s t p e l l e t can b e c a l c u l a t e d by t h e fol lowing heat ba lance equat ion , assuming an uniform r e a c t i o n rate i n the c a t a l y s t .
(15’)
vhere k,, the e f f e c t i v e thermal conduct iv i ty may be c a l c u l a t e d from
1 1 - 5
k, (l-Ok, + <kg
S o l u t i o n of t h e above equat ion us ing proper boundary condi t ion i s
Again = 6 lb-mole/ ( h r . c u . f t . c a t . ) i s used f o r t h e c a l c u l a t i o n of t e m p h t u r e d i f f e r e n c e w i t h i n t h e p e l l e t , y i e l d i n g t h a t (T-Tc) lr=o <4*F.
In a s i m i l a r manner, t h e concent ra t ion d i f f e r e n c e betveen t h e bulk phase and the s u r f a c e of t h e catalyst i s approximated by
where k and may ge evalua ted from [91
i s t h e f l u i d - p a r t i c l e mass t r a n s f e r c o e f f i c i e n t i n t h e bed,
maximum d i f f e r e n c e i n concent ra t ion corresponds t o only 2% of bulk phase concent ra t ion .
(19)
I n summary, i t may be s a f e l y assumed t h a t t h e d i f f e r e n c e s i n temperature and concent ra t ion between t h e bulk phase and t h e c a t a l y s t s u r f a c e a r e n e g l i g i b l y small.
3. PERFORXANCE EQUATIONS
A. Flow Model f o r Fixed Bed Reactor ..
Flow p a t t e r n s ot t l u i d i n a f ixed bed r e a c t o r a r e d e s c r i b a b l e by t h e dispersed-plug flow model o r compartment-in-series model. requi red condi t ion may be s p e c i f i e d as fol lows [12]
The
...

I
- 61 -
Da/VL < 0.01
(Noting thc r e l a t i o n Da/vL = (Da/vd) (d /L)
and u s i n g the expcri iaental r e s u l t s oi 1:evenspiel and Bischoff [ I21 9
Da/vd zz 0.5
Equat ion (20) i s equiva len t t o d/I. < 0.02
In t h i s study t h e c h a r a c t e r i s t i c length d is the same a s t h e u n i t compartment length which is se lec ted a s 1 i n . Therefore, i t i s s e e n from equat ion (22) t h a t i f L i s l a r g e r than 5 f t . t h e requirement is s a t i s f i e d .
B. Performance Equations f o r Reactor Simulat ion
Material ba lances f o r each component around n- th compartment a r e g iven a s fol lows:
F? = F " - ~ +vn rCO i i C.
i.= 1,2,--,6
is negat ive f o r i = 1 , 2 , p o s i t i v e f o r i = 3 , 4 , ze ro f o r i = 5 , 6 , wh@e Ff;, Fg, F?, FZ, FY, Fg are t h e molar flow r a t e of CO, H20 , H 2 , GOz, CH4, and N a t t h e e x i t of t h e n-th compartment, r e s p e c t i v e l y , V: i s t h e c a t a f y s t volume per u n i t compartment. t h e n-th compartment under a d i a b a t i c condi t ions may a l s o be expressed as :
Energy ba lance around
T where
The pressure e f f e c t on h e a t c a p a c i t i e s may be considered n e g l i z i b l e even a t 1000 psi8 except f o r steam.
P r e s s u r e drop through t h e f i x e d bed r e a c t o r is c a l c u l a t e d using Ergun's equat jon [SI:
d G
Cpim = JT Cpi dT/(T - T o ) , AH = -17698 BTU/I b- mole 0
T O
(25) = 150t1-t ) ! a / ( p 1 + 1.75 3 d (f ) (4.) (- PA)
I - r c~ G 2
C. Design Equation t o r Ileat Exchanger
Considcri.ng the chnuze of f i l m cocffici:ent and scal iny, probI.cr,i, i t is assuificd t l ~ n t approximately 50% of water cntcrin:, t h e tiihcs i.n h e a t

- 62 -
= UT IC' (t2-tl) + 0 .51 ] f o r tubc! sidc P whe.re 1' tempera!'^^^:^^ of she1.l sicle and t u b e sidc!, rcspective1.y. h e a t t ra i i s fc r cocEfici.ent i s ca lcu l a t e d from:
t a re t h e out1.et tempc.~:atui:c~s, and 'Y2, t l , a r e ttie in1.c.t The shell. siclc
The pressurc drop i n the shell s i d c is estioiatcd by t h e f o l l o v i n g equati.on [ 101 :
2 3.0 AP =. f G L) I / (5 .22 x 10 Dos B ) s s S ' R
where -0.1876 f = 0.01165 ( U o G s / ~ t )
The tube s i d e heat t r a n s f e r c o e f f i c i e n t f o r t h e c a s e without phase change" may be computed by :
Si.nce a compl.etc optiinal. design of hea t exchan;i;ei:s is r a t h e r involved vhi.ch i s not c a l l e d f o r i n t i t i s s t u d y ; a sicipl.iEied procedure is adapted. T h i s procedure j.nvol.ves the de te rmina t ion of zn optirnur:, h e a t t r a n s f e r c o e f f i c i e n t f o r the heat exchanger. Cleer ly the i n c r e a s i n g mass v e l o c j t y of gases w i l l have a favorable e f f e c t on hea t t r a n s f e r c o e f f i c i e n t but w i l l r e su l t i.n a l a r g e r pressure d r o p . An optinurn heat. t r a n s f e r c o e f f i c i e n t t h e r e f o r ? i s c a l c u l a t e d bese(! on the hi.ghest v e l o c i t y within t.he all.oviablc pressure. d ro? of 3 psi..
Reactor Shell Cost: The Lhickiicss of the rt-ilctoi w a l l , T is coixputed h from [ I ]
Th =: P R' / ( S E'-0.61')
ann r.~ei.gtit of: r e a c t o r KR which inc ludes t!w top and Lottori b1.ank j s cal.culatcd by
(32)
(33)
- 63 - (34)
Then the r c a c t o r c o s t bccomcs ER = CKIfWI,, 3.13
Cost of c a t a l y s t suppor t ing t rays : ES = 0.21G IIN(Df5) (35)
Control Valve Cost: Averagc va lues of $8000 pcr va lve f o r a l a r g e s i n g l e reac to i and $4000 f o r s m a l l p a r a l l c l r e a c t o r s a r e used.
(36) Heat Exchanger Cost [17]: EI1 = C y I f [850 (A,/50)o*562]
Pump COSL: The fol lowing equat ions are u s e d t o e s t i m a t e the c o s t of pumps [6] [14] assoc ia ted with h e a t eschangers t o d e l i v c r cool ing water
0.467 ' E = 664 B P . P
where
B = q e, Ah/@46,600 Ef) P
B.
C a t a l y s t Cost: E, = IcVc
Cost of Di rec t M a t e r i a l and U t i l i t y
Steam Cost: Alt-hough t h e c o s t of steam deponds l a r g e l y upon i t s source and manufacturer , a v a l u e of 60 c e n t s per thousand pounds i s pr imar i ly used.
Thus EST = (W,,/lOOO) (6200) (0.6)
Cooling Water Cost: $0.12 per thousand g a l l o n i s used f o r t r e a t e d water .
Electr ic i ty Cost: 11 m i l per kw-hr i s used
C. Calcula t ion o f Revenue Requirement
I n order t o opt imize t h e process , formula t ion of c b j e c t i v e f u n c t i o n i s necessary. The accounting procedures i s " U t i l i t y Sas Product ion General Accounting Procedure" which is formulated by t h e American Gas Assoc ia t ion and adopted annual revenue requirement under t h e fol lowing condi t ions 1211 :
The o b j e c t i v e f u n c t i o n i s developed based on t h e annual c o s t .
by t h e O f f i c e of Coal Research. The procedure estimates t h e
Debt-equity s t r u c t u r e 65% debt (1/20th r e t i r e d Rc t u r n *on-ra t e b a s e 7% annual ly ) F e d e r a l income t a x r a t e 4 8% I n t e r e s t on debt 5%
s t r a j g h t l i n e 5%
i n w r o n c e 3%
n _-I__ :-.:-- ?n __-"_ rrL,'LCC*UL*V.l, L" J c I -
S t a t e and l o c a l taxes and

-. 64 -
A . Process Desc r ip t ion
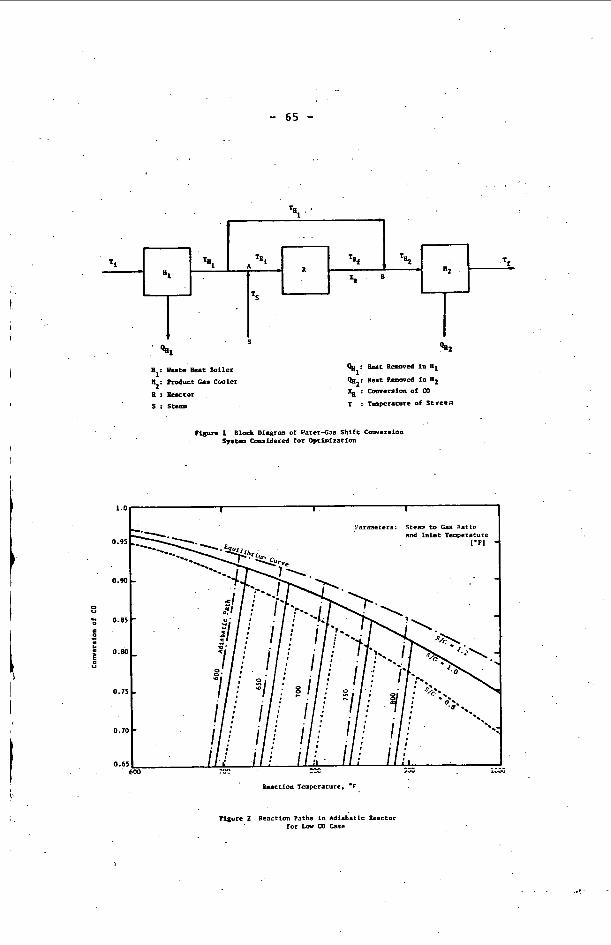
The block diagrani of the system f o r op t i io iza t ion i s shown i n Figure 1. Since t h e teiuperaturc of t h e raw gas from g a s i f i e r is s s u a l l y much h ighe r than the operati .ng tcmperature f o r s h i f t conversion, cool.ing by waste heat b o i l e r i s necessary b e f o r e going i.nto t h c r e a c t o r . The gas a f t c r cooled t o a proper temperati ire i.s thcn i.ntroduccd t o t h e r e a c t o r i n vhIch t.he mole r a t i o of carbon monoxide t o hydrogen i.s ad jus t ed about 1 / 3 . Therefore , f o r any f i x e d i n l e t gas composition, t h e r e is, al.vays a required conversion of carbon monoxide. Before the. gas enters t.he r e a c t o r , a c e r t a j n a m u n t of stcl'aiii i s added t o t h i s strean:. T h e a d d i t i o n a l steam a l s o b r i n s s the.steaai t o gas ra t i .0 high enou:,h so t h a r carbon depos5 . t i on on ca ta l .ys t xi11 no t take p l ace . 1)eteiiiiinati.on c f t he proper s t e m t o g a s r a t i o i s n o t a s inp le probler.1, hov.,:cver, because it requj.res t h e knowledge o f many f a c t o r s i nc lud ing t h e r e a c t i o n k i n e t i c s of carbon 1:j.t-h aases . Fur thernore , t he aooun t of steam introduced v o u l d g r e a t l y a f f e c t not only t h e s t e z a c o s t b u t a l s o reactj .cn r a t e , e q u i l i - brium conversion, e t c . and the opti:iiuni opexat ing cond i t ions . The required convzrsicn of carbon n?onoxide can b e achieved i n t h e r e a c t o r by one throughput. Nowever, because ,of t h e coa t of steam and t h e heavy duty required i n the. product ;as cooler , i t will be %ore advantageous t o by-pass 2. por t ion of the f c e d , and niix i t w i th t h e product Gas t h a t has been converted i n excess i n the r e a c t o r . Thc Conversion i n t he r eac to r i s adjusted t o achieve t h c required conversion upon niislng. I t i s observed t h a t i n o r d e r t o meet t h e r equ i r ed conversion by t h i . s schexe, t h e coiivci:sion i n the r e a c t o r has t o approach c l o s e l y t o the equi l ibr iuni conversion. The temperature of p r o d w t gas a f t e r the s h i f t conversion i s approxiinntc!l.y SOO"F, o r love r i f t h i s product i s mixed wi th t h e by-passed g a s . purifi .catioii . decidcd bascd (711 t he pcrrfoi-ciance of pui-jficr-, but: i n the p r e s e n t s tudy t h i s t eape ra tu rc 3 s f i x e d a t 4 G O " F f o r convenicnce.
E . Adi.abatic Reactoi-
Again, it is reqcii.red t o COOJ. the o u t l c t gas before The oiit1.et tel:rperature of product gas co:l.cr sholt3.d be
I I I C a d i a b a t i c opcr:icj.cn cnii bc rcprescntco on t!ic convcrsjon- tcillpc-rature p l o t . Figurr. 2 shovs t l i r cqtij.?.ibriiiitl curves fo r d j ricrrtir vslucs c l f s t r n i i i to ;-as raL.in hnsccl 011 tlie focd cccbpoaition of t-ltr lot+ CO cast . On the smw f i .guri* a r c s:iclt:-n tile acIj,?I>;l!:iC q>cra t . i r ?g l i i1c . s :
- 65 -
I'
s . 9.1 H : waste B e a t Boiler Il : Rodvet Gas Cwler
P : Peutor .
s : steam
P i s y n 1 Block Diagram of Water4aa Shift Coaversion Syst- CDDaidered for optimization
Peactioo Temperature. 'P
PQure 2 Reaction Paths In Adiabatic Reactor for Low a, Case
..-

- 66 -
which reprcsenl: thc cncrgy bal.ance rc la t ions l i ip s t a r t i n g from the given inl.ct- tciopcratiircs. l'lic i n t c r s c c t i o n of a d i a b a f i c pat11 v i . L I i equili.brium cui:vc i s a d i a h a t i c-equi1.i briuni p o i n t , .indicating tile.
niaxiniiiin aLtaiiiab1.e conversion and tenipei-aturc i n an adiabati.c, opcrnt jon. The i n l e t gas tcIilpp.rature t o r e a c t o r is one of the dccis ioi i var iabl .cs , having a n a31.owablc range, bcltween GOO"1: t o E 0 O " F . The niaximuiii a1l.owable o p e r a t i n g teiiiperature i s scl .cctcd a s 900"F, because experi.nicntal.ly i.t has been sliom that uiidc.sirab1.c phe-noiiicna such a s c a t a l y s t si.ntc!ring and carbon deposi t i .on could t a k e p l a c c above this teiiipcrattire. .
The optimizat ion of r c a c t t i r p a r t i s 1.0 f i n d the rc!ac.tioii condi t ions a t which t h e t o t a l annual . c o s t 5s minifiiizcd. HoI?ever, s i n c e t h e e n t i r e systeni t o be optimized incl.udes heat e : tc l ian~ers a l s o , the optimuin condi t ions cannot b e deci.ded from the r e a c t o r s t u d y aI.on?. I n o t h e r words, the react.or i s regarded a s one s tage w h i l e thc. e n t i r e process c o n s t i t u t e s a mult i -s tage process . Therefore , a t each s t a g e the optinial. d e c i s i o n s a r e obtai-ned f o r every admissible v a l u e of s t a t e v a r i a b l e s . I n t h i s s t u d y the q u a n t i t i c s to b e decided f o r t h c opt imiza t ion of t h e r e a c t o r a r e : the h l e t g a s t.esipcrature, t h e conversion (or by-pass f r a c t i o n ) , and thc diameter of r e a c t o r . I f we s e l e c t the tempcrature of gas as t h e s t a t e variab1.e and t h e r e n a i u i n g q u a n t i t i e s a s the d e c i s i o n v a r i a b l e s , t h r n t h e r e a c t o r op t in iza t i -on v i 1 1 fol low the procelure of searching foi: the optiinun conversion and optiniun diameter f o r every adni.ssib1.e val.uc o i t h e i n l e t gas temperature .
It can b e pl-oveiy. t h a t f o r a given r e a c t o r v o l u ~ i e , a soial.l.er dianietcr r e a c t o r weighs l e s s t h a n t h a t of a I.argcr dianieter r e a c t o r because of the th ickness of t h e r e a c t o r val.1.. Therefore , once the volume of t h e r e a c t o r i s determined froio t h e conversi.on, the s m a l l e s t diaineter xaill. b e chosen as the opti.nui:i d iameter vhic;i o f f e r s t h e a1lor:able pressure d rop throush t h e r e a c t o r . This reduces the nuober of d e c i s i o n v a r i a b l e s a n d sir:i:l.ifies t h e c a l c u l a t i o n . The procedure of r e a c t o r op t iwiza t ion i s a s f o l l o w :
1. The a d i a b a t i c equi l ibr ium conversion and t e n p e r a t u r e a r e dcterr.ii.ned for each .of the assumed i.nlet temperatures vit:i g iven feed conposi t i o n .
2 . An ini.tia1. t r i a l . v a l u e of di.anietei- i s e s t i o e t e d ap~ro:. : inatel .y from the required convers ion , the average teniperature and the pressure of tlic gas s t r e a z .
aunual. c o s t f o r the r e a c t o r p a r t i s ca lcu la tcd a t each poilit along t h c a d i a b a t i c l i n c by a sui tab1.e i n t e r v a l of conversion. I n t h i s proccdui-e, s e a r c h nicthocls such as E'iboiinc.ci Scarch or Golden Sec t ion Scarcti inay bc uscd f o r higlicr eEfi.cicucy, b u t i n t he p r e s e n t s t u d y a constant intcrvcil of 0.05 i s t a k e n f o r s i m p l i c i t y . >lcanviii.l.e, a t each convcrsion tlic cor rec t dianictclr of tlic r e a c t o r s a t i s f y i n g tiie pressure drop l i n t i t a t i o n i s c a l c u ~ a t c d by i t e r a t i o n s . I t i.s noted t h a t the detr.riiiin;ition of colivcrsion i.n the r e a c t o r tises autoi i~aLic.~l l .y tlic by-p:i::s fracLi.cn of tile fccd E ~ S .
is obtni.nctl f o r a siii::le r c n c i o r , t l i c optinwiti nui:hc.r of renc.tnrs i n
3 . Star t i .ng from tiie poin t near the e q u i l i b r i u n conversion, the
4,. Oncc tiie opL.i i t i i ini cniivcrsioii an<! tile c o r r c c t vaI.iie o f tiic din:i!etci-

- 67 -
p a r a l l e l can b e dccidcd r e a d i l y , based on t h e optimum space v d o c j t y a l ready deterniiiied.
, / ,
After t h e hea t exchanges and r e a c t o r a r e optimized i n d i v i d u a l l y for every 'admissible inl .e t and o u t l e t gas temperatures , t h e r e s u l t s can be combiued t o l o c a t e t h e optimum temperatures f o r the o v e r a l l system; acconipl'ish t h i s , f i r s t i t is necessary to, d e c i d e t h e steam temperature, Ts, i n F igure 1. Apparentl-y, . t h e i n c r e a s i n g v a l u e of of H1 b u t a f f e c t s t h a t of 112 adverse ly i f TR oppos i te tendencies , can be combined t o show t h a t t h e h i g h e s t p o s s i b l e Tkil and consequently t h e I.or.rest p o s s i b l e TS should be s e l e c t e d f o r an economical opera t ion . I n t h i s s tudy TS is s e l e c t e d as t h e s a t u r a t i o n temperature of steam a t .the opera t ing pressure . Once t h e t e n p s r a t u r e of steam is fixed:, t'he remaining procedure is s t ra ight forward . For every va lue of- TR. t h e val.ue of T H ~ is c a l c u l a t e d by m a t e r i a l and energy balances around p o i n t A . Since t h e corresponding v a l u e of. Trrf is. already obtained by a n optimum XK i n t h e ' r e a c t o r , s in i la r m a t e r i a l and energy bal-anccs around poin t E y i e l d t h e v a l u e of Tl1 . Hence, a l l t h e necessary i n l e t and o u t l e t temperatures f o r es t imazing t h e o v e r a l l c o s t s are determined.
C. Cold-Quenching Reactor
To
Tl1 . favors t h e cos t is f i x e j , These two
. .
The a d i a b a t i c s y s t e n provides a s imple and economical process when the Concentrat ion of carbon monoixde. i n t h e f,eed. gas s t ream is lot:. evolu t ion i.s so high t h a t t h e removal of h e a t from t h e s y s t e a becozes necessary i n order t o keep t h e r e a c t i o n temperature w i t h i n t h e d e s i r a b l e range. Hence, frolo the p o i n t of temperature c o n t r o l , more f l e x i b l c cold-quenching s y s t e m m u s t b e employed. I n i a t e r - g a s s h i f 1: converter cold-quenching is achieved by i n j e c t t n g a s u i t a b l e amount of cold water and vaporLzinp i t i n t h e .quenching zone of :he r e a c t o r . Since steam is a r e a c t a n t and is requi red i n excess , the water-quenching accomplishes d u a l e f f e c t s : F igure 3 (a) shows t h e present sys.tex of cold-quenching water-gas s h i f t conversion process . p rogresses under a n a d i a b a t i c condi t ion . \.!hen t h e r e a c t i o n h a s achieved a c e r t a i n e x t e n t of conversion, the quenching i s performed in the quenching zone by a pressur ized low temperature cool ing water '
which i s coniplete1.y vaporized and mixed with tlie r e a c t i n g gas s t ream .before e n t e r i n g t h e n e s t reacJ ion zone. Care m u s t be exerc ized f o r t h e . desi.gii and opera t ion of quenching zone t o a s s u r e compl.ete vapor iza t ion of water i n tlie qucnchi.ng zone, o therwise t h e unvaporized water wi.11. d r a s t i - c a l l y contaminate t h e c a t a l y s t i n t h e subsequent r e a c t i o n zone. Af te r quenching, . the low temperature g a s cont inues t o r e a c t i n t h e
u n t j l t h e des i red conversion is achieved. The c m l i n ; process i n tllc product- gas cooler wliicii fol lows t h c r e a c t o r is tlic snmc a s t h a t of the adiabat i .c systeni.
However, when the CO concent ra t ion i s h i g h t h e r a t e of h e a t
I
temperature reduct ion and s t e a n supply.
I n t h e f i r s t r e a c t i o n zone the r e a c t i o n
.
. . . secubt" ic'ici1.ui.n ~ c t ~ t c . ' i i tc a .Ptc. inatr qii2~1~ia.li~g anc i c r c c i ~ c ~ ~ ~ L ~ t , ~ l , , u c

- 68 -
sj.iicc (:he C ~ J ~ d - - ~ ~ ~ l ~ i i r l , j n ; : . i l i l l ~ ; syt;tc!ii c.niisi. of a s e r i c s of ac1iahat:i.c bed:;, tlic! typiclnl. opt-iiqliznt joii Lecliniqiic f o l l l . L i - - S tngC I J I - O C e S S , ?2111CJl.y dynaiiijc pro(;raiiiiiiiiy j.:; used. klasccl on t l ~ c ? r w u l ts of siiiiiilat'icln. l'lic liacliwai-d dynariii c prop,r;~iii i s c!::pt-c by t i le we3 1 laio\sn GC?I.I.III;III 'S pr inci .pl e of optioizal i.t:y [ 21 as: " \ h a t e v e r tlie i.nj.tia1. s t a t e and d e c i s i o n s a r e , t.hc r m a i i i i n ~ d e c i s i o n s must c o n s t i t u t e an optinin]. po1.i c y wit,ii regard t o the stat.e resuI.t:i.ng from the f irst dccis ion." I n c o n t r a s t t o t h e bacl:\~inrcl dynamic prograin algorit.hm, a forward dyi1aiili.c prograin al.gori t h i n [ 31 h a s bccn proposcd a s : "\,!hatever thc ensuing s t a t e a n d d c c i sioiis are., tlie pi:ec.eding d e c i s i o n s must c o n s t i t u t e an o i ~ t i ~ a l . p o l i c y w i t t i L-cgrrrd to vhe s t a t e existing before the l a s t dec is ion ." w i l l dcpend on the typc o f problciit a s well a s the given boundgry condi t ions .
I In Fi&ure 3(a) t h e i n i t i a l s t a k (X , T I ) , and f ina l . statcb (XE,TF) a r e i b e d e a r l i e r , b u t a l l o t h e r va lues a t interoiedj.ate s tages i n e d by opti.iiiization. Xov f rom t h e r e l a t i o n s h i p between
In t l i j s s t u d y , a L l i r v c - - s t a ~ c s y s t r i i i i s ? ;~ lcc tc :d
Thc sel.c.ction of backward o r fortcard a l g o r i thiii
t h e va lue of Sf and the amount of gas by-passed, i t . i s ? o s s i b l e t o confi.ne the system of o p t i n i z n t j o n t o t h s regi.on sCii.rounded hy t h e d o t t e d l i n e i n E'i.gur;-e be. optimized with Xi given .
Each s t a g e except s t a g e 1. c o n s i s t s of opc quetichl.ng zone and one r c a c t i o n zone, an? has tvio s t a t e v a r i a b l e s X, T, and two deci.sior1 v a r i a b l e s i.! and AX. For esainple! i f ve use backvard algori thio i n s t a g e 3 , f o r any given v a l u e of (S;, T $ ) , we can f i n d t h e optiii!al de.cision lt!3 and AS3 such t h a t t h e t o t a l c o s t i s minimized. water I.!, i s used,- t h e p r inc j .p l e of coaputa t iona l pr.ocedure i s s t i l l t h e saine .
j(::). Figure 3 (b ) siio:.!s the modified sys t e in ' t o
i n s t a g e 1. a l though no queuchiu:,
General ly , a baclxard approach has been u s e d more f r e q u e a t l y , and can be a1.so appl ied t o the present problem. Ho;;.cver, i n t h i s s t u d y the forcrni-d concept i.s used because f i - r s t l y , t h e problem i s of i n i t i a l . condi t ion type, and secoi td ly , the. equilibri .um coristraj .nt e.xi .st ing a t the end of esch s t a g e i s h e l p f u l f o r taki.ng t h e admissible ranges of s t a t e v a r j a b 1 . e ~ .
T h e gencra~. recurrance f o r s : u ~ a i.n i<-stage process i.s
- where - YN and GN aiid Fh are the o b j e c t i v e and mininiuiil objecLivc f u n c t i o n , r e s p c c r i . \ d y.
Os a r c t l ic s ~ a t e and d e c i s i o n v e c t o r s a t the X-t t l stage
Then t h e f o l l o v i r ~ ~ L u n c t h n a l rcjurrtiou can h e u r i t t e n f o r c a c ! ~ s t a z e .

- 69 -
F i r s t s t a g e ,
Second s t age ,
Third s t age ,
\ Based on t h e above equatioils and us ing t h e material and energy ba lance r e l a t i o n s , the opt imiza t ion is performed s t a r t i n g from the f i r s t s tage . Although t h e system i s d i f f e r e n t and involves t h e mult i -dimensional i ty problem, t h e b a s i c p r i n c i p l e f o r op t imiza t ion a t each s t age is q u i t e s i m i l a r t o t h a t of t h e a d i a b a t i c system. I n each case the amgunt of quenching water i s ad jus t ed wi th in t h e capac i ty of quenching zoae, and t h e i n t e r v a l s of v a r i a b l e s a r e proper ly s e l e c t e d based on t h e s e n s i t i - v i t y of ob jec t ive func t ion and on t h e computing t i m e . A l i n e a r i n t e r - po la t ion approximation is app l i ed t o connect t h e s tages . The computa- t i o n a l procedure i s a s fol lows:
I
1
f 1. A t t h e e x i t of t h e first s t age , t h e admissible ranges of X1 and T a r e found. I n doing t h i s , t h e r e s t r i c t e d range of opera t ing temperature, 550'F_<T<gOO"F, and t h e equi l ibr ium temperature-conversion r e l a t i o n - s h i p a r e considered. Then wi th in t h e range l a t t i c e p o i n t s of (Xf,Tf) a r e formulated.
The corresponding Ti f o r each of t h e l a t t i c e poin t i s c a l c u l a t e d us ing ma te r i a l and energy babe r e l a t i o n s h i p i n t h e s tage . The s i z e of r e a c t o r is evaluated, t h e annual c o s t , G1, i s t h e n obtained ana t abu la t ed .
S imi la r ly , a t t h e e x i t of t h e second s t a g e t h e admiss ib le values of ( X I T2f) a r e found.
and t h e evaluated G2's a r e l i s t e d .
1
t h e netwise two-dimensional
1 1 2.
I
t
2; (Xi, Ti ) 's a r e c a l c u l a t e d f o r d i f f e r e n t va lues of -(A<, W,),
5.
6.
- . 2
In t e rpo la t ion is performsd between (Xf Tf) and (X;,Ti), and t h e
By a s i m i l a r computation a t t h e t h i r d s t age , a l l t h e va lues of
minimum values of (G1+G2) obta ined a r e l i s t e d 'io? every va lue of (X2,Tz). f f
(Ax3, w3)* (X:,T;) and G3 are a l s o obtained from t h e admiss ib le va lues of (Xf Tf) and
In t e rpo la t ion i s performed between (Q T ) and (X; , T3).
3' 3 f f - i
7. Hence of (X' Tf) ,
i 2 t h e t o t a l ob jec t ive func t ion (G +G +G ) is obtained for every value 1 2
from which t h e optimum r e s u l t i s found. 3' 3
Again t h e r eac to r p a r t and h e a t exchmger p r t can be combined by t h e s i m i l a r 'procedure shown i n adfahat.: r cyst.ern.
1
- 70 - 6. RESULTS
Adiabat ic system: Figure 4 shows t h e r e a c t i o n r a t e p r o f i l e s along the r e a c t o r and Figure 5 i l l u s t r < i t e s the annual c o s t .vs . r e a c t o r i n l e t temperature f o r t h e low CO casc . The optimum opera t ing condi t ions and corresponding c o s t s a r e l i s t e d i n Tables 2 and 3 f o r both the low CO case and t h e high CO case.
Cold-quenching system: The r e a c t i o n r a t e p r o f i l e f o r the low CO casc, and r e a c t j o n pa ths f o r both cases a r e shown i n Figures 6 t o 8 , r e s p e c t i v e l y ; t h e optimum opera t ing condi t ions and c o s t s a r e l i s t ed i n Tables 4 t o 6.
7. DISCUSSION
A. Effec t of St-ean t o Gas Rat io on 0ptinii.zation of Adiabat ic Wafer-Gas S h i f t Conversion S y s t e m
A s a l ready i n d i c a t e d , t h e steam t o gas ra t i .0 i s one of t h e mcst important f a c t o r s i n t h e opt imiza t ion of water-gas s h i f t conversion sy'stem. However, i t s de termina t ion i s not s t ra ight forward . To s e e how t h i s f a c t o r a f f e c t s the performance of the reactj.on and t h e opti.- mizat ion, d i f f e r e n t va lues of steani t o gas r a t i o \;ere employed f o r t h e low CO case i n t h e a d i a b a t i c system. Figure 9 shows the r e a c t i o n r a t e p r o f i l e s a long t h e r e a c t o r he ight wi th d i f f e r e n t steam t o g a s r a t i o s of 0.8, 1 . 0 , and 1 . 2 . l i s t e d i n Table 7 , i n d i c a t i n g t h a t t h e inajor d i f f e r e n c e i n c o s t cones froiu the v a r i a t i o n i n t h e amount of s t e a n al thwigh t h e r e i s a l s o a cons iderable change i n o ther c o s t s .
The opera t ing condi t ions and c o s t s a r e
3. Effec t of P r e s s u r e on the Reactor Perforinance
Since l i t t l e is known about the r e a c t i o n k i n e t i c s above 450 p s i g , t h e v a l i d i t y of r a t e equat ion used i n t h i s s tudy i s uncer ta in above t h i s pressure . Besides , most of t h e commercial p l a n t s a r e operated around 400 p s i g or l e s s , due t o t h e experimental f a c t t h a t t h e a c t i v i t y of iron-chronium-oxide c a t a l y s t i n c r e a s e s r a p i d l y with p r e s s u r e i n t h e low pressure range but above 400 p s i g , t h e e f f e c t of pressure becomes i n s i g n i f i c a n t .
Two a d d i t i o n a l opera t ing p r e s s u r e s of 300 p s i g and 600 p s i g a r e s e l e c t e d t o s tudy t h e e f f e c t of p r e s s u r e on the a d i a b a t i c r e a c t o r opera t ion . F igure 10 shows the p r o f i l e s of r e a c t i o n r a t e and Table 8 l i s t s t h e o p e r a t i n g condi t ions and c o s t s . These results i o d i c a t e t h a t a t high p r e s s u r e al though the r e a c t i o n r A t e i s increased and uiisequen;ly t h e -;uL~,L G: ----*-I L L - U \ _ C U L :- A., UCCLL'.aeG, I------ :!.2 ;czt :f r:z:tsr becomes h igher h e c a a s r of t h e r e a c t o r wall th ickness . Therefore , i n genera l , t h e r e i s na reason t o opera te t h e rc3c t ion a t a high pressure unless oLher p a r t s of the g a s i f i c a t i o n processes are conducted under h igh pi essures .

- 71 -
I' I *
- Parameter: . Inlet Tenp&ature. .F
600 '
I I 10
Figure 3 ( 4 . X: Conversion of co T: Temperature 5: Steam Y: Quenching Water
a1
r
Figure 3 Block Diagram of Cold-Quenching Uater4G.S Shift C m e r s l o n Systen Considered for Optiniretion
\
5.0
a
uenctoi Hc1ght. ft.
Flgure 4 Reaction Fate Prorilcs In Adiabatic Reactor for Lov CrJ cssc

- 7 2 -
1-
t
I
. . . . _ --.-*n
- 73 -
?
0.70 - e
-.-- 100 800 820 840 860 880 900
Reacrlan Temperature. .F
Figure 7 Reaction P a t h Under Oprlnuc Condition in C o l d - p u e n c h l w Rrsclor for Lm eo ca*e
1.00 I I
950
Leactio" Temperature. si
Flgurc 8 Reacrlon P s t h Under Optlrum Candlflan In Cold-Quenchlng Reactor for Hlgh u) Case
\

- 74 -
-4
.. 4 .o
c I
u
0
u 0
3 3

- 75 -
I U
0
4
pc
c o 4 v
4
c n
c . n
*

- 76 -
0 .-I .
Y
0

- 77 -
Parameter: Steam t o cas Satiocslc)
Reactor Height, f t .
Figure 9 Effect of Steam t o Cas Rat10 on Reaction Rate in Adiahatir.Reastor for Low co case
I I I I
Reactor Ilelght, I t .

- 78 -
C; Comparison of t he Resul t s Using D i f f e r e n t Reaction Rate Expressions
In s e c t i o n 2, two types of rate equat ion , namely the pseudo-f i r s t o rder equa t ion (2) and the second order equat ion (11) are discussed. Since t h e des ign of t he r e a c t o r depends g r e a t l y upon t h e r a t e equation, i t w i l l b e necessary t o compare the r e s u l t s obtained us ing t h e two rate equa t ions . based on t h e two equat ions a r e l i s t e d i a . T a b l e 9 r eac to r . p re s su res , 300 p s i g is s e l e c t e d as t he ope ra t ing pressure . seen from the t a b l e only sma l l d i f f e r e n c e s e x i s t between the two r e s u l t s i n d i c a t i n g t h a t t h e water-gas s h i f t r e a c t i o n can be represented by either of t h e two equat ions i n t h i s range. The second order equation however seems to provide more conserva t ive estimate than the f i r s t o rder equation.
b.
The ope ra t ing condi t ions and t h e corresponding c o s t s f o r t h e a d i a b a t i c
Because the a p p l i c a b l e range of bo th equat ions favors low As can be
P res su re Drop in Quenching Zone
Since the quenching zone is u s u a l l y packed wi th r i n g s and saddles , more p r e s s u r e drop is expected i n t h i s region. equat ions may b e used f o r t h e approximat6on of p re s su re drop:
2
E i t h e r of the following
(44) i2 m/z = 0.012 C ~ G /6gce
or n AP/Z = k' v (45 ) [I I
I f t h e values, G = 7000 l b / ( f t ? hr.) and then AP/Z = 0.05 (44)and 0.03 p s i l f t by equation
be neglec ted , un le s s t he packing he igh t i s much l a r g e r than an t i c ipa t ed .
8 = 1.5 l b / f t 3 are used, p s i / f t by equat ion
(45). Therefore t h e p re s su re drop through quencing zone i n t h i s study CE
E. E f f e c t o f Su l fu r Content i n Gas
The s u l f u r conten t I n gas is another impor tan t f a c t o r a f f e c t i n g g r e a t l y the performance of water-gas s h i f t r eac t ion . amount of s u l f u r exceeds the a l lowable va lue , t h e c a t a l y s t a c t i v i t y d e t e r i o r a t e s cons iderably r e q u i r i n g p e r i o d i c a l gene ra t ion . s i n c e t h e a l lowable s u l f u r conten t v a r i e s cons iderably depending on t h e type of c a t a l y s t used, t h e d e t e r n i n a t i o n must be based on the experimental daEa obtained from t h e s p e c i f i c c a t a l y s t .
Therefore, i f t he
Bowever,
The s tudy of Bohlbro 151 i n d i c a t e s t h a t t he k i n e t i c s of water-gas s h i f t r e a c t i o n may be modified by t h e presence of 82s i n the feed gas.
100 ppm ( p a r t per n i l l i o n ) on ly phys ica l adso rp t ion on the su r face of c a t a l y s t t a k e s p l ace , b u t above 1000 ppm k i n e t i c s w i l l be a l t e r e d because
1 According t o h i s experirnonral r n c i i l t z , if the cc=t=nt cf IT ..p J - 1 - - - &an
i
. -. I
I

- 79 -
of t h e t ransformation of i r o n oxide i n t o i r o n s u l f i d e . On t h e o t h e r hand, G i r d l e r 171 descr ibed t h a t s u l f u r conten t above 150 ppm reduces t h e a c t i v i t y of c a t a l y s t g r e a t l y , b u t below 50 ppm s u l f u r does n o t have any s i g n i f i c a n t e f f e c t on t h e a c t i v i t y of t h e i r c a t a l y s t . d i scussed t h e e f f e c t of s u l f u r conten t on a c t i v i t y of c a t a l y s t showing removal of s u l f u r compounds from t h e feed gas i n c r e a s e s t h e performance of r e a c t o r considerably.
Mars [13] a l s o
The s u l f u r conten t i n rziw gas from the g a s i f i e r v a r i e s widely depending on the process , some of which could have as much as 0.9% of H2S. t h i s s t u d y is made hased on t h e assumption t h a t t h e s u l f u r conten t is small enough t o b e t o l e r a t e d by the c a t a l y s t without caus ing s u b s t a n t i a l d e a c t i v a t i o n . very high, i t is p o s s i b l e i n most cases t o s e l e c t a proper type of c a t a l y s t t h a t w i l l wi thstand the s u l f u r poisoning f o r s u b s t a n t i a l l ength of the . On t h e o t h e r hand, i f t h e c a t a l y s t g e t s d e a c t i v a t e d it is also p o s s i b l e t o modify t h e space v e l o c i t y i n t h e r e a c t o r t o t h e corresponding r e d u c t i o n i n catalyst a c t i v i t y . The r e c e n t s t u d y of Ting and Wan 1191, shows another approach f o r handl ing su l fur -conta in ing gases . Here the rate c o n s t a n t is modified by a s u l f u r c o r r e c t i o n f a c t o r , t h e v a l u e of which are obta ined i n t e r m s of o p e r a t i n g p r e s s u r e up t o 30 a t m . f o r the gases conta in ing H2S as high as 0.24%.
F. S e n s i t i v i t y Analysis
However,
I n g e n e r a l , u n l e s s t h e s u l f u r conten t i n the feed gas i s
The c u r r e n t op t imiza t ion involves a number of s p e c i f i c system parameters. But t h e information on t h e s e parameters are n o t n e c e s s a r i l y accura te . Such a n u n c e r t a i n t y of parameters is incurred by various i n t e r n a l and e x t e r n a l f a c t o r s and may a f f e c t t h e performance of op t imiza t ion cons iderably under c e r t a i n condi t ions . The s e n s i t i v i t y s tudy h e r e is intended t o b r i n g about a b e t t e r system performance by analyzing t h e e f f e c t of v a r i a t i o n i n parameters on o b j e c t i v e func t ion . The s e n s i t i v i t y of a given parameter , Se may b e represented as (221
Se = [(J - J ) / ~ ] / [ ( W - ;)/GI (461
Refer r ing t o t h e r e s u l t s l i s t e d i n Table 10, i t i s seen t h a t t h e o b j e c t i v e f u n c t i o n i s most s e n s i t i v e t o t h e parameters involved i n k i n e t i c expression. p e l l e t play an important r o l e i n t h e r e a c t o r performance.
As i s a l s o expected, t h e dimension and c h a r a c t e r of c a t a l y s t

- 80 -
- 5
" Y . 9
I 0'
" P c
e e .I .i
" 0
Y " " CI
m 9 4
4

- 81 -
I
I
8. CONCLUSIOX
A. I n t h e opera t ion of water-gas s h i f t r e a c t o r , steam c o s t occupies t h e major por t ion of t h e t o t a l c o s t . The reduct ion of t h e anount of steam is t h e r e f o i e most important i n making t h e process inore economical.
B. The t o t a l annual c o s t i s not g r e a t l y a f f e c t e d by t h e v a r i a t i o n i n t h e r e a c t o r i n l e t temperature between 650°F t o 750°F when t h e concent ra t ion of CO i n the feed gas i s low o r moderate. concent ra t ion , hovever, t h e s e n s i t i v i t y due t o t h e i n l e t temperature v a r i a t i o n is increased.
C. i n most c a s e s , which i s mainly due t o t h e r o l e of steam c o s t i n the o b j e c t i v e func t ion .
D. not be a c c u r a t e f o r high p r e s s u r e s , t h e o p e r a t i o n beyond 400 p s i g Goes not s e m to h2vc any p a r t i c u l a r advantage.
E. I n cold quenching r e a c t o r , major p a r t of the t o t a l conversior. is achieved i n the f i r s t s t a g e hut bo th t h e f i r s t and t h e l a s t s t a g e cf t h e r e a c t o r occupy the l a r g e s t p o r t i o n of o v e r a l l r e a c t o r systen:.
F. The concent re t ion of CHG and CO i n t h e feed gas is the p r h a r y f a c t o r a f f e c t i n g t h e process c o s t . Because o f the s t e a n cos t , t h e cold-quenching s y s t e n i s less c o s t l y than th2 a d i a b a t i c s y s t e n i n m o s t ceses , p a r t i c - i l a r l y i n t h e h igh CO concent ra t ion case . However, i f t h e s t e z n can be igmrec!, th:! a d i s b z t i c sys ten w i l l b2 s u i t a b l e f o r low CO concent ra t ion of less t h a n 35% 0x1 d r y b a s i s .
G. somewhat s e n s i t i v e t o t h e p a r a z e t e r s r e l a t e d t o the k i n e t i c express ion and t h e charac te r of c a t a l y s t p e l l e t , i n d i c a t i n g t h a t s g e c i e l c a r e must be exerc iseJ f o r the d e t e r a i n a t i o n of t h e s e p a r a n c t e r s .
For t h e g a s of high CO
The optimum conversi& is very c l o s e t o t h e e q u i l i b r i u n conversion
Althcugh t h e k i n e t i c s information of water-gas s h i f t r e c t i o n may
Fro= t h e s e n s i t i v i t y s tudy , t h e o b j e c t i v e f u n c t i o n ~ p p e 2 r e d t 3 b2
ACKIIO~X.EDGX~ST
The au thors g r a t e f u l l y acknowledge t h e support of t h e O f f i c e of
Coal Research, Dcpzrtinent of t h e I n t e r i o r , Uasiiington, D.C.

- 82 -
NOKENCL ATURE -
Da D elyD%
dP E
Fd
%SGS
h' P
J,J
Adiabat ic p a t h s i n r e a c t i o n zones of the f i r s t , second and t h i r d s t a g e s , r e s p e c t i v e l y Heat t r a n s f e r a r e a s of t h e hea t ing zone, t h e vaporizing zone, and the t o t a l , r e s p e c t i v e l y [ s q . f t . ] B a f f l e spac ing [ f t . ] , and Brake horse power [hp.], r e s p e c t i v e l y Concent ra t ion of component i [mole f r a c . ] , and concentrat ions of product gas i n bulk of g a s phase and a t c a t a l y s t s u r f a c e [ l b mole/cu.f t . ] , r e s p e c t i v e l y A-constant r e l a t e d t o t h e packings and f l u i d f low Height of a u n i t compartment [ f t . ] Heat c a p a c i t i e s of gases and water, r e s p e c t i v e l y [BTU/(lb.OF)] Molar temperature-mean h e a t c a p a c i t y of component i [BTU/(lb mole,OF): Cost p e r podnd of material used f o r cons t ruc t ion of r e a c t o r shell [ $ / l b ] , and c o s t year index, r e s p e c t i v e l y C h a r a c t e r i s t i c l e n g t h in r e a c t o r and i n s i d e diameter of r e a c t o r , r e s p e c t i v e l y [ f t. ] Axial d i s p e r s i o n c o e f f i c i e n t [ s q . f t . / h r . ] E f f e c t i v e d i f f u s i v i t y of CO i n c a t a l y s t pores a t 1 atm and a t p r e s s u r e p, r e s p e c t i v e l y [ sq . f t . /h r . ] I n s i d e d iameter of tube, equiva len t diameter f o r h e a t t r a n s f e r tube , and i n s i d e s h e l l diameter of h e a t exchanger, r e s p e c t i v e l y [ f t . ] Diameter of c a t a l y s t pel le t [ f t . ] A c t i v a t i o n energy i n pseudo f i r s t o rder r a t e equat ion [BTU/lb mole] E f f i c i e n c y of t h e l o n g i t u d i n a l j o i n t s i n c y l i n d r i c a l s h e l l s , and mechanical e f f i c i e n c y , r e s p e c t i v e l y Cost of c a t a l y s t [$I and steam [ $ / y r ] , r e s p e c t i v e l y Costs of h e a t exchanger, pump, r e a c t o r and c a t a l y s t support ing t r a y , r e s p e c t i v e l y [$] f l a t b lenk diameter of top and bottom of domes of r e a c t o r [ f t . ]
Molar f low rates of component i a t (n-1)-th compartment and n-th compartment, r e s p e c t i v e l y [ l b n o l e / h r ] S h e l l s i d e f r i c t i o n f a c t o r [ sq . f t . / sq . in . ] G r a v i t a t i o n a l a c c e l e r a t i o n [ f t . / sq .hr . ] S u p e r f i c i a l g a s mass v e l o c i t y [ l b . / ( s q . f t . h r . ) ] Mass v e l o c i t y i n tube s i d e and she l l s i d e , r e s p e c t i v e l y [IbRsq. f t .hr . ) ] Hydraul ic head [ f t . ] Heat of r e a c t i o n a t any temperature and a t temperature To, r e s p e c t i v e l y [BTU/lb mole CO] Film heat t r a n s f e r c o e f f i c i e n t i n i n s i d e and o u t s i d e , r e s p e c t i v e l y [BTU/(sq.ft.hr.OF)] Fluid-par t i c l e h e a t t r a n s f e r c o e f f i c i e n t [ BTU/ (sq . f t . h r . OF) ] Unit cost of c a t a l y s t [$/cu.f t . ] and cost f a c t o r ; r e s p e c t i v e l y
Objec t ive f u n c t i o n f o r a g iven v a l u e o f parameter and c h a t a t the optimum condi t ion , r e s p e c t i v e l y Heat t r a n s f e r f a c t o r and m a s s t r a n s f e r f a c t o r , r e s p e c t i v e l y

e - 83 -
'd i - =.
t T - T T 1, 2
Equilibrium constant based on mole fraction Constants related to the packings and fluid flow Reacton rate constant in second order rate equation [hr Apparent catalyst activities at 1 atm and at pressure p, respectively [hr'l] TheFal conductivity of catalyst and effective thermal conductivity of catalyst particle, respectively [BTU/(ft.hr.OF)] Fluid-particle mass transfer coefficient [f t h r . ] Thermal conductivity of gas and water, respectively [BTU/(ft .hr . OF) ] Apparent first order rate constant based on the unit catalyst bed volume [hr'l] Intrinsic catalyst activity based on unit surface area [f t . lb mole/ (hr . BTU) ] Intrinsic rate constant at 1 atm [hr
-1 .
]
~
-1 ]
Lengths of reactor and heat exchanger, respectively [ft.] Hrnnber of trays and Prandtl number, respectively Pressure of the system and pressure drop, respectively [lbf /sq . in. ] Partial pressure of CO.at any time and at equilibrium, respectively [lbf /sq.in.]
- Beat transfer rate in heat exchangers [BTU/hr.] Volumeric flow rate of water [gal./min.] Radial distance in catalyst particle [ft.] Gas constant [BTIJ/(lb mole, "E)] Inside radius of cylinder [in.] Reaction rate of CO [lb mole CO/(hr.cu.ft.cat.)] [cu,f t . CO/ (hr .cu. f t .cat .) 1, respectively Dirt factor in heat exchanger Reaction rate per unit catalyst particle [lb mole CO&r.unit cat.)] Specific gravity, steam flow rate [lb/hr.] and sensitivity, respect €vely Specific surface area of catalyst [sq.ft./lb], maximu; allowable stre s value [lb;/sq.in.] and space velocity at N.T.P. basis I~ ' Q I , respectiiiely time [hr.] Temperature, The subscript denotes the stage number and the superscript represents the status [OF] [OR] Temperature of shell side at outlet and inlet, respectively [OF]
Bulk gas temperature in reactor and surface temperature of catalyst particle, respectively [OF] Thickness of reactor shell [io.] Shell side gas temperature at which vaporization of water starts to take place [OF] Exit temperature of (n-1)-th
Standard temperature (77OF), and temperature of steam [OF], respectively Overall heat transfer coefficient [BTU/ (sq .f t .hr .OF)]
compartment an! n-th compartment, respcti-rely [ O F !

- 8 4 -
,-.. .
W
e - ON
4
Overall h e a t t r a n s f e r c o e f f i c i e n t s f o r hea t ing zone, vapor i z ing zone, and whole h e a t exchanger, r e spec t ive ly [BTU/(sq.f t .hr .OF11 Axial mean v e l o c i t y [ f t . / h r . ] and l i n e a r v e l o c i t y of gas i n empty tower [ f t . / sec . ] , r e spec t ive ly C a t a l y s t volume per u n i t compartment, and of t o t a l r eac to r , r e s p e c t i v e l y t cu . f t . 1 Quenching water.
Parameter sub jec t t o v a r i a t i o n and t h a t a t a s p e c i f i c va lue cons idered , r e spec t ive ly ,
Weight of r e a c t o r [ l b . ] , mass flow r a t e of gas i n s h e l l s i d e [lb . /hr . I Mass flow r a t e of steam and water i n tube s i d e , r e spec t ive ly [ l a . / h r . 1 F r a c t i o n a l conversion of CO a t a n y t h e and a t equi l ibr ium, r e s p e c t i v e l y . s u p e r s c r i p t r ep resen t s the status. S t a t e v e c t o r i n N-th s t a g e Eeight of packing [ f t . ]
The s u b s c r i p t denotes t h e s t age number [ W h r l
r espec t i v e l y
The s u b s c r i p t denotes t h e s t a g e number and the
GREEK LETTERS
Voidage of c a t a l y s t bed Decis ion vec to r at N-th stage
Effec t iveness f a c t o r a t 1 a t m
I n t e r n a l porosLty of c a t a l y s t La ten t h e a t of water [BTU/lb.] V i scos i ty of gas and water , r e s p e c t i v e l y [ l b , / ( f t . h r . ) ]
V i scos i ty of water at tube-wall temperature [ l b l (f t .hr .) ]
Density of gas r e a c t o r m a t e r i a l , c a t a l y s t p a r t i c l e , and water , r e s p e c t i v e l y [ l b . /cu. f t . I Th ie l e modulus a t 1 atm

- 8 5 -
APPENDIX
In case t h a t t h e vapor i za t ion is tak ing p l ace i n s i d e the tube, t h e c a l c u l a t i o n of h e a t t r a n s f e r c o e f f i c i e n t i s d i f f i c u l t . However, t h e following s impl i f i ed approach i s used i n t h i s s tudy , by sepa ra t ing t h e h e a t exchanger f i c t i t i o u s l y Tnto two zones: hea t ing zone and vapor iz ing zone. Tm at which t h e vapor i za t ion starts t o take p l ace corresponding t o t h e boundary of t h e two zones i n t h e tube can be
Then t h e temperature
I ca lcu la t ed by a hea t balance:
. The log-mean temperature d i f f e r e n c e s i n t h e hea t ing zone and vapor i za t ion zone a re :
- . 1
2 Tl.m. E [(Tm-t2)-(Tl-tl>l/& [(Tm-tZ)/(Tl- t i ) I
I TLm. = [(T2-t2)-(Tm-t2)1/R” [ (T2-t2)/(Tm-T2)1
(48)
(49)
\ The o v e r a l l hea t t r a n s f e r c o e f f i c i e n t f o r each zone can be obtained by
1 / U = l/hi + l /h , +Rd (50) I’
Then t h e hea t t r a n s f e r a r e a s f o r hea t ing zone and vapor i za t ion zone become
% = W C ’ ( t2 - t l ) / (U T1 ) T P b 1.m.
I
i
I A, = 0.5 X WT/(UvTtm!
Thus t h e t o t a l a r e a i s
% = % + * v
And t h e average o v e r a l l hea t t r a n s f e r c o e f f i c i e n t UT is obtained
i - (53)

- 86 -
REFEXIINCES
ASXE Boiler and P res su re Vessel Code, Sect ion VIII, Unfired P res su re Vessels, The Anierican Society of Nechanical Engineers, New York, 1956. Bellman, R . , "Dynami.c Programiiii.n:,," Pr inceton Un ive r s i ty P r e s s , P r ince ton , N.J., 1957. Bhavnani, K . H . , Chen, K . , "Optimization of Time-Dependent S y s t e m by Dynamic Prograniiiiing , J o i n t Automatic Control Conference Proceedings, 1966. Bohlbro, H . , Acta Chem. Scand., Is, 502 (1961). Bohlbro, H . , Acta Chen. Scand., 17, 7 (1963). Ch i l ton , C . , "Cost Engineering i n t he Process I n d u s t r i e s , " McGrar~Hill, Wew York, p. 50, 1960. Communication, G i r d l e r Ca ta lys t , L o u i s v i l l e , Ky . , A p r i l , 1968. Ergun, S . , Chem. Eng. Progr . 48, 89 (1952). Gamson, B.W., Chem. Eng. Progr . 47, 19 (1951). Kern, D . Q., "Process Heat Trans fe r , " PfcGraw-Hill, New York, 1950. Laupichler, F. G . , I nd . Eng. Chcn. 30, 578 (1938). Levenspiel , O., "Cehmical Reaction Engineering," John Vilcy a:.d Sons, Inc. , New York, P. 274, 1962. Mars, P . , Cheiii. Eng. Sc i . 2, 375 (1961). McCabe, L!. L. and Sni.th, J . C . , "Unit Operations of Cher5cal Engineering ," EicGraw-Hill, Kergr York, 1956. Noe, J . M . , Chen. Eng. Progr . 2, 33 (1962). Norman, 1.7. S., "Absorption, D i s t i l l a t i o n and Cooling l'orrers," Longmans, Engl-and, p. 327, 1961. Page, 3 . S . , "Est imators ' Manual of Equipment and I n s t a l l a t i o n Cost," Gulf , Houston, 1963. Ruthvcn, D. -+I., "The A c t i v i t y of Commercial Water-Gas S h i f t Catal .ysts," T r i p a r t i t e Conference, Xon t rea l , Sept . 23, 1.96s. Ting, A . P. and Wan, S. TJ., Chen. Eng., >fay 1 9 , 185 (1959). Treybal , R. E. , ";.lass Trans fe r Operations, ' ' Secoild ed . , NcGraw-Hill New York, p . 162, 1968. U t i l i t y Gas '2roduction General Accounti.ng Procedure, Lverican Gas Associat ion, >fay 20, 1965. Wen, C. Y . and Chang, T . M . , Ind . Eng. Chea. Process Design Development L, 49 (1968). Wil.ke, C . R . and Hougen, 0 . A . , ,Trans . A.1.Ch.E. 41, 445 (1949).

- 87 -
Costs of Liquid Fuels from Oil Shale
Harry Perry 11
U.S. Department of the Interior 18th and C Streets, N.W. Washington, D.C. 20240
I. Introduction I I
1 their promise of riches have been a constant challenge to the scientist, the en- gineer, the entrepreneur and, indeed, the entire petroleum industry. The shortage of oil during World War I provided a stimulus for investors to try to bring this resource to the point of commercial utilization. By the early 1920's ownership of the land had been complicated by the terms of the Mineral Leasing Act of 1920, which changed the method by which the lands could be alienated. indication that the processes then under consideration were technically or econom- I ically attractive, and the establishment of an oil shale industry did not occur at that time. Subsequently, the discoveries of very large, low cost reserves of oil in I East Texas delayed the possible development of the resource for many years.
The immense size of the oil shale deposits of Colorado, Utah, and Wyoming with
In addition there was no I
Legal problems associated with title to the lands have been an integral part of the history of the oil shale deposits. Concern over the disputes about ownership led to the withdrawal of the lands in 1930 for oil shale leasing. The withdrawal
t
I has continued to the present except for three test leases which were offered in [ December 1968. In 1964, the Department of the Interior instituted some test cases
against the pre-1920 claims which are still under consideration. Other actions were taken to test the validity of post-1920 claims and as a result, the Department of the Interior has made great strides in resolving the title clearance issues. Their resolution is indispensable to the orderly development of the resource.
11. The Need for Synth.etics
A s shown in Table I, demand for energy is expected to continue to rise, as it 1 has in the past, so that BTU consumption in the U.S. may increase about 260 percent 1 between 1968 and the year 2000. In absolute terms this is an increase in ,demand of
1 an oil equivalent of 11.0 billion to 28.7 billion barrels per year. I the form of liquid fuels is expected to increase about 190 percent over this same
period or an increase of from 4.9 billion barrels in 1968 to 9.6 billion barrels in 2000. Most of the demand for petroleum will continue to be used in the transpor- tation sector (autos, trucks, buses, airplanes); this sector is dominated by liquid fuels which supplied over 95 percent of the energy consumed in 1968.
These predictions were made during a time when, while there was an awareness that air pollution and other environmental controls could have an impact on patterns of energy consumption, the potential magnitude of the new environmental standards
' could not be factored into the projections. For example, recent indications that ' leaded gasoline may no longer be an acceptable fuel have opened up new requirements and opportunities for meeting the demands of the transportation sector. gasoline can be produced using present technology but this requires a higher percent- age of aromatics and isoparaffins if octane ratings are to be maintained. any wide-spread demand for lead-free gasoline would require that the petroleum industry install an enormous amount of additional processing units, particularly for reforming and alkylation. The extra costs of lead-free gasoline have been estimated to be 2 cents per gallon or a total cost of 2 billion dollars a year in the U . S .
Energy use in
Lead-free
To meet !
11 Mineral Resources Research Advisor, Assistant Secretary of Mineral Resources - Office
\

- 88 -
The need t o t o o l up t o produce modif ied d e s i g n s of engines and f u e l s could induce i n d u s t r y t o l o o k s e r i o u s l y a t o t h e r automotive power p l a n t s such a s gas t u r b i n e s , steam e n g i n e s , Nankel e n g i n e s , combined g a s o l i n e - n a t u r a l gas engines o r e l e c t r i c v e h i c l e s .
Environmental c o n s i d e r a t i o n s a r e r a p i d l y c r e a t i n g a l a r g e new demand f o r a l o w s u l f u r r e s i d u a l o i l t o be used a t e l e c t r i c g e n e r a t i n g s t a t i o n s and i n d u s t r i a l
f o r s u l f u r oxide emiss ions . I n PAD D i s t r i c t I, where under p r e s e n t o i l import reg- u l a t i o n s , u n l i m i t e d amounts of r e s i d u a l o i l impor ts a r e p e r m i t t e d , imported low s u l f u r r e s i d u a l has a l r e a d y r e p l a c e d s i g n i f i c a n t amounts o f h i g h s u l f u r c o a l . Recent ly , approval was g i v e n f o r i m p o r t a t i o n of low s u l f u r r e s i d u a l o i l i n t o Chicago. I f o i l import r e g u l a t i o n s a r e changed ( s p e c i f i c recommendations f o r change have been made t o t h e P r e s i d e n t by a C a b i n e t Level Study Group) t h i s t r e n d could be g r e a t l y a c c e l e r a t e d .
s t i l l t o come, on t o t a l l i q u i d f u e l demand are s t i l l t o o r e c e n t t o permi t modi f i - c a t i o n a t t h j s t ime of t h e p r o j e c t i o n s shown i n Table I. However, t h e e f f e c t s of t h e s e and o t h e r changes caused by t h e e s t a b l i s h m e n t of f u t u r e environmental s t a n - d a r d s w i l l a f f e c t t h e p a t t e r n s of demand and supply. On t h e o t h e r hand, a l l t h e f u e l r e s o u r c e s a t our d i s p o s a l w i l l have t o be used i n some form i f t h e tremendous demand f o r energy t h a t has been p r e d i c t e d a c t u a l l y occurs . The f u e l forms may have t o be modi f ied t o meet o t h e r s t a n d a r d s p laced on them but t h e t o t a l energy demand could n o t be met i f o i l (or h e a t u n i t s d e r i v e d from it) were n o t used i n about t h e q u a n t i t i e s shown i n Table 1.
they can compete economica l ly w i t h o t h e r energy s o u r c e s o r wi th c rude petroleum under t h e p u b l i c p o l i c i e s t h a t p r e v a i l a t any given t ' i m e . e n t e r t h e market w i l l o b v i o u s l y depend on how much crude o i l i s found. This i n t u r n i s a f u n c t i o n of t h e o i l impor t program t h a t e v e n t u a l l y emerges, t h e i n c e n t i v e f o r investment i n e x p l o r a t i o n , and t h e s i z e of t h e Alaskan d i s c o v e r y coupled wi th t h e c o s t of d e l i v e r i n g t h a t c rude o i l t o markets . A s shown i n F i g u r e 1, t h e d e c l i n i n g r e s e r v e s t o product ion r a t i o t h a t s t a r t e d i n t h e e a r l y 1 9 6 0 ' s i s expec ted t o con- t i n u e and t h i s should p r o v i d e an i n c e n t i v e f o r t h e o i l i n d u s t r y t o look t o o t h e r s o u r c e s o f supply.
111. O i l Shale Development--Non-Technologic F a c t o r s
' p l a n t s . T h i s f u e l would r e p l a c e c o a l which could n o t meet a i r p o l l u t i o n s tandards
A s p r e v i o u s l y n o t e d , t h e combined e f f e c t s of t h e s e two developments o r o t h e r s
S y n t h e t i c s , whether f rom o i l s h a l e , t a r sands o r c o a l , w i l l o n l y be used when
The a b i l i t y of s y n t h e t i c s t o
The development o f the o i l s h a l e r e s o u r c e i s dependent on t h e e x i s t e n c e of a t e c h n i c a l l y f e a s i b l e p r o c e s s t h a t i s economic under t h e c o n d i t i o n s p r e v a i l i n g t h a t de te rmine t h e p r i c e of c rude o i l . The major n o n - t e c h n i c a l f a c t o r s t h a t a f f e c t t h e p r i c e of c r u d e o i l w i t h which s h a l e o i l would compete a r e t h e o i l import program (how much can be imported and under what c o n d i t i o n s ) , t h e d e p l e t i o n al lowance f o r o i l , s t a t e p r o r a t i o n i n g p r a c t i c e s , and F e d e r a l l e a s i n g p o l i c i e s bo th on-shore and on t h e Outer C o n t i n e n t a l S h e l f - - p a r t i c u l a r l y new s t r i n g e n t s a f e t y r e g u l a t i o n s which may i n c r e a s e c o s t s .
s h a l e p r o c e s s i n g becomes commercial a r e t h e r a t e a t which t h e clouded t i t l e s on m o s t of the p u b l i c l y owned l a n d s can be removed, any m o d i f i c a t i o n s o f t h e terms of t h e Minera l Leas ing A c t of 1920 under which t h e o i l s h a l e l a n d s are l e a s e d by t h e Government, which of t h e d i f f e r e n t b idding procedures t h e Government e lects t o u s e , and t h e t e r m s and p r o v i s i o n s of t h e l e a s e . C e r t a i n t y p e s of s h a l e d e p o s i t s are almost e n t i r e l y i n Government ownership. I f a technology i s developed f o r u s i n g them t h a t i s more economic t h a n f o r t h e d e p o s i t s i n p r i v a t e hands, t h e n t h e Govem- ment would c o n t r o l e n t i r e l y by i t s l e a s e o f f e r i n g s t h e r a t e and t i m e when an o i l s h a l e i n d u s t r y would emerge.
d e t e r an o i l s h a l e development , t h e l a r g e c a p i t a l requi rements t o a t t a i n economies of scale w i l l l i m i t t h e number of p o s s i b l e p a r t i c i p a n t s i n t h e i n d u s t r y , and t h e i n s t i t u t i o n a l p r a c t i c e s of t h e o i l i n d u s t r y w i l l make i t d i f f i c u l t f o r t h o s e n o t
Other impor tan t f a c t o r s t h a t w i l l a f f e c t t h e t i m i n g and t h e ra te a t which o i l
In a d d i t i o n , a c t i o n s t a k e n by s t a t e and l o c a l governments could e i t h e r h e l p o r
1

- 89 -
a l r e a d y i n t h e o i l b u s i n e s s t o e n t e r an o i l s h a l e i n d u s t r y . Moreover, t h e r e l a t i v e c o s t s , a s w e l l a s o t h e r f a c t o r s , of producing s y n t h e t i c s from o i l s h a l e compared t o '
" c o a l w i l l a l s o be of importance i n de te rmining t h e o n s e t of an o i l s h a l e i n d u s t r y .
I V . S t a t u s of O i l Sha le Technology I
There a r e b a s i c a l l y two ways t o produce a c rude s h a l e o i l from o i l s h a l e . I n , t h e f i r s t , t h e o i l s h a l e i s mined and then r e t o r t e d where, by t h e a p p l i c a t i o n of h e a t ,
t h e c rude s h a l e o i l i s d i s t i l l e d from t h e o i l s h a l e . In t h e second, w e l l s are d r i l l e d from t h e s u r f a c e t o t h e o i l s h a l e d e p o s i t , t h e p e r m e a b i l i t y of t h e o i l s h a l e i s i n - c reased by some method, and t h e s h a l e o i l d i s t i l l e d from t h e d e p o s i t by an i n s i t u a p p l i c a t i o n o f h e a t .
, 1 . Mining
Underground mining, u s i n g t h e room and p i l l a r method, was e x t e n s i v e l y i n v e s t i - I gated by t h e Bureau of Mines and Union O i l Company d u r i n g t h e 1950's and by t h e Colony , Group i n t h e 1960 ' s . ' t h e 7O-foot t h i c k r ichMahognanyledge d e p o s i t which i s found i n many p a r t s of t h e
These experiments c o n c e n t r a t e d on developing methods t o e x t r a c t
Piceance Basin i n Colorado. F e a s i b l e methods f o r underground mining have been demon- s t r a t e d a l though t h e r e a r e s t i l l p o t e n t i a l s f o r f u r t h e r c o s t r e d u c t i o n .
Open p i t mining of o i l s h a l e should p r e s e n t no problems t h a t have n o t been ' solved i n mining f o r o t h e r m i n e r a l r e s o u r c e s by t h i s method. However, t h e r e has , been no exper imenta l t e s t i n g of open p i t mining i n t h e o i l s h a l e r e s o u r c e . The c o s t s I a s s o c i a t e d w i t h t h i s method of mining w i l l depend on t h e t h i c k n e s s and grade of s h a l e , and on the g e o l o g i c c o n d i t i o n s - - t h e t h i c k n e s s of t h e overburden and i t s p h y s i c a l
c h a r a c t e r i s t i c s . It h a s been sugges ted t h a t a p p r e c i a b l y lower c o s t s than t h o s e a s s o c i a t e d w i t h underground mining o p e r a t i o n s can be a n t i c i p a t e d i n l o c a t i o n s where a r i c h d e p o s i t of s h a l e o u t c r o p s t o t h e s u r f a c e . I n such a c a s e , t h e r e would be l i t t l e investment r e q u i r e d b e f o r e commercial amounts of s h a l e could be e x t r a c t e d and used and c o s t s should be low.
2 . R e t o r t i n g
I n t h e r e t o r t i n g of mined s h a l e a l a r g e number of p r o c e s s e s have been proposed, 1' but in t h e l a s t decade only t h r e e have been t e s t e d e x t e n s i v e l y enough t o be con-
I The Bureau of Mines and Union O i l Company r e t o r t s , bo th of which a r e i n t e r n a l -
s i d e r e d f o r commercial development a t t h i s t i m e . These a r e t h e Bureau of Mines gas combustion r e t o r t , t h e Union O i l Company r e t o r t and O i l Shale Corp. , (TOSCO) process .
combustion t y p e s , a r e based on s imi la r p r o c e s s p r i n c i p l e s wi th t h e major d i f f e r e n c e b e i n g t h e d i r e c t i o n of f low of t h e s h a l e and a i r . The TOSCO p r o c e s s c o n s i s t s of a r e t o r t i n g k i l n i n which f i n e l y c rushed o i l s h a l e i s h e a t e d t o r e t o r t i n g tempera ture by h e a t exchange w i t h h o t ceramic b a l l s h e a t e d i n a n o t h e r v e s s e l . I t i s claimed t h a t more s h a l e o i l i s recovered p e r t o n of o i l s h a l e t r e a t e d and tha t t h e s h a l e o i l i s of b e t t e r q u a l i t y than t h a t produced i n t h e r e t o r t s u s i n g d i r e c t h e a t i n g and a l a r g e r s i z e d o i l s h a l e f e e d . However, t h e economics of t h e product ion of s h a l e o i l e s t i - 1 mated i n t h i s paper a r e based on r e s u l t s ob ta ined i n t h e Bureau of Mines gas com- b u s t i o n r e t o r t s i n c e i n s u f f i c i e n t p u b l i s h e d d a t a were a v a i l a b l e f o r t h e o t h e r two p r o c e s s e s t o make e n g i n e e r i n g estimates of c o s t s o f s h a l e o i l produced by them.
I
3 . In S i t u R e t o r t i n g
I n s i t u r e t o r t i n g of s h a l e u s i n g non-nuclear t e c h n i q u e s f o r i n c r e a s i n g t h e 'I p e r m e a b i l i t y of t h e o i l s h a l e has been t e s t e d by s e v e r a l companies and by t h e Bureau
of Mines. Methods used i n r e c e n t exper iments by t h e Bureau of Mines t o i n c r e a s e t h e p e r m e a b i l i t y of t h e o i l s h a l e i n c l u d e d e l e c t r o l i n k i n g , h y d r a u l i c f r a c t u r i n g and
1 e x p l o s i v e f r a c t u r i n g . E l e c t r o l i n k i n g fol lowed by h y d r a u l i c f r a c t u r i n g d i d n o t i n - c r e a s e p e r m e a b i l i t y a p p r e c i a b l y . Explos ive f r a c t u r i n g f o l l o w i n g h y d r a u l i c f r a c t u r i n g
\

- 9 0 -
improved t h e p e r m e a b i l i t y by a f a c t o r of 5 . I n a s e r i e s of f i e l d t e s t s , 11 new w e l l s were d r i l l e d i n an a r e a where 4 p r e v i o u s w e l l s had been d r i l l e d . i'h? c e n t e r well was i g n i t e d i n an a t tempt t o r e t o r t a 20- foot t h i c k (22 g a l l o n s p e r t o n ) s e c t i o n of t h e o i l s h a l e l o c a t e d 68 t o 88 f e e t below t h e s u r f a c e . A f t e r s i x weeks of o p e r a t i o n , t h e p r o c e s s produced 190 b a r r e l s of a medium v i s c o s i t y 10x9 pour p o i n t s h a l e o i l . Ls!.~.r t e s t s of t h e d e p o s i t i n d i c a t e d t h a t on ly a 5- foot s e c t i o n of t h e 2G-foot sha1.e bed had been r e t o r t e d . Although t h e r e remain s e v e r a l impor tan t unsolved.problerns , such as b e t t e r u t i l i z a t i o n o f t h e s h a l e , improved c o n t r o l of t h e combustion f r o n t , and t h e u s e o f wider spaced w e l l s w i t h r e a s o n a b l e p r e s s u r e drop , t h e s e i n s i t u t e s t s have demonstrated a much h i g h e r d e g r e e of t e c h n i c a l f e a s i b i l i t y f o r t h e p r o c e s s than had p r e v i o u s l y been demonst ra ted .
w i t h broken o i l s h a l e which c o u l d then be r e t o r t e d i n p l a c e , has been under s e r i o u s c o n s i d e r a t i o n f o r over 10 y e a r s i n a program t o be sponsored j o i n t l y by i n d u s t r y and Government.
E x t e n s i v e p r e l i m i n a r y e n g i n e e r i n g s t u d i e s have been made t o estimate (1) t h e s i z e of t h e chimney from a g i v e n s i z e d d e v i c e d e t o n a t e d i n o i l s h a l e , (2) t h e s i z e d i s t r i b u t i o n of t h e broken s h a l e , and (3) t h e amount of s h a l e o i l t h a t would be r e - covered from a s i n g l e chimney.
broken rock c o n t a i n i n g t h e wide s i z e d i s t r i b u t i o n t h a t might resu1.t i n a n u c l e a r made chimney, a 175-ton r e t o r t w a s c o n s t r u c t e d t o s i m u l a t e t h o s e c o n d i t i o n s . The r e to r t was f i l l e d w i t h o i l s h a l e r a n g i n g i n s i z e from f i n e s t o one l a r g e p i e c e weighing 7500 pounds. I n a s i n g l e 24-day experiment , an o i l y i e l d of approximate ly 60% of t h e F i s c h e r a s s a y was o b t a i n e d . Operat ion of t h e r e t o r t was smooth w i t h uniform temp- e r a t u r e d i s t r i b u t i o n a c r o s s t h e bed and wi th low p r e s s u r e d r o p . The c h a r a c t e r i s t i c s of t h e s h a l e o i l were a l i t t l e b e t t e r than t h o s e o b t a i n e d from above-ground r e t o r t i n g i n t h e gas combustion r e t o r t having a somewhat lower pour p o i n t and v i s c o s i t y and a lower n i t r o g e n c o n t e n t .
A d d i t i o n a l t e s t s w i l l be r e q u i r e d t o f i r m up what was l e a r n e d i n t h i s s i n g l e experiment b u t t h e r e is e v e r y i n d i c a t i o n t h a t h i g h e r r e c o v e r i e s and b e t t e r q u a l i t y of product can be produced when t h e optimum o p e r a t i n g c o n d i t i o n s a r e e s t a b l i s h e d .
V . The Economics of t h e O i l Shale Product ion
The u s e of a n u c l e a r d e v i c e , exploded underground t o c r e a t e a chimney f i l l e d
To determine t h e amount o f s h a l e o i l t h a t could be recovered from a mass of
I n t h e Department o f t h e I n t e r i o r r e p o r t on o i l s h a l e i s s u e d i n May 1968, L/ s h a l e o i l p roduct ion w a s e s t i m a t e d f o r 5 d i f f e r e n t mining systems each u s i n g (1) a 45- foot d iameter r e t o r t , ( 2 ) a 60- foot d iameter r e t o r t , and (3) a second g e n e r a t i o n r e t o r t u s i n g improved technology. The c a p i t a l inves tment , annual o p e r a t i n g c o s t s and c o s t p e r b a r r e l f o r e a c h of t h e s e 15 c o n d i t i o n s a r e shown on Table 2 .
r e s o u r c e t h e c o s t p e r b a r r e l ( a f t e r a 61 c e n t s c r e d i t f o r by-products) i s shown i n F i g u r e 2 f o r 6 sets of c o n d i t i o n s . The two p l a n t s f o r 1972 were i d e n t i c a l except f o r o i l s h a l e q u a l i t y . I n c r e a s i n g t h e q u a l i t y of t h a t s h a l e from 30 t o 42 g a l l o n s p e r t o n decreased c o s t s 72 c e n t s p e r b a r r e l . The 1976 c a s e , i n a d d i t i o n t o u s i n g a l a r g e r d i a m e t e r r e t o r t t h a n was used f o r t h e 1972 c a s e , compared t h e e f f e c t of open p i t t o room and p i l l a r mining. It a l s o t e s t e d t h e e f f e c t of i n c r e a s i n g p l a n t s i z e by f o u r f o l d . A n i n c r e a s e from 62,000 t o 250,000 b a r r e l s p e r day d e c r e a s e d c o s t s 27 c e n t s p e r b a r r e l .
a f f e c t t h e economics have o c c u r r e d . These are (1) t h e by-product c r e d i t of 6 1 c e n t s p e r b a r r e l - i s b e l i e v e d t o b e t o o high and a more realistic v a l u e i s probably 41 c e n t s p e r b a r r e l f o r a l l c a s e s e x c e p t t h e second g e n e r a t i o n p l a n t where 7 7 c e n t s i s used i n t h e s e new c a l c u l a t i o n s , (2) c a p i t a l and o p e r a t i n g c o s t s o f new p l a n t s have
Using a 1 2 p e r c e n t d i s c o u n t e d c a s h f low and w i t h no v a l u e ass igned t o t h e s h a l e
S ince t h e s e c a l c u l a t i o n s were made, f o u r impor tan t f a c t o r s t h a t s i g n i f i c a n t l y
- I/ P r o s p e c t s f o r O i l Sha le Development--Colorado, Utah, and Wyoming, Department of t h e I n t e r i o r , May 1968

- 91 -
i nc reased s i g n i f i c a n t l y over t h e 1966 c o s t s used i n t h e e a r l i e r r e p o r t , (3) t h e p o i n t a t which the d e p l e t i o n allowance i s a p p l i e d h a s been changed by law from 15 percen t on t h e o i l sha l e t o 15 pe rcen t on t h e c rude s h a l e o i l , and ( 4 ) t h e v a l u e of t h e semi- r e f i n e d s h a l e o i l i n Colorado has inc reased about 25 c e n t s pe r b a r r e l .
Table 3 compares t h e 1966 and 1969 c o n d i t i o n s f o r fou r d i f f e r e n t types of r e t o r t s and mining systems. C a p i t a l investment c o s t s i nc reased about 10 pe rcen t du r ing t h i s pe r iod . Annual o p e r a t i n g c o s t s i nc reased from a low of 1 3 percen t f o r t h e improved f i r s t gene ra t ion r e t o r t and improved room and p i l l a r mining system (case 3) t o a high of 25 percen t f o r t h e f i r s t gene ra t ion r e t o r t w i t h conven t iona l room and p i l l a r mining (case 1)
The decreased va lue a s s igned t o by-product c r e d i t s of 41 c e n t s i n t h e 1969 s tudy compared t o 61 c e n t s ass igned i n 1966 was more than balanced by t h e inc reased va lue of t h e semi- ref ined c rude o i l i n Colorado. The n e t market v a l u e of t h e prod- u c t s r e s u l t e d i n an i n c r e a s e of 5 c e n t s p e r b a r r e l t o $3.74 . On t h e o t h e r hand, even a f t e r t h e t a x b e n e f i t s t h a t acc rue from changing t h e p o i n t a t which t h e d e p l e t i o n allowance may be c r e d i t e d , and t h i s i s approximate ly 10 c e n t s p e r b a r r e l , t h e i n - c r eased c a p i t a l and o p e r a t i n g c o s t s r a i s e d t h e c o s t of producing semi - re f ined crude o i l from a low of 1 2 c e n t s (case 3 ) t o a h igh of 38 c e n t s p e r b a r r e l ( case 1). A s a r e s u l t , t h e d i scoun t r a t e ( a t z e r o r e source v a l u e ) t h a t equa te s cash flow t o c o s t dropped from 13 t o 9 pe rcen t f o r c a s e 1 and from 22 t o 20 percen t f o r ca se 4 with in t e rmed ia t e v a l u e s f o r c a s e s 2 and 3 .
i n t h e 1968 o i l s h a l e r e p o r t . For t h e most f avorab le c a s e , i . e . , n u c l e a r i n s i t u wi th a 7 0 percen t recovery e f f i c i e n c y of t h e o i l and a i r p r e s s u r e f o r r e t o r t i n g a t 50 p . s . i . , c o s t s were e s t ima ted a t $2.98 pe r b a r r e l of s h a l e o i l . The 1969 c o s t s i n - c r eased 45 c e n t s f o r a t o t a l c o s t of $3.43 p e r b a r r e l . Th i s is a l a r g e r i n c r e a s e than f o r any of t h e cases shown i n Table 3 , and r e s u l t s i n p a r t from t h e method by which t h e d e p l e t i o n allowance was a p p l i e d i n t h e 1966 e s t i m a t e . S ince no o i l sha l e i s mined du r ing i n s i t u r e t o r t i n g it was no t p o s s i b l e t o t a k e a 15 percen t d e p l e t i o n on t h e o i l s h a l e . A s a r e s u l t , i t was taken on t h e s h a l e o i l . Consequent ly , i n t h e 1969 e s t i m a t e t h e r e was no a d d i t i o n a l r e d u c t i o n a s a r e s u l t of t h e change i n deple- t i o n allowance from o i l s h a l e t o s h a l e o i l .
The 1966 e s t i m a t e inc luded c o s t s f o r p reven t ion of a i r and w a t e r p o l l u t i o n from both t h e r e t o r t i n g and r e f i n i n g o p e r a t i o n s . It a l s o inc luded c o s t s f o r purchase of land and f o r o t h e r c o s t s involved i n s t o r i n g s p e n t s h a l e i n a manner which would p re - ven t air p o l l u t i o n from t h e d r i e d spent s h a l e and water p o l l u t i o n from t h e l each ing of t h e spent s h a l e . However, t h e c o s t s d i d n o t i nvo lve r e p l a c i n g as much of t h e spent s h a l e a s p o s s i b l e i n e i t h e r underground o r open p i t mines. While such c o s t s w i l l va ry wide ly from l e a s e t o l e a s e depending on o t h e r f a c t o r s t h a t de te rmine p l a n t l oca - t i o n w i t h r e s p e c t t o t h e mine (water a v a i l a b i l i t y , a c c e s s t o t h e p r o p e r t y , s u i t a b l e a r e a s f o r t h e ba lance of was te d i s p o s a l , r e l a t i v e e l e v a t i o n of t h e p l a n t and mine) an average va lue of about 20 c e n t s p e r b a r r e l has been e s t ima ted over p rev ious e s t i - mates f o r waste d i s p o s a l .
Another l i m i t a t i o n of t h e s e e s t i m a t e s (both t h e 1966 and t h e 1969) i s t h a t t hey r e p r e s e n t average c o n d i t i o n s and cannot r e f l e c t e i t h e r t h e lower o r h i g h e r c o s t s t h a t may be a s s o c i a t e d w i t h geo log ic c o n d i t i o n s t h a t d i f f e r from t h e ave rage . A l l new mining v e n t u r e s a t tempt t o use t h e h i g h e s t g rade d e p o s i t s and t h e most f avorab le geo log ic c o n d i t i o n s f i r s t i n o r d e r t o make t h e economics of t h e f i r s t p l a n t s more f a v o r a b l e . It has been sugges ted t h a t i f c o n d i t i o n s p a r t i c u l a r l y f a v o r a b l e t o open p i t mining could be found f o r t h e t h i c k d e p o s i t s t h a t c o n t a i n good q u a l i t y s h a l e t h a t much lower c o s t s t han those i n d i c a t e d above might be a t t a i n a b l e . Mining c a p i t a l and o p e r a t i n g c o s t s f o r ca se 1 r e p r e s e n t about $1.25 p e r b a r r e l of a t o t a l c o s t of about $4.00. Thus, m a t e r i a l r e d u c t i o n of t h e mining c o s t , f o r example, by 5 0 per - c e n t would have an impor tan t and p o s s i b l y c o n t r o l l i n g impact on t h e economics of s h a l e o i l p roduc t ion . I f t h i c k beds of s h a l e t h a t outcropped a t t h e s u r f a c e could be l o c a t e d , so t h a t ve ry sma l l head-end c o s t s ( r e q u i r i n g l i t t l e overburden t o be removed) before commercial p roduc t ion of o i l s h a l e were p o s s i b l e , min ing c o s t reduc- t i o n s of t h e o r d e r mentioned may be a t t a i n a b l e .
I n s i t u r e t o r t i n g c o s t s f o r 1966 f o r bo th n u c l e a r and conven t iona l were shown

- 9 2 -
As mentioned above, o t h e r technology about which t h e Department of t he I n t e r i o r had i n s u f f i c i e n t i n fo rma t ion t o make c o s t e s t i m a t e s s i m i l a r t o those made f o r t h e gas combustion r e t o r t t e s t e d by t h e Bureau of Mines might i n d i c a t e product ion of s h a l e o i l a t c o s t s lower than t h o s e shown. The absence of commercial developments on privately-owned l a n d , combined wi th t h e weak b i d s r ece ived on t h e t h r e e t r a c t s o f f e r e d by t h e Department i n December of 1968, would appear t o i n d i c a t e t h a t t h i s o t h e r technology i s probably not much more advanced than t h e margina l technology of t h e g a s combustion r e t o r t .
F i n a l l y , i n u s i n g t h e s e c o s t e s t i m a t e s i t should be remembered t h a t , wh i l e they a r e be l ieved t o be a c c u r a t e wi th in 10 p e r c e n t , t h e r e i s no c e r t a i n t y t h a t they a r e t h i s accu ra t e . Even a 10 pe rcen t e r r o r i n t r o d u c e s a p o s s i b l e 2 40 c e n t s per b a r r e l e r r o r which would r e p r e s e n t a change i n t h e D.C.F. from 9 pe rcen t t o over 15 pe rcen t f o r case 1. Obvious ly , t h e v a r i a t i o n s of a c o s t eng inee r ing e s t i m a t e f o r a non-ex i s t en t technology might be even g r e a t e r , and could make t h e d i f f e r e n c e between a ve ry p r o f i t a b l e o r a v e r y marg ina l o p e r a t i o n .
V I . Conclusions
In t h e pas t two y e a r s a d d i t i o n a l and promising in fo rma t ion has been developed wi th r e s p e c t t o t h e i n s i t u ( n u c l e a r and non-nuc lea r ) r e t o r t i n g of o i l s h a l e . In non-nuclear i n s i t u r e t o r t i n g , methods t o i n c r e a s e apprec i ab ly t h e pe rmeab i l i t y of t h e o i l s h a l e have been demons t r a t ed . Also proven i n a r e t o r t i n g experiment were (1) a combustion zone can be e s t a b l i s h e d i n f r a c t u r i n g o i l s h a l e , ( 2 ) t h i s zone can be moved through s h a l e by a i r i n j e c t i o n , (3) p e r m e a b i l i t y does not dec rease dur ing r e t o r t i n g ( a t t h e sha l low d e p t h s t e s t e d ) , and ( 4 ) recovery of t h e s h a l e o i l p r e s e n t s no s p e c i a l problems.
In nuc lea r i n s i t u r e t o r t i n g , t he above-ground p rocess ing of a s imula ted n u c l e a r chimney i n d i c a t e d t h a t under these c o n d i t i o n s good c o n t r o l of t h e combustion f r o n t could be achieved and t h a t even the l a r g e s t p i e c e s of o i l s h a l e could be r e - t o r t e d s a t i s f a c t o r i l y . No o t h e r new exper imenta l d a t a have been publ i shed du r ing t h e p a s t two years t o e s t a b l i s h t h e f e a s i b i l i t y o f t h e n u c l e a r i n s i t u r e t o r t i n g p r o c e s s .
based on t h e assumptions t h a t t h e new exper iments performed i n the p a s t two yea r s would be s u c c e s s f u l . A s a r e s u l t , i t was unnecessary t o r e c a l c u l a t e t h e s e e s t i m a t e s . A s a r e s u l t of i nc reased c a p i t a l c o s t s t h e most f a v o r a b l e i n s i t u case showed an i n c r e a s e of 45 c e n t s p e r b a r r e l between 1966 and 1969, but remained i n t h e competi- t i v e range wi th above-ground r e t o r t i n g .
The s i t u a t i o n wi th r e s p e c t t o above-ground r e t o r t i n g i n d i c a t e s t h a t , f o r t h e f o u r c a s e s w h i c h were r e c a l c u l a t e d , a l though a number of changes i n t h e assumptions must be made t o r e f l e c t 1969 c o n d i t i o n s , s h a l e o i l remains marg ina l ly compet i t ive a s i t d i d in 1966. improved p r o p r i e t a r y technology f o r e i t h e r mining o r r e t o r t i n g o r t he use of a l e a s e wi th ve ry f avorab le g e o l o g i c c o n d i t i o n s . of them, a f i r s t commercial o i l s h a l e p l a n t may look ve ry f i n a n c i a l l y a t t r a c t i v e .
E a r l i e r cos t e s t i m a t e s of bo th nuc lea r and non-nuclear i n s i t u r e t o r t i n g were
T h i s , however , ’does not c o n s i d e r t h e a v a i l a b i l i t y of any g r e a t l y
For any of t h e s e c o n d i t i o n s , o r combinations

- 9 3 - 4
t
Table 1
I
1 .
Energy Consumption by Sector, 1968 and 2000 Trillions of BTU
1968 2000 - Residential and Commercial 13,599 21,066
Industrial 19,348 32,594
Transportation 15,136 36,600
Electricity Generation 14,046 72,291
Miscellaneous and Unaccounted for 295
Bureau of Mines (1969) Estimate 62,424 162,551
------
Estimate Made in "Energy R h D and National Progress" (1963)
Estimate Made by Batelle Northwest (1969)
135,000
170,000.
\

- 9 4 -
10 W ? 4 U m E U 4 4 M d .rl m 10 W V 0
- & W 4 m 6 I 4 .rl 0
W 0
U 10 0 U
M ' d .rl U m U W a 0
I
.' N
I W z sl m Fl
I
cor- <? 40
P-r. m m . . 4 0
\o\D mP- 4 0 . .
\ D m
4 0 :09
P-rD NID
40 . .
P-rD
4 0
mP- . .
a m m m 4 4 . .
o m ? < N 4
w a a N . . 4 4
m w m m .. . 4 4
aP- m m . . 4 4
a - ? < N 4
4
m m d .N rl
N
m e mcu 4

m rD m
0 0 e m I n r .
In \D rD
rD
rl m
. I
m rD m d
m o r D w h l r .
N rD
rD rD m d
o\ rD
d m
I n 0 \ D a N r .
N UY
rD
m rD
rl
m rD
rl m
0 0 N e
m m 0. e
\D \D
rl m
4
I co co N 0
N
W
0 0 d e - N
In In
m e N N cu
4
d r. d N
N
m r.
N p1 rl
\D
N W 4 N N
rl
0 hl
'9 o m N
9 m o m N ,-I
co
N rD 4
"9 -? m e N N N
m r. r.
m d m m N cu 0
N
m rl
r- m
N m m Q\ 9 N m
rl
m m Cr) m
rl
-? co rl
OD m 4
\ d l m u .d U 0 d U m U rn h
P 1 m I
m m d
H n
m 1.1 m d
..d Y O m a o w 0
M e m *d e u o m 4 1 . 1 4 a l d 0" 2 m
- 95 -
U CI w
m U
u aI w w .rl 21
ki
W U 0 z v
U .rl W 0 h a
e .rl U
.rl 0 m a a m m a
,-4 0 c .rl
U In 0 0

- 96 -
Figure I - Trends in the reserve to production ratio 1945-1968
L-l 1575

- 97 -
c 0
0
- 4-
E .- t ul a3 t ul 0 0
0
0
3 0 0 0
0
a3 0, c 0 (z I
I I
.c
z
.c
t
0 0 rri
0 9 cu
0 0
0

- 98 -
COMPARATIVE ECONOMICS O F TAR SANDS CONVERSION PROCESSES
P a u l V. Roberts and R u s s e l l C. P h i l l i p s S t a n f o r d Research I n s t i t u t e
Menlo Park , C a l i f o r n i a 9 4 0 2 5
The t a r sands r e source i s t h e only s o l i d f u e l resource c u r r e n t l y be ing conver ted t o l i q u i d f u e l s i n North America on a l a r g e scale. A 4 5 , 0 0 0 B/CD syncrude p l a n t based on t a r sands is c u r r e n t l y i n o p e r a t i o n i n t h e Athabasca r eg ion Qf Albe r t a . The major s t e p s i n convers ion of t a r sand t o syncrude are (1) su r face mining of tar sands , ( 2 ) h o t water e x t r a c t i o n o f bitumen from mined t a r sands , and ( 3 ) upgrading o f bitumen by coking o r hydrov i sb reak ing fo l lowed by h y d r o t r e a t i n g o f d i s t i l l a t e s .
ven tu re have been ana lyzed . I t was found t h a t t a r sands mining c o s t s , bitumen recovery e f f i c i e n c i e s , cho ice of upgrading p rocess , p r i c e .of syncrude p r o d u c t , and r o y a l t y payments a l l s i g n i f i c a n t l y a f f e c t t h e d i scoun ted cash f low r a t e of r e t u r n from an i n t e g r a t e d ven tu re . R e s u l t s are p resen ted a t a l e v e l of 50 ,000 B/SD syncrude product ion and e f f e c t s of t h e f a c t o r s l i s t e d above are d iscussed . E f f e c t of changing t h e scale of o p e r a t i o n s i s a l s o d i scussed .
The economics of a combined t a r sands mining and conversion

- 99 -
AN EVALUATION OF TONNAGE OXYGEN PLANTS
Sidney Katell and Paul Wellman
Bureau of Mines U. S . Department of the Interior
Morgantown, West Virginia
SUMMARY
Tonnage oxygen plants have increased in size and are available today in the 100- to 1,400-ton-per-day range. The capital investment requirements and estimated selling price a re investigated in this study.
INTRODUCTION
Interest in the production of synthetic liquid and gaseous fuels has intensified so that several systems have reached the point where prototype plants are being installed o r a r e being considered for installation. In many of these systems high-purity oxygen is a require- ment, whether it be in the direct gasification of coal, oil, o r shale, o r for the production of hydrogen for the hydrogasification o r hydrogenation of such raw materials.
DISCUSSION
1 A previous paper explored the subject of oxygen plant costs; however, a major change
has occurred since then--the size of the oxygen plant that can be built today is much larger. The present study takes into account the capital investment requirements and the production costs of these larger units and updates the data contained in the earlier study.
The parameters of the present study a r e as follows: 1. Location of plant: Ohio Valley. 2 . Size of plant: 100 to 1,400 tons per day. 3 . Purity: 99.5 percent. 4. Pressure specification: atmospheric and 450 psig. 5. Process employed: low pressure cycle. 6 . Type of compressors: electric drive. 7. Cost of available power: $0.00675 per kilowatt-hour.
Figure 1 shows the relationship between power requirements and plant capacity for the two pressures set up as a parameter. Since the production process is the same, the dif- ference in the two curves is the power required to compress the oxygen to 450 psig discharge pressure.
Figure 2 presents the capital investment requirements for the plants ranging in size from 100 to 1,400 tons per day.
1 - / Katell, Sidney, and John H. Faber. Cost of Tonnage-Oxygen. BuMines Inf. Circ. 7939, 1960, 6 pp.

1 i
- 100 - Table 1 presents the method used in determining the cost of operation on an annual
basis for a 500-ton-per-day plant with the oxygen produced at a discharge pressure of 450 psig. The calculation is typical of the several made to establish the curves shown in figure 3 . A s noted direct labqr costs a re assumed a t $4 per hour, annual onstream time as 350 days per year, and depreciation at 15 years on a straight-line basis.
I
Using the discounted cash flow rate of return of 12 percent as a criterion for return on investment, the typical calplat ion is shown ip table 2 and the values obtained a re plotted in figure 4. 1

- 101 -
TABLE 1
Oxygen Plant 500 Tons Per Day
. Oxygen Compressed t o 450 PSIG
Operating Cost
Annual cost , dol lars
Direct costs: Power.. ..... .8,670 kwhrlhr x 8,400 hr /yr x $0.00675/kwhr Cooling water....135 M gal/hr x 8,400 hr /yr x
$0.020/M gal... ....................... Direct labor: 60 hr/day a t $4 per hour................. Supervision @ 15 percent................................ Plant maintenance @ 2 percent of investment.............
Operating supplies @ 20 percent of plant maintenance....
Total d i rec t cost.............................
Payroll overhead @ 25 percent of payroll........ ........
Indirect costs: 40 percent of labor, maintenance, and supplies ..........
Fixed costs: Taxes and insurance @ 2 percent of investment........... Depreciation @ 6.66 percent of investment...............
Total annual operating cost...................
Annual production = 500 x 350 = 175,000 tons
491,600
22 , 700 87 , 600 13,100 88,000 38 , 200 17,600
758,800
82,500
88,000 293,300
1,222,600
Cost, dol lars per ton of oxygen = 1,222,600 f 175,000 = $6.99

- 102 -
TABLE 2
Oxygen P lan t
Oxygen Compressed t o 450 PSIG 500 Tons Per Day
F i n a n c i a l Analysis, DCF a t 12 Percent
Discounted cash flow, n = 15 yea r s ( l i f e of p l a n t ) i = 1 2 pe rcen t pe r yea r
(1 + i>" - 1 i ( 1 + i)" P = R
P / R = 4.4733510.656826 = 6.81086
R = $4,400,000/6.81086 = $646,000
Net p r o f i t = R - Depreciat ion = $352,700 With Fede ra l Income Tax @ 50 pe rcen t , Gross p r o f i t = 2 x $352,700 = $705,400 Sales 5 Gross p r o f i t -& opera t ing c o s t = $1,928,000
S e l l i n g p r i c e , d o l l a r s per ton oxygen = $1,928,0001175,000 = $11.02
C a p i t a l investment = P = $4,400,000 S a l e s - 175,000 tpy x $11.02 per ton Operat ing c o s t
Fede ra l Income Tax at 50 percen t Gross p r o f i t
Net p r o f i t
Cash f low: Deprec ia t ion Net p r o f i t
T o t a l p o s i t i v e cash flow = R =
$1,92 8 , 000 1,222,600
705,4OO 352,700
352,700
293,300 352,700 646,000

- 103 -
1 1 1 1 1 1 l A-Discharge pressure - 0.5 Io 5 pslg camorerred
EDischarge pressure - 0.5 Io 5 psig - 99.5% 02 8oo - Io 450 ping - 99.5% 02
>
0 . r
- -
600 c . .. , : ' . .. - ' . y::., 2 -
3 - 0 w L1_
-
5 200 - -
z -
~ . . , . . ,
I I I I I I I 400 800 I . 200 0
!
FIGURE 2 . - Oxygen Plant. Capital Investment vs . Daily Production.

- 104 -
4 a 2
- &Low pressure - 0 5 t o 5 psig discharge compressed
- 6-Low pressure - 0 5 to 5 psig discharge - 99 5% 0 2
- - t 0 450 PSlg - 99 5% 02 -
I I I I I I I I I I I I I -
0 I
P
A I ' ' I I I I I I I I l l ' - -
&Low pressure - 0 5 to 5 0118 discharge. compressed
&Low pressure - 0 5 to 5 PSI^ discharge - 99 5% 02 to 450 pslg - 99 5% 02 -
- - - - - - - - - -
a -
-
- 6 1 1 1 1 1 1 1 1 1 1 1 1 l
-
0 200 400 600 800 1,000 1.200 1.400
FIGURE 4. - Oxygen Plant. Selling Price vs . Daily Production.