for personal use only · the company’s exposure to gold is via a 51% equity interest in horizon...
TRANSCRIPT

2019 ANNUAL REPORT
Panoramic Resources Lim
ited | 2019 Annual Report
For
per
sona
l use
onl
y

For
per
sona
l use
onl
y

2019 ANNUAL REPORT | PAGE 1
MISSION STATEMENT 2ABOUT US 2INVESTMENT PROPOSITION 3FY2019 SIGNIFICANT EVENTS 3LETTER FROM THE MANAGING DIRECTOR 4REVIEW OF OPERATIONS 6EXPLORATION 20VISION 22 DIRECTORS’ REPORT 23 CORPORATE GOVERNANCE STATEMENT 50 DIRECTORS’ DECLARATION 58 INDEPENDENT AUDITOR’S REPORT 59 AUDITOR’S INDEPENDENCE DECLARATION 60 FINANCIAL REPORT 65CONSOLIDATED INCOME STATEMENT 66 CONSOLIDATED STATEMENT OF COMPREHENSIVE INCOME 67 CONSOLIDATED BALANCE SHEET 68 CONSOLIDATED STATEMENT OF CHANGES IN EQUITY 69 CONSOLIDATED STATEMENT OF CASH FLOWS 71 NOTES TO THE CONSOLIDATED FINANCIAL STATEMENTS 72 ADDITIONAL SHAREHOLDER INFORMATION 125 SCHEDULE OF TENEMENTS 127 RESOURCES AND RESERVES 128 CORPORATE DIRECTORY BC
CONTENTS
2018 ANNUAL REPORT | PAGE 1
Competent PersonThe information in this report that relates to Mineral Resources, Ore Reserves and Exploration Results is based on information compiled by John Hicks. Mr Hicks is a member of the Australasian Institute of Mining and Metallurgy (AusIMM) and is a full-time employee and shareholder of Panoramic Resources Limited.
The aforementioned has sufficient experience that is relevant to the style of mineralisation and types of deposits under consideration and to the activity which he is undertaking to qualify as a Competent Person as defined in the Australasian Code for Report of Exploration Results, Mineral Resources and Ore Reserves (the JORC Code 2012 Edition). Mr Hicks consents to the inclusion in the report of the matters based on the information in the form and context in which it appears.
For
per
sona
l use
onl
y

PAGE 2 | 2019 ANNUAL REPORT
Panoramic Resources Limited (ASX code: PAN) is a Western Australian mining company formed in 2001 for the purpose of developing the Savannah Nickel Project in the East Kimberley. Panoramic successfully commissioned the $65 million Savannah Project in late 2004 and then in 2005 purchased and restarted the Lanfranchi Nickel Project, near Kambalda. In FY2014, the Company produced a record 22,256 tonnes contained nickel and produced 19,301 tonnes contained nickel in FY2015. The Lanfranchi and Savannah Projects were placed on care and maintenance in November 2015 and May 2016 respectively pending a sustained recovery in the nickel price.
After delivering an updated feasibility study on the Savannah Project in October 2017, securing an offtake customer and putting in place project financing in July 2018, the Company made the decision to restart operations at Savannah with first concentrate shipped from Wyndham in February 2019. The Lanfranchi Project was sold in December 2018 for a total cash consideration of $15.1 million, providing additional financial support for the re-commissioning of the Savannah Project.
Apart from the nickel, copper and cobalt inventory at Savannah the Company has exposure to platinum group metals (PGMs) and gold. The PGM Division consists of the Panton Project, located 60 kilometres south of the Savannah Project and the Thunder Bay North Project in Northern Ontario, Canada, which is in the process of being sold to Benton Resources for C$9 million.
The Company’s exposure to gold is via a 51% equity interest in Horizon Gold Limited (ASX Code: HRN). Horizon’s owns 100% of the Gum Creek Gold Project located near Wiluna in Western Australia. Gum Creek was spun out of Panoramic Resources in December 2016.
The Company’s vision is to again become a diversified mining company. The growth path includes developing existing resources, discovering new ore bodies, acquiring additional projects and is being led by an experienced exploration-to-production team with a proven track record.
MISSION STATEMENT
VisionBuilding a multi-commodity company producing base metals, battery metals and PGMs
CommitmentMaximise margins to deliver capital growth and dividends to our shareholders
ResultsA sustainable mining company
We strive to achieve excellence in all aspects of our business to provide long term capital growth and dividend returns to our shareholders, a safe and rewarding work environment for our employees, and opportunities and benefits to the people in the communities in which we operate.
ABOUT US
PAGE 2 | 2019 ANNUAL REPORT
For
per
sona
l use
onl
y

2019 ANNUAL REPORT | PAGE 3
INVESTMENT PROPOSITION
FY2019 SIGNIFICANT EVENTS
Investing in Panoramic gives shareholders exposure to:1. The electric vehicle battery thematic through nickel-copper-cobalt sulphide production from Savannah
2. Forecast lower operating costs per pound payable Ni and improved margins when Savannah Northramps up to full production due to higher nickel and cobalt grades and increased mining rates compared to the Savannah orebody
3. An eight-year mine life with excellent potential for mine life extension through exploration success
4. Capturing the recent rally in the nickel price and favourable price outlook going forward throughimproved revenue
5. A gold option through the 51% shareholding in Horizon Gold Limited (ASX:HRN)
6. PGM exposure through the 100% owned Panton PGM Project in the Kimberley
July 2018 - Decision to re-start Savannah Nickel-Copper-Cobalt sulphide Project
September 2018 - $40M Facility Agreement executed with Macquarie Bank
September 2018 - Recommissioned the Savannah mine, processing facility and associated infrastructure
September 2018 - Sale of Lanfranchi Nickel Mine to Black Mountain Metals for $15.1 million announced
December 2018 – Sale of Lanfranchi completed
February 2019 – First shipment of Savannah concentrates and receipt of first revenue
March 2019 - Placement raising $5 million together with a fully underwritten 1 for 13 pro-rata renounceable Entitlement Offer raising $14.8 million to provide additional funds to meet liquidity requirements under the financing facility with Macquarie Bank due to slow ramp-up of production from the Savannah remnant orebody and lower than forecast commodity prices
April 2019 - Appointment of Chief Operating Officer, Boyd Timler to oversee the operations at Savannah
June 2019 - Savannah FY2019 production of 2,484 tonnes of nickel, 1,474 tonnes of copper and 130 tonnes of cobalt in concentrate
July 2019 - Benton Resources Inc of Canada to acquire the Thunder Bay North PGM project for C$9 million
August 2019 - The Company reported sales revenue of $25.1 million for FY2019 and a Net Profit after Tax of $9.2 million due to the recommencement of the mining operations at Savannah and the resulting $19.2 million non-cash impairment charge reversal
September 2019 - Fully underwritten 2 for 11 pro-rata renounceable Entitlement Offer raising $28.2 million to provide funds primarily to pay back $20 million of the Macquarie Bank facility and provide additional working capital as Savannah transitions to the Savannah North orebody
2019 ANNUAL REPORT | PAGE 3
For
per
sona
l use
onl
y

PAGE 4 | 2019 ANNUAL REPORT
The small team in Perth and the new Savannah team worked tirelessly and under significant pressure to undertake major refurbishment works on the processing plant, the paste plant and other infrastructure and then re-commissioned the village, mine, process plant, paste plant, workshops, mobile fleet while employing approximately 250 new employees, most of whom had never worked at Savannah before, let alone in the Kimberley.
All of this was achieved in less than nine months with first concentrate from the recommissioned processing plant leaving Wyndham in mid-February 2019 and less than six months from when the formal decision to recommence operations was made. This was an outstanding effort and I am incredibly proud of what our team achieved in this very short period of time, with limited financial resources.
History has shown that the re-commissioning proved to be more challenging than we anticipated due to a combination of the following factors:
• an extremely tight labour market for the various disciplines we were seeking to employ;
• delayed employment of the +250 personnel required to operate the project;
• poor underground mobile equipment availability;
• underestimation of the amount of rehabilitation required in the Savannah mine;
• delayed commissioning of the paste plant and paste reticulation system;
• mining the Savannah remnant orebody out of sequence to make up for tonnage shortfalls in the early months, which adversely affected ground conditions; and
• extreme weather events which damaged infrastructure and diverted resources from production to repairs.
The combination of these factors resulted in ore production being below forecast for FY2019. In addition, nickel and cobalt prices during the first half of 2019 were well below what we forecast in the FY2019 Budget. This, combined with the below budget production, reduced revenue and resulted in a need to raise funds to provide additional working capital. This was achieved via a Placement and Entitlement Offer in March 2019 which was very well supported by existing shareholders and raised $22.4 million.
Following a review of the operations in March 2019, we made some significant changes, including engagement of a contractor to develop the twin decline to Savannah North and appointing a new Chief Operating Officer to oversee the Savannah operations.
LETTER FROM THE MANAGING DIRECTOR
Dear fellow Shareholders,
It has been an extremely busy year at Panoramic with the re-commissioning and ramp up of the Savannah nickel-copper-cobalt underground mine and processing plant being our sole focus.
For
per
sona
l use
onl
y

2019 ANNUAL REPORT | PAGE 5
We reported a significant improvement in performance in the June quarter which gave us confidence that the early teething problems were being addressed and resolved. We also recognised that the Savannah remnant orebody would continue to be difficult to mine and that producing ore to meet the forecast tonnages in the FY2020 Budget would be a challenge. In addition, access to the high-grade Savannah North ore had been delayed until late 2019, impacting forecast revenue. This resulted in Macquarie Bank, our project financier, requesting repayment of 50% of the debt, reducing our bank debt from $40 million to a modest $20 million. This required another equity raising undertaken in September 2019 via a 2 for 11 Entitlement Offer to raise $28.2 million, which again was well supported by shareholders.
We have been fortunate that the US$ nickel price has rallied strongly since mid-July 2019 due to the Indonesian Government announcing the re-instatement of the ban on export of unprocessed nickel laterite ore from 1 January 2020. This has been an unexpected bonus for Panoramic, coming at a time when the US/China Trade War has been playing havoc with metal markets. Also, the cobalt price has rallied from recent lows meaning our revenue per tonne of concentrate has increased significantly in recent months. In addition, Macquarie Bank rolled our A$ nickel hedge positions forward to match the revised loan repayment schedule (September 2020 – March 2022) meaning we are currently receiving 100% of the spot price for our nickel, copper and cobalt which significantly enhances our revenue in FY2020.
So after a tough start, there is light at the end of the tunnel. We are only a few months away from the first Savannah North ore and will be ramping up to full production from Savannah North by the middle of 2020. Savannah North is significantly better than the Savannah orebody that we mined continuously for 12 years. The nickel grade is on average 30% higher and the cobalt grade is double that of Savannah and the orebody can be mined at a faster rate resulting in forecast annual production of approximately 11,000 Ni, 6,000t Cu and 800t Co when Savannah North is at full production.
Savannah North will provide a bright future for Panoramic based on:
• operating safely;• achieving our production targets;• implementing new technologies to improve efficiencies; • controlling costs; and • extending the mine life through exploration success.
The Savannah Project’s economics will be enhanced as the nickel price continues to respond to the current tightness in supply/demand and should continue to be supported by the strong and growing demand for nickel from the electric vehicle revolution.
I would like to thank all the Panoramic staff for their hard work and dedication and welcome on board all our new employees. Our people are the future of this business and working together as a team you will make Panoramic a profitable mining company again.
I would also like to thank all our new and longer-term shareholders for their support of the two equity raisings that we undertook in 2019. Without your commitment and belief in the Savannah Project, Panoramic would be a different story.
On a personal note, after nearly 19 years with the Company I am moving on. I am incredibly proud of the business we have built since Panoramic (then called Sally Malay Mining) started in 2001 as a $3 million IPO with a small and unloved base metal deposit in the Kimberley called the Sally Malay Project. With a huge amount of hard work and dedication we took a “thought bubble” to a 20,000 tonne per year nickel producer with a market capitalisation exceeding $1.2 billion and 450 staff in less than seven years. We went on to produce nearly 200,000 tonnes of nickel and paid $114 million in fully franked dividends. We tried hard to diversify into other commodities (gold and PGMs) although with limited success, and then had to go through the difficult task of closing our two operating nickel mines due to the historically low nickel price to preserve the value of the nickel resources until the nickel price improved. We did this and now our staff and shareholders will benefit from the difficult decisions we made.
The Company is named after the road I grew up in as a child in Melbourne. I have very fond memories of Panoramic Road and even fonder memories of my 19 years here at Sally Malay/Panoramic.
Thank you to all the people who worked with me to make a difference. Best wishes for the future. Savannah North is a great orebody and Panoramic is a great company.
Yours sincerely,
Peter HaroldManaging Director
For
per
sona
l use
onl
y

PAGE 6 | 2019 ANNUAL REPORT
SAVANNAH NICKEL-COPPER-COBALT PROJECT
REVIEW OF OPERATIONS
Overview and HistoryThe Savannah Nickel-Copper-Cobalt Project is located 240km south of Kununurra in the East Kimberley region of Western Australia and consists of a number of nickel sulphide orebodies. The Project infrastructure includes an underground mine, 1.0 million tonne per annum processing plant, paste fill plant, a 180 room village, workshops, office accommodation, tailings and water storage facilities and other associated infrastructure. The Savannah Project was constructed in 2003 and commissioned in late 2004 initially sourcing ore from an open pit. After 18 months, the operations transitioned to underground mining.
Over an initial twelve-year period, Savannah milled 8.5 million tonnes at an average grade of 1.29% Ni, 0.65% Cu and 0.06% Co to produce 1.22 million tonnes of concentrate containing 94,600t Ni, 53,000t Cu and 5,000t Co. Savannah was placed onto care and maintenance in May 2016 due to the historically low nickel price.
In 2014, the Company discovered the Savannah North orebody and in 2016, the Company reported an updated Resource estimate of 175,100t Ni, 75,400t Cu and 12,700t Co metal contained.
In October 2017, the Company delivered the Updated Feasibility Study on mining and processing the remaining Savannah ore and the new Savannah North orebody.
The Updated Feasibility Study formed the basis for the restart of the Savannah Project which was formally approved by the Panoramic Board in July 2018, following completion of a new concentrate Offtake Agreement and debt financing facilities. First shipment of concentrate departed Wyndham Port in February 2019.
PAGE 6 | 2019 ANNUAL REPORT
For
per
sona
l use
onl
y

2019 ANNUAL REPORT | PAGE 7
Savannah Re-startThe Savannah nickel-copper-cobalt Project re-start required a number of activities to be undertaken.
Processing and Paste PlantsThe Processing and Paste Plants were refurbished by MACA Interquip between June 2018 and February 2019 and the Processing Plant was recommissioned in December 2018. The major refurbishment works undertaken included:
• Repair and/or replacement of corroded structural steel and painting throughout
• ROM orebin refurbishment and replacement of the grizzly • Refurbishment of the crusher• Refurbishment of the emergency stockpile bin and
conveyors • Installation or repairs to rubber lining in flotation cells. • Installation of new lifters and liners in the mill and
replacement of trunnion bearings• Refurbishment or replacement of most pumps• Thickener tanks refurbished • Electrical and communication upgrade including
replacement of existing PLCs• Major refurbishment of the filter press• New on-stream analyser
Commissioning of the paste plant was slower than planned due to the focus at the time being on recommissioning
the processing plant. The paste plant refurbishment was undertaken in January/February 2019.
Tailings Storage Facility Wall LiftA three metre wall lift was undertaken on the Tailing Storage Facility commencing in July 2018 and was completed in November 2018. This lift provides for another +3 years of storage capacity at the planned processing rates and paste fill usage.
Savannah North Ventilation Shaft Fresh Air Raise (FAR)Drilling of the 892m pilot hole for the 5 metre diameter raise bore hole commenced in August 2018 and reaming of the raise bore commenced in January 2019. Reaming progressed slowly due to poor ground conditions requiring the head to be lowered and cutters replaced numerous times. The raise bore diameter was reduced from 5 metres down to 4.5 metres and then further down to 4.1 metres to improve reaming performance through the poor ground conditions. As of 30 June 2019, the 4.1 metres diameter raise bore was up 122.4 metres, with 769.6 metres remaining. The raise bore hole is now scheduled for completion in the second quarter of 2020 and independent ventilation consultants have confirmed that a 4.1 metre diameter hole and other existing ventilation infrastructure will provide adequate ventilation for the current life of mine of the Savannah North orebody.
Figure 1 Savannah Location Map
For
per
sona
l use
onl
y

PAGE 8 | 2019 ANNUAL REPORT
Equipment RefurbishmentSignificant mobile equipment refurbishment was required prior to the commencement of mining in December 2018. Several of the planned activities were not undertaken due to a lack of available personnel over the 2018/19 Christmas period and hence some of this work was undertaken after mining recommenced, which adversely impacted equipment availability. To complement the existing fleet, the following pieces of new equipment were acquired during FY2019:
• Two new Epiroc MT65 underground haulage trucks (to complement the existing fleet of six 60 tonne trucks)
• Two new CAT 2900 loaders (one planned to replace an existing unit)
• Two new Volvo prime movers and eight concentrate trailers to allow owner operated concentrate haulage to Wyndham (previously undertaken by a contractor)
The two new CAT 2900 loaders were ordered and delivered to site in February 2019. Unfortunately, both units experienced operational issues which required remedial works by the supplier taking these units out of service for approximately one month.
PersonnelFollowing the decision to re-start operations, work commenced immediately on recruiting and onboarding the ~250 personnel required for the Project.
Following the decision to recommence mining, the labour market for experienced mining personnel became increasingly tight due to general competition in the mining sector. In particular, this included supervisors, jumbo and bogger operators, mining engineers and diesel fitters.
Solid progress has been made with recruiting and strategies are in place to enable the Company to secure the necessary workforce to achieve our operational requirements. This has included the use of alternate labour providers to temporarily fill some operator and trade roles and engaging additional senior technical and mining consultants to assist with planning and implementation.
There have been a number of changes within the senior management team at Savannah throughout the restart phase which has created further challenges. There are still some vacant senior positions remaining, however the Company is confident that it will attract the appropriately qualified personnel to fill these outstanding positions.
The continued strength in the mining sector in Western Australia, especially underground gold mining, will mean securing and retaining skilled, experienced personnel is to remain a challenge and the Company will need to implement strategies to ensure it can attract and retain personnel.
SafetyIn FY2019 which included the process plant refurbishment activities, the underground mine re-start and ramp up period, there were four Lost Time Injuries (LTIs) and the LTI Frequency Rate was 7.2 at 30 June 2019. There were five Disabling Injuries (DIs) for the period with a DIFR of 9 at 30 June 2019. While the injuries were of low severity in nature, more concerning was the frequency rates which are above the Western Australian Nickel Industry Average.
As part of the Savannah re-start planning, it was identified that the safety culture would need to be re-established and driven by senior management on site. Initially, safety activities
Image 1: Reamer Head for Savannah Ventilation Raise Bore
For
per
sona
l use
onl
y

2019 ANNUAL REPORT | PAGE 9
focused on re-establishing the safety systems and processes and then shifted to leadership training. The previously utilised hazard recognition system SHED (Safely Home Every Day) was re-introduced and the CCM (Critical Care Management) system was introduced to support the SHED system in identifying the top ten critical risk hazards across the work site.
Basis of Re-start The Savannah Project re-start was based on the Updated Savannah Feasibility Study (October 2017) which demonstrates the mining of the remaining Savannah orebody and Savannah North orebody will provide an initial mine life of approximately 8.3 years. The key physicals from the Updated Feasibility Study are summarised in Table 1.
Mining Re-start activities ramped-up between September to December 2018 from care and maintenance, with refurbishing the old Savannah levels in advance of mining the Savannah remnant orebody. The Savannah remnant Resources consist of over 2.0 million tonnes of material grading 1.39% Ni, 0.88% Cu and
0.07% Co. Concurrently, the primary capital development to access Savannah North with a twin decline from the bottom of the Savannah decline on the 1440 Level, which is 860 metres below surface, commenced in late 2018. As at 30 June 2019, the Savannah North twin decline was within 300 metres of the Savannah North orebody on the 1340 Level (960 metres form surface).
Operating metric October 2017 Updated Feasibility StudyMineral Resource 13.2Mt @ 1.65% Ni, 0.75% Cu and 0.11% Co containing 218,300t
nickel, 99,100t copper and 14,900t cobaltMine Production 7.65Mt @ 1.42% Ni, 0.68% Cu and 0.10% Co containing 108,700t
nickel, 51,700t copper and 7,300t cobaltMine Life 8.3 yearsLife-of-mine metal in concentrate production 90,200t Ni, 50,700t Cu and 6,700t CoAverage annual metal in concentrate production 10,800tpa Ni, 6,100tpa Cu and 800t Co
Figures 2 & 3: Full year LTIFR and DIFR
Table 1. Key Parameters of the Updated Feasibility Study, October 2017
For
per
sona
l use
onl
y

PAGE 10 | 2019 ANNUAL REPORT
Figure 4: Savannah North twin declines as at 30 June 2019, approximately 300m from the Savannah North orebody
Figure 5: Schematic of the Savannah mine and the Savannah North orebody(This figure shows the completed status of the twin declines into Savannah North and the Savannah North FAR Raisebore as of 30 June 2019)
By the end of the financial year, production from the Savannah remnant stopes totalled 281,817 tonnes of ore at 1.17% Ni, 0.60% Cu and 0.06% Co. Long hole production drilling totalled 47,853 metres and 68,147 tonnes of cemented paste fill had
been placed underground. Lateral development of 1,813 metres had been completed, the majority in the Savannah North twin declines. Total waste generated was 172,254 tonnes.
For
per
sona
l use
onl
y

2019 ANNUAL REPORT | PAGE 11
Figure 6: Savannah Mine showing the remnant Resources (green and yellow blocks)
Ore production is undertaken via conventional long hole open stoping with remote bogging on retreat. Currently, the long hole drilling is undertaken by a contractor. Savannah purchased a used Cabletec drilling rig for ground support and as a back-up production drill, as required. The mine plan requires open stopes to be backfilled with cemented paste fill to maximise recovery of the orebody and to assist geotechnical stability of the mine.
The mining of the Savannah Resources is sensitive to sequencing of the stopes to manage access and geotechnical stability. Due to the delays in recommissioning the paste reticulation system, this resulted in a number of adjustments to the production schedule to access new areas. These adjustments often required additional areas to be rehabilitated which was not initially planned and therefore had a negative
impact on ore production during the financial year. To assist the backfill schedule, the mine has commenced placing cemented waste rockfill in some open voids.
Even though the mine had been on care and maintenance for only two and a half years, a considerable amount of the ground support had deteriorated (by corrosion). A rigorous ground support testing program was undertaken which determined that installing new ground support was the safest approach. The resources required to complete this remediation work (people and equipment), were initially redirected from the planned capital development to access Savannah North however this slowed down the advancement of the twin declines. To mitigate this, a mining contractor was mobilised to site in April 2019 to focus solely on the Savannah North twin decline development.
For
per
sona
l use
onl
y

PAGE 12 | 2019 ANNUAL REPORT
Image 2: New Agi-Truck, New CAT 2900R Loader, New Epiroc 65T Truck
Image 3: Savannah Processing Plant at night
ProcessingThe processing plant was successfully refurbished between July and December 2018 with first ore processed in December 2018.
From recommissioning until 30 June 2019, the Processing Plant treated 276,039 tonnes of ore with an average feed grade of 1.16% Ni, 0.60% Cu and 0.06% Co. This was consistent with the ore mined and delivered to the ROM. Concentrate produced in FY2019 totalled 35,608 tonnes of ore at an average grade of 6.98% Ni, 4.14% Cu and 0.36% Co containing 2,484.3 tonnes of Ni, 1,474.2 tonnes of Cu and 129.7 tonnes of Co. The Ni grade in the concentrate continued to improve throughout 2019 and the target grade of 8% Ni should be achieved once production switches to the higher-grade Savannah North orebody. The average metal recoveries in FY2019 were 77.8% Ni, 89% Cu and 81.8% Co. Throughout the commissioning phase, metal recoveries continued to improve with the nickel recovery consistently achieving around 85% by June 2019 as planned.
The nominal throughput capacity of the Savannah plant
is approximately 1.0 million tonnes per annum, based on a normal operating rate of 120 tonnes per hour when in full production. During the ramp-up period, the mill was run at 90-100 tonnes per hour and is not scheduled to operate at full production until Savannah North ramps up in early 2020.
Following refurbishment activities, the Processing Plant was re-commissioned in December 2018. Mechanically, the restart was reasonably trouble free, however electrically, there were a number of issues which took time to resolve.
The primary crusher was refurbished however, following six months of operation, cracks were identified in the fixed jaw frame. A new crusher frame has been ordered and will be installed during the planned November 2019 shutdown.
There was a significant amount of work undertaken on the concentrate filter press during the plant refurbishment to improve the operating efficiency and to reduce maintenance. The original filter plates were not replaced and since restarting these have deteriorated faster than planned and will be replaced. In addition, lime is now added to the concentrate thickener prior to the filter press and an acid wash cycle is planned to be incorporated to remove lime scaling.
For
per
sona
l use
onl
y

2019 ANNUAL REPORT | PAGE 13
Image 4: Savannah concentrate being loaded for transport to Wyndham
Image 5: Construction of the Savannah Tailings Storage Facility 3m wall lift completed in November 2018
Refurbishment of the Paste Fill Plant was delayed as additional components were identified as needing to be replaceed or modified, which further delayed the delivery of paste underground.
By the end of the June 2019 quarter, the Paste Fill Plant was performing at forecast rates however, due to the delayed commissioning, a significant back log of unfilled stopes is being progressively filled by cemented rock fill, waste rock or paste filling.
Concentrate TransportPanoramic made the decision to transport concentrate from Savannah to Wyndham using Company owned and operated equipment and purchased its own concentrate trailers and two prime movers for this purpose. The Company has employed its own team of truck drivers and relied on hired prime movers until taking delivery of the first of its prime mover during the June 2019 quarter. The second prime mover was delivered in the September 2019 quarter. The concentrate is clean, with very low deleterious material. The concentrate is transported approximately 250km to the Wyndham Port to the Company’s storage shed and is shipped to Jinchuan in China on a monthly basis.
InfrastructureDuring care and maintenance, the accommodation village was kept in good condition. Only minor repairs and upgrades were required to bring all 180 rooms back into service. An additional 16 rooms are to be added in late 2019 together with an upgraded waste water treatment plant.
All mine site roads, process water storage facilities, bore fields and general infrastructure have been well maintained and are in good condition.
The third party owned power station was operational whilst on care and maintenance. Since the re-start, the power plant, substations and power reticulation have been upgraded as required to meet the power requirements of the site.
The other major infrastructure works undertaken prior to the re-start was a three metre wall lift on the existing tailings storage facility, which was completed in November 2018.
For
per
sona
l use
onl
y

PAGE 14 | 2019 ANNUAL REPORT
FinancingThe Company executed the original Savannah Facility Agreement (SFA) with Macquarie Bank Limited on 20 September 2018 to provide a secured project loan of up to A$40 million and nickel, copper and A$:US$ foreign-exchange hedging lines. Summary of the key terms of the September 2018 SFA were as follows:
Project Financing – September 2018• Principal - up to A$40 million
• Margin - very competitive for a financing of this style
• Availability - upon execution of full documentation and satisfaction of limited conditions precedent
• Repayment Schedule - quarterly repayments commencing 31 March 2020
• Final Repayment - 31 December 2021
• Loan Covenants and project ratios - customary for this size of facility
• Loan Security - the Savannah Project
• Mandatory Hedging – 7kt Ni at average forward price of A$8.51/lb, 3kt Cu at average forward price of A$3.71/lb for delivery between February 2019 and June 2021
In March 2019, following the slower than forecast ramp up of production from Savannah and lower than forecast commodity prices, the SFA was restructured as follows:
Project Financing - March 2019 Restructure• Debt – A$30 million Senior, A$10 million Mezzanine
• Margin – competitive margins for each debt style
• Availability – fully drawn
• Repayment Schedule – quarterly from June 2020 - December 2021
• Loan Covenants and project ratios – applied to Senior debt only
• 1st Mandatory Hedging – 7kt Ni at an average forward price of A$8.44/lb, 3kt Cu at average forward price of A$3.71/lb (undertaken in September 2018)
• 2nd Mandatory Hedging – 1,560t Ni at an average forward price of A$8.15/lb (undertaken in March 2019)
In September 2019, the SFA was restructured again primarily to reduce the loan amount to a total of $20 million. This was achieved with funds from the 2 for 11 pro-rata Entitlement Offer undertaken in September 2019. The current SFA terms are summarised as follows:
Project Financing - September 2019 Restructure• Debt – Facility A1 (Senior) - A$20 million
• Margin – Competitive margin
• Repayment Schedule – Quarterly from September 2020 - March 2022 (delayed by one quarter)
• Loan Covenants and project ratios – Debt Service Cover Ratio removed
• Minimum Project Liquidity Amount – A$7.5 million minimum removed until mid-2020, then one month operating costs
• No additional hedging required - existing hedging rolled to FY2021/22 to match the new loan repayment profile ie. delivery between September 2020 – March 2022
Post the restructuring of the SFA, the Company now has a very modest A$20 million of outstanding bank debt with repayments not due to commence until September 2020.
Marketing In July 2018, the Company executed a new Concentrate Sales Agreement with Sino Nickel, a joint venture company owned 60% by Jinchuan and 40% by Sino Mining International Limited.
The new Agreement replaced the Extended Concentrate Sales Agreement, dated 26 March 2010, which was due to expire on 31 March 2020. The terms of the new Agreement were applicable from the first shipment of concentrate from the recommissioned Savannah Project which departed Wyndham on 13 February 2019.
The new Sales Agreement incorporates improved payabilities for certain contained metals compared to the previous agreement demonstrating the tight market for nickel sulphide concentrates at the time of the contract negotiations and the unique characteristics of the Savannah nickel-copper-cobalt concentrates.
Panoramic is delighted to have completed the new offtake arrangements with Jinchuan/Sino Nickel and recommenced shipments following the two and a half year hiatus while Savannah was on care and maintenance.
Environment Savannah North is located on the existing granted Savannah mining leases. The site groundwater license issued by the Department of Water and the License to Operate issued by the Department of Environment Regulation remain current.
Panoramic received all the necessary regulatory approvals required for the restart of operations in a timely manner. All environmental reporting, monitoring and licence conditions were complied with during FY2019.
Social and HeritageThe Savannah operation has maintained strong social and heritage relationships with the traditional owners, pastoralists and other local business and community groups over the past fifteen years.
The 2007 Kimberley Nickel Co-existence Agreement outlines the processes for acknowledgement and engagement with
For
per
sona
l use
onl
y

2019 ANNUAL REPORT | PAGE 15
the traditional owners and has given rise to employment and business opportunities, heritage and cultural awareness training and other support and services in health, education, sports and arts for local communities. The Agreement remained in place during the care and maintenance period and has been reactivated since the recommencement of operations at Savannah.
Following the restart of operations, the Savannah Nickel Mine Implementation and Review Committee (IRC) made up of Traditional Owner and Mine representatives recommenced its quarterly meetings. The IRC meets to discuss the commitments outlined in the Co-Existence Agreement and to maintain positive partnerships and communication between the mine and Traditional Owners
FY2020 Production GuidanceThe Company updated guidance in early September 2019 based on the lower than budgeted production in July and August 2019 and a review of the Savannah and Savannah North production schedules for the balance of FY2020. The revised forecast production for FY2020 (tonnes in concentrate)
is now expected to be as follows:
• Nickel 9,500 - 10,000 tonnes
• Copper 5,800 - 6,000 tonnes
• Cobalt 600 – 650 tonnes
Image 7: Traditional “Smoking” Ceremony at Savannah Administration Building
Image 6: IRC Committee MembersFor
per
sona
l use
onl
y

PAGE 16 | 2019 ANNUAL REPORT
The Outlook for Savannah and the Panoramic Group The key to the long-term success of the Savannah Project is the successful ramp up of production from the new Savannah North orebody. With the Savannah North twin declines now scheduled to reach the Savannah North orebody in November 2019, the first development ore is scheduled to be treated in the mill during December 2019. Ore production from Savannah North will ramp-up and transition to stope ore from January 2020 with full production from Savannah North planned during the June 2020 quarter.
Once Savannah North is at full production the project will begin to generate significant free cash flow which will provide funds to:
• Repay outstanding bank debt;
• Explore for potential extensions to the known Savannah North mineralisation;
• Test other exploration targets on ground around Savannah;
• Invest in new technology to reduce operating costs at Savannah;
• Grow our mineral asset portfolio and expand our production base; and
• Return surplus cashflow to shareholders by way of dividends as we have done in the past.
The Savannah North orebody is a major nickel-copper-cobalt resource that will return Panoramic to a significant and profitable Australian base metal producer.
Thunder Bay North PGM ProjectBackgroundThe Thunder Bay North (TBN) Project is located near Thunder Bay in northwest Ontario, Canada. The advanced exploration project claims cover an aggregate area of 40,816 hectares. The TBN Project Resource contains 10.4Mt at 1.13g/t Pt and 1.07g/t Pd for ~0.4Moz Pt and ~0.4Moz Pd with exploration potential at depth and along strike.
In 2015, Rio Tinto Exploration Canada Inc. (RTEC) commenced a farm-in whereby RTEC can earn a 70% interest in the TBN Project by sole funding C$20 million in expenditure over five years, with a minimum spend of C$5 million. In January 2017, RTEC confirmed that it had achieved the minimum spend of C$5 million on the Project.
FY2019 ActivitiesThere was no exploration activity on the project in FY2019. Panoramic maintains a small office in Thunder Bay with two
Figure 7 – Savannah North Project Plan showing potential for additional mineralisation
For
per
sona
l use
onl
y

2019 ANNUAL REPORT | PAGE 17
employees who are sub-contracting geological consulting services to third parties to reduce the corporate overheads in Thunder Bay.
During the year, Panoramic held discussions with RTEC regarding the future plans and strategy of the Project and received a number of approaches to acquire Thunder Bay North.
Sale of Thunder Bay NorthIn July 2019, Panoramic agreed to sell Thunder Bay North to Benton Resources Inc of Canada for a total consideration of C$9 million. The transaction is subject to a number of conditions precedent including the signing of a Definitive Agreement. Panoramic is expecting this transaction to close during the December 2019 quarter.
Panton PGM ProjectBackgroundPanton is located 60km south of the Savannah Nickel Project in the East Kimberley region of Western Australia. Panton is a significant PGM Resource containing ~1.0Moz Pt at 2.2g/t and ~1.1Moz Pd at 2.4g/t with exploration potential at depth and along strike.
Panoramic considers the Panton Project to be a quality PGM development asset which fits within the Company’s commodity diversification and growth strategy and is a part of its “Kimberley Hub” concept. Testwork on Panton ore by Panoramic in 2014/15 demonstrated that high-grade PGM concentrates (circa 250g/t PGM) can be produced by standard fine grinding and flotation techniques. In 2015 Panoramic entered into a four-year research agreement with Curtin University to investigate alternative extraction methods applicable to Panton ore. The research agreement is due to end in September 2019.
FY2019 ActivitiesTestwork completed in FY2019 showed that in addition to producing a high-grade PGM concentrate, a “metallurgical grade” chromite concentrate by-product (circa 40% Cr2O3) can be recovered from the high-grade PGM concentrate flotation tails using simple wet high intensity magnetic separation (WHIMS) techniques. Testwork by Curtin University in FY2019 focused on evaluating the feasibility of producing further value-added direct Pt, Pd and Au refinery feed products from Panton while maintaining the ability to produce the chromite by-product. Tests on high-grade PGM concentrate samples showed that direct, high quality refinery feed products can be produced from the concentrate by roasting, HCl leaching and direct precipitation techniques.
As part of Company-wide asset review, Panoramic contracted Mr Len Jubber, a consulting mining engineer, to undertake a detailed review of the Project, bringing together all aspects of the Project (geology, resources, mining and processing) with the aim to produce a financial model based on the latest
possible flow sheet designs and their respective operating and capital costs. The review will also identify where further testwork may be beneficial to the Project economics. Len is due to complete the review and present it to the Company before the end of 2019.
Horizon Gold Limited (Panoramic 51%)
BackgroundThe Company has an indirect interest in the Gum Creek Gold Project through its 51% majority shareholding in Horizon Gold Limited (ASX:HRN Horizon). Horizon listed on the ASX after a $15 million initial public offering in December 2016.
The Gum Creek Gold Project hosts JORC 2012 Mineral Resources of 15.9 million tonnes averaging 2.7g/t gold for 1.39 million ounces of gold. It is located within a well-endowed gold region that hosts multi-million ounce deposits including Big Bell, Wiluna, Mt Magnet, Meekatharra and Agnew/Lawlers.
Horizon has identified the Swan and Swift open pit high grade gold Resources as likely candidates for mining activities to recommence at Gum Creek. The grade of these Resources combined with the higher Australian dollar gold price and a number of third-party gold processing plants in the vicinity of Gum Creek could allow Horizon to unlock significant value from these assets in the foreseeable future. A Scoping Study is underway to determine the economic parameters for mining and toll treating the Swan and Swift open pits.
Horizon has also discovered exciting new zinc-copper-silver mineralisation at Altair which could have a strike extent of up to eight kilometres.
Horizon’s plans are to continue exploration and development studies with the aim of becoming a stand-alone gold producer and potentially a base metal producer depending on the extent and economics of the Altair Project.
FY2019 Activities
Resource Extension (Swan and Swift)During FY2019, Horizon continued to drill test targets about the Butcherbird Shear and Premium Lode located at the northern end of the historical Swan open pit. Concurrent with the completion of the drilling, Horizon engaged Mining Plus Pty Ltd (Mining Plus) to update the Mineral Resource Estimates (MRE) for the Swan deposit, including the Swift deposit located just to the east of Swan.
The updated in situ, drill-defined, open pit and underground MRE for the Swan and Swift deposits were reported at cut-off grades of 0.5 g/t Au within an A$2,000/oz pit shell optimisation and 2.5 g/t Au beneath the pit optimisation. The updated MREs increased the Total Mineral Resource inventory at Gum Creek by 138,000oz to 15.9Mt @ 2.7g/t Au for 1.39 million ounces contained gold and includes a maiden Swift Open Pit Resource of 840,000t @ 7.2 g/t Au for 195,000oz (see Horizon Gold Limited ASX announcement of 12 July 2019).
For
per
sona
l use
onl
y

PAGE 18 | 2019 ANNUAL REPORT
Swan/Swift Open Pit Scoping StudySince the completion of the MRE in June 2019, Mining Plus has been retained by Horizon to assist with the completion of a series of open pit evaluation studies on the Swan and Swift deposits. This work forms the basis of a Scoping Study which is based on toll treating high grade ore at processing plants in the vicinity of Gum Creek. The Scoping Study is due to be completed by Horizon in the December 2019 quarter.
Altair Zinc-Copper-Silver Discovery In October 2018, Horizon announced a significant base metal intersection at Altair. Subsequently, the company reported a significant zinc-copper-silver intersection of 55.0m @ 3.32% Zn and 0.52% Cu from 184.0m, including 9.0m @ 6.69% Zn and 1.00% Cu from 213.0m (see Horizon Gold Limited ASX announcement of 23 October 2018).
During FY2019, Horizon drilled a further 20 holes over two drilling campaigns at Altair for a total of 6,832 drill metres. A broad continuous lens of zinc-copper mineralisation has been defined over a strike length of more than 450 metres. The maximum down dip extent and average thickness of the lens is 350m and 25m, respectively. Importantly, the mineralised lens remains open to the north and east (Figure 9).
The Altair drill results exhibited many of the geological and geochemical hallmarks of a major polymetallic, hydrothermal VHMS/SEDEX mineralising system and in June 2019, Horizon completed a broad (200m by 200m) moving loop electro-magnetic (MLEM) survey over the area with the aim to possibly map the extent of the mineralisation before undertaking further drilling.
Intuitive interpretation of the MLEM data by Horizon, suggests the Altair mineralisation continues strongly to the north for at least 600m where it is interpreted to plunge slightly deeper and continue north for a further 5km. The interpretation has been confirmed by numerical modelling which returned a series of plates as shown in Figure 10. The modelled plates imply, a possibly continuous, gently folded, steep dipping conductor of similar conductivity and time constant to the defined mineralised lens at Altair.
Numerical modelling of the MLEM data in the north where the response appears to fold towards the east, suggests the modelled plates in this area are sourced by shallow flat lying bedrock conductors of a similar conductivity and time constant as Altair. The combined strike length of the conductors mapped by the MLEM survey is approximately 8km. Horizon is planning to undertake a broad spaced nine-hole drill program during 2020 to test the MLEM defined conductors.
Advanced Australian gold exploration/developer valuations – Enterprise Value per Resource ounce*
$0
$20
$40
$60
$80
$100
$120
$140
$160
(A$)
BellevueGold
(ASX:BGL)
CapricornMetals
(ASX:CMM)
EganStreetResources(ASX:EGA)
BreakerResources(ASX:BRB)
EchoResources(ASX:EAR)
BlighResources(ASX:BGH)
HorizonMinerals
(ASX:HRZ)
GenesisMinerals
(ASX:GMD)
Kin Mining(ASX:KIN)
CalidusResources(ASX:CAI)
BardocGold
(ASX:BDC)
NTM Gold(ASX:NTM)
HorizonGold
(ASX:HRN)
*Source: Company ASX announcements, information including share price, EV and Mineral Resource current as at 31 July 2019. Additional supporting information can be found in Appendix 2 of this presentation.Refer HRN Company Announcement 2 August 2019
Figure 8 – Horizon Gold Limited – Relative to Peers
For
per
sona
l use
onl
y

2019 ANNUAL REPORT | PAGE 19
Figure 9: Altair Zn-Cu Prospect geology plan showing location of FY2019 completed drill holes
Figure 10: Altair Bouguer Gravity image showing MLEM survey modelled plates and planned follow-up drill hole locations.
For
per
sona
l use
onl
y

PAGE 20 | 2019 ANNUAL REPORT
EXPLORATIONOver the past eighteen years, the Company’s exploration team has had significant exploration success across its various projects and has discovered in aggregate:
• 342,700 tonnes nickel• 125,000 tonnes copper• 18,700 tonnes cobalt • 630,000 ounces gold
The Company continues to conduct exploration activities on its tenement package in a systematic and cost-effective
manner. Following the Savannah North discovery in early 2014 Panoramic’s primary exploration focus was building the resource base at Savannah North culminating with the release of the upgraded Savannah North Mineral Resource estimate in August 2016. In FY2019, there was no exploration undertaken on Savannah North due to the focus being on the restart of mining operations however, there was limited exploration activities on several regional projects in the Kimberley.
Savannah Regional Exploration FY2019 exploration activities focused on several layered mafic-ultramafic intrusions (namely Sub-Chamber D, Wilsons and Dave Hill) located about Savannah. Research conducted by Panoramic and CSIRO concluded that these intrusions were being emplaced at the same time and by the same magmatic event that was responsible for the emplacement of the mineralised Savannah and Savannah North intrusions and are therefore prospective hosts for magmatic Ni sulphide mineralisation. In addition to the three intrusions mentioned above, Panoramic has identified other prospective intrusions
about Savannah at Frog Hollow, Three Nuns, Anomaly A, Northern Ultramafic Granulite, Norton and Oxide.
Between May and September 2018, Panoramic drilled a total of 15 surface diamond exploration holes, with 10 of the 15 holes completed within the Wilsons/Dave Hill Complex, three at Frog Hollow and single holes at Three Nuns and Sub-Chamber D for an aggregate total of 9,138 drill metres (Figures 10 and 11). In addition, drill hole SMD169 at Subchamber D was extended by 42.4 metres during FY2019. The FY2019 drill program is part of an ongoing effort by Panoramic to better understand the 3D architecture of all the layered mafic-ultramafic intrusions
Figure 10 – Savannah Project Plan showing location of prospective mafic-ultramafic intrusions and FY2019
completed drill holes.
Figure 11 - Savannah Mine Complex Plan showing location of prospective mafic-ultramafic intrusions and FY2019 completed
drill holes.
PAGE 20 | 2019 ANNUAL REPORT
For
per
sona
l use
onl
y

2019 ANNUAL REPORT | PAGE 21
about Savannah and, if present, the location of the more nickel sulphide prospective ultramafic (high MgO rich) phases within each intrusion. To assist the search for new nickel sulphide bodies down-hole electromagnetic (DHEM) surveys were completed on all FY2019 holes apart from SMD185 and 186 at Frog Hollow.
Dave Hill / Wilsons ComplexA much clearer understanding of the Dave Hill/Wilsons Complex architecture has emerged from the FY2019 drill program. Previously thought to be separate intrusions, the latest drilling suggest Dave Hill and Wilsons are part of a large, complex single intrusion that has a broad “bath tub” shape, similar to the Savannah North intrusion. It differs from Savannah North in that the more prospective MgO rich (ultramafic) lithologies appears confined to a centrally located, tube-like (conduit) zone situated well above the base of the intrusion (Figure 12). The depth to the base of the conduit zone ultramafic lithologies is deepest in the south-west at approximately 650 metres deep in SMD172, shallowing slowly northwards to be approximately 200 metres deep in SMD182.
Geological mapping conducted during the course of the FY2019 drill program indicates that the nearby Oxide intrusion, which was previously thought to be a separate intrusion, is also part of the Dave Hill/Wilsons Complex. High precision thermal ionization mass spectrometry (TIMS) geochronological age dating of drill core samples from Dave Hill and Wilsons suggests both were emplaced more-or-less at the same time, albeit between 7-9 million years prior to the emplacement of the mineralised Savannah and Savannah North intrusions.
Frog HollowThe three Frog Hollow holes indicate the intrusion is dominated by medium to coarse grained iron rich norite to gabbronorite lithologies. No evidence was found for the existence of more primitive, ultramafic lithologies at depth within the intrusion, which tends to down-grade the nickel prospectivity of this intrusion. However, all three Frog Hollow drill holes did intersect broad thicknesses containing titanomagnetite accumulations which assaying confirmed to be strongly anomalous in vanadium; grading up to 0.4% V2O5.
Based on the size of the Frog Hollow intrusion, the spacing between the Panoramic drill holes and the consistency of the titanomagnetite accumulations encountered by the drill holes, Panoramic believe the intrusion has the potential to host a major low to moderate grade vanadiferous titanomagnetite (VTM) deposit.
To determine the vanadium grade and recovery that might be recovered to a VTM concentrate, the Company has selected three intervals from drill hole SMD185 for WHIMS testing. The intervals and head assays for the three intervals selected for WHIMS testing are as follows:
• 34m @ 0.36% V2O5, 5.57% TiO2, 25.93% Fe2O3 from 19m;
• 45m @ 0.25% V2O5, 3.06% TiO2, 17.73% Fe2O3 from 160m; and
• 53m @ 0.17% V2O5, 3.66% TiO2, 15.40% Fe2O3 from 92m.
Results for this phase of testwork are expected in the December 2019 quarter.
Figure 12 – Dave Hill / Wilsons Complex Plan showing interpreted position of ultramafic conduit zone.
For
per
sona
l use
onl
y
PAGE 22 | 2019 ANNUAL REPORT
VISION
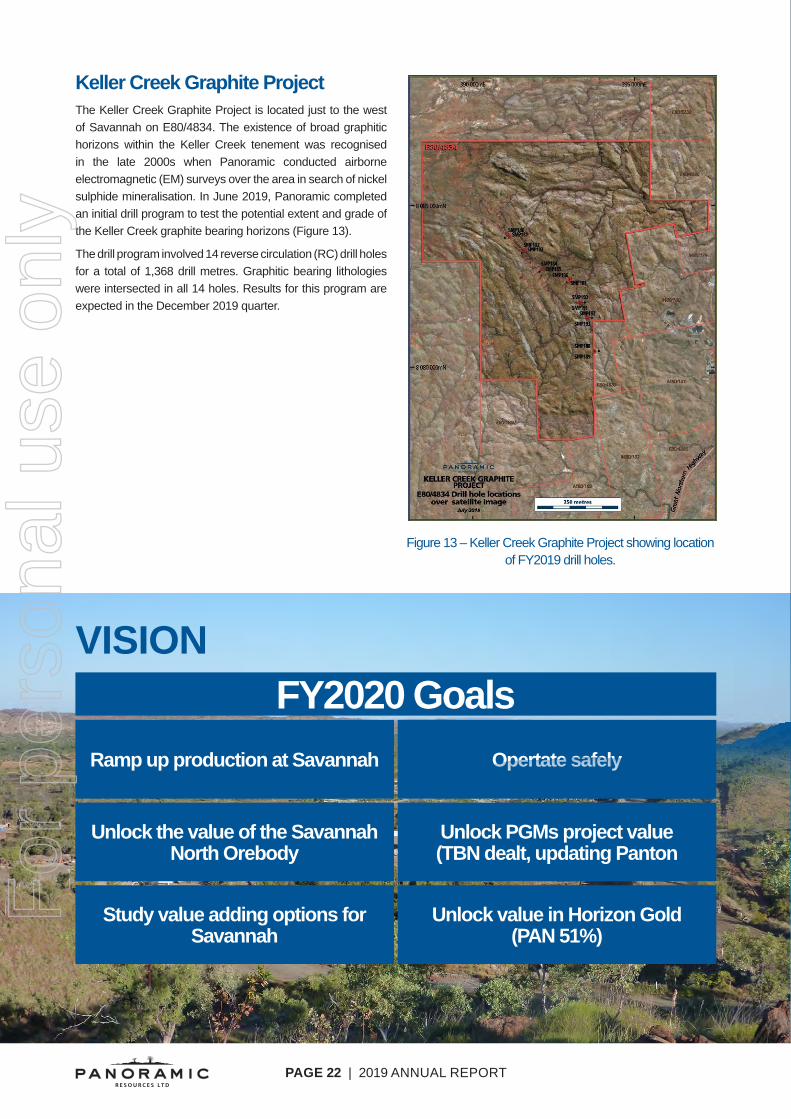
Keller Creek Graphite ProjectThe Keller Creek Graphite Project is located just to the west of Savannah on E80/4834. The existence of broad graphitic horizons within the Keller Creek tenement was recognised in the late 2000s when Panoramic conducted airborne electromagnetic (EM) surveys over the area in search of nickel sulphide mineralisation. In June 2019, Panoramic completed an initial drill program to test the potential extent and grade of the Keller Creek graphite bearing horizons (Figure 13).
The drill program involved 14 reverse circulation (RC) drill holes for a total of 1,368 drill metres. Graphitic bearing lithologies were intersected in all 14 holes. Results for this program are expected in the December 2019 quarter.
Figure 13 – Keller Creek Graphite Project showing location of FY2019 drill holes.
FY2020 GoalsRamp up production at Savannah
Unlock the value of the Savannah North Orebody
Study value adding options for Savannah
Opertate safely
Unlock PGMs project value (TBN dealt, updating Panton
Unlock value in Horizon Gold (PAN 51%)
For
per
sona
l use
onl
y

2019 ANNUAL REPORT | PAGE 23
DIRECTORS’ REPORTF
or p
erso
nal u
se o
nly

PAGE 24 | 2019 ANNUAL REPORT
Directors' report For the financial year ended 30 June 2019
The directors present their report on the consolidated entity (referred to hereafter as the Group) consisting of Panoramic Resources Limited and the entities it controlled at the end of, or during, the year ended 30 June 2018. Directors
Brian M Phillips (Independent Non-Executive Chairman) AWASM-Mining, FAusIMM Appointed 27 March 2007; Independent Non-Executive Chairman from 17 November 2011 Brian is a mining engineer who has had extensive mining industry experience in operational and management roles over a 50 year period. Brian has worked as an executive, and on the boards of mining companies in Australia and overseas involved with copper, gold, nickel, mineral sands and coal. He is a past President of the Victorian Chamber of Mines (now the Minerals Council of Australia - Victorian Division). During the past three years, Brian has also served as a director of the following listed companies: • White Rock Minerals Ltd (Non-Executive Chairman from 26 March 2010 to 31 December 2018)
Peter J Harold (Managing Director) B.AppSc(Chem), AFAICD Appointed 16 March 2001 Peter is a process engineer with over 30 years corporate experience in the minerals industry, specialising in financing, marketing, business development and general corporate activities. Peter has extensive experience with the development and operation of base metal projects having been responsible for metals marketing and various corporate functions relating to the Scuddles/Golden Grove copper lead zinc mine, Cawse nickel laterite project and the Silver Swan and Mt Keith nickel sulphide projects. Peter held various senior management positions with Shell Australia, Australian Consolidated Minerals Limited, Normandy Mining Limited, MPI Mines Limited and the Gutnick network of companies prior to founding Panoramic Resources Limited (formerly Sally Malay Mining Limited) in March 2001.On 20 August 2019, the Company announced that Peter will be leaving the Company within the next 12 months. During the past three years, Peter has also served as a director of the following listed companies: • Pacifico Minerals Limited (Non-Executive Director from 19 August 2013)* • Peak Resources Limited (Non-Executive Chairman from 1 December 2015 to 31 December 2017) • Horizon Gold Limited (Non-Executive Director from 10 August 2016, Non-Executive Chairman from 31 August
2016)* • Ocean Grown Abalone Limited (Non-Executive Chairman from 14 November 2017)* * Denotes current directorship Peter R Sullivan (Non-Executive Director) BE, MBA Appointed 1 October 2015 Peter is an engineer with an MBA and has been involved in the management and strategic development of resource companies and projects for more than 30 years. His work experience includes periods in project engineering, corporate finance, investment banking, corporate and operational management and public company directorships. During the past three years, Peter has also served as a director of the following listed companies: • GME Resources Limited (Managing Director from 24 June 1996 to 1 October 2004 and Non-Executive
Director from 1 October 2004)* • Resolute Mining Limited (Managing Director from 14 February 2001 to 30 June 2015 and Non-Executive
Director from 30 June 2015)* • Zeta Resources Mining Limited (Non-Executive Chairman from 7 June 2013)* • Pan Pacific Petroleum NL (Non-Executive Director from 26 September 2014 to 15 April 2018) • Bligh Resources Limited (Non-Executive Director from 13 July 2017 to 14 August 2019) * Denotes current directorship
For
per
sona
l use
onl
y

2019 ANNUAL REPORT | PAGE 25
Directors' report For the financial year ended 30 June 2019
Nicholas L Cernotta (Independent Non-Executive Director) BEng (Mining) Appointed 2 May 2018 Nicholas (Nick) is a mining engineer with over 30 years’ experience in the mining industry, spanning various commodities and operations in Australia and Overseas. Nick has held senior executive roles with extensive operational experience in both the public and private sectors of the mineral resources industry, including as Director of Operations at Fortescue Metals Group Ltd., Chief Operating Officer at MacMahon Contracting and Director of Operations at Barrick Gold. During the past three years, Nick has also served as a director of the following listed companies: • ServTech Global Holdings Ltd (Non-Executive Chairman from 17 October 2016 to 22 November 2017) • Pilbara Minerals Limited (Non-Executive Director from 6 February 2017)* • New Century Resources Limited (Non-Executive Director from 28 March 2019)* • Northern Star Resources Limited (Non-Executive Director from 1 July 2019)* * Denotes current directorship
Rebecca J Hayward (Independent Non-Executive Director) LLB Appointed 21 June 2018 Rebecca is an experienced infrastructure and resources lawyer, with a strong background in mining, energy and large scale infrastructure transactions. Rebecca currently manages the legal, contracts and procurement function for the Projects division of a large resource company. Rebecca was a Senior Associate at Clayton Utz in the Melbourne Construction and Major Projects team, where she had a lead role in a number of large infrastructure projects for both the private and public sectors. During the past three years, Rebecca has not served as a director of any other listed company. John Rowe (Independent Non-Executive Director) BSc (Hons), ARSM, MAusIMM Appointed 5 December 2006, Resigned 30 June 2019 John is a geologist who has had extensive mining industry experience over a 40 year period. Until August 2006, John was General Manager, Business Development with LionOre Australia responsible for assessing new business, divesting assets and negotiating nickel ore and concentrate sales contracts. Prior to joining LionOre, John spent 12 years with MPI Mines Limited in various group executive roles and was involved in the evaluation, development and production of the high-grade Silver Swan nickel sulphide project as well as the Stawell Gold Mine in Victoria. During the past three years, John did not serve as a director of any other listed companies. Company Secretary Trevor R Eton B.A (Hons)(Econ), PostGradDip (Man), AFAIM Appointed 12 March 2003 Trevor is an accountant with over 30 years’ experience in corporate finance within the minerals industry. Prior to joining the Company in 2003, he was Company Secretary and Group Financial Controller of MPI Mines Limited for 10 years. Trevor also worked for North Kalgurli Mines Limited, Metals Exploration Limited and Australian Consolidated Minerals Limited in various corporate finance roles from the mid 1980’s. During the past three years, Trevor has not served as a director of any listed company. F
or p
erso
nal u
se o
nly

PAGE 26 | 2019 ANNUAL REPORT
Directors' report For the financial year ended 30 June 2019
Meetings of Directors The number of meetings of directors (including committee meetings of directors) held during the year ended 30 June 2019, and the number of meetings attended by each director are as follows:
Meetings of Committees
Directors' Meetings Audit Remuneration Risk
Number of meetings held 11 2 4 2 Number of meetings
attended: Brian M Phillips 11 2 4 2 Peter J Harold 11 - 3* 2 John Rowe 11 2 4 2 Peter R Sullivan 11 2 4 2 Nicholas L Cernotta 11 2 4 2 Rebecca J Hayward 11 2 4 2 *Peter Harold attended each meeting of the Remuneration Committee as an invitee
Committee Membership As at the date of this report, the Company has an Audit Committee, a Remuneration Committee and a Risk Committee.
Members acting on the committees of the Board during the year were: Audit Committee Remuneration Committee Risk Committee John Rowe (c)* Peter R Sullivan (c) Nicholas L Cernotta (c) Brian M Phillips Brian M Phillips Brian M Phillips Peter R Sullivan John Rowe* John Rowe* Nicholas L Cernotta Nicholas L Cernotta Peter R Sullivan Rebecca J Hayward Rebecca J Hayward Rebecca J Hayward Peter J Harold (c) designates the Chairman of the Committee. The Company Secretary, Trevor Eton, acts as the Secretary on each of the committees of the Board. * John Rowe resigned as a member of the committees of the Board on 30 June 2019
Directors' Interests The relevant interest of each director in the share capital as notified by the directors to the Australian Securities Exchange (ASX) in accordance with S205G(1) of the Corporations Act 2001, at the date of signing is as follows: Ordinary Shares Performance rights over
Name of Director Direct Indirect ordinary shares Brian M Phillips - 353,733 - Peter J Harold 2,388,446 4,307,714 - Peter R Sullivan - - - Nicholas L Cernotta - - - Rebecca J Hayward - - - F
or p
erso
nal u
se o
nly

2019 ANNUAL REPORT | PAGE 27
Directors' report For the financial year ended 30 June 2019
Principal Activities The principal activities of the consolidated entity during the course of the financial year consisted of exploration, evaluation, development and mining of mineral deposits. The consolidated entity has four business divisions in which it operates, being: • Nickel Division - comprising the Savannah Nickel Project, which re-started production of a bulk nickel/copper/cobalt
concentrate in December 2018 (the Lanfranchi Nickel Project was sold during the financial year with an effective sale date of 30 June 2018);
• Gold Division - comprising the Company’s 51% equity interest in Horizon Gold Limited (the parent entity of the Gum Creek Gold Project);
• Platinum Group Metals (PGM) Division - comprising the Thunder Bay North PGM Project and the Panton PGM Project; and
• Australian and Overseas Exploration Division - comprising greenfield exploration activities within the two segments.
Operating and Financial Review Operating Results for the Year The Group recorded a profit after tax for the financial year ending 30 June 2019 of $9,229,000 (2018: after tax loss of $48,039,000). Financial Performance The Group's performance during the 2018/19 financial year and for the four previous financial years, are set out in the table below. The financial results shown below were all prepared under the Australian Accounting Standards.
Year Ended 30 June 2019 2018 2017 2016 2015Revenue and other income ($'000) 27,885 1,714 9,666 93,441 200,280Cost of sales of goods ($'000) (20,900) - (8,473) (97,933) (155,048)Royalties ($'000) (1,904) - (490) (4,920) (11,948)Exploration and evaluation ($'000) (671) (487) (493) (4,280) (12,912)Care and maintenance expenses ($'000) (847) (5,474) (7,539) (1,002) (905)Fair value change of financial assets ($'000) (1,511) - - - - Corporate and marketing costs ($'000) (4,929) (4,022) (5,365) (6,729) (7,964)Other (expenses)/income ($'000) 2,273 114 (4) (1,791) (919)EBITDA (before impairment) ($'000) (604) (8,155) (12,698) (23,214) 10,584Depreciation and amortisation ($'000) (7,039) (430) (760) (50,749) (62,124)Net reversal of / (impairment) of assets ($'000) 18,255 (38,511) 9,178 (79,453) 11,864Finance costs ($'000) (1,383) (943) (490) (1,405) (998)Profit /(loss) before tax ($'000) 9,229 (48,039) (4,770) (154,821) (40,674)Income tax benefit (expense) ($'000) - - - 10,462 11,827Net profit/(loss) after tax ($'000) 9,229 (48,039) (4,770) (144,359) (28,847)Earnings/(loss) per share (cents) 2.0 (9.1) (1.0) (42.7) (9.0)Dividends per share (cents) - - - - 1.0Dividends pay out ratio (%) - - - - -Market capitalisation ($'000) 163,307 304,788 94,285 57,857 149,462Closing share price ($ per share) 0.295 0.620 0.220 0.135 0.465 Return on equity (%) 4.6 (26.8) (2.8) (88.0) (18.1) Note (1): Comparative information has not been restated for the impact of AASB9 Financial Instruments and AASB15 Revenue from contracts with customers. Note (2): EBITDA (before impairment) is non-IFRS information and has not been audited by the Company's auditor, Ernst & Young (EY). The table above shows how it is reconciled to the Consolidated Income Statement. EBITDA (before impairment) has been included for the purpose of reconciling earnings without impairment.
For
per
sona
l use
onl
y
PAGE 28 | 2019 ANNUAL REPORT
Directors' report For the financial year ended 30 June 2019
Revenue and Other Income The Savannah Nickel Project generated $39,567,000 of sales income following the re-commencement of bulk Savannah nickel/copper/cobalt concentrate shipments to China in February 2019. Of this amount, $25,112,000 was booked as sales revenue in the income statement, with the balance of pre-production income for the first two shipments in February and March 2019 being off-set against capitalised pre-production and development costs in the balance sheet as the Project was still in the process of ramping-up production from the remnant Savannah orebody. Other income of $2,733,000 consisted of (1) a gain on the sale of the Lanfranchi Nickel Project ($782,000); (2) sale of equipment ($584,000); (3) positive final quotational sale price adjustments ($508,000); (4) interest income ($451,000) (5) rents and sub-lease rentals ($406,000) and (4) net foreign exchange gains ($42,000). Cost of Production
Total aggregate direct costs of the Savannah Nickel Project were $19,429,000. Until 31 March 2019, the cost of production at the Savannah Nickel Project were recognised as capitalised pre-production costs in the balance sheet.
Care and Maintenance Costs (including depreciation and amortisation) Care and maintenance costs totaling $847,000 were incurred by the Nickel Division and the Gum Creek Gold Project during the period. These costs were 84% lower than the previous financial year ($5,201,000) as a result of the re-commencement of mining operations at the Savannah Nickel Project early in 2018/19 financial year. Corporate and Marketing Costs Corporate and marketing costs of $4,929,000 were 23% higher than the previous reporting period as a result of the increase in corporate activity and higher employee costs following the employment of new full-time staff during the financial year. Reversal of Impairment Loss As a result of the re-commencement of mining operations at the Savannah Nickel Project, a reversal of a previous impairment loss of $19,156,000 was made against the carrying values of the Project’s assets at 31 December 2018. Change in Fair Value of Financial Assets As a result of the first-time application of AASB9 Financial Instruments, the adverse change in the fair value of the Company’s shareholdings in listed entities (excluding the Company’s interest in Horizon Gold Limited) of $1,511,000 was recognised in the profit and loss account. In previous financial years, the change in the fair value of these financial assets was recognised in a reserve account in equity. Review of Financial Condition Balance Sheet Horizon Gold Limited
In recognition of the Company’s majority 51% shareholding in Horizon Gold Limited (“Horizon)” at balance date, under AASB 10 Consolidated Financial Statements (“AASB10”), the assets, liabilities, equity, income, expenses and cash flows of Horizon are consolidated in the financial statements of the consolidated entity after attributing the profit or loss and each component of other comprehensive income to the equity owners of the Company and to the non-controlling interests (as described in note 30 of the “Notes to the Consolidated Financial Statements”). For clarity, the Company has shown in Table A below, a non-AIFRS pro-forma consolidated balance sheet in which the Company’s 51% shareholding in Horizon has been re-classified as an ”investment in subsidiary”. In this presentation, the Company’s equity investment of 39,030,617 shares in Horizon is shown at fair value through other comprehensive income measured using the quoted share price of Horizon at balance date, instead of the assets, liabilities, equity and results of Horizon being separately consolidated as required under AASB10. The table also includes the adjustments to reconcile the pro-forma balance sheet back to the consolidated balance sheet.
For
per
sona
l use
onl
y

2019 ANNUAL REPORT | PAGE 29
Directors' report For the financial year ended 30 June 2019
Table A: Pro-forma Consolidated Balance Sheet (51% equity interest in Horizon Gold Limited re-classified as “Investment in Subsidiary”)
30 June 2019 (Pro-forma)1
Adjustments 30 June 2019 (AIFRS)
$’000 $’000 $’000
Current Assets Cash and cash equivalents 10,854 1,879 12,733 Trade and other receivables 19,259 19 19,278 Inventories 8,415 - 8,415 Derivative financial instruments 3,742 - 3,742 Prepayments 1,326 28 1,354 Assets classified as held for sale 4,299 - 4,299 Total Current Assets 47,895 1,926 49,821 Non-Current assets Financial assets at fair value 957 - 957 Investment in subsidiary at fair value through other comprehensive income 6,830 (6,830) -
Property, plant and equipment 54,705 4,299 59,004
Exploration and evaluation 11,851 15,912 27,763
Development properties 84,745 - 84,745
Mine properties 29 - 29
Derivative financial instruments 4,409 - 4,409 Other non-current assets 181 - 181 Total Non-Current Assets 163,707 13,381 177,088
Total Assets 211,602 15,307 226,909 Current Liabilities Trade and other payables 21,718 376 22,094 Borrowings 8,082 - 8,082 Derivative financial instruments 2,721 - 2,721 Provisions 2,158 47 2,205 Total Current Liabilities 34,679 423 35,102
Non-Current Liabilities Borrowings 38,553 - 38,553 Derivative financial instruments 5,584 - 5,584 Provisions 21,375 10,173 31,548 Total Non-Current Liabilities 65,512 10,173 75,685 Total Liabilities 100,191 10,596 110,787
Net Assets 111,411 4,711 116,122 Contributed equity 210,109 - 210,109 Reserves 13,858 8,336 22,194 Accumulated losses (112,556) (9,267) (121,823) Non-controlling interests - 5,642 5,642
Total Equity 111,411 4,711 116,122 1 The pro-forma balance sheet presentation of the de-consolidated 51% equity interest in Horizon Gold Limited is a non-AIFRS treatment of this investment. The adjustments to the Pro-forma balance sheet are to comply with AIFRS. 2 The financial information presented above in Table A has not been audited or reviewed by the Company’s Auditor, Ernst & Young (EY).
For
per
sona
l use
onl
y
PAGE 30 | 2019 ANNUAL REPORT
Directors' report For the financial year ended 30 June 2019
Net Working Capital - current assets less current liabilities The net working capital position of $14,719,000 was 58% lower than at the previous balance date. This position is lower than the previous balance date primarily due to the significant 487% increase in trade payables and other payables as a result of the re-commencement of mining operations at the Savannah Nickel Project. The amount excludes $181,000 (2018: $1,303,000) which is cash backing the drawn amount on the Company’s performance bond facility (and is classified as a non-current asset, as described in note 18 of the “Notes to the Consolidated Financial Statements”). The contribution of Horizon Gold Limited’s net assets to net working capital was $1,503,000 (2018: $6,574,000). The operating activities of the consolidated entity (including greenfield exploration and net corporate costs) generated a net cash outflow of $8,362,000 (2018: $6,936,000). Net cash outflow from investing activities of $63,131,000 included (1) $5,961,000 expenditure on exploration and evaluation activities at the Savannah Nickel Project and Gum Creek Gold Project; (2) $47,529,000 expenditure on pre-production and development activities at the Savannah Nickel Project and (3), plant and equipment ($25,732,000). Offsetting this expenditure was the net proceeds of $14,285,000 from the sale of the Lanfranchi Nickel Project. Net Tax Balances At balance date, the consolidated entity had a deferred tax asset value of $48,036,000. Until such time as the Savannah Nickel Project is generating sustainable taxable income, this asset is not being recognised in the consolidated statement of financial position. Net Assets/Equity The net asset position of the consolidated entity increased 35% to $116,122,000, primarily due to the significant increase in expenditure on (1) pre-production and development activities at the Savannah Nickel Project and (2) refurbishment on existing site infrastructure and the purchase of new plant and equipment at Savannah. Capital Structure The debt to equity ratio (borrowings on contributed equity) at 30 June 2019 was 22% (2018: nil). Business and Financial Risks Exposure to movements in nickel, copper, cobalt and diesel (input) prices and the Australian dollar exchange rate to the United States dollar (A$:US$) are significant business and financial risks in the Nickel Division. As a price-taker, the consolidated entity has no ability to control the global spot prices it receives for the sales of nickel concentrate and nickel ore. Any negative commodity price movement directly impacts the business by reducing the sales revenue the consolidated entity receives in United States dollars. Similarly, the conversion of sales revenue received in United States dollars into Australian dollars exposes the consolidated entity to movements in the foreign exchange rate between the Australian dollar and the United States dollar. If the Australian dollar is strong relative to the United States dollar at the time of conversion, the consolidated entity will receive less Australian dollar revenue. Commodity and US$ Foreign Currency Hedging To limit the exposure to commodity price risk and foreign exchange currency risk between the Australian dollar and United States dollar, the consolidated entity has established mandatory and discretionary commodity and United States dollar foreign exchange derivative hedging lines under a Master ISDA Agreement with Macquarie Bank Limited (“Macquarie”). Initial mandatory hedging, consisting of 7,000 tonnes of fixed US$ nickel forward sales contracts and 3,000 tonnes of fixed US$ copper forward sales contracts together with matching United States dollar denominated foreign exchange derivatives, was completed in July 2018 as a pre-condition to the execution of the Savannah Facility Agreement (SFA) with Macquarie in September 2018 (refer to the “Corporate” section of this report for details on the SFA). In February 2019, the SFA was amended and additional 1,560 tonnes of mandatory fixed US$ nickel forwards were sold forward together with matching United States dollar denominated foreign exchange derivatives. F
or p
erso
nal u
se o
nly

2019 ANNUAL REPORT | PAGE 31
Directors' report For the financial year ended 30 June 2019
The consolidated entity also has an open Hedging Policy in which limited discretionary commodity and United States dollar denominated foreign exchange hedging is undertaken (currently subject to Macquarie approval), namely:
• For nickel price risk, the policy is to hedge, when appropriate and after considering the volume of mandatory hedging, no more than 80% of the payable nickel forecast to be produced in any month, over a rolling two-year horizon. Any hedging is undertaken using a combination of nickel forward sales contracts and nickel put options, with nickel call options written and sold in order to offset the cost of bought nickel put options. Of the 80% maximum limit, the percentage of the combined nickel forward sales contracts and written nickel call options (but excluding purchased nickel put options) is to be no more than 40% of the payable nickel forecast to be produced in any month over the same rolling two-year horizon; and
• For foreign exchange currency risk, although not mandatory in the policy, when appropriate, sufficient United States dollar denominated foreign exchange hedging on a month to month basis, via a combination of A$:US$ foreign exchange forward contracts and A$:US$ foreign exchange put and call options, to match the net United States dollar proceeds from commodity hedging derivative contracts.
As at 30 June 2019 (30 June 2018: nil), the consolidated entity had sold forward:
• 7,990 tonnes of nickel at an average weighted US$ nickel price of US$6.22 per pound for delivery between July 2019 and December 2021;
• 2,636 tonnes of copper at an average weighted US$ nickel price of US$2.77 per pound for delivery between July 2019 and December 2021; and
• US$104.1 million of matching United States dollar denominated foreign exchange derivatives at an average weighted A$:US$ exchange rate of US$0.7431 for delivery between July 2019 and December 2021.
None of the existing fixed forward contracts that have been entered into by the consolidated entity are subject to margin calls. As at 30 June 2019 (30 June 2018: nil), the consolidated entity had remaining 1,319 tonnes of bought nickel put options at a strike price of A$7.48 per pound for delivery between July 2019 to September 2019. Other business risks can have an impact on the profitability of the consolidated entity. The recognition, management and control of these risks are key elements of the Group enterprise-wide risk management framework which is in the process of being updated, as detailed in the Corporate Governance Statement on page 56. Dividends No final dividend has been declared for the financial year ended 30 June 2019 (2018: nil). Review of Operations
Nickel Division Savannah Nickel Project, East Kimberley region, WA In July 2018, the Company announced the decision to restart operations at the Project, including the development and mining, commencing in late 2019, from the high-grade Savannah North orebody. Following the completion of the main refurbishment activities on the Savannah Process Plant, the ramp-up of production of a bulk Savannah nickel/copper/cobalt concentrate commenced in December 2018. Through-out the second-half of the financial year, the ramp-up was slower than forecast from a number of factors, as described in the Company’s December 2018 and March 2019 quarterly reports. Physicals 2019 (i) Produced Ore Treated (t) 276,039 Nickel Grade (%) 1.16 Recovery (%) 77.8 Nickel in Concentrate (t) 2,484 (ii) Sold Nickel in Concentrate (t) 2,357 In addition, the mine produced 1,474 tonnes of copper and 130 tonnes of cobalt in concentrate. The concentrate was trucked to and shipped from the port of Wyndham to China under the June 2018 Concentrate Sales Agreement with Jinchuan Group Co. Ltd / Sino Nickel Pty Ltd.
For
per
sona
l use
onl
y
PAGE 32 | 2019 ANNUAL REPORT
Directors' report For the financial year ended 30 June 2019
Exploration and Development Projects
Nickel Division During the financial year, the consolidated entity completed broad-spaced stratigraphic diamond drilling and associated down-hole electromagnetic (DHEM) surveys at and in the tenements surrounding the Savannah Nickel Project, namely at the following intrusions: • Dave Hill / Wilson Complex; • Sub-Chamber D (located on the Savannah Nickel Project Mining Leases); and • Frog Hollow.
The aim of the drill testing was to determine the 3D architecture of the intrusions and, if they exist, the location of the more prospective ultramafic (high MgO rich) phases within each intrusion. As part of these programs, a drill-hole was also completed at the Three Nuns prospect. Little or no exploration has been conducted on these intrusions and previous drilling by the Group demonstrated that both Dave Hill and Wilson host disseminated/blebby magmatic nickel-copper sulphide mineralisation (refer to the Company’s ASX announcement of 28 April 2016 for further details). No significant nickel sulphide mineralisation was intersected in the drill-holes on the Dave Hill/Wilson Complex. At Sub-Chamber D, the drilling indicates that this intrusion has a broad “bath-tub” shape similar to the Savannah North intrusion, however, no significant DHEM anomalies were returned. The results to date provide a greater understanding of the formation of “Savannah style” nickel sulphide orebodies and will assist in future exploration in the region. At Frog Hollow, the drill-holes intersected broad zones of vanadiferous titanomagnetite (VTM) accumulations. Follow-up, detailed assaying on the zones and intensity magnetic separation (WHIMS) testing in the June 2019 quarter has determined the typical vanadium grade and recovery that can be achieved to a vanadiferous titanomagnetite (VTM) concentrate using this technique. The next steps to progress the Frog Hollow VTM Project are being evaluated. In June 2019, two underground diamond drill rigs were mobilised to commence infill grade control drilling on the Savannah North deposit from the 1570 East Drill Drive. Platinum Group Metals (PGM) Division Thunder Bay North (TBN) PGM Project, North-West Ontario, Canada During the 2018/19 financial year, Rio Tinto Exploration Canada Inc (“RTEC”) continued to fund the holding costs on the TBN PGM Project under the 30 July 2014 Earn-In Agreement. The three part-time employees of TBN assisted RTEC as required and continued to undertake various consulting projects for locally based exploration companies to assist in offsetting the costs of running the Thunder Bay Office. On 2 July 2019, the Company announced that it had signed a binding Letter Agreement with TSX listed Benton Resources Inc (“Benton”) to sell its shareholding in wholly owned subsidiary, Panoramic PGMs (Canada) Limited, the 100% owner of the Thunder Bay North (TBN) PGM Project, to Benton for a total of consideration of A$9.8 million (C$9.0 million) subject to a number of conditional precedent (refer to “Matters subsequent to the end of the financial year” section of this report for further details). Panton PGM Project, East Kimberley, WA The Company continued its sponsorship of research by Curtin University into alternative direct leaching technologies for smaller chromite rich PGM deposits. This research has led the Company to study and review the viability of producing a high grade PGM concentrate with a chromite by-product stream. The results of a preliminary test-work program in mid-2018 indicated that a metallurgical grade chromite by-product can be produced from the Panton PGE concentrate flotation tails using WHIMS magnetic separation techniques. In the December 2018 quarter, the Company commenced test-work in conjunction with Curtin University to evaluate the feasibility of producing value-added direct refinery feed products while maintaining the ability to also produce an economic chromite by-product by-product revenue stream. This test-work is now largely complete and was successful on many fronts. In May 2019, the Company commenced a detailed review of the Project, bringing together all aspects of the Project (geology, resources, mining and processing) with the aim to produce a financial model based on the latest possible flow sheet designs and their respective operating and capital costs.
For
per
sona
l use
onl
y

2019 ANNUAL REPORT | PAGE 33
Directors' report For the financial year ended 30 June 2019
Gold Division Horizon Gold Limited (owner of the Gum Creek Gold Project, Murchison region, WA) Following the spin-off, capital raising and initial public offering (IPO) of Horizon (ASX Code: HRN) in December 2016, the Company has retained a 51% majority equity interest of 39,030,617 shares in Horizon and as a result, an indirect interest in the Gum Creek Gold Project. The market value of this equity investment in Horizon at 30 June 2019 was approximately $6.8 million (by reference to the then Horizon share price of 17.5 cents per share), The Company’s shares in Horizon were escrowed from trading on the ASX until 21 December 2018. Exploration and evaluation studies are ongoing at the Gum Creek Gold Project (refer to the public announcements made by Horizon for further details). Under the October 2016 Management Agreement and the various extensions of the agreement’s expiry date on essentially the same terms, consolidated entity personnel are continuing to provide management services to Horizon on a cost recovery basis. Corporate
The Company is limited by shares and is domiciled and incorporated in Australia. Significant events of the consolidated entity during the financial period of a corporate nature were as follows:
Lanfranchi Nickel Project
On 13 September 2018, the Company announced that it had agreed to sell its shareholding in wholly owned subsidiary, Cherish Metals Pty Ltd, the 100% owner of the Lanfranchi Nickel Project, to a wholly owned subsidiary of Texas-based Black Mountain Metals LLC (“Black Mountain”) for a total consideration of $15.1 million, with an effective sale date of 30 June 2018. The Project had been on care and maintenance since November 2015. On 5 December 2018, the sale transaction was completed as all pre-conditions to the sale had either been satisfied or waived. An adjusted total consideration of $15.0 million before costs was received during the financial period. Savannah Facility Agreement (SFA)
On 20 September 2018, the consolidated entity executed the Savannah Facility Agreement (SFA) with Macquarie Bank Limited (“Macquarie”) for an up to $40 million project loan, including executing an ISDA Master Agreement to undertake mandatory and discretionary commodity and foreign currency hedging. On 5 March 2019, the SFA was amended in response to the slower than expected ramp-up in production from the Savannah orebody and lower metal prices. The first loan repayment, originally scheduled for 31 March 2020, was moved to 30 June 2020 without changing the repayment end date of 31 December 2021. In addition, the $40 million, fully drawn and outstanding under the SFA, was split over two tranches of $30 million in Senior Debt and $10 million in Mezzanine Debt. Capital Raising On 11 March 2019, the Company announced a capital raising consisting of: • an Initial Placement in mid-March 2019 to raise $5.0 million before costs (13,157,895 ordinary shares at 38
cents per share) to existing shareholders and new sophisticated investors; • a pro-rata renounceable, one (1) for thirteen (13) Entitlement Offer to raise $14.84 million before costs
(39,054,489 ordinary shares at 38 cents per share) to eligible existing shareholders that successfully closed on 9 April 2019; and
• a Conditional Placement of $2.6 million (6,842,105 ordinary shares at 38 cents per share) to the Company’s major shareholder, Zeta Resources Limited (“Zeta”).
The purpose of the Offer was to raise funds to progress the ramp up of production from the Savannah orebody and expedite the development drive to the higher-grade Savannah North orebody, to satisfy minimum liquidity requirements under the SFA, to replenish the $2.1 million used to purchase short-term nickel put option price protection and for general corporate costs and capital raising costs. Employees
At the end of the financial year, the Group had 216 permanent, full time employees (2018: 20).
For
per
sona
l use
onl
y

PAGE 34 | 2019 ANNUAL REPORT
Directors' report For the financial year ended 30 June 2019
Key Developments (Incorporating Significant Changes in the State of Affairs)
Significant changes in the state of affairs of the consolidated entity during the financial period were as follows:
• On 16 July 2018, the Company announced the formal decision to restart operations at the Savannah Nickel Project;
• On 10 August 2018, the Company issued 2,935,093 ordinary shares to executives of the Company following the vesting on 1 July 2018 of the FY2016 Performance Rights;
• On 13 September 2018, the Company announced that it had agreed to sell its shareholding in wholly owned subsidiary, Cherish Metals Pty Ltd, the 100% owner of the Lanfranchi Nickel Project, to a wholly owned subsidiary of Texas-based Black Mountain Metals LLC (“Black Mountain”) for a total consideration of $15.1 million (which was revised down to $15.0 million in June 2019);
• On 20 September 2018, the consolidated entity and Macquarie executed the SFA and ISDA Master Agreement;
• On 6 December 2019, the Company announced that all pre-conditions to the sale of the Lanfranchi Nickel Project to Black Mountain had either been satisfied or waived;
• On 12 December 2018, the Company agreed with Horizon to extend the October 2016 Management Agreement on the same terms until 21 June 2019;
• On 21 December 2019, the three-year escrow period on the Company’s shareholding in Horizon ended; • On 13 February 2019, the first shipment of bulk Savannah nickel/copper/cobalt concentrate, following the
re-commencement of operations at the Savannah Nickel Project, departed Wyndham for Lianyungang, China;
• On 5 March 2019, the consolidated entity and Macquarie executed an amended SFA; • On 11 March 2019, the Company announced a $22.44 million before costs capital raising, consisting of an
Initial Placement ($5.0 million), pro-rata renounceable, one for thirteen Entitlement Offer ($14.84 million) and Conditional Placement to Zeta ($2.6 million);
• On 13 June 2019, the Company agreed with Horizon to extend the October 2016 Management Agreement on the same terms for a further six months until 20 December 2019; and
• On 14 June 2019, the Conditional Placement of $2.6 million to Zeta was approved at a general meeting of shareholders.
Matters subsequent to the end of the financial year Thunder Bay North PGM Project Sale
On 2 July 2019, the Company executed a binding Letter Agreement with TSX listed Benton Resources Inc (“Benton”) to sell its shareholding in wholly owned subsidiary, Panoramic PGMs (Canada) Limited, the 100% owner of the Thunder Bay North (TBN) PGM Project, to Benton for a total of consideration of A$9.8 million (C$9.0 million). As at the date of signing, the completion of the transaction is still subject to a number of conditions precedent, including the signing of a Definitive Agreement, Benton raising sufficient finance to fund the purchase price and the completion of the acquisition by Benton of the Escape Lake Project from Rio Tinto Exploration Canada Inc.. With the strong likelihood that the sale of the TBN PGM Project will be completed in the 2019/20 financial year, the Project has been classified as an asset held for sale at 30 June 2019 (as described in note 10 of the “Notes to the Consolidated Financial Statements). Departure of Managing Director
On 20 August 2019, the Company announced that the Managing Director, Peter Harold, would be leaving the Company within the next 12 months. Savannah Facility Agreement (SFA)
As at the date of this report, the consolidated entity and Macquarie Bank Limited are in discussions in relation to the SFA in order to provide financial flexibility as the Savannah Nickel Project transitions to the Savannah North orebody. In the interval between the end of the financial year and the date of this report, apart from the matters mentioned above, there has not arisen any item, transaction or event of a material and unusual nature likely, in the opinion of the directors of the Company, to affect significantly the operations of the consolidated entity, the results of those operations, or the state of affairs of the consolidated entity, in future financial years.
For
per
sona
l use
onl
y

2019 ANNUAL REPORT | PAGE 35
Directors' report For the financial year ended 30 June 2019
Business Strategies and Prospects (Incorporating likely developments and expected results) The Company’s primary goal is to explore for, develop and mine its Resources profitably and return value to shareholders through capital growth and dividends. The Company’s vision is to broaden its exploration and production base, with the aim of becoming a major, diversified mining house in the S&P/ASX 100 Index. The likely developments in each of the consolidated entity’s commodity divisions over the next 12 months are highlighted below:
Nickel Division In relation to the Savannah Nickel Project, the Company will continue with mining the Savannah orebody, while, at the same time, continue with development across to the Savannah North deposit, with mining to commence on this high-grade orebody in late 2019. Exploration activities will continue on the infill grade control drilling on the Savannah North deposit. Once this has been completed, it is planned to conduct additional exploration drilling into and east of the Fault Zone where the up-plunge continuation of the Savannah North (Upper Zone) orebody has had limited testing. The consolidated entity will also continue with evaluation studies on the Frog Hollow VTM Project. Gold Division The consolidated entity will continue to provide technical, commercial, managerial and administrative services to the Gum Creek Gold Project and such other assets of Horizon Gold Limited as appropriate, pursuant and subject to the extension of the October 2016 Management Agreement between the Company and Horizon. Exploration and evaluation activities are ongoing at the Gum Creek Gold Project (refer to the public announcements made by Horizon for further details). Platinum Group Metals (PGM) Division The consolidated entity will continue working towards the completion of the sale of the Thunder Bay North PGM Project to Benton in the December 2019 quarter. On the Panton PGM Project in the East Kimberley region of Western Australia, the consolidated entity will continue with evaluation studies on the development of the Project. Further information about likely developments in the operations of the consolidated entity and the expected results of those operations in the future financial years has not been included in this report because disclosure would be likely to result in unreasonable prejudice to the consolidated entity. Shares Options
At the date of signing, there are no unissued ordinary shares of the Company under Option (2018: nil). Indemnification of Auditors
To the extent permitted by law, the Company has agreed to indemnify the auditors, Ernst & Young (EY), as part of the terms of its audit engagement agreement against claims by third parties arising from the audit (for an unspecified amount). No payments have been made to indemnify Ernst & Young (EY) during or since the financial year. Indemnification and Insurance of Directors and Officers
The Company has agreed to indemnify the directors and senior executives against all liabilities to another person (other than the Company or a related body corporate) that may arise from their position as directors and officers of the Company, except where the liability arises out of certain wrongful acts for which the Company has not agreed to provide indemnity. The agreement stipulates that the Company will meet the full amount of any such liabilities including costs and expenses. During the financial year, the Company has accrued and/or paid premiums of $59,604 (2018: $40,490) in respect of contracts insuring all the directors and officers against legal costs incurred in defending proceedings. The insurance premiums relate to: (1) Costs and expenses incurred by the relevant officers in defending legal proceedings, both civil and
criminal and whatever the outcome; and (2) Other liabilities that may arise from their position, with the exception of conduct involving a wilful breach
of duty or improper use of information or position to gain a personal advantage.
For
per
sona
l use
onl
y
PAGE 36 | 2019 ANNUAL REPORT
Directors' report For the financial year ended 30 June 2019
2019 Remuneration Report (Audited) This 2019 remuneration report outlines the remuneration arrangements in place for the directors and executives of the Company and the Group in accordance with the Corporations Act 2001 and its Regulations (the Act). The information provided in this remuneration report has been audited as required by section 308(3C) of the Corporations Act 2001. For the purposes of this report, Key Management Personnel (“KMP”) of the Group are defined as those persons having authority and responsibility for planning, directing and controlling the major activities of the Group, directly or indirectly, including any director (whether executive or otherwise) of the parent company. For the purposes of this report, the term ‘executive’ encompasses the Managing Director, senior executives and operations managers of the Company and the Group.
(a) Directors and other Key Management Personnel disclosed in this Report (i) Directors Brian Phillips Chairman (Non-Executive) Peter Harold Managing Director John Rowe Director (Non-Executive) (until 30 June 2019) Peter Sullivan Director (Non-executive) Nicholas Cernotta Director (Non-executive) Rebecca Hayward Director (Non-executive)
(ii) Named Executives Trevor Eton Chief Financial Officer and Company Secretary Boyd Timler Chief Operating Officer (from 3 April 2019) Benjamin (Ben) Robinson General Manager – Savannah Project (from 13 September 2018 until 14 August 2019) John Hicks General Manager - Exploration Timothy (Tim) Mason General Manager – Projects and Innovation Rochelle Lampard General Manager – Human Resources (from 1 October 2018) (b) Remuneration Philosophy The performance of the Company depends upon the quality of its directors and executives. To prosper, the Company must attract, motivate and retain highly skilled directors and executives. To this end, the Company embodies the following principles in its remuneration framework:
• Provide competitive rewards to attract high calibre executives; • Link executive rewards to shareholder value and company profits; • Significant portion of executive remuneration 'at risk', dependent upon meeting pre-determined
performance benchmarks; and • Establish appropriate and demanding performance hurdles in relation to variable executive
remuneration. (c) Remuneration Committee The Remuneration Committee of the Board of Directors of the Company is responsible for determining and reviewing compensation arrangements for the Managing Director and the senior executive team. The Remuneration Committee assesses the appropriateness of the nature and amount of remuneration of executives on a periodic basis by reference to relevant employment market conditions, with the overall objective of ensuring maximum stakeholder benefit from the retention of a high quality, high performing and committed senior executive team. (d) Remuneration Structure In accordance with best practice corporate governance, the remuneration structure of the non-executive directors, and senior management, is separate and distinct.
For
per
sona
l use
onl
y

2019 ANNUAL REPORT | PAGE 37
Directors' report For the financial year ended 30 June 2019
(e) Use of remuneration consultants Where appropriate, the Remuneration Committee and the Board seek advice from independent remuneration consultants to ensure the remuneration paid to the non-executive directors and senior management is appropriate and in line with the market. As defined under the Corporations Amendment (Improving Accountability on Director and Executive Remuneration), the Remuneration Committee received remuneration advice from BDO Remuneration and Reward Services Pty Ltd (“BDO”) in the first two months of the 2018/19 financial year, on the design and structure of a new Short Term Incentive (STI) and Long Term Incentive (LTI) scheme for the Group’s KMP and other senior managers. For this remuneration advice, BDO was paid a fee of $31,250 (ex GST). Following the giving of the remuneration advice from BDO and the ensuing discussions between BDO and the Remuneration Committee, as recommended by BDO and adopted for good corporate governance, the final design and approval of the two schemes was made solely by the Company’s Non-Executive Directors, thereby ensuring there was no undue input or influence by any member of the KMP.
(f) Non-executive director remuneration policy (i) Fixed Remuneration
Objective The Board seeks to set aggregate remuneration at a level which provides the Company with the ability to attract and retain directors of the highest calibre, whilst incurring a cost which is acceptable to shareholders. Structure The Company's Constitution and the ASX Listing Rules specify that the aggregate remuneration of non-executive directors shall be determined from time to time by a general meeting of shareholders. An amount not exceeding the amount determined is then divided between the directors as agreed. The amount of aggregate remuneration sought to be approved by shareholders and the manner in which it is apportioned amongst directors is reviewed annually. The Board considers fees paid to non-executive directors of comparable companies when undertaking the annual review process. Each director receives a fee for being a director of the Company. This fee is inclusive for each Board committee on which a director is a member. In recognition of the decision in July 2018 to restart mining operations at the Savannah Nickel Project, the Board reviewed the fees paid to non-executive directors. As a result of this review, from 1 September 2019, the fees paid to non-executive directors were increased, with the Non-Executive Chairman’s annual remuneration being increased to $140,000 per annum and other non-executive director’s annual remuneration being increased to $90,000 per annum. In addition, from 1 September 2018, each Chairman of a Board Sub-Committee is paid an annual fee of $10,000. The fees paid to non-executive directors for the period ending 30 June 2019 are detailed in Table 1 on pages 44 and 45 of this report. Fees for the non-executive directors were determined within an aggregate directors’ fee pool limit of $600,000, which was last approved by shareholders on 20 November 2007. (ii) Variable Remuneration The Company does not reward non-executive directors with variable remuneration. Any shares in the Company that are held by non-executive directors at the date of this report are separately purchased and held by each director and have not been issued by the Company as part of each director’s remuneration package (g) Executive Remuneration Objective The Company aims to reward executives with a level and mix of remuneration commensurate with their position and responsibilities within the Company so as to:
• reward executives for Company, operating segment and individual performance against targets set by reference to appropriate benchmarks;
• align the interests of executives with those of shareholders; • link reward with the strategic goals and the performance of the Company; and • ensure total remuneration is competitive by market standards.
.
For
per
sona
l use
onl
y

PAGE 38 | 2019 ANNUAL REPORT
Directors' report For the financial year ended 30 June 2019
Structure In determining the level and make-up of executive remuneration, the Remuneration Committee takes into consideration the operational and economic circumstances the Company is facing and likely to face in the medium term together with the current market levels of remuneration for comparable executive roles. It is the Remuneration Committee’s policy that employment contracts are entered into with the Managing Director and other key management personnel. Details of these KMP contracts are provided on pages 42 to 43. Remuneration consists of the following key elements:
• Fixed Remuneration (base salary, superannuation and non-monetary benefits); and • Variable Remuneration:
o Short Term Incentive Bonus (“STIB”) and Long Term Incentive (“LTI”). The proportion of fixed remuneration and variable remuneration (potential short term and long term incentives if the Company’s operational and economic circumstances permit), is established for each senior executive by the Remuneration Committee. Table 1 on page 44 and 45 details the variable component (%) of the Group’s KMP. Where necessary, when the payment of superannuation on an individual’s STIB would cause the amount of superannuation in any financial year to exceed the applicable statutory concessional maximum superannuation contribution limit, at the individual’s discretion, an equivalent amount of employer superannuation is added to the executive’s base cash salary. (i) Fixed Remuneration Objective The level of fixed remuneration is set so as to provide a base level of remuneration which is both appropriate to the position and is competitive in the market. Fixed remuneration is reviewed by the Remuneration Committee on a regular basis and the process consists of a review of Company-wide, business unit and individual performance, the Company’s operational and economic circumstances, relevant comparative remuneration in the market and internal and, when appropriate, external advice on policies and practices. As noted above, the Remuneration Committee has access to external advice, independent of management. Structure Executives are given the opportunity to receive their fixed (primary) remuneration in a variety of forms including cash and fringe benefits. It is intended that the manner of payment chosen will be optimal for the recipient without creating undue cost for the Company. In recognition of the decision in July 2018 to restart mining operations at the Savannah Nickel Project, the Remuneration Committee reviewed all salaries across the Group. As a result of this review, from 1 September 2018, those senior executives who had accepted a 10% reduction in base salary from 1 July 2016, received an increase in base salary in order to get their base salary back to their pre-July 2016 level. The base salary and other benefits of the Group’s other senior managers were also reviewed at the same time and adjustments were made on a case by case basis. The fixed remuneration component of the Group’s KMP is detailed in Table 1 on page 44 and 45. (ii) Variable Remuneration - Short-term Incentive Bonus (STIB) Following the Nickel Division operations being put on care and maintenance in the 2015/16 financial year, the Remuneration Committee cancelled the STIB scheme that had been in place since 1 January 2010. In recognition of the decision to restart mining operations at the Savannah Nickel Project, in September 2018, the Remuneration Committee introduced a new STIB Scheme for the Group’s KMP and other senior managers.
For
per
sona
l use
onl
y

2019 ANNUAL REPORT | PAGE 39
Directors' report For the financial year ended 30 June 2019
STIB Framework The objective and intention of the new STIB scheme is to encourage and provide an incentive to executives and senior managers to achieve, on a consistent basis, a number of annually set, pre-determined weighted Company (80% weighting) and Individual (20% weighting) Key Performance Indicators (KPIs). In the STIB scheme, each participant is entitled to receive a cash bonus calculated on a certain percentage, depending on the participant’s level of seniority, of their Total Fixed Remuneration (TFR) provided one or more of the KPIs is achieved, but always subject to the Company’s profitability and capacity to pay, namely the annual free cash generated by the consolidated entity must be more than the aggregate STIB payable in that year. The added provision of having the capacity to pay ensures that the cost to the Company is reasonable in the circumstances. For the 2018/19 financial year only, the Company KPIs (80% of the potential STIB) were weighted across (1) 20,000 ore tonnes milled by 31 December 2018 (10%), (2) first concentrate shipment by January 2019 (10%), (3) safety – total recordable injury frequency rate (TRFIR) below industry average (10%), (4) no reported environmental incidents (10%), (5) 3,448 tonnes payable nickel produced in 2018/19 (25%) and (6) weighted average unit cost per tonne milled below A$137.60 per tonne in 2018/19 (35%), all key focus areas in the ramp-up in mining operations in the 12 months to 30 June 2019. In August 2019, the Remuneration Committee determined under their absolute discretion that, despite the achievement on the Company’s KPI on safety, as a result of the Company’s incapacity to pay, no individuals are to receive an STIB in respect to the 2018/19 financial year. (iii) Variable Remuneration - Long Term Incentive (LTI) Objective The objective of a LTI program is to reward and incentivise executives in a manner which aligns this element of remuneration with the creation of shareholder value and to provide greater incentive to the participant focus on the Company’s longer term goals. The Company’s performance during the 2018/19 financial year and for the previous four financial years, and its impact on shareholder wealth, is summarised in the table below. Year Ended 30 June 2019 2018 2017 2016 2015Revenue and other income ($'000) 27,885 1,714 9,666 93,441 200,280Cost of sales of goods ($'000) (20,900) - (8,473) (97,933) (155,048)Royalties ($'000) (1,904) - (490) (4,920) (11,948)Exploration and evaluation ($'000) (671) (487) (493) (4,280) (12,912)Care and maintenance expenses ($'000) (847) (5,474) (7,539) (1,002) (905)Fair value change of financial assets ($'000) (1,511) - - - - Corporate and marketing costs ($'000) (4,929) (4,022) (5,365) (6,729) (7,964)Other (expenses)/income ($'000) 2,273 114 (4) (1,791) (919)EBITDA (before impairment) ($'000) (604) (8,155) (12,698) (23,214) 10,584Depreciation and amortisation ($'000) (7,039) (430) (760) (50,749) (62,124)Net reversal of / (impairment) of assets ($'000) 18,255 (38,511) 9,178 (79,453) 11,864Finance costs ($'000) (1,383) (943) (490) (1,405) (998)Profit /(loss) before tax ($'000) 9,229 (48,039) (4,770) (154,821) (40,674)Income tax benefit (expense) ($'000) - - - 10,462 11,827Net profit/(loss) after tax ($'000) 9,229 (48,039) (4,770) (144,359) (28,847)Earnings/(loss) per share (cents) 2.0 (9.1) (1.0) (42.7) (9.0)Dividends per share (cents) - - - - 1.0Dividends pay out ratio (%) - - - - -Market capitalisation ($'000) 163,307 304,788 94,285 57,857 149,462Closing share price ($ per share) 0.295 0.620 0.220 0.135 0.465 Return on equity (%) 4.6 (26.8) (2.8) (88.0) (18.1)
From 1 July 2014 and until 30 July 2017, LTI grants to executives were delivered in the form of performance rights to shares issued under the old 2010 Panoramic Resources Limited Employee Share Plan (“2010 ES Plan”). On 30 July 2017, the 2010 ES Plan three-year shareholder approval period ended. The final tranche of performance rights under the 2010 ES Plan was the “FY2016 Performance Rights” which were granted on 1 July 2015.
For
per
sona
l use
onl
y
PAGE 40 | 2019 ANNUAL REPORT
Directors' report For the financial year ended 30 June 2019
• FY2016 Performance Rights under 2010 ES Plan The vesting day of the FY2016 Performance Rights was 1 July 2018. On 10 August 2018, the Company issued 2,935,093 ordinary shares to the Group’s KMP and other senior managers following the 100% satisfaction of the two performance hurdles (relative TSR and Resources and Reserves growth performance between 1 July 2015 and 30 June 2018) and three-year time-based vesting hurdle. The Fair Value (FV) on the grant date (1 July 2015) was externally determined at $0.208. Table 3 on page 46 provides details of the movements of Performance Rights granted as compensation to the Managing Director and named executives under the old 2010 ES Plan during the 2018/19 financial year (FY2016 Performance Rights) and during the 2017/18 financial year (FY2015 Performance Rights). New Panoramic Resources Limited Employee Share Plan (“2018 ES Plan”) in the first two months of the 2018/19 financial year, in response of the Company’s operational and economic circumstances changing with the restart of mining operations at the Savannah Nickel Project, the Remuneration Committee with the assistance of BDO, designed a new LTI Plan, named the “Incentive Options & Performance Rights Plan” (“2018 ES Plan”). The 2018 ES Plan was subsequently approved for a three-year period by the Company’s shareholders at the 2018 Annual General Meeting on 21 November 2018. Under the 2018 ES Plan, a KMP and selected senior managers are able to be granted Options and Performance Rights (collectively defined as “Awards”). Notwithstanding that the new 2018 ES Plan includes the Offer and granting of Options, in its discretion, the Remuneration Committee has determined that the grant of Performance Rights is the preferred LTI component of the Company’s executives and senior managers total remuneration for the foreseeable future. This preference is made from the observation that grants of Performance Rights made under prior Company employee share schemes have served their purpose of acting as a key retention tool and focusing executives on future Shareholder value generation. A Performance Right is a right to be issued or transferred a Share at a future point, subject to the satisfaction of Vesting Conditions. No exercise price is payable and eligibility to a grant of Performance Rights under the 2018 ES Plan is at the Board’s discretion. If approved by the Board, a participant under the 2018 ES Plan may be paid, as an alternative, a cash amount equal to the Market Value of a Share as at the date the Performance Right is exercised (“Cash Payment”) instead of being issued or transferred a Share. The LTI dollar value that each KMP and senior managers will be entitled to receive in Performance Rights (or Options if applicable) is set at a fixed percentage of their annual TFR (base salary plus statutory superannuation) and ranges from 25% to 100% of fixed remuneration, depending on the participant’s level of seniority. The number of Performance Rights to shares to be granted is determined by dividing the LTI dollar value by the FV of one Performance Right (as determined by an external independent valuer). Until further notice, future grants of Performance Rights made under the 2018 ES Plan are to be subject to the satisfaction of a time-based service hurdle and three Vesting Conditions over a three-year vesting period. These Vesting Conditions have been reviewed and determined by the Remuneration Committee. Absolute total shareholder return (TSR), relative TSR and Reserves and Resources growth performance, net of depletion, are deemed by the Remuneration Committee as appropriate performance measures of the Company’s performance. Similar split performance conditions are commonly used by other ASX listed resource companies. Absolute TSR and relative TSR are forward-looking performance measures that drives continued and sustainable growth, measuring the return received by Shareholders from holding Shares over the three-year vesting period. No reward will be provided to senior executives and senior managers unless (1) the Company’s absolute TSR is positive and (2) the relative TSR performance positions is at the 50th percentile or greater against a customised peer group. No retesting will be permitted. Notwithstanding these Vesting Conditions, the Board may in its discretion (except to the extent otherwise provided by an Offer to apply for Awards), by written notice to a Participant, resolve to waive or reduce any Vesting Condition applying to an Award in whole or in part. Reserves and Resources metal growth performance is also a forward-looking performance measure and is fundamental to the sustainability of the Company’s economic performance and financial survival. No reward will be provided to executives and senior managers if the Group’s Reserves and Resources are depleted. No retesting will be permitted.
For
per
sona
l use
onl
y

2019 ANNUAL REPORT | PAGE 41
Directors' report For the financial year ended 30 June 2019
In accordance with the Listing Rules and the Corporations Act, grants of Awards (Performance Rights or Options if applicable) under the 2018 ES Plan to the Company’s Managing Director will be subject to approval by the Company’s Shareholders. Approval by Shareholders would also be necessary for any grant of Awards under the 2018 ES Plan to the non-executive directors. There were no Awards granted to the named executives and senior managers under the 2018 ES Plan during the 2018/19 financial year. There have been no Awards to the named executives and senior managers under the 2018 ES Plan since the end of the financial period and the date of signing the 2019 Directors’ report No Hedging Contracts on LTI Grants The Company does not permit executives or senior managers to enter into contracts to hedge their exposure to options or performance rights to shares granted as part of their remuneration package. This policy is strictly enforced by the Managing Director under the Company’s Share Trading Policy detailed in the Corporate Governance Statement on page 54. (h) Employment contracts (i) Non-Executive Chairman The Non-Executive Chairman, Brian Phillips, commenced in his role on 17 November 2011 under the following terms: • Brian Phillips may resign from his position and thus terminate his directorship on written notice. • The Company must provide 6 months written notice or provide payment in lieu of the notice period ($70,000),
based on the fixed component of Brian Phillips’ remuneration if termination is initiated by the Company, except where termination is from serious misconduct.
• The Company may terminate his directorship at any time without notice if serious misconduct has occurred. In this situation, the Non-Executive Chairman is only entitled to that portion of remuneration which is fixed, and only up to the date of termination.
(ii) Non-Executive Directors All other non-executive directors conduct their duties under the following terms: • A non-executive director may resign from their position and thus terminate their contract on written notice. • The Company may terminate a directorship by providing 6 months’ written notice or provide payment in lieu
of the notice period (based on the fixed component of the non-executive director’s remuneration) if termination is initiated by the Company, except where termination is from serious misconduct.
Non-Executive Director Amount payable on
termination Peter Sullivan $50,000 Nicholas Cernotta $50,000 Rebecca Hayward $45,000
• The Company may terminate a directorship at any time without notice if serious misconduct has occurred.
Where termination with such cause occurs, the non-executive director is only entitled to that portion of remuneration which is fixed, and only up to the date of termination.
For
per
sona
l use
onl
y

PAGE 42 | 2019 ANNUAL REPORT
Directors' report For the financial year ended 30 June 2019
(iii) Managing Director The Managing Director, Peter Harold, is employed under a contract that commenced on 1 January 2010. The key features of his employment contract (Contract) are: • The term of the Contract was initially for a minimum of 12 months, and is now able to be terminated on 6
months notice from Peter Harold, and on 12 months notice from the Company (on 19 August 2019, the Company gave Peter Harold a 12 month notice of termination). Termination is immediate (with no payment in lieu of notice) under certain events. Since 1 January 2011, the fixed remuneration per annum of Peter Harold’s Contract has been subject to review on an annual basis.
• The Company may make STIB payments to Peter Harold, firstly, up to a maximum of 75% of Peter Harold’s fixed remuneration per annum under the First Part (Financial Performance), and secondly, up to a maximum of 25% of Peter Harold’s fixed remuneration per annum under the discretionary Second Part (Core Values). The Cash bonus under the First Part (Financial Performance) will be calculated at the end of the Relevant Financial Year using figures obtained from the audited consolidated financial statements of the Company for the Relevant Financial Year, in accordance with the following formula:
CPH = [P - (E x 15%)] x 2.5%, where
CPH = the Cash bonus to be paid to Peter Harold for the Relevant Financial Year; P = Earnings Before Interest and Tax (“EBIT”) of the Company (on a consolidated basis) for the Relevant Financial Year; E = the average of (1) the “Total Assets” line item of the audited consolidated balance sheet of the Company (on a consolidated basis) for the Relevant Financial Year and (2) the “Total Assets” line item of the audited consolidated balance sheet of the Company for the year immediately preceding the Relevant Financial Year. “Total Assets” includes current and non-current assets.
• Peter Harold may resign from his position and thus terminate the Contract by giving 6 months written notice. Any vested unlisted options not exercised, if applicable, will be forfeited 4 weeks after notice of resignation. Peter Harold will not receive any accrued benefits of the executive STIB scheme in the event that he gives notice.
• Peter Harold accrues 5 weeks of annual leave entitlements per year and 13 weeks of long service leave entitlements for every 10 years of service.
• If the Company terminates Peter Harold’s Contract, other than lawfully in accordance with its terms, Peter Harold will be entitled to be paid his accrued First Part (Financial Performance) at the time notice of the termination is given based on the calculated STIB at the end of the previous quarter in the Relevant Financial Year, up to the maximum of 75% of Peter Harold’s fixed remuneration per annum. Any payment of a Cash bonus under the Second Part (Core Values) will be at the discretion of the Remuneration Committee. If Peter Harold works out the whole or any part of his notice period, he will be entitled to his accrued First Part (Financial Performance) during the period after the notice is given until such time as he stops working.
• If there is a Change of Control Event, Peter Harold will be entitled to be paid his accrued First Part (Financial Performance) at the time of the Change of Control based on the calculated STIB at the end of the previous quarter in the Relevant Financial Year, up to the maximum of 75% of Peter Harold’s fixed remuneration per annum. Any payment of a Cash bonus under the Second Part (Core Values) will be at the discretion of the Board. If the Board is unable to determine for any reason the accrued and discretionary benefits to Peter Harold, Peter Harold will be entitled to be paid an accrued STIB based on 100% of Peter Harold’s fixed remuneration per annum.
• From 1 July 2014 until 30 July 2017, for the granting of performance rights to shares at zero cost under the old 2010 ES Plan, Peter Harold was entitled to receive up to 100% of his annual Fixed Remuneration in Performance Rights to shares. On 20 November 2015 at a General Meeting of shareholders, Peter Harold was granted 1,450,000 FY2016 performance rights at zero cost under the 2010 ES Plan (with 1,450,000 FY2016 performance rights vesting on 1 July 2018). The FV of each Performance Right on 20 November 2015 was externally determined at $0.208. On 30 July 2014 at a General Meeting of shareholders, Peter Harold was granted 904,601 FY2015 Performance Rights at zero cost under the 2010 ES Plan (with 678,446 of the 904,601 FY2015 performance rights vesting on 1 July 2017). The FV of each Performance Right on 30 July 2014 was externally determined at $0.71. F
or p
erso
nal u
se o
nly

2019 ANNUAL REPORT | PAGE 43
Directors' report For the financial year ended 30 June 2019
• If Peter Harold’s employment contract is terminated after a Change of Control of the Company, other than lawfully
in accordance with its terms, then, if applicable at the time, the Company may determine in its sole and absolute discretion, the manner in which granted Performance Rights will be dealt with, including (but not limited to) allowing Peter Harold to exercise all or a proportion of the Performance Rights within such time as determined, after which the Performance Rights will lapse and be cancelled.
(iv) Other Named Executives The other named executives and the commencement date of their contracts are as follows:
Named Executive Date of Current Employment Contract Position
Trevor Eton 1 July 2016 Chief Financial Officer and Company Secretary Boyd Timler 3 April 2019 Chief Operating Officer Ben Robinson@ 13 September 2018 General Manager – Savannah Project John Hicks 1 July 2016 General Manager – Exploration Tim Mason 1 July 2016 General Manager – Projects and Innovation Rochelle Lampard 1 October 2018 General Manager – Human Resources @ Mr. B P Robinson left the Company on 14 August 2019. The details of his terminated employment contract are not disclosed. Employment Contracts Trevor Eton, John Hicks and Tim Mason are each employed under individual open common law employment contracts with no fixed term. The common key features of their employment contracts are: • Each executive may resign from their position and thus terminate their contract by giving 3 months written
notice. Any vested unlisted options not exercised, if applicable, will be forfeited 4 weeks from the date of resignation.
• The Company may terminate a named executive’s employment contract by providing 4 months written notice or provide payment based on each executive’s fixed remuneration per annum in lieu of the notice period. In the event of a termination in employment through a Change in Control of the Company, the Company will provide 6 months written notice or provide payment based on each executive’s fixed remuneration per annum in lieu of notice.
• The Company may terminate the contract at any time without notice if serious misconduct has occurred. When termination with such cause occurs, the executive is only entitled to that portion of remuneration which is fixed, and only up to the date that notice of termination is given. On termination with such cause, any unvested options or LTI grants in the form of Performance Rights, if applicable, will immediately be forfeited. Any vested unlisted options not exercised within 4 weeks of such notice of termination will be forfeited.
• Under the 2018 ES Plan, if a company (Acquiring Company) obtains control of the Company as a result of a Change of Control and both the Company, the Acquiring Company and the executive agree, the executive may, in respect of any vested Awards (options and Performance Rights) that are exercised, be provided with shares of the Acquiring Company, or its parent, in lieu of Shares, on substantially the same terms and subject to substantially the same conditions as the Shares, but with appropriate adjustments to the number and kind of shares subject to the Awards.
• Each executive accrues 4 weeks of annual leave entitlements per year and 13 weeks of long service leave entitlement for every 10 years of service.
Boyd Timler and Rebecca Lampard are each employed under an individual employment contract with no fixed term, with entitlements covered by national workplace laws included in the National Employment Standards (NES) as set out in the Fair Work Act 2009 (Cth) (FW Act). Key features of their employment contracts are:
• Boyd Timler may resign from his position and thus terminate his contract, after completing a 6 months probationary period, by giving 3 months written notice. Rebecca Lampard may resign from her position and thus terminate her contract by giving 4 weeks written notice. For both employees, any vested unlisted options not exercised, if applicable, will be forfeited 4 weeks from the date of resignation.
For
per
sona
l use
onl
y
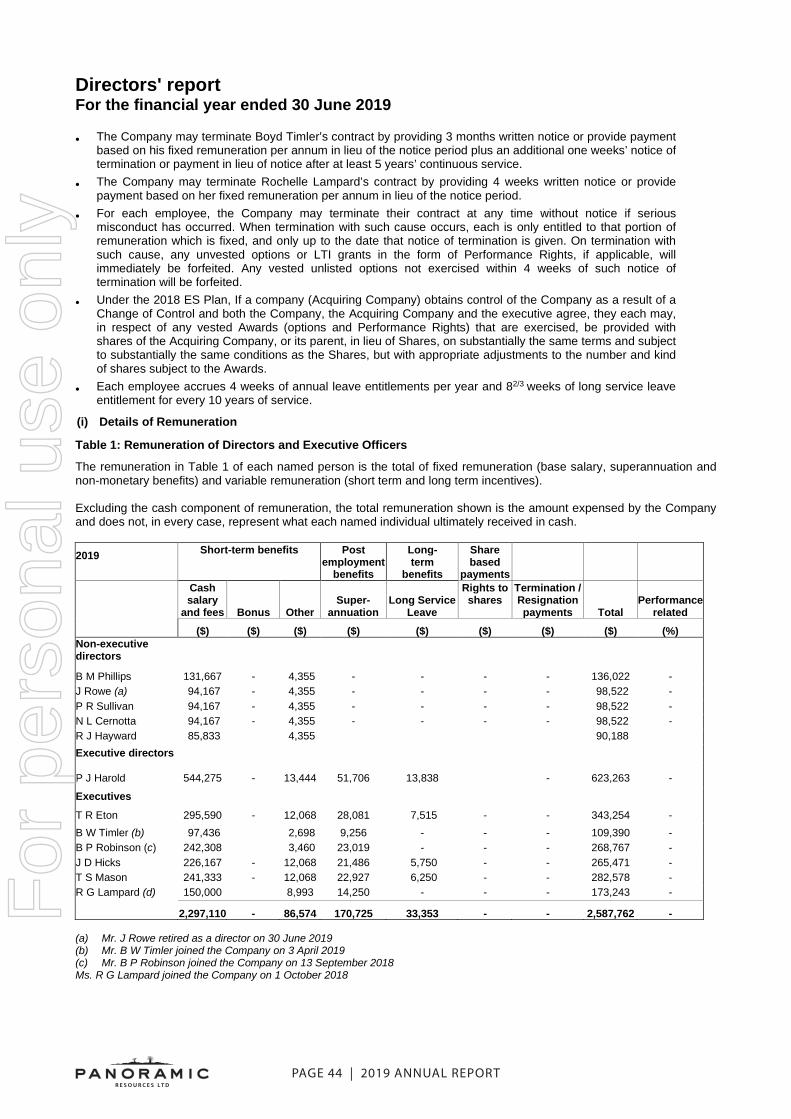
PAGE 44 | 2019 ANNUAL REPORT
Directors' report For the financial year ended 30 June 2019
• The Company may terminate Boyd Timler’s contract by providing 3 months written notice or provide payment based on his fixed remuneration per annum in lieu of the notice period plus an additional one weeks’ notice of termination or payment in lieu of notice after at least 5 years’ continuous service.
• The Company may terminate Rochelle Lampard’s contract by providing 4 weeks written notice or provide payment based on her fixed remuneration per annum in lieu of the notice period.
• For each employee, the Company may terminate their contract at any time without notice if serious misconduct has occurred. When termination with such cause occurs, each is only entitled to that portion of remuneration which is fixed, and only up to the date that notice of termination is given. On termination with such cause, any unvested options or LTI grants in the form of Performance Rights, if applicable, will immediately be forfeited. Any vested unlisted options not exercised within 4 weeks of such notice of termination will be forfeited.
• Under the 2018 ES Plan, If a company (Acquiring Company) obtains control of the Company as a result of a Change of Control and both the Company, the Acquiring Company and the executive agree, they each may, in respect of any vested Awards (options and Performance Rights) that are exercised, be provided with shares of the Acquiring Company, or its parent, in lieu of Shares, on substantially the same terms and subject to substantially the same conditions as the Shares, but with appropriate adjustments to the number and kind of shares subject to the Awards.
• Each employee accrues 4 weeks of annual leave entitlements per year and 82/3 weeks of long service leave entitlement for every 10 years of service.
(i) Details of Remuneration Table 1: Remuneration of Directors and Executive Officers The remuneration in Table 1 of each named person is the total of fixed remuneration (base salary, superannuation and non-monetary benefits) and variable remuneration (short term and long term incentives). Excluding the cash component of remuneration, the total remuneration shown is the amount expensed by the Company and does not, in every case, represent what each named individual ultimately received in cash. 2019 Short-term benefits Post
employment benefits
Long- term
benefits Share based
payments
Cash salary
and fees Bonus Other Super-
annuation Long Service
Leave
Rights to shares
Termination / Resignation payments Total
Performance related
($) ($) ($) ($) ($) ($) ($) ($) (%) Non-executive directors B M Phillips 131,667 - 4,355 - - - - 136,022 - J Rowe (a) 94,167 - 4,355 - - - - 98,522 - P R Sullivan 94,167 - 4,355 - - - - 98,522 - N L Cernotta 94,167 - 4,355 - - - - 98,522 - R J Hayward 85,833 4,355 90,188 Executive directors
P J Harold 544,275 - 13,444 51,706 13,838 - 623,263 -
Executives T R Eton 295,590 - 12,068 28,081 7,515 - - 343,254 - B W Timler (b) 97,436 2,698 9,256 - - - 109,390 - B P Robinson (c) 242,308 3,460 23,019 - - - 268,767 - J D Hicks 226,167 - 12,068 21,486 5,750 - - 265,471 - T S Mason 241,333 - 12,068 22,927 6,250 - - 282,578 - R G Lampard (d) 150,000 8,993 14,250 - - - 173,243 -
2,297,110 - 86,574 170,725 33,353 - - 2,587,762 -
(a) Mr. J Rowe retired as a director on 30 June 2019 (b) Mr. B W Timler joined the Company on 3 April 2019 (c) Mr. B P Robinson joined the Company on 13 September 2018 Ms. R G Lampard joined the Company on 1 October 2018
For
per
sona
l use
onl
y

2019 ANNUAL REPORT | PAGE 45
Directors' report For the financial year ended 30 June 2019
2018 Short-term benefits Post employment
benefits Long- term
benefits Share based
payments
Cash salary
and fees Bonus Other Super-
annuation Long Service
Leave
Rights to shares
(a) Termination / Resignation payments Total
Performance related
($) ($) ($) ($) ($) ($) ($) ($) (%) Non-executive directors B M Phillips 90,000 - 2,244 - - - - 92,244 - J Rowe 65,000 - 2,244 - - - - 67,244 - P R Sullivan 65,000 - 2,244 - - - - 67,244 - N L Cernotta (b) 10,833 - 363 - - - - 11,196 - R J Hayward (c) 1,806 55 1,861 Executive directors P J Harold 498,150 - 11,770 47,324 12,454 116,245 - 685,943 17
Executives T R Eton 270,540 - 10,394 25,701 6,764 47,575 - 360,974 13 J D Hicks (d) 207,000 - 45,266 19,665 5,175 24,267 - 301,373 8 T S Mason 198,000 - 10,394 18,810 4,950 23,212 - 255,366 9
1,406,329 - 84,974 111,500 29,343 211,299 - 1,843,445 11 (a) Includes the non-cash amortisation expense of the FY2016 LTI performance rights to shares over the period (b) Mr. N L Cernotta joined the Company on 2 May 2018 (c) Ms. R J Hayward joined the Company on 21 June 2018 (d) Mr. J D Hicks short term benefits in “Other” includes a cash payment of $34,872 for unused annual leave (j) Details of share based compensation and bonuses (a) Securities granted as part of remuneration Table 2: Securities granted as part of remuneration during the year Performance Rights to Shares • 2018/19 Financial Year:
No performance rights to shares were granted as compensation to key management personnel (KMP).
• 2017/18 Financial Year:
No performance rights to shares were granted as compensation to key management personnel (KMP).
Options • 2018/19 Financial Year:
No options were granted as compensation to key management personnel (KMP).
• 2017/18 Financial Year:
No options were granted as compensation to key management personnel (KMP).
For
per
sona
l use
onl
y

PAGE 46 | 2019 ANNUAL REPORT
Directors' report For the financial year ended 30 June 2019
The fair value of one performance right is determined using a Binomial valuation model (for non-market vesting conditions) and a Monte Carlo simulation model (for market vesting conditions), that takes into account the share price at grant date and expected price volatility of the underlying Share, the expected dividend yield and the risk-free rate for the term of the right at the date of grant There were 2,635,679 ordinary shares issued to key management personnel on the exercise of securities (FY2016 Performance Rights) during the financial year (2018: 1,230,580 ordinary shares issued to KMP on the exercise of securities (FY2015 Performance Rights)). (b) Equity instrument disclosures relating to key management personnel Securities provided as remuneration Details of securities provided as remuneration are shown in Table 3. The terms and conditions of the securities are provided in pages 46, 47 and 48. Security holdings The number of securities (performance rights) over ordinary shares in the Company held during the financial year by the Managing Director of Panoramic Resources Limited and other key management personnel (KMP) of the Group, including their personally related parties are provided in the following table. Table 3: Securities holdings of managing director and specified executives
2019 Performance Rights
Balance at start of the
year Granted as compen-
sation
Exercised Other
changes#
Balance at end of the
year Vested and exercisable Unvested
(number) (number) (number) (number) (number) (number) (number) Managing director of Panoramic Resources Limited P J Harold 1,450,000 - (1,450,000) - - - - Other key management personnel of the Group T R Eton 593,432 - (593,432) - - - - B W Timler - - - - - - - B P Robinson - - - - - - - J D Hicks 302,704 - (302,704) - - - - T S Mason 289,543 - (289,543) - - - - R G Lampard - - - - - - - 2,635,679 - (2,635,679) - - - -
2018 Performance Rights
Balance at start of the
year Granted as compen-
sation
Exercised Other
changes#
Balance at end of the
year Vested and exercisable Unvested
(number) (number) (number) (number) (number) (number) (number) Managing director of Panoramic Resources Limited P J Harold 2,354,601 - (678,446) (226,155) 1,450,000 - 1,450,000 Other key management personnel of the Group T R Eton 961,891 - (276,343) (92,116) 593,432 - 593,432 J D Hicks 490,652 - (140,960) (46,988) 302,704 - 302,704 T S Mason 469,319 - (134,831) (44,945) 289,543 - 289,543 4,276,463 - (1,230,580) (410,204) 2,635,679 - 2,635,679 # Other changes relate to performance rights that did not satisfy the performance hurdles and lapsed F
or p
erso
nal u
se o
nly

2019 ANNUAL REPORT | PAGE 47
Directors' report For the financial year ended 30 June 2019
Share holdings
The numbers of shares in the Company held during the financial year by each director of Panoramic Resources Limited and other key management personnel (KMP) of the Group, including their personally related parties, are set out below. There were no shares granted during the reporting period as remuneration.
2019 Ordinary Shares
Balance at the start of
the year
Received during the year on the
exercise of options
Received on vesting of rights
to deferred shares
Other changes
during the year
Balance at end of the
year (number) (number) (number) (number) (number) Directors of Panoramic Resources Limited P J Harold 5,246,160 - 1,450,000 - 6,696,160 B M Phillips 328,466 - - 25,267 353,733 J Rowe 99,894 - - (99,894) - P R Sullivan - - - - - N L Cernotta - - - - - R J Hayward - - - - -
Other key management personnel of the Group T R Eton 96,343 - 593,432 1,053 690,828 B W Timler - - - B P Robinson - - - 62,587 62,587 J D Hicks 497,646 - 302,704 61,567 861,917 T S Mason 160,293 - 289,543 - 449,836 R G Lampard - - - - - 6,428,802 - 2,635,679 50,580 9,115,061
2018 Ordinary Shares
Balance at the start of
the year
Received during the year on the
exercise of options
Received on vesting of rights
to deferred shares
Other changes
during the year
Balance at end of the
year (number) (number) (number) (number) (number) Directors of Panoramic Resources Limited P J Harold 4,567,714 - 678,446 - 5,246,160 B M Phillips 287,407 - - 41,059 328,466 J Rowe 87,407 - - 12,487 99,894 P R Sullivan - - - - - N L Cernotta - - - - - R J Hayward - - - - -
Other key management personnel of the Group T R Eton 70,000 - 276,343 (250,000) 96,343 J D Hicks 306,751 - 140,960 49,935 497,646 T S Mason 2,340 - 134,831 23,122 160,293 5,321,619 - 1,230,580 (123,397) 6,428,802
All equity transactions with key management personnel other than those arising from the exercise of performance rights to shares have been entered into on terms and conditions no more favourable than those the Group would have adopted if dealing at arm's length.
For
per
sona
l use
onl
y

PAGE 48 | 2019 ANNUAL REPORT
Directors' report For the financial year ended 30 June 2019
Securities granted and exercised as part of remuneration for the year ended 30 June 2019 and 30 June 2018 2019
Value of securities granted during the year
Value of securities exercised during the year (a)
Value of securities lapsed during the year
Performance Rights ($) ($) ($) P J Harold - 899,000 - T R Eton - 367,928 - B W Timler - - - B P Robinson - - - J D Hicks - 187,676 - T S Mason - 179,517 - G W Lampard - - - (a) The Company’s 29 June 2018 closing share price of $0.62 per share was used to value the securities exercised 2018
Value of securities granted during the year
Value of securities exercised during the year (b)
Value of securities lapsed during the year #
Performance Rights ($) ($) ($) P J Harold - 149,258 49,754 T R Eton - 60,795 20,046 J D Hicks - 31,011 10,337 T S Mason - 29,663 9,888 (b) The Company’s 30 June 2017 closing share price of $0.22 per share was used to value the securities exercised # Refer to Table 3 on page 46 for the number of performance rights to shares lapsed and cancelled
There were no alterations to the terms and conditions of securities granted as remuneration from their grant date until their vesting date. KMP Transactions There were no loans to key management personnel and their related parties at any time during the year ended 30 June 2019. There were no transactions involving key management personnel and their related parties other than compensation and transaction concerning shares and performance rights to shares as discussed in the remuneration report. This marks the end of the 2019 Remuneration Report.
Environmental regulation
The Group’s operations are subject to significant environmental regulations under both Commonwealth and State legislation in relation to its development, mining and exploration activities. The Group’s management monitors compliance with the relevant environmental legislation. The directors are not aware of any serious breaches of the legislation during the period covered by this report.
For
per
sona
l use
onl
y

2019 ANNUAL REPORT | PAGE 49
Directors' report For the financial year ended 30 June 2019
Rounding of Amounts
The amounts contained in this report and in the financial report have been rounded to the nearest $1,000 (where rounding is applicable) under the option available to the Company under Australian Securities and Investments Commission Corporations (Rounding in Financial/Directors’ Reports) Instrument 2016/191, dated 24 March 2016. Auditor's Independence Declaration
Section 307C of the Corporations Act 2001 requires our auditors, Ernst & Young (EY), to provide the directors of Panoramic Resources Limited with an Independence Declaration in relation to the audit of the financial report for the year ended 30 June 2019. This Independence Declaration is attached to the Directors’ Report and forms a part of the Directors’ Report. Non-audit Services The following non-audit services were provided by the entity’s auditor, Ernst & Young (EY). The directors are satisfied that the provision of non-audit services is compatible with the general standard of independence for auditors imposed by the Corporations Act. The nature and scope of each type of non-audit service provided means that auditor independence was not compromised. Ernst & Young (EY) received or are due to receive the following amounts for the provision of non-audit services: • Tax Compliance and other services of $102,313. Signed in accordance with a resolution of the directors.
Peter Harold Managing Director Perth, 30 August 2019 Competent Person Statements
The information in this report that relates to exploration activities has been complied or reviewed by John Hicks. Mr Hicks is a member of the Australasian Institute of Mining and Metallurgy (AusIMM) and is a full-time employee and shareholder of Panoramic Resources Limited. The aforementioned has sufficient experience that is relevant to the style of mineralisation and type of target/deposit under consideration and to the activity which he is undertaking to qualify as a Competent Person as defined in the 2012 Edition of the Australian Code for Reporting of Exploration Results, Mineral Resources and Ore Reserves. Mr Hicks consents to the inclusion in the report of the matters based on the information in the form and context in which it appears.
No New Information or Data
This report contains references to exploration results, Mineral Resource and Ore Reserve estimates, and feasibility study results including production targets, all of which have been cross referenced to previous market announcements made by the Company. The Company confirms that it is not aware of any new information or data that materially affects the information included in the relevant market announcements and, in the case of estimates of Mineral Resource and Ore Reserve estimates, and feasibility study results including production targets, that all material assumptions and technical parameters underpinning the estimates in the relevant market announcement continue to apply and have not materially changed.
For
per
sona
l use
onl
y

PAGE 50 | 2019 ANNUAL REPORT
Corporate governance statement
The Board of Directors of Panoramic Resources Limited (“the Board”) is responsible for the corporate governance of the Company. The Board guides and monitors the business and affairs of Panoramic Resources Limited on behalf of the shareholders by whom they are elected and to whom they are accountable. The Company’s Corporate Governance Statement (“Statement”) outlines the main corporate governance practices in place throughout the financial year, which comply with the Australian Securities Exchange (“ASX”) Corporate Governance Council’s (“CGC”) Third Edition (March 2014) of the “Corporate Governance Principles and Recommendations (“the Recommendations”), unless otherwise stated. As required under ASX Listing Rule 4.10.3, the Company makes the following Board approved disclosures in relation to each of the Recommendations. Principle 1: Lay Foundations for Management and Oversight Primary Role of the Board The Board’s primary role is the protection and enhancement of long-term shareholder value. Board Operation To ensure the Board is well equipped to discharge its responsibilities, the Board has adopted a formal Board Charter. The Board Charter details the Board’s role, authority, responsibilities, membership and operation and sets out the matters specifically reserved for the Board and the powers delegated to any of its Committees and to management. In addition, Article 11 of the Company’s Constitution (November 2008) (“Constitution”) details the specific powers and duties of directors as empowered on them by the Company’s shareholders
The Board Charter can be viewed on the Company’s website at www.panoramicresources.com under the Corporate Governance section.
Board Processes The Board is responsible for the overall Corporate Governance of the Company including the strategic direction, establishing goals for executive management and monitoring the achievement of these goals. The Board has established a framework for the management of the Company and its controlled entities, a framework which divides the functions of running the Company between the Board, the Managing Director and the senior executives. The Board has put in place a system of internal control, a pro-active business risk management process, and has the task of monitoring financial performance and the establishment of appropriate ethical standards. The agenda for meetings of the Board is prepared by the Managing Director. Standard items include the project reports, financial reports, strategic matters, governance and compliance. Submissions are circulated in advance. Senior executives are regularly involved in Board discussions. The Company Secretary of the Company is directly accountable to the Board, through the Chairman, on all matters to do with the proper functioning of the Board. The Company Secretary is to facilitate and monitor the implementation of Board policies and procedures and is to provide advice to the Board on the application of the Board Charter, the Company’s Constitution, corporate governance matters, ASX Listing Rules and other applicable laws.
Roles of Management and the Evaluation of Management Performance The Managing Director and the senior executives are ultimately responsible and accountable for the day to day running of the Company and for implementing the strategic objectives and operating within the risk appetite set by the Board. The Board regularly reviews the division of functions between the Board and the senior executives. The Board has recently updated the process of updating the performance appraisal and remuneration system for the Managing Director and senior executives to enhance performance and Management performance is reviewed on an annual basis at the end of financial year and as appropriate. The criterion for the evaluation of the Managing Director and of each executive is their performance against Company and individual key performance indicators, behavior and effectiveness in role. In addition, the Board monitors and evaluates the performance of the Managing Director and senior executives as appropriate.
Principle 1: Lay Foundations for Management and Oversight (continued) Appointment of Directors and Management The Company has in place an appropriate organisational and management structure to ensure the day to day running of the Company is undertaken in an effective and efficient manner and to ensure the Company has the right mix of skills and resources to implement and achieve the Board’s corporate and strategic objectives. The Board and the Managing Director regularly reviews this structure to determine that it is appropriate and “fit for purpose” and if necessary make changes in the number of roles and personnel. The directors and senior executives have a clear understanding of their duties, roles and responsibilities and of the expectations of them, as contained within a written agreement agreed and signed by the Company and each director and senior executive.
For
per
sona
l use
onl
y
2019 ANNUAL REPORT | PAGE 51
Corporate governance statement The Board reviews its composition as required to ensure that the Board has the appropriate mix of commercial, financial and mining skills, technical expertise, industry experience, and diversity (including, but not limited to gender and age) for which the Board is looking to achieve in its membership. When a vacancy exists, for whatever reason, or where it is considered that the Board would benefit from the services of a new director with particular skills, candidates with the appropriate experience, expertise and diversity are considered. Under the direction and supervision of the Chair, appropriate background checks are undertaken of each candidate as to the person’s character, experience, education, criminal record and bankruptcy history. Each incumbent director is encouraged, and given the opportunity to meet with each candidate on a one to one basis. The full Board then appoints the most suitable candidate who must stand for election at the next general meeting of shareholders. For the meeting, shareholders are given sufficient information of the new director, including but not limited to biographical details, other listed directorships currently held and in the case of a director standing for election for the first time, advice that appropriate background checks have been undertaken. Diversity Policy The Company has in place a Diversity Policy which provides the written framework and objectives for achieving a work environment that values and utilises the contributions of employees with diverse backgrounds, experiences, and perspectives, irrespective of gender, age, ethnicity and cultural background. The Board is responsible for developing, where possible, measurable objectives and strategies to support the framework and objectives of the Diversity Policy. The Remuneration Committee is responsible for monitoring the progress of the measurable objectives through various monitoring, evaluation and reporting mechanisms. Apart from participation rates established for indigenous employment at the Savannah nickel project prescribed under the 2007 Savannah Co-Existence Agreement (and as reported below), the Board has not determined measurable objectives on gender diversity across the workplace and at the Board level. In the coming financial year, the Board is to continue to oversee the development of new programs to achieve a broader pool of skilled and experienced senior management and Board candidates, and if deemed appropriate, identify future and targeted measurable objectives and strategies on gender diversity. Pursuant to Recommendation 1.5 of the Recommendations, the Company discloses the following information as at the date of this report:
• Percentage of women and men employed within the Group - women: 13%; men: 87%; • Percentage of women and men employed as a senior executive - women: 20%; men: 80%; • Percentage of women and men employed at the Board level - women: 20%; men: 80%; and • Percentage of indigenous employees at the Savannah Nickel Project – 6%.
The Company has defined an employee who is a senior executive as a person who is a “senior manager” as defined in Section 9 (Definitions) of the Corporations Act 2001, namely a person who is at the highest management level of the Company who “makes, or participates in making decisions that affect the whole, or a substantial part, of the business of the corporation; or has the capacity to affect significantly the corporation’s financial standing”. The performance appraisal of a senior executive is performed by the Managing Director and the Remuneration Committee.
The Diversity Policy can be accessed on the Company’s website at www.panoramicresources.com under the Corporate Governance section. Performance Assessment of the Board, its Committees and Individual Directors Currently, there is no formal annual performance appraisal system in place for Board performance on a director by director basis. In the coming year, each Director performance will be discussed informally, whereby the performance of individual members and the performance of the Board as a whole, will be assessed. The Board has agreed to conduct these informal performance assessments until such time as a suitable formal performance appraisal system has been put in place. Membership of the Audit Committee by non-executive directors is initially for a three-year period, with an annual renewal review thereafter with performance being one criteria in order to retain office. Principle 2: Structure the Board to Add Value Board Composition The composition of the Board is determined using the following principles:
• The Board currently comprises five directors. Under Article 10 of the Company’s Constitution, this number may be increased to a maximum of ten directors where it is required due to a commercial alliance, or felt that additional expertise is required in specific areas, or when an outstanding candidate is identified;
• The Board should comprise directors with a broad range of expertise with an emphasis on commercial, exploration, mining and project development related experience; and
• Directors appointed by the Board are subject to election by shareholders at the following annual general meeting and thereafter directors (other than the Managing Director) are subject to re-election at least every three years. The tenure of executive directors is linked to their holding of executive office.
For
per
sona
l use
onl
y

PAGE 52 | 2019 ANNUAL REPORT
Corporate governance statement The name, position, independence classification, qualification, skills and length of service of each director of the Company in office at the date of the Statement is:
Name Position Independence Classification Qualification/Skills Service (yrs)
Brian M Phillips Chairman Independent Mining Engineer, general mining 12
Peter J Harold Managing Director n/a, executive Process Engineer, project development 18
Peter R Sullivan # Non-Executive Director Non Independent
Engineer, corporate and project development 3
Nicholas L Cernotta Non-Executive Director Independent
Mining Engineer, general mining and project development 1
Rebecca J Hayward Non-Executive Director Independent
Lawyer, corporate and project development 1
# Peter R Sullivan is a non-executive director of a substantial shareholder holding more than 5% of the ordinary shares in the Company and as a consequence has been assessed as not being independent under the independence criteria detailed in Recommendation 2.3 of the Recommendations
Nomination committee Due to the size of the Board and the small senior executive team, the Board has determined there is no benefit, at this time, of establishing a nomination committee. The functions of the nomination committee are performed by the Board as a whole, when required, using the principles for setting the composition of the Board. Directors' Independence The composition of the Board is considered to be appropriate for a Company that is in the process of becoming once again a sustainable producing business. In addition, the Company remains active in reviewing, developing or divesting projects in its current portfolio. As at the date of this Statement, the majority of non-executive directors, including the Chairman, are considered independent of management, have no interest, position, association or relationship that would compromise their independence and directly or indirectly, individually hold less than 5% of the issued ordinary shares of the Company. The Independence Criteria detailed in Recommendation 2.3 of the Recommendations in relation to each non-executive director is listed in Annexure A to the Board Charter and each director’s independence is assessed on a regular basis against the Independence Criteria and the quantitative and qualitative Materiality Thresholds (listed in Annexure B of the Board Charter) when appropriate.
Where a director acquires an interest, position, association or relationship described in Recommendation 2.3 of the Recommendations and exceeds the Materiality Thresholds set out in the Board Charter, the director must immediately declare the nature of the interest, position, association or relationship and the Board will determine whether to declare any loss of independence. Director Education The non-executive directors are given every opportunity to gain a better understanding of the business, the industry, and the environment within which the Company operates, and are given access to continuing education opportunities to update and enhance their skills and knowledge. Directors visit the Savannah Nickel Project at least once a year, and meet with executives on a regular basis to enable directors to maintain an understanding of the roles and responsibilities of executives and of the culture and values within the Company. Conflict of Interest In accordance with Section 191 of the Corporations Act 2001 and Article 10.13 of the Company’s Constitution, directors must keep the Board advised, on an ongoing basis, of any interest that could potentially conflict with those of the Company. Where the Board believes that a significant conflict exists, the director concerned does not receive the relevant board papers and is not present at the meeting whilst the item is considered.
Independent professional advice Each director has the right of access to all relevant Company information and to the Company’s executives and, subject to prior consultation with the Chairman, may seek independent professional advice at the Company’s expense. A copy of the advice received by the director is made available to all other members of the Board.
For
per
sona
l use
onl
y

2019 ANNUAL REPORT | PAGE 53
Corporate governance statement Board Committees To facilitate the execution of its responsibilities, the Board’s Committees provide a forum for a more detailed analysis of key issues. Each Committee is entitled to the resources and information it requires to carry out its duties, including direct access to advisors and employees. Membership of the current Committees of the Panoramic Board and the number of times each Committee met during the financial year are set out in the Directors’ Report. The names and functions of each Committee is set out below: • Audit Committee The Audit Committee consists of all non-executive directors and is chaired by an independent director who is not the Chairman of the Board. The Audit Committee is to oversee the financial reporting process to ensure the balance, transparency and integrity of published financial information. The Audit Committee is also to review: the effectiveness of internal controls, recommendation and the appointment and assessing the performance of the external auditor; the Company’s process for monitoring compliance with laws and regulations affecting financial reporting and, if applicable, its code of business conduct. The Audit Committee operates under an Audit Committee Charter that is reviewed by the Committee and is re-approved or changed by the full Board on a bi-annual basis.
• Remuneration Committee The Remuneration Committee consists of all non-executive directors. The Remuneration Committee is chaired by Peter Sullivan, who has been assessed as not being independent under the Independence criteria detailed in Recommendation 2.3 of the Recommendations. The Board believes that Peter Sullivan is an appropriate person for the position of Chair, due, in part, to his extensive corporate experience gained from a previous role as managing director of a large listed resource company and his current directorships of several listed resource companies.
The role of the Remuneration Committee is to review remuneration packages and policies applicable to the Managing Director, other executive directors (if applicable) and senior executives and to monitor the scope and currency of the Company’s Diversity Policy. The remuneration of executive directors is determined by reference to relevant employment market conditions and of the attainment of defined Company goals. The remuneration of senior executives is determined by the Remuneration Committee based on recommendations provided by the Managing Director. Remuneration levels are competitively set to attract the most qualified and experienced directors and senior executives. The Remuneration Committee obtains independent advice on the appropriateness of remuneration packages. There is increased transparency and accountability in remuneration matters as required in the Improving Accountability on Director and Executive Remuneration Bill 2011. There are now rules for engaging remuneration consultants and on reporting specific information about remuneration consultants in the audited Remuneration Report in the Directors’ Report. The Company’s audited 2019 Remuneration Report includes these reporting obligations. Further details on the Committee and of remuneration arrangements in place for the directors and executives are set out in the Directors’ Report. • Risk Committee The Risk Committee consists of all directors and is chaired by Nick Cernotta, an independent director. The role of the Risk Committee is to oversee and monitor the effectiveness of the Group’s strategies and systems to ensure that the Company complies with external and internally accepted standards for the impact of business activities on the environment, the safety and well-being of employees, and on the control and management of the key risks facing the business. Where possible, the Committee meets during Board visits to the mining operations whereby the members of the Committee are able to directly inter face with the senior managers responsible for environmental risks, occupational health and safety risks and the control and mitigation of non-financial risks. The Committee also nominates a non-executive director to attend and be actively involved in the Group’s safety conferences. The Committee operates under a Charter that is reviewed by the committee and is re-approved or changed by the full Board on a bi-annual basis. The Committee Charter can be accessed on the Company’s website at www.panoramicresources.com under the Corporate Governance section.
In August 2018, the Committee convened to review both the Committee Charter and the 2015 Risk Management Guideline and to discuss with management on the rapidly changing business landscape and what risks and challenges the Company would be facing with the transition to a producing company. In May 2019, the Committee was briefed by management on the progress made to date on the review and update of both the Savannah Nickel Project and corporate risk registers which are important inputs in the update and production of a new Risk Management Guideline. Principle 3: Act Ethically and Responsibly All directors, executives, managers and employees are expected to act with the utmost integrity, honesty and objectivity, striving at all times to enhance the performance and reputation of the Company and its controlled entities.
For
per
sona
l use
onl
y

PAGE 54 | 2019 ANNUAL REPORT
Corporate governance statement Code of Conduct The Company has established a written Code of Conduct which outlines the culture, practices, expected conduct, values and behaviour to be displayed by all employees in upholding the integrity, reputation and accountability of the Company and its controlled entities in the work environment and in the interactions with the Company’s various stakeholders. Certain practices are necessary to comply with Federal and Western Australian State industrial legislation and the Corporations Law. The Code of Conduct has a clear responsibility and accountability of employees for reporting and investigating reports of unethical practices by reference to specific rules and policies such as the rules for trading in the Company securities, and the policy on discrimination, harassment and bullying. This code can be accessed on the Company’s website at www.panoramicresources.com under the Corporate Governance section. Trading in Company securities by directors, officers and employees The Company has in place a fit-for-purpose Share Trading Policy for the trading in Company securities by directors, key management personnel, officers and employees as required under ASX Listing Rule 12.12. The Policy is worded to ensure compliance with Section 1043A of the Corporations Law (on insider trading), Part 2D.1 of the Corporations Act 2001 (on the proper duties in relation to the use of inside information), and ASX Listing Rules 3.19A, 12.9, 12.10, and 12.11 and updated Guidance Note 27 (July 2017). The Managing Director and the Company Secretary have been appointed to ensure that the following rules for the trading in Company’s securities are strictly adhered to: • Trading in Company securities is only permitted following the notification of the intention to trade by submitting a
Notification Form with the Managing Director and dealing is not to occur until a receipt of confirmation is received from the Managing Director or, in the case of the Managing Director, from the Chairman;
• Trading in Company securities is prohibited at any time when in possession of unpublished information, which if generally available, might materially affect the price or value of those securities;
• Trading in Company securities is prohibited during specified prohibited periods, known as black-out periods; • Active trading in Company securities, which involves frequent and regular trading in those securities with a view to
derive profit related income from that activity, is prohibited; • The entering into contracts to hedge exposure to equity-based remuneration, is prohibited; and • Only in exceptional circumstances, can approval be obtained in advance from the Managing Director, or in the case
of a director, from the other directors, to trade outside the specified prohibited periods. On an annual basis in December, the Company Secretary circulates to all employees via email, the start and finish dates for the next calendar year’s black-out periods. To monitor compliance with the policy and to give assurance to the Board on compliance with the rules of the Share Trading Policy, the Company Secretary keeps records of the confirmations permitting a trade in the Company’s securities in strict adherence with the rules. This Share Trading Policy can be accessed on the Company’s website at www.panoramicresources.com under the Corporate Governance section. Discrimination, Harassment and Bullying Policy The Company is committed to providing a work environment that is safe, fair and free from discrimination, harassment and bullying for all employees of the Company. All employees are encouraged to follow adopted procedures allowing concerns or instances of illegal conduct or malpractice to be raised in good faith without being subjected to victimisation, harassment or discriminatory treatment, and to have such concerns or instances properly investigated. The Policy provides a mechanism by which all employees can confidentially report improper conduct without fear of discrimination. This policy document can be accessed on the Company's website at www.panoramicresources.com under the Corporate Governance section. Privacy Policy The Company has in place a Privacy Policy which deals with the collection, use, storage and disclosure of information of personal information about an individual who can be identified or who may be reasonably identified by the information. Where sensitive information is collected and stored, the information must not be collected unless the individual consents to collection and the Company is authorised to collect the information by law. The Policy sets out the obligations surrounding the integrity of personal information, security measures, how an individual can access their information and seek correction to it, and make complaint to if necessary. This Privacy Policy can be accessed on the Company’s website at www.panoramicresources.com under the Corporate Governance section.
The Company has a Privacy Data Breach Response Plan (“Plan”), which sets out the required steps to be followed if an actual or potential breach of personal or sensitive information occurs. Following this Plan will help the Company’s employees and contractors to contain, assess and respond to data breaches in a timely manner and to mitigate potential harm to any affected individuals and organisations. This Plan can be accessed on the Company's website at www.panoramicresources.com under the Corporate Governance section.
For
per
sona
l use
onl
y

2019 ANNUAL REPORT | PAGE 55
Corporate governance statement Principle 4: Safeguard Integrity in Corporate Reporting The Managing Director and Chief Financial Officer are required to state in writing to the Audit Committee and the Board that the Company’s and Group’s financial reports present a true and fair view, in all material aspects, of the Company’s and Group’s financial condition and that operational results are in accordance with relevant accounting standards. Pursuant to Section 295A of the Corporations Act 2001, the Managing Director and the Chief Financial Officer are required to provide written certification to the Board, at both the end of the Half-Year and the Full-Year reporting periods, that the Company’s financial reports are based on a sound system of risk management and internal control and that the system is operating effectively. The Audit Committee reviews all final draft external financial reports with the external auditor and makes recommendations on their adequacy to the Board prior to their release to shareholders, investors and other public forums. There is regular communication between the Audit Committee, management and external auditor. In accordance with Section 324DA of the Corporations Act 2001, the audit partner of the external auditor is required to be rotated after five successive financial years. It is the role of the Audit Committee to select the new audit engagement partner as nominated by the external partner after considering each nominated individual’s experience, reputation and independence. In addition, in the absence of an internal audit function, the Audit Committee reviews, assists and assesses the adequacy of the Company’s internal control and financial risk management systems, accounting and business policies. Principle 5: Make Timely and Balanced Disclosure Continuous Disclosure and Shareholder Communication The Company is committed to providing relevant up to date information to its shareholders and the broader investment community in accordance with the continuous disclosure requirements under the ASX Listing Rules and the Corporations Law. The Company has a Continuous Disclosure Policy that all shareholders and investors have equal access to the Company's information. This policy has been updated and approved by the full Board to comply with the April 2014 amendments to ASX Listing Rule 3.1 and updated Guidance Note 8 (August 2018) of the Recommendations. This document and all material announcements provided to the ASX can be accessed on the Company’s website at www.panoramicresources.com. The Company has appointed the Company Secretary to oversee the continuous disclosure practices of the Company and its controlled entities. His responsibilities include: • Reviewing all statutory regulatory or tender reports submitted to or made by the Company and its controlled
entities, and to report or recommend to the Board as appropriate; • Ensuring compliance with continuous disclosure requirements; • Overseeing and coordinating the disclosure of information to the ASX, analysts, brokers, shareholders, the
media and public; and • Educating directors and staff of the Company’s and Group’s disclosure policies and procedures and raising
awareness of the principles of the underlying continuous disclosure. Principle 6: Respect the Rights of Security Holders Continuous Disclosure and Shareholder Communication The Board in adopting a Continuous Disclosure Policy ensures that shareholders are provided with up to date Company information. Communication to shareholders is facilitated by the production of the annual report, quarterly reports, public announcements, and the posting of policies, and ASX releases immediately after their disclosure to the ASX, on the Company’s website. All shareholders are given the option to receive communications from, and send communications to, the Company and Share Registry electronically. In addition, all shareholders are encouraged to attend the Annual General Meeting and use the opportunity to ask questions to management following the Managing Director’s presentation. The Company makes every endeavour to respond to the most commonly asked questions. The external auditor attends the meeting and is available to answer questions in relation to the conduct of the audit.
For
per
sona
l use
onl
y

PAGE 56 | 2019 ANNUAL REPORT
Corporate governance statement Principle 7: Recognise and Manage Risk The Board believes that risk management and compliance are fundamental to sound management and that oversight of such matters is an important responsibility of the Board. Since 2011, the Company has significantly changed the risk management framework through the progressive development of an enterprise-wide software database on the inherent risks and risk mitigation strategies identified across all functions of the business, including occupational, health, safety and environment (OHS&E). This Board sanctioned approach is in accordance with Australian/New Zealand Standard for Risk Management (AS/NZS 4360 2004) and is currently aligned to the control framework for enterprise risk management prepared by the Committee of Sponsoring Organisations of the Treadway Commission (COSO) in 2001.
There are a number of risks the Company’s operations (either directly or in-directly owned) are exposed to, principally when in production, that are both common to the mining industry and unique due to location such as, but not limited to: • exposure to fluctuations in commodity prices and the United States currency foreign exchange rate; • customer declaration of force majeure; • health, safety, industrial and environment matters; • production capacity; • future delivery against committed financial derivatives; and • regulatory constraints, compliance, the impact of climate change and natural disasters. In FY2015, the Company conducted a second comprehensive review of its enterprise wide risk management framework using the process and procedures set down in the 2012 Risk Management Guideline, including the re-setting of various risk appetite tolerance thresholds by senior management, which resulted in the production of Risk Appetite Statements (May 2015), Risk Management Policy (May 2015) and an updated Risk Management Guideline (“Guideline”) that was approved by the full Board in June 2015. A condensed version of the Guideline is available on the Company’s website at www.panoramicresources.com. The Board has established a committee of the Board, the Risk Committee, which is chaired by an independent director. All directors of the Board are also members of the Committee. The number of times the Committee met during the financial year is contained in the Directors’ Report. The Committee’s Charter (August 2018) states that the Committee will oversee the Company’s management of financial and non-financial risks at the operations in accordance with the established risk management framework while always taking into account the Company’s legal obligations set by the Federal and State statutory law makers on, but not limited to, environment, employment and occupational health and safety.
In August 2018, the Risk Committee convened a meeting with management to discuss the various elements of the Company’s risk management framework in light of the decision to restart operations at the Savannah Nickel Project. It was agreed at that meeting to plan and conduct various workshops across the Group to review risk registers, the risk appetite tolerance thresholds and Risk Appetite Statements, with the aim to updating the Guideline as soon as practical. This review and update process is still ongoing. The Risk Committee in its review of the Company’s risk management framework is targeting to incorporate certain aspects of the recent 2018 revision to the International Organisation for Standardisation (ISO) ISO 31000 Standard, which has provided a clearer, shorter and more concise guide on the principles of risk management. In May 2019, the Risk Committee was briefed by management on the progress made to date on the review and update of both the Savannah Nickel Project and corporate risk registers which are important inputs in the update and production of a new Risk Management Guideline. There are strict Company-wide compliance reporting requirements under the Guideline that require each department head/function manager on an annual basis to review their risk registers to determine the level of compliance (from zero to 100%) using a risk matrix score for impact, tolerance and opportunity, thereby ensuring that either a risk(s) has not developed a higher risk profile, or outlining monitoring and corrective measures to reduce the risk(s) to an acceptable level. Using this information, each operations manager is required to complete and provide a Project Risk Summary and Compliance Report during the Full-Year audit process.
In FY2016, FY2017, FY2018 and FY2019, the compliance reporting requirements detailed above were undertaken on a more limited basis as a consequence of the Group’s operations being on either full care and maintenance or for part of the financial year, as was the case in FY2019.
The reporting and control mechanisms, in the absence of an internal audit function, support the written certification at the end of the Half-Year and Full-Year reporting periods, in accordance with Section 295A of the Corporations Act 2001 given by the Managing Director and the Chief Financial Officer to the Board certifying that the Company’s financial reports are based on a sound system of risk management and internal control and that the system is operating effectively.
For
per
sona
l use
onl
y

2019 ANNUAL REPORT | PAGE 57
Corporate governance statement
Principle 8: Remunerate Fairly and Responsibly Board Remuneration The total annual remuneration paid to non-executive directors may not exceed the limit set by the shareholders at an annual general meeting (currently $600,000). The remuneration of the non-executive directors is fixed rather than variable. Executive Remuneration The Board has established a committee of the Board, the Remuneration Committee. The Remuneration Committee provides recommendations and direction for the Company’s remuneration practices. Subject always to the Company’s operational and economic circumstances, the Committee ensures that a significant proportion of each executive’s remuneration is linked to his or her performance and the Company’s performance. Performance reviews are conducted regularly to determine the proportion of remuneration that will be at ‘risk’ for the upcoming year. The Committee also ensures that there is no discrimination on remuneration in respect to gender.
The Company’s executives are able, once again, to participate in a long term employee incentive plan, the shareholder approved 2018 ES Plan, that is linked to the Company’s performance on an absolute and relative share price basis against its peers in the resources industry and on a resources and reserves growth performance basis.
Further details in relation to director and executive remuneration are set out in the 2019 Remuneration Report on pages 36 to 48.
For
per
sona
l use
onl
y

PAGE 58 | 2019 ANNUAL REPORT
Directors' declaration 30 June 2019
In accordance with a resolution of the directors of Panoramic Resources Limited, I state that: 1. In the directors' opinion: (a) the financial statements and notes set out on pages 66 to 122 are in accordance with the Corporations Act
2001, including: (i) giving a true and fair view of the Consolidated entity’s financial position as at 30 June 2019 and of
its performance for the year ended on that date; and (ii) complying with Australian Accounting Standards (including the Australian Accounting
Interpretations) and Corporations Regulations 2001. (b) subject to the achievement of the matters set out in Note 1(b), there are reasonable grounds to believe
that the Company will be able to pay its debts as and when they become due and payable. 2. This declaration has been made after receiving the declarations required to be made to the directors in accordance with sections 295A of the Corporations Act 2001 for the financial period ending 30 June 2019.
3. In the opinion of the directors, as at the date of this declaration, there are reasonable grounds to believe that the members of the Closed Group identified in note 33 will be able to meet any obligations or liabilities to which they are or may become subject, by virtue of the Deed of Cross Guarantee.
On behalf of the Board
Peter Harold Managing Director Perth, 30 August 2019
For
per
sona
l use
onl
y

2019 ANNUAL REPORT | PAGE 59
Directors' declaration 30 June 2019
In accordance with a resolution of the directors of Panoramic Resources Limited, I state that: 1. In the directors' opinion: (a) the financial statements and notes set out on pages 66 to 122 are in accordance with the Corporations Act
2001, including: (i) giving a true and fair view of the Consolidated entity’s financial position as at 30 June 2019 and of
its performance for the year ended on that date; and (ii) complying with Australian Accounting Standards (including the Australian Accounting
Interpretations) and Corporations Regulations 2001. (b) subject to the achievement of the matters set out in Note 1(b), there are reasonable grounds to believe
that the Company will be able to pay its debts as and when they become due and payable. 2. This declaration has been made after receiving the declarations required to be made to the directors in accordance with sections 295A of the Corporations Act 2001 for the financial period ending 30 June 2019.
3. In the opinion of the directors, as at the date of this declaration, there are reasonable grounds to believe that the members of the Closed Group identified in note 33 will be able to meet any obligations or liabilities to which they are or may become subject, by virtue of the Deed of Cross Guarantee.
On behalf of the Board
Peter Harold Managing Director Perth, 30 August 2019
A member firm of Ernst & Young Global Limited Liability limited by a scheme approved under Professional Standards Legislation
PT:CT:PAN:025
Ernst & Young 11 Mounts Bay Road Perth WA 6000 Australia GPO Box M939 Perth WA 6843
Tel: +61 8 9429 2222 Fax: +61 8 9429 2436 ey.com/au
Auditor’s Independence Declaration to the Directors of Panoramic Resources Limited
As lead auditor for the audit of the financial report o Panoramic Resources Limited for the financial year ended 30 June 2019, I declare to the best of my knowledge and belief, there have been:
a) no contraventions of the auditor independence requirements of the Corporations Act 2001 in relation to the audit; and
b) no contraventions of any applicable code of professional conduct in relation to the audit.
This declaration is in respect of Panoramic Resources Limited and the entities it controlled during the financial year. Ernst & Young Philip Teale Partner 30 August 2019
For
per
sona
l use
onl
y

PAGE 60 | 2019 ANNUAL REPORT
A member firm of Ernst & Young Global Limited Liability limited by a scheme approved under Professional Standards Legislation
PT:CT:PANORAMIC:026
Ernst & Young 11 Mounts Bay Road Perth WA 6000 Australia GPO Box M939 Perth WA 6843
Tel: +61 8 9429 2222 Fax: +61 8 9429 2436 ey.com/au
Independent auditor's report to the members of Panoramic Resources Limited
Report on the audit of the financial report
Opinion
We have audited the financial report of Panoramic Resources Limited (the Company) and its subsidiaries (collectively the Group), which comprises the consolidated balance sheet as at 30 June 2019, the consolidated income statement, the consolidated statement of comprehensive income, consolidated statement of changes in equity and consolidated statement of cash flow for the year then ended, notes to the financial statements, including a summary of significant accounting policies, and the Directors' declaration.
In our opinion, the accompanying financial report of the Group is in accordance with the Corporations Act 2001, including:
a) giving a true and fair view of the consolidated financial position of the Group as at 30 June 2019 and of its consolidated financial performance for the year ended on that date; and
b) complying with Australian Accounting Standards and the Corporations Regulations 2001.
Basis for opinion
We conducted our audit in accordance with Australian Auditing Standards. Our responsibilities under those standards are further described in the Auditor’s Responsibilities for the Audit of the Financial Report section of our report. We are independent of the Group in accordance with the auditor independence requirements of the Corporations Act 2001 and the ethical requirements of the Accounting Professional and Ethical Standards Board’s APES 110 Code of Ethics for Professional Accountants (the Code) that are relevant to our audit of the financial report in Australia. We have also fulfilled our other ethical responsibilities in accordance with the Code.
We believe that the audit evidence we have obtained is sufficient and appropriate to provide a basis for our opinion.
Material uncertainty related to going concern
We draw attention to Note 1(b) in the financial report. These events or conditions indicate that a material uncertainty exists that may cast significant doubt on the Group’s ability to continue as a going concern. The financial report does not include any adjustments relating to the recoverability and classification of recorded asset amounts or to the amounts and classification of liabilities that might be necessary should the entity not continue as a going concern. Our opinion is not modified in respect of this matter.
Key audit matters
Key audit matters are those matters that, in our professional judgment, were of most significance in our audit of the financial report of the current year. These matters were addressed in the context of our audit of the financial report as a whole, and in forming our opinion thereon, but we do not provide a separate opinion on these matters. In addition to the matter described in the Material Uncertainty Related to Going Concern section, we have determined the matters described below to be the key audit matters to be communicated in our report. For each matter below, our description of how our audit addressed the matter is provided in that context.
For
per
sona
l use
onl
y

2019 ANNUAL REPORT | PAGE 61
A member firm of Ernst & Young Global Limited Liability limited by a scheme approved under Professional Standards Legislation
PT:CT:PANORAMIC:026
We have fulfilled the responsibilities described in the Auditor’s Responsibilities for the Audit of the Financial Report section of our report, including in relation to these matters. Accordingly, our audit included the performance of procedures designed to respond to our assessment of the risks of material misstatement of the financial report. The results of our audit procedures, including the procedures performed to address the matters below, provide the basis for our audit opinion on the accompanying financial report.
1. Carrying value of non-current assets
Why significant How our audit addressed the key audit matter
The carrying value of the Group’s property, plant and equipment, exploration and evaluation assets and mine property assets at 30 June 2019 was $171.5 million. Of this total amount, $142.5 million related to the Savannah Cash Generating Unit (“CGU”). The Group assessed whether there was any indication of impairment or indication an impairment loss recognised in prior periods should be reversed. It was determined indicators of a reversal of an impairment loss recognised in prior period were present in respect of the Savannah CGU. Accordingly, the Group performed an impairment test for the Savannah CGU at 31 December 2018 and based on this assessment concluded an impairment reversal of $19.2 million was required (refer to Note 14). The Group performed an assessment of whether there were any indictors of impairment or impairment reversal at 30 June 2019 and concluded indicators were not present. We considered this to be a key audit matter because of the: ► Significant judgment involved in determining
whether there is any indication of impairment or indication an impairment loss recognised in prior periods should be reversed.
► Significant judgment and estimates involved in the determination of the recoverable amount of the Savannah CGU, including assumptions relating to future nickel prices, exchange rates, operating and capital costs and an appropriate discount rate to reflect the risk associated with the forecast cash flows having regard to the current status of the project.
Our audit procedures included the following: ► Assessed the Group’s process for identifying
indicators of impairment and impairment reversal for its CGUs.
► For the Savanah CGU, we: ► Evaluated the Group’s methodology for
measuring recoverable amount for consistency with Australian Accounting Standards.
► With the involvement from our valuation specialists, considered the key assumptions used in the Group’s cash flows forecasts, including nickel prices and foreign exchange rates with reference to external market data.
► Agreed assumptions on timing and an amount of future capital and operating expenditure to the Group’s feasibility analysis for the project and the latest Board approved life of mine plan.
► Assessed the work of the Group’s internal and external experts with respect to the capital and operating expenditure assumptions.
► Assessed the work of the Group’s experts with respect to the mineral reserve quantities recovered as part of the life of mine plan. This included understanding the reserve estimation process and evaluating the competence, qualifications and objectivity of the Group’s experts.
► Tested the mathematical accuracy of the Group’s discounted cash flow impairment model.
► Assessed the impact of a range of sensitivities to the economic assumptions underpinning the Group’s recoverable amount assessment.
► Assessed the adequacy of the associated financial report.
F
or p
erso
nal u
se o
nly

PAGE 62 | 2019 ANNUAL REPORT
A member firm of Ernst & Young Global Limited Liability limited by a scheme approved under Professional Standards Legislation
PT:CT:PANORAMIC:026
2. Rehabilitation provision
Why significant How our audit addressed the key audit matter
As a consequence of its operations the Group incurs obligations to rehabilitate and restore its mine sites. Rehabilitation activities are governed by local legislative requirements. As at 30 June 2019 the Group’s consolidated balance sheet includes provisions of $31.5 million in respect of these obligations (refer to note 24). Estimating the costs associated with these future activities requires considerable judgment for factors such as timing of the rehabilitation, the costs associated with the rehabilitation activities and economic assumptions such as discount rates and inflation rates. Given the judgment involved in measuring the provision, this was considered to be a key audit matter.
We evaluated the assumptions and methodologies used by the Group in arriving at their rehabilitation cost estimates. Our audit procedures included the following: ► We involved our rehabilitation specialists to assess
the objectivity, qualifications and competence of both the Group’s internal and external experts whose work formed the basis of the Group’s cost estimate.
► Assessed the reasonableness of the timing of the rehabilitation cashflows and the resultant inflation and discount rate assumptions used in the Group’s cost estimates, having regard to available economic data on future inflation and discount rates.
► Evaluated the adequacy of the Group’s disclosures relating to rehabilitation obligations and considered the treatment applied to changes in the rehabilitation and restoration provision.
Information other than the financial report and auditor’s report thereon
The Directors are responsible for the other information. The other information comprises the information included in the Company’s 2019 Annual Report other than the financial report and our auditor’s report thereon. We obtained the Directors’ Report that is to be included in the Annual Report, prior to the date of this auditor’s report, and we expect to obtain the remaining sections of the Annual Report after the date of this auditor’s report.
Our opinion on the financial report does not cover the other information and we do not and will not express any form of assurance conclusion thereon with the exception of the Remuneration Report and our related assurance opinion.
In connection with our audit of the financial report, our responsibility is to read the other information and, in doing so, consider whether the other information is materially inconsistent with the financial report or our knowledge obtained in the audit or otherwise appears to be materially misstated.
If, based on the work we have performed on the other information obtained prior to the date of this auditor’s report, we conclude that there is a material misstatement of this other information, we are required to report that fact. We have nothing to report in this regard.
Responsibilities of the directors for the financial report
The Directors of the Company are responsible for the preparation of the financial report that gives a true and fair view in accordance with Australian Accounting Standards and the Corporations Act 2001 and for such internal control as the Directors determine is necessary to enable the preparation of the financial report that gives a true and fair view and is free from material misstatement, whether due to fraud or error.
In preparing the financial report, the directors are responsible for assessing the Group’s ability to continue as a going concern, disclosing, as applicable, matters relating to going concern and using the going concern basis of accounting unless the directors either intend to liquidate the Group or to cease operations, or have no realistic alternative but to do so.
For
per
sona
l use
onl
y

2019 ANNUAL REPORT | PAGE 63
A member firm of Ernst & Young Global Limited Liability limited by a scheme approved under Professional Standards Legislation
PT:CT:PANORAMIC:026
Auditor's responsibilities for the audit of the financial report
Our objectives are to obtain reasonable assurance about whether the financial report as a whole is free from material misstatement, whether due to fraud or error, and to issue an auditor’s report that includes our opinion. Reasonable assurance is a high level of assurance, but is not a guarantee that an audit conducted in accordance with the Australian Auditing Standards will always detect a material misstatement when it exists. Misstatements can arise from fraud or error and are considered material if, individually or in the aggregate, they could reasonably be expected to influence the economic decisions of users taken on the basis of this financial report.
As part of an audit in accordance with the Australian Auditing Standards, we exercise professional judgment and maintain professional scepticism throughout the audit. We also:
► Identify and assess the risks of material misstatement of the financial report, whether due to fraud or error, design and perform audit procedures responsive to those risks, and obtain audit evidence that is sufficient and appropriate to provide a basis for our opinion. The risk of not detecting a material misstatement resulting from fraud is higher than for one resulting from error, as fraud may involve collusion, forgery, intentional omissions, misrepresentations, or the override of internal control.
► Obtain an understanding of internal control relevant to the audit in order to design audit procedures that are appropriate in the circumstances, but not for the purpose of expressing an opinion on the effectiveness of the Group’s internal control.
► Evaluate the appropriateness of accounting policies used and the reasonableness of accounting estimates and related disclosures made by the directors.
► Conclude on the appropriateness of the Directors’ use of the going concern basis of accounting and, based on the audit evidence obtained, whether a material uncertainty exists related to events or conditions that may cast significant doubt on the Group’s ability to continue as a going concern. If we conclude that a material uncertainty exists, we are required to draw attention in our auditor’s report to the related disclosures in the financial report or, if such disclosures are inadequate, to modify our opinion. Our conclusions are based on the audit evidence obtained up to the date of our auditor’s report. However, future events or conditions may cause the Group to cease to continue as a going concern.
► Evaluate the overall presentation, structure and content of the financial report, including the disclosures, and whether the financial report represents the underlying transactions and events in a manner that achieves fair presentation.
► Obtain sufficient appropriate audit evidence regarding the financial information of the entities or business activities within the Group to express an opinion on the financial report. We are responsible for the direction, supervision and performance of the Group audit. We remain solely responsible for our audit opinion.
We communicate with the directors regarding, among other matters, the planned scope and timing of the audit and significant audit findings, including any significant deficiencies in internal control that we identify during our audit.
We also provide the directors with a statement that we have complied with relevant ethical requirements regarding independence, and to communicate with them all relationships and other matters that may reasonably be thought to bear on our independence, and where applicable, related safeguards.
For
per
sona
l use
onl
y

PAGE 64 | 2019 ANNUAL REPORT
A member firm of Ernst & Young Global Limited Liability limited by a scheme approved under Professional Standards Legislation
PT:CT:PANORAMIC:026
From the matters communicated to the directors, we determine those matters that were of most significance in the audit of the financial report of the current year and are therefore the key audit matters. We describe these matters in our auditor’s report unless law or regulation precludes public disclosure about the matter or when, in extremely rare circumstances, we determine that a matter should not be communicated in our report because the adverse consequences of doing so would reasonably be expected to outweigh the public interest benefits of such communication.
Report on the audit of the remuneration report
Opinion on the remuneration report
We have audited the Remuneration Report included in the directors' report for the year ended 30 June 2019.
In our opinion, the Remuneration Report of Panoramic Resources Limited for the year ended 30 June 2019, complies with section 300A of the Corporations Act 2001.
Responsibilities
The Directors of the Company are responsible for the preparation and presentation of the Remuneration Report in accordance with section 300A of the Corporations Act 2001. Our responsibility is to express an opinion on the Remuneration Report, based on our audit conducted in accordance with Australian Auditing Standards. Ernst & Young Philip Teale Partner Perth 30 August 2019
For
per
sona
l use
onl
y

2019 ANNUAL REPORT | PAGE 65
FINANCIAL REPORTF
or p
erso
nal u
se o
nly

PAGE 66 | 2019 ANNUAL REPORT
Consolidated income statement For the year ended 30 June 2019
Notes 2019
$'000 2018 $'000
Revenue 3 25,112 - Cost of sales of goods 5 (29,803) - Gross loss (4,691) - Other income 4 2,773 1,714 Care and maintenance expenses (847) (5,201) Corporate and marketing costs (4,929) (4,022) Exploration and evaluation expenditure (671) (487) Exploration expenditure written-off (901) (619) Reversal of stock obsolescence provision 5,341 - Fair value losses on derivatives 5 (2,071) - Change in fair value of financial assets at fair value through profit or loss (1,511) - Impairment loss 14, 16 - (45,152) Reversal of impairment loss 14, 16 19,156 7,260 Share based payments - (160) Other expenses 5 (1,037) (429) Finance costs 5 (1,383) (943) Profit/(loss) before income tax 9,229 (48,039) Income tax expense 6 - - Profit/(loss) for the year 9,229 (48,039) Profit/(loss) for the year is attributable to: Owners of Panoramic Resources Limited 10,327 (40,803) Non-controlling interests (1,098) (7,236) 9,229 (48,039)
Cents Cents
Earnings/(loss) per share for loss attributable to the ordinary equity holders of the Company: Basic earnings/(loss) per share 36 2.0 (9.1) Diluted earnings/(loss) per share 36 2.0 (9.1)
The above consolidated income statement should be read in conjunction with the accompanying notes.
For
per
sona
l use
onl
y
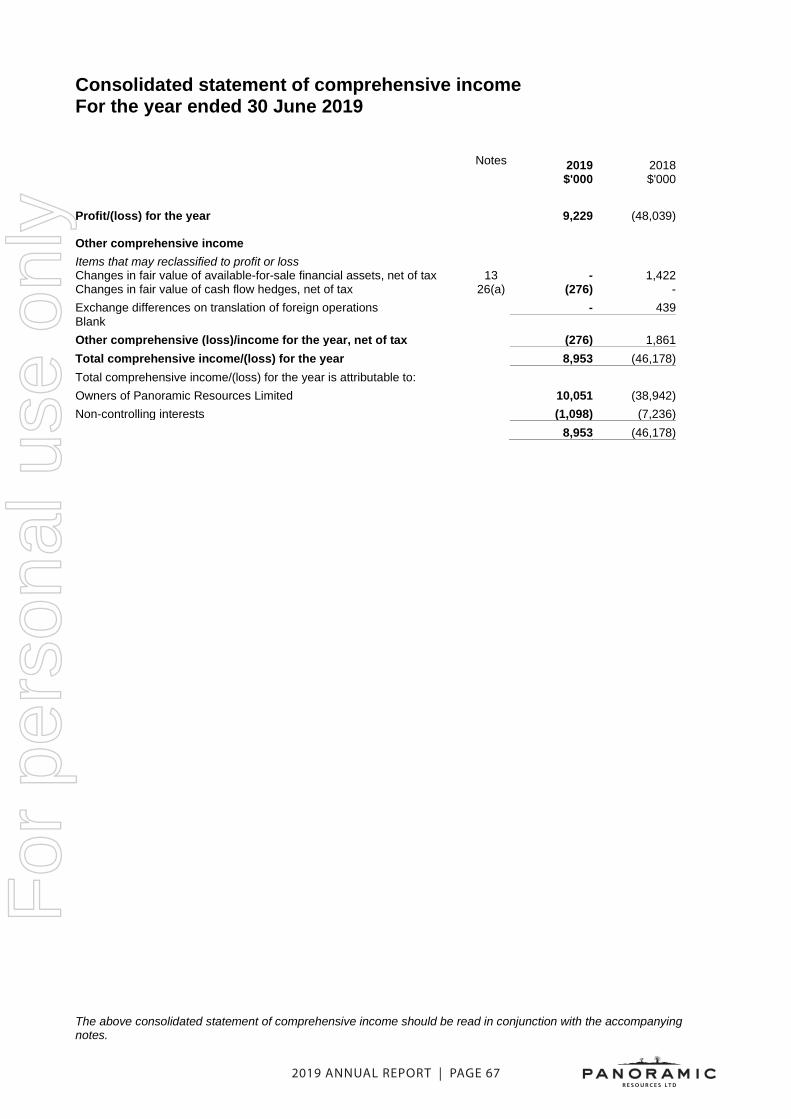
2019 ANNUAL REPORT | PAGE 67
Consolidated income statement For the year ended 30 June 2019
Notes 2019
$'000 2018 $'000
Revenue 3 25,112 - Cost of sales of goods 5 (29,803) - Gross loss (4,691) - Other income 4 2,773 1,714 Care and maintenance expenses (847) (5,201) Corporate and marketing costs (4,929) (4,022) Exploration and evaluation expenditure (671) (487) Exploration expenditure written-off (901) (619) Reversal of stock obsolescence provision 5,341 - Fair value losses on derivatives 5 (2,071) - Change in fair value of financial assets at fair value through profit or loss (1,511) - Impairment loss 14, 16 - (45,152) Reversal of impairment loss 14, 16 19,156 7,260 Share based payments - (160) Other expenses 5 (1,037) (429) Finance costs 5 (1,383) (943) Profit/(loss) before income tax 9,229 (48,039) Income tax expense 6 - - Profit/(loss) for the year 9,229 (48,039) Profit/(loss) for the year is attributable to: Owners of Panoramic Resources Limited 10,327 (40,803) Non-controlling interests (1,098) (7,236) 9,229 (48,039)
Cents Cents
Earnings/(loss) per share for loss attributable to the ordinary equity holders of the Company: Basic earnings/(loss) per share 36 2.0 (9.1) Diluted earnings/(loss) per share 36 2.0 (9.1)
The above consolidated income statement should be read in conjunction with the accompanying notes.
The above consolidated statement of comprehensive income should be read in conjunction with the accompanying notes.
Consolidated statement of comprehensive income For the year ended 30 June 2019
Notes 2019
$'000 2018 $'000
Profit/(loss) for the year 9,229 (48,039) Other comprehensive income Items that may reclassified to profit or loss Changes in fair value of available-for-sale financial assets, net of tax 13 - 1,422 Changes in fair value of cash flow hedges, net of tax 26(a) (276) - Exchange differences on translation of foreign operations - 439 Blank Other comprehensive (loss)/income for the year, net of tax (276) 1,861 Total comprehensive income/(loss) for the year 8,953 (46,178) Total comprehensive income/(loss) for the year is attributable to: Owners of Panoramic Resources Limited 10,051 (38,942) Non-controlling interests (1,098) (7,236) 8,953 (46,178)
For
per
sona
l use
onl
y

PAGE 68 | 2019 ANNUAL REPORT
The above consolidated balance sheet should be read in conjunction with the accompanying notes.
Consolidated balance sheet As at 30 June 2019
Notes 2019
$'000 2018 $'000
ASSETS Current assets Cash and cash equivalents 7 12,733 25,430 Trade and other receivables 8 19,278 421 Inventories 9 8,415 184 Prepayments 11 1,354 246 Derivative financial instruments 12 3,742 - Disposal group classified as held for sale 10 4,299 17,002 Total current assets 49,821 43,283 Non-current assets Available-for-sale financial assets 13 - 2,703 Financial assets at fair value through profit or loss 17 957 - Property, plant and equipment 14 59,004 10,630 Exploration and evaluation 16 27,763 45,763 Development properties 16 84,745 17,222 Mineral properties 16 29 27 Derivative financial instruments 12 4,409 - Other non-current assets 18 181 1,303 Total non-current assets 177,088 77,648 Total assets 226,909 120,931 LIABILITIES Current liabilities Trade and other payables 19 22,094 3,764 Borrowings 20 8,082 - Derivative financial instruments 12 2,721 - Provisions 21 2,205 923 Liabilities directly associated with disposal group classified as held for sale 10 - 3,502 Total current liabilities 35,102 8,189 Non-current liabilities Borrowings 22 38,553 - Derivative financial instruments 12 5,584 - Provisions 24 31,548 26,822 Total non-current liabilities 75,685 26,822 Total liabilities 110,787 35,011 Net assets 116,122 85,920 EQUITY Contributed equity 25 210,109 188,860 Amounts recognised in equity relating to disposal group 1,200 - Reserves 26(a) 20,994 44,589 Accumulated losses (121,823) (154,269) Non-controlling interests 5,642 6,740
Total equity 116,122 85,920
For
per
sona
l use
onl
y

2019 ANNUAL REPORT | PAGE 69
The above consolidated statement of changes in equity should be read in conjunction w
ith the accompanying notes.
Consolidated statem
ent of changes in equity For the year ended 30 June 2019
Contributed
equity $'000
Equity relating to disposal
group $'000
Mineral
properties revaluation
reserve $'000
Available-for-sale
financial assets reserve $'000
Cash
flow
hedge reserve $'000
Share- based
payment
reserve $'000
Foreign currency
translation reserve $'000
Equity R
eserve $'000
Retained
earnings $'000
Non- controlling interests
$'000 Total
equity $'000
Balance at 1 July 2017 169,044
- 19,845
852 -
21,556 761
(446) (113,466)
13,976 112,122
Loss for the year -
- -
- -
- -
- (40,803)
(7,236) (48,039)
Other com
prehensive income
- -
- 1,422
- -
439 -
- -
1,861 Total com
prehensive loss for the year -
- -
1,422 -
- 439
- (40,803)
(7,236) (46,178)
Transactions with ow
ners in their capacity as ow
ners:
Contributions of equity, net of transaction
costs and tax 19,816
- -
- -
- -
- -
- 19,816
Employee share options - value of
employee services
- -
- -
- 160
- -
- -
160
19,816 -
- -
- 160
- -
- -
19,976 B
alance at 30 June 2018 188,860
- 19,845
2,274 -
21,716 1,200
(446) (154,269)
6,740 85,920
For
per
sona
l use
onl
y

PAGE 70 | 2019 ANNUAL REPORT
The
abov
e co
nsol
idat
ed s
tate
men
t of c
hang
es in
equ
ity s
houl
d be
read
in c
onju
nctio
n w
ith th
e ac
com
pany
ing
note
s.
Con
solid
ated
sta
tem
ent o
f cha
nges
in e
quity
Fo
r the
yea
r end
ed 3
0 Ju
ne 2
019
Not
es
Con
trib
uted
eq
uity
$'
000
Equi
ty re
latin
g to
dis
posa
l gr
oup
$'00
0
Min
eral
pr
oper
ties
reva
luat
ion
rese
rve
$'00
0
Ava
ilabl
e-fo
r- sa
le fi
nanc
ial
asse
ts re
serv
e $'
000
Cas
h flo
w
hedg
e re
serv
e $'
000
Shar
e-
base
d pa
ymen
t re
serv
e $'
000
Fore
ign
curr
ency
tr
ansl
atio
n re
serv
e $'
000
Equi
ty
Res
erve
$'
000
Ret
aine
d ea
rnin
gs
$'00
0
Non
- co
ntro
lling
in
tere
sts
$'00
0 To
tal
equi
ty
$'00
0 Ba
lanc
e at
1 J
uly
2018
as
prev
ious
ly re
porte
d
188,
860
- 19
,845
2,
274
- 21
,716
1,
200
(446
) (1
54,2
69)
6,74
0 85
,920
Im
pact
on
adop
tion
of A
ASB
9 (N
ote
26)
-
- -
(2,2
74)
- -
- -
2,27
4 -
- B
alan
ce a
t 1 J
uly
2018
- re
stat
ed
18
8,86
0 -
19,8
45
- -
21,7
16
1,20
0 (4
46)
(151
,995
) 6,
740
85,9
20
Tr
ansf
er o
f equ
ity re
latin
g to
di
spos
al g
roup
- 1,
200
- -
- -
(1,2
00)
- -
- -
Prof
it fo
r the
yea
r
- -
- -
- -
- -
10,3
27
(1,0
98)
9,22
9 O
ther
com
preh
ensi
ve in
com
e
- -
- -
(276
) -
- -
- -
(276
) To
tal c
ompr
ehen
sive
loss
for
the
year
- 1,
200
- -
(276
) -
(1,2
00)
- 10
,327
(1
,098
) 8,
953
C
ontri
butio
ns o
f equ
ity, n
et o
f tra
nsac
tion
cost
s an
d ta
x 25
21
,249
-
- -
- -
- -
- -
21,2
49
Tran
sfer
of r
eval
uatio
n re
serv
es to
re
tain
ed e
arni
ngs
on d
ispo
sal o
f as
set
-
- (1
9,84
5)
- -
- -
- 19
,845
-
-
21
,249
-
(19,
845)
-
- -
- -
19,8
45
- 21
,249
B
alan
ce a
t 30
June
201
9
210,
109
1,20
0 -
- (2
76)
21,7
16
- (4
46)
(121
,823
) 5,
642
116,
122
For
per
sona
l use
onl
y

2019 ANNUAL REPORT | PAGE 71
Consolidated statement of cash flows For the year ended 30 June 2019
Notes 2019
$'000 2018 $'000
Cash flows from operating activities Receipts from customers (inclusive of goods and services tax) 24,289 1,305 Payments to suppliers and employees (inclusive of goods and services tax) (31,248) (7,732) Interest paid (732) (22) Payments for exploration and evaluation expenditure (671) (487) Net cash used in operating activities 35 (8,362) (6,936) Cash flows from investing activities Payments for property, plant and equipment (25,732) (1,209) Payments for available-for-sale financial assets - (81) Payments for purchase of financial assets at fair value through profit or loss (53) - Payment of development costs (47,529) (2,697) Exploration and evaluation expenditure (5,961) (4,297) Proceeds from sale of subsidiary (net of cost) 10 14,285 - Return of proceeds from cash backed performance bonds 1,122 500 Proceeds from sale of property, plant and equipment - 55 Proceeds from sale of financial assets at fair value through profit or loss 286 - Interest received 451 467 Net cash used in investing activities (63,131) (7,262) Cash flows from financing activities Proceeds from issues of shares (net of cost) 21,249 19,816 Proceeds from borrowings 22 40,000 - Repayment of borrowings (1,453) (838) Capitalised borrowing costs 32 (1,000) - Net cash inflow from financing activities 58,796 18,978 Net (decrease) / increase in cash and cash equivalents (12,697) 4,780 Cash and cash equivalents at the beginning of the financial year 25,430 20,650 Cash and cash equivalents at end of year 7 12,733 25,430
For
per
sona
l use
onl
y

PAGE 72 | 2019 ANNUAL REPORT
Notes to the consolidated financial statements 30 June 2019
1 Summary of significant accounting policies
The financial report of Panoramic Resources Limited (the Parent or the Company) and its subsidiaries (the Group) for the year ended 30 June 2019 was authorised for issue in accordance with a resolution of the directors on 30 August 2019. Panoramic Resources Limited (the Parent) is a for profit Company limited by shares incorporated and domiciled in Australia whose shares are publicly traded on the Australian Stock Exchange. The Group's principal place of business is Level 9, 553 Hay Street, Perth WA 6000. The principal activities of the Group during the course of the financial year consisted of exploration, evaluation, development and production of mineral deposits.
(a) Basis of preparation The financial report is a general purpose financial report, which has been prepared in accordance with the requirements of the Corporations Act 2001 and Australian Accounting Standards. The financial report has also been prepared on a historical cost basis, except for derivative financial instruments, trade receivables and available-for-sale investments, which have been measured at fair value. The financial report complies with Australian Accounting Standards and International Financial Reporting Standards (IFRS) as issued by International Accounting Standards Board.
(b) Going concern basis The Group had cash outflows from operating and investing activities of $71.493 million for the year ended 30 June 2019. At 30 June 2019, the Group had cash on hand (including restricted cash and excluding the cash held by Horizon Gold Limited) of $26.65 million. The Group has continued to work to bring the Savannah Nickel Project (Project) into full production, with the first Savannah bulk nickel concentrate shipped to China in February 2019. Although the Group has seen an increase in production rates during the period (including achieving commercial levels of production in April 2019), the Group will continue to be exposed to the normal risks of mining operations and uncertainties inherent in mining the Savannah North orebody. These risks include significant judgments in the capital required to complete the transition to Savannah North, the volatility in commodity prices and the strength of the Australian dollar, the financial constraints under the Savannah Facility Agreement (SFA), the Project failing to perform as expected; higher than expected operating costs; lower than expected customer revenues; and key additional infrastructure not coming on stream when required or within budget. On 5 March 2019, the SFA was amended in response to the slower than expected ramp-up in production from the Savannah orebody and lower metal prices. The first loan repayment, originally scheduled for 31 March 2020, was moved to 30 June 2020 without changing the repayment end date of 31 December 2021. In addition, the $40 million, fully drawn under the SFA, was split into two tranches of $30 million in Senior Debt and $10 million in Mezzanine Debt. The $10 million Mezzanine tranche attracts a higher margin than the Senior component and is the last tranche to be repaid under the repayment schedule. The amendment also required the consolidated entity to sell forward a further 1,560 tonnes of nickel for delivery October 2020 to September 2021. On 11 March 2019, the Company announced a capital raising of $22.4 million before costs to (i) progress the ramp up of production from the Savannah orebody and expedite the development drive to the higher-grade Savannah North orebody, (ii) to satisfy minimum liquidity requirements under the SFA, (iii) to replenish the $2.1 million used to purchase short-term nickel put option price protection and (iv) for general corporate costs and capital raising costs. As at the date of this report, the consolidated entity and Macquarie Bank Limited are in discussions in relation to the $40 million Savannah Facility Agreement (“SFA”) in order to provide financial flexibility as the Savannah Nickel Project transitions to the Savannah North orebody. In the event that these discussions do not lead to a mutually agreed outcome, the loan may be payable within 12 months which is earlier than scheduled under the current SFA. The Board is satisfied they will be able to raise additional funds as required and thus it is appropriate to prepare the financial statements on a going concern basis. In the event that the Company is unable to obtain sufficient funding for ongoing operating and capital requirements, there is material uncertainty whether it will continue as a going concern and therefore whether it will realise its assets and discharge its liabilities in the normal course of business and at the amounts stated in the financial statements.
For
per
sona
l use
onl
y

2019 ANNUAL REPORT | PAGE 73
Notes to the consolidated financial statements 30 June 2019
The financial statements do not include any adjustment relating to the recoverability or classification of recorded asset amounts or to the amounts or classification of liabilities that may be necessary should the Company not be able to continue as a going concern.
(c) Changes in accounting policies and disclosures Since 1 July 2018, the Group has adopted all Accounting Standards and Interpretations effective from 1 July 2018. Other than the changes described below, the accounting policies adopted are consistent with those of the previous financial year.
(d) New accounting standards and interpretations The Group applied all new and amended Accounting Standards and Interpretations that were effective as at 1 July 2018. The Group applied AASB 15 Revenue from Contracts with Customers (“AASB 15”) and AASB 9 Financial Instruments (“AASB 9”) for the first time from 1 July 2018. The nature and effect of these changes as a result of the adoption of these new Accounting Standards are described below. Several other new and amended Accounting Standards and Interpretations applied for the first time from 1 July 2018 but did not have an impact on the consolidated financial statements of the Consolidated Entity and, hence, have not been disclosed. AASB 15 The Group adopted AASB 15 Revenue from Contracts with Customers (AASB 15) from 1 July 2018. The nature and effect of adopting these standards are disclosed below. AASB 15 and its related amendments supersedes AASB 118 Revenue (AASB 118) and related Interpretations. It applies to all revenue arising from contracts with customers and became effective for annual periods beginning on or after 1 July 2018. AASB 15 establishes a five-step model to account for revenue arising from contracts with customers. It requires revenue to be recognised when control of a good or service transfers to a customer at an amount that reflects the consideration to which an entity expects to be entitled in exchange for transferring goods or services to a customer. The Group has adopted AASB 15 with the date of initial application being 1 July 2018. In accordance with the transitional provisions in AASB 15, the standard has been applied using the full retrospective approach. The adoption of AASB 15 did not have any impact as the Group at the date of initial application or at the start of the comparative period. Whilst the Concentrate Sales Agreement with Sino Nickel Pty Ltd was signed on 28 June 2018 the first shipment only occurred after the date of initial application of AASB 15. The new accounting policy for revenue from contracts with customers is disclosed in note 1(h). AASB 9 AASB 9 Financial Instruments replaces parts of AASB 139 Financial Instruments (AASB 139) bringing together three aspects of the accounting for financial instruments: classification and measurement; impairment; and hedge accounting. The Group has applied AASB 9 retrospectively, with the initial application date being 1 July 2018. The cumulative impact of applying AASB 9 is recognised at the date of initial application as an adjustment to the opening balance of retained earnings. The Consolidated Entity has elected not to adjust comparative information. The accounting policies have been updated to reflect application of AASB 9 for the period from 1 July 2018 (see note 1(ac) for the change in policy relating to financial assets). AASB 9 introduced new classification and measurement models for financial assets. A financial asset shall be measured at amortised cost, if it is held within a business model whose objective is to hold assets in order to collect contractual cash flows, which arise on specified dates and are solely payments of principal and interest (“SPPI”). All other financial instrument assets are to be classified and measured at fair value through profit or loss (“FVTPL”) unless the entity makes an irrevocable election on initial recognition to present gains and losses on equity instruments (that are not held-for trading) in other comprehensive income (“OCI”). For financial liabilities, the standard requires the portion of the change in fair value that relates to the entity’s own credit risk to be presented in OCI (unless it would create an accounting mismatch). New simpler hedge accounting requirements more closely align the accounting treatment with the risk management activities of the Group.
For
per
sona
l use
onl
y
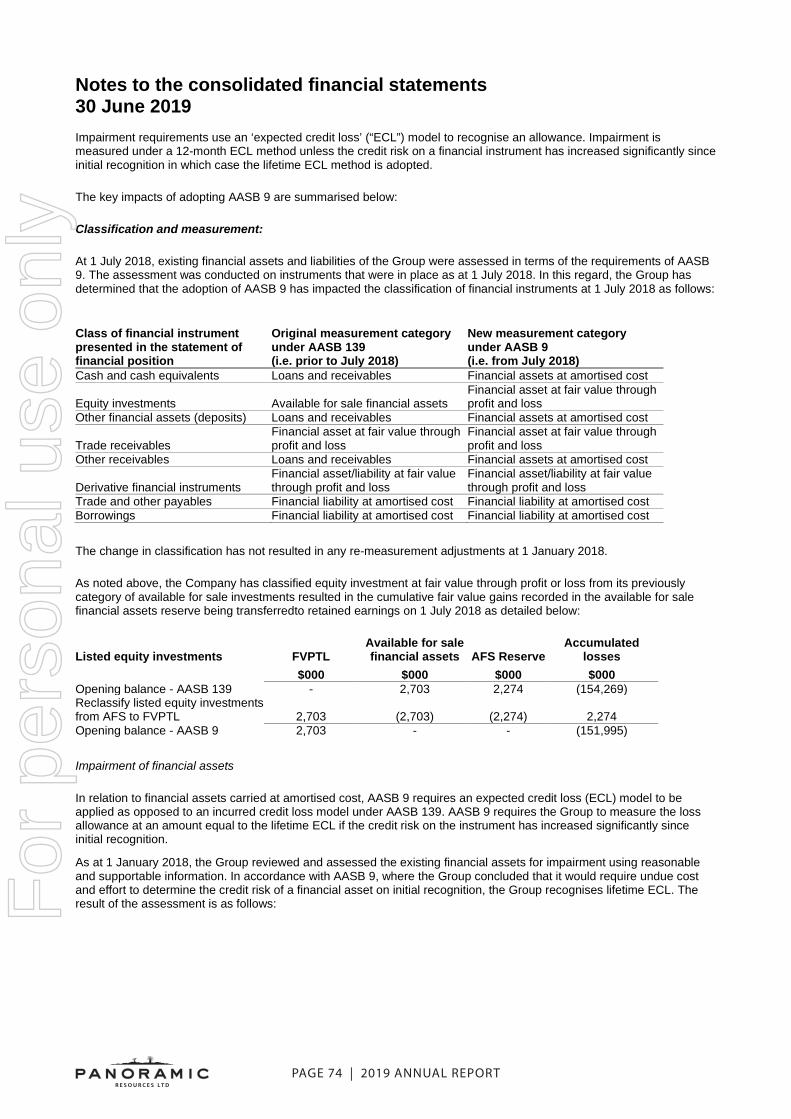
PAGE 74 | 2019 ANNUAL REPORT
Notes to the consolidated financial statements 30 June 2019 Impairment requirements use an ‘expected credit loss’ (“ECL”) model to recognise an allowance. Impairment is measured under a 12-month ECL method unless the credit risk on a financial instrument has increased significantly since initial recognition in which case the lifetime ECL method is adopted. The key impacts of adopting AASB 9 are summarised below: Classification and measurement: At 1 July 2018, existing financial assets and liabilities of the Group were assessed in terms of the requirements of AASB 9. The assessment was conducted on instruments that were in place as at 1 July 2018. In this regard, the Group has determined that the adoption of AASB 9 has impacted the classification of financial instruments at 1 July 2018 as follows:
Class of financial instrument presented in the statement of financial position
Original measurement category under AASB 139 (i.e. prior to July 2018)
New measurement category under AASB 9 (i.e. from July 2018)
Cash and cash equivalents Loans and receivables Financial assets at amortised cost
Equity investments Available for sale financial assets Financial asset at fair value through profit and loss
Other financial assets (deposits) Loans and receivables Financial assets at amortised cost
Trade receivables Financial asset at fair value through profit and loss
Financial asset at fair value through profit and loss
Other receivables Loans and receivables Financial assets at amortised cost
Derivative financial instruments Financial asset/liability at fair value through profit and loss
Financial asset/liability at fair value through profit and loss
Trade and other payables Financial liability at amortised cost Financial liability at amortised cost Borrowings Financial liability at amortised cost Financial liability at amortised cost The change in classification has not resulted in any re-measurement adjustments at 1 January 2018. As noted above, the Company has classified equity investment at fair value through profit or loss from its previously category of available for sale investments resulted in the cumulative fair value gains recorded in the available for sale financial assets reserve being transferredto retained earnings on 1 July 2018 as detailed below:
Listed equity investments FVPTL Available for sale financial assets AFS Reserve
Accumulated losses
$000 $000 $000 $000 Opening balance - AASB 139 - 2,703 2,274 (154,269) Reclassify listed equity investments from AFS to FVPTL 2,703 (2,703) (2,274) 2,274 Opening balance - AASB 9 2,703 - - (151,995) Impairment of financial assets In relation to financial assets carried at amortised cost, AASB 9 requires an expected credit loss (ECL) model to be applied as opposed to an incurred credit loss model under AASB 139. AASB 9 requires the Group to measure the loss allowance at an amount equal to the lifetime ECL if the credit risk on the instrument has increased significantly since initial recognition. As at 1 January 2018, the Group reviewed and assessed the existing financial assets for impairment using reasonable and supportable information. In accordance with AASB 9, where the Group concluded that it would require undue cost and effort to determine the credit risk of a financial asset on initial recognition, the Group recognises lifetime ECL. The result of the assessment is as follows: F
or p
erso
nal u
se o
nly

2019 ANNUAL REPORT | PAGE 75
Notes to the consolidated financial statements 30 June 2019 Impairment requirements use an ‘expected credit loss’ (“ECL”) model to recognise an allowance. Impairment is measured under a 12-month ECL method unless the credit risk on a financial instrument has increased significantly since initial recognition in which case the lifetime ECL method is adopted. The key impacts of adopting AASB 9 are summarised below: Classification and measurement: At 1 July 2018, existing financial assets and liabilities of the Group were assessed in terms of the requirements of AASB 9. The assessment was conducted on instruments that were in place as at 1 July 2018. In this regard, the Group has determined that the adoption of AASB 9 has impacted the classification of financial instruments at 1 July 2018 as follows:
Class of financial instrument presented in the statement of financial position
Original measurement category under AASB 139 (i.e. prior to July 2018)
New measurement category under AASB 9 (i.e. from July 2018)
Cash and cash equivalents Loans and receivables Financial assets at amortised cost
Equity investments Available for sale financial assets Financial asset at fair value through profit and loss
Other financial assets (deposits) Loans and receivables Financial assets at amortised cost
Trade receivables Financial asset at fair value through profit and loss
Financial asset at fair value through profit and loss
Other receivables Loans and receivables Financial assets at amortised cost
Derivative financial instruments Financial asset/liability at fair value through profit and loss
Financial asset/liability at fair value through profit and loss
Trade and other payables Financial liability at amortised cost Financial liability at amortised cost Borrowings Financial liability at amortised cost Financial liability at amortised cost The change in classification has not resulted in any re-measurement adjustments at 1 January 2018. As noted above, the Company has classified equity investment at fair value through profit or loss from its previously category of available for sale investments resulted in the cumulative fair value gains recorded in the available for sale financial assets reserve being transferredto retained earnings on 1 July 2018 as detailed below:
Listed equity investments FVPTL Available for sale financial assets AFS Reserve
Accumulated losses
$000 $000 $000 $000 Opening balance - AASB 139 - 2,703 2,274 (154,269) Reclassify listed equity investments from AFS to FVPTL 2,703 (2,703) (2,274) 2,274 Opening balance - AASB 9 2,703 - - (151,995) Impairment of financial assets In relation to financial assets carried at amortised cost, AASB 9 requires an expected credit loss (ECL) model to be applied as opposed to an incurred credit loss model under AASB 139. AASB 9 requires the Group to measure the loss allowance at an amount equal to the lifetime ECL if the credit risk on the instrument has increased significantly since initial recognition. As at 1 January 2018, the Group reviewed and assessed the existing financial assets for impairment using reasonable and supportable information. In accordance with AASB 9, where the Group concluded that it would require undue cost and effort to determine the credit risk of a financial asset on initial recognition, the Group recognises lifetime ECL. The result of the assessment is as follows:
Notes to the consolidated financial statements 30 June 2019
Key estimates
(iii) Determination of mineral resources and ore reserves The Group estimates its mineral resources and ore reserves in accordance with the Australian Code for Reporting of Exploration Results, Mineral Resources and Ore Reserves (the ‘JORC Code’) as a minimum standard. The information on mineral resources and ore reserves were prepared by or under the supervision of a Competent Person(s) as defined in the JORC Code. The amounts presented are based on the mineral resources and ore reserves determined either under the 2012 or 2004 editions of the JORC Code. There are numerous uncertainties inherent in estimating mineral resources and ore reserves and assumptions that are valid at the time of estimation may change significantly when new information becomes available. Significant judgement is required in assessing the available reserves. Factors that must be considered in determining reserves and resources are the Company's history of converting resources to reserves and the relevant time frame, market and future developments. Changes in the forecast prices of commodities, foreign currency exchange rates, production costs or recovery rates may change the economic status of reserves and may ultimately result in the reserves being restated. Such changes in reserves could impact on depreciation and amortisation rates, asset carrying values and provisions for decommissioning and restoration.
(iv) Impairment of capitalised exploration and evaluation expenditure
The Group assesses impairment of all assets at each reporting date by evaluating conditions specific to the Group and to the particular asset that may lead to impairment. If an impairment trigger exists, the recoverable amount of the asset is determined. The future recoverability of capitalised exploration and evaluation expenditure is dependent on a number of factors, including whether the Group decides to exploit the related lease itself or, if not, whether it successfully recovers the related exploration and evaluation asset through sale. Factors which could impact the future recoverability include the level of proved and probable reserves and mineral resources, future technological changes which could impact the cost of mining, future legal changes (including changes to environmental restoration obligations) and changes to commodity prices. To the extent that capitalised exploration and evaluation expenditure is determined not to be recoverable in the future, this will reduce profits and net assets in the period in which this determination is made. In addition, exploration and evaluation expenditure is capitalised if activities in the area of interest have not yet reached a stage which permits a reasonable assessment of the existence or otherwise of economically recoverable reserves. To the extent that it is determined in the future that this capitalised expenditure should be written off, this will reduce profits and net assets in the period in which this determination is made. Capitalised exploration and evaluation expenditure that suffered an impairment are tested for possible reversal of the impairment whenever events or changes in circumstances indicate that the impairment may have reversed.
(v) Impairment of property, plant and equipment, capitalised mine development expenditure and mine properties expenditure
The Group assesses impairment of all assets at each reporting date by evaluating conditions specific to the Group and to the particular asset that may lead to impairment. If an impairment trigger exists, the recoverable amount of the asset is determined. Where a review for impairment is conducted, the recoverable amount is assessed by reference to the higher of ‘value in use’ (being the net present value of expected future cash flows of the relevant cash-generating unit) and ‘fair value less costs to dispose (FVLCD). In determining value in use, future cash flows are based on: • Estimates of the quantities of ore reserves and mineral resources for which there is a high degree of confidence of
economic extraction; • Future production levels; • Future commodity prices; and • Future cash costs of production and capital expenditure. Variations to the expected future cash flows, and the timing thereof, could result in significant changes to any impairment losses recognised, if any, which could in turn impact future financial results.
For
per
sona
l use
onl
y

PAGE 76 | 2019 ANNUAL REPORT
Notes to the consolidated financial statements 30 June 2019
Property, plant and equipment that suffered an impairment is tested for possible reversal of the impairment whenever events or changes in circumstances indicate that the impairment may have reversed. Refer to Note 14: Non-current assets - Property, plant and equipment for further information.
(vi) Provision for decommissioning and rehabilitation Decommissioning and restoration costs are a normal consequence of mining, and the majority of this expenditure is incurred at the end of a mine’s life. In determining an appropriate level of provision consideration is given to the expected future costs to be incurred, the timing of these expected future costs (largely dependent on the life of the mine), and the estimated future level of inflation. The ultimate cost of decommissioning and restoration is uncertain and costs can vary in response to many factors including changes to the relevant legal requirements, the emergence of new restoration techniques, discount rates or experience at other mine sites. The expected timing of expenditure can also change, for example in response to changes in reserves or to production rates. The timing of expenditure is expected to be incurred between 4 and 8 years. The carrying amount of the provision for decommissioning and rehabilitation as at 30 June 2019 was $31.534 million (2018: $26.810 million). The Group estimates that the costs will be incurred towards the end of the respective mine lives and calculates the provision using the discounted cash flow method based on expected costs to be incurred to rehabilitate the disturbed area. These costs are discounted at 1.18% (2018: 2.46%). Changes to any of the estimates could result in significant changes to the level of provisioning required, which would in turn impact future financial results.
(vii) Share-based payment transactions The Group measures the cost of equity-settled transactions with employees by reference to the fair value of the equity instruments at the date at which they are granted. The fair value is determined by a Monte Carlo model and a Binomial model, using the assumptions detailed in note 37.
(g) Basis of consolidation The consolidated financial statements comprise the financial statements of the Group and its subsidiaries as at 30 June 2019. Control is achieved when the Group is exposed, or has rights, to variable returns from its involvement with the investee and has the ability to affect those returns through its power over the investee. Specifically, the Group controls an investee if and only if the Group has: • Power over the investee (i.e. existing rights that give it the current ability to direct the relevant activities of the investee); • Exposure, or rights, to variable returns from its involvement with the investee; and • The ability to use its power over the investee to affect its returns. When the Group has less than a majority of the voting or similar rights of an investee, the Group considers all relevant facts and circumstances in assessing whether it has power over an investee, including: • The contractual arrangement with the other vote holders of the investee; • Rights arising from other contractual arrangements; and • The Group’s voting rights and potential voting rights. The Group re-assesses whether or not it controls an investee if facts and circumstances indicate that there are changes to one or more of the three elements of control. Consolidation of a subsidiary begins when the Group obtains control over the subsidiary and ceases when the Group loses control of the subsidiary. Assets, liabilities, income and expenses of a subsidiary acquired or disposed of during the year are included in the statement of comprehensive income from the date the Group gains control until the date the Group ceases to control the subsidiary. Profit or loss and each component of other comprehensive income (OCI) are attributed to the equity holders of the parent of the Group and to the non-controlling interests, even if this results in the non-controlling interests having a deficit balance. When necessary, adjustments are made to the financial statements of subsidiaries to bring their accounting policies into line with the Group’s accounting policies. All intra-group assets and liabilities, equity, income, expenses and cash flows relating to transactions between members of the Group are eliminated in full on consolidation. F
or p
erso
nal u
se o
nly

2019 ANNUAL REPORT | PAGE 77
Notes to the consolidated financial statements 30 June 2019 A change in the ownership interest of a subsidiary, without a loss of control, is accounted for as an equity transaction. If the Group loses control over a subsidiary, it: • De-recognises the assets (including goodwill) and liabilities of the subsidiary; • De-recognises the carrying amount of any non-controlling interests; • De-recognises the cumulative translation differences recorded in equity; • Recognises the fair value of the consideration received; • Recognises the fair value of any investment retained; • Recognises any surplus or deficit in profit or loss; and • Reclassifies the parent’s share of components previously recognised in OCI to profit or loss or retained earnings, as
appropriate, as would be required if the Group had directly disposed of the related assets or liabilities.
(h) Revenue
(i) Revenue from contracts with customers The Group is engaged in the business of producing nickel concentrate. Revenue from contracts with customers is recognised when control of the goods or services is transferred to the customer at an amount that reflects the consideration to which the Group expects to be entitled in exchange for those goods or services. The Group has concluded that it is the principal in its revenue contracts because it typically controls the goods or services before transferring them to the customer. For metal in concentrate sales under cost, insurance and freight (“CIF”) Incoterms, the performance obligations are the delivery of the concentrate and the provision of shipping services. Based on the current contractual terms, revenue from the sale of nickel concentrate is recognised when control passes to the customer, which occurs at a point in time when the nickel concentrate is physically transferred onto a vessel. The Group’s sales of nickel concentrate allow for price adjustments based on the market price at the end of the relevant Quotational Period (“QP”) stipulated in the contract. These are referred to as provisional pricing arrangements and are such that the selling price for nickel concentrate is based on prevailing spot prices on a specified future date after shipment to the customer. Adjustments to the sales price occur based on movements in quoted market prices up to the end of the QP. The period between provisional invoicing and the end of the QP can be up to two months. Revenue from the sale of nickel concentrate is measured at the amount to which the Group expects to be entitled being the forward price at the date the revenue is recognised net of treatment and refining charges, and a corresponding trade receivable is recognised. For the provisional pricing arrangements, any future changes that occur over the QP are embedded within the provisionally priced trade receivable. Given the exposure to the commodity price, these provisionally priced trade receivables fail the cash flow characteristics test within AASB 9 and are classified and measured at fair value through profit or loss from initial recognition and until the date of settlement. Subsequent changes in fair value of the receivable are recognised in the profit or loss each period and presented separately from revenue from contracts with customers as part of ‘fair value gains/losses on provisionally priced trade receivables’. Changes in fair value over, and until the end of, the QP, are estimated by reference to updated forward market prices for nickel as well as taking into account relevant other fair value considerations, including interest rate and credit risk adjustments.
Revenue is initially recognised based on the most recently determined estimate of nickel concentrate using the expected value approach based on initial internal assay and weight results. The Group has determined that it is highly unlikely that a significant reversal of the amount of revenue recognised will occur due to variations in assay and weight results. Subsequent changes in the fair value based on the customer’s final assay and weight results are recognised in revenue at the end of the QP. For CIF arrangements, the transaction price (as determined above) is allocated to the nickel concentrate and shipping services using the relative stand-alone selling price method. The consideration is received from the customer at, or around, the date of shipment under a provisional invoice. Therefore, some of the upfront consideration that relates to the shipping services yet to be provided is deferred. This is generally not material at the balance sheet date. Shipping revenue is recognised over time using an output method (being days of shipping/transportation elapsed) to measure progress towards complete satisfaction of the service as this best represents the Group’s performance. This is on the basis that the customer simultaneously receives and consumes the benefits provided by the Group as the services are being provided. The costs associated with these freight/shipping services are also recognised over the same period of time as incurred.
For
per
sona
l use
onl
y

PAGE 78 | 2019 ANNUAL REPORT
Notes to the consolidated financial statements 30 June 2019
(ii) Interest income and dividends Interest income Revenue is recognised as interest accrues using the effective interest method. This is a method of calculating the amortised cost of a financial asset and allocating the interest income over the relevant period using the effective interest rate, which is the rate that exactly discounts estimated future cash receipts through the expected life of the financial asset to the net carrying amount of the financial asset. Dividends Dividends are recognised as revenue when the right to receive payment is established.
(i) Borrowing costs Borrowing costs include interest, amortisation of discounts or premiums relating to borrowings, amortisation of ancillary costs incurred in connection with arrangement of borrowings, and finance charges in respect of finance leases. Borrowing costs are expensed as incurred unless they relate to qualifying assets. Qualifying assets are assets that necessarily take a substantial period of time to get ready for their intended use or sale, which is generally taken to be more than twelve months. In these circumstances, borrowing costs are capitalised to the costs of the assets. Where funds are borrowed specifically for the acquisition, construction or production of a qualifying asset, the amount of borrowing costs capitalised is those incurred in relation to that borrowing, net of any interest earned on those borrowings. Where funds are borrowed generally, borrowing costs are capitalised using a weighted average capitalisation rate to the extent that they relate to the qualifying asset. The capitalisation rate applied during the year was 6.81%. Exploration and evaluation expenditure carried forward relating to areas of interest which have not reached a stage permitting reliable assessment of economic benefits are not qualifying assets.
(j) Leases Finance leases, which transfer to the Group substantially all the risks and benefits incidental to ownership of the leased item, are capitalised at the inception of the lease at the fair value of the leased property or, if lower, at the present value of the minimum lease payments. Lease payments are apportioned between the finance charges and reduction of the lease liability so as to achieve a constant rate of interest on the remaining balance of the liability. Finance charges are charged directly against income. Capitalised leased assets are depreciated over the shorter of the estimated useful life of the asset or the lease term. Operating lease payments are recognised as an expense in the income statement on a straight-line basis over the lease term.
(k) Cash and cash equivalents Cash on hand and in banks and short-term deposits are stated at nominal value. For the purpose of the Statement of Cash Flows, cash includes cash on hand and in the banks short-term deposits with an original maturity not exceeding three months and if greater than three months, principal amounts can be redeemed in full with interest payable at the same cash rate from inception as per the agreement with each bank, net of bank overdrafts.
(l) Inventories
(i) Raw materials and stores, work in progress and finished goods Inventories are valued at the lower of cost (determined based on weighted average cost) and net realisable value. Costs incurred in bringing inventory to its present location and condition are accounted for as follows: • ore stocks (if applicable) - cost of direct mining and a proportion of site overheads; and • concentrates and work in progress (if applicable) - cost of direct mining, processing, transport and labour and a proportion of site overheads.
For
per
sona
l use
onl
y

2019 ANNUAL REPORT | PAGE 79
Notes to the consolidated financial statements 30 June 2019
Net realisable value (if applicable) is the estimated selling price in the ordinary course of business, less estimated costs of completion and the estimated costs necessary to make the sale. Cost of parts and consumables is accounted for using average cost.
(ii) Spares for production Inventories of consumable supplies and spare parts expected to be used in production are valued at weighted average cost. Obsolete or damaged inventories of such items are valued at net realisable value.
(m) Derivative financial instruments and hedging The Group uses derivatives such as United States dollar nickel and copper forward sales contracts, United States dollar nickel options, United States denominated currency options and United States denominated forward currency sales contracts to manage its risks associated with foreign currencies and commodity prices fluctuations. These derivative financial instruments are stated at fair value. Derivatives are not held for speculative purposes. Derivatives are initially recognised at fair value on the date a derivative contract is entered into and are subsequently remeasured to their fair value at each reporting date. The resulting gain or loss is recognised in profit or loss immediately unless the derivative is designated and effective as a cash flow hedging instrument, in which event, the timing of the recognition in profit or loss depends on the nature of the hedge relationship. A hedge of the foreign currency risk and commodity price risk of a firm commitment is accounted for as a cash flow hedge
At the inception of a hedge relationship, the Group formally designates and documents the hedge relationship to which the Group wishes to apply hedge accounting and the risk management objective and strategy for undertaking the hedge. The documentation includes identification of the hedging instrument, the hedged item or transaction, the nature of the risk being hedged and how the entity will assess the hedging instrument’s effectiveness in offsetting the exposure to changes in the hedged item’s fair value or cash flows attributable to the hedged risk. Such hedges are expected to be highly effective in achieving offsetting changes in the fair value or cash flows and are assessed on an ongoing basis to determine that they actually have been highly effective throughout the financial reporting periods for which they were designated. The hedges that meet the strict criteria for cash flow hedge accounting are accounted for as follows: Cash flow hedges Cash flow hedges are hedges of the Group’s exposure to variability in cash flows that is attributable to a particular risk associated with a highly probable forecast transaction and that could affect profit and loss. The effective portion of changes in the fair value of derivatives that are designated and qualify as cash flow hedges are deferred in equity. The gain or loss relating to the ineffective portion is recognised immediately in the income statement. Amounts deferred in equity are recycled in the income statement in the periods when the hedged item is recognised in the income statement. Hedge accounting is discontinued when the hedging instrument expires or is sold, terminated, or exercised, or no longer qualifies for hedge accounting. At that time, any cumulative gain or loss deferred in equity at that time remains in equity and is recognised when the forecast transaction is ultimately recognised in the income statement. When a forecast transaction is no longer expected to occur, the cumulative gain or loss that was deferred in equity is recognised immediately in the income statement. The Group tests each of the designated cash flow hedges for effectiveness at the inception of the hedge and then at each reporting date both prospectively and retrospectively using the dollar offset method. This is done by comparing the changes in the present value of the cash flow arising from hedged forecast sale at the forward rate, compared to changes in the fair value of the forward contract. Measurement of the cash flow changes is based on the respective forward curve over the hedge horizon. At each balance sheet date, the Group measures ineffectiveness using the ratio offset method. For cash flow hedges if the risk is over-hedged, the ineffective portion is taken immediately to the income/expense in the income statement. F
or p
erso
nal u
se o
nly

PAGE 80 | 2019 ANNUAL REPORT
Notes to the consolidated financial statements 30 June 2019
Derivatives that do not qualify for hedge accounting Certain derivative instruments do not qualify for hedge accounting. Changes in the fair value of any derivative instruments that do not qualify for hedge accounting are recognised immediately in the income statement.
(n) Foreign currency translation Both the functional and presentation currency of Panoramic Resources Limited and its Australian subsidiaries is Australian dollars (A$). Transactions and balances Transactions in foreign currencies are initially recorded by the Group’s entities at their respective functional currency spot rates at the date the transaction first qualifies for recognition. Monetary assets and liabilities denominated in foreign currencies are translated at the functional currency spot rates of exchange at the reporting date.
Differences arising on settlement or translation of monetary items are recognised in profit or loss with the exception of monetary items that are designated as part of the hedge of the Group’s net investment of a foreign operation. These are recognised in other comprehensive income until the net investment is disposed of, at which time, the cumulative amount is reclassified to profit or loss. Tax charges and credits attributable to exchange differences on those monetary items are also recorded in other comprehensive income. Group companies On consolidation, the assets and liabilities of foreign operations are translated into dollars at the rate of exchange prevailing at the reporting date and their statements of profit or loss are translated at exchange rates prevailing at the dates of the transactions. The exchange differences arising on translation for consolidation are recognised in other comprehensive income. On disposal of a foreign operation, the component of other comprehensive income relating to that particular foreign operation is recognised in profit or loss. (o) Income tax Current tax assets and liabilities for the current and prior periods are measured at the amount expected to be recovered from or paid to the taxation authorities. The tax rates and tax laws used to compute the amount are those that are enacted or substantively enacted by the balance sheet date. Deferred income tax is provided for using the full liability method on temporary differences at the balance sheet date between the tax bases of assets and liabilities and their carrying amounts for financial reporting purposes. Deferred income tax liabilities are recognised for all taxable temporary differences: • except where the deferred income tax liability arises from the initial recognition of an asset or liability in a transaction that is not a business combination and, at the time of the transaction, affects neither the accounting profit nor taxable profit or loss; and • in respect of deductible temporary differences associated with investments in subsidiaries, associates and interests in joint ventures, except where the timing of the reversal of the temporary differences can be controlled and it is probable that the temporary differences will not reverse in the foreseeable future. Deferred income tax assets are recognised for all deductible temporary differences, carry-forward of unused tax assets and unused tax losses, to the extent that it is probable that taxable profit will be available against which the deductible temporary differences, and the carry-forward of unused tax assets and unused tax losses can be utilised: • except where the deferred income tax asset relating to the deductible temporary difference arises from the initial recognition of an asset or liability in a transaction that is not a business combination and, at the time of the transaction, affects neither the accounting profit nor taxable profit or loss; and • in respect of deductible temporary differences associated with investments in subsidiaries, associates and interests in joint ventures, deferred tax assets are only recognised to the extent that it is probable that the temporary differences will reverse in the foreseeable future and taxable profit will be available against which the temporary differences can be utilised.
For
per
sona
l use
onl
y

2019 ANNUAL REPORT | PAGE 81
Notes to the consolidated financial statements 30 June 2019
The carrying amount of deferred income tax assets is reviewed at each balance sheet date and reduced to the extent that it is no longer probable that sufficient taxable profit will be available to allow all or part of the deferred income tax asset to be utilised. Unrecognised deferred tax assets and liabilities are reassessed at each balance sheet date and reduced to the extent that it is no longer probable that future taxable profit will allow the deferred tax asset to be utilised. Deferred income tax assets and liabilities are measured at the tax rates that are expected to apply to the year when the asset is realised or the liability is settled, based on tax rates (and tax laws) that have been enacted or substantively enacted at the balance sheet date. Income taxes relating to items recognised directly in equity are recognised in equity and not in profit or loss. Deferred tax assets and deferred tax liabilities are offset only if a legally enforceable right exists to set off current tax assets against current tax liabilities and the deferred tax assets and liabilities relate to the same taxable entity and the same taxation authority. (i) Tax consolidation legislation Panoramic Resources Limited and its wholly-owned Australian controlled entities have implemented the tax consolidation legislation. The head entity, Panoramic Resources Limited, and the controlled entities in the tax consolidated group account for their own current and deferred tax amounts. These tax amounts are measured as if each entity in the tax consolidated group continues to be a stand alone taxpayer in its own right. In addition to its own current and deferred tax amounts, Panoramic Resources Limited also recognises the current tax liabilities (or assets) and the deferred tax assets arising from unused tax losses and unused tax credits assumed from controlled entities in the tax consolidated group. Assets or liabilities arising under tax funding agreements with the tax consolidated entities are recognised as amounts receivable from or payable to other entities in the Company. Any difference between the amounts assumed and amounts receivable or payable under the tax funding agreement are recognised as a contribution to (or distribution from) wholly-owned tax consolidated entities.
(p) Other taxes Revenue, expenses and assets are recognised net of the amount of GST except: • where the GST incurred on a purchase of goods and services is not recoverable from the taxation authority, in which case the GST is recognised as part of the cost of acquisition of the asset or as part of the expense item as applicable; and • receivables and payables are stated with the amount of GST included. The net amount of GST recoverable from, or payable to, the taxation authority is included as part of receivables or payables in the balance sheet. Cash flows are included in the Statement of Cash Flows on a gross basis and the GST component of cash flows arising from investing and financing activities, which is recoverable from, or payable to, the taxation authority, are classified as operating cash flows. Commitments and contingencies are disclosed net of the amount of GST recoverable from, or payable to, the taxation authority.
(q) Property, plant and equipment Items of plant and equipment are stated at cost less accumulated depreciation and any impairment in value. The cost of plant and equipment constructed for and by the consolidated entity, where applicable, includes the cost of materials and direct labour. The proportion of overheads and other incidental costs directly attributable to its construction are also capitalised to the cost of plant and equipment. Costs incurred on plant and equipment subsequent to initial acquisition are capitalised when it is probable that future economic benefits, in excess of the originally assessed performance of the asset will flow to the consolidated entity in future years. Where these costs represent separate components of a complex asset, they are accounted for as separate assets and are separately depreciated over their useful lives. Costs incurred on plant and equipment that do not meet the criteria for capitalisation are expensed as incurred.
For
per
sona
l use
onl
y

PAGE 82 | 2019 ANNUAL REPORT
Notes to the consolidated financial statements 30 June 2019 (i) Depreciation and amortisation Depreciation and amortisation is calculated on a straight line basis or units of production over the estimated useful lives of the asset. The estimated useful lives used for each class of asset are as follows:
Office equipment 3 - 4 years Office furniture and fittings 5 years
Plant and equipment under hire purchase Over the shorter of the lease term and useful life. Useful lives range between 3 - 5 years
Plant and equipment under finance lease
Over the shorter of the lease term and useful life. Useful lives range between 3 - 5 years
Process plant and buildings Lesser of life of mine and life of asset (ii) Impairment The carrying values of plant and equipment are reviewed for impairment when events or changes in circumstances indicate the carrying value may not be recoverable. If any such indication exists and where the carrying values exceed the estimated recoverable amount, the assets or cash-generating units are written down to their recoverable amount. For an asset that does not generate largely independent cash inflows, the recoverable amount is determined for the cash-generating unit to which the asset belongs. The recoverable amount of plant and equipment is the greater of fair value less costs to dispose and value in use. In assessing value in use, the estimated future cash flows are discounted to their present value using a pre-tax discount rate that reflects current market assessments of the time value of money and the risks specific to the asset. Property, plant and equipment that suffered an impairment are tested for possible reversal of the impairment whenever events or changes in circumstances indicate that the impairment may have reversed. (iii) Derecognition and disposal An item of property, plant and equipment is derecognised upon disposal or when no further future economic benefits are expected from its use or disposal. Any gain or loss arising on derecognition of the asset (calculated as the difference between net disposal proceeds and the carrying amount of the asset) is included in profit or loss in the year the asset is derecognised.
(r) Exploration, evaluation, development, mine properties and rehabilitation expenditure
(i) Exploration and evaluation expenditure Expenditure on exploration and evaluation is accounted for in accordance with the ‘area of interest’ method. Exploration and evaluation in the area of interest that have not at the reporting date reached a stage which permits a reasonable assessment of the existence or otherwise of economically recoverable reserves, and active and significant operations in, or relating to, the area of interest are expensed as incurred. Exploration and evaluation expenditure is capitalised provided the rights to tenure of the area of interest is current and the exploration and evaluation activities are expected to be recouped through successful development and exploitation of the area or, alternatively, by its sale. Similarly, the costs associated with acquiring an exploration and evaluation asset are also capitalised.
For
per
sona
l use
onl
y
2019 ANNUAL REPORT | PAGE 83
Notes to the consolidated financial statements 30 June 2019
When the technical feasibility and commercial viability of extracting a mineral resource have been demonstrated and a decision to develop has been made, any capitalised exploration and evaluation expenditure is reclassified as capitalised mine development. Prior to reclassification, capitalised exploration and evaluation expenditure is assessed for impairment. Impairment The carrying value of capitalised exploration expenditure is assessed for impairment at the cash-generating unit level whenever facts and circumstances suggest that the carrying amount of the asset may exceed its recoverable amount.
(ii) Mine development expenditure Mine development expenditure represents the costs incurred in preparing mines for production, and includes stripping and waste removal costs incurred before production commences. These costs are capitalised to the extent they are expected to be recouped through successful exploitation of the related mining leases. Once production commences, these are amortised using the units of production method based on the estimated economically recoverable reserves to which they relate or are written off if the mine property is abandoned. Impairment The carrying value of capitalised mine development is assessed for impairment whenever facts and circumstances suggest that the carrying amount of the asset may exceed its recoverable amount.
(iii) Mineral properties expenditure Mineral properties expenditure represents the cost incurred in the acquisition of a mining lease, and represents the excess of the cost of acquisition over the fair value of the net identifiable assets of the acquired mining lease at the date of acquisition. These costs are capitalised to the extent they are expected to be recouped through successful exploitation of the related mining leases Once production commences, these costs are amortised using the units of production method based on the estimated economically recoverable reserves to which they relate or are written off if the mine property is abandoned. Impairment The carrying value of capitalised mine properties expenditure is assessed for impairment whenever facts and circumstances suggest that the carrying amount of the asset may exceed its recoverable amount.
(iv) Provision for decommissioning and rehabilitation The Group is required to decommission and rehabilitate mines and processing sites at the end of their producing lives to a condition acceptable to the relevant authorities. The expected cost of any approved decommissioning or rehabilitation program, discounted to its net present value, is provided in the period in which obligation arise. The cost is capitalised when it gives rise to future benefits, whether the rehabilitation activity is expected to occur over the life of the operation or at the time of closure. Over time, the liability is increased for the change in net present value based on a risk adjusted pre-tax discount rate appropriate to the risk inherent in the liability. The unwinding of the discount is included in financing cost. Expected decommissioning and rehabilitation costs are based on the discounted value of the estimated future cost of detailed plans prepared for each site. Where there is a change in the expected decommissioning and rehabilitation costs, the value of the provision and any related asset are adjusted and the effect is recognised in the income statement on a prospective basis over the remaining life of the operation.
(s) Impairment of non-financial assets The Group assesses at each reporting date whether there is an indication that an asset may be impaired. If any such indication exists, or when annual impairment testing for an asset is required, the Group makes an estimate of the asset’s recoverable amount. An asset’s recoverable amount is the higher of its fair value less costs to sell and its value in use and determined for an individual asset, unless the asset does not generate cash inflows that are largely independent of those from other assets or groups of assets and the asset’s value in use cannot be estimated to be close to its fair value. In such cases the asset is tested for impairment as part of the cash-generating unit to which it belongs. When the carrying amount of an asset or cash-generating unit exceeds its recoverable amount, the asset or cash-generating unit is considered impaired and is written down to its recoverable amount. F
or p
erso
nal u
se o
nly

PAGE 84 | 2019 ANNUAL REPORT
Notes to the consolidated financial statements 30 June 2019
In assessing value in use, the estimated future cash flows are discounted to their present value using a pre tax discount rate that reflects current market assessments of the time value of money and the risks specific to the asset. Impairment losses relating to continuing operations are recognised in those expense categories consistent with the function of the impaired asset unless the asset is carried at revalued amount (in which case the impairment loss is treated as a revaluation decrease). An assessment is also made at each reporting date as to whether there is any indication that previously recognised impairment losses may no longer exist or may have decreased. If such indication exists, the recoverable amount is estimated. A previously recognised impairment loss is reversed only if there has been a change in the estimates used to determine the asset’s recoverable amount since the last impairment loss was recognised. If that is the case the carrying amount of the asset is increased to its recoverable amount. That increased amount cannot exceed the carrying amount that would be determined, net of depreciation, had no impairment loss been recognised for the asset in prior years. Such reversal is recognised in profit and loss unless the asset is carried at revalued amount, in which case the reversal is treated as a revaluation increase. After such a reversal the depreciation charge is adjusted in future periods to allocate the asset’s revised carrying amount, less any residual value, on a systematic basis over its remaining useful life. Non-financial assets that suffered an impairment are tested for possible reversal of the impairment whenever events or changes in circumstances indicate that the impairment may have reversed.
(t) Trade and other payables Trade payables and other payables are carried at amortised costs and represent liabilities for goods and services provided to the Group prior to the end of the financial year that are unpaid and arise when the Group becomes obliged to make future payments in respect of the purchase of these goods and services.
(u) Interest-bearing loans and borrowings All loans and borrowings are initially recognised at fair value net of issue costs associated with the borrowing. After initial recognition, interest-bearing loans and borrowings are subsequently measured at amortised cost using the effective interest method. Amortised cost is calculated by taking into account any issue costs, and any discount or premium on settlement. Gains and losses are recognised in the income statement when the liabilities are derecognised and as well as through the amortisation process.
(v) Provisions Provisions are recognised when the economic entity has a present obligation (legal or constructive) to make a future sacrifice of economic benefits to other entities as a result of past transactions or other past events, it is probable that a future sacrifice of economic benefits will be required and a reliable estimate can be made of the amount of the obligation. When the Group expects some or all of a provision to be reimbursed, for example under an insurance contract, the reimbursement is recognised as a separate asset but only when the reimbursement is virtually certain. The expense relating to any provision is presented in the income statement net of any reimbursement. The effect of the time value of money is material and provisions are determined by discounting the expected future cash flows at a pre-tax rate that reflects current market assessments of the time value of money and, where appropriate, the risks specific to the liability. Where discounting is used, the increase in the provision due to the passage of time is recognised as a borrowing cost.
(w) Employee benefits
(i) Short term benefits Liabilities for short term benefits expected to be wholly settled within 12 months of the reporting date are recognised in other payables in respect of employees services up to the reporting date. They are measured at the amounts expected to be paid when the liabilities are settled.
For
per
sona
l use
onl
y

2019 ANNUAL REPORT | PAGE 85
Notes to the consolidated financial statements 30 June 2019
(ii) Long service leave The liability for long service leave is recognised in the provision for employee benefits and measured as the present value of expected future payments to be made in respect of services provided by employees up to the reporting date using the projected unit credit method. Consideration is given to expected future wage and salary levels, experience of employee departures, and periods of service. Expected future payments are discounted using market yields at the reporting date of corporate bond rate with terms of maturity and currencies that match, as closely as possible, the estimated future cash outflows.
(iii) Share-based payments Equity-settled transactions The Group provides benefits to employees (including executive directors) of the Group in the form of share based payment transactions, whereby employees render services in exchange for rights over shares (‘equity-settled transactions’). The cost of these equity-settled transactions with employees is measured by reference to the fair value at the date at which they are granted. The fair value is determined using a Monte-Carlo simulation model or binomial model. In valuing equity-settled transactions, no account is taken of any performance conditions, other than conditions linked to the price of shares of Panoramic Resources Limited if applicable. The cost of equity-settled transactions is recognised, together with the corresponding increase in reserve, over the period in which the performance conditions are fulfilled, ending on the date on which the relevant employees become fully entitled to the award (‘vesting date’). The cumulative expense recognised for equity-settled transactions at each reporting date until vesting date reflects (i) the extent to which the vesting period has expired and (ii) the number of awards that, in the opinion of the directors of the Group, will ultimately vest. This opinion is formed based on the best available information at balance date. No adjustment is made for the likelihood of market performance conditions being met as the effect of these conditions is included in the determination of fair value at grant date. The income statement charge or credit for a period represents the movement in cumulative expense recognised as at the beginning and end of that period. There is a corresponding entry to equity. No expense is recognised for awards that do not ultimately vest, except for awards where vesting is conditional upon a market condition.
If the terms of an equity-settled award are modified, as a minimum an expense is recognised as if the terms had not been modified. In addition, an expense is recognised for any modification that increases the total fair value of the share-based payment arrangement, or is otherwise beneficial to the employee, as measured at the date of modification. If an equity-settled award is cancelled, it is treated as if it had vested on the date of cancellation, and any expense not yet recognised for the award is recognised immediately. However, if a new award is substituted for the cancelled award and designated as a replacement award on the date that it is granted, the cancelled and new award are treated as if they were a modification of the original award, as described in the previous paragraph. The dilutive effect, if any, of outstanding options is reflected as additional share dilution in the computation of earnings per share.
(iv) Bonus plans When applicable, the Company recognises a liability and an expense for bonuses based on a formula that takes into consideration the profit attributable to the Company's shareholders after certain adjustments. The Company recognises a provision where contractually obliged or where there is a past practice that has created a constructive obligation.
(x) Contributed equity Issued and paid up capital is recognised at the fair value of the consideration received by the Group. Incremental costs directly attributable to the issue of new shares for the acquisition of a business are deducted from equity and not expensed as an acquisition related cost.
(y) Dividends Provision is made for the amount of any dividend declared, being appropriately authorised and no longer at the discretion of the entity, on or before the end of the financial year but not distributed at balance date.
For
per
sona
l use
onl
y

PAGE 86 | 2019 ANNUAL REPORT
Notes to the consolidated financial statements 30 June 2019
(z) Business combinations Business combinations are accounted for using the acquisition method. The consideration transferred in a business combination shall be measured at fair value, which shall be calculated as the sum of the acquisition date fair values of the assets transferred by the acquirer, the liabilities incurred by the acquirer to former owners of the acquiree and the equity issued by the acquirer, and the amount of any non-controlling interest in the acquiree. For each business combination, the acquirer measures the non-controlling interest in the acquiree either at fair value or at the proportionate share of the acquiree's identifiable net assets. Acquisition-related costs are expensed as incurred. When the Group acquires a business, it assesses the financial assets and liabilities assumed for appropriate classification and designation in accordance with the contractual terms, economic conditions, the Group’s operating or accounting policies and other pertinent conditions as at the acquisition date. This includes the separation of embedded derivatives in host contracts by the acquiree. If the business combination is achieved in stages, the acquisition date fair value of the acquirer's previously held equity interest in the acquiree is remeasured at fair value as at the acquisition date through profit or loss. Any contingent consideration to be transferred by the acquirer will be recognised at fair value at the acquisition date. Subsequent changes to the fair value of the contingent consideration which is deemed to be an asset or liability will be recognised in accordance with AASB 139 either in profit or loss or in other comprehensive income. If the contingent consideration is classified as equity, it shall not be remeasured. Business combinations prior to 1 July 2009 were accounted for using the purchase method.
(aa) Government grants
Government grants are recognised where there is reasonable assurance that the grant will be received and all attached conditions will be complied with. When the grant relates to an expense item, it is recognised as income on a systematic basis over the periods that the related costs, for which it is intended to compensate, are expensed. When the grant relates to an asset, it is recognised as income in equal amounts over the expected useful life of the related asset.
(ab) Joint Operations When applicable, the Group’s recognises its interest in joint operations: • Assets, including its share of any assets held jointly; • Liabilities, including its share of any liabilities incurred jointly; • Revenue from the sale of its share of the output arising from the joint operation; • Share of the revenue from the sale of the output by the joint operation; and • Expenses, including its share of any expenses incurred jointly.
(ac) Financial assets On 1 July 2018 the Group implemented AASB 9 and elected not to restate comparative information. The Group has disclosed the current and prior year accounting policies for financial assets as below. Pre 1 July 2018 accounting policy Initial recognition, measurement and classification Financial assets were recognised when the entity became party to the contractual provisions to the instrument. For financial assets, this was equivalent to the date that the Group committed itself to either the purchase or sale of the asset. Financial assets were classified, at initial recognition, as financial assets at fair value through profit or loss, trade and other receivables, trade and other payables, held-to-maturity investments or available-for-sale financial assets. Financial instruments were initially measured at fair value plus transaction costs, except where the instrument was classified "at fair value through profit or loss (FVTPL)", in which case transaction costs were expensed to profit or loss immediately.
For
per
sona
l use
onl
y

2019 ANNUAL REPORT | PAGE 87
Notes to the consolidated financial statements 30 June 2019 Subsequent measurement Financial instruments were subsequently measured at fair value or amortised cost using the effective interest method. Other receivables and deposits Other receivables were subsequently measured at amortised cost. An impairment allowance was recognised when there was objective evidence that the Group would not be able to collect the receivable. Available for sale financial assets After initial recognition available-for-sale investments are measured at fair value with gains or losses being recognised as a separate component of equity until the investment is derecognised or until the investment is determined to be impaired, at which time the cumulative gain or loss previously reported in equity is recognised in profit or loss. The fair value of investments that are actively traded in organised financial markets is determined by reference to quoted market bid prices at the close of business on the balance sheet date. Investments which are not classified as held for trading or held to maturity are treated as available-for-sale financial assets. Post 1 July 2018 accounting policy Initial recognition and measurement: Financial assets are classified, at initial recognition, as subsequently measured at amortised cost, fair value through other comprehensive income (OCI), and fair value through profit or loss. The classification of financial assets at initial recognition that are debt instruments depends on the financial asset’s contractual cash flow characteristics and the Group’s business model for managing them. With the exception of trade receivables, the Group initially measures a financial asset at its fair value plus, in the case of a financial asset not at fair value through profit or loss, transaction costs. Trade receivables are measured at the transaction price determined under the Group’s accounting policy for revenue from contracts with customers (see note 1(h)). In order for a financial asset to be classified and measured at amortised cost or fair value through OCI, it needs to give rise to cash flows that are ‘solely payments of principal and interest (SPPI)’ on the principal amount outstanding. This assessment referred to as the SPPI test is performed at an instrument level. Subsequent measurement: For purposes of subsequent measurement, financial assets are classified in four categories: • Financial assets at amortised cost (debt instruments); • Financial assets at fair value through OCI with recycling of cumulative gains and losses (debt instruments); • Financial assets designated at fair value through OCI with no recycling of cumulative gains and losses upon
derecognition (equity instruments); or • Financial assets at fair value through profit or loss. Financial assets at amortised cost (debt instruments) The Group measures financial assets at amortised cost if both of the following conditions are met: • The financial asset is held within a business model with the objective to hold financial assets in order to collect
contractual cash flows; and • The contractual terms of the financial asset give rise on specified dates to cash flows that are solely payments of
principal and interest on the principal amount outstanding • Financial assets at amortised cost are subsequently measured using the effective interest rate (EIR) method and are
subject to impairment. Gains and losses are recognised in profit or loss when the asset is derecognised, modified or impaired.
The Group’s financial assets at amortised cost include deposits and other receivables.
For
per
sona
l use
onl
y

PAGE 88 | 2019 ANNUAL REPORT
Notes to the consolidated financial statements 30 June 2019 Financial assets at fair value through profit or loss Financial assets at fair value through profit or loss include financial assets held for trading, financial assets designated upon initial recognition at fair value through profit or loss, or financial assets mandatorily required to be measured at fair value. Financial assets with cash flows do not pass the SPPI test are classified and measured at fair value through profit or loss, irrespective of the business model. Debt instruments may be designated at fair value through profit or loss on initial recognition if doing so eliminates, or significantly reduces, an accounting mismatch. Financial assets at fair value through profit or loss are carried in the statement of financial position at fair value with net changes in fair value recognised in the profit or loss. This category also includes trade receivables subject to provisional pricing (QP adjustment), and listed equity investments. Impairment of financial assets The Group recognises an allowance for ECLs for all debt instruments not held at fair value through profit or loss. ECLs are based on the difference between the contractual cash flows due in accordance with the contract and all the cash flows that the Group expects to receive, discounted at an approximation of the original EIR. ECLs are recognised in two stages. For credit exposures for which there has not been a significant increase in credit risk since initial recognition, ECLs are provided for credit losses that result from default events that are possible within the next 12-months (a 12-month ECL). For those credit exposures for which there has been a significant increase in credit risk since initial recognition, a loss allowance is required for credit losses expected over the remaining life of the exposure, irrespective of the timing of the default (a lifetime ECL). For receivables other than those subject to provisional pricing, and due in less than 12 months, the Group does not track changes in credit risk, but instead, recognises a loss allowance based on the financial asset’s lifetime ECL at each reporting date. The Group has established a provision matrix for these receivables that is based on its historical credit loss experience, adjusted for forward-looking factors specific to the debtors and the economic environment. For any other financial assets carried at amortised cost (which are due in more than 12 months), the ECL is based on the 12-month ECL when there has not been a significant increase in credit risk since origination. The 12-month ECL is the proportion of lifetime ECLs that results from default events on a financial instrument that are possible within 12 months after the reporting date.
When there has been a significant increase in credit risk since origination, the allowance will be based on the lifetime ECL. When determining whether the credit risk of a financial asset has increased significantly since initial recognition and when estimating ECLs, the Group considers reasonable and supportable information that is relevant and available without undue cost or effort. This includes both quantitative and qualitative information and analysis, based on the Group’s historical experience and informed credit assessment including forward-looking information. The Group considers a financial asset in default when contractual payments are 90 days past due. However, in certain cases, the Group may also consider a financial asset to be in default when internal or external information indicates that the Group is unlikely to receive the outstanding contractual amounts in full before taking into account any credit enhancements held by the Group. A financial asset is written off when there is no reasonable expectation of recovering the contractual cash flows and usually occurs when past due for more than one year and not subject to enforcement activity. At each reporting date, the Group assesses whether financial assets carried at amortised cost are credit impaired. A financial asset is credit-impaired when one or more events that have a detrimental impact on the estimated future cash flows of the financial asset have occurred.
2 Segment information
(a) Business segments The Group has identified its operating segments based on the internal reports that are reviewed and used by the executive management team (the chief operating decision makers) in assessing performance and in determining the allocation of resources. The Group has identified five operating segments being: (1) Nickel, the Savannah Nickel Project; (2) Gold, the Gum Creek Gold Project; (3) Platinum Group Metals, the Thunder Bay North PGM Project and Panton PGM Project; (4) Australian Exploration; and (5) Overseas Exploration.
For
per
sona
l use
onl
y

2019 ANNUAL REPORT | PAGE 89
Notes to the consolidated financial statements 30 June 2019
Nickel The Savannah Nickel Project mines nickel ore and produces nickel concentrate. The Savannah Nickel Project was placed onto care and maintenance in May 2016. In July 2018, the Company commenced pre-production activities on site. The Company made its first shipment of Savannah nickel concentrate to China in February 2019. Nickel concentrate is sold to the one customer, Sino Nickel Pty Ltd (a company owned by the Jinchuan Group Limited (60%) and Sino Mining International (40%)). Gold The Gum Creek Gold Project (formerly Gidgee Gold) is located 640kms northeast of Perth in Western Australia, and was purchased by the Company in January 2011. In May 2012, the Company acquired the Wilsons Gold Project from Apex Minerals Limited. The Wilsons Gold Project is within trucking distance of the existing Gum Creek processing facility which is under care and maintenance. The Wilsons Gold Project acquisition forms part of the Gum Creek Gold Project. In October 2016, the Gum Creek Gold Project was sold to the Company's wholly owned subsidiary, Horizon Gold Limited. In December 2016, Horizon Gold Limited was listed on the Australian Stock Exchange (ASX) and raised $15 million in new capital. The Company has retained a 51% controlling equity in Horizon Gold Limited.
Platinum Group Metals (PGM) In July 2012, the Company completed the acquisition of Magma Metals Limited by way of an off market takeover bid. Magma’s principal project, the Thunder Bay North PGM Project, is located in northwest Ontario, Canada. Since acquisition, the Company undertook evaluation studies to re-optimise the mining method and mineral processing route contained in the 2011 Scoping Study/Preliminary Economic Assessment (PEA). In January 2015, Rio Exploration Canada Inc. (RTEC), having completed its review of all existing data on TBN, exercised a right under the "Earn In with Option to Joint Venture Agreement (July 2014)" by electing to proceed into the Earn-In option phase. RTEC is able to earn a 70% interest in the TBN by spending C$20 million over a five year period to January 2020. In May 2012, the Company executed an agreement with Platinum Australia Limited to purchase the Panton PGM Project. The Panton Project is located 60km north of Halls Creek, in the East Kimberley Region of Western Australia. On 27 June 2019, the Company's directors resolved to sell all of the Company's shares in 100% owned Canadian entity, Panoramic PGMs (Canada) Limited, the owner of the Thunder Bay North PGM Project, to Benton Resources Inc. (Benton) for a total cash consideration of C$9 million. A binding Letter Agreement was executed by the Company and Benton on 2 July 2019 to commence a process to complete the sale over the 2019/20 financial year. At 30 June 2019, the Thunder Bay North PGM Project was reclassified as asset held for sale and is excluded from this segment note. Australian and Overseas Exploration The Group's primary greenfield exploration and evaluation activities currently cover the regional areas of Western Australia. The Group's GM - Exploration is responsible for budgets and expenditure by the Group's exploration team. The exploration division does not normally derive any income. Should a project generated by the exploration division commence generating income or lead to the construction or acquisition of a mining operation, that operation would then be disaggregated from the exploration and become a separate reportable segment. Accounting policies Segment information is prepared in conformity with the accounting policies of the entity as disclosed in note 1 and Accounting Standard AASB 8 Operating Segments. Segment revenues, expenses, assets and liabilities are those that are directly attributable to a segment and the relevant portion that can be allocated to the segment on a reasonable basis. Segment assets include all assets used by a segment and consist primarily of operating cash, receivables, inventories, derivative financial instruments, property, plant and equipment and development and mine properties. Segment liabilities consist primarily of trade and other creditors, employee benefits, derivative financial instruments, finance leases and borrowings and provision for rehabilitation.
For
per
sona
l use
onl
y

PAGE 90 | 2019 ANNUAL REPORT
Notes to the consolidated financial statements 30 June 2019
(b) Operating business segments
2019 Nickel Gold Platinum
Group Metals
Australian Exploration
Overseas Exploration Total
$'000 $'000 $'000 $'000 $'000 $'000
Revenue from contracts with customers 25,112 - - - - 25,112 Total segment revenue 25,112 - - - - 25,112 Total segment results 16,493 (2,227) (74) (260) - 13,932 Total segment assets 177,475 22,136 6,912 5,260 - 211,783 Total segment liabilities 99,444 10,503 148 7 - 110,102 Reversal of impairment loss (19,156) - - - - (19,156) Depreciation and amortisation 6,999 - - - - 6,999 Mark to market of derivatives 2,130 - - - - 2,130 Exploration and evaluation written off - 901 - - - 901 Interest expense 396 129 - - - 525 Interest income (146) (95) (1) - - (242)
2018 Nickel Gold Platinum
Group Metals
Australian Exploration
Overseas Exploration Total
$'000 $'000 $'000 $'000 $'000 $'000
Total segment revenue - - - - - - Total segment results (5,066) (14,764) (32,723) (30) - (52,583) Total segment assets 24,654 24,234 10,647 22,583 - 82,118 Total segment liabilities 19,602 10,437 93 7 - 30,139 (39,190) (19,907) 21,983 (22,560) - (59,674) Impairment of assets - 12,569 32,583 - - 45,152 Exploration and evaluation written off - 619 - - - 619 Interest expense 419 463 - - - 882 Interest income (21) (189) (1) - - (211)
(c) Other segment information
(i) Segment revenue In 2019, 100% of the revenue from contracts with customers was derived from the sale of goods to one external customer located in China. Total revenue derived from interest income in Australia is $0.451 million (2018: $0.211 million). (ii) Segment results A reconciliation of segment results to loss for the year is provided as follows:
2019 $'000
2018 $'000
Segment results 13,932 (52,583) Corporate charges and other unallocated expenses (4,703) (3,418) Revenue and expenses directly associated with assets held for sale - 7,962 Profit/(loss) for the year 9,229 (48,039)
At 30 June 2018, the Lanfranchi Nickel Project was classified as an asset held for sale. The project was sold in December 2018. For further details, see Note 10. F
or p
erso
nal u
se o
nly

2019 ANNUAL REPORT | PAGE 91
Notes to the consolidated financial statements 30 June 2019
(iii) Segment assets Reportable segments' assets are reconciled to total assets as follows:
2019 $'000
2018 $'000
Segment assets 211,783 82,118 Intersegment eliminations 117 117 Unallocated assets 10,710 21,694 Assets held for sale 4,299 17,002 Total assets as per the consolidated balance sheet 226,909 120,931
At 30 June 2019, unallocated assets include cash and cash equivalent held by the parent entity amounting to $9.626 million (2018: $18.810 million) At 30 June 2019, the Thunder Bay North PGM Project was classified as an asset held for sale. For further details, see Note 10. Total non-current assets located in Australia is $177.088 million (2018: $73.564 million), and the total of these non-current assets located in Canada is nil (2018: $4.084 million). Non-current assets for this purpose consist of property, plant and equipment, exploration and evaluation, development and mine properties.
(iv) Segment liabilities
Reportable segments' liabilities are reconciled to total liabilities as follows:
2019 $'000
2018 $'000
Segment liabilities 110,102 30,139 Intersegment eliminations 117 117 Unallocated liabilities 1,568 1,253 Liabilities directly associated with assets held for sale - 3,502 Total liabilities as per the consolidated balance sheet 111,787 35,011 3 Revenue
2019 $'000
2018 $'000
Revenue from contracts with customers Sale of nickel concentrate 25,112 - 25,112 - 4 Other income
2019 $'000
2018 $'000
Net gain on sale of subsidiary 782 - Quotational period (QP) price adjustments 508 - Rents and sub-lease rentals 406 794 Foreign exchange gains (net) 42 - Gain on measurement of rehabilitation liability - 50 Interest income calculated using the EIR method 451 467 Sundry income 584 403 2,773 1,714 * Certain revenue amounts in the prior year have been reclassified between revenue and other income to allow for comparison of similar revenue streams between periods. In December 2018, the Lanfranchi Nickel Project (Project) was sold to a wholly owned subsidiary of Texas-based Black Mountain Metals LLC. A gain on the sale of the Project of $0.782 million has been recognised in the consolidated income statement for the year ended 30 June 2019. See note 10 for further details.
For
per
sona
l use
onl
y

PAGE 92 | 2019 ANNUAL REPORT
Notes to the consolidated financial statements 30 June 2019
5 Expenses
2019 $'000
2018 $'000
Loss before income tax includes the following specific expenses: Cost of sales of goods Cost of goods sold/produced 19,429 - Shipping costs 1,471 - Royalties 1,904 - Depreciation - property, plant and equipment 3,380 - Amortisation - deferred development costs 3,618 - Amortisation - mineral properties 1 - 29,803 - Finance costs Interest and finance charges paid/payable 1,024 22 Unwinding of discount - rehabilitation 359 921 1,383 943 Rental expense relating to operating leases Minimum lease payments 1,067 606 1,067 606 Derivative financial instruments Fair value losses on derivatives instruments which are not in an effective hedge relationship 2,071 - 2,071 - Other Net loss on disposal of property, plant and equipment 8 - Write off of asset 382 - Depreciation - property, plant and equipment not used in production 40 429 Net foreign currency exchange gain (41) - Net realisable value write down of stock 648 - 1,037 429 Breakdown of total employee benefits Salaries and wages 20,982 3,567 Payroll tax 1,266 206 Superannuation 1,962 328 Redundancies - 78 Share based payments expense - 160 24,210 4,339
For
per
sona
l use
onl
y
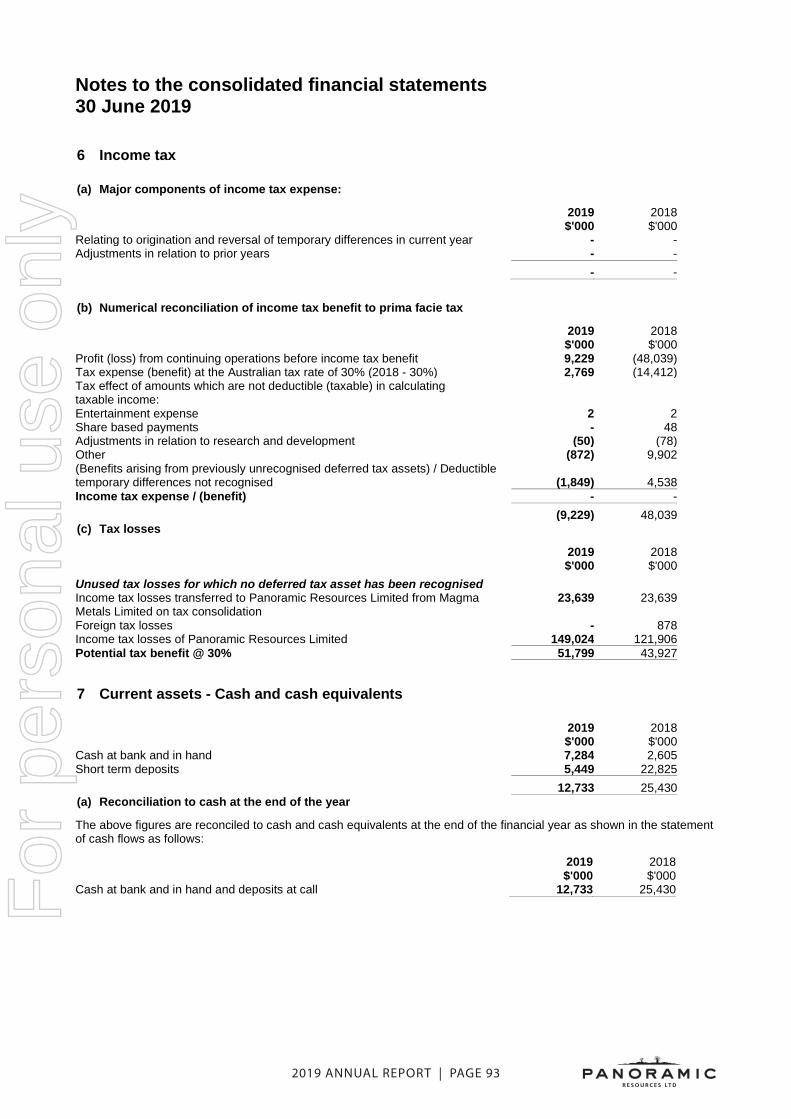
2019 ANNUAL REPORT | PAGE 93
Notes to the consolidated financial statements 30 June 2019
6 Income tax
(a) Major components of income tax expense:
2019 $'000
2018 $'000
Relating to origination and reversal of temporary differences in current year - - Adjustments in relation to prior years - - - - (b) Numerical reconciliation of income tax benefit to prima facie tax
2019 $'000
2018 $'000
Profit (loss) from continuing operations before income tax benefit 9,229 (48,039) Tax expense (benefit) at the Australian tax rate of 30% (2018 - 30%) 2,769 (14,412) Tax effect of amounts which are not deductible (taxable) in calculating taxable income: Entertainment expense 2 2 Share based payments - 48 Adjustments in relation to research and development (50) (78) Other (872) 9,902 (Benefits arising from previously unrecognised deferred tax assets) / Deductible temporary differences not recognised (1,849) 4,538 Income tax expense / (benefit) - - (9,229) 48,039 (c) Tax losses
2019 $'000
2018 $'000
Unused tax losses for which no deferred tax asset has been recognised Income tax losses transferred to Panoramic Resources Limited from Magma Metals Limited on tax consolidation
23,639 23,639
Foreign tax losses - 878 Income tax losses of Panoramic Resources Limited 149,024 121,906 Potential tax benefit @ 30% 51,799 43,927
7 Current assets - Cash and cash equivalents
2019 $'000
2018 $'000
Cash at bank and in hand 7,284 2,605 Short term deposits 5,449 22,825 12,733 25,430 (a) Reconciliation to cash at the end of the year The above figures are reconciled to cash and cash equivalents at the end of the financial year as shown in the statement of cash flows as follows:
2019 $'000
2018 $'000
Cash at bank and in hand and deposits at call 12,733 25,430 F
or p
erso
nal u
se o
nly

PAGE 94 | 2019 ANNUAL REPORT
Notes to the consolidated financial statements 30 June 2019
(b) Cash at bank and on hand Cash and cash equivalents as at 30 June 2019 include $1.879 million (2018: 7.161 million) held by Horizon Gold Limited. Cash at bank earns interest at floating rates based on daily bank deposit rates. The weighted average interest rate achieved for the year was 1.60% (2018: 1.85%).
(c) Short term deposits Short term deposits are made for varying periods typically between one day and three months depending on the immediate cash requirements of the Group and earn interest at short-term rates. If short term deposits have original maturity greater than three months, principal amounts can be redeemed in full with no significant interest penalty. The weighted average interest rate achieved for the year was 1.69% (2018: 2.50%). Deposits are held with various financial institutions with short term credit ratings of A-1+ (S&P). As these instruments have maturities of less than twelve months, the Group has assessed the credit risk on these financial assets using life time expected credit losses. In this regard, the Group has concluded that the probability of default on the deposits is relatively low. Accordingly, no impairment allowance has been recognised for expected credit losses on the term deposits.
(d) Fair value The carrying amount for cash and cash equivalents equals the fair value.
8 Current assets - Trade and other receivables
2019 $'000
2018 $'000
Trade receivables - at fair value 1,521 - Other receivables - at amortised cost 2,141 421 Restricted deposit - at amortised cost 15,616 - 19,278 421 (a) Trade receivables Trade receivables are non-interest bearing and are generally on 30-90 day terms. Generally, on presentation of ship loading documents and the provisional invoice, the customer settles 100% of the provisional sales invoice value within approximately 7 days and the final sales invoice value is settled in approximately 5 days upon presentation of the final invoice. Sales are invoiced and received in US dollars (US$). As at 30 June 2019, 6,797 tonnes of nickel concentrate subject to QP pricing was recognised with reference to an average nickel price of US$5.38 per pound. The trade receivable at the reporting date has been remeasured with reference to an average forward nickel price of US$6.11 per pound. There is no material copper and cobalt exposure at 30 June 2019. The amount of fair value changes recognised in the income statement during the year ended 30 June 2019 was $0.507 million (2018: nil) All receivables are current and not past due. All receivables are current and not past due.
(b) Restricted deposit At 30 June 2019, the Group had undrawn funds of $15.616 million on deposit. Under the SFA with Macquarie Bank Limited, these funds can only be used by the Company for expenditure associated with the Savannah Nickel Project in accordance with the SFA and the drawing of the funds is subject to approval of Macquarie Bank Limited. The deposit is held with Macquarie Bank Limited with a short term credit ratio of A-1+ (S&P). As the deposit is expected to be utilised within 12 months, the Group has assessed the credit risk on these financial assets using life time expected credit losses. In this regard, the Group has concluded that the probability of default on the deposit is relatively low. Accordingly, no impairment allowance has been recognised for expected credit losses on the deposit.
(c) Other receivables Other receivables are non-interest bearing and have repayment terms between 30 and 90 days. There is an insignificant probability of default as sundry debtors are short term, have no history of default and customers have passed the Group’s internal credit assessment.
For
per
sona
l use
onl
y
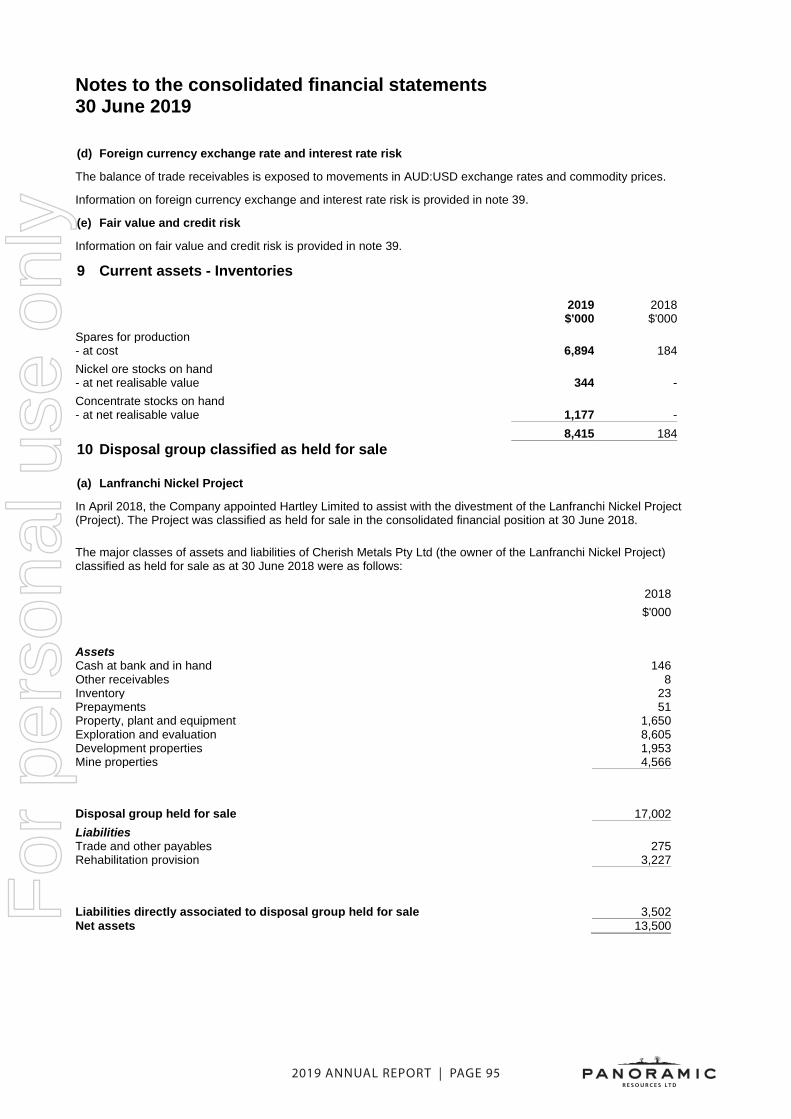
2019 ANNUAL REPORT | PAGE 95
Notes to the consolidated financial statements 30 June 2019
(d) Foreign currency exchange rate and interest rate risk The balance of trade receivables is exposed to movements in AUD:USD exchange rates and commodity prices. Information on foreign currency exchange and interest rate risk is provided in note 39.
(e) Fair value and credit risk Information on fair value and credit risk is provided in note 39.
9 Current assets - Inventories
2019 $'000
2018 $'000
Spares for production - at cost 6,894 184 Nickel ore stocks on hand - at net realisable value 344 - Concentrate stocks on hand - at net realisable value 1,177 - 8,415 184 10 Disposal group classified as held for sale
(a) Lanfranchi Nickel Project In April 2018, the Company appointed Hartley Limited to assist with the divestment of the Lanfranchi Nickel Project (Project). The Project was classified as held for sale in the consolidated financial position at 30 June 2018. The major classes of assets and liabilities of Cherish Metals Pty Ltd (the owner of the Lanfranchi Nickel Project) classified as held for sale as at 30 June 2018 were as follows:
2018 $'000 Assets Cash at bank and in hand 146 Other receivables 8 Inventory 23 Prepayments 51 Property, plant and equipment 1,650 Exploration and evaluation 8,605 Development properties 1,953 Mine properties 4,566
Disposal group held for sale 17,002 Liabilities Trade and other payables 275 Rehabilitation provision 3,227
Liabilities directly associated to disposal group held for sale 3,502 Net assets 13,500
For
per
sona
l use
onl
y

PAGE 96 | 2019 ANNUAL REPORT
Notes to the consolidated financial statements 30 June 2019
On 13 September 2018, the Company announced that it had agreed to sell its shareholding in 100% owned Cherish Metals Pty Ltd, the 100% owner of the Lanfranchi Nickel Project, to a wholly owned subsidiary of Texas-based Black Mountain Metals LLC (“Black Mountain”) for a total consideration of $15.1 million, with an effective sale date of 30 June 2018. On 6 December 2018, all the conditions precedent to the sale had been satisfied or waived and final settlement was concluded with a second payment of $11.99 million by Black Mountain in addition to the $1.51 million deposit paid in September 2018. The Company was to receive deferred cash consideration of $1.6 million to be paid in 12 equal monthly instalments, commencing from the date that is 14 days from the first supply or ore under a contract with BHP Nickel West Pty Ltd, the processing of ore in another commercial capacity or 1 January 2021, whichever is earlier. A subsequent agreement was reached with Black Mountain for an early settlement of the deferred cash consideration. A final payment was received on 17 June 2019 at a discounted value of $1.5 million. At the date of disposal, proceeds received from the sale amount to $14.285 million (net of cost) and the carrying amount of net assets disposed of amount to $13.502 million. As a result, a gain on the sale of the Project of $0.782 million has been recognised in the consolidated income statement for the year ended 30 June 2019.
(b) Thunder Bay North PGM Project On 27 June 2019, the Company's directors resolved to sell all of the Company's shares in 100% owned Canadian entity, Panoramic PGMs (Canada) Limited, the owner of the Thunder Bay North PGM Project, to Benton Resources Inc. (Benton) for a total cash consideration of C$9 million. A binding Letter Agreement was executed by the Company and Benton on 2 July 2019 to commence the process to complete the sale over the 2019/20 financial year. As the carrying value of the Thunder Bay North PGM Project will be recovered principally through a sale transaction, the Thunder Bay North PGM Project has been classified as an asset held for sale at 30 June 2019. The major classes of assets and liabilities of the Thunder Bay North PGM Project classified as disposal group held for sale consists of exploration and evaluation properties totalling $4.299 million as at 30 June 2019. The fair value of the project has been determined based on an internal review of comparable market transactions for Platinum Group Metals (PGM) projects completed between 2010 and 2019.
11 Current assets - Prepayments
2019 $'000
2018 $'000
Prepayments 1,354 246 12 Derivative financial instruments
2019 $'000
2018 $'000
Current assets Commodity put options - at fair value through profit or loss 122 - Forward commodity contracts - designated as cash flow hedges 3,620 - Total current derivative financial instrument assets 3,742 - Non-current assets Forward commodity contracts - designated as cash flow hedges 4,409 - Total non-current derivative financial instruments 4,409 - Current liabilities Forward foreign exchange contracts - designated as cash flow hedges 2,721 - Total current derivative financial instrument liabilities 2,721 - Non-current liabilities Forward foreign exchange contracts - designated as cash flow hedges 5,584 - Total non-current derivative financial instrument liabilities 5,584 - Net position (154) - F
or p
erso
nal u
se o
nly

2019 ANNUAL REPORT | PAGE 97
Notes to the consolidated financial statements 30 June 2019 (a) Instruments used by the group In September 2018, the Company executed the A$40 million Savannah Facility Agreement (SFA) and Master International Swaps Derivatives Association Agreement (ISDA) with Macquarie Bank Limited. The Company entered into a mandatory hedge program under the ISDA to hedge exposure to fluctuations in commodity prices and foreign currency exchange rates. The Group used a number of methodologies to determine the fair value of derivatives. These techniques included comparing contracted rates to market rates with the same length of maturity to determine the value of forward contracts and used of option pricing models to value put options. The principal inputs to valuation techniques are listed below: - Commodity prices - Interest rates - Foreign currency exchange rates - Price volatilities - Discount rates Commodity prices, interest rates and foreign currency exchange rates were determined by reference to published / observable prices. The Group presents its derivative financial assets and liabilities on a gross basis. Derivative financial instruments entered into by the Group are subject to enforceable master netting arrangements, such as ISDA master netting agreement. In certain circumstances, for example, when a credit event such as default occurs, all outstanding transactions under an ISDA agreement are terminated, the termination value is assessed and only a single net amount is payable in settlement of all transactions. The amounts set out in this note represent the derivative financial assets and liabilities of the Group, that are subject to the above arrangements and are presented on a gross basis.
(b) Commodity Hedges
The Group has entered into nickel forward, nickel puts and copper forward contracts as part of mandatory and discretionary hedging lines under the ISDA. These contracts have been designated as cashflow hedges and are timed to mature when sales are scheduled to occur.
Consolidated Tonnes
Hedged Average Price
per LB Tonnes
Hedged Average Price
per LB
30 June 2019 30 June 2019 30 June 2018 30 June 2018
Nickel Fixed Forwards Not later than one year 2,058 US$6.32 - - Later than one year 5,932 US$6.18 - - Copper Fixed Forwards Not later than one year 1,292 US$2.76 - - Later than one year 1,344 US$2.77 - - Nickel Put Options Not later than one year 1,319 A$7.48 - - The portion of the gain or loss on the hedging instrument that is determined to be an effective hedge is recognised directly in equity. When the cash flows occur, the Company adjusts the initial measurement of the component recognised in the income statement by the related amount deferred in equity.
(c) Foreign Currency Hedges The Group has entered into foreign currency forward contracts as part of mandatory and discretionary hedging lines under the ISDA.
For
per
sona
l use
onl
y

PAGE 98 | 2019 ANNUAL REPORT
Notes to the consolidated financial statements 30 June 2019
These contracts have been designated as cashflow hedges and are timed to mature when receipts are scheduled to be received. Consolidated USD Hedged Average FX Rate USD Hedged Average FX Rate
30 June 2019 30 June 2019 30 June 2018 30 June 208
$ '000 US$ $ '000 US$
Foreign Currency (USD) Forwards Not later than one year $31,206 $0.7418 - - Later than one year $72,848 $0.7437 - - The portion of the gain or loss on the hedging instrument that determined to be an effective hedge is recognised directly in equity. When the cash flows occur, the Company adjusts the initial measurement of the component recognised in the income statement by the related amount deferred in equity.
13 Non-current assets - Available-for-sale financial assets Available-for-sale financial assets include the following classes of financial assets:
2019 $'000
2018 $'000
Listed securities Equity securities - 2,703 At beginning of year 2,703 1,200 AASB 9 transition adjustment - reclassified listed equity investments to financial assets at fair value through profit or loss (2,703) - Additions - 81 Fair value gain/(loss) recognised in other comprehensive income - 1,422 At end of year - 2,703 In the comparative period, these investments where classified as available for sale investments with all fair value movements being recognised within equity in the available for sale reserve in accordance with AASB 139. On 1 July 2018, on adoption of AASB 9, investments in equity securities were reclassified from available for sale to financial assets at fair value through profit or loss. For further details, see note 1(d).
14 Non-current assets - Property, plant and equipment
2019 $'000
2018 $'000
Plant and equipment Gross carrying amount - at cost 179,235 163,547 Accumulated depreciation and impairment (136,917) (153,180) 42,318 10,367 Leased plant & equipment Gross carrying amount - at cost 8,149 365 Accumulated depreciation (1,047) (365) 7,102 - Construction in progress Gross carrying amount - at cost 9,584 241 Accumulated impairment - 22 9,584 263 59,004 10,630
For
per
sona
l use
onl
y

2019 ANNUAL REPORT | PAGE 99
Notes to the consolidated financial statements 30 June 2019
Plant and equipment
$'000
Leased plant and
equipment $'000
Construction in progress
$'000 Total $'000
Year ended 30 June 2019 Opening net book amount 10,367 - 263 10,630 Additions 21 7,785 25,587 33,393 Depreciation charge (2,736) (683) - (3,419) Reversal of impairment loss 18,862 42 (22) 18,882 Write off to profit and loss (280) 21 - (259) Transfer (to)/from other asset class 16,092 (63) (16,244) (215) Disposals (8) - - (8) Closing net book amount 42,318 7,102 9,584 59,004 At 30 June 2019 Gross carrying amount - at cost 179,235 8,149 9,584 196,968 Accumulated depreciation and impairment (136,917) (1,047) - (137,964) Net book amount 42,318 7,102 9,584 59,004 Year ended 30 June 2018 Opening net book amount 11,298 59 198 11,555 Additions 1,144 - 65 1,209 Assets included in a disposal group classified as held for sale and other disposals (1,649) - - (1,649) Depreciation charge (430) - - (430) Transfer (to)/from other asset class 59 (59) - - Disposals (55) - - (55) Closing net book amount 10,367 - 263 10,630 At 30 June 2018 Gross carrying amount - at cost 163,547 365 241 164,153 Accumulated depreciation (153,180) (365) 22 (153,523) Net book amount 10,367 - 263 10,630 (a) Impairment of assets Savannah Nickel Project On 16 July 2018, the Company's Board made the formal decision to restart operations at the Savannah Nickel Project. As a result of this decision, the Group commenced Phase Two of the pre-production activities at the Project with first shipment of Savannah bulk concentrate to China in February 2019. The formal decision to restart operations at the Savannah Nickel Project was considered to be an indicator of reversal of impairment loss recognised in prior periods and accordingly, management determined the recoverable amount of the Savannah Nickel Project cash generating unit (“CGU”) at 31 December 2018. The recoverable amount of the Savannah Nickel Project CGU was determined based on a combination of a discounted cash flow (DCF) calculation at 31 December 2018 using cash flow projections based on financial budgets covering the life of the project incorporating current market assumptions approved by the Company's Directors and independent valuations from external valuers. The recoverable amount of the Savannah Nickel Project CGU was in excess of the carrying value and accordingly, the entire impairment loss recognised in prior periods, adjusted for depreciation and amortisation, was reversed. This impairment loss reversal has been recognised in the consolidated income statement. The fair value methodology adopted is categorised as Level 3 in the fair value hierarchy. In determining the FVLCD, estimates were made in relation to the underlying resources/reserve and the valuation multiples. F
or p
erso
nal u
se o
nly

PAGE 100 | 2019 ANNUAL REPORT
Notes to the consolidated financial statements 30 June 2019 The carrying value of the Savannah Nickel Project was reviewed for indicators of impairment at 30 June 2019 and no indicators of impairment were identified. Lanfranchi Nickel Project At 30 June 2018, the Lanfranchi Nickel Project was classified as an asset held for sale. The major classes of assets of the Project classified as held for sale consists of property, plant and equipment, capitalised exploration and evaluation, mine development and mineral properties expenditure totalling $17.002 million as at 30 June 2018. Immediately before the classification of the Project's assets being held for sale, the recoverable amount was estimated for the exploration and evaluation expenditure, mine development and mineral properties expenditure and it was determined that a reversal of impairment loss was required. An impairment loss reversal of $7.260 million was recognised at 30 June 2018 to increase the carrying value of the exploration and evaluation expenditure and mineral properties expenditure to their fair value. This impairment loss reversal has been recognised in the consolidated income statement.
(b) Non-current assets pledged as security Lease liabilities are effectively secured as the rights to the leased assets recognised in the financial statements revert to the lessor in the event of default. At 30 June 2019, the carrying amounts of assets pledged as security for current and non-current lease liabilities were $7.102 million.
15 Non-current assets - Deferred tax assets
2019 $'000
2018 $'000
The balance comprises temporary differences attributable to: Tax losses 51,799 43,927 Employee benefits 700 268 Provisions 10,143 10,404 Depreciation and amortisation 1,499 7,547 Sundry temporary differences 1,368 14 Research and development tax offset 4,091 4,091 Business related costs 734 727 Derivatives 46 - Deferred tax asset not recognised (48,036) (47,012) 22,344 19,966 Set-off of deferred tax liabilities pursuant to set-off provisions (note 23) (22,344) (19,966) Net deferred tax assets - - Net deferred tax assets - - 16 Non-current assets - Exploration and evaluation, development and mine properties
2019 $'000
2018 $'000
Mine development expenditure Gross carrying amount - at cost 295,988 225,118 Accumulated amortisation and impairment (211,243) (207,896) 84,745 17,222 Exploration and evaluation Gross carrying amount - at cost 98,983 116,983 Accumulated impairment (71,220) (71,220) 27,763 45,763 Blank Mineral properties Gross carrying amount - at cost 1,795 1,795 Accumulated amortisation and impairment (1,766) (1,768) 29 27 112,537 63,012
For
per
sona
l use
onl
y

2019 ANNUAL REPORT | PAGE 101
Notes to the consolidated financial statements 30 June 2019
Mine Development Expenditure
$'000
Exploration and
Evaluation $'000
Mine (Mineral) Properties
$'000 Total $'000
Year ended 30 June 2019 Opening net book amount 17,222 45,763 27 63,012 Additions 47,528 5,960 - 53,488 Transfer to disposal group held for sale - (4,298) - (4,298) Amortisation charge (3,618) - - (3,618) Transfer (to)/from other asset class 18,976 (18,761) - 215 Written off to profit and loss - (901) - (901) Reversal of impairment loss (net) 271 - 2 273 Remeasurement of rehabilitation provision 4,366 - - 4,366 Closing net book amount 84,745 27,763 29 112,537 At 30 June 2019 Gross carrying amount - at cost 295,988 98,983 1,795 396,766 Accumulated amortisation and impairment (211,243) (71,220) (1,766) (284,229) Net book amount 84,745 27,763 29 112,537 Year ended 30 June 2018 Opening net book amount 17,028 91,772 1,403 110,203 Additions 2,697 4,297 - 6,994 Transfer to disposal group held for sale (1,953) (8,605) (4,566) (15,124) Impairment loss - (41,082) 3,190 (37,892) Written off to profit and loss - (619) - (619) Remeasurement of rehabilitation provision (550) - - (550) Closing net book amount 17,222 45,763 27 63,012 At 30 June 2018 Gross carrying amount - at cost 225,118 116,983 1,795 343,896 Accumulated amortisation and impairment (207,896) (71,220) (1,768) (280,884) Net book amount 17,222 45,763 27 63,012
The ultimate recoupment of costs carried forward for exploration and evaluation expenditure is dependent on the successful development and commercial exploitation or the sale of the respective mining areas. Refer to Note 14(a) for further details on impairment reversal recognised in 2019. Refer to Note 22 for details of assets pledged as security in relation to the Groups’ non-current assets.
(a) Impairment of assets
Savannah Nickel Project Refer to Note 14(a) for further details on impairment of Savannah Nickel Project assets. Lanfranchi Nickel Project Refer to Note 14(a) for further details on impairment of Lanfranchi Nickel Project assets. Gum Creek Gold Project The deficiency in market capitalisation of Horizon Gold Limited (which owns the Gum Creek Gold Project) compared to its net assets during the year ended 30 June 2018 led to the Group to make an assessment of the recoverability of the carrying value of Horizon's assets at 30 June 2018. An external party was engaged to determine the fair value less costs to dispose (FVLCD) of the Gum Creek Gold Project. The FVLCD was then compared against the carrying value of capitalised exploration and evaluation expenditure. As a result of this comparison, an impairment loss of $12.569 million was recognised to reduce the carrying amount of exploration and evaluation expenditure. This amount has been recognised in the consolidated income statement. The fair value less cost to dispose of the Project's assets were determined by a valuation performed by an external party based on a review of comparable market transactions that were completed between 2015 and 2018. The fair value methodology adopted was categorised as Level 3 in the fair value hierarchy. In determining the FVLCD, estimates were made in relation to the underlying resources/reserves and the valuation multiple.
For
per
sona
l use
onl
y
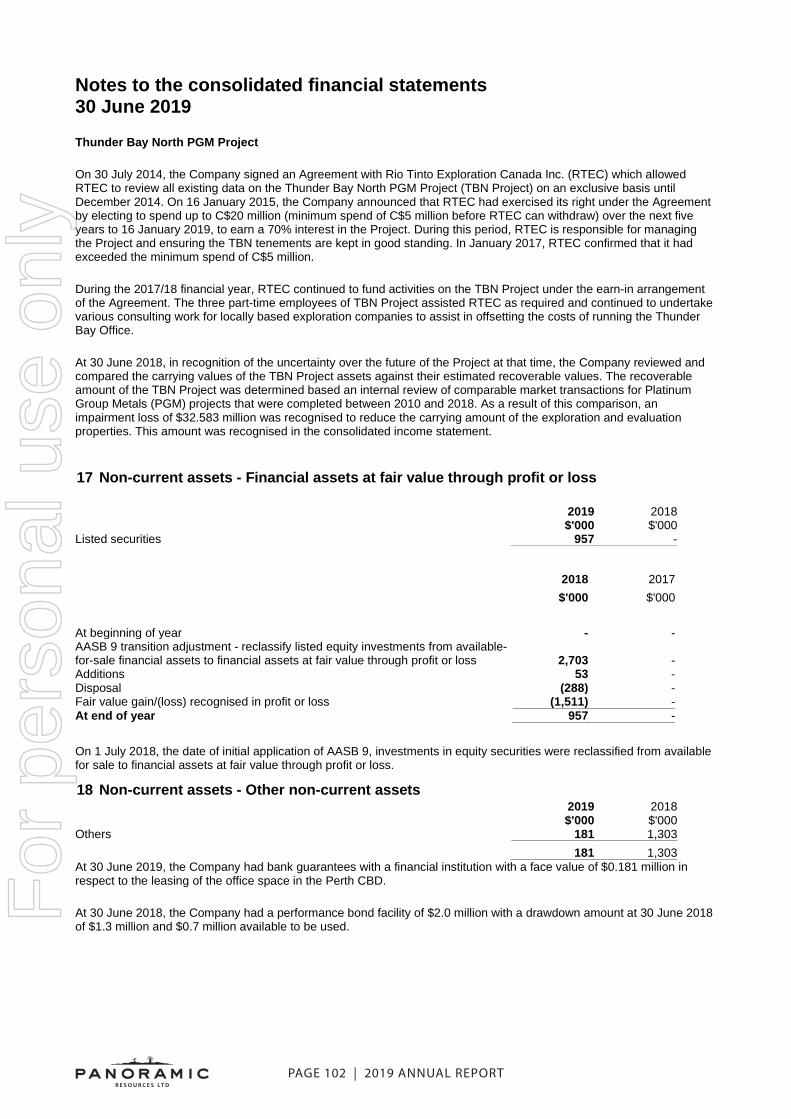
PAGE 102 | 2019 ANNUAL REPORT
Notes to the consolidated financial statements 30 June 2019 Thunder Bay North PGM Project On 30 July 2014, the Company signed an Agreement with Rio Tinto Exploration Canada Inc. (RTEC) which allowed RTEC to review all existing data on the Thunder Bay North PGM Project (TBN Project) on an exclusive basis until December 2014. On 16 January 2015, the Company announced that RTEC had exercised its right under the Agreement by electing to spend up to C$20 million (minimum spend of C$5 million before RTEC can withdraw) over the next five years to 16 January 2019, to earn a 70% interest in the Project. During this period, RTEC is responsible for managing the Project and ensuring the TBN tenements are kept in good standing. In January 2017, RTEC confirmed that it had exceeded the minimum spend of C$5 million. During the 2017/18 financial year, RTEC continued to fund activities on the TBN Project under the earn-in arrangement of the Agreement. The three part-time employees of TBN Project assisted RTEC as required and continued to undertake various consulting work for locally based exploration companies to assist in offsetting the costs of running the Thunder Bay Office. At 30 June 2018, in recognition of the uncertainty over the future of the Project at that time, the Company reviewed and compared the carrying values of the TBN Project assets against their estimated recoverable values. The recoverable amount of the TBN Project was determined based an internal review of comparable market transactions for Platinum Group Metals (PGM) projects that were completed between 2010 and 2018. As a result of this comparison, an impairment loss of $32.583 million was recognised to reduce the carrying amount of the exploration and evaluation properties. This amount was recognised in the consolidated income statement.
17 Non-current assets - Financial assets at fair value through profit or loss
2019 $'000
2018 $'000
Listed securities 957 - 2018 2017 $'000 $'000 At beginning of year - - AASB 9 transition adjustment - reclassify listed equity investments from available-for-sale financial assets to financial assets at fair value through profit or loss 2,703 - Additions 53 - Disposal (288) - Fair value gain/(loss) recognised in profit or loss (1,511) - At end of year 957 - On 1 July 2018, the date of initial application of AASB 9, investments in equity securities were reclassified from available for sale to financial assets at fair value through profit or loss.
18 Non-current assets - Other non-current assets
2019 $'000
2018 $'000
Others 181 1,303 181 1,303 At 30 June 2019, the Company had bank guarantees with a financial institution with a face value of $0.181 million in respect to the leasing of the office space in the Perth CBD. At 30 June 2018, the Company had a performance bond facility of $2.0 million with a drawdown amount at 30 June 2018 of $1.3 million and $0.7 million available to be used. F
or p
erso
nal u
se o
nly

2019 ANNUAL REPORT | PAGE 103
Notes to the consolidated financial statements 30 June 2019
19 Current liabilities - Trade and other payables
2019 $'000
2018 $'000
Trade payables 15,020 2,154 Accrued expenses 7,074 1,610 22,094 3,764 Trade payables are non interest bearing and are normally settled on 30 day terms. Due to the short term nature of these payables, their carrying value is assumed to approximate their fair value.
20 Current liabilities - Borrowings
2019 $'000
2018 $'000
Secured Bank loans (note 22) 5,759 - Lease liabilities (note 22) 1,685 - Other loans 638 - Total secured current borrowings 8,082 - (a) Risk exposures Details of the Group's exposure to risks arising from current and non-current borrowings are set out in note 39.
(b) Fair value disclosures Details of the fair value of borrowings for the Group are set out in note 39.
21 Current liabilities - Provisions
2019 $'000
2018 $'000
Employee benefits - long service leave 577 506 Employee benefits - annual leave 1,628 417 2,205 923 The current provision for long service leave includes all unconditional entitlements where employees have completed the required period of service. Where employees have not yet completed the required period of service, their entitlement is recognised as a non-current provision for long service leave.
22 Non-current liabilities - Borrowings
2019 $'000
2018 $'000
Secured Bank loans 33,500 - Lease liabilities (note 30) 5,053 - Total secured non-current borrowings 38,553 - Bank loans On 20 September 2018, the consolidated entity executed the Savannah Facility Agreement (SFA) with Macquarie Bank Limited (“Macquarie”) for an up to $40 million project loan, including executing an ISDA Master Agreement to undertake mandatory and discretionary commodity and foreign currency hedging. The loan facility is secured over the Project's assets and undertakings. At 30 June 2019, the carrying amounts of assets pledged as security for current and non-current borrowings were of $181.308 million. On 5 March 2019, the SFA was amended in response to the slower than expected ramp-up in production from the Savannah orebody and lower metal prices. The first loan repayment, originally scheduled for 31 March 2020, was moved to 30 June 2020 without changing the repayment end date of 31 December 2021. In addition, the $40 million, fully drawn and outstanding under the SFA, was split over two tranches of $30 million in Senior Debt and $10 million in Mezzanine Debt.
For
per
sona
l use
onl
y

PAGE 104 | 2019 ANNUAL REPORT
Notes to the consolidated financial statements 30 June 2019 Lease liabilities Finance lease liabilities are effectively secured as the rights to the leased assets recognised in the financial statements revert to the lessor in the event of default. At 30 June 2019, the carrying amounts of assets pledged as security for current and non-current lease liabilities were $7.102 million (2018: nil). In 2019, finance lease liabilities had an average term of 4 years. The average interest rate implicit in the hire purchase liability was 6.12% (2018: nil). Financing facilities available At 30 June 2019, the Company had bank guarantees with a financial institution with a face value of $0.181 million in respect to the leasing of the office space in the Perth CBD. At 30 June 2018, the Company had a performance bond facility of $2.0 million with a drawdown amount at 30 June 2018 of $1.3 million and $0.7 million available to be used.
(a) Interest rate risk exposures The following table sets out the Company's exposure to interest rate risk, including the contractual repricing dates and the effective weighted average interest rate by maturity periods.
2019 Fixed interest rate
Floating interest
rate
1 year or
less
Over 1 to 2 years
Over 2 to 3 years
Over 3 to 4 years
Non interest bearing Total
$'000 $'000 $'000 $'000 $'000 $'000 $'000 Trade and other payables - - - - - 3,764 3,764 Other loans - 638 - - - - 638 Bank loans 39,259 - - - - - 39,259 Lease liabilities - 1,685 1,785 1,736 1,531 - 6,737 39,259 2,323 1,785 1,736 1,531 3,764 50,398
Weighted average interest rate - 4.88% 5.89% 5.97% 6.17% N/A
2018 Fixed interest rate
Floating interest
rate
1 year or
less
Over 1 to 2 years
Over 2 to 3 years
Over 3 to 4 years
Non interest bearing Total
$'000 $'000 $'000 $'000 $'000 $'000 $'000 Trade and other payables - - - - - 3,764 3,764 - - - - - 3,764 3,764 Weighted average interest rate - - - - - N/A N/A
For
per
sona
l use
onl
y

2019 ANNUAL REPORT | PAGE 105
Notes to the consolidated financial statements 30 June 2019
(b) Changes in liabilities arising from financing activities
Bank loans Lease laibilities Total $'000 $'000 $'000 1 July 2018 - - - Proceeds 40,000 - 40,000 Repayments (Principal and Interest) (1,152) (714) (1,866) Other non cash movements 1,411 7,452 8,863 30 June 2019 40,259 6,738 46,997 Bank loans Lease liabilities Total $'000 $'000 $'000 1 July 2017 - 837 837 Proceeds - - - Repayments (Principal and Interest) - (859) (859) Other non cash movements - 22 22 30 June 2018 - - - The 'Other’ column includes the effect of accrued interest and various other adjustments.
(c) Fair value The carrying amounts and fair values of borrowings at balance date are:
2019 2018
Carrying amount
$'000
Fair value $'000
Carrying amount
$'000
Fair value $'000
On-balance sheet (i) Non-traded financial liabilities Bank loans 39,295 39,295 - - Lease liabilities 6,738 6,738 - - Other loans 638 638 - - 46,671 46,671 - - (i) On-balance sheet The fair value of borrowings is determined by discounting the expected future cash flows by the current interest rates for liabilities with similar risk profiles (level 3 in the fair value hierarchy). The interest rates implicit in the lease agreements varies from the current interest rates, however the impact is not significant as such the carrying value is assumed to approximate their fair value.
23 Non-current liabilities - Deferred tax liabilities
2019 $'000
2018 $'000
The balance comprises temporary differences attributable to: Inventories 3,151 2,417 Rehabilitation asset 1,304 - Accrued income - 2 Exploration and evaluation, development expenditure and mine properties 17,843 15,274 Financial assets 46 - Asset classified held for sale - 2,273 22,344 19,966 Set-off of deferred tax liabilities pursuant to set-off provisions (note 15) (22,344) (19,966) Net deferred tax liabilities - -
For
per
sona
l use
onl
y

PAGE 106 | 2019 ANNUAL REPORT
Notes to the consolidated financial statements 30 June 2019 24 Non-current liabilities - Provisions
2019 $'000
2018 $'000
Employee benefits - long service leave 14 12 Rehabilitation 31,534 26,810 31,548 26,822 A provision for rehabilitation is recognised in relation to the mining activities for costs such as reclamation, waste site closure, plant closure and other costs associated with the rehabilitation of a mining site. Estimates of the rehabilitation are based on the anticipated technology and legal requirements and future costs, which have been discounted to their present value. In determining the restoration provision, the entity has assumed no significant changes will occur in the relevant Federal and State legislations in relation to rehabilitation of such mines in the future. Refer to note1(f)(vi) for inputs used in determining the provision for rehabilitation.
(a) Movements in provisions Movements in each class of provision during the financial year, other than employee benefits, are set out below: Year ended 30 June 2019
Rehabilitation $'000
Carrying amount at start of year 26,810 - unwinding of discount 359 - additional provision charged 4,365 Carrying amount at end of year 31,534 Year ended 30 June 2018
Rehabilitation $'000
Carrying amount at start of year 29,715 - unwinding of discount 921 - reclass to liabilities directly associated to assets held for sale (3,226) - reversal of unutilised provisions (600) Carrying amount at end of year 26,810 25 Contributed equity (a) Share capital
2019
Shares 2018
Shares 2019 $'000
2018 $'000
Ordinary shares Ordinary shares - fully paid 553,582,471 491,592,889 210,109 188,860 (b) Movements in ordinary share capital
Date Details
Number of shares
Issue price $'000
1 July 2017 Opening balance 428,567,271 169,044 1 August 2017 Performance rights issue 1,575,012 - 1 March 2018 Share Issue 61,450,606 $0.34 20,893 Transaction costs, net of tax - (1,077) 30 June 2018 Balance 491,592,889 188,860
1 July 2018 Opening balance 491,592,889 188,860 13 August 2018 Performance rights issue 2,935,093 - 18 March 2019 Share Issue 13,157,895 $0.38 5,000 17 April 2019 Share Issue 39,054,489 $0.38 14,841 19 June 2019 Shares Issue 6,842,105 $0.38 2,600 Transaction costs, net of tax - (1,192) 30 June 2019 Balance 553,582,471 210,109
For
per
sona
l use
onl
y

2019 ANNUAL REPORT | PAGE 107
Notes to the consolidated financial statements 30 June 2019
(c) Ordinary shares Ordinary shares entitle the holder to participate in dividends and the proceeds on winding up of the Company in proportion to the number of and amounts paid on the shares held. Ordinary shares entitle their holder to one vote, either in person or by proxy, at a meeting of the Company.
(d) Capital management When managing capital, management's objective is to ensure the entity continues as a going concern as well as to maintain optimal returns to shareholders and benefits for other stakeholders. Management also aims to maintain a capital structure that ensures the lowest cost of capital available to the entity. Management are constantly adjusting the capital structure to take advantage of favourable costs of capital or high returns on assets. As the market is constantly changing, management may change the amount of dividends to be paid to shareholders, return capital to shareholders, issue new shares or sell assets to reduce debt. Management monitor capital through the gearing ratio (total borrowings / contributed equity). The debt to equity ratio (borrowings on equity interest in shareholders’ equity) at 30 June 2019 was 22.20% (2018: nil). The Group has put in place a Group Cash Management Policy to ensure that up to 180 days (2018: 180 days) excess cash holdings are invested with a range of institutions that have sufficient financial strength to ensure the security of the investment. (Refer to note 39 Financial risk management) The Group is not subject to any externally imposed capital requirements. Management consider that the total equity of the Group (contributed equity, reserves and retained earnings) plus borrowings (current and non-current) is what it manages as capital. At 30 June 2019 this was $162.757 million (2018: $85.920 million).
26 Reserves (a) Reserves
2019 $'000
2018 $'000
Mineral properties revaluation reserve - 19,845 Available-for-sale financial assets - 2,274 Cash flow hedge reserve (276) - Share-based payments 21,716 21,716 Foreign currency translation - 1,200 Other reserves (446) (446) 20,994 44,589 (b) Nature and purpose of reserves
(i) Mineral properties revaluation reserve In 2009, the Company increased the Group's interest in the Lanfranchi Project from 75% to 100%. This required a revaluation of the original interest in the project when acquired in 2004 under the accounting standards applicable at the time. The asset revaluation reserve resulted from the increase in the fair value of the original interest. On 6 December 2018, the sale of Lanfranchi Nickel Project was completed. For further details of the sale, refer to note 10. The asset revaluation reserve was transferred to retained earnings on disposal of the asset.
(ii) Available-for-sale investments revaluation reserve This reserve comprises the cumulative net change in the fair value of available for sale financial assets until the investment was derecognised or impaired. The Group has adopted AASB 9 as issued in July 2014 with the date of initial application being 1 July 2018. In accordance with the transitional provisions in AASB 9, comparative figures have not been restated. The Company has classified equity instruments at fair value through profit or loss from its previously category of available for sale investments which resulted in the cumulative fair value gains recorded in the available for sale financial assets reserve to retained earnings on 1 July 2018.
For
per
sona
l use
onl
y

PAGE 108 | 2019 ANNUAL REPORT
Notes to the consolidated financial statements 30 June 2019
(iii) Share-based payments reserve The share based payments reserve is used to record the value of share based payments provided to employees as part of their remuneration. The reserve is also used to record share based payments provided to third parties as part of the acquisition of an entity or asset.
(iv) Foreign currency translation The foreign currency translation reserve is used to record exchange differences arising from the translation of the financial statements of foreign subsidiaries.
27 Dividends
(a) Ordinary shares No final dividend was paid for the year ended 30 June 2019 (30 June 2018: Nil).
(b) Dividends not recognised at the end of the reporting period
No dividend has been declared since the end of the reporting period.
(c) Franking credits Consolidated entity
2019 $'000
2018 $'000
Franking credits available for subsequent reporting periods 10,503 10,503 The tax rate at which paid dividends have been franked is 30% (2018: 30%).
28 Remuneration of auditors
2019
$ 2018
$ Amounts received or due and receivable by Ernst & Young for: Audit and review of financial statements 166,500 99,000 - - Other services in relation to the Company and other entity of the consolidated entity: Tax compliance and other services 102,313 95,493 268,813 194,493 29 Guarantees and contingencies
(a) Guarantees At 30 June 2019, the Company had bank guarantees with a financial institution with a face value of $0.181 million (2018: $0.709 million) in respect to the leasing of the office space in the Perth CBD. Controlled entities Under the terms of Deeds of Cross Guarantee with several financial institutions, the Company has agreed to become a covenantor with Savannah Nickel Mines Pty Ltd in regards to indebtedness and liabilities resulting from the lease and hire purchase of mobile equipment and mine buildings. As at reporting date, the Closed Group has lease liabilities amounting to $6.738 million (2018: nil). The Company has guaranteed the bank facilities of controlled entities.
(b) Contingent assets There Group had no contingent assets at 30 June 2019.
(c) Contingent liabilities There Group had no contingent liabilities at 30 June 2019.
For
per
sona
l use
onl
y

2019 ANNUAL REPORT | PAGE 109
Notes to the consolidated financial statements 30 June 2019
30 Commitments
(a) Capital commitments Capital expenditure contracted for at the reporting date but not recognised as liabilities is as follows:
2019 $'000
2018 $'000
Mineral tenements expenditure commitments Not later than one year 2,130 3,608 Later than one year but not later than five years 4,975 13,614 Later than five years 13,434 35,109 20,539 52,331 (b) Lease commitments: group as lessee
(i) Finance leases Future minimum lease payments under finance leases together with the present value of the net minimum lease payments are as follows:
2019 $'000
2018 $'000
Commitments in relation to finance leases are payable as follows: Within one year 2,060 - Later than one year but not later than five years 5,486 - 7,546 - Less future finance lease charges (808) - Present value of minimum lease payments 6,738 - Representing lease liabilities: Current (note 20) 1,685 - Non-current (note 22) 5,053 - 6,738 - (c) Operating lease commitments as lessee
2019 $'000
2018 $'000
Within one year 2,678 825 Later than one year and not later than five years 6,152 1,024 Later than five years 3,305 - 12,135 1,849 (d) Operating lease commitments as lessor
2019 $'000
2018 $'000
Commitments for minimum lease receipts in relation to non-cancellable operating leases are as follows: Within one year - 210 (e) Remuneration commitments
2019 $'000
2018 $'000
Commitments for the payment of salaries and other remuneration under long-term employment contracts in existence at the reporting date but not recognised as liabilities, payable: Within one year 903 694
For
per
sona
l use
onl
y

PAGE 110 | 2019 ANNUAL REPORT
Notes to the consolidated financial statements 30 June 2019 31 Related party transactions (a) Compensation of key management personnel of the Group Key management personnel of the Group include the following: B M Phillips Chairman (Non-Executive) P J Harold Managing Director J Rowe Director (Non-Executive) (until 30 June 2019) P R Sullivan Director (Non-Executive) N L Cernotta Director (Non-Executive) R J Hayward Director (non-Executive) T R Eton Chief Financial Officer and Company Secretary B W Timler Chief Operating Officer (from 3 April 2019) B P Robinson General Manager - Operations (from 13 September until 14 August 2019) J D Hicks General Manager - Exploration T S Mason General Manager - Projects R G Lampard General Manager - Human Resources (from 1 October 2018) The aggregate compensation made to directors and other members of key management personnel of the Group is set out below:
2019 $'000
2018 $'000
Short-term employee benefits 2,384 1,491 Post-employment benefits 171 112 Long-term benefits 33 29 Share-based payments - 211 2,588 1,843 The amounts disclosed in the table are the amounts recognised as an expense during the reporting period related to key management personnel.
32 Subsidiaries and transactions with non-controlling interests (a) Significant investments in subsidiaries The consolidated financial statements incorporate the assets, liabilities and results of the following principal subsidiaries in accordance with the accounting policy described in note 1(g):
Name of entity Country of
incorporation Class of shares Equity holding
2019
% 2018
% Cherish Metals Pty Ltd * Australia Ordinary - 100 Pindan Exploration Company Pty Ltd Australia Ordinary 100 100 SMY Copernicus Pty Ltd** Australia Ordinary - 100 Copernicus Nickel Mine Pty Ltd** Australia Ordinary - 100 Lanfranchi Nickel Mine Pty Ltd * Australia Ordinary - 100 Panton Sill Pty Ltd (formerly Panoramic Precious Metals Pty Ltd) Australia Ordinary 100 100 Mt Henry Gold Pty Ltd Australia Ordinary 100 100 Mt Henry Mines Pty Ltd Australia Ordinary 100 100 Magma Metals Pty Limited Australia Ordinary 100 100 Panoramic PGM's (Canada) Ltd (formerly Magma Metals (Canada) Ltd) Canada Ordinary 100 100 Horizon Gold Limited Australia Ordinary 51 51 Panoramic Gold Pty Ltd Australia Ordinary 51 51 Pan Transport Pty Ltd *** Australia Ordinary 100 -
* On 6 December 2018, the Company sold its shareholding in 100% owned Cherish Metals Pty Ltd, the 100% owner of the Lanfranchi Nickel Mines Pty Ltd (Lanfranchi Nickel Project), to a wholly owned subsidiary of Texas-based Black Mountain Metals LLC. For further information, see note 10.
** Deregistered on 22 July 2018. *** Registered on 23 July 2018.
Refer to note 33 for details on deed of cross guarantee signed between Savannah Nickel Mines Pty Ltd and Panoramic Resources Limited.
For
per
sona
l use
onl
y

2019 ANNUAL REPORT | PAGE 111
Notes to the consolidated financial statements 30 June 2019 (b) Non-controlling interests (NCI) In December 2016, the Company divested an interest in Horizon Gold Limited (“Horizon”) by way of an initial public offering (IPO) and listing of the subsidiary, on the Australian Securities Exchange (ASX). In the IPO, Horizon raised $15,000,000 before costs in new equity and issued 37,500,000 shares at $0.40 per share. Following completion of the capital raising by Horizon, the Company's interest in Horizon was diluted from 100% to 51%. The shares in Horizon held by the Company were held in escrow until 18 December 2018. In the IPO, Horizon raised $15,000,000 before costs in new equity and issued 37,500,000 shares at $0.40 per share. Following completion of the capital raising by Horizon, the Company's interest in Horizon was diluted from 100% to 51%. The shares in Horizon held by the Company were held in escrow until 18 December 2018. The financial information of Horizon in which material non-control interest now exist is provided below:
Summarised statement of financial position for the period: 30 June
2019 $000
30 June 2018 $000
Cash and bank balances (current) 1,879 7,160 Trade and other receivables 19 21 Intercompany payables (current) (90) (27) Prepayments (current) 28 15 Trade and other payables (current) (286) (545) Provisions (current) (47) (50) Current net assets 1,503 6,574 Property, plant and equipment (non-current) 4,299 4,296 Exploration and evaluation (non-current) 15,912 12,741 Provisions (non-current) (10,173) (9,842) Non-current net assets 10,038 7,195 Net assets 11,541 13,769 Accumulated balances of non-controlling interest (NCI) 5,642 6,740 Summarised statement of profit and loss for the period: 30 June
2019 $000
30 June 2018 $000
Other income 105 224 Care and maintenance expenses (760) (774) Corporate and administration (542) (563) Impairment loss - (12,569) Exploration expenditure written-off (901) (619) Finance costs (129) (463) Profit before tax (2,227) (14,764) Total comprehensive income (2,227) (14,764) < blank header row > Profit/(loss) allocated to NCI (1,091) (7,236) < blank header row > Summarised cashflow information for the period: 30 June
2019 $000
30 June 2018 $000
Cash flows from operating activities (1,558) (1,354) Cash flows from investing activities (3,782) (3,102) Cash flows from financing activities 59 (89) Net decreases in cash and cash equivalents (5,281) (4,545) F
or p
erso
nal u
se o
nly

PAGE 112 | 2019 ANNUAL REPORT
Notes to the consolidated financial statements 30 June 2019
33 Deed of cross guarantee
Pursuant to ASIC Corporations (wholly-owned companies) Instrument 2016/785, relief has been granted to Savannah Nickel Mines Pty Ltd and Cherish Metals Pty Ltd from the Corporations Act 2001 requirements for preparation, audit and lodgement of its financial report. As a condition of the ASIC Corporations (wholly-owned companies) Instrument 2016/785, Panoramic Resources Limited and Savannah Nickel Mines Pty Ltd (the "Closed Group"), entered into a Deed of Cross Guarantee on 29 June 2005. The effect of the deed is that Panoramic Resources Limited has guaranteed to pay any deficiency in the event of winding up of its controlled entity or if it does not meet its obligation under the terms of overdrafts, loans, leases or other liabilities subject to the guarantee. The controlled entity has also given a similar guarantee in the event that Panoramic Resources Limited is wound up or it does not meet its obligation under the terms of overdrafts, loans, leases or other liabilities subject to the guarantee. On 23 June 2009, Cherish Metals Pty Ltd and Donegal Resources Pty Ltd (now deregistered) joined as parties to the Deed of Cross Guarantee. On 6 December 2018, the Company sold Cherish Metals Pty Ltd, to a wholly owned subsidiary of Texas-based Black Mountain Metals LLC (“Black Mountain”). As at reporting date, the "Closed Group" comprised of Panoramic Resources Limited and Savannah Nickel Mines Pty Ltd.
(a) Consolidated income statement and summary of movements in consolidated retained earnings Set out below is a consolidated income statement and a summary of movements in consolidated retained earnings for the year ended 30 June 2019 of the Closed Group (consisting of Panoramic Resources Limited and Savannah Nickel Mines Pty Ltd).
2019 2018 $'000 $'000 Profit (loss) before income tax includes the following specific items: Revenue 25,112 1,070 Fair value losses on derivatives (2,071) - Change in fair value of financial assets at fair value through profit or loss (1,716) - Finance cost (1,383) (459) Impairment loss reversal 19,156 7,260
2019 $'000
2018 $'000
Consolidated income statement Profit/(loss) before income tax 36,478 (3,849) Profit/(loss) for the year 36,478 (3,849) Consolidated statement of comprehensive income Other comprehensive income Profit/(loss) for the year 36,478 (3,849) Items that may be reclassified to profit or loss Changes in fair value of available-for-sale financial assets, net of tax (276) 1,364 Other comprehensive loss for the period, net of tax (276) 1,364 Total comprehensive income/(loss) for the year 36,202 (2,485) Accumulated losses at the beginning of the financial year (102,228) (98,379) Profit/(loss) for the year 36,478 (3,849) Accumulated losses at the end of the financial year (65,750) (102,228) F
or p
erso
nal u
se o
nly

2019 ANNUAL REPORT | PAGE 113
Notes to the consolidated financial statements 30 June 2019
(b) Consolidated balance sheet Set out below is a consolidated balance sheet as at 30 June 2019 of the Closed Group (consisting of Panoramic Resources Limited and Savannah Nickel Mines Pty Ltd).
2019 $'000
2018 $'000
Current assets Cash and cash equivalents 10,814 18,218 Derivatives financial instruments 3,742 - Trade and other receivables 20,554 631 Inventories 8,415 184 Disposal group held for sale 4,299 17,002 Total current assets 47,824 36,035 Non-current assets Receivables 69,454 66,713 Available-for-sale investments - 2,621 Property, plant and equipment 53,722 6,260 Deferred exploration and evaluation expenditure 5,259 22,500 Development and mine properties 84,082 17,248 Derivative financial instruments 4,409 - Financial assets at fair value through profit and loss 957 - Other non-current asset 181 1,303 Total non-current assets 218,064 116,645 Total assets 265,888 152,680 Current liabilities Trade and other payables 21,693 3,176 Interest-bearing loans and borrowings 8,082 - Derivative financial instruments 2,721 - Provisions 2,080 829 Liabilities directly associated to disposal group classified as held for sale - 3,502 Total current liabilities 34,576 7,507 Non-current liabilities Interest-bearing loans and borrowings 38,553 - Provisions 21,375 16,979 Derivative financial instruments 5,584 - Total non-current liabilities 65,512 16,979 Total liabilities 100,088 24,486 Net assets 165,800 128,194 Equity Contributed equity 210,110 188,861 Reserves 21,440 41,561 Retained earnings (65,750) (102,228) Total equity 165,800 128,194
For
per
sona
l use
onl
y
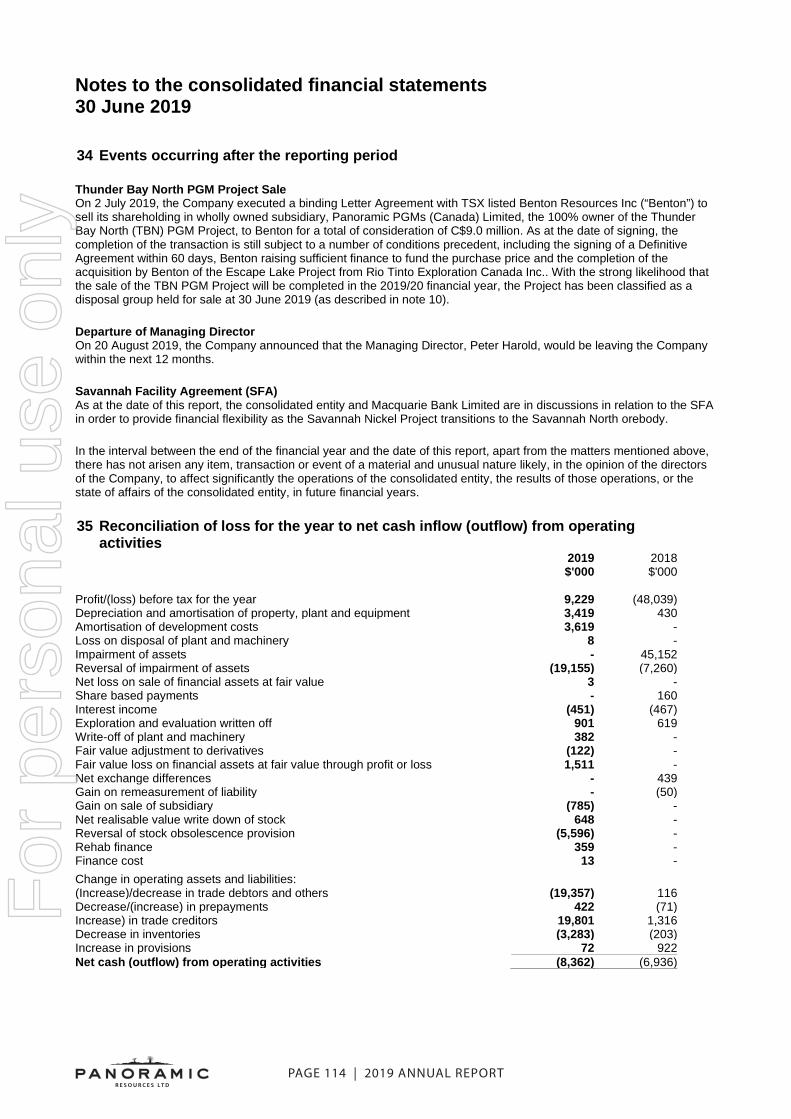
PAGE 114 | 2019 ANNUAL REPORT
Notes to the consolidated financial statements 30 June 2019
34 Events occurring after the reporting period
Thunder Bay North PGM Project Sale On 2 July 2019, the Company executed a binding Letter Agreement with TSX listed Benton Resources Inc (“Benton”) to sell its shareholding in wholly owned subsidiary, Panoramic PGMs (Canada) Limited, the 100% owner of the Thunder Bay North (TBN) PGM Project, to Benton for a total of consideration of C$9.0 million. As at the date of signing, the completion of the transaction is still subject to a number of conditions precedent, including the signing of a Definitive Agreement within 60 days, Benton raising sufficient finance to fund the purchase price and the completion of the acquisition by Benton of the Escape Lake Project from Rio Tinto Exploration Canada Inc.. With the strong likelihood that the sale of the TBN PGM Project will be completed in the 2019/20 financial year, the Project has been classified as a disposal group held for sale at 30 June 2019 (as described in note 10). Departure of Managing Director On 20 August 2019, the Company announced that the Managing Director, Peter Harold, would be leaving the Company within the next 12 months. Savannah Facility Agreement (SFA) As at the date of this report, the consolidated entity and Macquarie Bank Limited are in discussions in relation to the SFA in order to provide financial flexibility as the Savannah Nickel Project transitions to the Savannah North orebody. In the interval between the end of the financial year and the date of this report, apart from the matters mentioned above, there has not arisen any item, transaction or event of a material and unusual nature likely, in the opinion of the directors of the Company, to affect significantly the operations of the consolidated entity, the results of those operations, or the state of affairs of the consolidated entity, in future financial years. 35 Reconciliation of loss for the year to net cash inflow (outflow) from operating
activities
2019 $'000
2018 $'000
Profit/(loss) before tax for the year 9,229 (48,039) Depreciation and amortisation of property, plant and equipment 3,419 430 Amortisation of development costs 3,619 - Loss on disposal of plant and machinery 8 - Impairment of assets - 45,152 Reversal of impairment of assets (19,155) (7,260) Net loss on sale of financial assets at fair value 3 - Share based payments - 160 Interest income (451) (467) Exploration and evaluation written off 901 619 Write-off of plant and machinery 382 - Fair value adjustment to derivatives (122) - Fair value loss on financial assets at fair value through profit or loss 1,511 - Net exchange differences - 439 Gain on remeasurement of liability - (50) Gain on sale of subsidiary (785) - Net realisable value write down of stock 648 - Reversal of stock obsolescence provision (5,596) - Rehab finance 359 - Finance cost 13 - Change in operating assets and liabilities: (Increase)/decrease in trade debtors and others (19,357) 116 Decrease/(increase) in prepayments 422 (71) Increase) in trade creditors 19,801 1,316 Decrease in inventories (3,283) (203) Increase in provisions 72 922 Net cash (outflow) from operating activities (8,362) (6,936)
For
per
sona
l use
onl
y

2019 ANNUAL REPORT | PAGE 115
Notes to the consolidated financial statements 30 June 2019
36 Earnings (loss) per share
(a) Basic earnings (loss) per share
2019
Cents 2018
Cents From continuing operations attributable to the ordinary equity holders of the Company 2.0 (9.1) Total basic earnings (loss) per share attributable to the ordinary equity holders of the Company 2.0 (9.1)
(b) Diluted earnings (loss) per share
2019
Cents 2018
Cents From continuing operations attributable to the ordinary equity holders of the Company 2.0 (9.1) Total diluted earnings (loss) per share attributable to the ordinary equity holders of the Company 2.0 (9.1) (c) Reconciliation of profit (loss) used in calculating earnings (loss) per share
2019 $'000
2018 $'000
Basic earnings (loss) per share Profit (loss) from continuing operations 10,327 (40,803) Earnings (loss) attributable to the ordinary equity holders of the Company used in calculating basic earnings (loss) per share 10,327 (40,803)
Diluted earnings (loss) per share Profit (loss) from continuing operations 10,327 (40,803) Earnings (loss) attributable to the ordinary equity holders of the Company used in calculating diluted earnings (loss) per share 10,327 (40,803) (d) Weighted average number of shares used as denominator
2019
Number 2018
Number Weighted average number of ordinary shares used as the denominator in calculating basic and diluted loss per share 506,087,068 450,435,409 Performance rights on issue are not considered in the calculation of diluted loss per share as they are considered to be contingently issuable. There are nil performance rights on issue at 30 June 2019 (2018: 2,935,093). At the date of this report, no performance rights were granted.
37 Share-based payments
(a) Performance Rights Employee Share Plan (ESP) On 30 July 2014, the Company’s shareholders approved a three-year exemption to ASX Listing Rule 7.1 [Issues exceeding 15% of Capital] on the annual grant of performance rights and the issue of shares on the exercise of those performance rights under the 2010 Panoramic Resources Limited Employee Share Plan (“2010 ES Plan”). From 1 July 2014 until the expiry of the three-year exemption on 30 July 2017, executives and senior employees were invited to receive a new grant of performance rights under the 2010 ES Plan. The number of performance rights granted each year was determined by dividing the LTI dollar by the fair value (FV) of one performance right on 1 July (as determined by an independent valuer).
For
per
sona
l use
onl
y

PAGE 116 | 2019 ANNUAL REPORT
Notes to the consolidated financial statements 30 June 2019
Each grant of performance rights will vest subject to meeting service and performance conditions as defined below: - 75% of the performance rights will be performance tested against the relative total shareholder return (TSR) of a customised peer group over a 3 year period; and - 25% of the performance rights will be performance tested against the reserve/resource growth over a 3 year period, net of depletion. For FY2019, no performance rights were granted to key management personnel (KMP) and executives.
Grant date
Vesting date
Expiry date
Balance at start of the
year
Granted during
the year
Exercised during the
year
Expired during the
year
Forfeited during the
year
Balance at the end of the year
Vested and exercisable
at end of the year
Number Number Number Number Number Number Number
Consolidated 2019 27/11/15 30/06/18 01/07/18 2,935,093 - (2,935,093) - - - - 12/09/14 30/06/17 01/07/17 - - - - - - - 01/07/14 30/06/17 01/07/17 - - - - - - - Total 2,935,093 - (2,935,093) - - - - Weighted average exercise price
$- $- $0.62 $- $- $- $-
For FY2018, no performance rights were granted to key management personnel (KMP) and executives.
Grant date
Vesting date
Expiry date
Balance at start of the
year
Granted during
the year
Exercised during
the year
Expired during the
year
Forfeited during the
year
Balance at the end of the year
Vested and exercisable at end of the
year
Number Number Number Number Number Number Number Consolidated 2018 27/11/15 30/06/18 01/07/18 3,527,341 - - - (592,248) 2,935,093 12/09/14 30/06/17 01/07/17 1,195,428 - (896,566) - (298,862) - - 01/07/14 30/06/17 01/07/17 904,601 - (678,446) - (226,135) - -
Total 5,627,370 - (1,575,01
2) - (1,117,245) 2,935,093 - Weighted average exercise price
$- $- $- $- $- $- $-
The weighted average remaining contractual life of performance rights outstanding at the end of the period was nil (2018: nil).
(b) Expenses arising from share-based payment transactions The cost of equity-settled transactions is recognised, together with the corresponding increase in reserve, over the period in which performance conditions are fulfilled, ending on the date on which the relevant employees become fully entitled to the performance right (‘vesting date’). The cumulative expense recognised for equity settled transactions at each reporting date until vesting date reflects: (i) the extent to which the vesting period has expired; and (ii) the number of performance rights that, in opinion of the directors of the consolidated entity, will ultimately vest. This opinion is formed based on the best available information at balance date. No adjustment is made for the likelihood of market performance conditions being met as the effect of these conditions is included in the determination of fair value at grant date.
For
per
sona
l use
onl
y

2019 ANNUAL REPORT | PAGE 117
Notes to the consolidated financial statements 30 June 2019 No expense is recognised for performance rights that do not ultimately vest, except for performance rights where vesting is conditional upon a market condition. The dilutive effect, if any, of outstanding performance rights is not reflected as additional share dilution in the computation of earnings per share. Total expenses arising from share based payment transactions recognised during the period as part of employee benefit expense were as follows: (i) Performance rights under employee share plan amount to nil (2018: $0.160 million).
38 Parent entity financial information
(a) Summary financial information The individual financial statements for the Parent entity show the following aggregate amounts:
2019 $'000
2018 $'000
Balance sheet Current assets 9,697 18,980 Non-current assets 28,485 8,763 Total assets 38,182 27,743 Current liabilities 1,567 1,250 Non-current liabilities 8 10 Total liabilities 1,575 1,260 (112,971) (81,969) Shareholders' equity Contributed equity 210,109 188,860 Reserves 12,934 12,154 Retained earnings (186,436) (174,532) Capital and reserves attributable to owners of Panoramic Resources Limited 36,607 26,482 Loss for the year 32,547 8,268 Total comprehensive income 32,547 8,268 (b) Guarantees entered into by the parent entity The parent entity has given financial guarantees in respect of: (i) leases of subsidiaries amounting to 6.738 million (2018: nil); (ii) the bank facilities of a subsidiary amounting to $40.04 million (2018: $0.250 million); and (iii) a rehabilitation bank guarantee of a subsidiary amounting to nil (Lanfranchi Project now sold) (2018: $2 million). No liability was recognised by the parent entity or the consolidated entity in relation to these guarantees, as the fair value of the guarantees was immaterial. There are cross guarantees given by Panoramic Resources Limited and Savannah Nickel Mines Pty Ltd as described in note 33. No deficiencies of assets exist in any of these companies. No liability was recognised by the parent entity or the Group in relation to the cross guarantees.
(c) Contingent liabilities of the parent entity The parent entity and Group had contingent liabilities at 30 June 2019 in respect of a bank guarantee put in place with a financial institution with a face value of $0.181 million (2018: $0.709 million) in respect to the leasing of the office space in Perth CBD.
39 Financial risk management The Group’s principal financial instruments comprise receivables, payables, finance leases, borrowings, hire purchase contracts, cash and derivatives. The Group manages its exposure to key financial risks, including interest rate and currency risk in accordance with the Group’s financial risk management policy. The objective of the policy is to support the delivery of the Group’s financial targets whilst protecting future financial security.
For
per
sona
l use
onl
y

PAGE 118 | 2019 ANNUAL REPORT
Notes to the consolidated financial statements 30 June 2019 To manage exposure to commodity prices and exchange rates the Group used derivative instruments, principally forward sales contracts and put and call options. The purpose was to manage the commodity price and currency rate risks arising from the Group’s operations. These derivatives provided economic hedges and qualified for hedge accounting and are based on limits set by the Board. The main risks arising from the Group's financial instruments are foreign currency risk, interest rate risk, commodity price risk, credit risk and liquidity risk. The Group uses different methods to measure and manage different types of risks to which it is exposed. These include monitoring levels of exposure to commodity prices, interest rate and foreign currency exchange risk and assessments of market forecasts for commodity prices and foreign exchange. Ageing analyses and monitoring of specific credit allowances are undertaken to manage credit risk. Liquidity risk is monitored through the development of future rolling cash flow forecasts. The Board reviews and agrees policies for managing each of these risks as summarised below. Primary responsibility for the identification and control of financial risks rests with the Audit Committee under the authority of the Board. The Board reviews and agrees policies for managing each of the risks identified below, including the setting of limits for hedging cover of commodity prices, foreign currency and interest rate risk, credit allowances and future cash flow forecast projections.
(a) Foreign currency exchange rate risk The Group has transactional currency exposures. Such exposure arises from sales or purchases in a currency other than the entity’s functional currency. A 100% of the Group’s sales were denominated in United States Dollars, whilst most of the costs are denominated in Australian Dollars. The Group’s functional currency is Australian Dollars. The Group’s profit and loss and balance sheet can be affected significantly by movements in the AUD/USD exchange rate. The Group seeks to mitigate the effect of its net foreign currency exposure by using derivative instruments, principally forward foreign currency exchange rate contracts and put and call options. It is the Group’s policy to enter into derivative instruments to hedge foreign currency exposure once the likelihood of such exposure is highly probable and to negotiate the terms of the hedge derivatives to exactly match the terms of the hedged item to maximise hedge effectiveness. The Group will follow its current policy of matching and hedging up to 80% of sales revenues in USD. As 30 June 2019, the Group had the following exposure to USD foreign currency.
2019 2018
$'000 $'000
Cash at bank - 15 Restricted deposit 8,054 - Derivatives (8,305) - Trade receivables 1,521 - Net exposure 1,270 15 Sensitivity The following sensitivity is based on the foreign currency risk exposures in existence at the balance sheet date. The +/- 2.5% (2018: +/- 5%) sensitivity is based on reasonably possible changes, over a financial year, using an observed range of actual historical rates, for the Australian dollar to the US dollar, for the preceding 5 years and management's expectation of future movements.
At 30 June 2019, had the US dollar moved, as illustrated in the table below, with all other variables held constant, post tax profit and equity would have been affected as follows: Judgements of reasonably possible movements Impact on post-tax profit Impact on other equity 2019 2018 2019 2018 $'000 $'000 $'000 $'000
AUD to USD +2.5% (2018: +5%) (163) (1) 4,325 - AUD to USD -2.5% (2018: -5%) 172 1 (4,547) -
For
per
sona
l use
onl
y

2019 ANNUAL REPORT | PAGE 119
Notes to the consolidated financial statements 30 June 2019 Management believes the balance sheet date risk exposures are representative of the risk inherent in the financial instruments.
(b) Interest rate risk The Group has put in place a Cash Management Policy to ensure that up to 180 days (2018: 180 days) excess cash holdings are invested with a range of institutions that have sufficient financial strength to ensure the security of the investments. The Group policy is to reduce and manage cash flow interest rate risk by ensuing a timely reduction in debt obligations through scheduled debt repayments and non-scheduled debt repayments when excess cash is available.
2019 2018
Weighted average
interest rate %
Balance
$'000
Weighted average
interest rate %
Balance
$'000 Deposits at call 1.7% 5,449 2.5% 22,825 Borrowings 5.4% 39,259 -% - Cash restricted or pledged 1.8% 15,615 -% - 60,323 22,825 The following sensitivity is based on the interest rate risk exposures in existence at the balance sheet date. The sensitivity used is +/- 25 basis points (2018: +/- 25) which is based on reasonably, possible changes, over a financial year, using the observed range of actual historical Australian short term deposit rate movements over the last 3 years and management's expectation of future movements. Sensitivity
Interest rate risk -0.25% +0.25%
At 30 June 2019
Carrying amount
$'000
Impact on post tax
profit $'000
Impact on
equity $'000
Impact on post tax
profit $'000
Impact on
equity $'000
Financial assets Cash and cash equivalents 12,733 (1) - 1 - Trade and other receivables 19,278 (2) - 2 - Financial liabilities Borrowings 39,259 (12) - 12 - Total increase/ (decrease) (15) - 15 - Interest rate risk -0.25% +0.25% At 30 June 2018
Carrying amount
$'000
Impact on post tax
profit $'000
Impact on
equity $'000
Impact on post tax
profit $'000
Impact on
equity $'000
Financial assets Cash and cash equivalents 23,983 (15) - 15 - Total increase/ (decrease) (15) - 15 - (c) Fair value measurements The fair value of financial assets and financial liabilities must be estimated for recognition and measurement or for disclosure purposes. F
or p
erso
nal u
se o
nly

PAGE 120 | 2019 ANNUAL REPORT
Notes to the consolidated financial statements 30 June 2019 Disclosure of fair value measurements is by level of the following fair value measurement hierarchy:
(a) quoted prices (unadjusted) in active markets for identical assets or liabilities (level 1) (b) valuation techniques for which the lowest level input that is significant to the fair value measurement is
directly or indirectly observable, and (c) valuation techniques for which the lowest level input that is significant to the fair value measurement is
unobservable. The following table presents the fair value measurement hierarchy of the Group's assets and liabilities at 30 June 2019 and 30 June 2018: At 30 June 2019 Level 1
$'000 Level 2
$'000 Level 3
$'000 Total $'000
Assets Financial assets at fair value through profit or loss: - Derivative instruments - 8,151 - 8,151 - Equity securities 957 - - 957 - Trade receivables - 1,521 - 1,521 Financial assets measured at fair value: - Disposal group classified as held for sale - - 4,299 4,299 Total assets 957 9,672 4,299 14,928 Liabilities Financial liabilities at fair value through profit or loss: - Derivative instruments - 8,305 - 8,305 Financial liabilities for which fair values are disclosed: Lease liabilities - - 6,738 6,738 Total liabilities - 8,305 6,738 15,043
At 30 June 2018 Level 1
$'000 Level 2
$'000 Level 3
$'000 Total $'000
Assets Equity securities 2,703 - - 2,703 Total assets 2,703 - - 2,703 Equity securities are traded in active markets. Their fair value is based on quoted market prices at the end of the reporting period. These instruments are included in level 1. The fair values of trade receivables classified as financial assets at fair value through profit and loss are determined using market observable inputs sourced from the LME pricing index. These instruments are included in level 2. The fair value of derivative financial instruments that are not traded in an active market (for example, over-the-counter derivatives) is determined using valuation techniques. The Company uses a variety of methods and makes assumptions that are based on market conditions existing at the end of each reporting period. These techniques include comparing contracted rates to market rates with the same length of maturity to determine the value of forward contracts and use of option pricing models to value put options. These instruments are included in level 2. In the circumstances where a valuation technique for these instruments is based on significant unobservable inputs, such instruments are included in level 3. The fair value of finance lease is estimated by discounting future cashflows using rates currently available to debt on similar terms, credit risk and remaining maturities. These instruments are included in level 3.
(d) Commodity Price Risk The Group's exposure to nickel prices is very high as approximately 80-85% of total revenue comes from sale of nickel. Nickel is sold on the basis of nickel prices quoted on the London Metal Exchange (LME). The Group's profit and loss account and balance sheet can be affected significantly by movements in nickel prices on the LME. The Group seeks to mitigate the effect of its nickel prices exposure by using derivative instruments, principally forward sales contracts and put and call options. The limits of hedging are set by the Board.
For
per
sona
l use
onl
y

2019 ANNUAL REPORT | PAGE 121
Notes to the consolidated financial statements 30 June 2019 The following table summarises the sensitivity of the Group's financial assets and financial liabilities to commodity price risk. In 2019, the +/- 30% sensitivity is based on reasonably possible changes, over a financial year, using the observed range of actual historical prices for the preceding 5 year period and management's expectation of future movements. In 2018, the Group has no financial assets and financial liabilities that have exposure to commodity risk. Commodity price risk -30% +30%
At 30 June 2019 Gross
exposure
$'000
Impact on post tax
profit $'000
Impact on other
equity $'000
Impact on post tax
profit $'000
Impact on other
equity $'000
Financial assets Trade receivables at fair value 1,521 (1,292) - 1,373 - Derivatives - cash flow hedges 8,029 - (35,938) - 31,383 Total increase/ (decrease) (1,292) (35,938) 1,373 31,383
(e) Credit risk Credit risk arises from the financial assets of the Group, which comprise cash and cash equivalents, trade and other receivables and derivative instruments. The Group’s maximum exposures to credit risk at reporting date in relation to each class of recognised financial assets, other than derivatives, is the carrying amount of these assets as indicated in the balance sheet. In relation to derivative financial instruments, credit risk arose from the potential failure of counterparties to meet their obligations under the contract or arrangement. The Group‘s maximum credit risk exposure in relation to net settled derivatives is the total mark to market gain, should counterparts not honour their obligations. In case of gross-settled derivatives, the maximum exposure is the notional value. Gross-settled derivatives were held with financial institutions with sound credit rating. The Group has a concentration of credit risk in that it depends on one major customer for a significant volume of revenue. Under the Group's risk management framework, each customer is analysed individually for creditworthiness on an ongoing basis in order to minimise the risk of default. The Group believes that its customer is of sound creditworthiness as evidenced by the compliance with the off-take agreement's payment terms over the life of each project. Refer to notes 7 and 8 for disclosures in relation to expected credit losses on financial assets carried at amortised cost.
(f) Equity price risk The Group is exposed to equity securities price risk. This arises from investments held by the Group and classified on the balance sheet as available-for-sale. The fair value of these investments are based on quoted market prices. The Group holds investments of shares in several listed entities who are joint venture partners or potential joint venture partners. The Board has not reacted to short-term price fluctuations as it has a medium to long term view on these investments. These investments represent less than 1% (2018: 1%) of total assets and have yet to generate any revenue. The following sensitivity is based on the equity price risk exposures in existence at the balance sheet date. The sensitivity used is +/- 65% (2018: 100%) which is based on reasonably, possible changes, over a financial year, based on the share price fluctuations of the last 12 months and management's expectation of future movements. F
or p
erso
nal u
se o
nly

PAGE 122 | 2019 ANNUAL REPORT
Notes to the consolidated financial statements 30 June 2019
Sensitivity
Impact on post-tax profit Impact on equity
2019 $'000
2018 $'000
2019 $'000
2018 $'000
Available-for-sale financial investment +100% - - - 2,744 Financial assets at fair value through profit or loss +65% 622 - - - Available-for-sale financial investment -100% - - - (2,744) Financial assets at fair value through profit or loss -65% (622) - - -
(g) Liquidity risk Prudent liquidity risk management implies maintaining sufficient cash and marketable securities, the availability of funding when necessary and the ability to close-out market positions. The Group’s objective is to maintain a balance between continuity of funding and flexibility through the use of bank loans (when required), finance leases and committed available credit lines. The Group monitors on a regular basis rolling forecasts of liquidity on the basis of expected cash flow. The Group has put in place a Group Cash Management Policy to ensure that up to 180 days (2018: 180 days) excess cash holdings are invested with a range of institutions that have sufficient financial strength to ensure the security of the investment. This policy is reviewed and approved by the Board on a regular basis. When bank loans are used the Group’s policy is to reduce and manage cash flow interest rate risk by ensuing a timely reduction in debt obligations through scheduled debt repayments and non scheduled debt repayments when excess cash is available.
Maturities of financial liabilities The tables below analyse the Group’s financial liabilities, net and gross settled derivative financial instruments into relevant maturity groupings based on the remaining period at the reporting date to the contractual maturity date. The amounts disclosed in the table are the contractual undiscounted cash flows.
Contractual maturities of financial liabilities Less than 1 year
Between 1 and 5 years
Total contrac-
tual cash
flows
Carrying amount
(assets)/ liabilities
At 30 June 2019 $'000 $'000 $'000 $'000
Non-derivatives Trade payables 22,094 - 22,094 22,094 Borrowings 8,204 36,736 44,940 39,259 Finance lease liabilities 2,060 5,486 7,546 6,738 Total non-derivatives 32,358 42,222 74,580 68,091
Contractual maturities of financial liabilities Less than 1 year
Between 1 and 5
years
Total contrac-
tual cash flows
Carrying amount
(assets)/ liabilities
At 30 June 2018 $'000 $'000 $'000 $'000 Non-derivatives
Trade payables 3,764 - 3,764 3,764 Total non-derivatives 3,764 - 3,764 3,764
For
per
sona
l use
onl
y

2019 ANNUAL REPORT | PAGE 123
Appendix A New and amended accounting standards issued but not yet effective
The Group has not early adopted any other standard, interpretation or amendment that has been issued but is not yet effective. • AASB 2017-6 Amendments to Australian Accounting Standards - Prepayment Features with Negative Compensation, effective 1 January 2019
This Standard amends AASB 9 Financial Instruments to permit entities to measure at amortised cost or fair value through other comprehensive income particular financial assets that would otherwise have contractual cash flows that are solely payments of principal and interest but do not meet that condition only as a result of a prepayment feature. This is subject to meeting other conditions, such as the nature of the business model relevant to the financial asset. Otherwise, the financial assets would be measured at fair value through profit or loss. The Standard also clarifies in the Basis for Conclusion that, under AASB 9, gains and losses arising on modifications of financial liabilities that do not result in derecognition should be recognised in profit or loss The Group is in the process of evaluating the impact of the above amendment.
• AASB 16 Leases, effective 1 January 2019 AASB 16 provides a new lessee accounting model which requires a lessee to recognize assets and liabilities for all leases with a term of more than 12 months unless the underlying asset is of low value. A lessee is required to recognize a right-of-use asset representing its right to use the underlying leases asset and a lease liability representing its obligations to make lease payments. The depreciation of the right-of-use asset and interest on the lease liability will be recognised in the income statement. Transition to AASB 16 The Group plans to adopt the modified retrospective approach on transition with the initial date of application being 1 July 2019. The lease liability will be measured at the present value of future lease payments, discounted using the incremental borrowing rate for the Group at the date of transition. Using this approach, the right-of-use asset will be set to equal the lease liability. Prior period comparative financial statements are not required to be restated under this transition method. The Group has reviewed and implemented changes to its contracting process and system to ensure ongoing compliance with AASB 16. The Group has progressed with its impact assessment of AASB 16 and estimates an impact of at least $10 million, being an increase to both non-current assets (right-of-use assets) and liabilities (lease liabilities) on its consolidated statement of financial position on the initial date of application. The Group continues to assess the impact of a few other contracts on transition. The leases recognised by the Group under AASB 16 predominantly relate to mining equipment, contractor-provided equipment and office premises. Adopted of AASB 16 is expected to result in lower operating costs and higher finance and depreciation costs as the accounting profile of the lease payments changes under the new model.
• AASB 2018-1 Annual Improvements to IFRS Standards 2015-2017 Cycle, effective 1 January 2019 The amendments clarify certain requirements in: ► AASB 3 Business Combinations and AASB 11 Joint Arrangements - previously held interest in a joint operation ► AASB 112 Income Taxes - income tax consequences of payments on financial instruments classified as equity ► AASB 123 Borrowing Costs - borrowing costs eligible for capitalisation. The Group is in the process of evaluating the impact of the above amendment.
• AASB 2017-7 Amendments to Australian Accounting Standards - Long-term Interests in Associates and Joint Ventures, effective 1 January 2019
This Standard amends AASB 128 Investments in Associates and Joint Ventures to clarify that an entity is required to account for long-term interests in an associate or joint venture, which in substance form part of the net investment in the associate or joint venture but to which the equity method is not applied, using AASB 9 Financial Instruments before applying the loss allocation and impairment requirements in AASB 128. The Group is in the process of evaluating the impact of the above amendment.
• AASB Interpretation 23 Uncertainty over Income Tax Treatments, and relevant amending standards, effective 1 January 2019
For
per
sona
l use
onl
y

PAGE 124 | 2019 ANNUAL REPORT
Appendix A (continued) The Interpretation clarifies the application of the recognition and measurement criteria in AASB 112 Income Taxes when there is uncertainty over income tax treatments. The Interpretation specifically addresses the following: ► Whether an entity considers uncertain tax treatments separately ► The assumptions an entity makes about the examination of tax treatments by taxation authorities ► How an entity determines taxable profit (tax loss), tax bases, unused tax losses, unused tax credits and tax rates ► How an entity considers changes in facts and circumstances. The Group is in the process of evaluating the impact of the above amendment.
• AASB 2018-6 Amendments to Australian Accounting Standards - Definition of a Business, effective 1 January 2020 The Standard amends the definition of a business in AASB 3 Business Combinations. The amendments clarify the minimum requirements for a business, remove the assessment of whether market participants are capable of replacing missing elements, add guidance to help entities assess whether an acquired process is substantive, narrow the definitions of a business and of outputs, and introduce an optional fair value concentration test. The Group is in the process of evaluating the impact of the above amendment.
• AASB 2018-7 Amendments to Australian Accounting Standards - Definition of Material, effective 1 January 2020 This Standard amends AASB 101 Presentation of Financial Statements and AAS 108 Accounting Policies, Changes in Accounting Estimates and Errors to align the definition of ‘material’ across the standards and to clarify certain aspects of the definition. The amendments clarify that materiality will depend on the nature or magnitude of information. An entity will need to assess whether the information, either individually or in combination with other information, is material in the context of the financial statements. A misstatement of information is material if it could reasonably be expected to influence decisions made by the primary users. The Group is in the process of evaluating the impact of the above amendment.
• AASB 2014-10 Amendments to Australian Accounting Standards - Sale or Contribution of Assets between an Investor and its Associate or Joint Venture, effective 1 January 2022
The amendments clarify that a full gain or loss is recognised when a transfer to an associate or joint venture involves a business as defined in AASB 3 Business Combinations. Any gain or loss resulting from the sale or contribution of assets that does not constitute a business, however, is recognised only to the extent of unrelated investors’ interests in the associate or joint venture. • AASB 2015-10 deferred the mandatory effective date (application date) of AASB 2014-10 so that the amendments were required to be applied for annual reporting periods beginning on or after 1 January 2018 instead of 1 January 2016. AASB 2017-5 further defers the effective date of the amendments made in AASB 2014-10 to periods beginning on or after 1 January 2022. The Group is in the process of evaluating the impact of the above amendment.
For
per
sona
l use
onl
y

2019 ANNUAL REPORT | PAGE 125
Additional Shareholder Information As at 30 September 2019
Stock Exchange Listing Panoramic Resources Limited shares are listed on the Australian Securities Exchange Limited. The Company’s ASX code is PAN. Substantial Shareholders (Holding Not Less Than 5%) in accordance with notices provided to the Company as at 30 September 2019.
Name of Shareholder
Total Number of Voting Shares in Panoramic Resources Limited in which the Substantial Shareholders and its Associates Hold Relevant Interests
Percentage of Total Number of Voting Shares (%)
Zeta Resources Limited (including UIL Limited, General Provincial Life Pension Fund (L) Limited, Union Mutual Pension Fund Limited, ICM Limited and Duncan Saville)
227,203,153 34.73%
Class of Shares and Voting Rights At 30 September 2019, there were 4,045 holders of 654,235,709 fully paid Ordinary shares of the Company. The voting rights attaching to the Ordinary shares are in accordance with the Company’s Constitution being that:
a. each Shareholder entitled to vote may vote in person or by proxy, attorney or Representative;
b. on a show of hands, every person present who is a Shareholder or a proxy, attorney or Representative of a shareholder has one vote; and
c. on a poll, every person present who is a Shareholder or a proxy, attorney or Representative of a Shareholder shall, in respect of each fully-paid share held by him, or in respect of which he is appointed a proxy, attorney or Representative have one vote for the share, but in respect of partly-paid shares, shall have such number of votes as bears the proportion which the paid amount (not credited) is of the total amounts paid and payable (excluding amounts credited).
There are no voting rights attached to options or performance rights in the Company. Voting rights will be attached to the issued Ordinary shares when options and/or performance rights have been exercised. Unmarketable Shares At 30 September 2019, the number of parcels of shares with a value of less than $500 was 407. Distribution of Shareholders As at 30 September 2019
Number of Shares Held Number of Shareholders Number of Fully Paid Shares
1 - 1,000 220 74,286
1,001 - 5,000 1,329 3,874,149
5,001 - 10,000 697 5,395,055
10,001 - 100,000 1,470 49,853,097
100,001 and over 329 595,039,122
Total 4,045 654,235,709
For
per
sona
l use
onl
y

PAGE 126 | 2019 ANNUAL REPORT
Additional Shareholder Information As at 30 September 2019
Listing of 20 Largest Shareholders
Name of Ordinary Registered Shareholder Number of Shares Held
Percentage of Shares Held %
1. J P MORGAN NOMINEES AUSTRALIA PTY LIMITED 258,929,176 39.58
2. HSBC CUSTODY NOMINEES (AUSTRALIA) LIMITED 57,809,077 8.84
3. CITICORP NOMINEES PTY LIMITED 56,764,318 8.68
4. ZETA RESOURCES LIMITED 32,486,919 4.97
5. ZERO NOMINEES PTY LTD 24,119,209 3.69
6. UBS NOMINEES PTY LTD 23,044,400 3.52
7. NATIONAL NOMINEES LIMITED 8,050,683 1.23
8. MR KWOK LEUNG FUNG + MS YUEN MAN MOK 6,500,000 0.99
9. MR DAVID NORMAN DEITCH 5,258,541 0.80
10. BNP PARIBAS NOMS PTY LTD <DRP> 3,879,167 0.59
11. SACAVIC PTY LTD <MORRIS SUPER FUND A/C> 3,427,273 0.52
12. PATINA RESOURCES PTY LTD 3,397,984 0.52
13. MERRILL LYNCH (AUSTRALIA) NOMINEES PTY LIMITED 2,671,960 0.41
14. HSBC CUSTODY NOMINEES (AUSTRALIA) LIMITED - A/C 2 2,640,362 0.40
15. MATSA RESOURCES LIMITED 2,450,000 0.37
16. NEWECONOMY COM AU NOMINEES PTY LIMITED <900 ACCOUNT> 2,301,774 0.35
17. ABN AMRO CLEARING SYDNEY NOMINEES PTY LTD <CUSTODIAN A/C> 2,300,000 0.35
18. COLENEW PTY LIMITED <PAUL XIRADIS ACCOUNT> 2,282,486 0.35
19. ACCBELL NOMINEES PTY LTD 2,108,024 0.32
20. SPRINGWAY INVESTMENTS PTY LTD <ALLNUTT VENTURES FAMILY A/C> 1,945,636 0.30
TOTAL 502,366,989 76.79
For
per
sona
l use
onl
y

2019 ANNUAL REPORT | PAGE 127
Schedule of Mining Tenements 30 June 2019
Project Tenement
ID Code Status Current Area Equity Tenement Manager
Panormaic Commtiment
Current Registered Holders
East Kimberley - 100% E80/4880 E 8004880 Live 35 BL 100% PanRes
100% of Commit, Rent
& Rates Pindan Exploration Company Pty Ltd
East Kimberley - 100% E80/5131 E 8005131 Live 5 BL 100% PanRes
100% of Commit, Rent
& Rates Pindan Exploration Company Pty Ltd
East Kimberley - 100% E80/5238 E 8005238 Live 14 BL 100% PanRes
100% of Commit, Rent
& Rates Pindan Exploration Company Pty Ltd
East Kimberley - Keller Creek E80/4834 E 8004834 Live 15 BL
80% - THX has 20%
free carried interest PanRes
100% of Commit, Rents
& Rates
Pindan Exploration Company Pty Ltd 80/100 shares & Thundelarra Limited 20/100 shares
Laverton - Focus M38/101 M 3800101 Live 583.15 HA
100% Ni-Cu-PGM Focus Nil
Focus Minerals (Laverton) Pty Limited
Laverton - Focus M38/159 M 3800159 Live 597.15 HA
100% Ni-Cu-PGM Focus Nil
Focus Minerals (Laverton) Pty Limited
Laverton - Focus M38/342 M 3800342 Live 316.25 HA
100% Ni-Cu-PGM Focus Nil
Focus Minerals (Laverton) Pty Limited
Laverton - Focus M38/363 M 3800363 Live 5.245 HA
100% Ni-Cu-PGM Focus Nil
Focus Minerals (Laverton) Pty Limited
Laverton - Focus M38/364 M 3800364 Live 18.375 HA
100% Ni-Cu-PGM Focus Nil
Focus Minerals (Laverton) Pty Limited
Laverton - Focus M38/37 M 3800037 Live 650 HA
100% Ni-Cu-PGM Focus Nil
Focus Minerals (Laverton) Pty Limited
Laverton - Focus M38/38 M 3800038 Live 280.05 HA
100% Ni-Cu-PGM Focus Nil
Focus Minerals (Laverton) Pty Limited
Laverton - Focus M38/49 M 3800049 Live 945.05 HA
100% Ni-Cu-PGM Focus Nil
Focus Minerals (Laverton) Pty Limited
Laverton - Focus M38/535 M 3800535 Live 464.55 HA
100% Ni-Cu-PGM Focus Nil
Focus Minerals (Laverton) Pty Limited
Laverton - Focus M38/693 M 3800693 Live 48.2176 HA
100% Ni-Cu-PGM Focus Nil
Focus Minerals (Laverton) Pty Limited
Panton M80/103 M 8000103 Live 859.4 HA 100% PanRes
100% of Commit, Rents
& Rates Panton Sill Pty Ltd
Panton M80/104 M 8000104 Live 570.3 HA 100% PanRes
100% of Commit, Rents
& Rates Panton Sill Pty Ltd
Panton M80/105 M 8000105 Live 828.3 HA 100% PanRes
100% of Commit, Rents
& Rates Panton Sill Pty Ltd
Savannah L80/64 L 8000064 Live 311 HA 100% PanRes
100% of Commit, Rents
& Rates Savannah Nickel Mines Pty Ltd
Savannah M80/179 M 8000179 Live 241.85 HA 100% PanRes
100% of Commit, Rents
& Rates Savannah Nickel Mines Pty Ltd
Savannah M80/180 M 8000180 Live 960.3 HA 100% PanRes
100% of Commit, Rents
& Rates Savannah Nickel Mines Pty Ltd
Savannah M80/181 M 8000181 Live 960 HA 100% PanRes
100% of Commit, Rents
& Rates Savannah Nickel Mines Pty Ltd
Savannah M80/182 M 8000182 Live 589.4 HA 100% PanRes
100% of Commit, Rents
& Rates Savannah Nickel Mines Pty Ltd
Savannah M80/183 M 8000183 Live 967.05 HA 100% PanRes
100% of Commit, Rents
& Rates Savannah Nickel Mines Pty Ltd
Savannah - Copernicus L80/52 L 8000052 Live 140.3129 HA 100% PanRes
100% of Commit, Rents
& Rates Savannah Nickel Mines Pty Ltd
Savannah - Copernicus L80/86 L 8000086 Live 0.04 HA 100% PanRes
100% of Commit, Rents
& Rates Savannah Nickel Mines Pty Ltd
Savannah - Copernicus M80/540 M 8000540 Live 128.85 HA 100% PanRes
100% of Commit, Rents
& Rates Savannah Nickel Mines Pty Ltd
For
per
sona
l use
onl
y

PAGE 128 | 2019 ANNUAL REPORT
Resources and Reserves NICKEL-COPPER-COBALT MINERAL RESOURCES AS AT 30 JUNE 2019
Resource Equity Metal JORC Compliance
Measured Indicated Inferred Total Metal Tonnes Tonnes (%) Tonnes (%) Tonnes (%) Tonnes (%)
Savannah Project Savannah (above 900) 100% Nickel 2012 1,178,000 1.40 622,000 1.70 - - 1,800,000 1.50 27,100 Copper 0.86 1.41 - 1.05 18,900 Cobalt 0.07 0.08 - 0.07 1,300 Savannah (below 900) 100% Nickel 2012 - - 780,000 1.64 125,000 1.72 905,000 1.65 14,900 Copper - 0.76 0.75 0.76 6,900 Cobalt - 0.10 0.09 0.10 900 Savannah North (Upper) 100% Nickel 2012 - - 4,229,000 1.64 1,759,000 1.25 5,987,000 1.53 91,300 Copper - 0.65 0.49 0.60 36,100 Cobalt - 0.12 0.10 0.11 6,800 Savannah North (Lower) 100% Nickel 2012 - - 2,697,000 1.96 853,000 2.02 3,549,000 1.97 70,100 Copper - 0.98 0.93 0.97 34,400 Cobalt - 0.14 0.13 0.14 4,900 Savannah North (Other) 100% Nickel 2012 - - 242,000 2.22 493,000 1.67 735,000 1.85 13,600 Copper - 0.50 0.53 0.52 3,800 Cobalt - 0.14 0.11 0.12 900
Total (Equity) Nickel 12,977,000 1.67 217,000 Copper 0.77 100,100 Cobalt 0.11 14,800
Notes: • Figures have been rounded and therefore may not add up exactly to the reported totals • All resources are inclusive of reserves • Savannah Project Resource cutoff grade is 0.50% Ni Cross references to previous Company ASX announcements: • Savannah (above 900) - refer to ASX announcement of 30 September 2016, titled "Mineral Resources and Ore Reserves at 30
June 2016” • Savannah (below 900) - refer to ASX announcement of 30 September 2015, titled "Mineral Resources and Ore Reserves at 30
June 2015” • Savannah North – refer to ASX announcement of 24 August 2016, titled “Major Resource Upgrade for Savannah North” No New Information or Data The Mineral Resource estimates tabled above, with the exception of Savannah (above 900), have been previously reported and the relevant market announcements cross referenced. Except where stated otherwise, the Company confirms that it is not aware of any new information or data that materially affects the information included in the relevant market announcements and, in the case of estimates of Mineral Resources, that all material assumptions and technical parameters underpinning the estimates in the relevant market announcement continue to apply and have not materially changed.
Competent Person Statement The information in this report that relates to Mineral Resources for Savannah (above 900) is based on information compiled by or reviewed by Matthew Demmer (MAusIMM). The aforementioned is a full-time employee of Panoramic Resources Limited. The aforementioned have sufficient experience that is relevant to the style of mineralisation and type of deposit under consideration and to the activity which they are undertaking to qualify as a Competent Person as defined in the 2012 Edition of the Australian Code for Reporting of Exploration Results, Mineral Resources and Ore Reserves. The aforementioned consents to the inclusion in the report of the matters based on their information in the form and context in which it appears. F
or p
erso
nal u
se o
nly
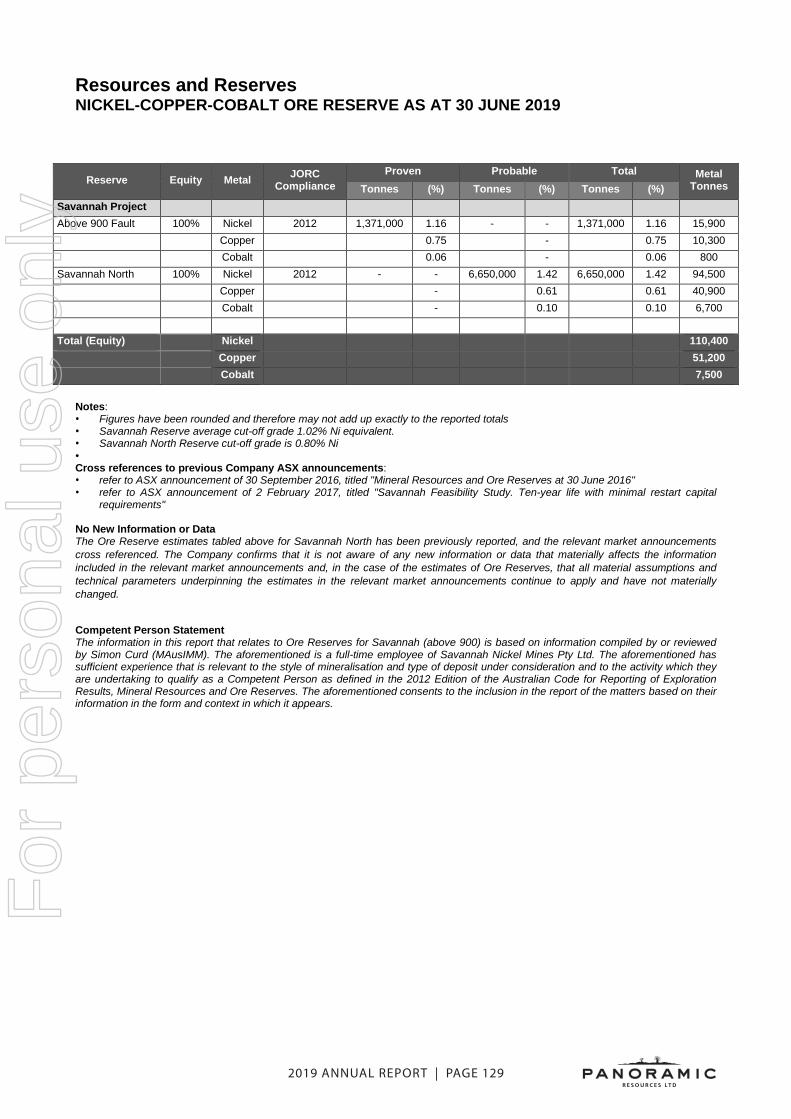
2019 ANNUAL REPORT | PAGE 129
Resources and Reserves NICKEL-COPPER-COBALT ORE RESERVE AS AT 30 JUNE 2019
Reserve Equity Metal JORC Compliance
Proven Probable Total Metal Tonnes Tonnes (%) Tonnes (%) Tonnes (%)
Savannah Project
Above 900 Fault 100% Nickel 2012 1,371,000 1.16 - - 1,371,000 1.16 15,900 Copper 0.75 - 0.75 10,300 Cobalt 0.06 - 0.06 800
Savannah North 100% Nickel 2012 - - 6,650,000 1.42 6,650,000 1.42 94,500 Copper - 0.61 0.61 40,900 Cobalt - 0.10 0.10 6,700
Total (Equity) Nickel 110,400 Copper 51,200 Cobalt 7,500
Notes: • Figures have been rounded and therefore may not add up exactly to the reported totals • Savannah Reserve average cut-off grade 1.02% Ni equivalent. • Savannah North Reserve cut-off grade is 0.80% Ni • Cross references to previous Company ASX announcements: • refer to ASX announcement of 30 September 2016, titled "Mineral Resources and Ore Reserves at 30 June 2016" • refer to ASX announcement of 2 February 2017, titled "Savannah Feasibility Study. Ten-year life with minimal restart capital
requirements" No New Information or Data The Ore Reserve estimates tabled above for Savannah North has been previously reported, and the relevant market announcements cross referenced. The Company confirms that it is not aware of any new information or data that materially affects the information included in the relevant market announcements and, in the case of the estimates of Ore Reserves, that all material assumptions and technical parameters underpinning the estimates in the relevant market announcements continue to apply and have not materially changed.
Competent Person Statement The information in this report that relates to Ore Reserves for Savannah (above 900) is based on information compiled by or reviewed by Simon Curd (MAusIMM). The aforementioned is a full-time employee of Savannah Nickel Mines Pty Ltd. The aforementioned has sufficient experience that is relevant to the style of mineralisation and type of deposit under consideration and to the activity which they are undertaking to qualify as a Competent Person as defined in the 2012 Edition of the Australian Code for Reporting of Exploration Results, Mineral Resources and Ore Reserves. The aforementioned consents to the inclusion in the report of the matters based on their information in the form and context in which it appears.
For
per
sona
l use
onl
y

PAGE 130 | 2019 ANNUAL REPORT
Resources and Reserves PLATINUM GROUP METALS (PGM) MINERAL RESOURCES AS AT 30 JUNE 2019
Resource Equity JORC Compliance Tonnage
Grade Contained Metal
Pt (g/t)
Pd (g/t)
Rh (g/t)
Au (g/t)
Ag (g/t)
Cu (%)
Ni (%)
Co %
Pt-Eq (g/t)
Pt (oz
,000)
Pd (oz
,000) Thunder Bay North Open Pit 100% 2004 Indicated 8,460,000 1.04 0.98 0.04 0.07 1.50 0.25 0.18 0.014 2.13 283 267 Inferred 53,000 0.96 0.89 0.04 0.07 1.60 0.22 0.18 0.014 2.00 2 2 Underground 100% 2004 Indicated 1,369,000 1.65 1.54 0.08 0.11 2.60 0.43 0.24 0.016 3.67 73 68 Inferred 472,000 1.32 1.25 0.06 0.09 2.10 0.36 0.19 0.011 2.97 20 19 Sub-total – Thunder Bay North (Equity) 10,354,000 1.13 1.07 377 355
Panton Top Reef 100% 2012 Measured 4,400,000 2.46 2.83 - 0.42 - 0.08 0.28 - - 348 400 Indicated 4,130,000 2.73 3.21 - 0.38 - 0.09 0.31 - - 363 426 Inferred 1,560,000 2.10 2.35 - 0.38 - 0.13 0.36 - - 105 118 Middle Reef 100% 2012 Measured 2,130,000 1.36 1.09 - 0.10 - 0.03 0.18 - - 93 75 Indicated 1,500,000 1.56 1.28 - 0.10 - 0.04 0.19 - - 75 62 Inferred 600,000 1.22 1.07 - 0.10 - 0.05 0.19 - - 24 21 Sub-total – Panton (Equity) 14,320,000 2.19 2.39 1,008 1,102 Total - PGM (Equity) 1,385 1,456
Notes Thunder Bay North Open Pit Resource: The open pit Mineral Resource is reported at a cut-off grade of 0.59 g/t Pt-Eq within a Lerchs-Grossman resource pit shell optimized on Pt-Eq. The strip ratio (waste:ore) of this pit is 9.5:1. The platinum-equivalency formula is based on assumed metal prices and overall recoveries. The Pt-Eq formula is: Pt-Eq g/t = Pt g/t + Pd g/t x 0.3204 + Au g/t x 0.6379 + Ag g/t x 0.0062 + Cu g/t x 0.00011 + Total Ni g/t x 0.000195 + Total Co g/t x 0.000124 + Rh g/t x 2.1816. The conversion factor shown in the formula for each metal represents the conversion from each metal to platinum on a recovered value basis. The assumed metal prices used in the Pt-Eq formula are: Pt US$1,595/oz, Pd US$512/oz, Au US$1,015/oz, Ag US$15.74/oz, Cu US$2.20/lb, Ni US$7.71/lb, Co US$7.71/lb and Rh US$3,479/oz. The assumed combined flotation and PlatsolTM process recoveries used in the Pt-Eq formula are: Pt 76%, Pd 75%, Au 76%, Ag 55%, Cu 86%, Ni 44%, Co 28% and Rh 76%. The assumed refinery payables are: Pt 98%, Pd 98%, Au 97%, Ag 85%, Cu 100%, Ni 100%, Co 100% and Rh 98%. Thunder Bay North Underground Resource: The underground mineral resource is reported at a cut-off grade of 1.94g/t Pt-Eq. The Pt-Eq formula is: Pt-Eq g/t = Pt g/t + Pd g/t x 0.2721 + Au g/t x 0.3968 + Ag g/t x 0.0084 + Cu g/t x 0.000118 + Sulphide Ni g/t x 0.000433 + Sulphide Co g/t x 0.000428 + Rh g/t x 2.7211. The assumed metal prices used in the Pt-Eq formula are: Pt US$1,470/oz, Pd US$400/oz, Rh US$4,000/oz, Au US$875/oz, Ag US$14.30/oz, Cu US$2.10/lb, Ni US$7.30/lb and Co US$13.00/lb. The assumed process recoveries used in the Pt-Eq formula are: Pt 75%, Pd 75%, Rh 75%, Au 50%, Ag 50%, Cu 90%, and Ni and Co in sulphide 90%. The assumed smelter recoveries used in the Pt-Eq formula are Pt 85%, Pd 85%, Rh 85%, Au 85%, Ag 85%, Cu 85%, Ni 90% and Co 50%. Ni and Co in sulphide were estimated by linear regression of MgO to total Ni and total Co respectively. The regression formula for Ni in sulphide (NiSx) is: NiSx = Ni - (MgO% x 60.35 - 551.43). The regression formula for Co in sulphide (CoSx) is: CoSx = Co - (MgO% x 4.45 - 9.25). Cross references to previous ASX announcements: • Thunder Bay North Open Pit Resources – refer to Magma Metals Limited (ASX:MMW) announcement of 7 February 2011, titled
“Positive Scoping Study for Thunder Bay North Project” • Thunder Bay North Underground Resources – refer to Magma Metals Limited (ASX:MMW) announcement of 23 February 2012, titled
“Magma Metals Increases Mineral Resources at TBN to 790,000 Platinum-Equivalent Ounces” • Panton - refer to the Company’s ASX announcement of 30 September 2015, titled “Mineral Resources and Ore Reserves at 30 June
2015”
No New Information or Data The Mineral Resource estimates tabled above have been previously reported, and the relevant market announcements cross referenced. The Company confirms that it is not aware of any new information or data that materially affects the information included in the relevant market announcements and, in the case of estimates of Mineral Resources, that all material assumptions and technical parameters underpinning the estimates in the relevant market announcement continue to apply and have not materially changed.
For
per
sona
l use
onl
y

CORPORATE DIRECTORY
BOARD OF DIRECTORSBrian PhillipsNon-Executive Chairman
Peter HaroldManaging Director
Peter SullivanNon-Executive Director
Nicholas CernottaNon-Executive Director
Rebecca HaywardNon-Executive Director
Gillian SwabyNon-Executive Director
MANAGEMENTTrevor EtonChief Financial Officer & Company Secretary
Boyd TimlerChief Operating Officer
John HicksGeneral Manager Exploration
Tim MasonGeneral Manager Projects & Innovation
Rochelle LampardGeneral Manager Human Resources
Tim ShervingtonCommercial Manager
Andrew MathGroup Financial Controller
Jeremy SmithManager Information & Technology
REGISTERED OFFICELevel 9, 553 Hay Street Perth, Western Australia, 6000T: +61 8 6266 8600F: +61 8 9421 1008W: www.panoramicresources.com
AUSTRALIAN BUSINESS NUMBER47 095 792 288
AUDITORErnst & YoungErnst & Young Building11 Mounts Bay RoadPerth, Western Australia, 6000
BANKERNational Australia Bank100 St Georges TerracePerth, Western Australia, 6000
SHARE REGISTRYComputershare Investor Services172 St Georges TerracePerth, Western Australia, 6000
TAX ADVISORErnst & YoungErnst & Young Building11 Mounts Bay RoadPerth, Western Australia, 6000
For
per
sona
l use
onl
y

Panoramic Resources LimitedLevel 9, 553 Hay Street, Perth WA 6000
Postal Address PO Box Z5487, Perth WA 6831Telephone: +61 8 6266 8600Facsimile: + 61 8 9421 1008
Email: [email protected]: 47 095 792 288
www.panoramicresources.com
Panoramic Resources Lim
ited | 2019 Annual Report
For
per
sona
l use
onl
y