for personal use only during normal business hours. · 2015. 3. 25. · presentation – mining...
TRANSCRIPT

Unit 17, Level 2, 100 Railway Road, Subiaco WA 6008 PO Box 8129, Subiaco East WA 6008
Phone: +61 (0)8 9380 9920 Fax: +61 (0)8 9381 5064
Peninsula Energy Limited - ABN: 67 062 409 303
25 March 2015 Companies Announcement Office Via Electronic Lodgement
COMPANY PRESENTATION Please find attached a copy of the presentation by Peninsula Energy Limited's Executive Chairman, Mr John (Gus) Simpson for the 2015 Mines and Money Conference in Hong Kong. A copy of the presentation will also be available on our website at http://www.pel.net.au. Yours sincerely
Jonathan Whyte Company Secretary
For further information, please contact our office on +61 8 9380 9920 during normal business hours.
For
per
sona
l use
onl
y

BUILDING A GLOBAL URANIUM SUPPLY
COMPANY
March 2015 Presentation F
or p
erso
nal u
se o
nly

This presentation is provided on the basis that the Company nor its representatives make any warranty (express or implied) as to the accuracy, reliability, relevance or completeness of the material contained in the Presentation and nothing contained in the Presentation is, or may be relied upon as, a promise, representation or warranty, whether as to the past or the future. The Company hereby excludes all warranties that can be excluded by law. The Presentation contains material which is predictive in nature and may be affected by inaccurate assumptions or by known and unknown risks and uncertainties, and may differ materially from results ultimately achieved. The Presentation contains “forward-looking statements”. All statements other than those of historical facts included in the Presentation are forward-looking statements including estimates of resources. However, forward-looking statements are subject to risks, uncertainties and other factors, which could cause actual results to differ materially from future results expressed, projected or implied by such forward-looking statements. Such risks include, but are not limited to, gold and other metals price volatility, currency fluctuations, increased production costs and variances in ore grade or recovery rates from those assumed in mining plans, as well as political and operational risks and governmental regulation and judicial outcomes. The Company does not undertake any obligation to release publicly any revisions to any “forward-looking statement” to reflect events or circumstances after the date of the Presentation, or to reflect the occurrence of unanticipated events, except as may be required under applicable securities laws. All persons should consider seeking appropriate professional advice in reviewing the Presentation and all other information with respect to the Company and evaluating the business, financial performance and operations of the Company. Neither the provision of the Presentation nor any information contained in the Presentation or subsequently communicated to any person in connection with the Presentation is, or should be taken as, constituting the giving of investment advice to any person. Presentation does not relate to any securities which will be registered under the United States Securities Act of 1933 nor any securities which may be offered or sold in the United States or to a US person unless registered under the United States Securities Act of 1933 or in a transaction exempt from registration. Please note that in accordance with Clause 17 of the JORC (2012) Code, the potential quantity and grade of the ”Exploration Target” in this presentation must be considered conceptual in nature as there has been insufficient exploration to define a Mineral Resource and it is uncertain if further exploration will result in the determination of a Mineral Resource. Please note that Production Targets within this presentation are based on a proportion of inferred resources. There is a low level of geological confidence associated with inferred mineral resources and there is no certainty that further exploration work will result in the determination of indicated mineral resource or that the production target itself will be realised.
Competent Person Statement The information in this presentation that relates to Exploration Results, Mineral Resources or Ore Reserves at the Lance Projects is based on information compiled by Mr. Jim Guilinger. Mr. Guilinger is a Member of a Recognised Overseas Professional Organisation included in a list promulgated by the ASX (Member of Mining and Metallurgy Society of America and SME Registered Member of the Society of Mining, Metallurgy and Exploration Inc). Mr. Guilinger is Principal of independent consultants World Industrial Minerals. Mr. Guilinger has sufficient experience which is relevant to the style of mineralisation and type of deposit under consideration and to the activity which they are undertaking as a Competent Person as defined in the 2012 Edition of the ‘Australasian Code for Reporting of Exploration Results, Mineral Resources and Ore Reserves’. Mr. Guilinger consents to the inclusion in the presentation of the matters based on his information in the form and context in which it appears. The information in this presentation that relates to Exploration Results and Exploration Potential at Peninsula’s Karoo projects is based on information compiled by Mr. George van der Walt. Mr. van der Walt is a member of a Recognised Overseas Professional Organisation included in a list promulgated by the ASX (The South African Council of Natural Scientific Professions, Geological Society of South Africa). Mr van der Walt is a Director of Geoconsult International. Mr van der Walt has sufficient experience which is relevant to the style of mineralisation and type of deposit under consideration and to the activity which they are undertaking as Competent Persons as defined in the 2012 Edition of the ‘Australasian Code for Reporting of Exploration Results, Mineral Resources and Ore Reserves’. Mr. van der Walt consents to the inclusion in the presentation of the matters based on his information in the form and context in which it appears. The information in the presentation which relates to Mineral Resources at the Karoo Projects is based upon information compiled by Ian Glacken, who is a Fellow of the Australasian Institute of Mining and Metallurgy. Ian Glacken is an employee of Optiro Pty Ltd and has sufficient experience which is relevant to the style of mineralisation and type of deposit under consideration and to the activity which he is undertaking to qualify as a Competent Person as defined in the 2012 edition of the Australasian Code for Reporting of Exploration Results, Mineral Resources and Ore Reserves. Ian Glacken consents to the inclusion in the presentation of a summary based upon his information in the form and context in which it appears.
2
Disclaimer & Competent Person F
or p
erso
nal u
se o
nly

Update on Recent Trends
1) Olympic Dam mill shutdown & Rossing fire - A mill shutdown due to electrical failure at the largest of three operating mills at Olympic Dam threatens 3-4m lbs of global uranium supply in 2015 (~10% spot demand). Details are still emerging from a fire at Rossing's product recovery plant, but mining/production appears unharmed (5.2m lbs pa).
2) Russia/Ukraine fallout - With ongoing strife in the region, concerns of EU/US sanctions against Russia are mounting. This could impact both primary and secondary supply, enrichment capabilities, and potentially banks that deal in the sector.
3) Japanese restarts - We remain cautiously optimistic on restarts in H1/15 with two Sendai reactors receiving NRA and community approvals. Two Takahama reactors have also received approvals with restarts expected later this year.
4) Chinese resurgence - Three reactors were completed in 2014 but no new reactors broke ground until recently. Resurgence is now expected with five reactors expected to start construction. Expect aggressive U3O8 procurement to continue.
5) Underfeeding - Low uranium prices and lack of enrichment demand is encouraging increased underfeeding globally, and enrichment firms turn excess capacity into excess uranium.
6) DOE inventory sales - The lawsuit with ConverDyn was delayed until May 2015 but until then the DOE is able to sell perhaps 8-10+m lbs pa (was 4-5m lbs). Including depleted uranium excess the DOE has ~120-145m lbs in inventory.
7) Russian domination - Russia continues to push new builds in Venezuela, Jordan, South Africa, Iran, India and Hungary. WNA suggests that Rosatom ranks #1 with 37% of reactors under construction globally, having a US$100B order backlog. Russia has become a one-stop shop, from reactor financing and construction through uranium supply and waste management.
3
For
per
sona
l use
onl
y

Build a uranium producer with multiple sources of supply in established mining economies with low cost, long life mines backed up by a sophisticated well recognized trading arm dealing directly with the utilities
1. Utilities are seeking security of supply through diversity of supply – multiple suppliers with multiple sources of low cost, long life uranium located in varied, stable and secure mining countries
2. 5 year program of directly connecting to US and European utilities:
– To build knowledge of our plans & projects
– To build trust and confidence in our management
– Establish Peninsula as a future preferred supplier: long life, low cost mines in USA, South Africa and Australia (planned) and
– To enter into Long Term Contracts
• Two contracts in place with US utiliies for 2 million pounds over 10 years
• LOI received from a major utility; contract being concluded
• Two RFP’s currently live 3. Construction on-schedule and on-budget for production at Lance ISR uranium Projects in Wyoming for Q3, 2015
– building to 2.3mlbs U3O8 per annum; acquire satellite deposit (plant capacity licensed for 3mlbs pa)
4. Complete DFS and reserve definition at Karoo Projects, South Africa and build a mine by 2018 – Build to 3- 4mlbs U3O8 per annum over 3 years
5. Acquire one of several projects identified in Australia Please note that Production Targets within this presentation are based on a proportion of inferred resources. There is a low level of geological confidence associated with inferred mineral resources and there is no certainty that further exploration work will result in the determination of indicated mineral resource or that the production target itself will be realised. The estimated mineral resources underpinning the production targets have been prepared by Alf Gillman, a Competent Person as defined in the 2012 edition of the Australasian Code for Reporting of Exploration Results, Mineral Resources and Ore Reserves. The basis of the Production Targets within this presentation are included in a presentation to ASX released on 27th March 2014 “Company Presentation – Mines and Money Hong Kong” for the Lance Projects and a presentation released on 5 February 2014 “Company Presentation – Mining Indaba Conference 2014” for the Karoo Projects.” Peninsula confirms that it is not aware of any new information or data that materially affects the information included in this announcement and that all material assumptions and technical parameters underpinning the production targets continue to apply and have not materially changed. The Company confirms that the form and context in which the Competent Person’s findings are presented have not been materially modified from the original market announcement
4
Business Plan
For
per
sona
l use
onl
y

Uranium – Supply & Demand History
5
Spot price is US$38.75/lb, long term contract price is US$49/lb
For
per
sona
l use
onl
y

Uranium Supply
Two sources:
• Primary (mines) 150,000,000 lbs U3O8
• In-situ leach 44%
• Underground 29%
• Open Pit 20%
• By-product 7%
• Secondary (already mined) 50,000,000 lbs U3O8
• Tails re-enrichment & underfeeding ~50%
• Government stocks ~33%
• MOX/RepU ~17%
6
Source: UxC, WNA, IAEA.
For
per
sona
l use
onl
y

Primary Uranium Supply – Global Sources
7
Global Uranium Production by Country (mlbs U3O8 – 2014E) Top 10 Uranium Mines (mlbs - 2014E)
Source: UxC, Raymond James Ltd.
Kazakhstan, 59.3 , 40.6%
Canada, 23.0 , 15.7%
Australia, 13.3 , 9.1%
Namibia, 9.7 , 6.6%
Niger, 11.7 , 8.0%
Russia, 7.8 , 5.3%
Uzbekistan, 6.3 , 4.3%
Other, 2.7 , 1.8%USA, 4.6 , 3.1%
China, 3.9 , 2.7% Ukraine, 2.5 , 1.7% South Africa, 1.5 , 1.0%
Others, 72.7 , 50%
McArthur River, 18.3 , 12%
Katco, 10.1 , 7%
Olympic Dam, 8.5 , 6%
Airlit, 7.0 , 5%
Navoi, 6.3 , 4%
Akbastau, 5.2 , 4%
Langer Heinrich, 5.2 , 4%
Piargunsky, 5.1 , 3%Rossing, 3.5 , 2% Rabbit Lake, 4.2 , 3%
70% of supply from Central Asian, Africa & Russia
For
per
sona
l use
onl
y

Primary Uranium Supply - Outlook
8
Global Primary Supply Forecast (mlbs/yr U3O8eq)
0
25
50
75
100
125
150
175
200
225
250
2004
A
2005
A
2006
A
2007
A
2008
A
2009
A
2010
A
2011
A
2012
A
2013
A
2014
E
2015
E
2016
E
2017
E
2018
E
2019
E
2020
E
2021
E
2022
E
2023
E
2024
E
2025
E
2026
E
2027
E
2028
E
2029
E
2030
E
Glo
bal M
ine
SUpp
ly (M
lbs/
yr)
Olympic Dam Ranger Other Australia McArthur River Cigar Lake Other Canada USA
Niger Namibia Other Africa Russia Other NIS Kazakhstan Other Countries
Today
Source: UxC, WNA, NIW, Raymond James Ltd.
For
per
sona
l use
onl
y
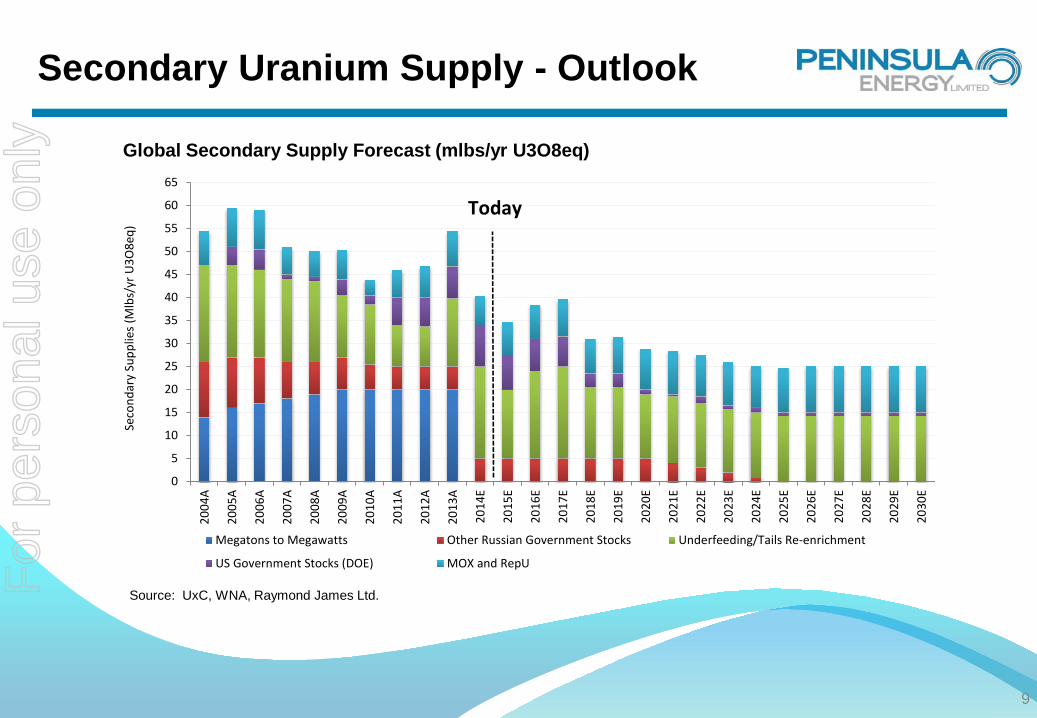
Secondary Uranium Supply - Outlook
9
Global Secondary Supply Forecast (mlbs/yr U3O8eq)
0
5
10
15
20
25
30
35
40
45
50
55
60
65
2004
A
2005
A
2006
A
2007
A
2008
A
2009
A
2010
A
2011
A
2012
A
2013
A
2014
E
2015
E
2016
E
2017
E
2018
E
2019
E
2020
E
2021
E
2022
E
2023
E
2024
E
2025
E
2026
E
2027
E
2028
E
2029
E
2030
E
Seco
ndar
y Su
pplie
s (M
lbs/
yr U
3O8e
q)
Megatons to Megawatts Other Russian Government Stocks Underfeeding/Tails Re-enrichment
US Government Stocks (DOE) MOX and RepU
Today
Source: UxC, WNA, Raymond James Ltd. For
per
sona
l use
onl
y

Supply - Contractions
• Supply Contractions – Kazakhstan 3Q y/y production drop; signed first LTC with China and India – Paladin shuts down Kayelekera; – 25% of Langer Heinrich production now diverted to Chinese – Cigar Lake
– Rio Tinto aging mines; Rossing production down by 50% – BHP Olympic Dam Uranium circuit out of action for 6 months – UUU closed Honeymoon and winding back ISL production in USA to contracts only – RSA gold producer U by-product threatened
• Risk to New Uranium Supply - Market has factored in a seamless ramp-up of new supply 2011 – 2018 – Reduced shifts at McClean Lake – Trekkopje Namibia; Bokouma CAR; Imouraran Niger; Mkuju River Tanzania not happening; and – Kazakh expansion curtailed
10
For
per
sona
l use
onl
y

Uranium Demand - Outlook
11
Notes: • Nearly all the reactors shown as “Under Construction” will be completed by the end of 2018. • “Planned” means reactors will likely be completed within the next 10 years. • Average Annual Demand is based on average consumption of approximately 440,000lbs U3O8 per year, which is the rule of thumb for each 1,000 Mwe
of generation from a standard light water reactor
• Global Nuclear Generation Capacity will increase 70% over the next decade - from 377,728Mwe to 636,693Mwe
• 70 Reactors under construction & 183 new Reactors planned
• Annual Uranium Demand will increase from 177mlbs to 280mlbs by 2020 (58% increase)
• Additional 390mlbs will be needed for new initial cores
Source: World Nuclear Association (January 2015)
Electricity Generation and Uranium Consumption
Operable Reactors January 2015 Under Construction Planned
Annual Uranium Demand
Generation Capacity
437 Reactors
70 Reactors
183 Reactors
65,908 tonnesU
14,703 tonnesU
40,716 tonnesU
203,580 Mwe
377,728 Mwe
73,5146 Mwe
For
per
sona
l use
onl
y

Uranium Demand – Global Consumers
12
Global Operating Nuclear Capacity by Country (GW gross, 2014E)
Prospective Reactor Counts by Category, February 2015
0
30
60
90
120
150
180
210
240
China
India
Russia
USA
Saudi Arabia
Japan
UAE
Ukraine
South Korea
Vietnam
Iran
South Africa
Proposed
Planned
Under Construction
USA, 103, 29%
France, 66, 19%
Russia, 25, 7%China, 24, 7%
Korea RO (South), 22, 6%
India, 6, 2%
Middle East/Africa, 4, 1%
Rest of World, 102, 29%
Japan, 0, 0%
Source: UxC, WNA, IAEA, NIW, Raymond James Ltd. For
per
sona
l use
onl
y

Uranium Supply/Demand - Outlook
13
Global Uranium Supply vs. Demand (mlbs/yr)
0
25
50
75
100
125
150
175
200
225
250
275
300
2012
A
2013
A
2014
E
2015
E
2016
E
2017
E
2018
E
2019
E
2020
E
2021
E
2022
E
2023
E
2024
E
2025
E
2026
E
2027
E
2028
E
2029
E
2030
E
Mlb
s/yr
U3O
8
Secondary Supplies Existing Mines New Mines Total Demand
Today
Source: UxC, WNA, IAEA, NIW, Raymond James Ltd. For
per
sona
l use
onl
y

Price Outlook – Long Term
14
Expect US$70/lb by 2017/2018E in order to support badly-needed new mines
• Strong global demand growth
• Insufficient mine growth
• Dwindling secondary supplies
• Significant deficit at decade’s end
• Need reasonable risk-adjusted return implied on new projects well in advance of shortfall
Source: Raymond James Ltd
For
per
sona
l use
onl
y

Price Outlook – Near-term
15
• Less clear
• But many reasons to expect price jump in 2015:
• Return of utility contracting
• Japanese restarts
• Supply disruptions
• Accelerating grid connections
• More China construction deals, domestic + export
• India finally joining the party, settling liability issues
• Uranium participation – more buying
• ConverDyn lawsuit vs. DOE
• M&A – EFR/URZ first of new wave?
For
per
sona
l use
onl
y
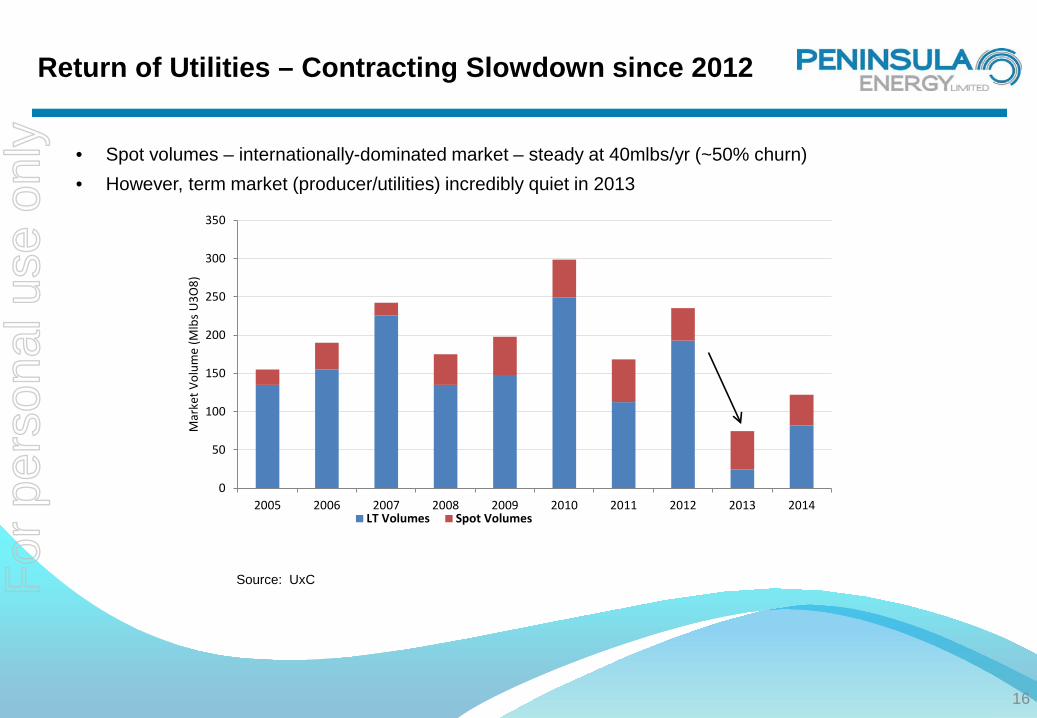
Return of Utilities – Contracting Slowdown since 2012
16
• Spot volumes – internationally-dominated market – steady at 40mlbs/yr (~50% churn) • However, term market (producer/utilities) incredibly quiet in 2013
0
50
100
150
200
250
300
350
2005 2006 2007 2008 2009 2010 2011 2012 2013 2014
Mar
ket V
olum
e (M
lbs U
3O8)
LT Volumes Spot Volumes
Source: UxC For
per
sona
l use
onl
y

Return of Utilities – High Uncovered Requirements
17
• 2018/2019-onwards (3-4 years out) are particularly uncovered • Utilities must resume normal levels of purchasing to cover these needs • Typical contracting window is >3 years ahead (fuel cycle, physical delivery time + buffer) • Uncovered requirements = demand – discretionary inventories – supply contracts
0
25
50
75
100
125
150
175
200
225
250
275
2014 2015 2016 2017 2018 2019 2020 2021 2022 2023 2024 2025
Mlb
s U3O
8
Non -US Utilities US Utilities Projected Demand (Burn + Initial Cores)
UxC Uncovered Uranium Requirements Estimate
Source: UxC, Raymond James Ltd.
For
per
sona
l use
onl
y

The Nuclear Fuel Cycle
18 Source: World Nuclear Association (WNA)
For
per
sona
l use
onl
y

Return of Utilities - US Uranium Forward Contracts
19
For
per
sona
l use
onl
y

Japanese Restarts – A Psychological Catalyst
20
0.0 GW
• Pre-Fukushima: 54 reactors, 47 GW, 21 Mlbs/yr demand (now zero) • Government guiding 1/3rd to 2/3rd return by 2020 • Sendai 1&2 and Takahama 3&4 approved and expected online ‘15 • Positive read-throughs on inventories and delivery deferrals
0.0
2.0
4.0
6.0
8.0
10.0
12.0
14.0
16.0
2013A 2014A 2015E 2016E 2017E
Ope
ratin
g N
ucle
ar C
apac
ity (G
W)
PWR BWR APR ABWR
0.0 GW
5.3 GW
10.6 GW
14.3 GW
0.0 GW
Expected Operating Nuclear Capacity in Japan 2013 – 2017E (GW; EOP)
Source: UxC, WNA, Raymond James Ltd.
For
per
sona
l use
onl
y

Potential Supply Disruptions – Cigar Lake
21
• World #2 mine by 2017E • 6-8mlbs guidance in 2015E; further decreased to 3-4mlbs • Freezing issues could worsen in our view
For
per
sona
l use
onl
y
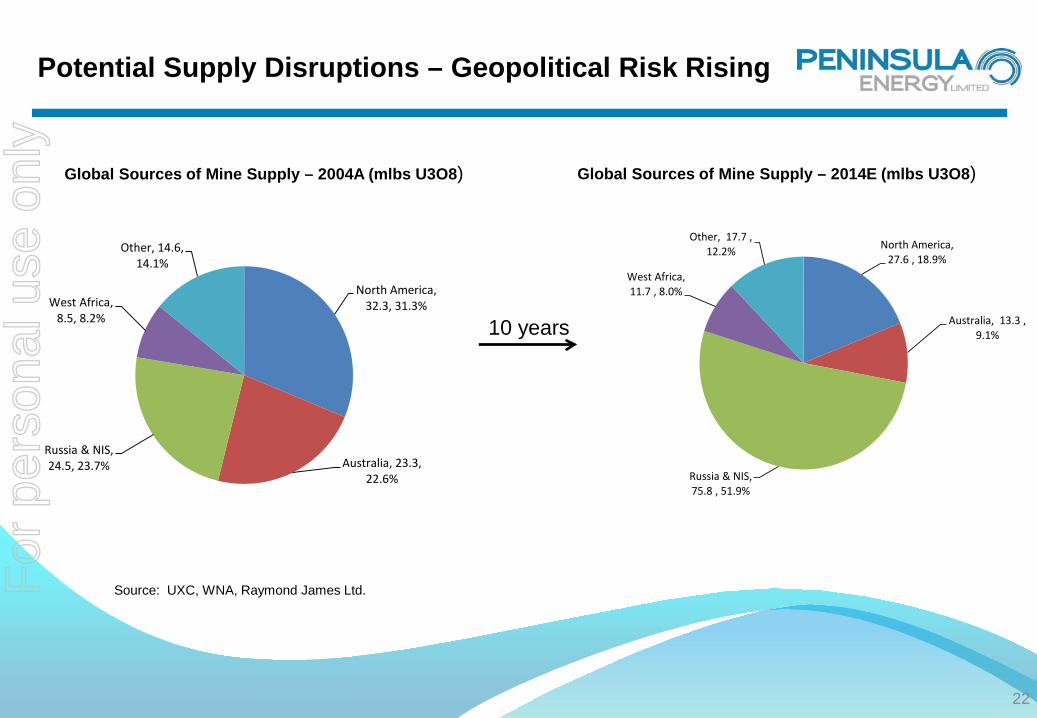
Potential Supply Disruptions – Geopolitical Risk Rising
22
Global Sources of Mine Supply – 2004A (mlbs U3O8)
10 years
Global Sources of Mine Supply – 2014E (mlbs U3O8)
North America, 32.3, 31.3%
Australia, 23.3, 22.6%
Russia & NIS, 24.5, 23.7%
West Africa, 8.5, 8.2%
Other, 14.6, 14.1%
North America, 27.6 , 18.9%
Australia, 13.3 , 9.1%
Russia & NIS, 75.8 , 51.9%
West Africa, 11.7 , 8.0%
Other, 17.7 , 12.2%
Source: UXC, WNA, Raymond James Ltd. For
per
sona
l use
onl
y

Slowing Kazakh Growth
23
• Meteoric growth finally slowing • Costs at new projects much higher than existing mines
Kazakh Production (Mlbs/yr)
8.611.3 13.2
17.3
22.1
36.4
46.450.6
55.558.5 59.3 60.5 60.6 60.6 60.6
05
101520253035404550556065
2004
A
2005
A
2006
A
2007
A
2008
A
2009
A
2010
A
2011
A
2012
A
2013
A
2014
E
2015
E
2016
E
2017
E
2018
E
Mlb
s U3O
8 We see limited growth until prices rise because: • Kazatomprom guidance (most
recently Sep 2014) • there is limited upside at
existing mines in north • southern deposits are much
more expensive
Source: UXC, WNA, NIW, Raymond James Ltd.
For
per
sona
l use
onl
y
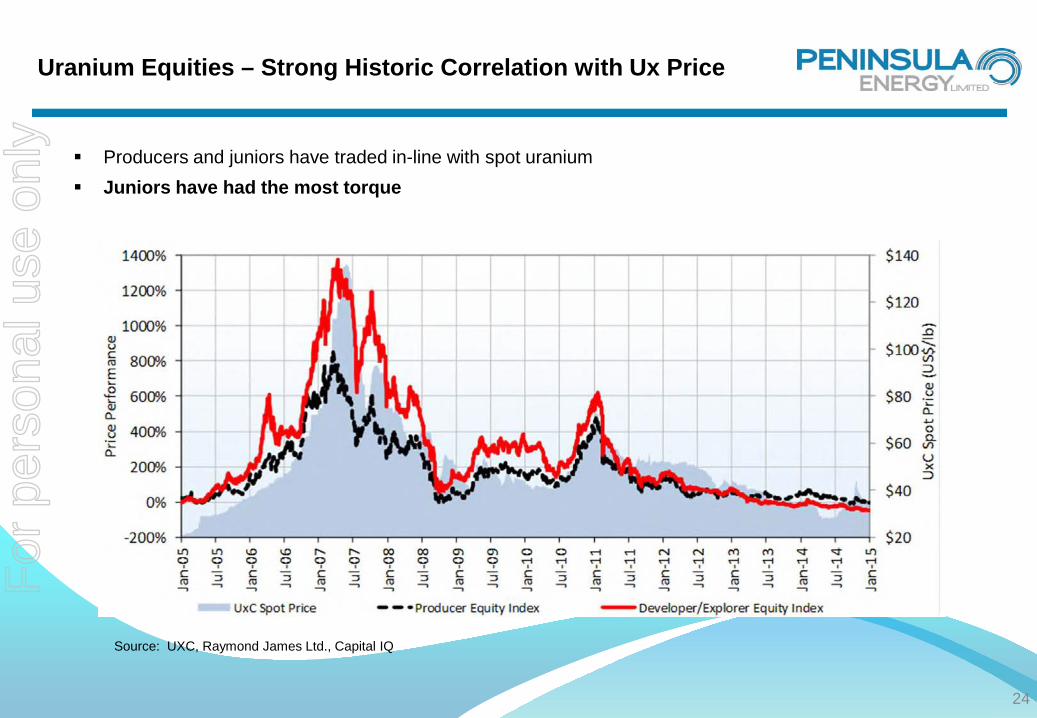
Uranium Equities – Strong Historic Correlation with Ux Price
24
Producers and juniors have traded in-line with spot uranium Juniors have had the most torque
Source: UXC, Raymond James Ltd., Capital IQ
For
per
sona
l use
onl
y

Uranium Equities – Recent Correlation Breakdown
25
• Correlation has broken down since mid 2014 – we believe it could correct later in 2015
Source: UXC, Raymond James Ltd., Capital IQ
For
per
sona
l use
onl
y

Uranium Equities – Positive Outlook
26
• Anticipate strong year for uranium • Spot price rebound has stared • Utilities are re-entering long Term Contract market • Focus on producers and quality juniors with:
• Strong news flow • Balance sheet strength • Production • Leverage to rebound
PENINSULA ENERGY LIMITED For
per
sona
l use
onl
y

1 year share price & volume history
Corporate Overview
27
Shareholding % holding
Resource Capital Fund VI 20.9%
Pala Investments 12.3%
BlackRock Funds 9.3%
J P Morgan 6.7%
AREVA 3.3%
Gus Simpson 2.4%
Top 20 Shareholders 63.2%
Capital Structure
Shares on issue 6,907m
Share price 2.0c
Market capitalisation $138m
Cash $48m
Undrawn debt $18m
Debt $1m
Research coverage RFC Ambrian Jim Taylor Dundee Capital Markets Dave Talbot Canaccord Genuity Gary Watson Patersons Simon Tonkin
For
per
sona
l use
onl
y

Uranium Mining in Wyoming
28
Wyoming very supportive of uranium extraction – multiple ISR operations in region
For
per
sona
l use
onl
y

Company Overview - Projects
Emerging uranium producer with established project pipeline • Flagship Lance Projects in Wyoming – Fully Funded, Fully Permitted and construction commenced • Karoo Projects in South Africa – positive scoping study recently completed; PFS underway
Lance: Wyoming USA • Low risk staged ramp-up
– Stage 1 up to 700,000mlbs p.a. U3O8 in 2015/16 – Stage 2 increase to 1,200,000mlbs p.a. U3O8 by 2018 – Stage 3 increase to 2,300,000mlbs p.a. U3O8 by 2021
• Stage 1 development fully funded. Stage 2 & 3 to be funded by debt and surplus cashflow • US$288 million unlevered NPV8 at current uranium prices & IRR of 36% • Low capital intensity • JORC Resource of 54mlbs¹ U3O8: (51.2Mt at 476ppm U3O8) • Exploration Target³ of 158-217mlbs U3O8 (169-196mt at 426-530ppm U3O8) inclusive of 54mlbs JORC Resource
Karoo: South Africa • Scoping study complete - positive outcome triggered PFS start Q4, 2013 • JORC Resource 56.9mlbs² eU3O8 • High grade 1,108ppm resource (cut-off 600ppm) • Exploration Target of 250-350mlbs eU3O8 (126-133mt at 900-1200ppm eU3O8) inclusive of 56.9mlbs JORC Resource • Targeting Development CY 2017/2018 Please note that Production Targets within this presentation are based on a proportion of inferred resources. There is a low level of geological confidence associated with inferred mineral resources and there is no certainty that further exploration work will result in the determination of indicated mineral resource or that the production target itself will be realised. The estimated mineral resources underpinning the production targets have been prepared by Alf Gillman, a Competent Person as defined in the 2012 edition of the Australasian Code for Reporting of Exploration Results, Mineral Resources and Ore Reserves. The Karoo Scoping Study referred to in this presentation is based on low-level technical and economic assessments, and is insufficient to support estimation of Ore Reserves or to provide assurance of an economic development case at this stage, or to provide certainty that the conclusions of the Scoping Study will be realised.
29
For
per
sona
l use
onl
y

Lance Exploration Target Additional Disclosure
Exploration Target
Tonnes (million)
Grade eU3O8
(ppm eU3O8) (mlbs)
Range From To From To From To Total 169 196 426 530 158 217
Exploration Target The Lance Projects cover a significant proportion of the Powder River Basin Basin Cretaceous sandstones of Wyoming, which are believed to represent an Exploration Target of between 158 and 217mlbs U3O8 which includes 54mlbs of existing JORC (2012) Code compliant resource.
Please note that in accordance with Clause 17 of the JORC (2012) Code, the potential quantity and grade of the ”Exploration Target” in this presentation must be considered conceptual in nature as there has been insufficient exploration to define a Mineral Resource and it is uncertain if further exploration will result in the determination of a Mineral Resource.
Basis of Exploration Target Exploration Target is based on a combination of Exploration Results and on proposed exploration programs. Exploration Results Approximately 7,500 drillholes, of which over 2,500 have been drilled and PFN logged since 2009. The data from these holes has been used to determine a JORC (2012) Code compliant resource and to extrapolate between areas of limited drilling but still within the mineralised trends. Proposed Exploration Programs The Company has minerals rights and surface access rights to 122.2 square kilometres and 107.8 square kilometres respectively. This package covers the most prospective mineralised redox /roll front trends that have a cumulative strike length of over 300km. The Company intends to continue exploration over this ground with drilling in order to validate the exploration target and convert to resources.
Lance Projects Exploration Target (including the existing JORC (2012) Code Compliant Resource)
For
per
sona
l use
onl
y

31
Basis of Grade and Tonnage Range Determination With a database of approximately 7,500 drillholes together with several decades of geological research the level of exploration activity on which the Exploration Target is based, is considered to be high. The known Lance resources are located in the upper Lance Formation and in the lower Fox Hills horizons in which roll fronts have been identified over a cumulative length of over 300kms. These horizons have only been partially explored and towards the south (Barber area) the lower unit of the Fox Hills has not been systematically tested. Along these channels JORC-compliant resources have been estimated in localised areas in which reliable drilling data is available. The zones between the JORC (2012) Code compliant resource areas form the Exploration Target because of the following: • Continuity of the prospective sandstone established by geological mapping and regional drilling • Historic estimates of mineralisation based on drilling which has not yet been validated by Peninsula The Exploration Target is based on a combination of: • A tonnage calculation that incorporates the total cumulative prospective strike length of the identified redox fronts multiplied by the average width,
thicknesses as determined in the resource estimate, • The grade range represents the lowest resource area grades and highest resource area grades Summary of the Relevant Exploration Data Available and the Nature of the Results For a comprehensive description of drilling information readers are referred to JORC Table 1 at the end of this presentation. Proposed Exploration Activities Designed To Test Validity of the Exploration Target Over the life of mine ongoing exploration drilling is proposed to expand the JORC (2012) Code compliant resource within the Exploration Target areas. This initial program will be focussed on the Kendrick area. Exploration activities will mostly comprise geophysical logging of additional drillholes.
Lance Projects Competent Person Statement The information in this presentation that relates to Exploration Targets, Exploration Results and Exploration Potential at the Lance Projects is based on information compiled by Mr. Jim Guilinger. Mr. Guilinger is a Member of a Recognised Overseas Professional Organisation included in a list promulgated by the ASX (Member of Mining and Metallurgy Society of America and SME Registered Member of the Society of Mining, Metallurgy and Exploration Inc). Mr. Guilinger is Principal of independent consultants World Industrial Minerals. Mr. Guilinger has sufficient experience which is relevant to the style of mineralisation and type of deposit under consideration and to the activity which they are undertaking as a Competent Person as defined in the 2012 Edition of the ‘Australasian Code for Reporting of Exploration Results, Mineral Resources and Ore Reserves’. Mr. Guilinger consents to the inclusion in the presentation of the matters based on his information in the form and context in which it appears.
Lance Exploration Target Additional Disclosure F
or p
erso
nal u
se o
nly
Basis of the Exploration Target The Exploration Target is based on a combination of Exploration Results and proposed exploration programs. Please note that in accordance with Clause 17 of the JORC (2012) Code, the potential quantity and grade of the ”Exploration Target” in this presentation must be considered conceptual in nature as there has been insufficient exploration to define a Mineral Resource and it is uncertain if further exploration will result in the determination of a Mineral Resource. Exploration Results The database currently contains 9,343 historic holes, of which 7,230 have been used to determine the JORC (2012) Code compliant Mineral Resource and subsequent update and to extrapolate between areas of limited drilling still within the mineralised trends. Many of the remaining collar positions are for historic holes that are not within the current resource areas or are inaccessible (filled in over time). For a comprehensive description of drilling information readers are referred to the JORC Table 1 declaration included in the announcement released to ASX on 11 March 2014 titled “13% Resource Expansion and Upgrade at Karoo Projects”. Proposed Exploration Programs Peninsula has prospecting rights to 7,550 square kilometres of ground. This package covers the most prospective mineralised trend that have a cumulative strike length of 23km. Peninsula intends to continue exploration over this ground using airborne radiometric data, geological mapping and prospecting together with follow up drilling with the intention of locating additional material for future mining and processing. Basis of Grade and Tonnage Range Determination With a database of 9,343 drill holes together with several thousand historic holes not yet located and entered into the database, and several decades of geological research and surface exploration, the level of exploration knowledge on which the Exploration Target is based is considered to be high. The current Karoo resources are located on two well-defined sedimentary channels that each extends for at least 100 kms along strike. These channels have, according to historic records, been tested both recently and historically by in excess of 10,000 exploration drill holes representing 1.6 million metres of drilling. Along these channels JORC (2012) Code compliant resources have been estimated in localised areas in which reliable drilling data is available. The zones between the JORC-compliant resources areas form the Exploration Target because of the following: • Continuity of the prospective sandstone established by geological mapping and regional drilling • Historic estimates of mineralisation based on drilling which has not yet been validated by Peninsula The current JORC (2012) Code compliant resource of the Ryst Kuil channel alone, which represents the most completely drilled portion of the resources, comprises 18.5mt at 1,105ppm eU3O8.
Karoo Exploration Target Additional Disclosure F
or p
erso
nal u
se o
nly

This resource tonnage is distributed over a cumulative strike length of 23km representing approximately 0.80 million tonnes/km. The Exploration Target is based on a combination of: • the total cumulative prospective strike length of the undrilled sections of the channel multiplied by the demonstrated tonnage/km, combined with, • the areas of known mineralisation for which historic estimates exists but are not included in the JORC-compliant resource • the grade range represents the lowest resource area grades and highest resource area grades Summary of the Relevant Exploration Data Available and the Nature of the Results For a comprehensive description of drilling information readers are referred to JORC Table 1 included in announcement to the ASX on 11th March 2014: 13% Resource Expansion and Upgrade at Karoo Projects. Peninsula confirms that it is not aware of any new information or data that materially affects the information included in this presentation and that all material assumptions and technical parameters underpinning the estimates continue to apply and have not materially changed. Proposed Exploration Activities Designed To Test Validity of the Exploration Target Over the next 3-5 years ongoing exploration drilling is proposed to expand the JORC (2012) Code compliant resource within the Exploration Target areas. This initial 3-5 years program will be focussed on the Eastern Sector RystKuil channel. Exploration activities will mostly comprise geophysical logging and geochemical sampling of additional drillholes, ground-based prospecting and geological mapping. Testing of the Western Sector Exploration Target, utilising the same exploration techniques, areas will commence during following 5-10 year time frame. Karoo Projects Competent Person Statement The information in this presentation that relates to Exploration Targets, Exploration Results and Exploration Potential at Peninsula’s Karoo projects is based on information compiled by Mr. George van der Walt. Mr. van der Walt is a Member of the Australian Institute of Mining and Metallurgy and is a member of a Recognised Overseas Professional Organisation included in a list promulgated by the ASX (The South African Council of Natural Scientific Professions, Geological Society of South Africa). Mr van der Walt is a Director of Geoconsult International. Mr van der Walt has sufficient experience which is relevant to the style of mineralisation and type of deposit under consideration and to the activity which they are undertaking as Competent Persons as defined in the 2012 Edition of the ‘Australasian Code for Reporting of Exploration Results, Mineral Resources and Ore Reserves’. Mr. van der Walt consents to the inclusion in the presentation of the matters based on their information in the form and context in which it appears.
Karoo Exploration Target Additional Disclosure
For
per
sona
l use
onl
y

Company Overview - Management
34
Management Corporate & USA Gus Simpson Executive Chairman
Strong strategic leader, extensive background in resources, corporate finance and management; 25 years experience in USA, Asia, Africa and Australia
Alfred Gillman Technical Director
Experienced geologist with strong exploration and resource discovery background; 35 years experience in USA, Southern Africa and Australia
Glenn Black COO, CEO South Africa
Senior management engineer; 30 years experience with De Beers in mine construction and operations in Africa
Ralph Knode CEO North America
Senior management geologist /engineer; 30 years experience with Cameco and Uranium One in ISR mine development and operation in USA, Central Asia and Australia
David Coyne Chief Financial Officer
CPA accountant and experienced mineral production CFO; 25 years cross border experience in Australia, Asia and USA
Mike Griffin VP Permitting, Regulatory and Environmental Compliance
Extensive experience in Health Physics, permitting and compliance with Cameco and Uranium One in North America, Central Asia and Australia
Mike Brost VP Geology North America
Senior uranium geologist ; 30+ years experience in uranium roll front exploration and well field planning, design and operation with US subsidiary of Cameco
Jan Fajgl VP Production Ben Schiffer - WWC Engineering Lead Permitting Consultant
Mining engineer with over 25 years experience in managing uranium field operations, mine engineering and hydrology in the Unites States, Czechoslovakia and Kazakhstan. Over 30 years operating experience in all facets of the Wyoming regulatory and permitting process www.wwcengineering.com
Brian Pile - TREC Project Manager-Design Engineers & EPC contractors for Lance
Senior construction engineer with leading US engineering firm in design and construction management of ISR facilities in North America www.treccorp.com
Team already in place to support Peninsula as a Producer
For
per
sona
l use
onl
y

Scalable Production Development
35
• Nature of ISR lends itself to scalable expansion – Lance Projects JORC Code compliant resource base (54m lbs) supports the ability to increase
rates of production quickly
– No pre-stripping or mining development is required – production wells access the ore body directly – at rate of approx. 1 well per drilling rig per day
– Processing plant comprised of separate production arrays that can be replicated at each stage
• Scalable development plan for Lance Projects based on Equity funding for revised Stage 1 production rate up to 700,000 lbs U3O8 p.a. over 2015 - 2017
• Stage 2 development plan based on debt funding and construction in H1 2017 with additional production of 500,000 lbs U3O8 p.a. over 2018 – 2020 (1,200,000lbs )
• Stage 3 development plan based on debt funding and construction in 2020 with additional production of 1,100,000 lbs U3O8 p.a. over 2021 – 2023 (2,300,000lbs)
– Development plan structured to get into production at a meaningful rate at a reduced capital investment using equity followed by debt funded expansion as market demand allows
• Market conditions will be the determining factor in rate of production increase
For
per
sona
l use
onl
y

Pro Forma Project Cash Flow
36
• Stage 1 All-in Cash Cost (AIC): $41/lb (HHG Stage 1 will reduce further); Stage 2 AIC: $30/lb; Stage 3: AIC $29/lb
• Cashflow positive in Year 2
• Project cash flows and debt fund stage 2 and 3 expansions
* Average Price per Pound Sold is based on existing contracts and expected new contracts. First delivery under existing contracts is scheduled for delivery in January 2016.
(All amounts are in NOMINAL terms) 2015 2016 2017 2018 2019 2020 2021 2022
Production ('000 lbs) 100 650 800 1,250 1,750 2,350 2,350 2,350
Average Price per Pound Sold (USD/lb) * 53 56 60 64 67 67 70
Revenue (USD'm) 0.0 35.3 46.4 70.7 110.3 172.9 165.3 163.4 All-in Operating Costs (USD'm) 0.0 (27.7) (31.6) (40.9) (59.2) (87.8) (85.1) (84.6)Initial Working Capital (USD'm) (5.0) 0.0 0.0 0.0 0.0 0.0 0.0 0.0 Operating Cashflow (USD'm) (5.0) 7.6 14.8 29.8 51.1 85.1 80.2 78.8
Stage 1 CAPEX (incl Contingency) (USD'm) (33.3)Stage 2 CAPEX (incl Contingency) (USD'm) (35.0)Stage 3 CAPEX (incl Contingency) (USD'm) (9.8) (49.8) (18.4)
Free Cash Generation (USD'm) (38.3) 7.6 (20.1) 20.0 1.2 66.7 80.2 78.8
Financing:Equity Funding (USD'm) 41.5 Debt Drawdown (USD'm) 35.0 25.0 Debt Servicing / Repayments (USD'm) (2.8) (7.6) (8.2) (28.0) (26.0)
Net Cashflow (USD'm) 3.2 7.6 12.1 12.4 18.0 38.7 54.2 78.8
The basis of the Production and Financial Information within this presentation is included in a presentation to ASX released on 27th March 2014 “Company Presentation – Mines and Money Hong Kong” Peninsula confirms that it is not aware of any new information or data that materially affects the information included in this announcement and that all material assumptions and technical parameters underpinning the production and financial information continue to apply and have not materially changed. The Company confirms that the form and context in which the Competent Person’s findings are presented have not been materially modified from the original market announcement
For
per
sona
l use
onl
y

Lance – Financial Returns
37
Key financial metrics
Unlevered NPV 8% US$288m
Cashflow positive Year 2
IRR 36%
Stage 1 CAPEX 1 US$33m
1st Quartile All-in Costs @ 2.3mlbs p.a. *US$/lb
Royalties and indirect taxes $6.28
Operating costs $11.48 Restoration and closure costs $2.07
Ongoing wellfield development costs $9.33
Total ongoing cash costs $29.16
1. Stage 1 CAPEX inclusive of 10% cost contingency; excludes OPEX and working capital during commissioning
Strong economics: IRR of 36% and average cash cost US$29.16/lb
For
per
sona
l use
onl
y

Lance – Exploration Target
• 13 historic resources • 22 roll fronts extend for a combined linear strike length of
194 miles (312km) • Exploration Target 158-217mlbs U3O8 Please note that in accordance with Clause 17 of the JORC (2012) Code, the potential quantity and grade of the ”Exploration Target” in this presentation must be considered conceptual in nature as there has been insufficient exploration to define a Mineral Resource and it is uncertain if further exploration will result in the determination of a Mineral Resource.
38
Large Resource potential: 70+ years mine life
For
per
sona
l use
onl
y

• Located in the Karoo region of RSA, approx. 400km to 600km E-NE of Cape Town
• Known uranium and molybdenum mineralised province
• 7,800 km2 over Permian sandstones
• 32,176 hectares of freehold land
• Freehold land covers majority of historic mineralisation
• Ownership: • Peninsula 74% • BEE Partners 26%
Karoo Projects Overview – Land Holding
39
High grade U3O8 & Molybdenum in proven area
For
per
sona
l use
onl
y

Karoo Projects Overview
40
Work completed to date Current & future strategy Historic Completed 2011-14 2015-18
• Drill-defined 99mlbs U3O
8 at
1,050 ppm • 9,850 holes drilled by ESSO,
Union Carbide & JCI • ESSO trial mining & FS
amenable to open-pit and/or decline mining
• Numerous drill tested uranium occurrences requiring follow-up
• Numerous un-tested surface uranium occurrences
• 7,800km2 of Permian Sedimentary Sequences
• 1,245 holes re-probed or drilled by Peninsula for QAQC and JORC resource estimate
• 746 RC and diamond twin and exploration holes completed
• 499 total historic holes re-probed for JORC resource estimate
• 250-350mlbs U3O
8Exploration
Target • Positive Scoping study
completed • Feasibility study Q4 2013 start • JORC compliant resource of
57mlbs U3O
8
• High grade 1,040 ppm
• 7,800km2 of Permian Sedimentary Sequences • PFS/DFS 2014-2016 • Reserve conversion drilling • Project funding 2016/2017 • Development planned for 2017/2018 • Further 42mlbs historic mineralisation to be
QAQC audited • 250-350mlbs U
3O
8 Exploration Target
• Numerous drill tested uranium occurrences requiring follow-up
• Numerous un-tested uranium occurrences
High grade near surface mineralisation
Please note that in accordance with Clause 17 of the JORC (2012) Code, the potential quantity and grade of the ”Exploration Target” in this presentation must be considered conceptual in nature as there has been insufficient exploration to define a Mineral Resource and it is uncertain if further exploration will result in the determination of a Mineral Resource.
For
per
sona
l use
onl
y

Investment Highlights
• Project funding fully committed and secured
• Peninsula will be the ASX’s next uranium producer
• The Company has a low risk, clear path to production
• Significant operating margins achievable even at the current uranium price
• Strong financial support from first-tier shareholder base
• Karoo offers second production centre and diversity of supply and jurisdiction
• Tightening supply and new demand expected to lift the whole uranium sector
• Peninsula’s commencement of production in 2015 will result in a strong re-rating of share price
41
Major sector re-rating expected due uranium supply contraction combined with increased new demand and utility contracting.
Peninsula re-rating due to commencement of production 2015
For
per
sona
l use
onl
y

Uranium Demand - Outlook
42
Global Operating Nuclear Capacity (GW gross, end of period)
353 347 344 351 368 385 398 410 419 429 437 445 456 471 483504 520
544563 580
050
100150200250300350400450500550600650
2011
A
2012
A
2013
A
2014
E
2015
E
2016
E
2017
E
2018
E
2019
E
2020
E
2021
E
2022
E
2023
E
2024
E
2025
E
2026
E
2027
E
2028
E
2029
E
2030
E
Glob
al O
pera
ting
Nuc
lear
Cap
acity
(GW
)
China India Russia Japan Korea USA France Middle East/Africa Rest of World
Today
Source: UxC, WNA, IAEA, NIW, Raymond James Ltd.
For
per
sona
l use
onl
y

Appendix 1 - Lance JORC Resource
43
Classification Tonnes Grade (ppm U3O8)
eU3O8 (lbs)
Mineability factor
eU3O8 (lbs)
Recovery factor
Recovered U3O8 (lbs)
50.4%
Measured 4,142,950 495 4,520,159 0.8 3,616,128 0.8 2,892,902
Indicated 11,532,135 497 12,640,951 0.8 10,112,761 0.8 8,090,209
M+Ind 15,675,085 497 17,161,110 0.8 13,728,888 10,983,111
Inferred 35,478,033 467 36,513,114 0.6 21,907,868 0.8 17,526,295
Total 51,153,119 476 53,674,224 35,636,757 28,509,405
ISR Reserves are determined after well field development drilling
¹JORC Table 1 included in an announcement to the ASX released on 27th March 2014:”Company Presentation – Mines and Money Hong Kong”. Peninsula confirms that it is not aware of any new information or data that materially affects the information included in this announcement and that all material assumptions and technical parameters underpinning the estimates continue to apply and have not materially changed. The Company confirms that the form and context in which the Competent Person’s findings are presented have not been materially modified from the original market announcement.
For
per
sona
l use
onl
y

JORC compliant Resource March 2014 Large resource potential – 100+ year mine life
Appendix 2 - Karoo JORC Resource
44
Note: Totals may not sum exactly due to rounding.
Classification Sector eU3O8 (ppm) CUT-OFF
Tonnes (million)
eU3O8 (ppm)
eU3O8 (million lbs)
Indicated Eastern 600 7.1 1,206 18.7
Western 600 0.9 1,657 3.2
Inferred Eastern 600 11.8 1,046 27.2
Western 600 3.5 1,019 7.8
Total 600 23.3 1,108 56.9
Classification eU3O8 (ppm) CUT-OFF
Tonnes (million)
eU3O8 (ppm)
eU3O8 (million lbs)
Indicated 600 8 1,242 21.9
Inferred 600 15.3 1,038 35
Total 600 23.3 1,108 56.9
²JORC Table 1 included in announcement to the ASX released on 11th March 2014 :”13% Resource Expansion and Upgrade at Karoo Projects”. Peninsula confirms that it is not aware of any new information or data that materially affects the information included in this presentation and that all material assumptions and technical parameters underpinning the estimates continue to apply and have not materially changed.
For
per
sona
l use
onl
y