for personal use only cleanaway waste management limited...streams, including general waste,...
TRANSCRIPT

Cleanaway Waste Management LimitedAustralia’s leading total waste management services company
Macquarie Securities 2016 Australia Conference
Presentation byVik Bansal
Managing Director and CEO
Making a sustainable future possible
For
per
sona
l use
onl
y

25 Recycling sites
Cleanaway is Australia’s leading total waste management services company, with operations across the country in solid and liquid waste and industrial services
2
~2,500 Heavy Duty vehicles8 Operational landfills
15 Transfer stations
Approximately 200 solids, liquids and industrial services depots
across the country
Over 100,000 customers
For
per
sona
l use
onl
y

3
We are a financially strong, diversified business working in a good sector with excellent market positions
1H16 Net External Revenue
59%9%
32%
Solids -Collections
Solids - Post Collections
Liquids and Industrial Services
Australian Industry Position
Cleanaway is Australia’s Largest:
Collector of Commercial & Industrial Waste Collector of Municipal Waste Collector and processor of waste oil Collector and processor of hazardous and
non-hazardous liquid waste Provider of environmental industrial services
Cleanaway has Australia’s second largest:
Network of landfill and transfer stations
Financial Summary (A$m)
1H16 FY15
Total net external revenue 746.8 1,384.9
Underlying EBITDA 137.2 231.3
Underlying net profit after tax 29.0 45.7
Net Debt/Underlying EBITDA (times) 1.32x 1.36x
For
per
sona
l use
onl
y

And one of the largest waste management companies in the world
4
Source: 2016 Plimsoll Global Analysis and Company estimates
For
per
sona
l use
onl
y

Characteristics of the Australian Waste Industry
High marginal contribution
Recurring revenue• Momentum business with multi-year contracts – customers generally
accepting annual price increases
• Network economics are ‘king’
• End to end route density and profitability critical to understand
Variability in local dynamics
• Revenue, costs and competitive dynamics are significantly different market by market
Mix of ‘2 worlds’
• Large enterprise-level selling juxtaposed against mass market, consumer-like selling
‘Utility-like’ spend category
• Low share of mind category —little incentive for customers to leave
• Key is to maintain steady customer service & satisfaction levels
For
per
sona
l use
onl
y

Our operating model is centred around these sources of value
6
Infrastructure Engineering & Compliance
Fleet & Network Performance
Growth & Marketing
Solids
MetroC&I / C&D
RegionalMetro Muni
Resource Recovery
Landfill
Waste to Energy
Liquids & Hazardous
Waste
Hydrocarbons
Collections
Post-collections and conversions
Val
ue
Ch
ain
Ente
rpri
se S
ervi
ces
Co
rpo
rate
Commodities/Trading
Liquids & Industrial Services
Industrial Services &
Remediation
Customers
For
per
sona
l use
onl
y
7
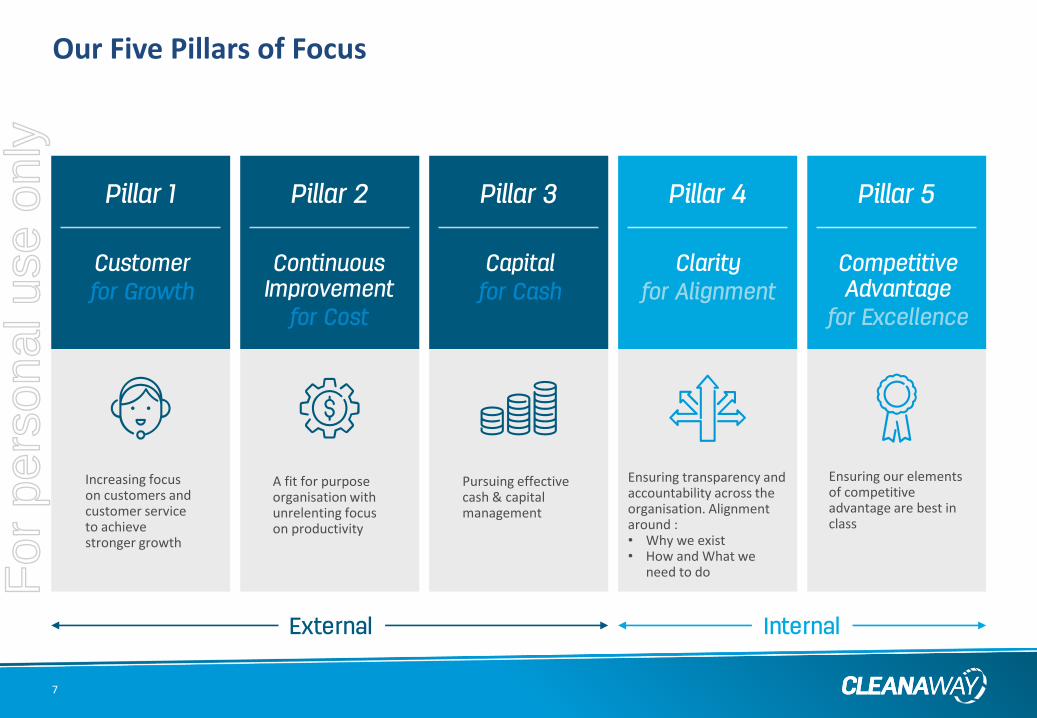
Increasing focuson customers and customer service to achieve stronger growth
A fit for purpose organisation with unrelenting focus on productivity
Pursuing effective cash & capital management
Ensuring transparency and accountability across the organisation. Alignment around :• Why we exist• How and What we
need to do
Ensuring our elements of competitive advantage are best in class
Our Five Pillars of FocusF
or p
erso
nal u
se o
nly

8
Customers for Growth
The rollout of our Sales Capability & Growth related initiatives are accelerating
• ONE Company – ONE Brand launched in February 2016• Building capabilities in our front line sales force• Clarity on sales channels and segmentation with alignment of sales force • Maximising route density via targeted campaigns• Telesales and Save Desk
1 2 3 4 5 6 7
Years
Pricin
g
Importance of churn management• Over 100,000 Commercial & Industrial customers• On average ~14,000 customers per annum subject to churn• Save desk limits churn, pricing and margin decline
Years1 2 3 4 5 6 7
Pricin
g
Margin sweet spot
Years1 2 3 4 5 6 7
Pricin
g
8 9
Margin sweet spot
For
per
sona
l use
onl
y

9
Continuous improvement for cost
Our cost reduction program is on schedule
• As committed, initiatives in place to permanently reduce the cost base
– Fit for purpose organisation – decentralised but standardised on key elements
– Delayered Organisation - Empowered and accountable
– Systems led improvement e.g. Fleet Management, Procurement
– Productivity – labour, non-labour and depot rationalisation
• In FY16 net impact immaterial as cost savings achieved are re-invested in growth and other initiatives
• By June 2017, initiatives will generate $30 million in permanent cost reductions
For
per
sona
l use
onl
y
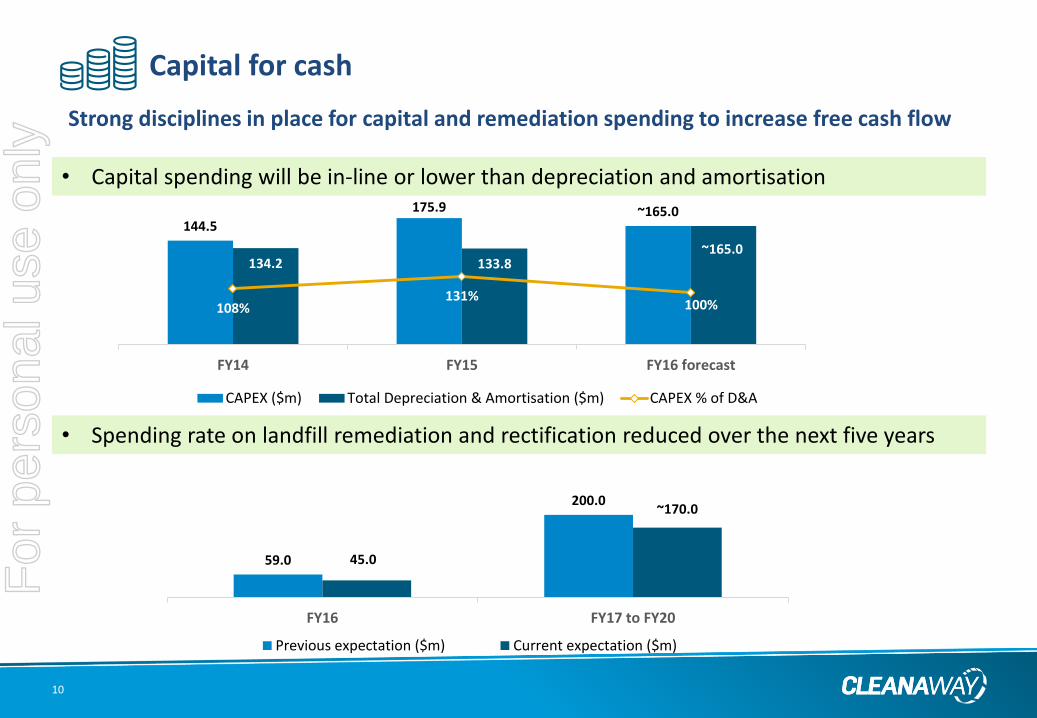
10
Strong disciplines in place for capital and remediation spending to increase free cash flow
• Capital spending will be in-line or lower than depreciation and amortisation
144.5
175.9 ~165.0
134.2 133.8~165.0
108%131%
100%
FY14 FY15 FY16 forecast
CAPEX ($m) Total Depreciation & Amortisation ($m) CAPEX % of D&A
Capital for cash
• Spending rate on landfill remediation and rectification reduced over the next five years
59.0
200.0
45.0
~170.0
FY16 FY17 to FY20
Previous expectation ($m) Current expectation ($m)
For
per
sona
l use
onl
y

11
Planning application – Melbourne Regional Landfill
• Based on expected fill rates, the Melbourne Regional Landfill facility is currently licenced for the next 7 to 10 years
• An application to extend licence for an additional 30 years was lodged with the Melton City Council and the Victorian EPA in February 2016
• As the asset is considered “state important” in Victoria’s waste policy, the planning application will now be assessed and determined by the Victorian Planning Minister
• Considering the extensive engineering and environmental work done by our engineers prior to the application being lodged, we remain confident that an extension will be granted
For
per
sona
l use
onl
y

Cleanaway Waste Management LimitedAustralia’s leading total waste management services company
For
per
sona
l use
onl
y

Cleanaway Waste Management LimitedAppendices
For
per
sona
l use
onl
y

Appendix: Solids division
Solid - Collections1H16 2H15 1H15 FY15
Net external revenue 393.2 372.0 383.8 755.8
EBITDA 74.1 64.8 73.4 138.2
Margin (%) 18.8% 17.4% 19.1% 18.3%
EBIT 43.6 35.5 45.5 81.0
Margin (%) 11.1% 9.5% 11.9% 10.7%
Solid – Post Collections1H16 2H15 1H15 FY15
Net external revenue ** 57.8 48.0 38.9 86.9
EBITDA 43.4 37.0 22.8 59.8
Margin (%) 75.1% 77.1% 58.6% 68.8%
EBIT 11.9 13.0 5.0 18.0
Margin (%) 20.6% 27.1% 12.9% 20.7%
** Excludes levies and carbon tax
Commercial and industrial (“C&I”), municipal and
residential collection services for all types of solid waste
streams, including general waste, recyclables, construction
and demolition waste and medical and washroom services
as well as resource recovery and recycling facilities,
commodities trading and secure product destruction and
quarantine treatment operations
Ownership and management of waste transfer stations and
landfills
For
per
sona
l use
onl
y

Appendix: Liquids and Industrial Services division
Liquids and Industrial Services1H16 2H15 1H15 FY15
Net external revenue 211.4 216.8 229.1 445.9
EBITDA 26.8 24.0 31.8 55.8
Margin (%) 12.7% 11.1% 13.9% 12.5%
EBIT 14.7 11.9 17.0 28.9
Margin (%) 7.0% 5.5% 7.4% 6.5%
Collection, treatment, processing, refining and recycling of
liquid and hazardous waste, including hydrocarbons for
disposal or re-sale, cleaning, vacuum tanker loading, site
remediation, sludge management, concrete remediation,
CCTV, corrosion protection and emergency response
services
For
per
sona
l use
onl
y

Appendix: Capital Structure – Debt
16
• At 31 December 2015 the Group had $244 million of headroom under the syndicated banking facilities.
• Average debt maturity at 31 December 2015 is 3.1 years (pcp: 4.3 years)
• Debt maturity now extended to 4.0 years following facility extensions to 2019 and 2020 on 5 January 2016.
A$ million 31 Dec 15 30 Jun 15 31 Dec 14
Current interest bearing liabilities 0.7 0.7 1.8
Non current interest bearing liabilities 359.7 351.0 162.7
Gross Debt 360.4 351.7 164.5
Cash and cash equivalents (35.3) (37.0) (41.1)
Net Debt/(cash) 325.1 314.7 123.4
Key Finance Measures – Net Debt Comprises Key Points
0
50
100
150
200
250
300
350
Dec-15 Jun-16 Dec-16 Jun-17 Dec-17 Jun-18 Dec-18 Jun-19 Dec-19 Jun-20
Funding Facility Maturity Profile ($m)
Bank Facility Drawn Bank Facility Available USPP
61
74130 165
170
54
135*
54
130**
335**
* The Working Capital drawn mainly comprises bank guarantee** Facilities extended to July-19 and July-20 on 5 January 2015
For
per
sona
l use
onl
y