for personal use only - australian securities exchangedrilling was advancing in parallel with a...
TRANSCRIPT

Annual Report 2013
ABN 91 124 752 745
For
per
sona
l use
onl
y

Contents
Chairman’s Report 1
2013 Highlights Summary 2
Review of Operations 3-26
Sustainable Development 27
Tenement Schedule 28
Corporate Governance Statement 29-33
Directors’ Report 34-40
Auditor’s Independence Declaration 41
Consolidated Statement of Comprehensive Income 42
Consolidated Statement of Financial Position 43
Consolidated Statement of Changes in Equity 44
Consolidated Statement of Cash Flows 45
Notes to the Financial Statements 46-67
Directors’ Declaration 68
Independent Auditor’s Report 69-70
ASX Additional Information 71-72
Corporate Directory 73
For
per
sona
l use
onl
y
GBM Resources Annual Report 2013 1
Chairman’s Report
Dear Fellow Shareholders,
GBM Resources Limited underwent significant change over the last 12 months as we completed a strategic review of our operations to better position the company for growth through project development, and to preserve and grow shareholder value in a challenging market.
With backing from our major Singaporean shareholders, the Company commenced a review for near-term gold production acquisition opportunities in the region with the objective of becoming a low-cost gold producer and to take advantage of the strong growth potential of South East Asia.
Acquiring 40% of Angka Alamjaya Sdn Bhd (AASB), which holds the Lubuk Mandi Gold Mine in Peninsular Malaysia, for 15% of GBM shares, in August this year, offers the Company potential for early cashflow from the re-treatment of tailings before moving to hard rock mining.
Commissioning a processing plant at the Lubuk Mandi Gold Mine and production of gold concentrate could occur as early as March 2014. Both parties also intend to complete an Initial Public Offering of AASB on the Singapore Stock Exchange during 2014.
This strategic review also enabled us to implement major expenditure reduction initiatives across the operations. The Company has focussed its priorities on:
n Continue field programmes on the Mount Morgan Gold-Copper Project, targeting the Sandy Creek, Smelter Return and Oaky Creek prospects to progress them as drill ready targets this year.
n Drilling of priority prospects including Bronzewing Bore (Bungalien Project) and the Mount Margaret West Project within the farm-in Joint Venture area. GBM has secured an approved $2.5 million budget, for the 12 months to 31 March 2014, on the farm-in projects with Japanese trading house partners, Pan Pacific Copper Co. Ltd. and Mitsui & Co.
n Continue to investigate funding opportunities to progress the Pre-Feasibility Studies for the Milo IOCG-REE Project.
n Major expenditure reduction initiatives implemented which achieved further annualised savings of $600,000. This includes salary reductions for executive directors, senior staff and reductions in other external service costs, so as to prioritise exploration expenditure.
The Board and management believes it is important to ensure that it is taking all possible steps to preserve shareholder value and believe we are well positioned to fast-track to production and grow our asset base and to deliver shareholders long-term value creation.
On behalf of the Board, I would like to acknowledge and thank our shareholders for their support during this pivotal year for the Company.
We look forward to sharing further updates on the progress of our development plans during the year ahead.
Peter Thompson Executive Chairman
For
per
sona
l use
onl
y

2 GBM Resources Annual Report 2013
2013 Highlights Summary
The Company completed a strategic assessment of its activities during the year and commenced a review for near-term gold production acquisition opportunities with the objective of becoming a low-cost gold producer and to take advantage of the strong growth potential of South East Asia.
This resulted in the Company acquiring 40% of Lubuk Mandi Gold Mine in Peninsular Malaysia with Angka Alamjaya Sdn Bhd (AASB), which holds the project, for 15% of GBM shares in August this year. The Lubuk Mandi Gold project offers the potential for early production by the re-treatment of tailings, progressing to hard rock mining.
A zero harm record in safety and environment during 2013 is in line with the Company’s zero harm policy, and is a record that the management and board of GBM are rightly proud of. We continue to improve our safety and environmental management systems while exploring efficiently, aiming to discover and develop projects in the shortest possible timeframe.
Exploration highlights for the 2013 financial year included:
n Zero LTI’s and Environmental incidents during the year.
n Acquisition of a 40% stake in the Lubuk Mandi gold project in Malaysia.
n Completion of a development plan for Lubuk Mandi showing an exploration target of up to 440,000 ounces of gold** and potential for early cashflow from tailings retreatment.
n Positive scoping study completed for the polymetallic Milo IOCG-REEY deposit.
n Maiden CuEq resource announced for the Milo Project.
n Discovery of copper mineralization associated with an altered hydrothermal breccia at Oakey Creek in the Mount Morgan Project area.
n Intersection of anomalous copper mineralization in the first scout hole in the Mount Margaret Project area near Cloncurry.
Pan Pacific Copper and Mitsui JV representatives in the field with GBM exploration staff.
For
per
sona
l use
onl
y

GBM Resources Annual Report 2013 3
Review of Operations
1.0 Exploration Strategy
Corporate GoalGBM is focused on delivery of shareholder value through discovery or acquisition and development of world class gold and copper deposits. The company is determined to achieve this in a safe and responsible manner with the highest regard for the environment and communities in which we work.
Exploration strategySince listing in October 2007, GBM’s Board has maintained a constant focus on creating shareholder wealth through discovery and development of world class gold and copper gold deposits. During the past twelve months the Board, recognising the continued strength of gold as a commodity and changing economic climate for exploration companies, has further honed the focus on gold. Long term forecasts for price and demand of both primary target commodities copper and gold remain sound at a time when other commodities are forecast to be approaching oversupply and prices are falling. As a result the company has identified and proceeded to acquire a significant stake in a near production gold asset in an exciting and under-explored gold province, the Lubuk Mandi Gold Project in Peninsular Malaysia. At the time of writing, resource drilling was advancing in parallel with a pre-feasibility study to treat mine tailings from previous operations, and to test extensions to gold mineralisation which yielded over 100,000 ounces in previous open pit mining.
The Board also recognise that during the exploration process, mineralisation enriched in other commodities may also be identified providing further opportunities to add additional shareholder value. This was highlighted last year with the implementation of a scoping study covering the Milo IOCG REE deposit in Queensland. The results of this study are summarised later in this report. Further opportunities identified include extensive REE mineralisation associated with the Milo IOCG system, significant tungsten and molybdenum intersections at the Yea project, extensive graphite occurrences in the Mount Margaret Project north of Cloncurry and Phosphate at the Bungalien Project south of Mt Isa.
GBM is committed to continuing to actively pursue discovery and development as the means to create shareholder value. Despite challenging market conditions, the company has succeeded in maintaining exploration and development activity at a high level as part of maximising the potential for near term discovery (see Figure 2).
The current downturn in mineral exploration has, and will continue to result in a range of exploration and development opportunities emerging for companies positioned to take advantage of adverse market conditions. The Board annually reviews the key drivers
of exploration success for GBM. The Board believes that the eight points listed below are fundamental to ensuring continued success in discovering new economic mineral deposits.
These key drivers are outlined as follows:
Identifying opportunities for early production and cashflow in deposits with potential for major resource growth.
Acquisition of a significant interest in the Lubuk Mandi Gold Project in the under-explored Eastern Gold Belt of Peninsular Malaysia is only the first step in this process. Current difficult conditions for explorers may present further opportunities for those with access to funding.
Focus on the discovery of world class gold and copper gold deposits.
Targeting mineralisation styles capable of delivering large deposits in commodities with sound historical and projected demand.
Discovery of a new deposit(s) is the key to adding significant value to shareholders.
Recently acquired interests in an emerging gold province compliment previous success in our current exploration assets. GBM is well on the way to achieving this outcome.
Competent, rapid and cost effective evaluation of discoveries.
Ensuring that evaluation of discoveries is cost effective and timely is essential to unlock value for shareholders in the most favourable timeframe.
Applying a systems approach to mineral exploration.
The importance of this approach, in ‘seeing what others have not’, cannot be emphasised too strongly. In many instances previous exploration has focussed on small scale prospect level evaluation and failed to understand the broader geological environment or system. This is essential to determine the likelihood of major deposits occurring, and provide vectors to their location and style.
Exploring in regions with historic production offers a higher probability of new discovery.
Exploration success in recent decades has been strongly biased to regions with an established mining history. GBM’s current projects lie in such regions or areas where recent geological interpretation indicates an extension of known mineral provinces. Our focus to date has been toward regions which, apart from being highly prospective from a mineral exploration perspective, offer the opportunity to acquire quality tenure in areas with good infrastructure and access to an experienced workforce.
For
per
sona
l use
onl
y

4 GBM Resources Annual Report 2013
Review of Operations
Strengthen GBM’s executive and technical capabilities.
Our technical team, along with a group of specialist consultants, form the core of GBM’s business and is essential for successful mineral exploration. The Board believes that highly experienced and highly motivated people are the cornerstone for successful exploration and will be vital in realising GBM’s development and growth plans in the coming years. The intellectual capacity to identify opportunities to apply new technology in exploration, mining and processing will provide GBM with sound growth options.
Maximising in-ground exploration expenditure.
GBM continues to operate from a small exploration base in regional Victoria, minimising company overheads.
2.0 Introduction
GBM listed on the ASX in 2007 and now holds an extensive portfolio of mineral exploration tenements including licences and applications covering an area of
greater than 5,176 square kilometres in project areas in Queensland and Victoria. Exploration remains focussed on the discovery of significant gold and copper-gold deposits. The combination of location in prospective mineral provinces, high quality targets, innovative technology and a high level of exploration activity, provide GBM with excellent prospects for the discovery of one or more world class deposits within this high quality tenement package.
The acquisition of a 40% stake in the Lubuk Mandi Gold Project in Peninsular Malaysia re-enforces GBM’s commitment to development and early production, and also marks a willingness to move outside Australia when the right opportunity is identified.
The completion of a revised resource, including a copper-uranium-molybdenite resource, and a positive scoping study for the Milo IOCG REE Project was a major milestone for the company. Based on the assumptions made in this study, which was released to ASX on 22 November 2012, Milo has the potential to generate pre tax between $701M (base case) to $1,160M (upside case) net cashflow after capital.
Figure 1: GBM Resources Project Locations.
For
per
sona
l use
onl
y

GBM Resources Annual Report 2013 5
3.0 Exploration Expenditure and Assets
In the year to 30 June 2013, GBM has completed drilling programs in Queensland on the FC4S prospect (Mt Margaret), Bronzewing Bore and Boomerang Bore prospects (Bungalien), Chumvale prospect (Brightlands) along with the completion of a scout drill hole on the Landing Ground prospect (Grassy Bore) which commenced in June 2012. A total of 5 diamond drillholes, 3 reverse circulation drill holes, 2 reverse circulation pre-collared diamond holes and 2 diamond holes with rotary mud pre-collar have been completed for totals of 414 metres of RC, 4,408metres of diamond core and 228 metres of rotary mud respectively.
Soil sampling has been completed at the Milo South prospect (Brightlands), Smelter Return and Oakey Creek prospects (Mt Morgan), Malbon2 prospect (EPM 18208), FC2 and FC12 prospects (Mt Margaret) and Anomalies E, B, H, I, D, G and F in the Willaura region for a total of 1,014 soil samples and 3001 MMI samples. Rock chip sampling was undertaken at Oakey Creek and Smelter Return for a total of 199 rock chip samples. A significant database relating to these tenements continues to grow as new tenements are acquired and data becomes available.
Total exploration expenditure on the Company’s tenements for 2013 was $5.8 million (including $3.5 million of farm-in funding) compared to a total of $6.9 million in the 2012 financial year. GBM’s exploration budget has maintained a growth trend since listing – reflecting the strength of GBM’s exploration targets. During 2013, activity has seen significant advancement of the Milo project, stronger focus on gold and continued strong support from our farm-in partners in other projects in the Cloncurry Region under the $55m exploration ‘Farm-in’ Agreement between GBM and the Japanese companies Pan Pacific Copper and Mitsui Corporation.
GBM’s portfolio of mineral exploration assets includes two inferred resources; the Milo IOCG REEYU Project with 187Mt containing 113,000t of REEYO and the
Malmsbury Gold Project with 800,000t containing over 100,000 ounces of Au. In addition a number of prospects are essentially ready for drilling with well defined targets based on geology, geochemistry and geophysics suggesting that further resource additions are likely.
GBM’s exploration portfolio has evolved significantly this year with further progress from targets that are essentially at conceptual or geological stage to those with strong results or resources moving closer to development. In addition, geological and geochemical data collected in the Milo area support the existence of a large mineralising system with potential to host significant additional resources. The Company remains committed to maximising the ‘in-ground’ component of its exploration funding as a means of increasing the likelihood of further resource additions.
Drilling of tailings dam at Lubuk Mandi in Malaysia.
Figure 2: GBM annual exploration summary.
For
per
sona
l use
onl
y

6 GBM Resources Annual Report 2013
Review of Operations
4.0 Lubuk Mandi Gold Mine Malaysia
GBM announced on 11 June 2013 that it had entered a binding agreement to acquire a 40% interest in Anka Alamjaya Sdn Bhd, a sole purpose Malaysian company which owns mining rights to the Lubuk Mandi Gold Project in Malaysia. This agreement was ratified at a meeting of GBM shareholders on 22 July 2013. Lubuk Mandi is located approximately 2 kilometres from the coast near Kuala Terengganu in Terengganu State, Peninsular Malaysia. Malaysia has a long history of mining, a skilled workforce and stable government.
The Lubuk Mandi Gold Mine operated as an open cut mine between 1993 and 1999 with recorded production of 108,000 ounces of gold. While gold has been known in Terengganu for centuries, alluvial mining at Lubuk Mandi appears to have only commenced in 1989, and virtually no modern exploration for gold has been conducted in this region which is now recognised as part of a new gold belt in Malaysia. Following completion of a due diligence study and compilation of a Project Development Plan in May, GBM has identified three main exploration targets**:
n Tailings dams containing a target of between 1Mt at 0.7 g/t Au containing 23,000 ounces of gold and 1.4Mt at 0.9 g/t Au containing 38,000 ounces of gold.
n Main Zone hosting a target of between 370,000 t averaging 2.9 g/t Au containing 35,000 ounces of gold and 1,100,000 t averaging 3.6 g/t Au containing 127,000 ounces of gold.
n East Zone target of between 1,440,000 t averaging 2.5 g/t Au containing 116,000 ounces of gold and 2,400,000 t averaging 3.6 g/t Au containing 280,000 ounces of gold.
Dendritic native gold in quartz from Lubuk Mandi. Sample M446 (field of view approx 5mm)
Henney et al 1994 pp33, Characterisation of Gold from Lubuk Mandi, British Geological Survey
Technical Report WC94021.Figure 4: Lubuk Mandi mine layout plan
showing exploration target locations.
Figure 3: satellite image of current day Lubuk Mandi Mine Site showing lease outlines in red.
For
per
sona
l use
onl
y

GBM Resources Annual Report 2013 7
Based on a review of available data, the potential early route to gold production from Lubuk Mandi is through retreatment of tailings followed by recommencement of hardrock mining should resources and reserves be defined though appropriate testing programmes. A preliminary exploration and resource definition programme has been designed and budgeted for all three potential ore sources.
Review of available information has allowed a conceptual process flowchart for tailings treatment to be developed. If confirmed by metallurgical testwork, this would involve reclaim of tailings from the tailings storage facility on site, regrinding, flotation and sale of concentrate for final gold production.
At the time of writing drilling and metallurgical testwork on the tailings dam was in progress.
**It should be noted that this is an exploration target only, potential quantity and grade is conceptual in nature, there has been insufficient exploration to define an Mineral Resource and it is uncertain if further exploration will result in the determination of a Mineral Resource.
5.0 Milo IOCG REE Project
The Milo Project on Brightlands EPM14416 is located due east of Mount Isa, and just 20 kilometres west of Cloncurry on the Barkley Highway, far northwest Queensland.
The mineralization is hosted in a northwest striking, highly brecciated and altered rock coincident with magnetic highs within a broader magnetic low anomaly that has been interpreted as a possible buried granite source for the IOCG & REE mineralisation. The REE and yttrium mineralisation (REEY) appears to overprint and envelope the IOCG style Cu-Au-Ag-Mo-U-Co mineralisation. Drilling shows that the mineralization dips steeply to the east, is possibly fault related, and that higher grade copper mineralization plunges to the north. The mineralization at Milo is considered to be closely linked to the Cloncurry Flexure, a deep structural feature in the region.
A total of 32 drillholes have been drilled on Milo so far, with each phase of drilling extending the main resource to the north and south. The drilling has delineated continuous Cu and REE mineralization over a strike length of 1 kilometre and up to 200 metres wide. The resource is still open-ended to the north, south and at depth.
Figure 5: Milo conceptual pit outline over soil geochemistry highlighting the location of additional high priority target area to the west of the known deposit.
For
per
sona
l use
onl
y

8 GBM Resources Annual Report 2013
Review of Operations
The drilling program intersected some high grade Cu mineralisation including 2 metres @ 6.19% Cu at 163 metres downhole in MIL015, one of the most southern drilled holes.
A total of 1594 soil samples and 295 rock samples have been collected on the Milo prospect to date. From the data collected it is possible that the total strike length of the Milo mineralisation could extend for up to two kilometres.
Soil sampling identified a number of soil geochemical anomalies within the Milo Prospect area. A number of parallel zones of coincident Cu-Au-La soil anomalism have been defined adjacent to drillhole BTD014 where peak downhole grades of 4,550 ppm Cu, 650ppm La, and 0.7 ppm Au were returned. It is likely that these anomalous zones will extend further with additional soil sampling, that they may be structurally related, and that drill testing may discover new mineralisation. Additionally, there is a large Cu-La soil geochemical anomaly west of the Milo prospect that returned peak assay results of 1.44% Cu, 0.35 ppm Au, and 120 ppm La that is associated with a coincident strong magnetic and topographic high.
The Milo mineralisation is still open-ended to the north, south and at depth. Further soil sampling and follow-up drilling will be required to determine the extent of mineralization.
Milo Scoping StudyThe in-depth study released by GBM in November 2012 highlighted that Milo has the potential to become a mid-tier producer of rare earth oxide products with key credits for copper, phosphate and uranium. Average annual production of key commodities is estimated to be: 3,500t of TREEYO products, 5,300t of copper, 173,000t of phosphate P205 (35%) and 927,000 lbs. of uranium U3O8.
Key outcomes of the scoping study are:
n A maiden Cu-equivalent inferred JORC resource estimate of 88 million tonnes containing around 97,000 tonnes of Cu and 14 million pounds of uranium oxide
n A TREEYO inferred JORC resource of 176 million tonnes @ 620ppm and 0.75% P2O5
n A long term net cash flow of between A$701 million – A$1,160 million over an 11 year mine life.
n Mining will be a low cost conventional open-cut with a crushing rate of 10 Mtpa and onsite processing
n Concentrates will be railed to Townsville and a scenario is that the REE concentrate can be further processed in Townsville to produce 99% pure REOs
n 100% GBM owner/operator and funded
Uranium is a significant credit for the Milo Project, and the announcement by the Queensland Government that it is moving to allow the recommencement of uranium mining in that State is very significant for the project.
Figure 6: Proposed Mine layout for Milo Project.
For
per
sona
l use
onl
y
GBM Resources Annual Report 2013 9
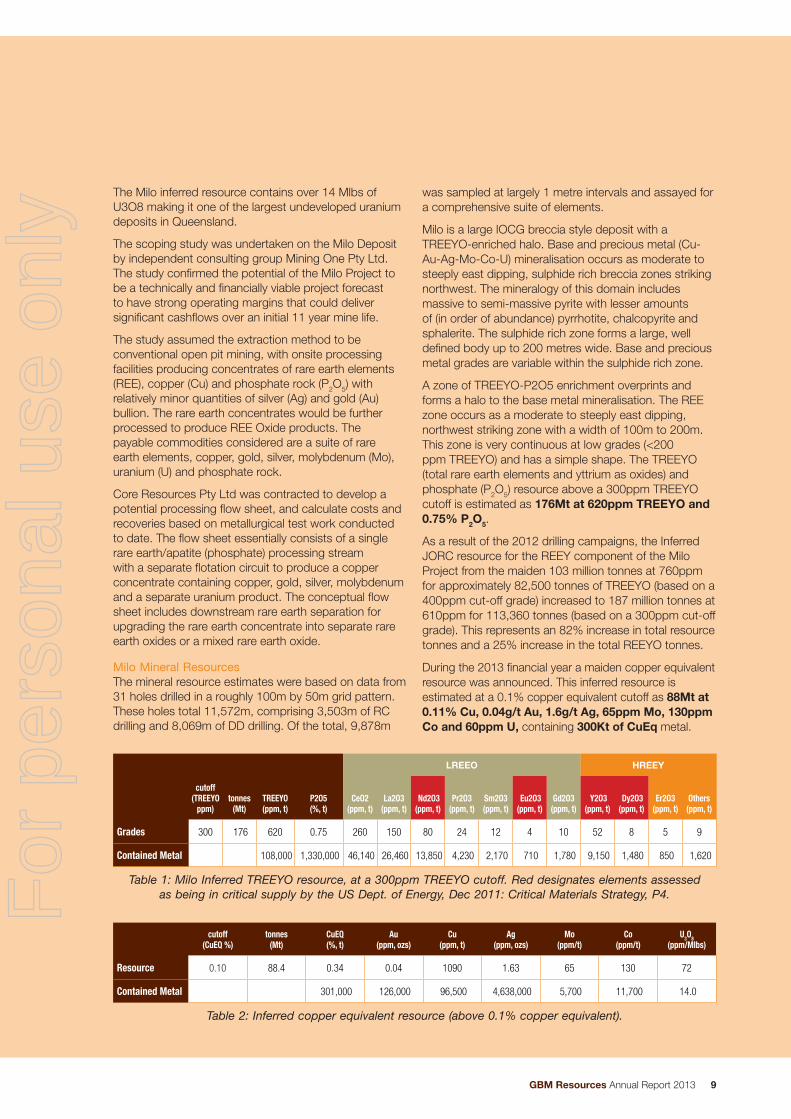
The Milo inferred resource contains over 14 Mlbs of U3O8 making it one of the largest undeveloped uranium deposits in Queensland.
The scoping study was undertaken on the Milo Deposit by independent consulting group Mining One Pty Ltd. The study confirmed the potential of the Milo Project to be a technically and financially viable project forecast to have strong operating margins that could deliver significant cashflows over an initial 11 year mine life.
The study assumed the extraction method to be conventional open pit mining, with onsite processing facilities producing concentrates of rare earth elements (REE), copper (Cu) and phosphate rock (P2O5) with relatively minor quantities of silver (Ag) and gold (Au) bullion. The rare earth concentrates would be further processed to produce REE Oxide products. The payable commodities considered are a suite of rare earth elements, copper, gold, silver, molybdenum (Mo), uranium (U) and phosphate rock.
Core Resources Pty Ltd was contracted to develop a potential processing flow sheet, and calculate costs and recoveries based on metallurgical test work conducted to date. The flow sheet essentially consists of a single rare earth/apatite (phosphate) processing stream with a separate flotation circuit to produce a copper concentrate containing copper, gold, silver, molybdenum and a separate uranium product. The conceptual flow sheet includes downstream rare earth separation for upgrading the rare earth concentrate into separate rare earth oxides or a mixed rare earth oxide.
Milo Mineral ResourcesThe mineral resource estimates were based on data from 31 holes drilled in a roughly 100m by 50m grid pattern. These holes total 11,572m, comprising 3,503m of RC drilling and 8,069m of DD drilling. Of the total, 9,878m
was sampled at largely 1 metre intervals and assayed for a comprehensive suite of elements.
Milo is a large IOCG breccia style deposit with a TREEYO-enriched halo. Base and precious metal (Cu-Au-Ag-Mo-Co-U) mineralisation occurs as moderate to steeply east dipping, sulphide rich breccia zones striking northwest. The mineralogy of this domain includes massive to semi-massive pyrite with lesser amounts of (in order of abundance) pyrrhotite, chalcopyrite and sphalerite. The sulphide rich zone forms a large, well defined body up to 200 metres wide. Base and precious metal grades are variable within the sulphide rich zone.
A zone of TREEYO-P2O5 enrichment overprints and forms a halo to the base metal mineralisation. The REE zone occurs as a moderate to steeply east dipping, northwest striking zone with a width of 100m to 200m. This zone is very continuous at low grades (<200 ppm TREEYO) and has a simple shape. The TREEYO (total rare earth elements and yttrium as oxides) and phosphate (P2O5) resource above a 300ppm TREEYO cutoff is estimated as 176Mt at 620ppm TREEYO and 0.75% P2O5.
As a result of the 2012 drilling campaigns, the Inferred JORC resource for the REEY component of the Milo Project from the maiden 103 million tonnes at 760ppm for approximately 82,500 tonnes of TREEYO (based on a 400ppm cut-off grade) increased to 187 million tonnes at 610ppm for 113,360 tonnes (based on a 300ppm cut-off grade). This represents an 82% increase in total resource tonnes and a 25% increase in the total REEYO tonnes.
During the 2013 financial year a maiden copper equivalent resource was announced. This inferred resource is estimated at a 0.1% copper equivalent cutoff as 88Mt at 0.11% Cu, 0.04g/t Au, 1.6g/t Ag, 65ppm Mo, 130ppm Co and 60ppm U, containing 300Kt of CuEq metal.
LREEO HREEY
cutoff (TREEYO
ppm)tonnes
(Mt) TREEYO (ppm, t)
P2O5 (%, t)
CeO2 (ppm, t)
La2O3 (ppm, t)
Nd2O3 (ppm, t)
Pr2O3 (ppm, t)
Sm2O3 (ppm, t)
Eu2O3 (ppm, t)
Gd2O3 (ppm, t)
Y2O3 (ppm, t)
Dy2O3 (ppm, t)
Er2O3 (ppm, t)
Others (ppm, t)
Grades 300 176 620 0.75 260 150 80 24 12 4 10 52 8 5 9
Contained Metal 108,000 1,330,000 46,140 26,460 13,850 4,230 2,170 710 1,780 9,150 1,480 850 1,620
Table 1: Milo Inferred TREEYO resource, at a 300ppm TREEYO cutoff. Red designates elements assessed as being in critical supply by the US Dept. of Energy, Dec 2011: Critical Materials Strategy, P4.
cutoff (CuEQ %)
tonnes (Mt)
CuEQ (%, t)
Au (ppm, ozs)
Cu (ppm, t)
Ag (ppm, ozs)
Mo (ppm/t)
Co (ppm/t)
U3O8 (ppm/Mlbs)
Resource 0.10 88.4 0.34 0.04 1090 1.63 65 130 72
Contained Metal 301,000 126,000 96,500 4,638,000 5,700 11,700 14.0
Table 2: Inferred copper equivalent resource (above 0.1% copper equivalent).
For
per
sona
l use
onl
y

10 GBM Resources Annual Report 2013
Review of Operations
This resource remains open at depth and along strike. In addition, recent geochemical surveys confirm the existence of a number of additional targets in the Milo area with similar geochemical signatures. In the case of the Milo West target, the geochemical response is more intense than the Milo area itself. These anomalies represent high priority targets for future exploration.
For a complete summary please refer to ASX announcement dated 22 November 2012, ’Scoping Study Confirms Strong Commercial Opportunity at GBM’s Milo IOCG-REE Project’.
The Milo Scoping Study by its nature provides preliminary estimates that are not as reliable or certain as a Pre-feasibility or Feasibility study outcomes. The estimates used in the scoping study are subject to completion of resource drill out and more comprehensive studies that include, detailed mine designs, metallurgical testwork, site construction and detailed capital and operating cost analysis. The scoping study is designed to +/- 40% level of accuracy.
The Scoping Study findings are not future revenue or operating forecasts. The study was intended to give shareholders and investors an indication of the scope and magnitude of the Milo Project
Diamond drilling in rugged terrain at Milo IOCG Project near Cloncurry in Queensland.
Euhedral quartz and pyrite crystals in mineralised drillcore from the Milo Project.
For
per
sona
l use
onl
y

GBM Resources Annual Report 2013 11
Figure 8: Milo proposed process flowchart.
Figure 7: Milo Resource Model within preliminary open pit shell (red REE 100ppm resource blocks, green 0.1 CuEq resource blocks).
3D Map
For
per
sona
l use
onl
y
12 GBM Resources Annual Report 2013
Review of Operations
6.0 Iron-Oxide-Copper-Gold (IOCG) Style Projects in the Mount Isa Region
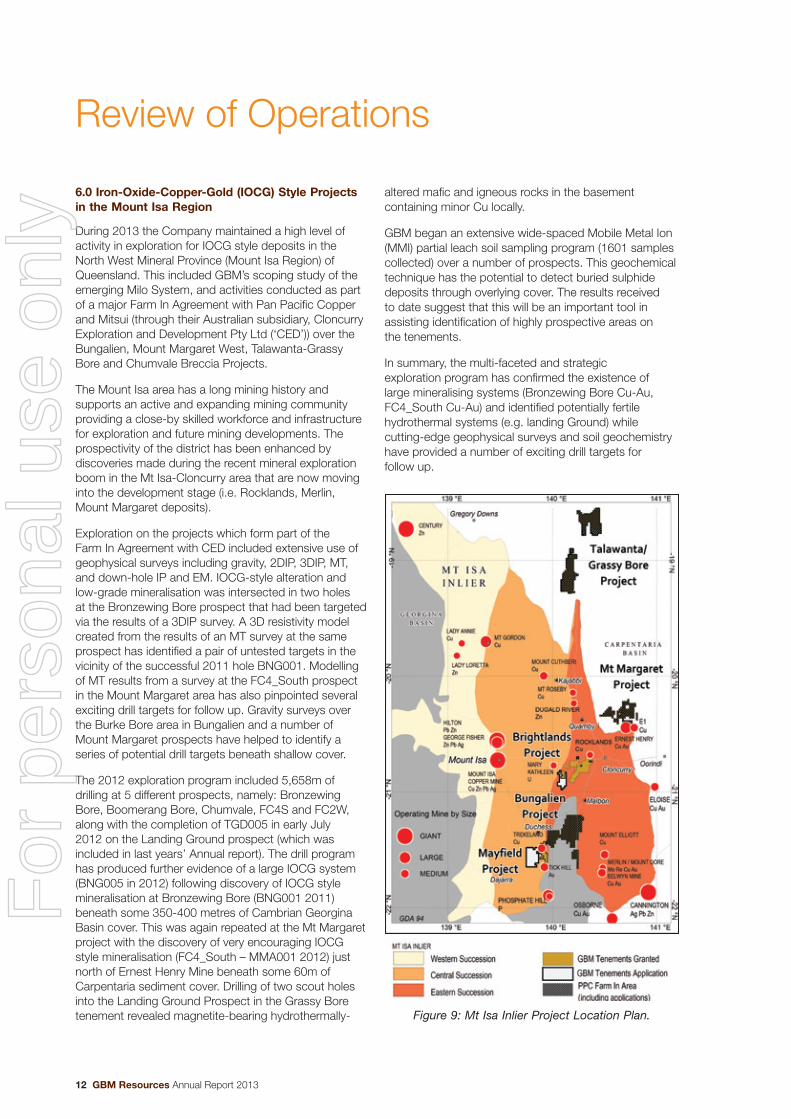
During 2013 the Company maintained a high level of activity in exploration for IOCG style deposits in the North West Mineral Province (Mount Isa Region) of Queensland. This included GBM’s scoping study of the emerging Milo System, and activities conducted as part of a major Farm In Agreement with Pan Pacific Copper and Mitsui (through their Australian subsidiary, Cloncurry Exploration and Development Pty Ltd (‘CED’)) over the Bungalien, Mount Margaret West, Talawanta-Grassy Bore and Chumvale Breccia Projects.
The Mount Isa area has a long mining history and supports an active and expanding mining community providing a close-by skilled workforce and infrastructure for exploration and future mining developments. The prospectivity of the district has been enhanced by discoveries made during the recent mineral exploration boom in the Mt Isa-Cloncurry area that are now moving into the development stage (i.e. Rocklands, Merlin, Mount Margaret deposits).
Exploration on the projects which form part of the Farm In Agreement with CED included extensive use of geophysical surveys including gravity, 2DIP, 3DIP, MT, and down-hole IP and EM. IOCG-style alteration and low-grade mineralisation was intersected in two holes at the Bronzewing Bore prospect that had been targeted via the results of a 3DIP survey. A 3D resistivity model created from the results of an MT survey at the same prospect has identified a pair of untested targets in the vicinity of the successful 2011 hole BNG001. Modelling of MT results from a survey at the FC4_South prospect in the Mount Margaret area has also pinpointed several exciting drill targets for follow up. Gravity surveys over the Burke Bore area in Bungalien and a number of Mount Margaret prospects have helped to identify a series of potential drill targets beneath shallow cover.
The 2012 exploration program included 5,658m of drilling at 5 different prospects, namely: Bronzewing Bore, Boomerang Bore, Chumvale, FC4S and FC2W, along with the completion of TGD005 in early July 2012 on the Landing Ground prospect (which was included in last years’ Annual report). The drill program has produced further evidence of a large IOCG system (BNG005 in 2012) following discovery of IOCG style mineralisation at Bronzewing Bore (BNG001 2011) beneath some 350-400 metres of Cambrian Georgina Basin cover. This was again repeated at the Mt Margaret project with the discovery of very encouraging IOCG style mineralisation (FC4_South – MMA001 2012) just north of Ernest Henry Mine beneath some 60m of Carpentaria sediment cover. Drilling of two scout holes into the Landing Ground Prospect in the Grassy Bore tenement revealed magnetite-bearing hydrothermally-
altered mafic and igneous rocks in the basement containing minor Cu locally.
GBM began an extensive wide-spaced Mobile Metal Ion (MMI) partial leach soil sampling program (1601 samples collected) over a number of prospects. This geochemical technique has the potential to detect buried sulphide deposits through overlying cover. The results received to date suggest that this will be an important tool in assisting identification of highly prospective areas on the tenements.
In summary, the multi-faceted and strategic exploration program has confirmed the existence of large mineralising systems (Bronzewing Bore Cu-Au, FC4_South Cu-Au) and identified potentially fertile hydrothermal systems (e.g. landing Ground) while cutting-edge geophysical surveys and soil geochemistry have provided a number of exciting drill targets for follow up.
Figure 9: Mt Isa Inlier Project Location Plan.
For
per
sona
l use
onl
y

GBM Resources Annual Report 2013 13
6.1 Brightlands Project (EPM14416, EPM18454, EPM18453, EPM(A)18672, EPM(A)18051)
Chumvale Prospect (Project is part of the CED Farm in Agreement)
The project area consists of an 8km2 block within the larger Brightlands tenement (EPM 14416) that is held by GBM Resources.
The project area covers a prominent WNW-ESE trending ridge of outcropping Chumvale Breccia. The Chumvale breccia is an extensive breccia system located along a WNW-ESE trending structure that is likely related to a similar structure running NW-SE through the Rocklands Cu-Au deposit to the north of the Chumvale prospect. Both the Chumvale prospect and the Rocklands deposit are located within an interpreted broad, deep-seated structural corridor termed the Cloncurry Flexure that trends NE-SW, from Ernest Henry and Great Australia in the east through the Milo Cu-Au-REE deposit in the west and on to link with the N-S trending Pilgrim Fault zone. The Cloncurry Flexure marks a zone of structural discontinuity where the fold nose of the NE trending Duck Creek Anticline is in presumed faulted contact with younger E-W trending rocks of the Tommy Creek Block to the north. This broad structural corridor is considered highly prospective for Cu-Au mineralization.
The exploration program at the Chumvale prospect consisted of additional rock-chip samples, an IP geophysical survey, a further two scout diamond drill-holes, and a petrological study of the Zn mineralisation. The focus of the program was to follow-up on the encouraging Zn (and minor Cu and Au) intersected in the 2011 scout drill-holes that targeted an apparent steeply-dipping conductive lense coincident with the breccia outcrop.
The two drill-holes intersected dolomitic breccia, siliceous breccia, altered dolerite, pelite, and siliceous shale (locally jasper). Dolerite was intersected in the
interpreted footwall of the vertical hole and confirmed the presence of a large mafic body along the northern margin of the breccia.
The assays for both holes returned highly anomalous Zn (15m at 3.5 % Zn in BTD045 between 10 to 25m with a peak assay of 5.5% Zn at 18m down hole and 16m at 1.3 % Zn in BTD046 from 10 to 26m with peak assay of 1.97% Zn at 16m) in the upper parts of the holes (from surface), whereas minor Cu occurred locally. High zinc values appear in the upper weathered breccia zone of both holes with the Zn concentration decreasing down-hole in both BTD045 and BTD046.
6.2 Bungalien-Horse Creek Project (EPM17849, EPM18207, EPM18208 & EPMA25213)
(Project is part of the CED Farm In agreement)
Following the discovery of broad intervals of IOCG style copper mineralisation below almost 400 metres of cover rocks in drillhole BNG001 at Bronzewing Bore Prospect during 2011, significant additional geophysical surveys and drilling have been completed.
The Bungalien project area consists of EPM’s Bungalien 2, Horse Creek 2, and Limestone Creek, and EPMA The Brothers and covers an area of 737km2 centred around 100km southwest of Cloncurry. The Bungalien 2 and Horse Creek 2 tenements were granted in 2012 and incorporated and replaced the existing enclosed permits with new titles increasing the total project area.
The structural block containing the Bungalien tenements is bound on the west by the Pilgrim Fault zone, a major north-south trending fault separating Cambrian cover rocks in the east from outcropping Proterozoic rocks in the west. The eastern margin of the block is marked by the Overhang Shear that separates the voluminous felsic and mafic volcanics and quartzite of the Argylla, Marraba, and Mitakoodi from the slates, shales and Fe-stones hosting the IOCG deposits along the Starra trend.
Open terrain in the Bronzewing Bore target area looking across to hills on the Fountain Gate Fault in the distance.
For
per
sona
l use
onl
y
14 GBM Resources Annual Report 2013
Review of Operations
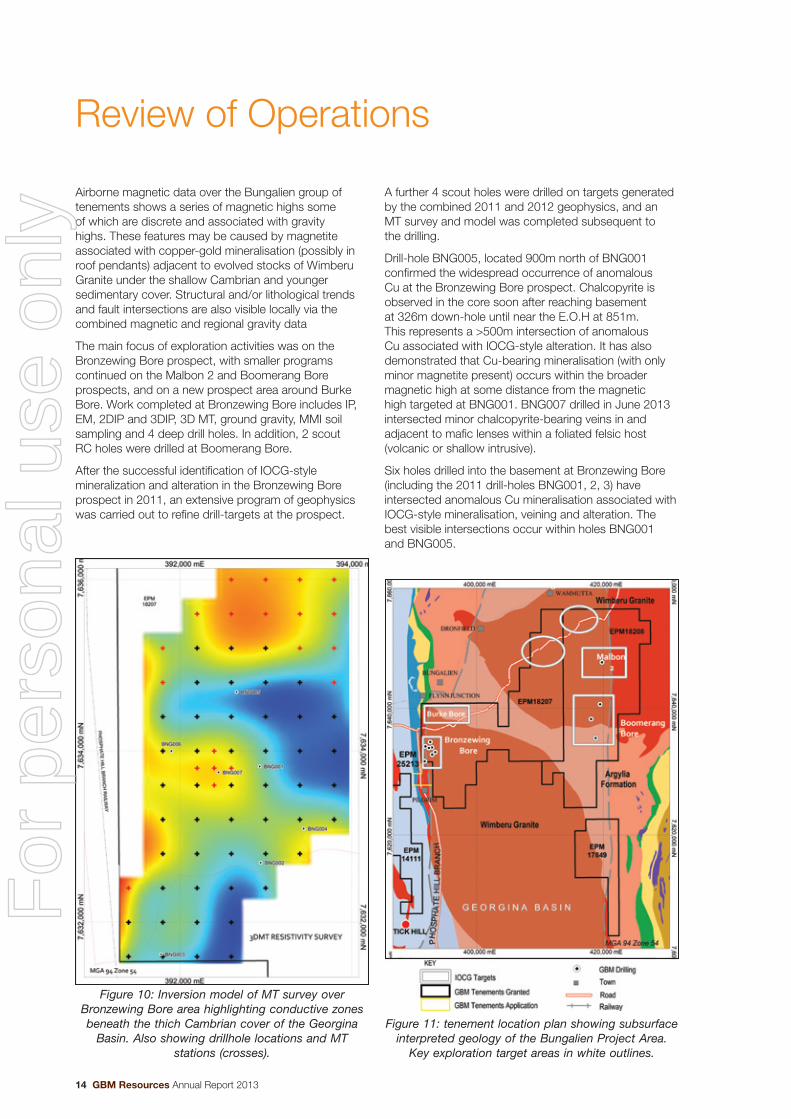
Airborne magnetic data over the Bungalien group of tenements shows a series of magnetic highs some of which are discrete and associated with gravity highs. These features may be caused by magnetite associated with copper-gold mineralisation (possibly in roof pendants) adjacent to evolved stocks of Wimberu Granite under the shallow Cambrian and younger sedimentary cover. Structural and/or lithological trends and fault intersections are also visible locally via the combined magnetic and regional gravity data
The main focus of exploration activities was on the Bronzewing Bore prospect, with smaller programs continued on the Malbon 2 and Boomerang Bore prospects, and on a new prospect area around Burke Bore. Work completed at Bronzewing Bore includes IP, EM, 2DIP and 3DIP, 3D MT, ground gravity, MMI soil sampling and 4 deep drill holes. In addition, 2 scout RC holes were drilled at Boomerang Bore.
After the successful identification of IOCG-style mineralization and alteration in the Bronzewing Bore prospect in 2011, an extensive program of geophysics was carried out to refine drill-targets at the prospect.
A further 4 scout holes were drilled on targets generated by the combined 2011 and 2012 geophysics, and an MT survey and model was completed subsequent to the drilling.
Drill-hole BNG005, located 900m north of BNG001 confirmed the widespread occurrence of anomalous Cu at the Bronzewing Bore prospect. Chalcopyrite is observed in the core soon after reaching basement at 326m down-hole until near the E.O.H at 851m. This represents a >500m intersection of anomalous Cu associated with IOCG-style alteration. It has also demonstrated that Cu-bearing mineralisation (with only minor magnetite present) occurs within the broader magnetic high at some distance from the magnetic high targeted at BNG001. BNG007 drilled in June 2013 intersected minor chalcopyrite-bearing veins in and adjacent to mafic lenses within a foliated felsic host (volcanic or shallow intrusive).
Six holes drilled into the basement at Bronzewing Bore (including the 2011 drill-holes BNG001, 2, 3) have intersected anomalous Cu mineralisation associated with IOCG-style mineralisation, veining and alteration. The best visible intersections occur within holes BNG001 and BNG005.
Figure 10: Inversion model of MT survey over Bronzewing Bore area highlighting conductive zones beneath the thich Cambrian cover of the Georgina
Basin. Also showing drillhole locations and MT stations (crosses).
Figure 11: tenement location plan showing subsurface interpreted geology of the Bungalien Project Area.
Key exploration target areas in white outlines.
For
per
sona
l use
onl
y

GBM Resources Annual Report 2013 15
A ground gravity survey on Burke Bore prospect defined six relatively discrete gravity highs. Four of these anomalies are coincident with, or overlapping and adjacent to areas of higher magnetic response and are thus almost certainly basement features. It is possible that the near-coincident magnetic and gravity highs may represent magnetite-bearing sulphide bodies adjacent to Wimberu Granite.
Trace Cu and Au were also intersected from the two scout drill-holes at Boomerang Bore. The granite, pegmatite and aplite intersected suggests that these are late-crystallizing, evolved and oxidized components of the Wimberu Granite. The magnetite content and presence of minor alteration supports this interpretation. Late phases such as this are likely to generate late-stage hydrothermal fluids capable of generating IOCG-style alteration and mineralization in the area.
6.3 Talawanta-Grassy Bore Projects (EPM15406, EPM15681, EPMA18290 & EPMA18291)
(Projects are part of the CED Farm in agreement)
The Talawanta-Grassy Bore project consists of two large granted exploration permits: EPM15406 (Talawanta) and EPM15681 (Grassy Bore). Talawanta is located approx. 220kms north of Cloncurry and Grassy Bore is located approx. 180kms NNW of Cloncurry
Applications for additional areas have been lodged to include further targets and to assist in a rationalisation of this tenement group. The total area under licence and application in this project is over 640 square kilometres. This project is subject to a farm-in agreement with PPC and Mitsui Corporation.
The Talawanta and Grassy Bore tenements are located within the Eastern Fold Belt of the Proterozoic Mount Isa Inlier, lying within a north-south trending zone of prominent magnetism commonly associated with gravity highs that are believed to reflect Proterozoic basement features beneath ca. 300 to 650m of younger Carpentaria Basin cover rocks of the Georgina Basin. The magnetic ridges can be traced back to the Cloncurry area. The tenement areas have had limited previous drilling recorded and none on identified prominent magnetic centres.
GBM has conducted ground gravity surveys over areas of coincident or near coincident magnetic and gravity
highs in 2010 and 2011, and drilled three scout drill-holes into selected targets. Two scout drill holes at the Ibis and Ibis South prospects intersected extensive magnetite-bearing alteration systems and a scout hole at Talawanta (Happy Valley) intersected an altered magnetite rich gabbro.
TalawantaA large gravity survey was completed over almost the entire Talawanta tenement area between 2010 and 2011. The gravity survey was completed at a 500m spacing and defined large, discrete gravity highs within a broader magnetic high, adjacent to a large gravity and magnetic low, interpreted as a granite. The large gravity highs are not totally coincident with the intense magnetic highs, indicating that the strongest gravity feature extends beyond the magnetic high. This could be interpreted as a potentially mineralised hematite-rich alteration zone which is part of a very large IOCG system.
The first scout drill-hole on the Talawanta tenement (TGD003) targeted a discrete, gravity and magnetic high, at the southern end (but separated from) a north-south trending gravity high. The gabbro returned an unusually high background Cu content (average 152ppm Cu from 60 samples assayed) in representative assays from the hole.
Grassy BoreDetailed ground gravity surveys were carried out in 2010 and 2011 over a number of coincident gravity and magnetic highs within the Grassy Bore tenement. The anomalies included the Ibis and Ibis South prospects, and the Landing Ground prospect ca. 10km to the north. 3D inversions of both gravity and regional magnetic data confirmed the existence of a very strong and discrete gravity and magnetic feature at both the Ibis and Ibis South locations.
In November 2010, GBM commenced drilling of the first hole at Grassy Bore, on the Ibis prospect (TGD001). The occurrence of the magnetite-bearing calc-silicate hydrothermal system associated with extensive felsic pegmatites was considered to be encouraging with respect to the potential for IOCG mineralization in the immediate area.
The Ibis_South prospect scout drill-hole, TGD002 drilled in 2011 targeted a discrete coincident gravity and magnetic high within a north-south trending zone of gravity and magnetic highs.
Core yard facility In Cloncurry.
For
per
sona
l use
onl
y

16 GBM Resources Annual Report 2013
Review of Operations
The Landing Ground prospect scout drill holes TGD004 and TGD005 drilled in 2012 were positioned within prominent and discrete magnetic highs located within a broader N-S trending magnetic high extending undercover to the north of known deposits. Both scout holes TGD004 and TGD005 on this prospect intersected strongly altered magnetite-rich granitic and mafic rocks.
6.4 Mount Margaret West Project (EPM16398, EPM16622, EPM 19834, EPMA18172 & EPMA18174)
(Project is part of the CED Farm in agreement)
The Mount Margaret West group of tenements consist of Mt Malakoff Ext EPM16398, Dry Creek EPM18172, Dry Creek Ext EPM18174, Mt Marge EPM19834 and Cotswold EPM16622 (all granted). EPM18172 Dry Creek (was granted in July 2012 for five years, consolidating EPM14614 Mt Margaret West and EPM16227 Mt Margaret West Extended (both licenses conditionally surrendered).
The Mount Margaret project area tenements are located to the north and north-west of the Ernest Henry Cu-Au mine, one of the largest IOCG deposits in the Mount Isa Inlier. Extensive and locally detailed geophysical surveys (including gravity, magnetic and IP) have been undertaken, as well as widespread drill-testing of anomalies. However, much of the earlier drilling involved shallow holes, generally <200m in total depth. The development of Ernest Henry has demonstrated that these deposits can continue down-dip to depths of greater than 1000m. GBM’s exploration strategy is to identify areas with promising structural settings and/or encouraging drill results associated with near contiguous magnetic highs that had some scope for further discovery. In particular areas where further detailed modern geophysical surveys, in particular gravity and electrical geophysical techniques may be beneficial.
In very close proximity to the Mt Margaret tenements, less than four kilometres south from EPM 16398, lies Ernest Henry. Ernest Henry was discovered in 1991 using aeromagnetics and has a global resource estimated at 220Mt @ 1.2% Cu and 0.4 g/t Au. The mineralisation is located in an ovate SSE plunging breccia pipe with dimensions measuring 300m by 250m. The breccia has been intersected at depths of 1200m below surface to date with consistent mineralisation over this entire distance.
Work completed during the year included the ongoing review and evaluation of existing geophysical, geological and drilling data over the tenements, particularly the large quantity of historical data at FC4S prospect. Fieldwork consisted of the completion of ground gravity regional and infill grids over target areas FC4S, FC6, FC2 and FC12, IP surveys at FC2, FC4S and FC6, a Magnetotellurics (MT) survey at FC4S as well as large MMI soil programs over the FC2W, FC12 and FC15 areas and three scout drill holes on FC4S.
FC4S ProspectThe 2012 field program at FC4S confirmed the potential for a major discovery of IOCG-style mineralisation still existing within the brownfields terrain in the vicinity of Ernest Henry.
A number of geophysical surveys were completed at FC4S during 2012, primarily to confirm the integrity of historical data or infill areas of sparse data. These included three East – West IP survey lines in June, a ground based gravity survey comprised of 251 stations in August and a 48 point MT survey in October 2012.
An IP survey was carried over the FC4S prospect in June 2013. Three lines of IP were run over the FC4S prospect. The lines at FC4S were designed to infill gaps in the previous data, and confirm the integrity of previous IP survey work. The survey was also designed to test the north-east trending linear magnetic high along strike
Figure 12: Talawanta and Grassy Bore tenement areas with GBM drillholes labelled. Interpreted regional
cross structures in black.
For
per
sona
l use
onl
y

GBM Resources Annual Report 2013 17
from EHM. Conductive Mesozoic cover rocks from above the magnetic ridge and east to the end of the survey lines were interpreted to mask any possible chargeability response in the basement, confirming the pattern observed in the reprocessed historic data and providing impetus for the MT survey in this area.
Two small infill gravity surveys were carried out over part of the FC4S prospect late June these lines filled in a gap in the previous sparse data, and confirmed previous work. The data was merged with state data and a number of gridded images were created. The merged image supports the presence of a NS-trending gravity ridge coincident with the ridge of high magnetic response which hosts the Ernest Henry Mine. A second discrete and untested gravity high exists near the eastern tenement margin.
Three holes were drilled on this prospect during the year, MMA001, MMA002 and MMA003. The first hole (MMA001) into the initial magnetic-gravity target intersected a broad interval of low-grade copper mineralisation averaging 302 ppm from near the top of basement to 615m. Within this zone numerous higher grade intervals were intersected including 12m @ 0.26 wt% Cu. Intense shearing and patchy red rock alteration observed throughout the hole shows strong affinities with the Ernest Henry deposit, located less than 4 km to the south-west of MMA001. MMA002 encountered minor IOCG style mineralisation, and magnetite-rich lenses were intercepted in MMA003. Downhole IP surveys were then attempted on holes MMA001 and 2, but due to hole blockage only completed on MMA001. The survey provides chargeability and resistivity profiles through the crust for comparison with surface IP surveys.
MT geophysical surveys have defined two, possibly three, large and discrete conductivity anomalies beneath an area of strongly anomalous gold mineralisation defined by historic drilling. To date, these targets have not been drill tested, however both targets show a spatial relationship with the distribution of gold mineralisation.
FC2 and FC2W ProspectsAnalysis of the historic geophysical and drilling data over the FC2 magnetic-gravity anomaly suggests the prospect may be prospective for Starra/Selwyn-style ironstone-hosted gold and copper mineralisation. Work on FC2 and FC2W commenced with a 2DIP resistivity survey initiated over the FC2 prospect in June 2012. The one line run over the FC2 prospect allowed confirmation
of the positioning of a chargeability anomaly located in previous work.
A large ground gravity survey was also completed in August 2012. The program was designed to cover the area of sparse existing data coverage west of FC2 prospect (FC2W). Three separate grids were completed; the main regional grid comprised of 1599 stations at 200x200m point spacing and follow-up grids over two discrete gravity highs (FC2A and FC2B) in-filled to 100x100m point spacing.
Following analysis of the regional geophysical data, a program of MMI (Mobile Metal Ion) soils was undertaken on this prospect. A total of 296 samples were collected from a nominal 400x400m grid. The wide spaced grid produced a number of discrete gold-silver and base metal anomalies, two of which were chosen for further infill sampling at 100mx200m spacing. The anomalies were confirmed as linear trends up to 1km in length, parallel and coincident or directly adjacent to underlying basement geophysical features. The targets produced will be drill tested in the 2014 field program.
FC6 ProspectTwo 2DIP lines and a detailed gravity survey were undertaken over the FC6 prospect during the year. The IP survey was designed to confirm the east-west positioning of a north-south trending chargeability anomaly detected by WMC. The anomaly was confirmed and the position of the WMC anomaly corrected accordingly.
The FC6 gravity survey consisted of 626 gravity stations on 24 W-E lines with line intervals of 200m and station intervals of 100m. Interpretation of data from these surveys identified five geophysical targets within the FC6 prospect area.
Figure 13: FC2 MMI soil assays with magnetic anomalies (orange) and gravity anomalies (blue) Inversions.
For
per
sona
l use
onl
y

18 GBM Resources Annual Report 2013
Review of Operations
FC12 ProspectA detailed ground based gravity survey comprising a total of 796 stations on 20 lines defined a strong gravity high. Examination of historic drilling on this prospect confirmed it had missed the peak of the gravity anomaly by approximately 800m.
An MMI soils program was conducted over an area that was described as a superimposed anomalous gravity high and complex circular magnetic high. A total of 257 samples were collected on a 200m grid spacing and 400m line spacing. The MMI survey identified more defined and prospective geochemical targets.
FC15 ProspectIncorporates two granted tenements, EPMs 18172 and 18174 and the small EPM 19834 tenement.
The FC15 prospect is highlighted by an obvious large circular gravity high superimposed on a significant
magnetic high showing limited prior drill testing and a maximum recorded basement depth of 46m. The mineral assemblages identified in the historical drilling indicate the area is potentially prospective for IOCG style mineralisation.
An extensive MMI soil sampling program over the greater FC15 prospect area was conducted by GBM during the year. A total of 355 samples were collected on a 200m grid spacing and 400m line spacing.
The MMI soils targeted a coincidentregional gravity and circular magnetic high anomaly in a sparsely and shallow drilled area in the north of the prospect. Also covered was the moderate but irregular coincident gravity and magnetic anomaly to the south. In the southern end of the prospect, anomalous copper was evident in historical drill holes (up to 527ppm) but these few drill holes were shallow and only partially tested this area of the prospect.
Figure 14: Mount Margaret West tenement and target plan.
For
per
sona
l use
onl
y

GBM Resources Annual Report 2013 19
7.0 Intrusive Related and Porphyry Style Copper-Gold and Gold Projects
During the year GBM has made significant progress in the search for IRGS and Porphyry deposits, in particular at the Mount Morgan Project in Queensland. IRGS and porphyry deposit styles have previously been identified by GBM as being capable of delivering world class deposits of commodities considered to have favourable long term price forecasts. Such deposits are suited to extraction by modern, large scale mining methods.
Surface sampling and mapping activity in the Mount Morgan project area has resulted in the discovery of a new copper prospect associated with hydrothermal breccia, alteration and surface copper mineralisation at Oakey Creek, and extended a large zone of anomalous copper and gold with coincident porphyry-style hydrothermal alteration in the Smelter Return area.
At the Willaura Project in Western Victoria, application of Mobile Metal Ion geochemical sampling has successfully defined a prospective Au-Cu target associated with interpreted porphyry intrusive activity.
7.1 Mount Morgan Project (EPM16057, EPM17105, EPM17163, EPMA17734 & EPMA18366)
The Mount Morgan Project is located 40km south west of Rockhampton in Queensland in close proximity to the world class Mt Morgan Copper-Gold mine, which produced in excess of 8.0M ounces of gold (Au) and 400,000 tonnes of copper (Cu) metal.
Exploration by GBM through 2013 continued intensive soil sampling and detailed geological mapping of prioritised prospects in the Mount Morgan Project Area. This resulted in the discovery of a new breccia style copper prospect at Oakey Creek.
The project area includes nine licenses (six granted) covering over 822 km2. Within these existing titles, numerous targets are defined ranging from early stage stream sediment anomalies to drill ready geophysical and geochemical targets. Exploration programs were
completed during the year at the Smelter Return and Oaky Creek Prospects.
The Mount Morgan gold-copper deposit has produced more gold than any other individual deposit in eastern Australia to date. The orebody was hosted by a sequence of acid volcanic rocks and sedimentary rocks occurring as a roof pendant (the Mount Warner Volcanics) in the late Middle Devonian Mount Morgan Trondhjemite (377 ± 5 Ma).
7.2 Malmsbury Project (EL4515 and EL5120)
GBM consider the Malmsbury Project (located in Central Victoria) has the potential to host a large IRGS in a world class gold province. This is supported by the large area of alteration and mineralisation associated with a demonstrated endowment of almost 200,000 ounces within 200 metres of surface. IRGS systems are known to persist to much greater depths in other regions.
Figure 15: Oakey Creek highlighting radiometric anomaly, copper geochemistry and breccia.
Core laydown area at Malmsbury in Victoria. This facility stores core from all Victorian Projects.
For
per
sona
l use
onl
y

20 GBM Resources Annual Report 2013
Review of Operations
A major structural and geological review completed during 2013 has resulted to an improved interpretation of the Malmsbury Project area. Previous comparisons of the mineralogy to the nearby multi million ounce Fosterville Gold Mine have been further supported with this study noting a valid comparison of the architecture of the fault and reef system at Malmsbury with the Fosterville System which hosts over 3 million ounces of gold. The study also identified additional strong North East trending structures similar to the Leven Star Zone. This is supported by a reprocessed magnetic image which highlights a clear complex magnetic feature with a similar trend.
Previous exploration results at the Malmsbury Gold Project indicate the existence a large IRGS in a world class gold province. Results of an extensive soil sampling program completed confirm an intense geochemical anomaly centred over the historic workings of Belltopper Hill. In addition to gold, coincident anomalism in elements including Bismuth (a signature mineral of IRGS) further support the existence of a large IRGS in the Malmsbury Project area.
Completion of a 12 hole diamond drilling program during 2008 which targeted the Leven Star Zone, part of the Malmsbury Project, resulted in the deposit’s Inferred Resource increasing to 0.8 Mt at an average grade of 4.0 g/t Au containing 104,000 ounces of gold using a 2.5 g/t Au cut off grade (see table below). This cut off was chosen to reflect a grade, which based on experience is considered to be applicable to extraction by underground mining methods.
This resource is contained within a 450 metre section of the Leven Star Zone within the Drummond North Goldfield which has an identified strike length of over 4,000 metres. The resource is considered open both to depth and along strike. Details of the parameters used are contained in the resource statement.
Resource Classification
Tonnes (x103)
Au (g/t)
Au (x103
ounces)
Inferred 820 4.0 104
Note: Cut-off grade of 2.5g/t Au anticipated to reflect underground mining production costs. Sources; GBM Resources 2009A, GBM Resources 2009B, Allwood 2008,
Table 3: 2008 Leven Star Gold Resource Estimate
Figure 16: Mount Morgan Project tenement and target location plan showing major structural corridors.
For
per
sona
l use
onl
y

GBM Resources Annual Report 2013 21
Available historical, recent exploration and mining data indicate a known gold endowment of 195,000 ounces of gold in the near surface (approximately 150 metres from surface) portion of the structurally controlled mineralised zones explored or mined to date. This endowment is based on mineralisation within a 2 kilometre section of the Drummond North Goldfield which remains open in all directions.
This endowment comprises 91,000 ounces of historical production and 104,000 ounces of the current Leven Star Resource. At this time, historical production from a number of shafts in the project area is still unknown. Many zones remain to be drill tested and resources evaluated. The current estimate of gold endowment is considered incomplete in the near-surface environment.
A one kilometre deep diamond drill hole was completed in March 2010 with assistance from the Victorian Government RDV grants program. Results strongly support the conclusion that the Malmsbury Gold Project is part of a large Intrusive Related Gold System (IRGS) centred on Belltopper Hill.
Gold in soils defines a strong anomaly at 50 ppb centred on the intersection of known mineralisation, but trending north wards to areas not previously drill tested. At low levels (10ppb) this anomaly is continuous over the 2.0 kilometres covered by the initial survey and remains open to both the East and West. Peak value for Au was 1600ppb. Arsenic and antimony define a very similar
pattern to gold, both reflecting the strong structural controls known to operate in the area, however Sb is much more tightly constrained at higher concentrations, with the Leven Star zone displaying the largest Sb anomaly. Molybdenum defines a discrete ovoid pattern centred near the south east margin of the magnetic feature, and very close to the Missing Link mineralised zone. Values range from 1 to 33 ppm Mo. The Bismuth distribution pattern very closely reflects molybdenum, and also defines a coherent feature centred on the same area as the Molybdenum anomaly.
7.3 Willaura Project (EL4631 and EL5346)
The Willaura Project is located in western Victoria, east of the Grampians, between the towns of Lake Bolac and Ararat.
Application of refined geochemical sampling and analytical techniques has upgraded previously identified magnetic Anomalies I and D to drill ready.
The project area straddles one of the state’s major deep crustal structures, the Moysten Fault and lies within the Stavely Volcanic Complex, analogous to Mt Lyell and the Mount Read Volcanics in Tasmania. Nearby porphyry systems include Thursday’s Gossan (10.6MT Cu @ 0.45% Cu open at depth and along strike), Junction Prospect (39m @ 3.9% Cu), and the Glenlyle Porphyry (sericite alteration and low grade Cu intersections from AC drilling).
Figure 17: Malmsbury plans showing magnetic feature and major cross structures structures related to gold mines and resources (left) and related to gold soil geochemistry (right).
For
per
sona
l use
onl
y

22 GBM Resources Annual Report 2013
Review of Operations
GBM holds three granted exploration licences within the Willaura Project covering an area of approximately 249 square kilometres, including the recently granted large lease EL5423.
The Company is targeting a large copper-gold system in the Stavely Grampians Zone. The Project recognises the prospective and under-explored nature of the Stavely – Grampians Zone as a potential host to intrusive related Cu-Au deposits of the Mount Lyell or Cadia styles. Discrete magnetic features covered by recent basalt cover offer potential for new discoveries.
Due to the extensive tertiary basalt covering much of the Willaura target area, modern and advanced “deep seeing” exploration techniques must be employed to identify suitable drill targets. In early 2013, a total of 605 partial leach Mobile Metal Ion (MMI) soil samples were collected from the seven magnetic anomalies identified by regional air magnetics (B, D, E, F, G, H & I). In conjunction with the MMI soil program, a 105 line km ground magnetic survey was completed over the Willaura magnetic targets. Interpretation of this data indicates an anomalous gold and base metal response directly above Anomaly I and base metals above Anomaly D.
Figure 19: Willaura tenement plan showing location of key target areas.
Figure 18: Distinct MMI soil responses for gold and copper over the strong basement magnetic feature
interpreted to reflect a felsic intrusive at Anomally ‘I’.
For
per
sona
l use
onl
y

GBM Resources Annual Report 2013 23
7.4 Yea Project (EL5292, EL5293 & EL5347)
The Yea Project is located in central Victoria between the townships of Yea, Alexandra and Marysville, approximately 100km north-east of Melbourne.
The first drill hole completed by GBM in 2012 intersected Tungsten and Molybdenum mineralisation which is coarse grained of potentially economic grade. Monkey Gully is a new Tungsten Molybdenum discovery, and the area still retains potential for IRGS style gold mineralisation.
The Yea project includes three exploration licences EL5292 Tin Creek, EL5293 Monkey Gully and EL5347 Rubicon which cover an area of approximately 800 square kilometres. The project area is centred on two separate intrusive systems; the Black Range Granodiorite and the Marysville Intrusive Complex.
Recent work by GBM focussed on the Monkey Gully and Mumbil Mines prospects near Yea in the north-west of the lease area and included extensive ridge and spur soi sampling, detailed ground magnetics, extensive soil sampling and a small diamond drilling program. Review of previous exploration data has also highlighted a number of significant geochemical and geophysical anomalies which represent targets for future exploration.
Logging of the two hole drill program confirmed the existence of a stockwork of thin quartz comprised of several generations of veining. Molybdenum and tungsten mineralisation was observed as coarse molybdenite and scheelite with associated pyrrhotite and chalcopyrite. The mineralisation is within and
adjacent to an interpreted high temperature vein set consistent with observations of occasional surface outcrops. The peak value for tungsten was 5,030ppm from 166 to 167 metres and for molybdenum 1,850ppm from 131 to 132 metres. Copper is also anomalous throughout most of the hole (peak assay 784ppm Cu from 8 to 10m).
Results from the soil sampling indicate that the W-Mo-Cu soil anomalism extends for at least 1,000m in a NW orientation across the prospect. Detailed mapping revealed a series of narrow parallel tonalite and dacite dykes in the centre of the prospect, parallel to the soil anomaly strike and the regional structural grain.
A program of ridge and spur soil and rock-chip sampling was completed in the Monkey Gully area concurrently with the drilling. The program was designed to test whether a larger IRGS system is present beneath Monkey Gully and the nearby existing Mumbil Au-Bi-W prospect. Mumbil is and trenching a zone of high-grade gold mineralisation defined by soil sampling located 2km NE of Monkey Gully (within GBM’s EL5293). GBM’s recent work confirmed anomalous Au at the Mumbil prospect in tourmalinised metasediments hosting extensive comb quartz veining (0.67g/t Au peak) and anomalous Au-As-Bi in soils in the area between the two prospects.
The drilling results at Monkey Gully when considered with the extensive Au-As soil anomalism and Au-Bi in tourmaline-altered metasediments within the prospect area are considered strongly supportive of the existence of an IRGS in the Monkey Gully area.
Figure 20: Yea Project tenement location plan showing target locations.
For
per
sona
l use
onl
y

24 GBM Resources Annual Report 2013
Review of Operations
8.0 Bungalien Phosphate Project
(The Company holds 100% of the Phosphate rights after successfully completing the 70% acquisition of the Bungalien Phosphate rights from Swift Venture Holdings Corporation on 20 December 2012.)
With P2O5 grades up to 25% in the vast and prospective Georgina Basin, and located adjacent to Australia’s largest phosphate deposit at Phosphate Hill, Bunglien Project remains a highly prospective area for discovery of rock phosphate resources.
Work on the Bungalien Phosphate project during 2011 advanced our targets in the Georgina Basin sediments which overlay the Proterozoic basement and continue to emerge as one of the world’s major phosphate provinces with phosphate resources currently identified totalling over three billion tonnes.
A total of 43 shallow RC drill holes, drilled in two stages, have been completed by GBM on the Bungalien Phosphate project areas located in the Georgina Basin, southeast of Mount Isa in North Queensland. Results of both drilling campaigns are very encouraging and confirm the extent of phosphate prospectivity in the area.
Drilling in the Burke River area returned a peak phosphate value exceeding 25% P2O5 among the higher grade results from the 1,436 metre RC drill programmes. Results include many intersections of significant widths of greater than 10% P2O5 mineralisation. In addition, scout drill holes PRC024, PRC025 and PRC026 intersected phosphate mineralisation in new prospect areas; drill hole PRC026 intersected 7m @ 4.19% P2O5 in Horse Creek EPM15150, and PRC024 intersected 9m @ 2.14% P2O5 in Limestone Creek EPM17849. These holes demonstrate that further substantial areas of these large tenements hold potential for untested phosphate mineralisation at shallow depths.
Figure 22: Burke River Phosphate Prospect drillhole plan.
Figure 21: Tenement plan for Bungalien Project showing key phosphate target areas. Burke River Phosphate area is in the
northwest of the tenement areas.
For
per
sona
l use
onl
y

GBM Resources Annual Report 2013 25
9.0 Tenements
GBM reviews and ranks existing tenements and continues to assess opportunities to add quality exploration targets to its portfolio by acquisition of new tenements. The Company currently holds 38 tenements in nine project areas that cover a total area of approximately 5176 square kilometres in some of Australia’s most prospective mineral provinces. This includes 9 applications in Queensland totalling 1,187 square kilometres.
Seven new tenements were granted during year. Two in the Mt Morgan region, Central Queensland (Limonite Hill EPM 18811 and Mt Hoopbound EPM 18812), three in the Mt Margaret region (Cotswold EPM 16622, Mt Marge EPM 19834 and Dry Creek EPM 18172)and one in the Bungalien region (Horsecreek2 EPM 18208), North West Queensland and one in the Willaura region, Victoria (Lake Bolac2 EL5423). In order for the granting of Horsecreek2 EPM 18208, Horsecreek EPM 14355 and Malbon2 EPM 14142 were conditionally surrendered. Likewise on the granting of Dry Creek EPM 18172, Mt Margaret West EPM 14614 and Mt Margaret West Ext EPM 16227 were conditionally surrendered.
Applications that were lodged during the year include Mt Victoria EPMA 25177 and Lake Bolac2 EL 5423 in the Willaura region, Central Victoria. In addition and Bajool EPMA 25362 in North West Queensland was applied for on 1 August 2013.
All of these licences and applications (see tenement schedule) are held 100% by the Company (or its wholly owned subsidiaries), however all tenements in the Talawanta-Grassy Bore, Mount Margaret and Bungalien Projects are subject to a farm-in agreement with Cloncurry Exploration and Development Pty. Ltd. (owned by Pan Pacific Copper and Mitsui Corporation). Application EPMA 18672 is a competing application and at this stage no indication of priority has been received by the Company.
It should be noted EPMA 19483, EPMA 19256 and EPMA 19255 are overlying applications encompassing existing, granted tenements.
In addition GBM has signed agreements with Newcrest to acquire EPM 14111 Mayfield2 and EPMA 19483 Mayfield in the Mount Isa area. This is subject to the transfer being approved. GBM is also awaiting approval from the Queensland Department on transfer of Cotswold EPM 16622 from Newcrest to GBM.
A summary of GBM’s tenements is provided in Table 4 on page 28 of this report.
Monkey Gully area, part of Yea Project area in Victoria.
For
per
sona
l use
onl
y
26 GBM Resources Annual Report 2013
AbbreviationsCuEq Copper Equivalent, as defined in Note 1 below.
EM Electro Magnetic (geophysical surveys)
IP Induced Polarisation (geophysical surveys)
RC Reverse circulation drilling
REE(O) Rare Earth Elements(oxides). There are14 rare earth elements; Lanthanum (La), Cerium (Ce), Praseodymium (Pr), Neodymium (Nd), Samarium (Sm), Europium (Eu), Gadolinium (Gd), Terbium (Tb), Dysprosium (Dy), Holmium (Ho), Erbium (Er), Thulium (Tm), Ytterbium (Yb), Lutetium (Lu) but excluding Promethium (Pm).
TREEY(O) Total Rare Earth element and Yttrium (oxides) (Yttrium (Y) is not always considered as a Rare Earth Element but does have many similar properties
Explanatory Notes* Copper Equivalent calculation represents the total metal value for each metal, multiplied by the conversion factor, summed and expressed in equivalent copper percentage. These results are exploration results only and no allowance is made for recovery losses that may occur should mining eventually result. However it is the company’s opinion that elements considered here have a reasonable potential to be recovered. It should also be noted that current state and federal legislation may impact any potential future extraction of Uranium. Prices and conversion factors used are summarised below, rounding errors may occur.
* MMI (Mobile Metal Ion) soil samples were submitted to SGS laboratories in Perth for analysis. The MMI assay technique is a proprietary method of SGS laboratories. It is a partial leach assay method finishing with ICP-MS for a suite of 53 elements. The sampling method consists of down-hole composite sampling of a 15cm horizon consistenetly between 10cm and 25cm below surface. Sieving is not necessary as this technique is designed to analyse loosely bound skins deposited on other grains. Conventional soil samples were submitted to ALS laboratories for sieving to -80#, grinding and analyses either in Mount Isa by Au-AA21 and ME-ICP61 or ALS in Brisbane using ME-ICP41 and Au-AA23 for the Mt Morgan samples with over limit for Cu (>1%) by Cu-OG46 for a suite of 35 elements.
*2 Intersections quoted are length weighted averages of results for individual sample intervals. Samples were taken at 1 metre intervals in RC drilling by multistage splitter and generally 1 metre intervals of half sawn core with maximum of 2 metres for diamond drilling. Analyses were completed by Amdel in Adelaide using IC2M and IC2E and Au by FA1, ALS in Mt Isa for all elements other than gold by ME-MS61, over limit Cu (>1%) by Cu-OG46 and Zn (>10000 ppm) by Zn-OG62 and Au by Au-AA25 in Brisbane.
The information in this report that relates to Mineral Resources (Milo & Malmsbury) is based on information compiled by Kerrin Allwood, who is a Member or Fellow of The Australasian Institute of Mining and Metallurgy. Mr Allwood is a full-time employee of the Geomodelling Pty. Ltd a New Zealand based consultancy. Mr Allwood has sufficient experience which is relevant to the style of mineralisation and type of deposit under consideration and to the activity which he is undertaking to qualify as a Competent Person as defined in the 2004 Edition of the ‘Australasian Code for Reporting of Exploration Results, Mineral Resources and Ore Reserves’. Mr Allwood consents to the inclusion in the report of the matters based on his information in the form and context in which it appears.
The information in this report that relates to Mineral Resources and Exploration Results is based on information compiled by Neil Norris, who is a Member of The Australasian Institute of Mining and Metallurgy. Mr Norris is a full-time employee of the company. Mr Norris has sufficient experience which is relevant to the style of mineralisation and type of deposit under consideration and to the activity which he is undertaking to qualify as a Competent Person as defined in the 2004 Edition of the ‘Australasian Code for Reporting of Exploration Results, Mineral Resources and Ore Reserves’. Mr Norris consents to the inclusion in the report of the matters based on his information in the form and context in which it appears.
Forward-Looking StatementsCertain statements made in this report, including, without limitation, those concerning the Milo Scoping Study, contain or comprise certain forward-looking statements regarding GBM Resources Limited’s exploration operations, economic performance and financial condition. Although GBM believes that the expectations reflected in such forward-looking statements are reasonable, no assurance can be given that such expectations will prove to have been correct. Accordingly, results could differ materially from those set out in the forward-looking statements as a result of, among other factors, changes in economic and market conditions, success of business and operating initiatives, changes in the regulatory environment and other government actions, fluctuations in metals prices and exchange rates and business and operational risk management. GBM undertakes no obligation to update publicly or release any revisions to these forward-looking statements to reflect events or circumstances after today’s date or to reflect the occurrence of unanticipated events.
Review of Operations
For
per
sona
l use
onl
y

GBM Resources Annual Report 2013 27
Sustainable Development
GBM Resources Ltd value the safety and health of all of its employees, contracting partners, site visitors and the wider community in which they operate, and are committed to a ‘zero harm’ philosophy relating to safety performance in all areas of the company’s businesses. The Occupational Health and Safety Management System is aligned to the AS/NZS 4801:2001 standard which provides a framework for industry best practice operations. As standard practice, the Companies:
n Do not compromise on health and safety standards;
n Include health and safety considerations in planning work;
n Identify, assess, mitigate and manage risks;
n Ensure work meets relevant standards and codes of practices;
n Develop, engage and empower employees and contractors;
n Set measurable objectives and targets aimed at continuous improvement and eliminating work related illness;
n Collaborate and communicate with employees with respect to all health and safety endeavours; and
n Maintain a health and safety system based on best industry standards.
Through the above practices, an exceptional level of safety performance at GBM Resources Ltd has been achieved. The current 12-month rolling total lost time injury frequency rate (LTIFR) is 0.0, based on combined GBM and contracting partners’ working hours (41,562.55). This compares to the 2011 average LTIFR published by Safe Work Australia for the Exploration sector of 3.9.
GBM is committed to safe and responsible development of Australia’s mineral resourcesThe Company’s continued focus on safety has resulted in improved safety performance during the year with no LTI’s recored. GBM strongly believes that the health and safety of personnel and the environment in which we operate are of the highest priority in all of our operations.
Safety & TrainingA range of training programmes was completed throughout the year as part of the Company’s commitment to the safety of our people. GBM remains committed to a process of continuous improvement of its standards procedures and work practices.
Training completed during 2012/2013 included Job Safety Analysis, First Aid and Niton training.
Community & EnvironmentGBM is committed to working with the communities in which we operate with the aim of reducing our Environmental impact whilst achieving mutually acceptable rehabilitation outcomes.
GBM will identify and show consideration for the rights, beliefs and concerns of relevant landholders and all other parties that have a legitimate interest in our exploration activities. To achieve this we will ensure that all of our employees and contractors are aware of their role in implementing company environmental responsibilities, policies and commitments.
Each exploration site undergoes a rigorous examination for the environmental aspect prior to, during and after work has been conducted on the site.
Statistics/Achievementsn No lost time injuries were sustained during operations in 2012/13 (LTI frequency rate of 0.0 against an industry
average of 3.9 in 2011)
n One medically treated injury was sustained during operations in 2012/13
n No significant environmental incidents were sustained in the reporting period
n Refresher First Aid Courses were undertaken during the year for all staff members
n Ongoing reviews of GBM’s Risk Register and procedures continued this year.
For
per
sona
l use
onl
y

28 GBM Resources Annual Report 2013
Tenement Schedule
Project/Name Tenement No. OwnerGBMR Equity Manager Granted Expiry
Approx Area (km2)
sub-blocks/grats Status
VICTORIAMalmsburyBelltopper EL4515 GBMR*1/Belltopper Hill 100% GBMR 06-Oct-05 05-Oct-13 25 25 GrantedLauriston EL5120 GBMR 100% GBMR 17-Dec-08 16-Dec-13 31 31 GrantedWillauraLake Bolac EL4631 GBMR 100% GBMR 21-Mar-02 20-Mar-14 20 20 GrantedWillaura EL5346 GBMR 100% GBMR 02-Jun-11 01-Jun-14 8 8 GrantedLake Bolac2 EL5423 GBMR 100% GBMR 03-Dec-12 02-Dec-17 218 218 GrantedYeaMonkey Gully EL5293 GBMR 100% GBMR 23-Mar-11 22-Mar-16 316 316 GrantedTin Creek EL5292 GBMR 100% GBMR 23-Mar-11 22-Mar-16 329 329 GrantedRubicon EL5347 GBMR 100% GBMR 27-Feb-12 26-Feb-17 155 155 GrantedQUEEnSLAnD
Drummond BasinDiamond Creek EPM 19193 GBMR 100% GBMR 27-Jun-11 26-Jun-14 124 38 GrantedDee RangeDee Range EPM16057 GBMR 100% GBMR 27-Sep-07 26-Sep-14 46 14 GrantedBoulder Creek EPM17105 GBMR 100% GBMR 26-Mar-08 25-Mar-15 88 27 GrantedBlack Range EPM17734 GBMR 100% GBMR 20-May-09 19-May-14 81 25 GrantedSmelter Return EPM18366 GBMR 100% GBMR 21-Jun-12 20-Jun-17 195 60 GrantedLimonite Hill EPM18811 GBMR 100% GBMR 41234 43059 260 80 GrantedLimonite Hill East EPMA19288 GBMR 100% GBMR 29 9 Appl’nMt Hoopbound EPM18812 GBMR 100% GBMR 41116 42941 23 7 GrantedMt Victoria EPMA25177 GBMR 100% GBMR 3 1 Appl’nMount Isa RegionTalawanta – Grassy BoreTalawanta EPM15406 GBMR*2,4/Isa Tenements 100% GBMR 15-Jan-08 14-Jan-13 325 100 RenewalGrassy Bore EPM15681 GBMR*2,4/Isa Tenements 100% GBMR 28-Sep-07 27-Sep-15 325 100 GrantedTalawanta2 EPMA19255 GBMR*5/Isa Tenements 100% GBMR 325 100 ProposalGrassy Bore2 EPMA19256 GBMR*5/Isa Tenements 100% GBMR 322 99 Appl’nMount MargaretMt Malakoff Ext EPM16398 GBMR*2,4/Isa Tenements 100% GBMR 19-Oct-10 18-Oct-15 85 26 GrantedCotswold EPM16622 GBMR*2,4/Isa Tenements 100% GBMR 41243 43068 46 14 GrantedMt Marge EPM19834 GBMR/Isa Tenements 100% GBMR 41337 43162 3 1 GrantedDry Creek EPM18172 GBMR*5/Isa Tenements 100% GBMR 41103 42928 228 70 GrantedDry Creek Ext EPM18174 GBMR*5/Isa Tenements 100% GBMR 25-Oct-11 24-Oct-14 39 12 GrantedBrightlandsBrightlands EPM14416 GBMR*2/Isa Brightlands 100% GBMR 5-Aug-05 4-Aug-14 254 78 GrantedBrightlands West EPMA18051 GBMR/Isa Brightlands 100% GBMR 7 2 ProposalBrightlands West Ext. EPMA18672 GBMR/Isa Brightlands 100% GBMR 98 30 Appl’nWakeful EPM18454 GBMR/Isa Brightlands 100% GBMR 23-Jan-12 22-Jan-17 13 4 GrantedHighway EPM18453 GBMR/Isa Brightlands 100% GBMR 23-Jan-12 22-Jan-17 36 11 GrantedBungalienLimestone Creek EPM17849 GBMR/Isa Tenements 100% GBMR 20-Oct-10 19-Oct-15 78 24 GrantedBungalien 2 EPM18207 GBMR*5/Isa Tenements 100% GBMR 24-May-12 23-May-17 325 100 GrantedHorse Creek 2 EPM18208 GBMR*5/Isa Tenements 100% GBMR 2-Aug-12 1-Aug-17 325 100 GrantedThe Brothers EPMA25213 GBMR/Isa Tenements 100% GBMR 10 3 Appl’nMayfieldMayfield EPMA19483 GBMR*5/Isa Tenements 100% GBMR 302 93 ProposalMayfield2 EPM14111 GBMR*2,4/Isa Tenements 100% GBMR 9-Aug-05 8-Aug-11 84 26 Renewal
Note *1 subject to a 2.5% net smelter royalty to vendors. *2 subject to a 2% net smelter royalty is payable to Newcrest Mining Ltd. *3 For Q’ld tenements, 1 sublock ~3.2km2. Underlined areas indicate the tenement is contained in new application area. *4 subject to approval by DME. *5 subject to a 2% net smelter royalty payable to Newcrest Mining Ltd. on old boundaries only.
Table 4: GBM Resources Limited tenement summary at 30 June 2013.
For
per
sona
l use
onl
y

GBM Resources Annual Report 2013 29
Corporate Governance Statement
Introduction
Since the introduction of the ASX Corporate Governance Council’s Principles of Good Corporate Governance and Best Practice Recommendations (“ASX Guidelines” or “the Recommendations”), GBM Resources Limited (“Company”) has made it a priority to adopt systems of control and accountability as the basis for the administration of corporate governance. Some of these policies and procedures are summarised in this report. Commensurate with the spirit of the ASX Guidelines, the Company has followed each Recommendation where the Board has considered the Recommendation to be an appropriate benchmark for corporate governance practices, taking into account factors such as the size of the Company, the Board, resources available and activities of the Company. Where, after due consideration, the Company’s corporate governance practices depart from the Recommendations, the Board has offered full disclosure of the nature of, and reason for, the adoption of its own practice.
The Board of the Company is committed to administering the policies and procedures with openness and integrity, pursuing the true spirit of corporate governance commensurate with the Company’s needs.
Further information about the Company’s corporate governance practices is set out on the Company’s website at www.gbmr.com.au. In accordance with the recommendations of the ASX, information published on the Company’s website includes:
Board CharterNomination Committee CharterRemuneration Committee CharterAudit and Risk Committee CharterCorporate Code of ConductPerformance Evaluation PolicyContinuous Disclosure PolicyRisk Management PolicyGuidelines for Trading in Company SecuritiesShareholder Communication StrategyDiversity Policy
Explanation for Departures from Best Practice Recommendations
During the Company’s 2012/2013 financial year the Company has sought to comply with the Corporate Governance Principles and the corresponding Best Practice Recommendations as published by the ASX Corporate Governance Council (“Corporate Governance Principles and Recommendations”) and has adopted the revised Principles and Recommendations taking effect from reporting periods beginning on or after 1 January 2008. Significant policies and details of any significant deviations from the principles are specified below.
Corporate Governance Council Recommendation 1 Lay Solid Foundations for Management and Oversight
Role of the Board of DirectorsThe role of the Board is to increase shareholder value within an appropriate framework which safeguards the rights and interests of the Company’s shareholders and ensure the Company is properly managed.
In order to fulfil this role, the Board is responsible for the overall corporate governance of the Company including formulating its strategic direction, setting remuneration and monitoring the performance of Directors and executives. The Board relies on senior executives to assist it in approving and monitoring expenditure, ensuring the integrity of internal controls and management information systems and monitoring and approving financial and other reporting.
In complying with Recommendation 1.1 of the Corporate Governance Council, the Company has adopted a Board Charter which clarifies the respective roles of the Board and senior management and assists in decision making processes. A copy of the Board Charter is available on the Company’s website.
Board ProcessesAn agenda for the meetings has been determined to ensure certain standing information is addressed and other items which are relevant to reporting deadlines and or regular review are scheduled when appropriate. The agenda is regularly reviewed by the Managing Director and the Company Secretary.
Evaluation of Senior Executive PerformanceThe Company has not complied with Recommendation 1.2 of the Corporate Governance Council. Due to the early stage of development of the Company it is difficult for quantitative measures of performance to be established. As the Company progresses its projects, the Board intends to establish appropriate evaluation procedures. The Chairman assesses the performance of the Executive Directors on an informal basis.
Corporate Governance Council Recommendation 2 Structure the Board to Add Value
Board CompositionThe Constitution of the Company provides that the number of Directors shall not be less than three. There is no requirement for any share holding qualification.
The membership of the Board, its activities and composition is subject to periodic review. The criteria for determining the identification and appointment of a suitable candidate for the Board shall include the quality of the individual, background of experience and achievement, compatibility with other Board members, credibility within the scope of activities
For
per
sona
l use
onl
y
30 GBM Resources Annual Report 2013
Corporate Governance Statement
Corporate Governance Council Recommendation 2 Structure the Board to Add Value (continued)
of the Company, intellectual ability to contribute to Board duties and physical ability to undertake Board duties and responsibilities.
Directors are initially appointed by the Board and are subject to re-election by shareholders at the next general meeting. In any event one third of the Directors are subject to re-election by shareholders at each general meeting.
As at 30 June 2013 the Board was comprised of four members, two Non-Executive and two Executive. The Non-Executive Directors were Mr Cameron Switzer and Mr Guan Huat Loh. On 2 September 2013 Mr Chiau Woei Lim was appointed as a Non-Executive Director. The skills, experience and expertise of all Directors is set out in the Directors’ Report.
The Board has assessed the independence of its Non-Executive Directors in office during the period according to the definition contained within the ASX Corporate Governance Guidelines and has concluded that the two Non-Executive Directors, Mr Switzer and Mr Loh, met the recommended independence criteria. Mr Lim does not meet the recommended independence criteria due to his substantial shareholding. The Company does not comply with Recommendation 2.1 of the Corporate Governance Council.
However, the Board considers that both its structure and composition are appropriate given the size of the Company and that the interests of the Company and its shareholders are well met.
Independent ChairmanThe Chairman is not considered to be an independent director as at the reporting date and as such Recommendation 2.2 of the Corporate Governance Council has not been complied with.
Roles of Chairman and Chief Executive OfficerThe roles of Chairman and Chief Executive Officer are not currently exercised by different individuals, and as such the Company does not comply with Recommendation 2.3 of the Corporate Governance Council.
Nomination CommitteeThe Board does not have a separate Nomination Committee comprising of a majority of independent Directors and as such does not comply with Recommendation 2.4 of the Corporate Governance Council. The selection and appointment process for Directors is carried out by the full Board. The Board considers that given the importance of Board composition it is appropriate that all members of the Board partake in such decision making. The Company has adopted a Nomination Committee Charter, which is available for review on the Company’s website.
Evaluation of Board PerformanceThe Company has not to date implemented a formal process for the evaluation of the performance of the Board and as such does not comply with Recommendation 2.5 of the Corporate Governance Council. The Board is of the opinion that the competitive environment in which the Company operates will effectively provide a measure of the performance of the Directors. In addition the Chairman assesses the performance of the Board, individual directors and key executives on an informal basis.
EducationAll Directors are encouraged to attend professional education courses relevant to their roles.
Independent Professional Advice and Access to InformationEach Director has the right to access all relevant information in respect of the Company and to make appropriate enquiries of senior management. Each Director has the right to seek independent professional advice at the Company’s expense, subject to the prior approval of the Chairman, which shall not be unreasonably withheld.
Corporate Governance Council Recommendation 3 Promote Ethical and Responsible Decision Making
The Board actively promotes ethical and responsible decision making.
Corporate Code of ConductThe Board has adopted a Corporate Code of Conduct that applies to all employees, executives and directors of the Company, and as such complies with Recommendation 3.1 of the Corporate Governance Council. This Code addresses expectations for conduct in accordance with legal requirements and agreed ethical standards. A copy of the Code is available on the Company’s website.
Guidelines for Trading in Company SecuritiesThe Board has committed to ensuring that the Company, its Directors and executives comply with their legal obligations as well as conducting their business in a transparent and ethical manner. The Board has adopted a procedure on dealing in the Company’s securities by directors, officers and employees which prohibits dealing in the Company’s securities when those persons possess inside information.
The guidelines also provide that the acknowledgement of the Chairman or the Board should be obtained prior to trading. A summary of the Guidelines are available on the Company’s website.
The Company’s policy restricts, notwithstanding exceptional circumstances, the trading in Company’s securities by those individuals covered by the policy to trading windows that are open for 10 days following the
For
per
sona
l use
onl
y

GBM Resources Annual Report 2013 31
Corporate Governance Council Recommendation 3 Promote Ethical and Responsible Decision Making (continued)
hosting of General Meetings of the Company, the release of annual, half yearly results and quarterly reports and after any other public announcement on ASX.
DiversityThe Board has adopted a diversity policy that details the purpose of the policy and the employee selection and appointment guidelines, consistent with the recommendations of the Corporate Governance Council. The Board believes that the adoption of an efficient diversity policy has the effect of broadening the employee recruitment pool, supporting employee retention, including different perspectives and is socially and economically responsible governance practice.
The Company employs new employees and promotes current employees on the basis of performance, ability and attitude. The Board is continually reviewing its practices with a focus on ensuring that the selection process at all levels within the organisation is formal and transparent and that the workplace environment is open, fair and tolerant.
The Company, in keeping with the recommendations of the Corporate Governance Council provides the following information regarding the proportion of gender diversity in the organisation as at 30 June 2013:
Proportion of female/total number of persons employed
Females employed in the Company as a whole 2/16
Females employed in the Company in senior positions 1/2
Females appointed as a Director of the Company 0/4
The recommendations of the Corporate Governance Council relating to reporting require a Board to set measurable objectives for achieving diversity within the organisation, and to report against them on an annual basis. The Company has implemented measurable objectives as follows:
Measurable Objective Objective Satisfied Comment
Adoption and promotion of a Formal Diversity Policy.
Yes The Company has adopted a formal diversity policy which has been made publicly available via the ASX and the Company’s website.
To ensure Company policies are consistent with and aligned with the goals of the Diversity Policy.
Yes The Company’s selection, remuneration and promotion practices are merit based and as such are consistent with the goals of the Company’s Diversity Policy.
To provide flexible work and salary arrangements to accommodate family commitments, study and self-improvement goals, cultural traditions and other personal choices of current and potential employees.
Yes The Company does, where considered reasonable, and without prejudice, accommodate requests for flexible working arrangements.
To implement clear and transparent policies governing reward and recognition practices.
Yes The Company grants reward and promotion based on merit and responsibility as part of its annual and ongoing review processes.
To provide relevant and challenging professional development and training opportunities for all employees.
Yes The Company seeks to continually encourage self-improvement in all employees, irrespective of seniority, ability or experience, through external and internal training courses, regular staff meetings and relevant on job mentoring.
The Company has not implemented specific measurable objectives regarding the proportion of females to be employed within the organisation or implement requirements for a proportion of female candidates for employment and Board positions. The Board considers that the setting of quantitative gender based measurable targets is not consistent with the merit and ability based policies currently implemented by the Company.
For
per
sona
l use
onl
y

32 GBM Resources Annual Report 2013
Corporate Governance Statement
Corporate Governance Council Recommendation 3 Promote Ethical and Responsible Decision Making (continued)
The Board will consider the future implementation of gender based diversity measurable objectives when more appropriate to the size and nature of the Company’s operations.
Corporate Governance Council Recommendation 4 Safeguarding Integrity in Financial Reporting
Audit CommitteeThe Board does not have a separate Audit Committee with a composition as suggested by Recommendations 4.1 and 4.2 of the Corporate Governance Council, and as such does not comply with those recommendations. The full Board carries out the function of an Audit Committee. The Board believes that the Company is not of a sufficient size to warrant a separate committee and that the full Board is able to meet objectives of the best practice recommendations and discharge its duties in this area. The relevant experience of Board members is detailed in the Directors’ section of the Directors’ Report. The Company has adopted an Audit and Risk Committee Charter and as such complies with Recommendation 4.3 of the Corporate Governance Council.
Financial ReportingThe Board relies on senior executives to monitor the internal controls within the Company. Financial performance is monitored on a regular basis by the Managing Director who reports to the Board at the scheduled Board meetings.
The Board reviews the performance of the external auditors on an annual basis and meets with them during the year to review findings and assist with Board recommendations.
In the absence of a formal Audit Committee, Non-Executive Directors of the Company are available for correspondence with the auditors of the Company.
Corporate Governance Council Recommendation 5 Make Timely and Balanced Disclosure
Continuous DisclosureThe Board is committed to the promotion of investor confidence by providing full and timely information to all security holders and market participants about the Company’s activities and to comply with the continuous disclosure requirements contained in the Corporations Act 2001 and the Australian Securities Exchange’s Listing Rules. The Company has established written policies and procedures, designed to ensure compliance with the ASX Listing Rule Requirements, in accordance with Recommendation 5.1 of the Corporate Governance Council.
Continuous disclosure is discussed at all regular Board meetings and on an ongoing basis the Board ensures that all activities are reviewed with a view to the necessity for disclosure to security holders.
In accordance with ASX Listing Rules the Company Secretary is appointed as the Company’s disclosure officer.
Corporate Governance Council Recommendation 6 Respect the Rights of Shareholders
CommunicationsThe Board fully supports security holder participation at general meetings as well as ensuring that communications with security holders are effective and clear. This has been incorporated into a formal shareholder communication strategy, in accordance with Recommendation 6.1 of the Corporate Governance Council. A copy of the policy is available on the Company’s website.
In addition to electronic communication via the ASX website, the Company publishes all significant announcements together with all quarterly reports. These documents are available in both hardcopy on request and on the Company website at www.gbmr.com.au.
Shareholders are able to pose questions on the audit process and the financial statements directly to the independent auditor who attends the Company Annual General Meeting for that purpose.
Corporate Governance Council Recommendation 7 Recognise and Manage Risk
Risk Management PolicyThe Board has adopted a risk management policy that sets out a framework for a system of risk management and internal compliance and control, whereby the Board delegates day-to-day management of risk to the Managing Director, therefore complying with Recommendation 7.1 of the Corporate Governance Council. The Board is responsible for supervising management’s framework of control and accountability systems to enable risk to be assessed and managed.
Risk Management and the Internal Control SystemThe Managing Director, with the assistance of senior management as required, has responsibility for identifying, assessing, treating and monitoring risks and reporting to the Board on risk management.
In order to implement the Company’s Risk Management Policy, it was considered important that the Company establish an internal control regime in order to:
For
per
sona
l use
onl
y

GBM Resources Annual Report 2013 33
Corporate Governance Council Recommendation 7 Recognise and Manage Risk (continued)
n Assist the Company to achieve its strategic objectives;
n Safeguard the assets and interests of the Company and its stakeholders; and
n Ensure the accuracy and integrity of external reporting.
Key identified risks to the business are monitored on an ongoing basis as follows:
n Business risk managementThe Company manages its activities within budgets and operational and strategic plans.
n Internal controlsThe Board has implemented internal control processes typical for the Company’s size and stage of development. It requires the senior executives to ensure the proper functioning of internal controls and in addition it obtains advice from the external auditors as considered necessary.
n Financial reportingDirectors approve a budget for the Company and regularly review performance against budget at Board Meetings.
n Operations reviewMembers of the Board regularly visit the Company’s exploration project areas, reviewing both geological practices, and environmental and safety aspects of operations.
n Environment and safetyThe Company is committed to ensuring that sound environmental management and safety practices are maintained on its exploration activities.
The Company’s risk management strategy is evolving and will be an ongoing process and it is recognised that the level and extent of the strategy will develop with the growth and change in the Company’s activities.
Risk ReportingAs the Board has responsibility for the monitoring of risk management it has not required a formal report regarding the material risks and whether those risks are managed effectively therefore not complying with Recommendation 7.2 of the Corporate Governance Council. The Board believes that the Company is currently effectively communicating its significant and material risks to the Board and its affairs are not of sufficient complexity to justify the implementation of a more formal system for identifying, assessing monitoring and managing risk in the Company.
The Company does not have an internal audit function.
Managing Director and Chief Financial Officer Written StatementThe Board requires the Managing Director and the Company Secretary provide a written statement that the financial statements of company present a true and fair view, in all material aspects, of the financial position and operational results and have been prepared in accordance with Australian Accounting Standards and the Corporation Act. The Board also requires that the Managing Director and Company Secretary provide sufficient assurance that the declaration is founded on a sound system of risk management and internal control, and that the system is working effectively.
The declarations have been received by the Board, in accordance with Recommendation 7.3 of the Corporate Governance Council.
Corporate Governance Council Recommendation 8 Remunerate Fairly and Responsibly
Remuneration CommitteeThe Board does not have a separate Remuneration Committee and as such does not comply with Recommendations 8.1 and 8.2 of the Corporate Governance Council. Remuneration arrangements for Directors are determined by the full Board. The Board is also responsible for setting performance criteria, performance monitors, share option schemes, superannuation, termination and retirement entitlements, and professional indemnity and liability insurance cover.
The Board considers that the Company is effectively served by the full Board acting as a whole in remuneration matters, and ensures that all matters of remuneration continue to be decided upon in accordance with Corporations Act requirements, by ensuring that no Director participates in any deliberations regarding their own remuneration or related issues.
Distinguish Between Executive and Non-Executive RemunerationThe Company does distinguish between the remuneration policies of its Executive and Non-Executive Directors in accordance with Recommendation 8.3 of the Corporate Governance Council.
Executive Directors receive salary packages which may include performance based components, designed to reward and motivate, including the granting of share options, subject to shareholder approval and vesting conditions relating to continuity of engagement.
Non-Executive Directors receive fees agreed on an annual basis by the Board, within total Non-Executive remuneration limits voted upon by shareholders at Annual General Meetings. In the current financial year, no Non-Executive Director received shares or share options as remuneration.
For
per
sona
l use
onl
y

34 GBM Resources Annual Report 2013
Directors’ Report
The Directors present their report together with the consolidated financial statements for the Company and its controlled entities (‘Group’) for the financial year ended 30 June 2013.
DirectorsThe names of Directors in office at any time during or since the end of the year are:
Peter Thompson B.Bus, CPA, FCIS Managing Director/Executive Chairman
ExperienceMr Thompson is a CPA qualified accountant and Fellow of Chartered Secretaries Australia. He has over 30 years experience in the mining industry in Australia, UK and South America. He has held senior roles with several major companies including Xstrata Plc, MIM Holdings Ltd and Mt Edon Gold Mines.
Since 2000, Mr Thompson has been involved in the development of various infrastructure projects, including mine and refinery expansions and establishment of infrastructure including roads, rail, port and power utilities.
Mr Thompson has held no other directorships of listed companies in the last 3 years.
Cameron Switzer BSc(Hons), MAusMM, MAIG Non-Executive Director
ExperienceMr Switzer is a geologist with over 24 years of experience gained in 11 countries. He has held senior positions with a number of major mining companies including Senior Project Geologist at Newcrest Mining Ltd’s Telfer gold mine in Western Australia and Geology Manager at Acacia Resources Ltd’s Union Reef Gold Mine in the Northern Territory. Mr Switzer was also Principal Geologist with MIM Exploration Ltd for seven years during which time he gained broad experience with a range of deposits and geological and operating environments. Mr Switzer has a strong skill base in Cu Au and most recently coal.
Mr Switzer has a track record in the successful identification of mineral deposits, highly successful project generation, exploration management, validation of resources and the subsequent commercialisation of resources. Mr Switzer is a geological consultant based in Queensland.
Mr Switzer is also the President and CEO of TSX.V listed entity WCB Resources Ltd, a junior explorer focussed in the Asia Pacific Region.
Mr Switzer has held no other directorships of listed companies in the last 3 years.
Guan Huat (Sunny) Loh BBA, MBA, ACIS Non-Executive Director
ExperienceMr Loh is the Managing Director of Swift Venture Holdings Corporation, an investment Company focussed on investing in small to mid sized listed companies and resources based companies in Asia.
Mr Loh is the Vice Chairman and Board Member of Shanghai Fortune Capital, a professional investment banking firm based in Shanghai, which has a focus on the restructuring and disposal of state owned companies, as well as merger and acquisition advisory services.
Mr Loh has held no other directorships of listed companies in the last 3 years.
Chiau Woei Lim MBA Non-Executive Director (Appointed 2 September 2013)
ExperienceMr Lim is managing director and major shareholder of Angka Alamjaya SDN BHD (AASB) which owns the Lubuk Mandi Gold Mine in Malaysia. Mr Lim has a wealth of experience in quarrying, construction and property development.
He holds a MBA from Leicester University UK and science degree in Electrical and Computer Engineering from Oklahoma State University, USA.
Mr Lim has held no other directorships of listed companies in the last 3 years.
neil norris BSc(Hons), MAIMM, MAIG Exploration Director – Executive
ExperienceMr Norris is a geologist with over 25 years’ experience gained in Australia and overseas. Recently he was Group Exploration Manager for Perseverance Corporation Limited and spent over ten years with Newmont Australia Limited holding senior positions in both mining and exploration areas. A key achievement was his development of the geological models which contributed to the discovery of the Phoenix ore body at Fosterville. Mr Norris was also involved in the discovery of the world class Cadia and Ridgeway deposits. Mr Norris has a track record in the successful identification of mineral deposits and his experience will greatly advance GBM’s exploration efforts.
Mr Norris has held no other directorships of listed companies in the last 3 years.
For
per
sona
l use
onl
y
GBM Resources Annual Report 2013 35
Company SecretaryKevin Hart FCA
Mr Hart is a Chartered Accountant and was appointed to the position of Company Secretary on 3 February 2010. He has over 20 years’ experience in accounting and the management and administration of public listed entities in the mining and exploration industry.
He is currently a partner in an advisory firm which specialises in the provision of company secretarial services to ASX listed entities.
Meetings of DirectorsDuring the financial year, the following meetings of Directors (including committees) were held:
Directors’ Meetings
number Eligible to Attend
number Attended
P Thompson 8 8
C Switzer 8 7
N Norris 8 8
G Loh 8 6
Principal ActivitiesThe principal activity of the Group during the financial year was gold and copper exploration in Australia.
Operating and Financial ReviewDuring the financial year the Group’s activities were focussed on exploration at its IOCG style targets at the Brightlands Project in Queensland and for gold mineralisation at the Mt Morgan Gold Project in Queensland and Malmsbury Gold Project in Victoria. Full details are available in the Review of Operations in the Annual Report.
Operating ResultsThe net loss after income tax attributable to members of the Group for the financial year to 30 June 2013 amounted to $1,727,043 (2012: $1,196,811).
Financial PositionAt the end of the financial year, the Group had $1,521,888 (2012: $1,590,824) in cash on hand and on deposit. Carried forward exploration expenditure was $13,740,089 (2012: $13,202,731).
Equity Securities on Issue
30 June 2013
30 June 2012
Ordinary fully paid shares 327,415,003 236,181,003
Options over unissued shares
– 129,493,124
Performance Share Rights – 350,000
Ordinary Fully Paid SharesDuring the year ended 30 June 2013 the Company issued the following ordinary fully paid shares:
n 20,000,000 shares at 5 cents each pursuant to a share placement;
n 10,000,000 shares at 5 cents each on the acquisition of the remaining Bungalien phosphate assets not already owned by the Company;
n 10,884,000 shares at 5 cents each pursuant to a share purchase plan;
n 350,000 shares on the exercise of employee performance rights; and
n 50,000,000 shares at 2 cents each pursuant to a share placement.
Since 30 June 2013 the Company has issued 57,779,118 shares to nominees of Angka Alamjaya Sdn Bhd in respect of the acquisition of a 40% interest of that Company, which holds the Lubuk Mandi gold project mining concession.
Other than the above, no shares have been issued between the end of the financial year and the date of this report.
Options over Ordinary SharesAt 30 June 2013, there were nil (2012: 129,493,124) options to acquire ordinary shares on issue.
During the year ended 30 June 2013, no options were issued pursuant to the terms of the Company’s Option Plan (2012: Nil).
During the year ended 30 June 2013 no options were issued by the Company.
During the year ended 30 June 2013 no ordinary shares were issued on exercise of options (2012: Nil).
There were 129,493,124 listed options (GBZOA) which expired unexercised during the financial year (2012: Nil).
For
per
sona
l use
onl
y

36 GBM Resources Annual Report 2013
Directors’ Report
Equity Securities on Issue (continued)
Other than the following option issues, no options have been issued, exercised or cancelled between the end of the financial year and the date of this report:
n 50 million options issued, exercisable at 3.5 cents each on or before 30 June 2016, pursuant to a share placement;
n 20 million options issued, exercisable at 3.5 cents each on or before 30 June 2016, pursuant to a corporate services agreement; and
n 64,746,562 options issued, exercisable at 3.5 cents each on or before 30 June 2016, pursuant to a priority entitlement offer closing on 13 August 2013.
Performance Share RightsThe Company’s Performance Share Rights Plan was approved by Shareholders at the Company’s Annual General Meeting held on 30 November 2010.
At 30 June 2013, there were nil (2012: 350,000) unvested performance share rights to acquire ordinary shares on issue. The 350,000 performance share rights on issue at 30 June 2012 vested and became exercisable on 31 December 2012.
During the year ended 30 June 2013, nil (2012: 1,300,000) performance share rights were issued pursuant to the terms of the Company’s Performance Share Rights Plan to employees of the Company.
During the year ended 30 June 2013 350,000 (2012: 1,750,000) ordinary shares were issued on the exercise of vested performance share rights.
There were no performance share rights cancelled due to cessation of employment during the financial year (2012: 300,000). There were no performance share rights lapsing on expiry date during the financial year (2012: Nil).
None of the performance share rights on issue entitle the holder to participate in any share issue of the Company or any other body corporate.
No performance share rights have been issued, exercised or cancelled between the end of the financial year and the date of this report.
Significant Changes in State of AffairsOther than the following, there were no significant changes in the state of affairs of the Group during the financial year, not otherwise disclosed in this Directors’ Report or in the Review of Operations.
n On 20 December 2012, the Company issued 10,000,000 million shares to Swift Venture Corporation (and its nominees) to acquire the 70% interest in the Bungalien phosphate rights not already owned by the Company;
n On 11 June 2013 the Company announced that it had entered into a binding terms sheet to acquire, subject to shareholder approval and other conditions precedent, a 40% interest in Angka Alamjaya Sdn Bhd (AASB), a Malaysian company which holds the mining concession over the historic Lubuk Mandi Gold Mine in Malaysia.
Shareholder approval for the acquisition was received at the Company’s General Meeting on 22 July 2013 and the issue of 57,779,118 ordinary fully paid shares to acquire the 40% interest in AASB was completed on 30 August 2013.
Events Subsequent to Balance DateOther than the following, there has not arisen in the interval between the end of the financial year and the date of this report any item, transaction or event of a material and unusual nature likely, in the opinion of the Directors of the Company to affect substantially the operations of the Group, the results of those operations or the state of affairs of the Group in subsequent financial years.
n On 22 July 2013 the Company obtained shareholder approval to proceed with the issue of shares for the acquisition of the 40% interest in AASB and to proceed with a Priority Entitlement Offer of options to holders of listed GBZOA options that expired on 30 June 2013;
n On 13 August 2013, the Company’s Priority Entitlement Offer closed with the subsequent issue of 64,746,562 listed options (GBZO) exercisable at 3.5 cents each on or before 30 June 2016. Entitlements under the offer were allotted on 19 August 2013 and the offer was finalised with the issue of the shortfall options on 27 August 2013. Total proceeds of $323,733 were received from the issue of these options;
n On 22 August 2013 the Company completed the issue of 50 million listed options (GBZO) exercisable at 3.5 cents each on or before 30 June 2016, pursuant to shareholder approval received on 22 July 2013 and which were securities attaching to a share placement completed on 28 June 2013;
n On 30 August 2013 the Company issued 20 million listed options (GBZO) exercisable at 3.5 cents each on or before 30 June 2016, to Alvito Capital Holdings Inc for corporate advisory and promotional services provided to the Company;F
or p
erso
nal u
se o
nly

GBM Resources Annual Report 2013 37
Events Subsequent to Balance Date (continued)
n On 19 August 2013 the Company advised that it had completed the Acquisition and Joint Venture Agreement pursuant to which the Company would acquire a 40% interest in AASB, a Malaysian Company holding the mining concession for the Lubuk Mandi Gold Project, and enter into a joint venture with AASB to assess, and if positive, commence recommissioning of the Lubuk Mandi Gold Project;
On 30 August 2013 the Company completed the issue of 57,779,118 ordinary fully paid shares to nominees of AASB in respect of the acquisition; and
n On 2 September 2013 the Company appointed Mr Chiau Woei Lim, Managing Director of AASB, to the Board as a Non-Executive Director of GBM Resources Limited.
DividendsNo dividends were paid during the year and the Directors recommend that no dividends be paid or declared for the financial year ended 30 June 2013.
Likely Developments and Expected Results of OperationsComments on expected results of the operations of the Company are included in this report under the Review of Operations.
Disclosure of other information regarding likely developments in the operations of the Company in future financial years and the expected results of those operations is likely to result in unreasonable prejudice to the Company. Accordingly, this information has not been disclosed in this report.
Environmental IssuesThe Group holds participating interests in a number of exploration tenements. The various authorities granting such tenements require the tenement holder to comply with the terms of the grant of the tenement and all directions given to it under those terms of the tenement. There have been no known breaches of the tenement conditions, and no such breaches have been notified by any government agencies during the year ended 30 June 2013.
Remuneration Report (Audited)The remuneration report is set out in the following manner:
n Policies used to determine the nature and amount of remuneration
n Details of remuneration
n Service agreements
n Share based compensation
Remuneration PolicyThe Board of Directors is responsible for remuneration policies and the packages applicable to the Directors of the Company. Whilst the broad remuneration policy is to ensure that packages offered properly reflect a person’s duties and responsibilities and that remuneration is competitive and attracts, retains, and motivates people of the highest quality, the Board has consciously been focused on conserving the Company’s funds to ensure the maximum amount is spent on exploration and mine development, and this is reflected in the modest level of Director fees.
The policy of the Group is to offer competitive salary packages which provide incentive to Directors and executives and are designed to reward and motivate. Total remuneration for all Non-Executive Directors was voted on by shareholders, whereby it is not to exceed in aggregate $200,000 per annum. Non-Executive Directors receive fees agreed on an annual basis by the Board.
At the date of this report, the Company had not entered into any remuneration packages with Directors or senior executives which include performance-based components.
Details of Remuneration for Directors and Executive OfficersThe remuneration of each Director of the Company and relevant executive officers are set out in the attached Table.
Remuneration levels are competitively set to attract and retain appropriately qualified and experienced Directors and senior executives. The Board of Directors obtains independent advice when appropriate in reviewing remuneration packages.
During the year, there were no senior executives who were employed by the Company for whom disclosure is required.F
or p
erso
nal u
se o
nly

38 GBM Resources Annual Report 2013
Directors’ Report
Remuneration Report (Audited) (continued)
2013 Short termPost
EmploymentShare Based
Payments
Remuneration of Directors and Executives
Salary and fees
$Other
$
Super-annuation
$
Options/shares
$Total
$
Share Based Payments as % of
remuneration
P Thompson 275,229 – 24,771 – 300,0001 –
C Switzer 36,000 – – – 36,000 –
N Norris 275,229 20,037 24,771 – 320,0371 –
G Loh 36,000 – – – 36,000 –
Total Directors 622,458 20,037 49,542 – 692,037
1 From 1 July 2013 total remuneration payable to the Executive Directors Peter Thompson and Neil Norris has been reduced by $90,000 per annum as part of the Company’s cash conservation measures implemented during the 2012/13 financial year. See disclosure relating to service agreements for further details of remuneration of executive directors.
2012 Short termPost
EmploymentShare Based
Payments
Remuneration of Directors and Executives
Salary and fees
$Other
$
Super-annuation
$
Options/shares
$Total
$
Share Based Payments as % of
remuneration
P Thompson 275,230 – 24,770 – 300,000 –
C Switzer 36,000 – – – 36,000 –
N Norris 275,230 14,026 24,770 – 314,026 –
G Loh (appointed 1 March 2012) 12,000 – – – 12,000 –
Total Directors 598,460 14,026 49,540 – 662,026
Options Provided as RemunerationDuring the years ended 30 June 2013 and 30 June 2012 no options have been granted and issued to Directors or Senior Executives of the Company.
No shares were issued to Directors or Senior Executives of the Company in respect of the exercise of options previously granted as remuneration.
Service AgreementsRemuneration and other terms of employment for the Managing Director and Executive Director are set out in Service Agreements:
Managing DirectorThe service agreement has a term of 12 months from 1 July 2013. Total remuneration under the contract of $300,000 per annum inclusive of superannuation has been reduced to $210,000 per annum as part of the Company’s cost reduction program. The reduced remuneration level will remain in place until otherwise decided by the Board.
The Service agreement contains certain provisions typically found in contracts of this nature. The Company may terminate the Service Agreement without cause by providing nine months written notice to the individual or by making a payment in lieu of notice. The Service Agreement may be terminated immediately in the case of serious misconduct.
The Service Agreement is subject to annual review.
There is no specific cash bonus or other performance based compensation contemplated in the agreement. Long term and short term incentives, may be awarded subject to Board discretion.
Exploration DirectorThe service agreement has a term of 12 months from 1 July 2013. Total remuneration under the contract of $300,000 per annum inclusive of superannuation has been reduced to $210,000 per annum as part of the Company’s cost reduction program. The reduced remuneration level will remain in place until otherwise decided by the Board. In addition the Exploration Director is given the use of a company vehicle.
For
per
sona
l use
onl
y

GBM Resources Annual Report 2013 39
Remuneration Report (Audited) (continued)
The Service agreement contains certain provisions typically found in contracts of this nature. The Company may terminate the Service Agreement without cause by providing nine months written notice to the individual or by making a payment in lieu of notice. The Service Agreement may be terminated immediately in the case of serious misconduct.
The Service Agreement is subject to annual review.
There is no specific cash bonus or other performance based compensation contemplated in the agreement. Long term and short term incentives, may be awarded subject to Board discretion.
Share Based CompensationAt the date of this report the Company has not entered into any agreements with Directors or Senior Executives which include performance based components. Options issued to Directors are approved by shareholders and were not the subject of an agreement or issued subject to the satisfaction of a performance condition. Options are issued to provide an appropriate level of incentive using a cost effective means given the Company’s size and stage of development.
End of Remuneration Report
Directors’ InterestsThe relevant interest of each Director in the ordinary shares and options issued by the Company as notified by the Directors to the Australian Securities Exchange at the date of this report, is set out in the table below.
Ordinary shares Director
Ordinary shares held at
1 July 2012
Movement during the
financial year
Ordinary Shares held at
30 June 2013
Ordinary shares held at the date of the Directors’ Report
P Thompson 9,562, 582 300,000 9,862,582 9,862,582
C Switzer 6,393,750 300,000 6,693,750 6,693,750
N Norris 9,250,000 300,000 9,550,000 9,550,000
G Loh 11,067,131 1,820,934 12,888,065 13,799,377
C Lim (appointed 2/9/13) – – – 24,077,285
Options Director
Options held at
1 July 2012
Movement during the
financial year1
Options held at
30 June 2013
Options held at the date of the
Directors’ Report
P Thompson 4,937,525 (4,937,525) – 2,468,763
C Switzer 4,346,875 (4,346,875) – 1,878,126
N Norris 3,093,635 (3,093,635) – 1,546,818
G Loh 17,800,000 (17,800,000) – 8,900,000
C Lim (appointed 2/9/13) – – – –
1 Options expired at 30 June 2013.
Loans to Directors and ExecutivesThere were no loans entered into with Directors or executives during the financial year under review. Other transactions with Directors and executives are set out in Note 21 to the Financial Report.
For
per
sona
l use
onl
y

40 GBM Resources Annual Report 2013
Directors’ Report
Indemnification and Insurance of Officers and AuditorsDuring the year, the Company paid an insurance premium to insure certain officers of the Company. The officers of the Company covered by the insurance policy include the Directors named in this report.
The Directors and Officers Liability insurance provides cover against all costs and expenses that may be incurred in defending civil or criminal proceedings that fall within the scope of the indemnity and that may be brought against the officers in their capacity as officers of the Company. The insurance policy does not contain details of the premium paid in respect of individual officers of the Company. Disclosure of the nature of the liability cover and the amount of the premium is subject to a confidentiality clause under the insurance policy.
Other than the above, the Group has not, during or since the end of the financial year, given an indemnity or entered an agreement to indemnify, or paid or agreed to pay insurance premiums for the Directors, officers or auditors of the Company or the controlled entity.
Proceedings on Behalf of the CompanyNo person has applied to the Court under section 237 of the Corporations Act 2001 for leave to bring proceedings on behalf of the Company, or to intervene in any proceedings to which the Company is a party, for the purpose of taking responsibility on behalf of the Company for all or part of those proceedings.
No proceedings have been brought or intervened in on behalf of the Company with leave of the Court under section 237 of the Corporations Act 2001.
Non-Audit ServicesNo non-audit services were provided by the external auditors in respect of the current or preceding financial year.
Auditor’s Independence DeclarationA copy of the auditor’s independence declaration as required under section 307C of the Corporations Act 2001, is set out on the following page.
Signed in accordance with a resolution of the Board of Directors.
Dated this 27th day of September 2013
Peter Thompson Executive Chairman
For
per
sona
l use
onl
y

GBM Resources Annual Report 2013 41
HLB Mann Judd (WA Partnership) ABN 22 193 232 714 Level 4, 130 Stirling Street Perth WA 6000. PO Box 8124 Perth BC 6849 Telephone +61 (08) 9227 7500. Fax +61 (08) 9227 7533. Email: [email protected]. Website: http://www.hlb.com.au Liability limited by a scheme approved under Professional Standards Legislation
HLB Mann Judd (WA Partnership) is a member of
International, a worldwide organisation of accounting firms and business advisers.
20
AUDITOR’S INDEPENDENCE DECLARATION As lead auditor for the audit of the consolidated financial report of GBM Resources Limited for the year ended 30 June 2013, I declare that to the best of my knowledge and belief, there have been no contraventions of:
a) the auditor independence requirements of the Corporations Act 2001 in relation to the audit; and b) any applicable code of professional conduct in relation to the audit.
This declaration is in respect of GBM Resources Limited and the entities it controlled during the year. Perth, Western Australia27 September 2013
L Di GiallonardoPartner
For
per
sona
l use
onl
y

42 GBM Resources Annual Report 2013
Consolidated Statement of Comprehensive IncomeFor the Year Ended 30 June 2013
Consolidated
2013 2012 Note $ $
Revenue 3 430,401 447,951
Consulting and professional services (203,394) (294,136)Corporate and project assessment costs (179,741) –Depreciation 4 (39,663) (41,992)Employee benefits expense 4 (435,636) (480,427)Employee share based payments 13 (23,333) (137,167)Exploration expenditure written off and expensed 4 (1,114,163) (212,797)Other share based payments – (375,400)Travel expenses (130,417) (94,102)Administration and other expenses (316,047) (267,433)
Loss before income tax (2,011,993) (1,455,503)
Income tax benefit 5 284,950 258,692
Loss for the year (1,727,043) (1,196,811)
Other comprehensive income – –
Total comprehensive loss for the year (1,727,043) (1,196,811)
Cents Cents
Basic loss per share 6 (0.7) (0.5)Diluted loss per share 6 (0.7) (0.5)
The accompanying notes form part of these financial statements
For
per
sona
l use
onl
y

GBM Resources Annual Report 2013 43
Consolidated Statement of Financial PositionAs at 30 June 2013
Consolidated
2013 2012 Note $ $
Current assetsCash and cash equivalents 18 1,521,888 1,590,824Trade and other receivables 7 134,795 411,712
Total Current Assets 1,656,683 2,002,536
non-current assetsTrade and other receivables 7 43,608 40,687Exploration and evaluation expenditure 8 13,740,089 13,202,731Property, plant and equipment 9 444,971 478,561
Total Non-current Assets 14,228,668 13,721,979
TOTAL ASSETS 15,885,351 15,724,515
Current liabilitiesTrade and other payables 10 446,085 1,435,847
Total Current Liabilities 446,085 1,435,847
TOTAL LIABILITIES 446,085 1,435,847
nET ASSETS 15,439,266 14,288,668
EquityIssued capital 11 21,118,244 18,228,936Option reserve 13 – 698,146Share based payments reserve 13 – 920,638Accumulated losses 13 (5,678,978) (5,559,052)
TOTAL EQUITY 15,439,266 14,288,668
The accompanying notes form part of these financial statements
For
per
sona
l use
onl
y

44 GBM Resources Annual Report 2013
Consolidated Statement of Changes in EquityFor the Year Ended 30 June 2013
Share based Issued Option payments Accumulated capital reserve reserve losses Total Consolidated Note $ $ $ $ $
Balance at 1 July 2011 16,950,744 698,146 642,071 (4,362,241) 13,928,720
Share based payments 13 70,000 – 442,567 – 512,567
Shares issued 11 1,044,192 – – – 1,044,192
Loss attributable to members of the Company 13 – – – (1,196,811) (1,196,811)
Transfer to issued capital on exercise of performance rights 13 164,000 – (164,000) – –
Balance at 30 June 2012 18,228,936 698,146 920,638 (5,559,052) 14,288,668
Balance at 1 July 2012 18,228,936 698,146 920,638 (5,559,052) 14,288,668
Share based payments 13 – – 23,333 – 23,333
Shares issued 11 2,854,308 – – – 2,854,308
Loss attributable to members of the Company 13 – – – (1,727,043) (1,727,043)
Transfer to issued capital on exercise of performance rights 13 35,000 – (35,000) – –
Transfer to accumulated losses on expiry of options 13 – (698,146) (908,971) 1,607,117 –
Balance at 30 June 2013 21,118,244 – – (5,678,978) 15,439,266
The accompanying notes form part of these financial statements
For
per
sona
l use
onl
y

GBM Resources Annual Report 2013 45
Consolidated Statement of Cash FlowsFor the Year Ended 30 June 2013
Consolidated
2013 2012 Note $ $
Cash flows from operating activitiesInterest received 43,743 120,663Research and development concession refund 543,642 –JV management fee income 383,737 325,329Payments to suppliers and employees (1,151,823) (1,231,333)
Net cash flows (used in) operating activities 18(b) (180,701) (785,341)
Cash flows from investing activitiesFunds provided by JV partner under Farm-in agreement 3,528,289 2,711,077Payments for exploration and evaluation, including JV Farm-in spend (5,838,058) (6,537,696)Payments to acquire property, plant and equipment (32,784) (39,585)
Net cash flows (used in) investing activities (2,342,553) (3,866,204)
Cash flows from financing activitiesProceeds from the issue of shares and options 2,544,200 1,115,000Share issue costs (89,882) (70,808)
Net cash flows from financing activities 2,454,318 1,044,192
Net decrease in cash and cash equivalents (68,936) (3,607,353)Cash and cash equivalents at the beginning of the financial year 18(a) 1,590,824 5,198,177
Cash and cash equivalents at the end of the financial year 18(a) 1,521,888 1,590,824
The accompanying notes form part of these financial statements
For
per
sona
l use
onl
y

46 GBM Resources Annual Report 2013
Notes to the Financial StatementsFor the Year Ended 30 June 2013
1. Statement of Significant Accounting PoliciesGBM Resources Limited (‘the Company’) is a listed public company domiciled in Australia. The consolidated financial report of the Company for the financial year ended 30 June 2013 comprises the Company and its subsidiaries (together referred to as the ‘Group’).
The following is a summary of the material accounting policies adopted by the Group in the preparation of the financial report. The accounting policies have been consistently applied, unless otherwise stated.
a) Basis of PreparationThe financial report is a general purpose financial report, which has been prepared in accordance with the requirements of the Corporations Act 2001, and Australian Accounting Standards and Interpretations. The financial report has also been prepared on an historical cost basis, unless otherwise stated. The financial report is presented in Australian dollars.
Adoption of New and Revised Standards – Changes in accounting policies on initial application of accounting standardsIn the year ended 30 June 2013, the Directors have reviewed all of the new and revised Standards and Interpretations issued by the AASB that are relevant to the Group’s operations and effective for the current annual reporting period. It has been determined by the Directors that there is no impact, material or otherwise, of the new and revised Standards and Interpretations on the Group’s business and, therefore, no change is necessary to Group accounting policies.
The Directors have also reviewed all new Standards and Interpretations that have been issued but are not yet effective for the year ended 30 June 2013. As a result of this review the Directors have determined that there is no impact, material or otherwise, of the new and revised Standards and Interpretations on the Group’s business and, therefore, no change necessary to Group accounting policies.
b) Statement of ComplianceThe financial report was authorised for issue on 27 September 2013.
The financial report complies with Australian Accounting Standards, which include Australian equivalents to International Financial Reporting Standards (AIFRS). Compliance with AIFRS ensures that the financial report, comprising the financial statements and notes thereto, complies with International Financial Reporting Standards (IFRS).
c) Principles of ConsolidationThe consolidated financial statements comprise the financial statements of GBM Resources Limited and its subsidiaries as at 30 June each year (the Group). The financial statements for the subsidiaries are prepared for the same reporting period as the parent company, using consistent accounting policies.
In preparing the consolidated financial statements, all intercompany balances and transactions, income and expenses and profit and losses resulting from intra-group transactions have been eliminated in full. Subsidiaries are fully consolidated from the date on which control is transferred to the Group and cease to be consolidated from the date on which the control is transferred out of the Group.
The acquisition of subsidiaries has been accounted for using the purchase method of accounting. The purchase method of accounting involves allocating the cost of the business combination to the fair value of the assets acquired and the liabilities and contingent liabilities assumed at the date of acquisition. Accordingly, the consolidated financial statements include the results of subsidiaries for the period from their acquisition. Minority interests represent the portion of profit and loss and net assets in subsidiaries not held by the Group and are presented separately in the consolidated statement of comprehensive income and within equity in the consolidated statement of financial position.
d) Revenue RecognitionRevenue is recognised to the extent that it is probable that the economic benefits will flow to the Group and the revenue can be reliably measured. The following specific recognition criteria must also be met before revenue is recognised:
Interest RevenueInterest revenue is recognised on a time proportionate basis that takes into account the effective yield on the financial asset.
Management FeesRevenue from farm-in management fees is recognised at the time the fees are invoiced.
For
per
sona
l use
onl
y

GBM Resources Annual Report 2013 47
1. Statement of Significant Accounting Policies (continued)
e) Income TaxCurrent tax assets and liabilities for the current and prior periods are measured at the amount expected to be recovered from, or paid to, the taxation authorities. The tax rates and tax laws used to compute the amount are those that are enacted or substantively enacted by the balance date.
Deferred income tax is provided on all temporary differences at the balance date between the tax bases of assets and liabilities and their carrying amounts for financial reporting purposes.
Deferred income tax liabilities are recognised for all taxable temporary differences except:
• whenthedeferredincometaxliabilityarisesfromtheinitialrecognitionofgoodwillorofanassetorliability in a transaction that is not a business combination and that, at the time of the transaction, affects neither the accounting profit nor taxable profit or loss; or
• whenthetaxabletemporarydifferenceisassociatedwithinvestmentsinsubsidiaries,associatesorinterests in joint ventures, and the timing of the reversal of the temporary difference can be controlled and it is probable that the temporary difference will not reverse in the foreseeable future.
Deferred income tax assets are recognised for all deductible temporary differences, carry-forward of unused tax assets and unused tax losses, to the extent that it is probable that taxable profit will be available against which the deductible temporary differences and the carry-forward of unused tax credits and unused tax losses can be utilised, except:
• whenthedeferredincometaxassetrelatingtothedeductibletemporarydifferencearisesfromtheinitialrecognition of an asset or liability in a transaction that is not a business combination and, at the time of the transaction, affects neither the accounting profit nor taxable profit or loss; or
• whenthedeductibletemporarydifferenceisassociatedwithinvestmentsinsubsidiaries,associatesorinterests in joint ventures, in which case a deferred tax asset is only recognised to the extent that it is probable that the temporary difference will reverse in the foreseeable future and taxable profit will be available against which the temporary difference can be utilised.
The carrying amount of deferred income tax assets is reviewed at each balance date and reduced to the extent that it is no longer probable that sufficient taxable profit will be available to allow all or part of the deferred income tax asset to be utilised.
Unrecognised deferred income tax assets are re-assessed at each balance date and are recognised to the extent that it has become probable that future taxable profit will allow the deferred tax asset to be recovered.
Deferred income tax assets and liabilities are measured at the tax rates that are expected to apply to the year when the asset is realised or the liability is settled, based on tax rates (and tax laws) that have been enacted or substantively enacted at the balance date.
Income taxes relating to items recognised directly in equity are recognised in equity and not in profit or loss.
Deferred tax assets and deferred tax liabilities are offset only if a legally enforceable right exists to set off current tax assets against current tax liabilities and the deferred tax assets and liabilities relate to the same taxable entity and the same taxation authority.
f) Other TaxesRevenues, expenses and assets are recognised net of the amount of GST except:
• whentheGSTincurredonapurchaseofgoodsandservicesisnotrecoverablefromthetaxationauthority, in which case the GST is recognised as part of the cost of acquisition of the asset or as part of the expense item as applicable; and
• receivablesandpayables,whicharestatedwiththeamountofGSTincluded.
The net amount of GST recoverable from, or payable to, the taxation authority is included as part of receivables or payables in the consolidated statement of financial position.
For
per
sona
l use
onl
y

48 GBM Resources Annual Report 2013
Notes to the Financial StatementsFor the Year Ended 30 June 2013
1. Statement of Significant Accounting Policies (continued)
g) Financing CostsNet financing costs comprise interest payable on borrowings calculated using the effective interest method.
Borrowing costs are expensed as incurred and included in net financing costs.
h) LeasesLeases are classified as finance leases whenever the terms of the lease transfer substantially all the risks and rewards of ownership to the lessee. All other leases are classified as operating leases.
Assets held under finance leases are initially recognised at their fair value or, if lower, the present value of the minimum lease payments, each determined at the inception of the lease. The corresponding liability to the lessor is included in the consolidated statement of financial position as a finance lease obligation.
Lease payments are apportioned between finance charges and reduction of the lease obligation so as to achieve a constant rate of interest on the remaining balance of the liability. Finance charges are charged directly against income, unless they are directly attributable to qualifying assets, in which case they are capitalised in accordance with the general policy on borrowing costs – refer Note 1(g).
Finance leased assets are depreciated on a straight line basis over the estimated useful life of the asset.
Operating lease payments are recognised as an expense on a straight line basis over the lease term, except where another systematic basis is more representative of the time pattern in which economic benefits from the leased asset are consumed.
i) Cash and Cash EquivalentsCash and short-term deposits in the consolidated statement of financial position comprise cash at bank and in hand. Cash equivalents are short-term, highly liquid investments that are readily convertible to known amounts of cash and which are subject to an insignificant risk of changes in value.
For the purposes of the consolidated statement of cash flows, cash and cash equivalents consist of cash and cash equivalents as defined above, net of outstanding bank overdrafts.
j) Trade and Other ReceivablesTrade receivables, which generally have 30–90 day terms, are recognised and carried at original invoice amount less an allowance for any uncollectible amounts. An allowance for doubtful debts is made when there is objective evidence that the Group will not be able to collect the debts. Bad debts are written off when identified.
k) Plant and EquipmentPlant and equipment is stated at cost, less accumulated depreciation and any accumulated impairment losses. Such cost includes the cost of replacing parts that are eligible for capitalisation when the cost of replacing the parts is incurred. Similarly, when each major inspection is performed, its cost is recognised in the carrying amount of the plant and equipment as a replacement only if it is eligible for capitalisation.
Depreciation is calculated on a straight-line basis over the estimated useful life of the assets as follows:
Office furniture and equipment 2.5-20 years Plant and equipment 0-40 years Motor Vehicles 8 years
The assets’ residual values, useful lives and amortisation methods are reviewed, and adjusted if appropriate, at each financial year end.
(i) ImpairmentThe carrying values of plant and equipment are reviewed for impairment at each reporting date, with recoverable amount being estimated when events or changes in circumstances indicate that the carrying value may be impaired.
The recoverable amount of plant and equipment is the higher of fair value less costs to sell and value in use. In assessing value in use, the estimated future cash flows are discounted to their present value using a pre-tax discount rate that reflects current market assessments of the time value of money and the risks specific to the asset. For an asset that does not generate largely independent cash inflows, recoverable amount is determined for the cash-generating unit to which the asset belongs, unless the asset’s value in use can be estimated to be close to its fair value.
An impairment exists when the carrying value of an asset or cash-generating units exceeds its estimated recoverable amount. The asset or cash-generating unit is then written down to its recoverable amount.
For
per
sona
l use
onl
y

GBM Resources Annual Report 2013 49
1. Statement of Significant Accounting Policies (continued)
k) Plant and Equipment (continued)
(ii) De-recognition and DisposalAn item of property, plant and equipment is de-recognised upon disposal or when no further future economic benefits are expected from its use or disposal.
Any gain or loss arising on de-recognition of the asset (calculated as the difference between the net disposal proceeds and the carrying amount of the asset) is included in profit or loss in the year the asset is de-recognised.
l) Investments and Other Financial AssetsFinancial assets in the scope of AASB 139 Financial Instruments: Recognition and Measurement are classified as either financial assets at fair value through profit or loss, loans and receivables, held-to-maturity investments, or available-for-sale investments, as appropriate. When financial assets are recognised initially, they are measured at fair value, plus, in the case of investments not at fair value through profit or loss, directly attributable transactions costs. The Group determines the classification of its financial assets after initial recognition and, when allowed and appropriate, re-evaluates this designation at each financial year-end.
All regular way purchases and sales of financial assets are recognised on the trade date i.e. the date that the Group commits to purchase the asset. Regular way purchases or sales are purchases or sales of financial assets under contracts that require delivery of the assets within the period established generally by regulation or convention in the marketplace.
(i) Financial Assets at Fair Value through Profit or LossFinancial assets classified as held for trading are included in the category ‘financial assets at fair value through profit or loss. Financial assets are classified as held for trading if they are acquired for the purpose of selling in the near term. Derivatives are also classified as held for trading unless they are designated as effective hedging instruments. Gains or losses on investments held for trading are recognised in profit or loss.
(ii) Held-to-Maturity InvestmentsNon-derivative financial assets with fixed or determinable payments and fixed maturity are classified as held-to-maturity when the Group has the positive intention and ability to hold to maturity.
Investments intended to be held for an undefined period are not included in this classification. Investments that are intended to be held-to-maturity, such as bonds, are subsequently measured at amortised cost. This cost is computed as the amount initially recognised minus principal repayments, plus or minus the cumulative amortisation using the effective interest method of any difference between the initially recognised amount and the maturity amount. This calculation includes all fees and points paid or received between parties to the contract that are an integral part of the effective interest rate, transaction costs and all other premiums and discounts. For investments carried at amortised cost, gains and losses are recognised in profit or loss when the investments are de-recognised or impaired, as well as through the amortisation process.
(iii) Loans and ReceivablesLoans and receivables are non-derivative financial assets with fixed or determinable payments that are not quoted in an active market. Such assets are carried at amortised cost using the effective interest method. Gains and losses are recognised in profit or loss when the loans and receivables are derecognised or impaired, as well as through the amortisation process.
(iv) Available-for-Sale InvestmentsAvailable-for-sale investments are those non-derivative financial assets that are designated as available-for-sale or are not classified as any of the three preceding categories. After initial recognition available-for sale investments are measured at fair value with gains or losses being recognised as a separate component of equity until the investment is derecognised or until the investment is determined to be impaired, at which time the cumulative gain or loss previously reported in equity is recognised in profit or loss.
The fair value of investments that are actively traded in organised financial markets is determined by reference to quoted market bid prices at the close of business on the balance date. For investments with no active market, fair value is determined using valuation techniques. Such techniques include using recent arm’s length market transactions; reference to the current market value of another instrument that is substantially the same; discounted cash flow analysis and option pricing models.
For
per
sona
l use
onl
y

50 GBM Resources Annual Report 2013
Notes to the Financial StatementsFor the Year Ended 30 June 2013
1. Statement of Significant Accounting Policies (continued)
m) Exploration and Evaluation ExpenditureExploration and evaluation expenditures in relation to each separate area of interest are recognised as an exploration and evaluation asset in the year in which they are incurred where the following conditions are satisfied:
(i) the rights to tenure of the area of interest are current; and
(ii) at least one of the following conditions is also met:
(a) the exploration and evaluation expenditures are expected to be recouped through successful development and exploration of the area of interest, or alternatively, by its sale; or
(b) exploration and evaluation activities in the area of interest have not at the reporting date reached a stage which permits a reasonable assessment of the existence or otherwise of economically recoverable reserves, and active and significant operations in, or in relation to, the area of interest are continuing.
Exploration and evaluation assets are initially measured at cost and include acquisition of rights to explore, studies, exploratory drilling, trenching and sampling and associated activities and an allocation of depreciation and amortised of assets used in exploration and evaluation activities. General and administrative costs are only included in the measurement of exploration and evaluation costs where they are related directly to operational activities in a particular area of interest.
Exploration and evaluation assets are assessed for impairment when facts and circumstances suggest that the carrying amount of an exploration and evaluation asset may exceed its recoverable amount. The recoverable amount of the exploration and evaluation asset (for the cash generating unit(s) to which it has been allocated being no larger than the relevant area of interest) is estimated to determine the extent of the impairment loss (if any). Where an impairment loss subsequently reverses, the carrying amount of the asset is increased to the revised estimate of its recoverable amount, but only to the extent that the increased carrying amount does not exceed the carrying amount that would have been determined had no impairment loss been recognised for the asset in previous years.
Where a decision has been made to proceed with development in respect of a particular area of interest, the relevant exploration and evaluation asset is tested for impairment and the balance is then reclassified to development.
n) Impairment of AssetsThe Group assesses at each reporting date whether there is an indication that an asset may be impaired. If any such indication exists, or when annual impairment testing for an asset is required, the Group makes an estimate of the asset’s recoverable amount. An asset’s recoverable amount is the higher of its fair value less costs to sell and its value in use and is determined for an individual asset, unless the asset does not generate cash inflows that are largely independent of those from other assets or groups of assets and the asset’s value in use cannot be estimated to be close to its fair value. In such cases the asset is tested for impairment as part of the cash-generating unit to which it belongs. When the carrying amount of an asset or cash-generating unit exceeds its recoverable amount, the asset or cash-generating unit is considered impaired and is written down to its recoverable amount.
In assessing value in use, the estimated future cash flows are discounted to their present value using a pre-tax discount rate that reflects current market assessments of the time value of money and the risks specific to the asset. Impairment losses relating to continuing operations are recognised in those expense categories consistent with the function of the impaired asset unless the asset is carried at re-valued amount (in which case the impairment loss is treated as a re-valuation decrease).
An assessment is also made at each reporting date as to whether there is any indication that previously recognised impairment losses may no longer exist or may have decreased. If such indication exists, the recoverable amount is estimated. A previously recognised impairment loss is reversed only if there has been a change in the estimates used to determine the asset’s recoverable amount since the last impairment loss was recognised. If that is the case the carrying amount of the asset is increased to its recoverable amount. That increased amount cannot exceed the carrying amount that would have been determined, net of depreciation, had no impairment loss been recognised for the asset in prior years. Such reversal is recognised in profit or loss unless the asset is carried at re-valued amount, in which case the reversal is treated as a re-valuation increase. After such a reversal the depreciation charge is adjusted in future periods to allocate the asset’s revised carrying amount, less any residual value, on a systematic basis over its remaining useful life.
For
per
sona
l use
onl
y

GBM Resources Annual Report 2013 51
1. Statement of Significant Accounting Policies (continued)
o) Trade and Other PayablesTrade payables and other payables are carried at amortised costs and represent liabilities for goods and services provided to the Group prior to the end of the financial year that are unpaid and arise when the Group becomes obliged to make future payments in respect of the purchase of these goods and services.
p) Interest Bearing LiabilitiesAll loans and borrowings are initially recognised at the fair value of the consideration received less directly attributable transaction costs.
After initial recognition, interest-bearing loans and borrowings are subsequently measured at amortised cost using the effective interest method.
Gains and losses are recognised in profit or loss when the liabilities are de-recognised.
q) Employee Benefits
(i) Wages, Salaries, Annual Leave and Sick LeaveLiabilities for wages and salaries, including non-monetary benefits, annual leave and non-accumulating sick leave expected to be settled within 12 months of the reporting date are recognised in other payables in respect of employees’ services up to the reporting date. They are measured at the amounts expected to be paid when the liabilities are settled. Liabilities for non-accumulating sick leave are recognised when the leave is taken and are measured at the rates paid or payable.
(ii) Long Service LeaveThe liability for long service leave is recognised in the provision for employee benefits and measured as the present value of expected future payments to be made in respect of services provided by employees up to the reporting date using the projected unit credit method. Consideration is given to expected future wage and salary levels, experience of employee departures, and period of service. Expected future payments are discounted using market yields at the reporting date on national government bonds with terms to maturity and currencies that match, as closely as possible, the estimated future cash outflows.
r) Share Based Payments
Equity Settled TransactionsThe Group provides benefits to employees (including senior executives) of the Group in the form of share based payments, whereby employees render services in exchange for shares or rights over shares (equity-settled transactions).
The cost of these equity-settled transactions with employees is measured by reference to the fair value of the equity instruments at the date at which they are granted. The fair value of options is determined by using a Black and Scholes model. Share rights are valued at the underlying market value of the ordinary shares over which they are granted.
In valuing equity-settled transactions, no account is taken of any performance conditions, other than conditions linked to the price of the shares of GBM Resources Limited (market conditions) if applicable.
The cost of equity-settled transactions is recognised, together with a corresponding increase in equity, over the period in which the performance and/or service conditions are fulfilled, ending on the date on which the relevant employees become fully entitled to the award (the vesting period).
The cumulative expense recognised for equity-settled transactions at each reporting date until vesting date reflects (i) the extent to which the vesting period has expired and (ii) the Group’s best estimate of the number of equity instruments that will ultimately vest. No adjustment is made for the likelihood of market performance conditions being met as the effect of these conditions is included in the determination of fair value at grant date. The charge or credit to the consolidated statement of comprehensive income for a period represents the movement in cumulative expense recognised as at the beginning and end of that period.
No expense is recognised for awards that do not ultimately vest, except for awards where vesting is only conditional upon a market condition.
For
per
sona
l use
onl
y

52 GBM Resources Annual Report 2013
Notes to the Financial StatementsFor the Year Ended 30 June 2013
1. Statement of Significant Accounting Policies (continued)
r) Share Based Payments (continued)If the terms of an equity-settled award are modified, as a minimum an expense is recognised as if the terms had not been modified. In addition, an expense is recognised for any modification that increases the total fair value of the share based payment arrangement, or is otherwise beneficial to the employee, as measured at the date of modification.
If an equity-settled award is cancelled, the cumulative expense recognised in respect of that award is transferred from its respective reserve to accumulated losses. However, if a new award is substituted for the cancelled award and designated as a replacement award on the date that it is granted, the cancelled and new awards are treated as if they were a modification of the original award, as described in the previous paragraph.
s) Share CapitalOrdinary shares are classified as equity. Incremental costs directly attributable to the issue of new shares or options are shown in equity as a deduction, net of tax, from the proceeds.
t) Earnings Per ShareBasic earnings per share (“EPS”) is calculated by dividing the net profit or loss attributable to members of the Company for the reporting period, after excluding any costs of servicing equity (other than ordinary shares and converting preference shares classified as ordinary shares for EPS calculation purposes), by the weighted average number of ordinary shares of the Company, adjusted for any bonus element.
Diluted EPS is calculated by dividing the basic EPS earnings, adjusted by the after tax effect of financing costs associated with dilutive potential ordinary shares and the effect on revenues and expenses of conversion, by the weighted average number of ordinary shares and potential dilutive ordinary shares, adjusted for any bonus element.
u) Critical Accounting Estimates and JudgementsEstimates and judgements are continually evaluated and are based on historical experience and other factors, including expectations of future events that may have a financial impact on the Group and that are believed to be reasonable under the circumstances.
Accounting for capitalised mineral exploration and evaluation expenditureThe Group’s accounting policy is stated at 1(m). A regular review is undertaken of each area of interest to determine the reasonableness of the continuing carrying forward of costs in relation to that area of interest.
Share based paymentsThe Group uses independent advisors to assist in valuing share based payments.
Estimates and assumptions used in these valuations are disclosed in the notes in periods when these share based payments are made.
For
per
sona
l use
onl
y

GBM Resources Annual Report 2013 53
2. Financial Risk ManagementThe Group has exposure to a variety of risks arising from its use of financial instruments. This note presents information about the Group’s exposure to the specific risks, and the policies and processes for measuring and managing those risks. Further quantitative disclosures are included throughout this financial report. The Board of Directors has overall responsibility for the risk management framework.
a) Credit riskCredit risk is the risk of financial loss to the Group if a customer or counterparty to a financial instrument fails to meet its contractual obligations, and arises principally from transactions with customers and investments.
Trade and other receivablesThe Group has no investments and the current nature of the business activity does not result in trading receivables. The receivables that the Group recognises through its normal course of business are short term in nature and the most significant (in quantity) is the receivable from the Australian Taxation Office and interest receivable. The risk of non recovery of receivables from this source is considered to be negligible.
Cash depositsThe Group’s primary banker is Commonwealth Bank. At balance date all operating accounts and funds held on deposit are with this bank. The Directors believe any risk associated with the use of only one bank is mitigated by its size and reputation. Except for this matter the Group currently has no significant concentrations of credit risk.
b) Liquidity riskLiquidity risk is the risk that the Group will not be able to meet its financial obligations as they fall due. The Group’s approach to managing liquidity is to ensure, as far as possible, that it will always have sufficient liquidity to meet its liabilities when due, under both normal and stressed conditions, without incurring unacceptable losses or risking damage to the Group’s reputation.
The Group manages its liquidity risk by monitoring its cash reserves and forecast spending. Management is cognisant of the future demands for liquid finance resources to finance the Group’s current and future operations, and consideration is given to the liquid assets available to the Group before commitment is made to future expenditure or investment.
c) Market riskMarket risk is the risk that changes in market prices, such as foreign exchange rates, interest rates and equity prices will affect the Group’s income or the value of its holdings of financial instruments. The objective of market risk management is to manage and control market risk exposures within acceptable parameters, while optimising any return.
Currency riskThe Group is not exposed to any currency risk other than the respective functional currencies of each Company within the Group, the Australian dollar (AUD).
Interest rate riskAs the Group has significant interest bearing assets, the Group’s income and operating cash flows are materially exposed to changes in market interest rates. The assets are short term interest bearing deposits, and no financial instruments are employed to mitigate risk (Note 16 – Financial Instruments).
d) Capital managementThe Board’s policy is to maintain a strong capital base so as to maintain investor, creditor and market confidence and to sustain future development of the business. The Board of Directors monitors capital expenditure and cash flows as mentioned in (b).F
or p
erso
nal u
se o
nly

54 GBM Resources Annual Report 2013
Notes to the Financial StatementsFor the Year Ended 30 June 2013
Consolidated
2013 2012 Note $ $3. RevenueInterest income 46,664 122,622Joint venture management fee 383,737 325,329
430,401 447,951
4. ExpensesEmployee expenses Gross employee benefit expense: Wages and salaries 1,668,099 1,763,943 Directors’ fees 72,000 48,000 Superannuation expense 147,137 158,475 Other employee costs 78,504 131,919
1,965,740 2,102,337 Less amount allocated to exploration (1,530,104) (1,621,910)
Net consolidated statement of comprehensive income employee benefit expense 435,636 480,427
Depreciation expense: Office equipment and software 9 21,250 24,385 Site equipment 9 2,083 2,083 Motor vehicles 9 16,330 15,524
39,663 41,992
Exploration costs: Unallocated exploration costs 136,381 159,310 Exploration costs written off 8 977,782 53,487
1,114,163 212,797
5. Income Taxa) Income tax recognised in profit and lossThe prima facie tax benefit on the operating result is reconciled to the income tax provided in the financial statements as follows:
Accounting loss before income tax from continuing operations (2,011,993) (1,455,503)
Income tax benefit calculated at 30% (603,598) (436,651)Share based payments 7,000 153,770Capital raising costs claimed (58,789) (87,110)Exploration costs written off 293,335 16,046Unused tax losses and temporary differences not recognised as deferred tax assets 362,052 353,945R&D tax concession (284,950) (258,692)
Income tax (benefit) reported in the consolidated statement of comprehensive income (284,950) (258,692)
The tax rate used in the above reconciliation is the corporate tax rate of 30% payable by Australian corporate entities on taxable profits under Australian tax law. There has been no change in the corporate tax rate when compared with the previous reporting period.
For
per
sona
l use
onl
y

GBM Resources Annual Report 2013 55
Consolidated
2013 2012 $ $5. Income Tax (continued)
b) Unrecognised deferred tax assets and liabilitiesThe following deferred tax assets and liabilities have not been brought to account:
Unrecognised deferred tax assets relate to: Losses available for offset against future taxable income 5,484,166 4,654,374 Capital raising costs 130,512 164,087 Accrued expenses and liabilities 73,976 131,338
5,688,654 4,949,799
Unrecognised deferred tax liabilities relate to: Exploration expenditure (4,122,027) (3,912,746)
(4,122,027) (3,912,746)
Net unrecognised deferred tax asset 1,566,627 1,037,053
The deductible temporary differences and tax losses do not expire under current tax legislation. Potential deferred tax assets attributable to tax losses carried forward have not been brought to account because the Directors do not believe it is appropriate to regard realisation of the future tax benefit as probable.
The potential future income tax benefit will only be obtained if:
(i) the Group derives future assessable income of a nature and an amount sufficient to enable the benefit to be realised in accordance with Division 170 of the Income Tax Assessment Act 1997;
(ii) the Group companies continue to comply with the conditions for deductibility imposed by the law; and
(iii) no changes in tax legislation adversely affect the Group in realising the benefits.
Consolidated
2013 2012 $ $6. Loss Per ShareLoss used in calculation of loss per share (1,727,043) (1,196,811)
Cents Cents
Basic earnings/(loss) per share (0.7) (0.5)
# #Weighted average number of shares used in the calculation of earnings per share 266,121,118 222,862,253
Options and performance share rightsOptions and share rights to acquire ordinary shares granted by the Company and not exercised at the reporting date have been included in the determination of diluted earnings per share to the extent to which they are dilutive.
For
per
sona
l use
onl
y

56 GBM Resources Annual Report 2013
Notes to the Financial StatementsFor the Year Ended 30 June 2013
Consolidated
2013 2012 Note $ $7. Trade and Other ReceivablesCurrent Amounts due from farm-in partner 95,129 – Research and development tax concession – 258,692 GST recoverable 36,118 59,158 Other debtors 3,548 93,862
134,795 411,712
non-current Security and environmental bonds 43,608 40,687
43,608 40,687
8. Exploration and Evaluation ExpenditureExploration and evaluation phase: Capitalised costs at the start of the financial year 13,202,731 9,478,299 Costs capitalised during the financial year 1,515,140 3,777,919 Capitalised costs written off during the financial year 4 (977,782) (53,487)
Capitalised costs at the end of the financial year 13,740,089 13,202,731
Ultimate recoupment of exploration and evaluation expenditure carried forward is dependent on successful development and commercial exploitation or alternatively, sale of the respective areas.
9. Property, Plant and EquipmentCarrying values at 30 June 2013:
Land: Cost 308,499 308,499 Depreciation – –
308,499 308,499Office equipment and software: Cost 153,402 147,330 Depreciation (123,087) (101,838)
30,315 45,492Site equipment and plant: Cost 22,545 22,545 Depreciation (6,800) (4,717)
15,745 17,828Motor vehicles: Cost 130,633 130,633 Depreciation (40,221) (23,891)
90,412 106,742
Total 444,971 478,561
For
per
sona
l use
onl
y

GBM Resources Annual Report 2013 57
Consolidated
2013 2012 Note $ $9. Property, Plant and Equipment (continued)
Reconciliation of movements:Land: Opening net book value 308,499 308,499 Cost of additions – – Disposals – – Depreciation – –
Closing net book value 308,499 308,499
Office equipment and software: Opening net book value 45,492 27,212 Cost of additions 6,073 42,665 Disposals – – Depreciation 4 (21,250) (24,385)
Closing net book value 30,315 45,492
Site equipment and plant: Opening net book value 17,828 19,910 Cost of additions – – Disposals – – Depreciation 4 (2,083) (2,082)
Closing net book value 15,745 17,828
Motor vehicles: Opening net book value 106,742 98,635 Cost of additions – 23,631 Disposals – – Depreciation 4 (16,330) (15,524)
Closing net book value 90,412 106,742
Total 444,971 478,561
10. Trade and Other PayablesCurrent Trade creditors 141,486 580,918 Sundry creditors and accruals 208,012 515,190 Employee leave liabilities 96,587 81,698
Advanced JV Farm-in funds unspent 446,085 1,177,806 – 258,041
446,085 1,435,847For
per
sona
l use
onl
y

58 GBM Resources Annual Report 2013
Notes to the Financial StatementsFor the Year Ended 30 June 2013
Issue 2013 2012 2013 2012 price no. No. $ $11. Issued CapitalIssued capital at the balance date 327,415,003 236,181,003 21,118,244 18,228,936
Movements in issued capital: On issue at the start of the year 236,181,003 219,793,503 18,228,936 16,950,744 Shares issued on the exercise
of vested performance rights $0.09 – 1,100,000 – 99,000 Shares issued on the exercise
of vested performance rights $0.10 – 650,000 – 65,000 Share placement $0.08 – 13,937,500 – 1,115,000 Shares issued in consideration
for corporate services $0.10 – 700,000 – 70,000 Share purchase plan $0.05 10,884,000 – 544,200 – Share placement $0.05 20,000,000 – 1,000,000 – Shares issued to acquire
phosphate rights $0.05 10,000,000 – 500,000 – Shares issued on the exercise
of vested performance rights $0.10 350,000 – 35,000 – Share placement $0.02 50,000,000 – 1,000,000 – Share issue costs – – (189,892) (70,808)
On issue at the end of the reporting year 327,415,003 236,181,003 21,118,244 18,228,936
Shares Subject to Restriction AgreementAt balance date there were no ordinary shares subject to any restrictions.
12. Options and Performance RightsDetails of the Company’s Incentive Option Scheme are provided at Note 14.
2013 2012 2013 2012 no. No. $ $
a) Options over unissued sharesOptions on issue at the balance date – 129,493,124 – 698,146
Movements in options: Options on issue at the start of the year 129,493,124 113,793,124 698,146 698,146 Options issued for corporate services
(Note 13) – 15,700,000 – – Options cancelled on expiry (129,493,124) – (698,146)
Options on issue at the end of the reporting year – 129,493,124 – 698,146
i) Options Issued, Exercised and Expired During the YearDuring the financial year the Company granted no options over unissued shares (2012: 15,700,000).During the year, no options over unissued shares were exercised (2012: Nil).During the year, 129,493,124 options were cancelled on expiry of their exercise term (2012: Nil).
ii) Options on Issue at the Balance DateThe number of options outstanding over unissued ordinary shares at 30 June 2013 is nil (2012: 129,493,124).
For
per
sona
l use
onl
y

GBM Resources Annual Report 2013 59
12. Options and Performance Rights (continued)
a) Options over unissued shares (continued)
iii) Subsequent to the Balance DateOther than the following option issues, no options have been issued, exercised or cancelled between the end of the financial year and the date of this report:
• 50 million options issued, exercisable at 3.5 cents each on or before 30 June 2016, pursuant to a share placement;
• 20 million options issued, exercisable at 3.5 cents each on or before 30 June 2016, pursuant to a corporate services agreement; and
• 64,746,562 options issued, exercisable at 3.5 cents each on or before 30 June 2016, pursuant to a priority entitlement offer closing on 13 August 2013.
iv) Basis and assumptions used in the valuation of options granted in the periodThere were no options granted during the period.
b) Performance Share RightsDetails of the Company’s Performance Rights Plan are provided at Note 14.
Issue 2013 2012 2013 2012 price no. No. $ $
Performance rights on issue at the balance date – 350,000 – –
Movements in share rights: Share rights on issue at the
start of the year 350,000 1,100,000 – – Share rights issued to employees
during the year Nil – 1,300,000 – – Vested share rights exercised
during the year (350,000) (1,750,000) – – Unvested share rights lapsed – (300,000)
Performance share rights on issue at the end of the reporting year – 350,000 – –
Number of vested performance share rights at the end of the reporting year – – – –
i) Performance share rights Issued, Exercised and Expired during the YearDuring the financial year the Company granted nil performance share rights (2012: 1,300,000)During the year, 350,000 vested share rights were exercised into ordinary fully paid shares (2012: 1,750,000).No unvested performance share rights were cancelled on cessation of employment (2012: 300,000).
ii) Performance share rights on Issue at the Balance DateThe number of share rights, vested unexercised and un-vested at 30 June 2013 is nil (2012: 350,000).
iii) Subsequent to the Balance DateNo share rights have been granted, exercised or cancelled subsequent to the reporting date.
iv) Basis and assumptions used in the valuation of share rights granted in the periodShare rights are valued at the underlying market value of the ordinary shares over which they are granted.
For
per
sona
l use
onl
y

60 GBM Resources Annual Report 2013
Notes to the Financial StatementsFor the Year Ended 30 June 2013
Consolidated
2013 2012 $ $13. Reserves and Accumulated LossesShare based payments reservei
Opening balance 920,638 642,071 Employee share based payments – performance rights 23,333 137,167 Share based payments – options issued for corporate services – 305,400 Transferred to issued capital on exercise of performance rights (35,000) (164,000) Transferred to accumulated losses on cancellation of expired options (908,971) –
Closing balance – 920,638
Option reserveii
Opening balance 698,146 698,146 Transferred to accumulated losses on cancellation of expired options (698,146) –
Closing balance – 698,146
Accumulated Losses Opening balance (5,559,052) (4,362,241) Net loss attributable to the members of the Company (1,727,043) (1,196,811) Transferred from reserves on cancellation of expired options 1,607,117 –
Closing balance (5,678,978) (5,559,052)
i) Share based payments reserveThe share based payments reserve represents the fair value of performance share rights and options, issued as consideration for services to employees or consultants as remuneration, or to third parties for the acquisition of assets, goods or services.
ii) Option reserveThe option reserve represents the proceeds received on the issue of options.
14. Employee Benefits Details of the Company’s share right and option plans, under which share rights and options are issuable to employees, directors and consultants are summarised below. Details of share rights and options issued to Directors and executives are set out in Note 20.
Incentive Option PlanThe Company has a formal option plan for the issue of options to employees, directors and consultants, which was approved by shareholders at the Company’s Annual General Meeting on 30 November 2010. Options are granted free of charge and are exercisable at a fixed price in accordance with the terms of the grant. Options over unissued shares are issued under the terms of the Plan at the discretion of the Board.
There are no options on issue under the Incentive Option Plan at 30 June 2013 (2012: nil). Refer to Note 12(a).
Performance Rights PlanThe Company has a formal plan for the issue of performance share rights to employees, which was approved by shareholders at the Company’s Annual General Meeting on 30 November 2010. Share rights are granted free of charge and are exercisable into ordinary fully paid shares in accordance with the terms of the grant. Share rights are issued to employees under the terms of the Plan at the discretion of the Board.
There are nil share rights on issue under the Performance Rights Plan at 30 June 2013 (2012: 350,000). Refer to Note 12(b).
For
per
sona
l use
onl
y
GBM Resources Annual Report 2013 61
15. Segment ReportingOperating segments are identified and segment information disclosed, where appropriate, on the basis of internal reports reviewed by the Company’s Board of Directors, being the Group’s Chief Operating Decision Maker, as defined by AASB 8.
The Group has identified its operating segments based on the internal reports that are reviewed and used by the Board of Directors in assessing performance and determining the allocation of resources. Reportable segments disclosed are based on aggregating operating segments, where the segments have similar characteristics. The Group’s sole activity is mineral exploration and resource development wholly within its Brightlands IOCG project in North Queensland, and its Malmsbury Gold Project in Victoria, Australia, therefore it has aggregated all operating segments into the one reportable segment being mineral exploration.
The reportable segment is represented by the primary statements forming these financial statements.
16. Financial InstrumentsCredit riskThe Directors do not consider that the Group’s financial assets are subject to anything more than a negligible level of credit risk, and as such no disclosures are made. Refer to Note 2(a).
Impairment lossesThe Directors do not consider that any of the Group’s financial assets are subject to impairment at the reporting date. No impairment expense or reversal of impairment charge has occurred during the reporting period.
Liquidity riskThe following are the contractual maturities of financial liabilities, including estimated interest payments and excluding the impact of netting agreements. Refer to Note 2(b):
Carrying Contractual 6 months 6-12 1-2 2-5 More than Consolidated amount cash flows or less months years years 5 years $ $ $ $ $ $ $
30 June 2013Trade and other payables 141,486 141,486 141,486 – – – –
141,486 141,486 141,486 – – – –
30 June 2012Trade and other payables 580,918 580,918 580,918 – – – –
580,918 580,918 580,918 – – – –
The Group does not have any interest bearing liabilities to report a weighted average interest rate.
Currency riskThe Group does not have any direct exposure to foreign currency risk, other than in respect of its impact on the economy and commodity prices generally. Refer to Note 2 (c).
Interest rate riskAt the reporting date the interest profile of the Group’s interest-bearing financial instruments were:
Consolidated
2013 2012 $ $Fixed rate instruments: Financial liabilities – –
– –
Variable rate instruments: Financial assets 1,521,888 1,590,824
1,521,888 1,590,824
For
per
sona
l use
onl
y

62 GBM Resources Annual Report 2013
Notes to the Financial StatementsFor the Year Ended 30 June 2013
16. Financial Instruments (continued)
Fair value sensitivity analysis for fixed rate investmentsThe Group does not account for any fixed rate financial assets and liabilities at fair value through profit or loss, and the Group does not designate derivatives as hedging instruments under a fair value hedge accounting model. Therefore a change in interest rates at the reporting date would not affect profit or loss.
Cash flow sensitivity analysis for variable rate instrumentsA change of 100 basis points in interest rates at the reporting date would have increased/(decreased) equity and profit or loss by the amounts shown below. This analysis assumes that all other variables remain constant.
Profit and Loss Equity 100bp 100bp 100bp 100bp increase decrease increase decrease $ $ $ $
30 June 2013Variable rate instruments 15,219 (15,219) 15,219 (15,219)
30 June 2012Variable rate instruments 15,908 (15,908) 15,908 (15,908)
Fair values
Fair values versus carrying amountsThe carrying amounts of financial assets and liabilities as described in the consolidated statement of financial position represent their estimated net fair value.
17. Commitmentsa) ExplorationThe Group has certain obligations to perform minimum exploration work on mineral leases held. These obligations may vary over time, depending on the Group’s exploration programmes and priorities. As at balance date, total exploration expenditure commitments on tenements held by the Group have not been provided for in the financial statements. These obligations are also subject to variations by farm-out arrangements or sale of the relevant tenements. This commitment does not include the expenditure commitments which are the responsibility of the joint venture partners.
b) Operating Lease CommitmentsThe Group has no operating lease commitments.
c) Contractual CommitmentThe Group has no contractual commitments.
For
per
sona
l use
onl
y

GBM Resources Annual Report 2013 63
Consolidated
2013 2012 $ $18. Notes to the Statement of Cash Flowsa) Cash AssetsCash at bank and on hand 1,389,984 1,465,538Bank at call cash account 131,904 125,286
Total cash and cash equivalents 1,521,888 1,590,824
The Bank at call account holds funds at call subject to certain trading restrictions and pays interest at an average of 5.20% (2012:5.20%).
b) Reconciliation of Loss from Ordinary Activities after Income Tax to net Cash Used In Operating Activities
Profit/(Loss) after income tax (1,727,043) (1,196,811)
Add (less) non-cash items: Depreciation 39,662 41,992 Share based payments 23,333 512,567 Exploration expenditure written off and expensed 1,114,163 212,797
Changes in assets and liabilities: Increase/(decrease) in trade creditors and accruals 18,530 (633) (Increase)/decrease in sundry receivables 91,962 (96,561) (Increase)/decrease in research and development tax concession receivable 258,692 (258,692)
Net cash flow from operations (180,701) (785,341)
During the 2013 financial year the Company issued 10,000,000 ordinary fully paid shares in consideration for the acquisition of the 70% Bungalien Phosphate rights from Swift Venture Corporation. The value of the shares amounted to $500,000.
During the 2012 financial year the Company issued 15,700,000 listed options, exercisable at 20 cents each on or before 30 June 2013, in consideration for corporate and public relations services to the Company. The value of the options granted amounted to $305,400).
During the 2012 financial year the Company issued 700,000 ordinary fully paid shares in consideration for corporate services to the Company. The value of the shares issued amounted to $70,000.
19. Auditor’s RemunerationAmounts received or receivable by HLB Mann Judd for: Audit and review of financial reports 27,750 26,970
For
per
sona
l use
onl
y

64 GBM Resources Annual Report 2013
Notes to the Financial StatementsFor the Year Ended 30 June 2013
2013 2012 % %20. Controlled Entitiesa) Particulars in Relation to Ownership of Controlled Entities
Belltopper Hill Pty Ltd 100 100Syndicated Resources Pty Ltd 100 100Willaura Minerals Pty Ltd 100 100Isa Brightlands Pty Ltd 100 100Isa Tenements Pty Ltd 100 100Bungalien Phosphate Pty Ltd 100 100
$ $b) GBM Resources Limited –
Investments in Controlled EntitiesBelltopper Hill Pty Ltd 596,850 596,850Syndicated Resources Pty Ltd 100 100Willaura Minerals Pty Ltd – 810,000Isa Brightlands Pty Ltd 1 1Isa Tenements Pty Ltd 1 1Bungalien Phosphate Pty Ltd 10 10
596,962 1,406,962
During the 2013 financial year the Company recognised a provision against the investment in Willaura Minerals Pty Ltd. The fair value of this investment had previously been recognised as fair value acquisition costs on consolidation in respect of the Willaura Minerals assets acquired on the Company’s initial public offer. The impairment expense has been included in the write off of exploration costs (Note 4).
c) Loans to/(from) Controlled EntitiesBelltopper Hill Pty Ltd 2,204,082 2,044,873Syndicated Resources Pty Ltd – –Willaura Minerals Pty Ltd – (810,000)Isa Brightlands Pty Ltd 7,630,888 4,466,859Isa Tenements Pty Ltd 1,368,324 810,211Bungalien Phosphate Pty Ltd – –
d) Contribution to Consolidated ResultGBM Resources Limited (1,726,492) (1,196,811)Belltopper Hill Pty Ltd – –Syndicated Resources Pty Ltd – –Willaura Minerals Pty Ltd – –Isa Brightlands Pty Ltd – –Isa Tenements Pty Ltd – –Bungalien Phosphate Pty Ltd – –
Total (1,726,492) (1,196,811)
For
per
sona
l use
onl
y

GBM Resources Annual Report 2013 65
21. Key Management Personnel Disclosuresa) Details of Key Management Personnel The following were key management personnel of the Group at any time during the year and unless otherwise stated were key management personnel for the entire year.
Non-Executive DirectorsCameron Switzer – Non-Executive DirectorGuan Huat Loh – Non-Executive Director
Executive DirectorsPeter Thompson – Managing DirectorNeil Norris – Exploration Director Consolidated
2013 2012 $ $
Total remuneration paid to key management personnel during the year:
Short-term benefits 642,495 612,486Post-employment benefits 49,542 49,540
692,037 662,026
b) Option Holdings of Key Management Personnel
Balance at Vested at Beginning Options Options Balance at 30 June 2013 Director of Year Exercised Expired End of Year Exercisable
P Thompson 4,937,525 – (4,937,525) – –C Switzer 4,346,875 – (4,346,875) – –N Norris 3,093,635 – (3,093,635) – –G Loh 17,800,000 – (17,800,000) – –
c) Shareholdings of Key Management Personnel
Balance at Granted Issued on Net Beginning as Exercise Change Balance at Director of Year Remuneration of Options Other End of Year
P Thompson 9,562,582 – – 300,000 9,862,582C Switzer 6,393,750 – – 300,000 6,693,750N Norris 9,250,000 – – 300,000 9,550,000G Loh 11,067,131 – – 1,565,000 12,632,131
d) Other Transactions and Balances with Key Management PersonnelDuring the financial year the Company acquired the 70% interest in the Bungalien phosphate rights that it didn’t own from Swift Venture Corporation, a Company associated with one of the directors of the Company, Mr Sunny Loh. Subsequent to shareholder approval at the Company’s annual general meeting, the Company issued, on 20 December 2012, 10 million shares to Swift Venture Corporation (and its nominees) as consideration for the acquisition.
Other than the above, there are no transactions with Directors, or Director related entities or associates, other than those reported in the remuneration disclosures in the Remuneration Report contained in the Directors’ Report.
For
per
sona
l use
onl
y

66 GBM Resources Annual Report 2013
Notes to the Financial StatementsFor the Year Ended 30 June 2013
Consolidated
2013 2012 $ $22. Related Party TransactionsTotal amounts receivable and payable from entities in the wholly-owned group (see Note 20 for details of controlled entities) at balance date:
non-Current ReceivablesLoans to controlled entities 11,203,294 10,087,783
non-Current PayablesLoans from controlled entities – (810,000)
23. Events Subsequent to Balance DateOther than the following, there has not arisen in the interval between the end of the financial year and the date of this report any item, transaction or event of a material and unusual nature likely, in the opinion of the Directors of the Company to affect substantially the operations of the Group, the results of those operations or the state of affairs of the Group in subsequent financial years.
• On22July2013theCompanyobtainedshareholderapprovaltoproceedwiththeissueofsharesfortheacquisition of the 40% interest in Angka Alamjaya Sdn Bhd (AASB) and to proceed with a Priority Entitlement Offer of options to holders of listed GBZOA options that expired on 30 June 2013;
• On13August2013,theCompany’sPriorityEntitlementOfferclosedwiththesubsequentissueof64,746,562listed options (GBZO) exercisable at 3.5 cents each on or before 30 June 2016. Entitlements under the offer were allotted on 19 August 2013 and the offer was finalised with the issue of the shortfall options on 27 August 2013. Total proceeds of $323,733 were received from the issue of these options;
• On22August2013theCompanycompletedtheissueof50millionlistedoptions(GBZO)exercisableat3.5 cents each on or before 30 June 2016, pursuant to shareholder approval received on 22 July 2013 and which were securities attaching to a share placement completed on 28 June 2013;
• On30August2013theCompanyissued20millionlistedoptions(GBZO)exercisableat3.5centseachonorbefore 30 June 2016, to Alvito Capital Holdings Inc for corporate advisory and promotional services provided to the Company;
• On19August2013theCompanyadvisedthatithadcompletedtheAcquisitionandJointVentureAgreementpursuant to which the Company would acquire a 40% interest in AASB, a Malaysian Company holding the mining concession for the Lubuk Mandi Gold Project, and enter into a joint venture with AASB to assess, and if positive, commence recommissioning of the Lubuk Mandi Gold Project.
On 30 August 2013 the Company completed the issue of 57,779,118 ordinary fully paid shares to nominees of AASB in respect of the acquisition; and
• On2September2013theCompanyappointedMrChiauWoeiLim,ManagingDirectorofAASB,totheBoardas a Non-Executive Director of GBM Resources Limited.
24. DividendsThere are no dividends paid or payable during the year ended 30 June 2013 or the 30 June 2012 comparative year.
For
per
sona
l use
onl
y
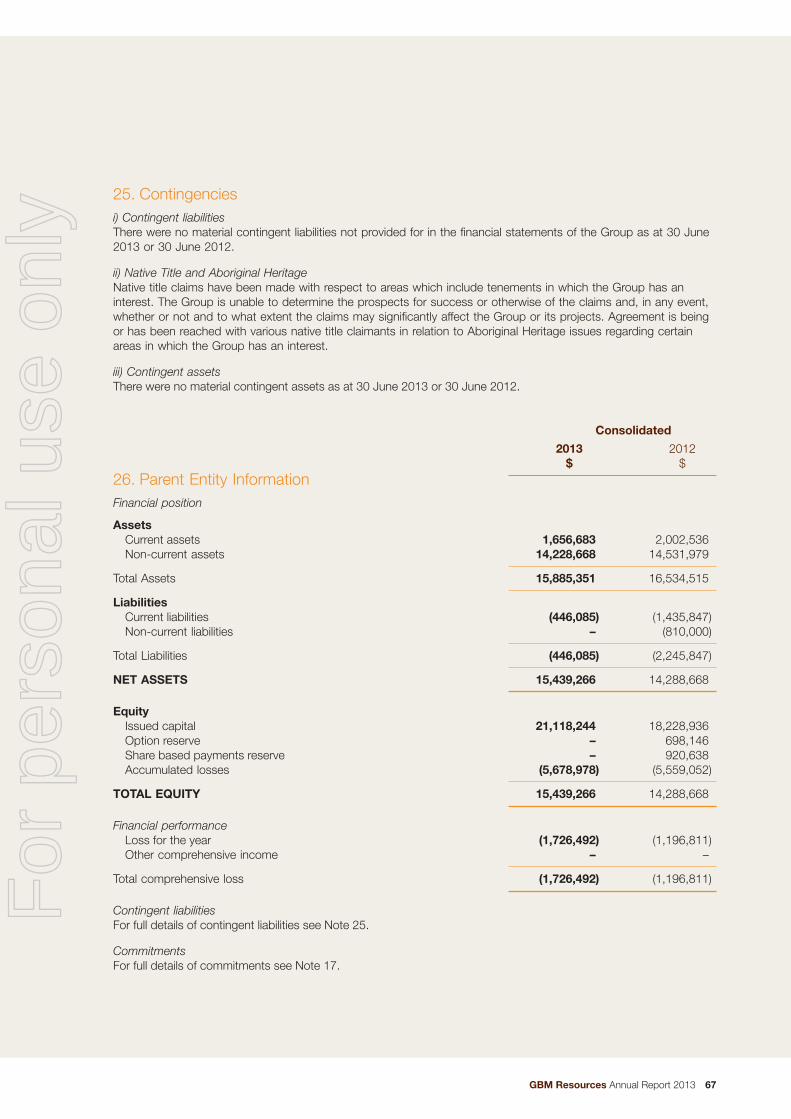
GBM Resources Annual Report 2013 67
25. Contingenciesi) Contingent liabilitiesThere were no material contingent liabilities not provided for in the financial statements of the Group as at 30 June 2013 or 30 June 2012.
ii) Native Title and Aboriginal HeritageNative title claims have been made with respect to areas which include tenements in which the Group has an interest. The Group is unable to determine the prospects for success or otherwise of the claims and, in any event, whether or not and to what extent the claims may significantly affect the Group or its projects. Agreement is being or has been reached with various native title claimants in relation to Aboriginal Heritage issues regarding certain areas in which the Group has an interest.
iii) Contingent assetsThere were no material contingent assets as at 30 June 2013 or 30 June 2012.
Consolidated
2013 2012 $ $26. Parent Entity InformationFinancial position
Assets Current assets 1,656,683 2,002,536 Non-current assets 14,228,668 14,531,979
Total Assets 15,885,351 16,534,515
Liabilities Current liabilities (446,085) (1,435,847) Non-current liabilities – (810,000)
Total Liabilities (446,085) (2,245,847)
nET ASSETS 15,439,266 14,288,668
Equity Issued capital 21,118,244 18,228,936 Option reserve – 698,146 Share based payments reserve – 920,638 Accumulated losses (5,678,978) (5,559,052)
TOTAL EQUITY 15,439,266 14,288,668
Financial performance Loss for the year (1,726,492) (1,196,811) Other comprehensive income – –
Total comprehensive loss (1,726,492) (1,196,811)
Contingent liabilitiesFor full details of contingent liabilities see Note 25.
CommitmentsFor full details of commitments see Note 17.
For
per
sona
l use
onl
y

68 GBM Resources Annual Report 2013
Directors’ DeclarationFor the Year Ended 30 June 2013
1. In the opinion of the Directors:
a) the accompanying financial statements and notes are in accordance with the Corporations Act 2001 including:
i. giving a true and fair view of the Group’s financial position as at 30 June 2013 and of its performance for the year then ended; and
ii. complying with Accounting Standards and Corporations Regulations 2001.
b) there are reasonable grounds to believe that the Company will be able to pay its debts as and when they become due and payable.
c) the financial statements and notes are in accordance with International Financial Reporting Standards issued by the International Accounting Standards Board.
2. This declaration has been made after receiving the declarations required to be made to the directors in accordance with Section 295A of the Corporations Act 2001 for the financial year ended 30 June 2013.
This declaration is made in accordance with a resolution of the Board of Directors.
Peter Thompson Executive Chairman
Dated this 27th day of September 2013
For
per
sona
l use
onl
y

GBM Resources Annual Report 2013 69
HLB Mann Judd (WA Partnership) ABN 22 193 232 714 Level 4, 130 Stirling Street Perth WA 6000. PO Box 8124 Perth BC 6849 Telephone +61 (08) 9227 7500. Fax +61 (08) 9227 7533. Email: [email protected]. Website: http://www.hlb.com.au Liability limited by a scheme approved under Professional Standards Legislation
HLB Mann Judd (WA Partnership) is a member of
International, a worldwide organisation of accounting firms and business advisers.
51
INDEPENDENT AUDITOR’S REPORT To the members of GBM Resources Limited
Report on the Financial Report
We have audited the accompanying financial report of GBM Resources Limited (“the company”), which comprises the consolidated statement of financial position as at 30 June 2013, the consolidated statement of comprehensive income, the consolidated statement of changes in equity and the consolidated statement of cash flows for the year then ended, notes comprising a summary of significant accounting policies and other explanatory information, and the directors’ declaration for the consolidated entity. The consolidated entity comprises the company and the entities it controlled at the year’s end or from time to time during the financial year.
Directors’ responsibility for the financial report
The directors of the company are responsible for the preparation of the financial report that gives a true and fair view in accordance with Australian Accounting Standards and the Corporations Act 2001 and for such internal control as the directors determine is necessary to enable the preparation of the financial report that is free from material misstatement, whether due to fraud or error.
In Note 1(b), the directors also state, in accordance with Accounting Standard AASB 101: Presentation of Financial Statements, that the financial report complies with International Financial Reporting Standards.
Auditor’s responsibility
Our responsibility is to express an opinion on the financial report based on our audit. We conducted our audit in accordance with Australian Auditing Standards. Those standards require that we comply with relevant ethical requirements relating to audit engagements and plan and perform the audit to obtain reasonable assurance whether the financial report is free from material misstatement.
An audit involves performing procedures to obtain audit evidence about the amounts and disclosures in the financial report. The procedures selected depend on the auditor’s judgement, including the assessment of the risks of material misstatement of the financial report, whether due to fraud or error. In making those risk assessments, the auditor considers internal control relevant to the company’s preparation and fair presentation of the financial report in order to design audit procedures that are appropriate in the circumstances, but not for the purpose of expressing an opinion on the effectiveness of internal control. An audit also includes evaluating the appropriateness of accounting policies used and the reasonableness of accounting estimates made by the directors, as well as evaluating the overall presentation of the financial report.
Our audit did not involve an analysis of the prudence of business decisions made by directors or management.
We believe that the audit evidence we have obtained is sufficient and appropriate to provide a basis for our audit opinion.
Independence
In conducting our audit, we have complied with the independence requirements of the Corporations Act 2001.
For
per
sona
l use
onl
y
70 GBM Resources Annual Report 2013
52
Auditor’s opinion In our opinion:
(a) the financial report of GBM Resources Limited is in accordance with the Corporations Act 2001, including: (i) giving a true and fair view of the consolidated entity’s financial position as at 30 June 2013 and
of its performance for the year ended on that date; and (ii) complying with Australian Accounting Standards and the Corporations Regulations 2001; and
(b) the financial report also complies with International Financial Reporting Standards as disclosed in Note 1(b).
Report on the Remuneration Report
We have audited the remuneration report included in the directors’ report for the year ended 30 June 2013. The directors of the company are responsible for the preparation and presentation of the remuneration report in accordance with section 300A of the Corporations Act 2001. Our responsibility is to express an opinion on the remuneration report, based on our audit conducted in accordance with Australian Auditing Standards.
Auditor’s opinion
In our opinion the remuneration report of GBM Resources Limited for the year ended 30 June 2013 complies with section 300A of the Corporations Act 2001.
HLB Mann Judd Chartered Accountants
L Di Giallonardo Partner
Perth, Western Australia27 September 2013
For
per
sona
l use
onl
y

GBM Resources Annual Report 2013 71
ASX Additional Information
Pursuant to the Listing Rules of the Australian Securities Exchange Limited, the shareholder information set out below was applicable as at 27 September 2013.
a. Distribution of Equity Securities
Range
Listed Shares (GBZ) Listed Options (GBZO)
Number of Holders
Securities Held
Number of Holders
Securities Held
1 – 1,000 52 10,725 1 800
1,001 – 5,000 84 328,967 3 10,500
5,001 – 10,000 152 1,331,559 3 23,750
10,001 – 100,000 563 24,705,239 22 920,090
100,001 and over 309 358,817,631 81 133,791,422
1,160 385,194,121 110 134,746,562
There are 296 shareholders holding unmarketable parcels represented by 11,111 shares.
b. Substantial ShareholdersThe Company has received no current notifications for inclusion on the Register of Substantial Shareholders (who hold 5% or more of the issued capital).
c. Twenty Largest Shareholders
ShareholderShares Held
% of Issued Capital
UOB Kay Hian Pte Ltd <Clients A/c> 61,491,851 15.96%Citicorp Nominees Pty Ltd 51,574,228 13.39%Chew Leok Chuan 19,900,000 5.17%Sung Yoon Chon 13,200,000 3.42%HSBC Custody Nominees (Australia) Limited 10,762,421 2.79%Tan Thiam Chye 10,000,000 2.60%Lion Resources Development Pte Ltd 10,000,000 2.60%Superfine Nominees Pty Ltd 9,862,582 2.56%Swift Venture Holdings Corporation 8,366,708 2.17%Cheng Ee Huang 5,500,000 1.43%Constance Tan Chai Ai 4,900,000 1.27%Carpentaria Corporation Pty Ltd <Daikoku Inv A/c> 4,856,250 1.26%Neil Norris <North Atlantic S/F A/c> 4,800,000 1.25%Australian Global Capital Pty Ltd 4,500,000 1.17%Bell Potter Nominees Ltd 4,496,000 1.17%De Gracie Nominees Pty Ltd <Le Havre A/c> 3,750,000 0.97%Hong Wei Boon 3,500,000 0.91%Kevin James Hendry 2,833,334 0.74%Ivan Perry Wu 2,626,500 0.68%Fullerton Private Capital Pty Ltd 2,200,000 0.57%
239,119,874 62.08%
For
per
sona
l use
onl
y

72 GBM Resources Annual Report 2013
ASX Additional Information
d. Twenty Largest Option Holders
OptionholderOptions
Held% of Issued
Options
Alvito Capital Holdings Inc 24,350,000 18.07%Constance Tan Cai Ai 22,400,000 16.62%Chew Leok Chuan 10,000,000 7.42%Swift Venture Holdings Corporation 8,900,000 6.61%Bell Potter Nominees Limited 6,702,188 4.97%Sung Yoon Chon 5,725,000 4.25%Rosegate Investments Pty Ltd 5,142,500 3.82%ABN Amro Clearing Sydney Nominees Pty Ltd 3,199,300 2.37%Au Sai Chuen 2,600,000 1.93%Sin Yew Seng (2004) Pte Ltd 2,500,000 1.86%John Saunders 2,460,709 1.83%Kevin Harvey & Ruth Linda Payne 2,316,250 1.72%Superfine Nominees Pty Ltd 1,718,750 1.28%HSBC Custody Nominees (Australia) Limited 1,552,500 1.15%KP Super Fund A/c 1,491,500 1.11%KP Family Fund A/c 1,422,500 1.06%Tan Hong Huat 1,400,000 1.04%De Gracie Nominees Pty Ltd 1,296,818 0.96%Shahrin Mohd Shahir 1,250,000 0.93%Shahrin Bin Mond Shahir 1,250,000 0.93%
107,678,015 79.91%
e. Voting RightsIn accordance with the Company’s Constitution, voting rights in respect of ordinary shares are on a show of hands whereby each member present in person or by proxy shall have one vote and upon a poll, each share will have one vote.
f. Restricted SecuritiesThere are no restricted securities.
For
per
sona
l use
onl
y

Corporate Directory
DirectorsPeter Thompson Managing Director/ Executive Chairman
Cameron Switzer Non-Executive Director
Guan Huat Loh Non-Executive Director
Chiau Woei Lim Non-Executive Director
Neil Norris Executive Director/ Exploration Director
Company SecretaryKevin Hart
Registered OfficeSuite 8, 7 The EsplanadeMt Pleasant WA 6153AUSTRALIATelephone: +61 8 9316 9100Facsimile: +61 8 9315 5475
Principal Place of BusinessSuite 8, 7 The EsplanadeMt Pleasant WA 6153AUSTRALIATelephone: +61 8 9316 9100Facsimile: +61 8 9315 5475
Website and email addressWebsite: www.gbmr.com.auEmail: [email protected]
Exploration Office10 Parker StreetPO Box 658Castlemaine VIC 3450AUSTRALIATelephone: +61 3 5470 5033
AuditorsHLB Mann JuddLevel 4, 130 Stirling StreetPerth WA 6000AUSTRALIA
Share RegistryAdvanced Share Registry Services150 Stirling HighwayNedlands WA 6009AUSTRALIATelephone: +61 8 9389 8033Facsimile: +61 8 9389 7871
Securities Exchange ListingGBM Resources Limited – shares & options are listed on the Australian Securities Exchange (ASX Code: GBZ, GBZO)
SolicitorsSteinepreis PaganinLawyers and ConsultantsLevel 4, Next Building16 Milligan StreetPerth WA 6000AUSTRALIA
Wallbrook Investor Relation Suite 8, 11 Collin Grove StreetWest Perth WA 6005Karen Oswald Account DirectorMobile: 0423 602 353
GBM Resources Annual Report 2013 73
For
per
sona
l use
onl
y

Suite 8, 7 The Esplanade, Mt Pleasant WA 6153 AustraliaTelephone: +61 8 9316 9100 • Facsimile: +61 8 9315 5475Website: www.gbmr.com.au • Email: [email protected]
For
per
sona
l use
onl
y