for personal use only - asx · 2018-02-14 · compulsory third party (ctp) in new south wales (nsw)...
TRANSCRIPT

SUNCORP GROUP LIMITED ABN 66 145 290 124
ANALYST PACK Financial results for the
HALF YEAR ENDED 31 DECEMBER 2017
For
per
sona
l use
onl
y
PAGE 2 FINANCIAL RESULTS FOR THE HALF YEAR ENDED 31 DECEMBER 2017
BASIS OF PREPARATION Suncorp Group (‘Group’, ‘the Group’, ‘the Company’ or ‘Suncorp’) is comprised of Suncorp Group Limited (SGL) and its subsidiaries, its interests in associates and jointly controlled entities. The Group’s results and historical financial information are reported across three functions: Insurance (Australia), Banking & Wealth and New Zealand. Net profit after tax (NPAT) for the Group is measured in accordance with Australian Accounting Standards. Profit after tax from functions, associated ratios and key statistics are based on the segment reporting disclosures that follow Suncorp’s operating model. All figures have been quoted in Australian dollars rounded to the nearest million unless otherwise denoted. The New Zealand section reports the Profit Contribution table in both A$ and NZ$ and all other New Zealand tables and commentary in NZ$. All figures relate to the half year ended 31 December 2017 and comparatives are for the half year ended 31 December 2016, unless otherwise stated. Where necessary, comparatives have been restated to reflect any changes in table formats or methodology. Movements within the financial tables have been labelled ‘n/a’ where there has been a percentage movement greater than 500% or less than (500%), or if a line item changes from negative to positive (or vice versa) between periods. This report has not been audited nor reviewed in accordance with Australian Auditing Standards. It should be read in conjunction with the Group’s consolidated annual and interim financial reports which have been either audited or reviewed in accordance with Australian Auditing Standards. In the context of ASIC’s Regulatory Guide 230, this report contains information that is ‘non-IFRS financial information’, such as the General Insurance Underlying Insurance Trading Result and the Life underlying profit after tax. The calculation of these metrics is outlined in the report and they are shown as they are used internally to determine operating performance within the various functions. This report should be read in conjunction with the definitions in Appendix 9.
DISCLAIMER This report contains general information on the Group and its operations which is current as at 15 February 2018. It is information given in summary form and does not purport to be complete. It is not a recommendation or advice in relation to the Group or any product or service offered by Suncorp or any of its subsidiaries. It is not intended to be relied upon as advice to investors or potential investors, and does not take into account the investment objectives, financial situation or needs of any particular investor. These factors should be considered, with or without professional advice, when deciding if an investment is appropriate. This report should be read in conjunction with all other information concerning Suncorp filed with the Australian Securities Exchange (ASX). The information in this report is for general information only. To the extent that the information may constitute forward-looking statements, the information reflects Suncorp’s intent, belief or current expectations with respect to the business and operations, market conditions, results of operations and financial condition, capital adequacy, specific provisions and risk management practices at the date of this report. Such forward-looking statements are not guarantees of future performance and involve known and unknown risks and uncertainties, many of which are beyond Suncorp’s control, which may cause actual results to differ materially from those expressed or implied. Suncorp undertakes no obligation to update any forward-looking statement to reflect events or circumstances after the date of this report (subject to ASX disclosure requirements).
Registered office Investor Relations
Level 28, 266 George Street Kelly Hibbins Andrew Dempster Brisbane Queensland 4000 Head of Investor Relations EM Investor Relations Telephone: (07) 3362 1222 Telephone: (02) 8121 9208 Telephone: (02) 8121 9206 suncorpgroup.com.au [email protected] [email protected]
For
per
sona
l use
onl
y
FINANCIAL RESULTS FOR THE HALF YEAR ENDED 31 DECEMBER 2017 PAGE 3
TABLE OF CONTENTS Basis of preparation .................................................................................................................................................... 2
Financial results summary ......................................................................................................................................... 4
Group ............................................................................................................................................................................ 5
Result overview .......................................................................................................................................................... 5
Outlook ....................................................................................................................................................................... 7
Contribution to profit by function ................................................................................................................................. 9
Statement of financial position .................................................................................................................................. 10
Insurance (Australia) ................................................................................................................................................. 11
Result overview ........................................................................................................................................................ 11
Outlook ..................................................................................................................................................................... 12
Profit contribution and General Insurance ratios ....................................................................................................... 14
Banking & Wealth ...................................................................................................................................................... 27
Result overview ........................................................................................................................................................ 27
Outlook ..................................................................................................................................................................... 28
Profit contribution and Banking ratios and statistics.................................................................................................. 30
New Zealand ............................................................................................................................................................... 45
Result overview ........................................................................................................................................................ 45
Outlook ..................................................................................................................................................................... 46
Profit contribution and General Insurance ratios ....................................................................................................... 47
Group .......................................................................................................................................................................... 57
Group operating expenses ....................................................................................................................................... 57
Business Improvement Program ............................................................................................................................... 58
Customer .................................................................................................................................................................. 59
General Insurance reinsurance................................................................................................................................. 60
Group capital and dividends ..................................................................................................................................... 61
Investments .............................................................................................................................................................. 64
Income tax ................................................................................................................................................................ 65
Appendix 1 – Consolidated statement of comprehensive income and financial position .................................. 66
Appendix 2 – Ratio calculations ............................................................................................................................... 69
Appendix 3 – Reported and underlying ITR ............................................................................................................ 72
Appendix 4 – General Insurance ITR Split............................................................................................................... 73
Appendix 5 – Group capital ...................................................................................................................................... 76
Appendix 6 – Life Embedded Value ........................................................................................................................ 81
Appendix 7 – Statement of assets and liabilities .................................................................................................... 83
Appendix 8 – Life and Wealth invested shareholder assets .................................................................................. 86
Appendix 9 – Definitions ........................................................................................................................................... 87
Appendix 10 – 2017/18 key dates ............................................................................................................................. 91
For
per
sona
l use
onl
y
GROUP
PAGE 4 FINANCIAL RESULTS FOR THE HALF YEAR ENDED 31 DECEMBER 2017
ANALYST PACK
FINANCIAL RESULTS SUMMARY
Financial highlights Half Year Ended Dec-17 Dec-17
Dec-17 Jun-17 Dec-16 vs Jun-17 vs Dec-16 Net earned premium - Insurance (Australia) $M 3,643 3,520 3,552 3.5 2.6 Net Interest Income - Banking & Wealth $M 598 573 558 4.4 7.2 Net earned premium - New Zealand $M 564 542 557 4.1 1.3 Profit after tax from functions $M 522 592 613 (11.8) (14.8) Cash earnings $M 472 561 584 (15.9) (19.2) Net profit after tax $M 452 538 537 (16.0) (15.8)
Cash earnings per share - Diluted (1) (cents) 36.11 42.91 44.61 (15.8) (19.1)
Cash return on average shareholders' equity (1) (%) 6.8 8.2 8.5
Insurance trading ratio (%) 8.0 11.2 12.5
Underlying ITR ratio (adjusted for BIP costs) (%) 10.2 12.0 11.0
Bank net interest margin (interest-earning assets) (%) 1.86 1.87 1.78
Ordinary dividends per ordinary share (cents) 33.0 40.0 33.0 (17.5) -
Payout ratio - cash earnings (1) (%) 90.1 91.6 72.5
General Insurance Group PCA coverage (times) 1.66 1.77 1.78
Bank Common Equity Tier 1 ratio (%) 9.01 9.23 9.20
(1) Refer to Appendix 9 for definitions.
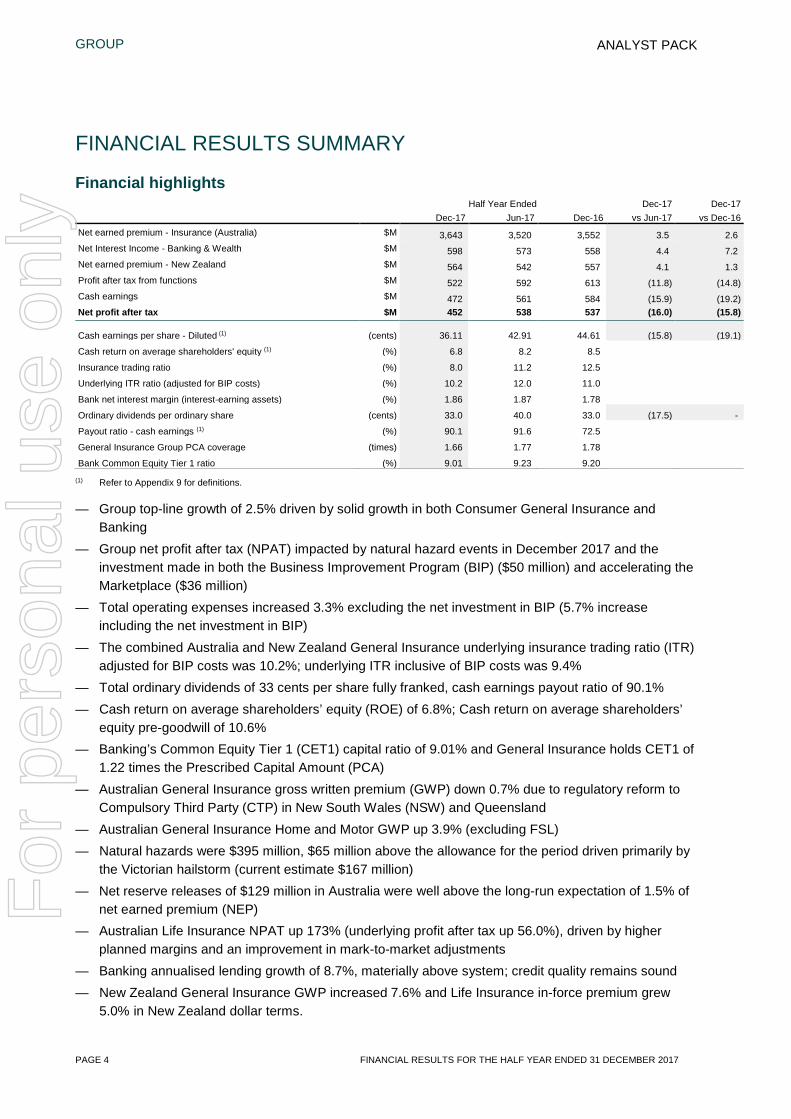
— Group top-line growth of 2.5% driven by solid growth in both Consumer General Insurance and Banking
— Group net profit after tax (NPAT) impacted by natural hazard events in December 2017 and the investment made in both the Business Improvement Program (BIP) ($50 million) and accelerating the Marketplace ($36 million)
— Total operating expenses increased 3.3% excluding the net investment in BIP (5.7% increase including the net investment in BIP)
— The combined Australia and New Zealand General Insurance underlying insurance trading ratio (ITR) adjusted for BIP costs was 10.2%; underlying ITR inclusive of BIP costs was 9.4%
— Total ordinary dividends of 33 cents per share fully franked, cash earnings payout ratio of 90.1% — Cash return on average shareholders’ equity (ROE) of 6.8%; Cash return on average shareholders’
equity pre-goodwill of 10.6% — Banking’s Common Equity Tier 1 (CET1) capital ratio of 9.01% and General Insurance holds CET1 of
1.22 times the Prescribed Capital Amount (PCA) — Australian General Insurance gross written premium (GWP) down 0.7% due to regulatory reform to
Compulsory Third Party (CTP) in New South Wales (NSW) and Queensland — Australian General Insurance Home and Motor GWP up 3.9% (excluding FSL) — Natural hazards were $395 million, $65 million above the allowance for the period driven primarily by
the Victorian hailstorm (current estimate $167 million) — Net reserve releases of $129 million in Australia were well above the long-run expectation of 1.5% of
net earned premium (NEP) — Australian Life Insurance NPAT up 173% (underlying profit after tax up 56.0%), driven by higher
planned margins and an improvement in mark-to-market adjustments — Banking annualised lending growth of 8.7%, materially above system; credit quality remains sound — New Zealand General Insurance GWP increased 7.6% and Life Insurance in-force premium grew
5.0% in New Zealand dollar terms.
For
per
sona
l use
onl
y
GROUP
FINANCIAL RESULTS FOR THE HALF YEAR ENDED 31 DECEMBER 2017 PAGE 5
ANALYST PACK
GROUP
Result overview
Suncorp’s result for the half year ended 31 December 2017 was driven by solid top-line growth of 2.5%, the phasing of investment in the Group’s two major strategic programs and the timing of natural hazards.
A fully franked interim ordinary dividend of 33 cents was declared, reflecting a payout ratio of 90.1%.
The timing of natural hazards, including the Victorian hailstorm (current estimate $167 million), resulted in the Group being above its natural hazard allowance and reporting an increase in risk margin ($18 million). The increase in risk margin is expected to unwind over the second half of the financial year.
An increased focus on Suncorp’s four strategic pillars, in particular, elevating the needs of customers, has delivered strong growth in Consumer and Commercial insurance premiums in Australia and New Zealand, as well as Banking lending growth. Regulatory reform has impacted CTP premium income and home insurance fire service levies, which has reduced headline growth rates.
Suncorp has progressed its two strategic programs, the Marketplace acceleration program and the BIP, over the period with a view to improving customer experience, lowering the Group’s cost base and delivering a more resilient business model embedding a culture of continuous improvement across the organisation.
The Group has also had to manage the short-term costs of increased regulation (an increase of $17 million) compared to the prior corresponding period, which are expected to deliver longer term competition benefits.
Function results overview
Insurance (Australia) delivered 3.9% GWP growth for Home and Motor lines (excluding FSL) and 1.5% GWP growth in Commercial lines. CTP premium growth was impacted by regulatory reform in NSW and Queensland. Total Insurance (Australia) NEP grew by 2.6%.
Net incurred claims were impacted by discount rate movements, natural hazards events in December 2017 and a shift in the mix of premiums towards long-tail classes.
Claims inflation continues to be an industry-wide issue for Consumer lines. Combined with repricing, Suncorp has successfully offset claims cost pressures by driving benefits from an intense focus on managing claims and its vertically integrated motor supply chain and improved home repair processes.
Reserve releases of $129 million remain well above long-term expectations, reflecting the continued benign inflationary environment.
NPAT of $264 million declined by 28.5% primarily due to higher natural hazard costs and the timing of expenses relating to the BIP.
Australian Life Insurance profit after tax increased to $30 million, up 173% (underlying profit after tax up 56.0%), driven by higher planned margins and improved mark-to-market adjustments. For further information on the performance of Insurance (Australia) in 1H18 please refer to page 11.
For
per
sona
l use
onl
y
GROUP
PAGE 6 FINANCIAL RESULTS FOR THE HALF YEAR ENDED 31 DECEMBER 2017
ANALYST PACK
Banking & Wealth annualised lending growth of 8.7% reflected strong consumer and commercial lending growth within risk appetite. Net interest margin (NIM) of 1.86% remained strong supported by asset repricing and improvements in funding.
Impairment losses increased to $13 million, representing 4 basis points (annualised) of gross loans and advances, remaining below the long-run operating target of 10 to 20 basis points of gross loans and advances.
The cost to income ratio of 54.9% increased relative to the prior corresponding period driven by investment in a number of growth related activities as well as investment in BIP.
Reported NPAT of $197 million reflects higher net interest income offset by growth-related expenses and the timing of the investment in the BIP.
The Wealth business reported a 20% increase in NPAT to $6 million, driven by positive investment returns and the performance of the annuity and participating business. For further information on the performance of Banking & Wealth in 1H18 please refer to page 27.
New Zealand GWP growth of 7.6%, in New Zealand dollar terms, was driven by both consumer and commercial classes.
New Zealand General Insurance NPAT increased to A$46 million, as higher net earned premium, reduced natural hazard costs and improvements in claims processes led to lower loss ratios.
New Zealand Life Insurance delivered NPAT of A$15 million, down 11.8%. For further information on the performance of the New Zealand business in 1H18 please refer to page 45.
Strategic programs
Suncorp continues to focus on its four strategic priorities to drive shareholder value: elevate the customer; create the Marketplace; inspire our people; and maintain momentum and growth.
Over 1H18 Suncorp invested in two strategic programs of work: BIP and the Marketplace acceleration program, that have been designed to support the Group’s four strategic priorities.
The BIP commenced during the half with a focus on programs that improve the customer experience, drive efficiencies and embed a culture of continuous improvement. BIP is a company-wide program focusing on the following five streams of work: digitisation of customer experiences, sales and service channel optimisation, end-to-end process improvement, claims supply chain re-design and smarter procurement and streamlining our business.
The Group invested $50 million in BIP over the period. BIP spending between functions was as follows: $35 million to Insurance (Australia) (includes $1 million attributable to the Australian life insurance business) and $15 million to Banking & Wealth.
BIP is on-track to deliver net benefits of $10 million, $195 million and $329 million over FY18, FY19 and FY20 respectively. The BIP benefits will help drive the Group’s operating cost base to $2.7 billion in FY19. For further information please refer to page 58.
Suncorp invested $36 million over the half in the Marketplace acceleration program. Progress has been made on each of the six Marketplace deliverables being: single customer experience, national roll-out of brand refresh, journeys and integrated offers, third party partnerships, customer reward and recognition and other enabling technology. For further information please refer to page 59.
For
per
sona
l use
onl
y
GROUP
FINANCIAL RESULTS FOR THE HALF YEAR ENDED 31 DECEMBER 2017 PAGE 7
ANALYST PACK
Dividend and capital
The Board has determined a fully franked interim dividend of 33 cents per share. This represents a dividend payout ratio of 90.1% of cash earnings above the top end of the Group’s 60% to 80% dividend payout range, reflecting the Board’s commitment to neutralise the impact of accelerated investment in the Marketplace and confidence in Group’s outlook.
After payment of the dividend, the franking account balance will be $158 million. The Group remains well capitalised with $381 million in CET1 capital held above its CET1 operating target. For further information please refer to page 61.
Outlook
Suncorp’s NPAT is expected to be higher for the six months ending 30 June 2018 compared to the six months ended 31 December 2017.
The key drivers for the stronger second half include:
— The swing from a net investment in 1H18 to a net benefit in 2H18 from the BIP as material cost efficiencies flow through to earnings
— The ongoing benefits from improving customer metrics
— Leveraging the generally favourable operating conditions to build on the strong GWP and loan growth in the first half.
In the second half of the 2018 financial year, Suncorp also expects to address:
— The shareholding in Tower Limited (Tower) New Zealand, and
— The strategic review of the Australian Life business.
Specifically, expectations of the business units in the second half include:
Insurance (Australia):
— GWP growth to remain positive for consumer classes, combined with improvements in claims processes offsetting industry-wide claims inflation
— GWP growth to remain stable for commercial classes as underwriting discipline is maintained
— The CTP portfolio will continue to be a headwind to GWP and will impact the underlying ITR
— Underlying ITR is expected to improve as the benefits of BIP are realised, while reported ITR remains subject to natural hazards costs, reserve releases and the performance of the investment portfolio
— Life Insurance profit will increase as the optimisation program delivers repricing improvements.
Banking & Wealth:
— Lending growth above system, with net interest margin remaining within a target range of 1.80% – 1.90%
— The cost to income ratio is expected to improve as the benefits of BIP begin to be realised and the revenue benefits from the strong balance sheet growth and improved margin outlook flow through
— Wealth profits are expected to remain broadly stable.
For
per
sona
l use
onl
y
GROUP
PAGE 8 FINANCIAL RESULTS FOR THE HALF YEAR ENDED 31 DECEMBER 2017
ANALYST PACK
New Zealand:
— GWP growth to remain positive for consumer and commercial lines, offsetting industry wide claims inflation and reinsurance premium increases
— Underlying ITR to remain strong
— Life insurance underlying profit to remain stable
— Maximise the value of its investment in Tower New Zealand.
Group:
Group investment returns are expected to be impacted by firming inflation, which is likely to weigh on bond returns, however inflation-linked bonds will perform well in this environment. Current high equity valuations are expected to result in lower equity returns.
Investment in the key strategic programs, BIP and the Marketplace acceleration program, will continue and are expected to support growth and cost benefits to the existing core business. Further, they are expected to open up new opportunities for growth through third party partnerships.
The Group continues to explore a number of strategic alternatives for the Australian Life business.
For the 2018 financial year, the Board intends to increase the dividend payout ratio for the full year dividend above the top end of the target range of 60% to 80% to offset the impact on cash earnings of the additional investment in the Marketplace.
FY19 targets
Suncorp is confident that the streams of work around its two strategic programs currently being undertaken will deliver significant improvement to earnings in FY19. In addition, at, or above system lending growth in Banking & Wealth combined with price increases and unit growth in Insurance (Australia) and New Zealand will drive achievement of Suncorp’s key FY19 targets as set out below:
— Group top-line growth of 3% to 5%, driven by strategic initiatives and targeted growth in selected product classes
— An underlying ITR of at least 12%, supported by BIP, in particular the benefits of claims supply chain redesign, and the earned impact of repricing and unit growth throughout FY18
— Banking cost to income ratio of around 50% and NIM of 1.80% to 1.90%, supported by BIP initiatives including channel optimisation, and targeted growth initiatives within risk appetite
— Expense base of $2.7 billion as smarter procurement and streamlining the Group, in addition to other BIP benefits, more than offset underlying inflation and growth-related investment.
Achieving the above targets will produce a cash ROE of 10%.
Reserve releases are expected to be above 1.5% of NEP, provided the benign inflationary environment continues.
Suncorp will also maintain a dividend payout ratio of 60% to 80% of cash earnings and return surplus capital to shareholders.
FY19 targets are subject to natural hazards at or below budget, movements in investment markets and unforeseen regulatory reform.
For
per
sona
l use
onl
y
GROUP
FINANCIAL RESULTS FOR THE HALF YEAR ENDED 31 DECEMBER 2017 PAGE 9
ANALYST PACK
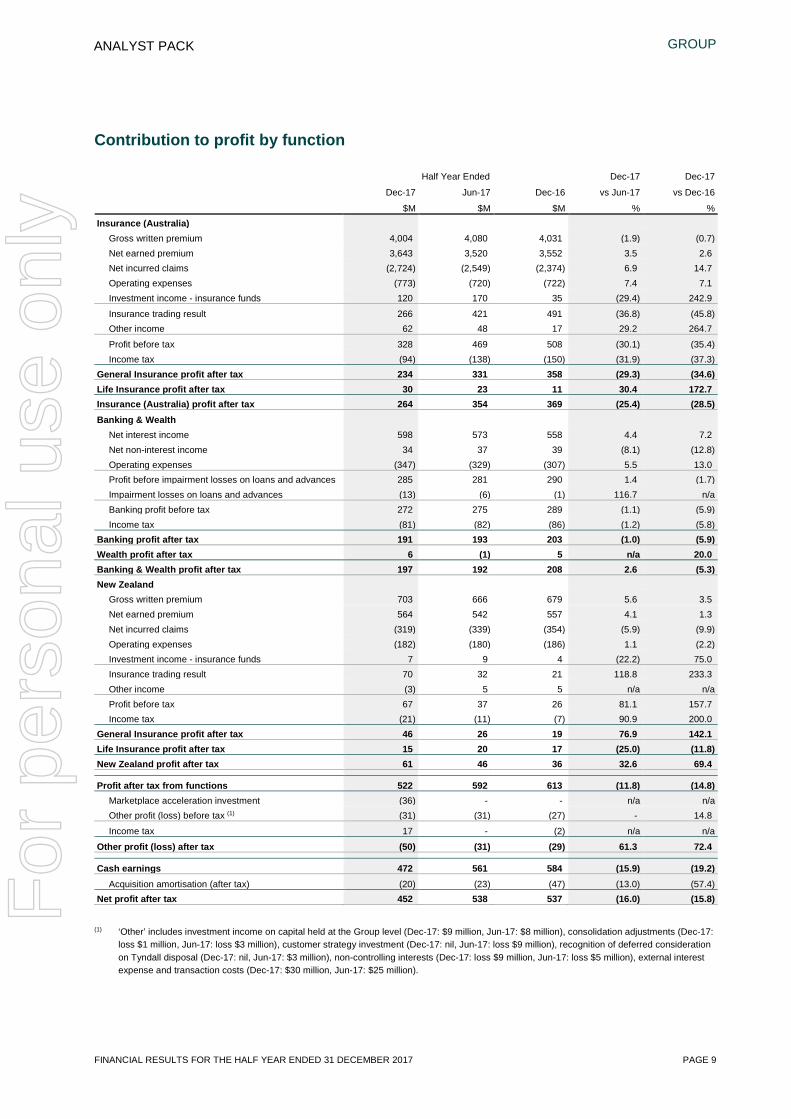
Contribution to profit by function
Half Year Ended Dec-17 Dec-17
Dec-17 Jun-17 Dec-16 vs Jun-17 vs Dec-16
$M $M $M % % Insurance (Australia)
Gross written premium 4,004 4,080 4,031 (1.9) (0.7) Net earned premium 3,643 3,520 3,552 3.5 2.6 Net incurred claims (2,724) (2,549) (2,374) 6.9 14.7 Operating expenses (773) (720) (722) 7.4 7.1 Investment income - insurance funds 120 170 35 (29.4) 242.9
Insurance trading result 266 421 491 (36.8) (45.8) Other income 62 48 17 29.2 264.7
Profit before tax 328 469 508 (30.1) (35.4) Income tax (94) (138) (150) (31.9) (37.3)
General Insurance profit after tax 234 331 358 (29.3) (34.6) Life Insurance profit after tax 30 23 11 30.4 172.7 Insurance (Australia) profit after tax 264 354 369 (25.4) (28.5) Banking & Wealth
Net interest income 598 573 558 4.4 7.2 Net non-interest income 34 37 39 (8.1) (12.8) Operating expenses (347) (329) (307) 5.5 13.0 Profit before impairment losses on loans and advances 285 281 290 1.4 (1.7) Impairment losses on loans and advances (13) (6) (1) 116.7 n/a Banking profit before tax 272 275 289 (1.1) (5.9) Income tax (81) (82) (86) (1.2) (5.8)
Banking profit after tax 191 193 203 (1.0) (5.9) Wealth profit after tax 6 (1) 5 n/a 20.0 Banking & Wealth profit after tax 197 192 208 2.6 (5.3) New Zealand
Gross written premium 703 666 679 5.6 3.5 Net earned premium 564 542 557 4.1 1.3 Net incurred claims (319) (339) (354) (5.9) (9.9) Operating expenses (182) (180) (186) 1.1 (2.2) Investment income - insurance funds 7 9 4 (22.2) 75.0 Insurance trading result 70 32 21 118.8 233.3 Other income (3) 5 5 n/a n/a Profit before tax 67 37 26 81.1 157.7 Income tax (21) (11) (7) 90.9 200.0
General Insurance profit after tax 46 26 19 76.9 142.1 Life Insurance profit after tax 15 20 17 (25.0) (11.8) New Zealand profit after tax 61 46 36 32.6 69.4
Profit after tax from functions 522 592 613 (11.8) (14.8)
Marketplace acceleration investment (36) - - n/a n/a Other profit (loss) before tax (1) (31) (31) (27) - 14.8
Income tax 17 - (2) n/a n/a
Other profit (loss) after tax (50) (31) (29) 61.3 72.4
Cash earnings 472 561 584 (15.9) (19.2) Acquisition amortisation (after tax) (20) (23) (47) (13.0) (57.4)
Net profit after tax 452 538 537 (16.0) (15.8)
(1) ‘Other’ includes investment income on capital held at the Group level (Dec-17: $9 million, Jun-17: $8 million), consolidation adjustments (Dec-17: loss $1 million, Jun-17: loss $3 million), customer strategy investment (Dec-17: nil, Jun-17: loss $9 million), recognition of deferred consideration on Tyndall disposal (Dec-17: nil, Jun-17: $3 million), non-controlling interests (Dec-17: loss $9 million, Jun-17: loss $5 million), external interest expense and transaction costs (Dec-17: $30 million, Jun-17: $25 million).
For
per
sona
l use
onl
y
GROUP
PAGE 10 FINANCIAL RESULTS FOR THE HALF YEAR ENDED 31 DECEMBER 2017
ANALYST PACK
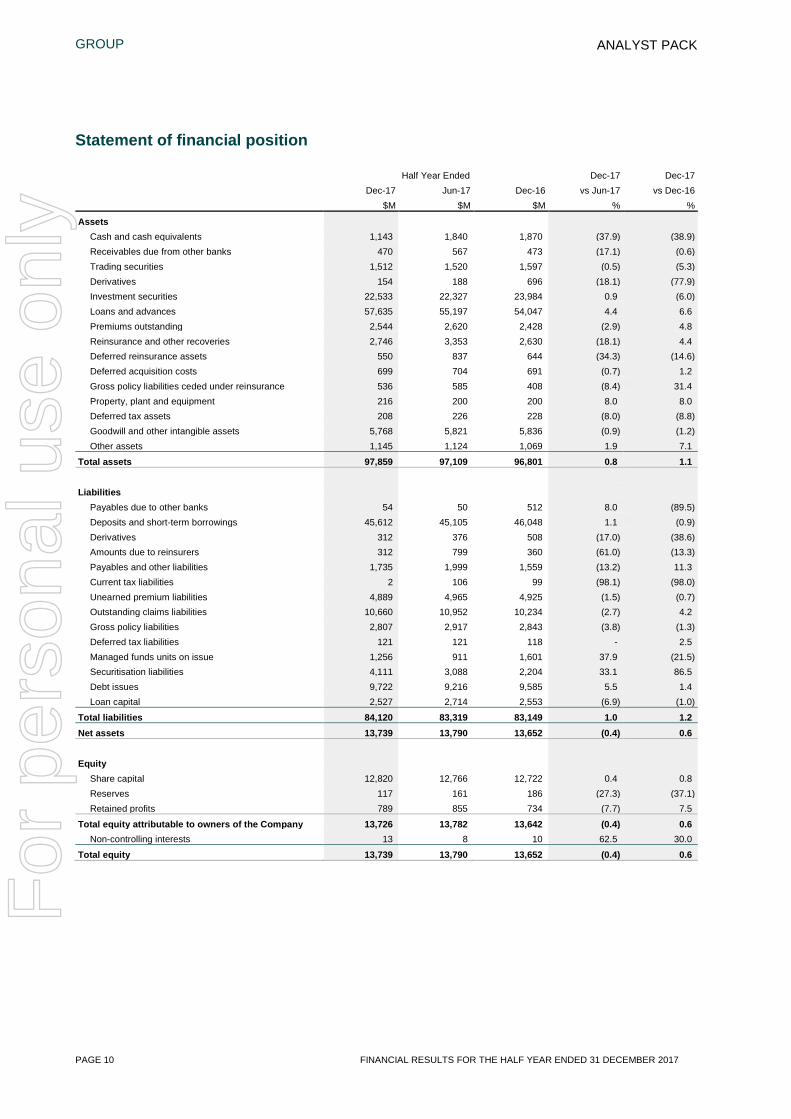
Statement of financial position
Half Year Ended Dec-17 Dec-17 Dec-17 Jun-17 Dec-16 vs Jun-17 vs Dec-16 $M $M $M % %
Assets Cash and cash equivalents 1,143 1,840 1,870 (37.9) (38.9) Receivables due from other banks 470 567 473 (17.1) (0.6) Trading securities 1,512 1,520 1,597 (0.5) (5.3) Derivatives 154 188 696 (18.1) (77.9) Investment securities 22,533 22,327 23,984 0.9 (6.0) Loans and advances 57,635 55,197 54,047 4.4 6.6 Premiums outstanding 2,544 2,620 2,428 (2.9) 4.8 Reinsurance and other recoveries 2,746 3,353 2,630 (18.1) 4.4 Deferred reinsurance assets 550 837 644 (34.3) (14.6) Deferred acquisition costs 699 704 691 (0.7) 1.2 Gross policy liabilities ceded under reinsurance 536 585 408 (8.4) 31.4 Property, plant and equipment 216 200 200 8.0 8.0 Deferred tax assets 208 226 228 (8.0) (8.8) Goodwill and other intangible assets 5,768 5,821 5,836 (0.9) (1.2) Other assets 1,145 1,124 1,069 1.9 7.1
Total assets 97,859 97,109 96,801 0.8 1.1 Liabilities
Payables due to other banks 54 50 512 8.0 (89.5) Deposits and short-term borrowings 45,612 45,105 46,048 1.1 (0.9) Derivatives 312 376 508 (17.0) (38.6) Amounts due to reinsurers 312 799 360 (61.0) (13.3) Payables and other liabilities 1,735 1,999 1,559 (13.2) 11.3 Current tax liabilities 2 106 99 (98.1) (98.0) Unearned premium liabilities 4,889 4,965 4,925 (1.5) (0.7) Outstanding claims liabilities 10,660 10,952 10,234 (2.7) 4.2 Gross policy liabilities 2,807 2,917 2,843 (3.8) (1.3) Deferred tax liabilities 121 121 118 - 2.5 Managed funds units on issue 1,256 911 1,601 37.9 (21.5) Securitisation liabilities 4,111 3,088 2,204 33.1 86.5 Debt issues 9,722 9,216 9,585 5.5 1.4 Loan capital 2,527 2,714 2,553 (6.9) (1.0)
Total liabilities 84,120 83,319 83,149 1.0 1.2 Net assets 13,739 13,790 13,652 (0.4) 0.6 Equity
Share capital 12,820 12,766 12,722 0.4 0.8 Reserves 117 161 186 (27.3) (37.1) Retained profits 789 855 734 (7.7) 7.5
Total equity attributable to owners of the Company 13,726 13,782 13,642 (0.4) 0.6 Non-controlling interests 13 8 10 62.5 30.0
Total equity 13,739 13,790 13,652 (0.4) 0.6
For
per
sona
l use
onl
y
INSURANCE (AUSTRALIA)
FINANCIAL RESULTS FOR THE HALF YEAR ENDED 31 DECEMBER 2017 PAGE 11
ANALYST PACK
INSURANCE (AUSTRALIA)
Result overview
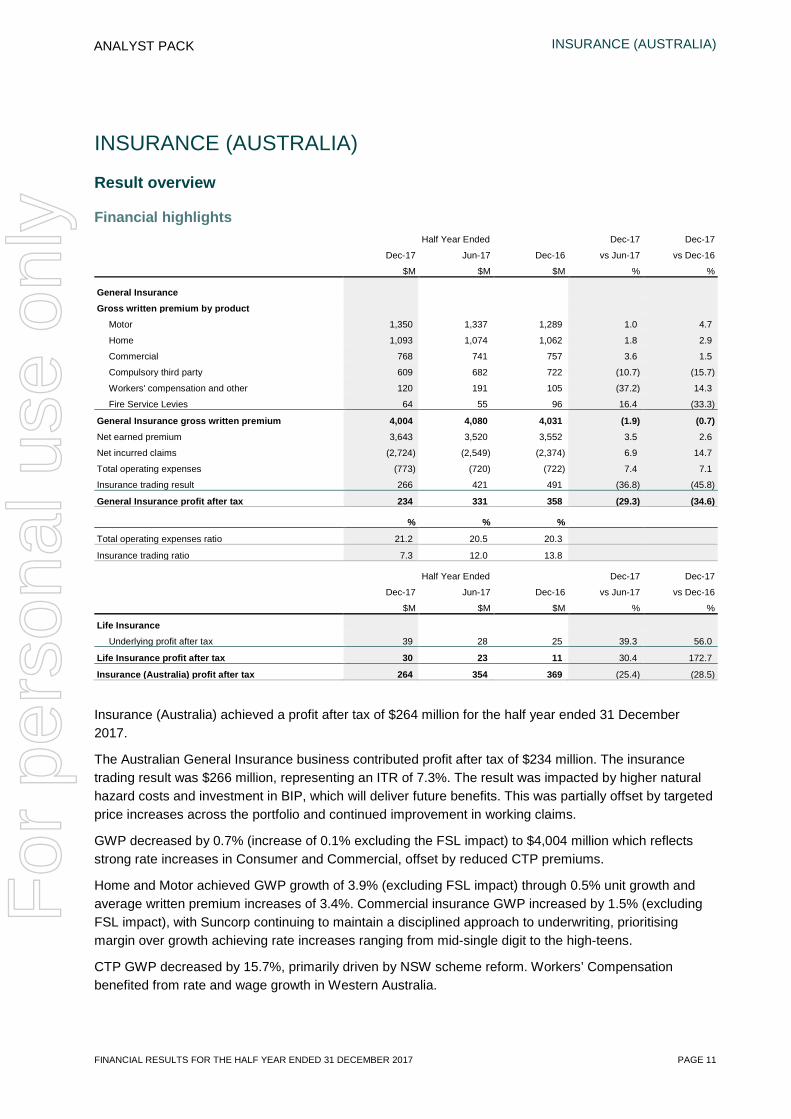
Financial highlights Half Year Ended Dec-17 Dec-17
Dec-17 Jun-17 Dec-16 vs Jun-17 vs Dec-16
$M $M $M % %
General Insurance
Gross written premium by product Motor 1,350 1,337 1,289 1.0 4.7
Home 1,093 1,074 1,062 1.8 2.9
Commercial 768 741 757 3.6 1.5
Compulsory third party 609 682 722 (10.7) (15.7)
Workers' compensation and other 120 191 105 (37.2) 14.3
Fire Service Levies 64 55 96 16.4 (33.3)
General Insurance gross written premium 4,004 4,080 4,031 (1.9) (0.7) Net earned premium 3,643 3,520 3,552 3.5 2.6
Net incurred claims (2,724) (2,549) (2,374) 6.9 14.7
Total operating expenses (773) (720) (722) 7.4 7.1
Insurance trading result 266 421 491 (36.8) (45.8)
General Insurance profit after tax 234 331 358 (29.3) (34.6)
% % %
Total operating expenses ratio 21.2 20.5 20.3
Insurance trading ratio 7.3 12.0 13.8
Half Year Ended Dec-17 Dec-17
Dec-17 Jun-17 Dec-16 vs Jun-17 vs Dec-16
$M $M $M % %
Life Insurance
Underlying profit after tax 39 28 25 39.3 56.0
Life Insurance profit after tax 30 23 11 30.4 172.7
Insurance (Australia) profit after tax 264 354 369 (25.4) (28.5)
Insurance (Australia) achieved a profit after tax of $264 million for the half year ended 31 December 2017.
The Australian General Insurance business contributed profit after tax of $234 million. The insurance trading result was $266 million, representing an ITR of 7.3%. The result was impacted by higher natural hazard costs and investment in BIP, which will deliver future benefits. This was partially offset by targeted price increases across the portfolio and continued improvement in working claims.
GWP decreased by 0.7% (increase of 0.1% excluding the FSL impact) to $4,004 million which reflects strong rate increases in Consumer and Commercial, offset by reduced CTP premiums.
Home and Motor achieved GWP growth of 3.9% (excluding FSL impact) through 0.5% unit growth and average written premium increases of 3.4%. Commercial insurance GWP increased by 1.5% (excluding FSL impact), with Suncorp continuing to maintain a disciplined approach to underwriting, prioritising margin over growth achieving rate increases ranging from mid-single digit to the high-teens.
CTP GWP decreased by 15.7%, primarily driven by NSW scheme reform. Workers’ Compensation benefited from rate and wage growth in Western Australia.
For
per
sona
l use
onl
y
INSURANCE (AUSTRALIA)
PAGE 12 FINANCIAL RESULTS FOR THE HALF YEAR ENDED 31 DECEMBER 2017
ANALYST PACK
Net incurred claims were $2,724 million, an increase of 14.7% on the prior corresponding period, impacted by discount rate movements, natural hazards events in December 2017 and a shift in the mix of premiums towards long-tail classes. Consumer working claims loss ratios continue to improve with operating efficiencies offsetting increased inflation. Strong claims performance continues across CTP in NSW with improved frequency experience. Queensland has continued to experience an increase in frequency, which is occurring across the industry.
Reserve releases of $129 million remain well above long-term expectations. This was primarily attributable to a continued focus on long-tail claims management and a benign environment for wage and super-imposed inflation.
Total operating expenses were $773 million. As a result of the $23 million investment in BIP, the operating expense ratio increased by 0.9%, which will be offset by expected BIP benefits in future periods.
Investment income on insurance funds of $120 million was impacted by the outperformance on inflation-linked bonds, gains from narrowing credit spreads, partially offset by losses from an increase in risk-free rates. Investment income on shareholders’ funds of $72 million was a result of improved returns from equities.
The Australian Life Insurance business underlying profit after tax of $39 million was up 56.0%. This reflects higher planned profit margins due to favourable claims experience at the end of last financial year as well as reduced expenses and repricing benefits.
In-force premium grew 0.9% from growth in retail and direct due to stepped age and CPI increases. New business volumes were impacted by ongoing industry disruption and heightened regulatory scrutiny.
Life Insurance profit after tax of $30 million was up 173% from the prior corresponding period.
Outlook
Insurance (Australia) continues to benefit from operating a diverse portfolio while targeting profitable growth through pricing discipline, meeting more customer and intermediary needs and successfully entering new markets. Investment in technology and the BIP are expected to deliver benefits.
In the Consumer portfolio, the favourable pricing environment is expected to continue as industry-wide pricing is adjusted to address claims cost inflation and the increasing incidence of natural hazards. Operational claims metrics in Consumer portfolios have stabilised and are improving, with further investment being made to improve operational efficiencies via the BIP.
In the Commercial portfolio, price increases will continue to restore profitability as the business prioritises margin over growth.
Within the Personal Injury portfolio, CTP regulatory reform continues to be a focus for state governments. Ongoing engagement in the reform process and the diversification of the CTP business through targeted growth in new and existing markets, means Insurance (Australia) is well placed.
In the long-term, CTP reform aims to deliver reduced margin volatility and improved customer outcomes. In NSW CTP, short-term results will be impacted by reduced premiums however improvements in claims profiles will emerge over the medium term. In Queensland CTP, premium reduction coupled with increased claims frequency is expected to continue, putting pressure on profitability.
Claims management and disciplined underwriting are expected to result in reserve releases remaining above long-run expectations (1.5% of Group NEP) in the short to medium term, provided the low inflationary environment continues.
For
per
sona
l use
onl
y
INSURANCE (AUSTRALIA)
FINANCIAL RESULTS FOR THE HALF YEAR ENDED 31 DECEMBER 2017 PAGE 13
ANALYST PACK
In Workers’ Compensation, the portfolio continues to move towards more profitable non-mining and SME segments across all competitively underwritten states.
Insurance (Australia) remains committed to improving the profitability of the Australian Life Insurance business by continuing with the optimisation program focused on generating long-term sustainable returns despite ongoing industry disruption and regulatory scrutiny. The optimisation program has delivered favourable results to date. Life planned margins have improved due to favourable claims experience, ongoing expense initiatives and industry repricing. Life planned margins and experience have remained relatively stable, however, continued elevated claim incidence within the income protection business is being carefully monitored.
For
per
sona
l use
onl
y
INSURANCE (AUSTRALIA)
PAGE 14 FINANCIAL RESULTS FOR THE HALF YEAR ENDED 31 DECEMBER 2017
ANALYST PACK
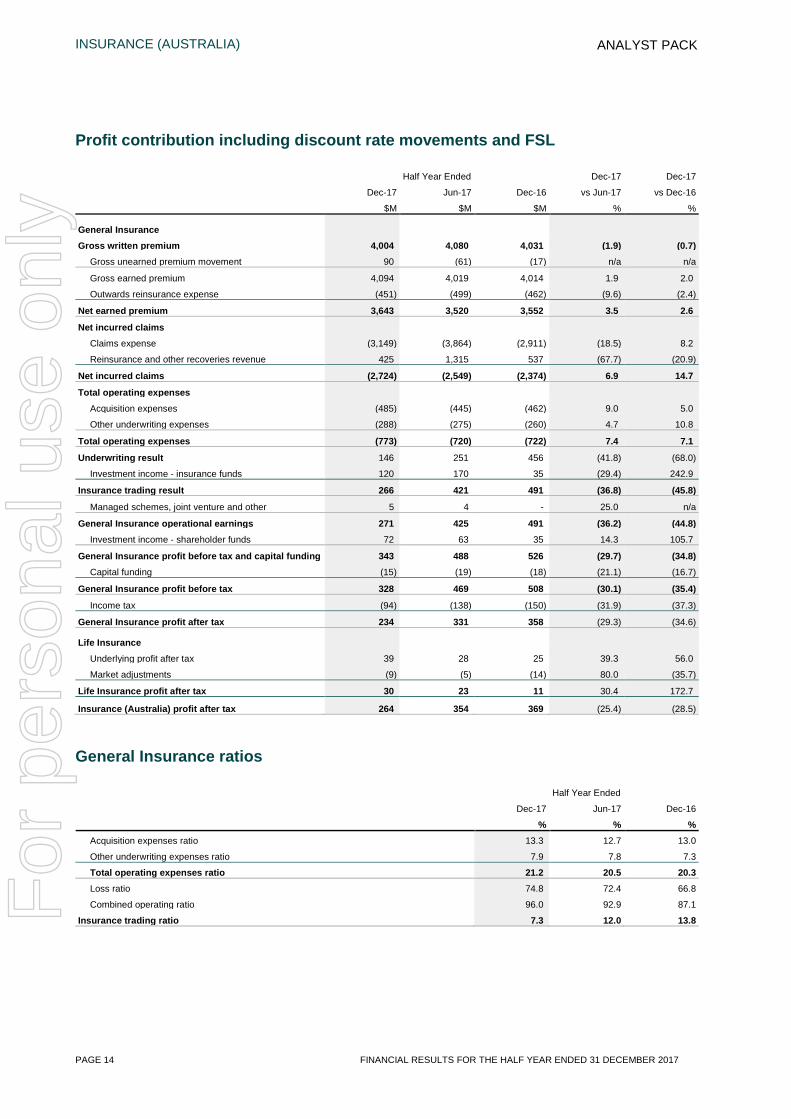
Profit contribution including discount rate movements and FSL
Half Year Ended Dec-17 Dec-17
Dec-17 Jun-17 Dec-16 vs Jun-17 vs Dec-16
$M $M $M % %
General Insurance
Gross written premium 4,004 4,080 4,031 (1.9) (0.7) Gross unearned premium movement 90 (61) (17) n/a n/a
Gross earned premium 4,094 4,019 4,014 1.9 2.0
Outwards reinsurance expense (451) (499) (462) (9.6) (2.4)
Net earned premium 3,643 3,520 3,552 3.5 2.6
Net incurred claims
Claims expense (3,149) (3,864) (2,911) (18.5) 8.2
Reinsurance and other recoveries revenue 425 1,315 537 (67.7) (20.9)
Net incurred claims (2,724) (2,549) (2,374) 6.9 14.7
Total operating expenses
Acquisition expenses (485) (445) (462) 9.0 5.0
Other underwriting expenses (288) (275) (260) 4.7 10.8
Total operating expenses (773) (720) (722) 7.4 7.1
Underwriting result 146 251 456 (41.8) (68.0)
Investment income - insurance funds 120 170 35 (29.4) 242.9
Insurance trading result 266 421 491 (36.8) (45.8)
Managed schemes, joint venture and other 5 4 - 25.0 n/a
General Insurance operational earnings 271 425 491 (36.2) (44.8) Investment income - shareholder funds 72 63 35 14.3 105.7
General Insurance profit before tax and capital funding 343 488 526 (29.7) (34.8) Capital funding (15) (19) (18) (21.1) (16.7)
General Insurance profit before tax 328 469 508 (30.1) (35.4)
Income tax (94) (138) (150) (31.9) (37.3)
General Insurance profit after tax 234 331 358 (29.3) (34.6)
Life Insurance
Underlying profit after tax 39 28 25 39.3 56.0
Market adjustments (9) (5) (14) 80.0 (35.7)
Life Insurance profit after tax 30 23 11 30.4 172.7
Insurance (Australia) profit after tax 264 354 369 (25.4) (28.5)
General Insurance ratios
Half Year Ended
Dec-17 Jun-17 Dec-16
% % % Acquisition expenses ratio 13.3 12.7 13.0
Other underwriting expenses ratio 7.9 7.8 7.3
Total operating expenses ratio 21.2 20.5 20.3 Loss ratio 74.8 72.4 66.8
Combined operating ratio 96.0 92.9 87.1
Insurance trading ratio 7.3 12.0 13.8
For
per
sona
l use
onl
y
INSURANCE (AUSTRALIA)
FINANCIAL RESULTS FOR THE HALF YEAR ENDED 31 DECEMBER 2017 PAGE 15
ANALYST PACK
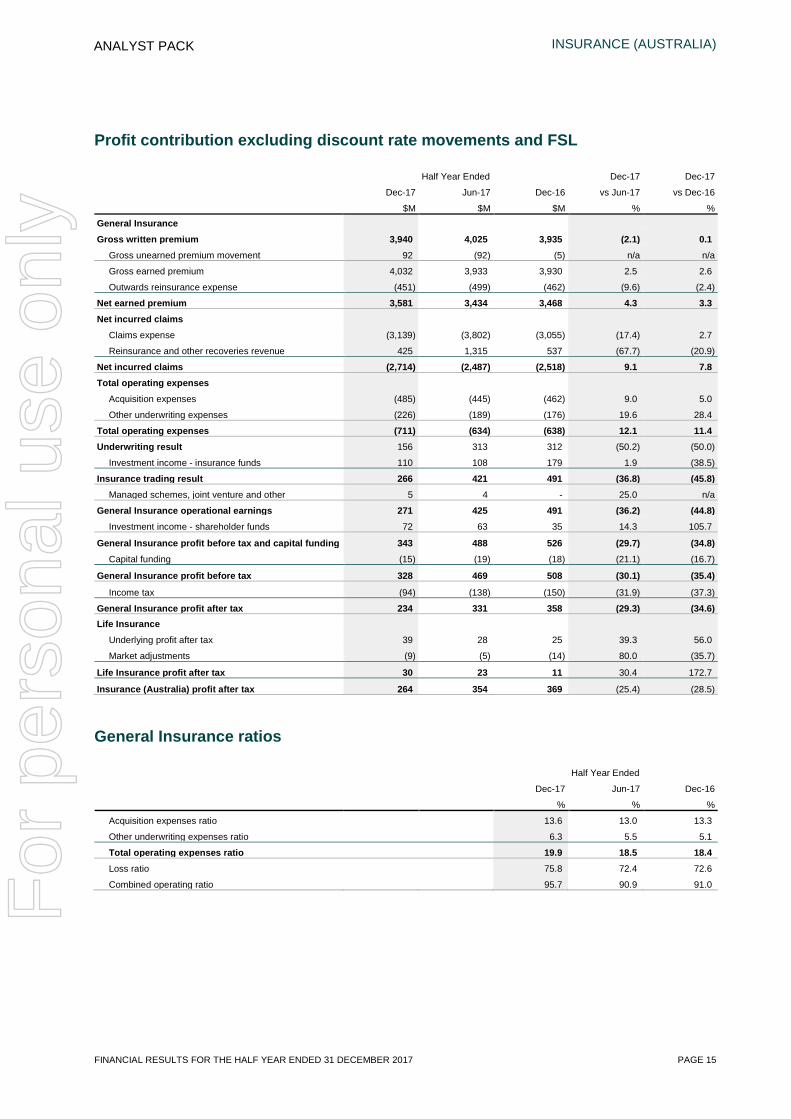
Profit contribution excluding discount rate movements and FSL
Half Year Ended Dec-17 Dec-17
Dec-17 Jun-17 Dec-16 vs Jun-17 vs Dec-16
$M $M $M % % General Insurance
Gross written premium 3,940 4,025 3,935 (2.1) 0.1 Gross unearned premium movement 92 (92) (5) n/a n/a
Gross earned premium 4,032 3,933 3,930 2.5 2.6
Outwards reinsurance expense (451) (499) (462) (9.6) (2.4)
Net earned premium 3,581 3,434 3,468 4.3 3.3 Net incurred claims
Claims expense (3,139) (3,802) (3,055) (17.4) 2.7
Reinsurance and other recoveries revenue 425 1,315 537 (67.7) (20.9)
Net incurred claims (2,714) (2,487) (2,518) 9.1 7.8 Total operating expenses
Acquisition expenses (485) (445) (462) 9.0 5.0
Other underwriting expenses (226) (189) (176) 19.6 28.4
Total operating expenses (711) (634) (638) 12.1 11.4 Underwriting result 156 313 312 (50.2) (50.0)
Investment income - insurance funds 110 108 179 1.9 (38.5)
Insurance trading result 266 421 491 (36.8) (45.8) Managed schemes, joint venture and other 5 4 - 25.0 n/a
General Insurance operational earnings 271 425 491 (36.2) (44.8) Investment income - shareholder funds 72 63 35 14.3 105.7
General Insurance profit before tax and capital funding 343 488 526 (29.7) (34.8) Capital funding (15) (19) (18) (21.1) (16.7)
General Insurance profit before tax 328 469 508 (30.1) (35.4)
Income tax (94) (138) (150) (31.9) (37.3)
General Insurance profit after tax 234 331 358 (29.3) (34.6) Life Insurance
Underlying profit after tax 39 28 25 39.3 56.0
Market adjustments (9) (5) (14) 80.0 (35.7)
Life Insurance profit after tax 30 23 11 30.4 172.7
Insurance (Australia) profit after tax 264 354 369 (25.4) (28.5)
General Insurance ratios
Half Year Ended
Dec-17 Jun-17 Dec-16
% % %
Acquisition expenses ratio 13.6 13.0 13.3
Other underwriting expenses ratio 6.3 5.5 5.1
Total operating expenses ratio 19.9 18.5 18.4 Loss ratio 75.8 72.4 72.6
Combined operating ratio 95.7 90.9 91.0
For
per
sona
l use
onl
y
INSURANCE (AUSTRALIA)
PAGE 16 FINANCIAL RESULTS FOR THE HALF YEAR ENDED 31 DECEMBER 2017
ANALYST PACK
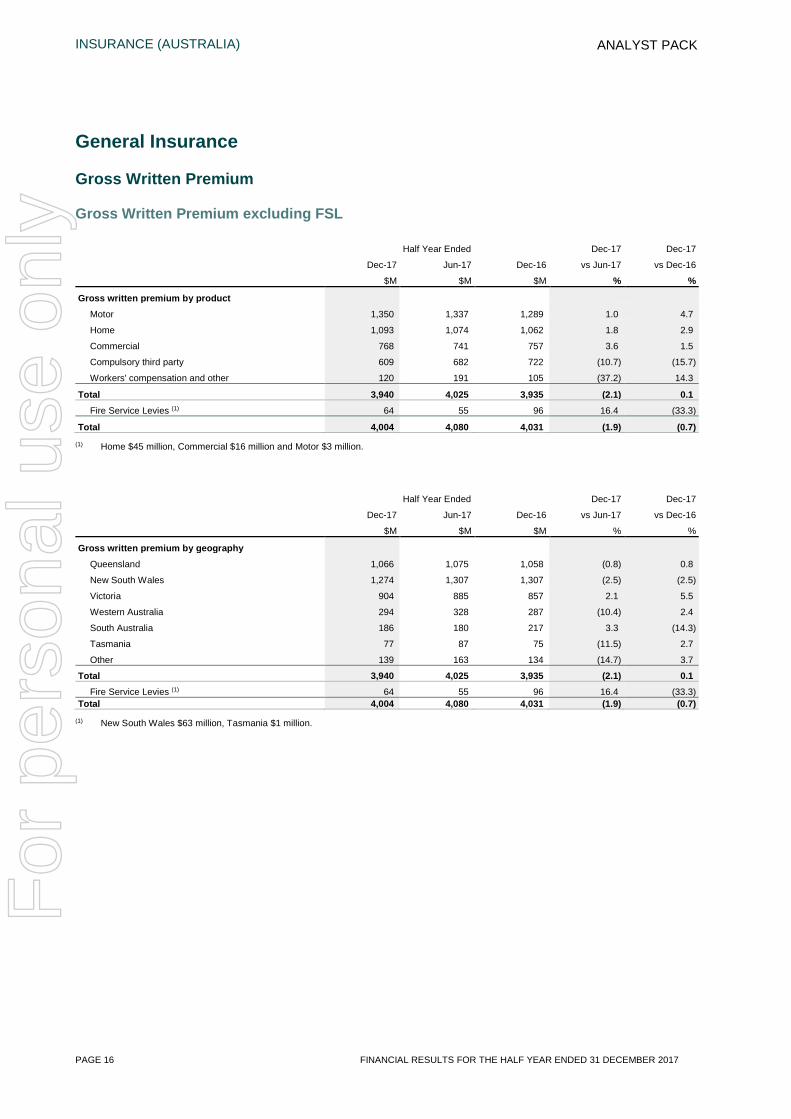
General Insurance
Gross Written Premium
Gross Written Premium excluding FSL
Half Year Ended Dec-17 Dec-17
Dec-17 Jun-17 Dec-16 vs Jun-17 vs Dec-16
$M $M $M % %
Gross written premium by product
Motor 1,350 1,337 1,289 1.0 4.7
Home 1,093 1,074 1,062 1.8 2.9
Commercial 768 741 757 3.6 1.5
Compulsory third party 609 682 722 (10.7) (15.7)
Workers' compensation and other 120 191 105 (37.2) 14.3
Total 3,940 4,025 3,935 (2.1) 0.1 Fire Service Levies (1) 64 55 96 16.4 (33.3)
Total 4,004 4,080 4,031 (1.9) (0.7) (1) Home $45 million, Commercial $16 million and Motor $3 million.
Half Year Ended Dec-17 Dec-17
Dec-17 Jun-17 Dec-16 vs Jun-17 vs Dec-16
$M $M $M % %
Gross written premium by geography
Queensland 1,066 1,075 1,058 (0.8) 0.8
New South Wales 1,274 1,307 1,307 (2.5) (2.5)
Victoria 904 885 857 2.1 5.5
Western Australia 294 328 287 (10.4) 2.4
South Australia 186 180 217 3.3 (14.3)
Tasmania 77 87 75 (11.5) 2.7
Other 139 163 134 (14.7) 3.7
Total 3,940 4,025 3,935 (2.1) 0.1 Fire Service Levies (1) 64 55 96 16.4 (33.3)
Total 4,004 4,080 4,031 (1.9) (0.7) (1) New South Wales $63 million, Tasmania $1 million.
For
per
sona
l use
onl
y

INSURANCE (AUSTRALIA)
FINANCIAL RESULTS FOR THE HALF YEAR ENDED 31 DECEMBER 2017 PAGE 17
ANALYST PACK
Gross Written Premium (continued)
Gross Written Premium including FSL
Half Year Ended Dec-17 Dec-17
Dec-17 Jun-17 Dec-16 vs Jun-17 vs Dec-16
$M $M $M % %
Gross written premium by product (Incl FSL)
Motor 1,353 1,341 1,293 0.9 4.6
Home 1,138 1,110 1,123 2.5 1.3
Commercial 784 756 787 3.7 (0.4)
Compulsory third party 609 682 722 (10.7) (15.7)
Workers' compensation and other 120 191 106 (37.2) 13.2
Total 4,004 4,080 4,031 (1.9) (0.7)
Half Year Ended Dec-17 Dec-17
Dec-17 Jun-17 Dec-16 vs Jun-17 vs Dec-16
$M $M $M % %
Gross written premium by geography (Incl FSL)
Queensland 1,066 1,075 1,058 (0.8) 0.8
New South Wales 1,337 1,361 1,401 (1.8) (4.6)
Victoria 904 885 857 2.1 5.5
Western Australia 294 328 287 (10.4) 2.4
South Australia 186 180 217 3.3 (14.3)
Tasmania 78 88 77 (11.4) 1.3
Other 139 163 134 (14.7) 3.7
Total 4,004 4,080 4,031 (1.9) (0.7)
Gross Written Premium movements including FSL ($m)
F
or p
erso
nal u
se o
nly
INSURANCE (AUSTRALIA)
PAGE 18 FINANCIAL RESULTS FOR THE HALF YEAR ENDED 31 DECEMBER 2017
ANALYST PACK
Gross Written Premium (continued)
Consumer
Motor GWP increased 4.7% to $1,350 million and Home GWP increased 2.9% to $1,093 million, excluding emergency services levy.
Motor premium increases of 3.5% were achieved with unit growth of 1.2% due to new business performing strongly and retention holding steady.
Home premium increase of 3.7% was partially offset by unit loss of 0.8% as the portfolio is repriced for increases in natural hazard costs and underlying inflation.
The NSW government’s reversal of FSL late last year, resulted in a requirement for Suncorp to pay $32 million to the NSW government with two years to recover this amount.
Commercial
Commercial GWP increased 1.5% to $768 million.
Suncorp continues to maintain a disciplined approach to underwriting, prioritising margin over growth with achieved rate increases ranging from low single digit to the high teens. These increases have impacted volumes in some classes, more specifically in the top end corporate market where the portfolio has been subject to selective de-risking.
Compulsory Third Party
CTP GWP decreased 15.7% to $609 million.
Suncorp continues to be a significant participant in the NSW CTP market. Under the new scheme and benefit design, customers have seen reduced premiums as at 1 December 2017. The new scheme has been implemented on a claims incurred basis, so customers who paid premiums before this date will be entitled to a pro-rata refund, which resulted in a $53 million payment to the NSW government during the period. Suncorp expects to maintain a market share of around 25% whilst achieving targeted profitability.
In the Queensland CTP market, GWP contracted by 6.6% (including the FY16 NIIS claw-back) driven by reductions in ceiling price by the regulator. Suncorp has maintained around 50% market share and will focus on maintaining sustainable underwriting results.
In the South Australian market, Suncorp’s allocation of 30% market share will continue until 30 June 2019 at which point the scheme will transition to become fully competitive.
Suncorp’s market share in the ACT CTP scheme has continued to grow, reaching 41% since entering the market in 2013.
For
per
sona
l use
onl
y

INSURANCE (AUSTRALIA)
FINANCIAL RESULTS FOR THE HALF YEAR ENDED 31 DECEMBER 2017 PAGE 19
ANALYST PACK
Compulsory third party GWP by geography and one-off movements
Half Year Ended Dec-17
Dec-17 Dec-16 vs Dec-16
$M $M %
Compulsory third party GWP by geography (before one-off movements)
Queensland 221 253 (12.6)
New South Wales 352 366 (3.8)
ACT 31 31 -
South Australia 58 55 5.5
Total 662 705 (6.1) Compulsory third party GWP one-off movements
New South Wales refunds (53) - n/a
South Australia FY16 novated premium - 33 n/a
Queensland FY16 NIIS claw-back - (16) n/a
Total compulsory third party GWP 609 722 (15.7)
Workers’ compensation and other
GWP growth of 14.3% was due to strong retention further benefited by rate increases and wage growth predominantly in Western Australia.
For
per
sona
l use
onl
y
INSURANCE (AUSTRALIA)
PAGE 20 FINANCIAL RESULTS FOR THE HALF YEAR ENDED 31 DECEMBER 2017
ANALYST PACK
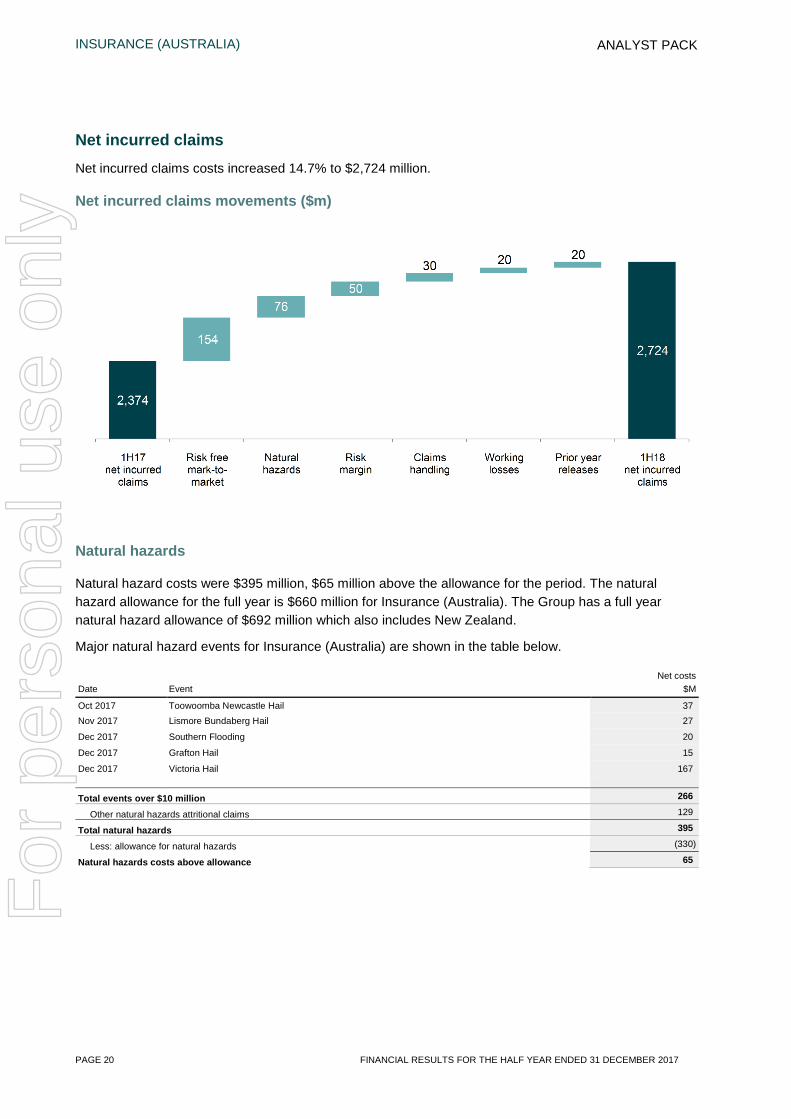
Net incurred claims Net incurred claims costs increased 14.7% to $2,724 million.
Net incurred claims movements ($m)
Natural hazards
Natural hazard costs were $395 million, $65 million above the allowance for the period. The natural hazard allowance for the full year is $660 million for Insurance (Australia). The Group has a full year natural hazard allowance of $692 million which also includes New Zealand.
Major natural hazard events for Insurance (Australia) are shown in the table below.
Net costs Date Event $M
Oct 2017 Toowoomba Newcastle Hail 37 Nov 2017 Lismore Bundaberg Hail 27
Dec 2017 Southern Flooding 20
Dec 2017 Grafton Hail 15
Dec 2017 Victoria Hail 167
Total events over $10 million 266
Other natural hazards attritional claims 129
Total natural hazards 395
Less: allowance for natural hazards (330)
Natural hazards costs above allowance 65
For
per
sona
l use
onl
y
INSURANCE (AUSTRALIA)
FINANCIAL RESULTS FOR THE HALF YEAR ENDED 31 DECEMBER 2017 PAGE 21
ANALYST PACK
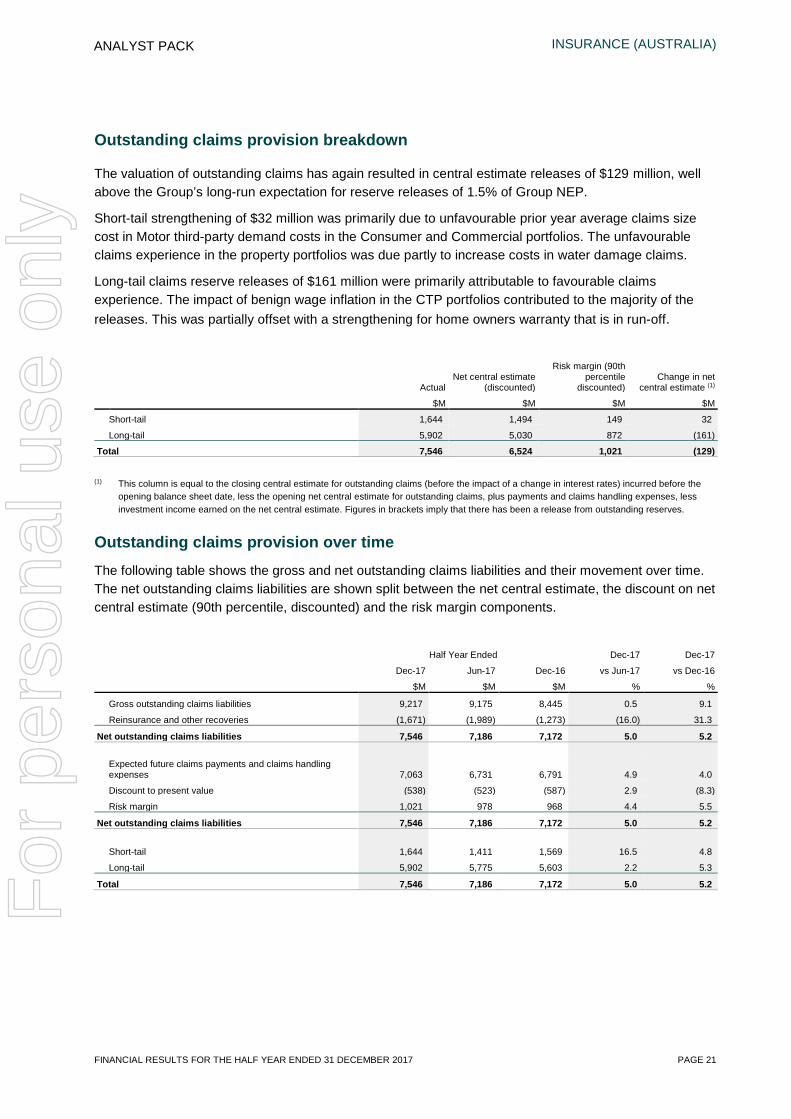
Outstanding claims provision breakdown
The valuation of outstanding claims has again resulted in central estimate releases of $129 million, well above the Group’s long-run expectation for reserve releases of 1.5% of Group NEP.
Short-tail strengthening of $32 million was primarily due to unfavourable prior year average claims size cost in Motor third-party demand costs in the Consumer and Commercial portfolios. The unfavourable claims experience in the property portfolios was due partly to increase costs in water damage claims.
Long-tail claims reserve releases of $161 million were primarily attributable to favourable claims experience. The impact of benign wage inflation in the CTP portfolios contributed to the majority of the releases. This was partially offset with a strengthening for home owners warranty that is in run-off.
Actual Net central estimate
(discounted)
Risk margin (90th percentile
discounted) Change in net
central estimate (1)
$M $M $M $M
Short-tail 1,644 1,494 149 32
Long-tail 5,902 5,030 872 (161)
Total 7,546 6,524 1,021 (129) (1) This column is equal to the closing central estimate for outstanding claims (before the impact of a change in interest rates) incurred before the
opening balance sheet date, less the opening net central estimate for outstanding claims, plus payments and claims handling expenses, less investment income earned on the net central estimate. Figures in brackets imply that there has been a release from outstanding reserves.
Outstanding claims provision over time
The following table shows the gross and net outstanding claims liabilities and their movement over time. The net outstanding claims liabilities are shown split between the net central estimate, the discount on net central estimate (90th percentile, discounted) and the risk margin components.
Half Year Ended Dec-17 Dec-17
Dec-17 Jun-17 Dec-16 vs Jun-17 vs Dec-16
$M $M $M % %
Gross outstanding claims liabilities 9,217 9,175 8,445 0.5 9.1
Reinsurance and other recoveries (1,671) (1,989) (1,273) (16.0) 31.3
Net outstanding claims liabilities 7,546 7,186 7,172 5.0 5.2
Expected future claims payments and claims handling expenses 7,063 6,731 6,791 4.9 4.0
Discount to present value (538) (523) (587) 2.9 (8.3)
Risk margin 1,021 978 968 4.4 5.5
Net outstanding claims liabilities 7,546 7,186 7,172 5.0 5.2
Short-tail 1,644 1,411 1,569 16.5 4.8
Long-tail 5,902 5,775 5,603 2.2 5.3
Total 7,546 7,186 7,172 5.0 5.2 F
or p
erso
nal u
se o
nly
INSURANCE (AUSTRALIA)
PAGE 22 FINANCIAL RESULTS FOR THE HALF YEAR ENDED 31 DECEMBER 2017
ANALYST PACK
Risk margins
Risk margins represent approximately 14% of outstanding claim reserves giving an approximate level of confidence of 90%.
Risk margins increased by $43 million during the period to $1,021 million from $978 million. The assets notionally backing risk margins had a net gain of $11 million. The net impact was therefore $32 million, which is excluded from the underlying ITR calculation.
Operating expenses
The total operating expense ratio was 0.9% higher as Suncorp began to invest in BIP initiatives which will be offset by expected benefits in future periods.
Managed schemes, joint venture and other
During the year Suncorp entered into a new managed scheme arrangement with the NSW Government whereby, Suncorp receives revenue as one of three claims management providers, to manage its existing portfolio as well as the portfolio of the exiting scheme agents. Suncorp continues to participate in the joint venture with the Royal Auto club in Tasmania and have distribution arrangements with other third party suppliers. Other income and expenses includes the amortisation of intangibles and other miscellaneous income.
For
per
sona
l use
onl
y
INSURANCE (AUSTRALIA)
FINANCIAL RESULTS FOR THE HALF YEAR ENDED 31 DECEMBER 2017 PAGE 23
ANALYST PACK
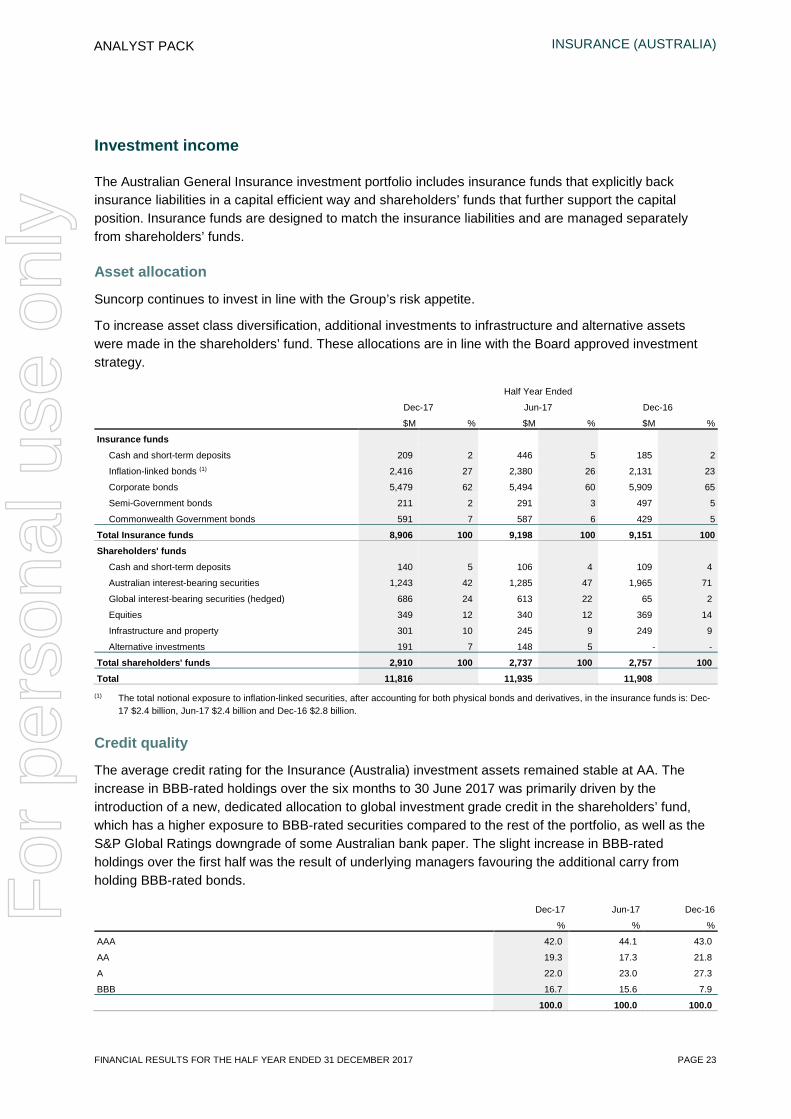
Investment income
The Australian General Insurance investment portfolio includes insurance funds that explicitly back insurance liabilities in a capital efficient way and shareholders’ funds that further support the capital position. Insurance funds are designed to match the insurance liabilities and are managed separately from shareholders’ funds.
Asset allocation
Suncorp continues to invest in line with the Group’s risk appetite.
To increase asset class diversification, additional investments to infrastructure and alternative assets were made in the shareholders’ fund. These allocations are in line with the Board approved investment strategy.
Half Year Ended
Dec-17 Jun-17 Dec-16
$M % $M % $M %
Insurance funds
Cash and short-term deposits 209 2 446 5 185 2
Inflation-linked bonds (1) 2,416 27 2,380 26 2,131 23
Corporate bonds 5,479 62 5,494 60 5,909 65
Semi-Government bonds 211 2 291 3 497 5
Commonwealth Government bonds 591 7 587 6 429 5
Total Insurance funds 8,906 100 9,198 100 9,151 100 Shareholders' funds
Cash and short-term deposits 140 5 106 4 109 4
Australian interest-bearing securities 1,243 42 1,285 47 1,965 71
Global interest-bearing securities (hedged) 686 24 613 22 65 2
Equities 349 12 340 12 369 14
Infrastructure and property 301 10 245 9 249 9
Alternative investments 191 7 148 5 - -
Total shareholders' funds 2,910 100 2,737 100 2,757 100 Total 11,816 11,935 11,908
(1) The total notional exposure to inflation-linked securities, after accounting for both physical bonds and derivatives, in the insurance funds is: Dec-17 $2.4 billion, Jun-17 $2.4 billion and Dec-16 $2.8 billion.
Credit quality
The average credit rating for the Insurance (Australia) investment assets remained stable at AA. The increase in BBB-rated holdings over the six months to 30 June 2017 was primarily driven by the introduction of a new, dedicated allocation to global investment grade credit in the shareholders’ fund, which has a higher exposure to BBB-rated securities compared to the rest of the portfolio, as well as the S&P Global Ratings downgrade of some Australian bank paper. The slight increase in BBB-rated holdings over the first half was the result of underlying managers favouring the additional carry from holding BBB-rated bonds.
Dec-17 Jun-17 Dec-16 % % %
AAA 42.0 44.1 43.0
AA 19.3 17.3 21.8
A 22.0 23.0 27.3
BBB 16.7 15.6 7.9
100.0 100.0 100.0
For
per
sona
l use
onl
y
INSURANCE (AUSTRALIA)
PAGE 24 FINANCIAL RESULTS FOR THE HALF YEAR ENDED 31 DECEMBER 2017
ANALYST PACK
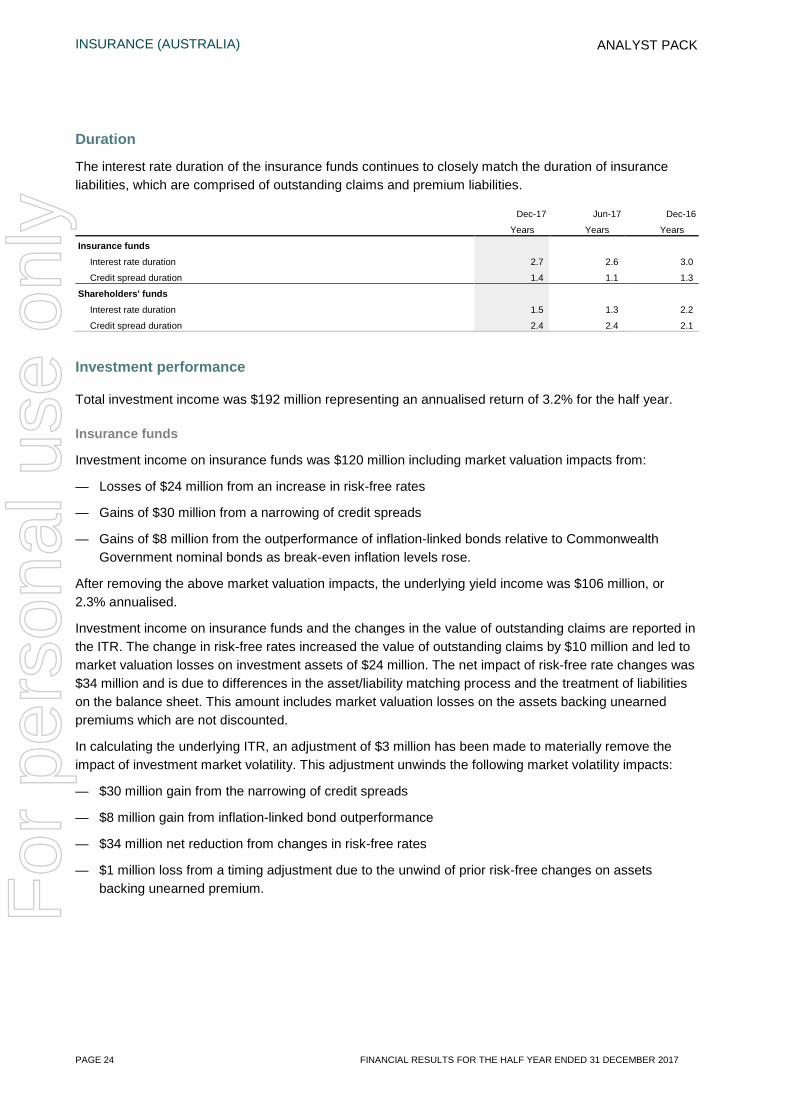
Duration
The interest rate duration of the insurance funds continues to closely match the duration of insurance liabilities, which are comprised of outstanding claims and premium liabilities.
Dec-17 Jun-17 Dec-16
Years Years Years
Insurance funds Interest rate duration 2.7 2.6 3.0
Credit spread duration 1.4 1.1 1.3
Shareholders' funds Interest rate duration 1.5 1.3 2.2
Credit spread duration 2.4 2.4 2.1
Investment performance
Total investment income was $192 million representing an annualised return of 3.2% for the half year.
Insurance funds
Investment income on insurance funds was $120 million including market valuation impacts from:
— Losses of $24 million from an increase in risk-free rates
— Gains of $30 million from a narrowing of credit spreads
— Gains of $8 million from the outperformance of inflation-linked bonds relative to Commonwealth Government nominal bonds as break-even inflation levels rose.
After removing the above market valuation impacts, the underlying yield income was $106 million, or 2.3% annualised.
Investment income on insurance funds and the changes in the value of outstanding claims are reported in the ITR. The change in risk-free rates increased the value of outstanding claims by $10 million and led to market valuation losses on investment assets of $24 million. The net impact of risk-free rate changes was $34 million and is due to differences in the asset/liability matching process and the treatment of liabilities on the balance sheet. This amount includes market valuation losses on the assets backing unearned premiums which are not discounted.
In calculating the underlying ITR, an adjustment of $3 million has been made to materially remove the impact of investment market volatility. This adjustment unwinds the following market volatility impacts:
— $30 million gain from the narrowing of credit spreads
— $8 million gain from inflation-linked bond outperformance
— $34 million net reduction from changes in risk-free rates
— $1 million loss from a timing adjustment due to the unwind of prior risk-free changes on assets backing unearned premium.
For
per
sona
l use
onl
y
INSURANCE (AUSTRALIA)
FINANCIAL RESULTS FOR THE HALF YEAR ENDED 31 DECEMBER 2017 PAGE 25
ANALYST PACK
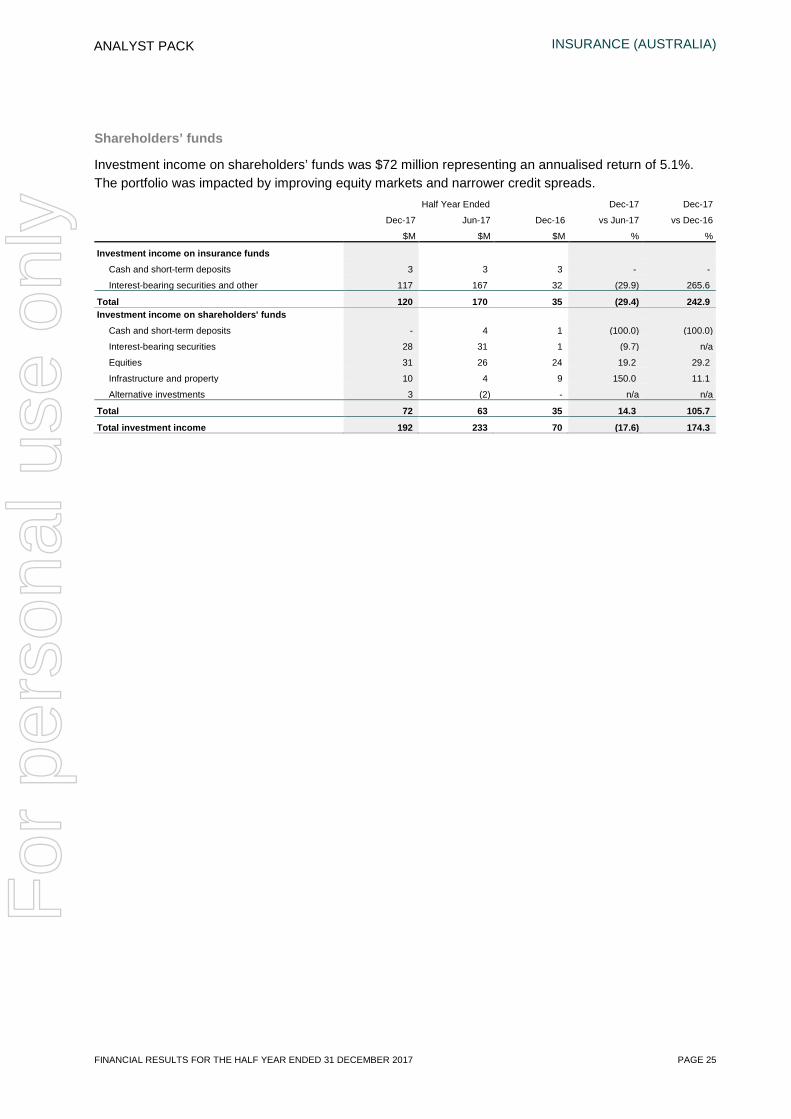
Shareholders’ funds
Investment income on shareholders’ funds was $72 million representing an annualised return of 5.1%. The portfolio was impacted by improving equity markets and narrower credit spreads.
Half Year Ended Dec-17 Dec-17
Dec-17 Jun-17 Dec-16 vs Jun-17 vs Dec-16
$M $M $M % %
Investment income on insurance funds
Cash and short-term deposits 3 3 3 - -
Interest-bearing securities and other 117 167 32 (29.9) 265.6
Total 120 170 35 (29.4) 242.9 Investment income on shareholders' funds
Cash and short-term deposits - 4 1 (100.0) (100.0)
Interest-bearing securities 28 31 1 (9.7) n/a
Equities 31 26 24 19.2 29.2
Infrastructure and property 10 4 9 150.0 11.1
Alternative investments 3 (2) - n/a n/a
Total 72 63 35 14.3 105.7
Total investment income 192 233 70 (17.6) 174.3
For
per
sona
l use
onl
y
INSURANCE (AUSTRALIA)
PAGE 26 FINANCIAL RESULTS FOR THE HALF YEAR ENDED 31 DECEMBER 2017
ANALYST PACK
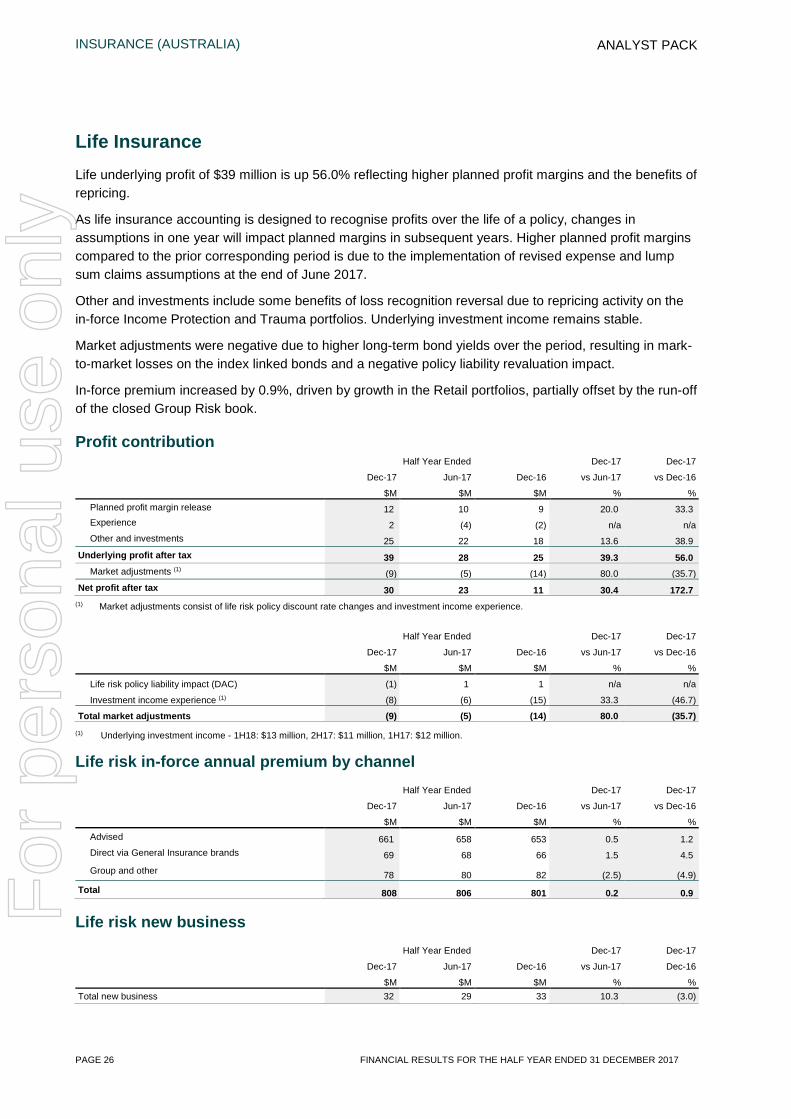
Life Insurance Life underlying profit of $39 million is up 56.0% reflecting higher planned profit margins and the benefits of repricing.
As life insurance accounting is designed to recognise profits over the life of a policy, changes in assumptions in one year will impact planned margins in subsequent years. Higher planned profit margins compared to the prior corresponding period is due to the implementation of revised expense and lump sum claims assumptions at the end of June 2017.
Other and investments include some benefits of loss recognition reversal due to repricing activity on the in-force Income Protection and Trauma portfolios. Underlying investment income remains stable.
Market adjustments were negative due to higher long-term bond yields over the period, resulting in mark-to-market losses on the index linked bonds and a negative policy liability revaluation impact.
In-force premium increased by 0.9%, driven by growth in the Retail portfolios, partially offset by the run-off of the closed Group Risk book.
Profit contribution Half Year Ended Dec-17 Dec-17
Dec-17 Jun-17 Dec-16 vs Jun-17 vs Dec-16
$M $M $M % % Planned profit margin release 12 10 9 20.0 33.3 Experience 2 (4) (2) n/a n/a Other and investments 25 22 18 13.6 38.9
Underlying profit after tax 39 28 25 39.3 56.0 Market adjustments (1) (9) (5) (14) 80.0 (35.7)
Net profit after tax 30 23 11 30.4 172.7 (1) Market adjustments consist of life risk policy discount rate changes and investment income experience.
Half Year Ended Dec-17 Dec-17
Dec-17 Jun-17 Dec-16 vs Jun-17 vs Dec-16
$M $M $M % %
Life risk policy liability impact (DAC) (1) 1 1 n/a n/a
Investment income experience (1) (8) (6) (15) 33.3 (46.7)
Total market adjustments (9) (5) (14) 80.0 (35.7) (1) Underlying investment income - 1H18: $13 million, 2H17: $11 million, 1H17: $12 million.
Life risk in-force annual premium by channel Half Year Ended Dec-17 Dec-17
Dec-17 Jun-17 Dec-16 vs Jun-17 vs Dec-16
$M $M $M % % Advised 661 658 653 0.5 1.2 Direct via General Insurance brands 69 68 66 1.5 4.5 Group and other 78 80 82 (2.5) (4.9)
Total 808 806 801 0.2 0.9
Life risk new business Half Year Ended Dec-17 Dec-17
Dec-17 Jun-17 Dec-16 vs Jun-17 Dec-16
$M $M $M % % Total new business 32 29 33 10.3 (3.0)
For
per
sona
l use
onl
y
BANKING & WEALTH
FINANCIAL RESULTS FOR THE HALF YEAR ENDED 31 DECEMBER 2017 PAGE 27
ANALYST PACK
BANKING & WEALTH
Result overview
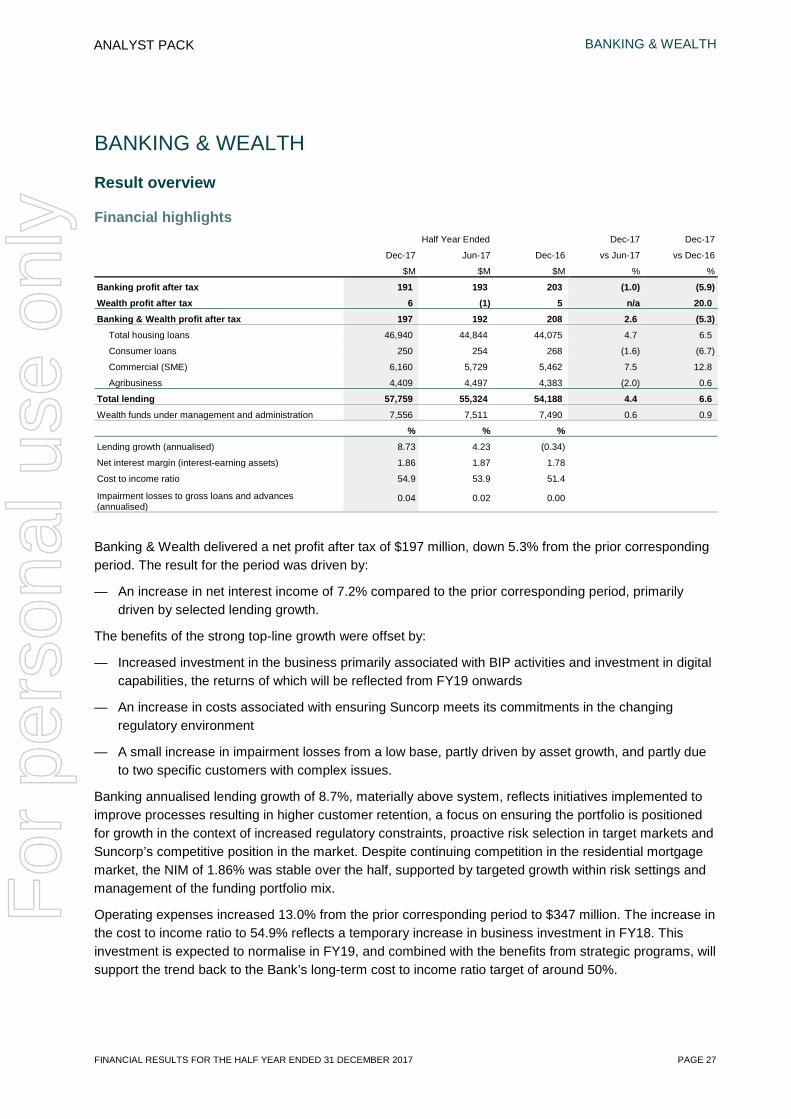
Financial highlights Half Year Ended Dec-17 Dec-17
Dec-17 Jun-17 Dec-16 vs Jun-17 vs Dec-16
$M $M $M % %
Banking profit after tax 191 193 203 (1.0) (5.9) Wealth profit after tax 6 (1) 5 n/a 20.0 Banking & Wealth profit after tax 197 192 208 2.6 (5.3)
Total housing loans 46,940 44,844 44,075 4.7 6.5
Consumer loans 250 254 268 (1.6) (6.7)
Commercial (SME) 6,160 5,729 5,462 7.5 12.8
Agribusiness 4,409 4,497 4,383 (2.0) 0.6
Total lending 57,759 55,324 54,188 4.4 6.6 Wealth funds under management and administration 7,556 7,511 7,490 0.6 0.9
% % % Lending growth (annualised) 8.73 4.23 (0.34) Net interest margin (interest-earning assets) 1.86 1.87 1.78 Cost to income ratio 54.9 53.9 51.4 Impairment losses to gross loans and advances (annualised)
0.04 0.02 0.00
Banking & Wealth delivered a net profit after tax of $197 million, down 5.3% from the prior corresponding period. The result for the period was driven by:
— An increase in net interest income of 7.2% compared to the prior corresponding period, primarily driven by selected lending growth.
The benefits of the strong top-line growth were offset by:
— Increased investment in the business primarily associated with BIP activities and investment in digital capabilities, the returns of which will be reflected from FY19 onwards
— An increase in costs associated with ensuring Suncorp meets its commitments in the changing regulatory environment
— A small increase in impairment losses from a low base, partly driven by asset growth, and partly due to two specific customers with complex issues.
Banking annualised lending growth of 8.7%, materially above system, reflects initiatives implemented to improve processes resulting in higher customer retention, a focus on ensuring the portfolio is positioned for growth in the context of increased regulatory constraints, proactive risk selection in target markets and Suncorp’s competitive position in the market. Despite continuing competition in the residential mortgage market, the NIM of 1.86% was stable over the half, supported by targeted growth within risk settings and management of the funding portfolio mix.
Operating expenses increased 13.0% from the prior corresponding period to $347 million. The increase in the cost to income ratio to 54.9% reflects a temporary increase in business investment in FY18. This investment is expected to normalise in FY19, and combined with the benefits from strategic programs, will support the trend back to the Bank’s long-term cost to income ratio target of around 50%.
For
per
sona
l use
onl
y
BANKING & WEALTH
PAGE 28 FINANCIAL RESULTS FOR THE HALF YEAR ENDED 31 DECEMBER 2017
ANALYST PACK
Banking continues to maintain disciplined lending practices, with deliberate management action delivering sound credit quality. New business credit quality was strong over the period with asset growth remaining within macroprudential limits and continued low exposure to market segments deemed as higher risk, such as inner-city apartments. The sound credit quality of the portfolio and reduced retail arrears contributed to a reduction in collective provision as a proportion of the portfolio balance. While impairment losses increased over the half, representing 4 basis points (annualised) of gross loans and advances, they remain low and well below the through-the-cycle operating range of 10 to 20 basis points.
Banking maintained its measured approach to managing funding and liquidity risk, ensuring a strong and sustainable funding profile that supports balance sheet growth. Continued focus on growing transaction and savings accounts was reflected in at-call deposit growth of 5.1% over the half, primarily driven by higher digital engagement, improved account origination capabilities and attractive customer offerings. Banking’s Net Stable Funding Ratio (NSFR) has been consistently above 105%, ending the half year at 113%.
Banking's CET1 ratio ended the half at the top of the operating range at 9.01%. The reduction in the CET1 ratio reflects the lending growth delivered over the half, particularly within business lending, and an overall reduction in CET1. Return on CET1 of 11.9% was below the target range, driven by the increase in strategic investments over the half and costs associated with higher than usual Additional Tier 1 (AT1) capital levels for the majority of the half year due to the early financing of maturing securities. AT1 capital levels returned to normal levels in December.
Wealth profit after tax of $6 million, up $1 million from the prior corresponding period, was driven by positive investment returns and the performance of annuity and participating business. This result was partially offset by the cost of heightened regulatory change activity and transitioning to the new administration platform.
Outlook
Banking is expected to continue to benefit from the investment in customer retention, with growth momentum extending into the second half to deliver lending growth above system for the 2018 financial year. Maintaining satisfactory lending quality, diversification of the lending portfolio and compliance with macroprudential limits will remain core to the ongoing lending proposition. Growth in transactional banking will continue to be a priority through investment in digital self-service and payment capabilities to meet evolving customer expectations.
The stable, diverse and flexible funding options available to Suncorp are expected to partially mitigate potential NIM headwinds from the persistently low interest rate environment and increased competition for both retail lending and deposits throughout the second half of the year.
The Banking industry is currently experiencing an unprecedented level of regulatory and political activity. This activity, coupled with the ongoing low interest rate environment and pricing pressure, will likely impact the Banking sector over the medium term. Suncorp is committed to maintaining confidence and stability in the Australian banking system and supports any measures that deliver improved outcomes for customers.
Through disciplined credit selection within risk appetite, portfolio credit quality is expected to remain sound, with impairment losses estimated at or below the bottom of the through-the-cycle operating range of 10 to 20 basis points. The continuing benign economic environment will support ongoing low impairment losses, however potential impacts from high house prices, low wage growth, and the inherent volatility in agricultural conditions could impact the level of future impairments.
For
per
sona
l use
onl
y
BANKING & WEALTH
FINANCIAL RESULTS FOR THE HALF YEAR ENDED 31 DECEMBER 2017 PAGE 29
ANALYST PACK
Notwithstanding the expected increase in regulatory compliance, Banking & Wealth remains committed to reducing the cost-to-income ratio with significant operational efficiencies, including enhanced digital capabilities and customer services, from the investment in BIP, expected to be realised from FY19. Revenue benefits from the strong balance sheet growth and improved margin outlook will also help reduce the cost-to-income ratio.
Wealth will continue to focus on opportunities to improve the digital experience for customers and deliver operational efficiencies through its new administrative system. The portfolio is expected to grow through its simple, everyday super product with a focus on retention in the more complex portfolios. Wealth will incur increased regulatory costs in the second half due to compulsory legislative changes and new reporting requirements.
The Banking & Wealth function will target:
— Sustainable retail lending growth above system
— A cost to income ratio of around 50%
— NIM of 1.80% to 1.90%
— A stable and diverse funding profile with a NSFR comfortably above 105%
— A return on CET1 capital of 12.5% to 15.0%.
For
per
sona
l use
onl
y
BANKING & WEALTH
PAGE 30 FINANCIAL RESULTS FOR THE HALF YEAR ENDED 31 DECEMBER 2017
ANALYST PACK
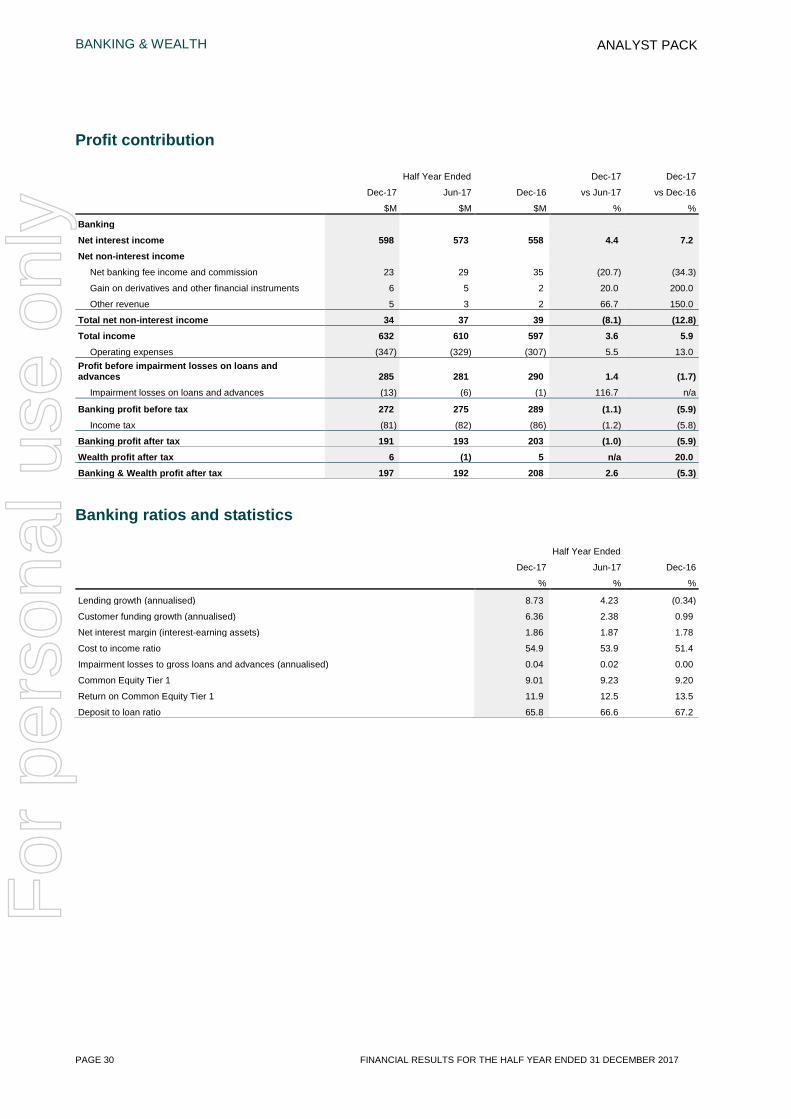
Profit contribution
Half Year Ended Dec-17 Dec-17
Dec-17 Jun-17 Dec-16 vs Jun-17 vs Dec-16
$M $M $M % %
Banking
Net interest income 598 573 558 4.4 7.2 Net non-interest income
Net banking fee income and commission 23 29 35 (20.7) (34.3)
Gain on derivatives and other financial instruments 6 5 2 20.0 200.0
Other revenue 5 3 2 66.7 150.0
Total net non-interest income 34 37 39 (8.1) (12.8) Total income 632 610 597 3.6 5.9
Operating expenses (347) (329) (307) 5.5 13.0 Profit before impairment losses on loans and advances 285 281 290 1.4 (1.7)
Impairment losses on loans and advances (13) (6) (1) 116.7 n/a
Banking profit before tax 272 275 289 (1.1) (5.9) Income tax (81) (82) (86) (1.2) (5.8)
Banking profit after tax 191 193 203 (1.0) (5.9) Wealth profit after tax 6 (1) 5 n/a 20.0 Banking & Wealth profit after tax 197 192 208 2.6 (5.3)
Banking ratios and statistics
Half Year Ended
Dec-17 Jun-17 Dec-16
% % %
Lending growth (annualised) 8.73 4.23 (0.34)
Customer funding growth (annualised) 6.36 2.38 0.99
Net interest margin (interest-earning assets) 1.86 1.87 1.78
Cost to income ratio 54.9 53.9 51.4
Impairment losses to gross loans and advances (annualised) 0.04 0.02 0.00
Common Equity Tier 1 9.01 9.23 9.20
Return on Common Equity Tier 1 11.9 12.5 13.5
Deposit to loan ratio 65.8 66.6 67.2
For
per
sona
l use
onl
y
BANKING & WEALTH
FINANCIAL RESULTS FOR THE HALF YEAR ENDED 31 DECEMBER 2017 PAGE 31
ANALYST PACK
Banking
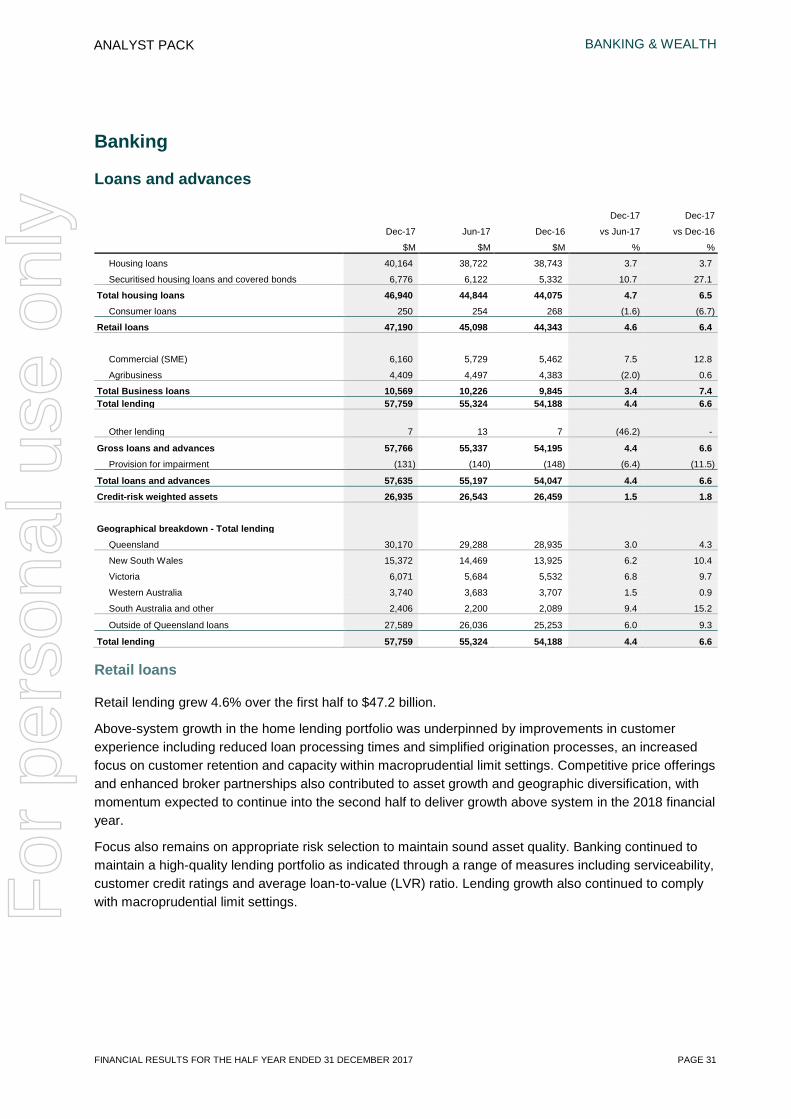
Loans and advances
Dec-17 Dec-17
Dec-17 Jun-17 Dec-16 vs Jun-17 vs Dec-16
$M $M $M % %
Housing loans 40,164 38,722 38,743 3.7 3.7
Securitised housing loans and covered bonds 6,776 6,122 5,332 10.7 27.1
Total housing loans 46,940 44,844 44,075 4.7 6.5 Consumer loans 250 254 268 (1.6) (6.7)
Retail loans 47,190 45,098 44,343 4.6 6.4
Commercial (SME) 6,160 5,729 5,462 7.5 12.8
Agribusiness 4,409 4,497 4,383 (2.0) 0.6
Total Business loans 10,569 10,226 9,845 3.4 7.4 Total lending 57,759 55,324 54,188 4.4 6.6
Other lending 7 13 7 (46.2) -
Gross loans and advances 57,766 55,337 54,195 4.4 6.6 Provision for impairment (131) (140) (148) (6.4) (11.5)
Total loans and advances 57,635 55,197 54,047 4.4 6.6 Credit-risk weighted assets 26,935 26,543 26,459 1.5 1.8
Geographical breakdown - Total lending
Queensland 30,170 29,288 28,935 3.0 4.3
New South Wales 15,372 14,469 13,925 6.2 10.4
Victoria 6,071 5,684 5,532 6.8 9.7
Western Australia 3,740 3,683 3,707 1.5 0.9
South Australia and other 2,406 2,200 2,089 9.4 15.2
Outside of Queensland loans 27,589 26,036 25,253 6.0 9.3
Total lending 57,759 55,324 54,188 4.4 6.6
Retail loans
Retail lending grew 4.6% over the first half to $47.2 billion.
Above-system growth in the home lending portfolio was underpinned by improvements in customer experience including reduced loan processing times and simplified origination processes, an increased focus on customer retention and capacity within macroprudential limit settings. Competitive price offerings and enhanced broker partnerships also contributed to asset growth and geographic diversification, with momentum expected to continue into the second half to deliver growth above system in the 2018 financial year.
Focus also remains on appropriate risk selection to maintain sound asset quality. Banking continued to maintain a high-quality lending portfolio as indicated through a range of measures including serviceability, customer credit ratings and average loan-to-value (LVR) ratio. Lending growth also continued to comply with macroprudential limit settings.
For
per
sona
l use
onl
y
BANKING & WEALTH
PAGE 32 FINANCIAL RESULTS FOR THE HALF YEAR ENDED 31 DECEMBER 2017
ANALYST PACK
Commercial (SME)
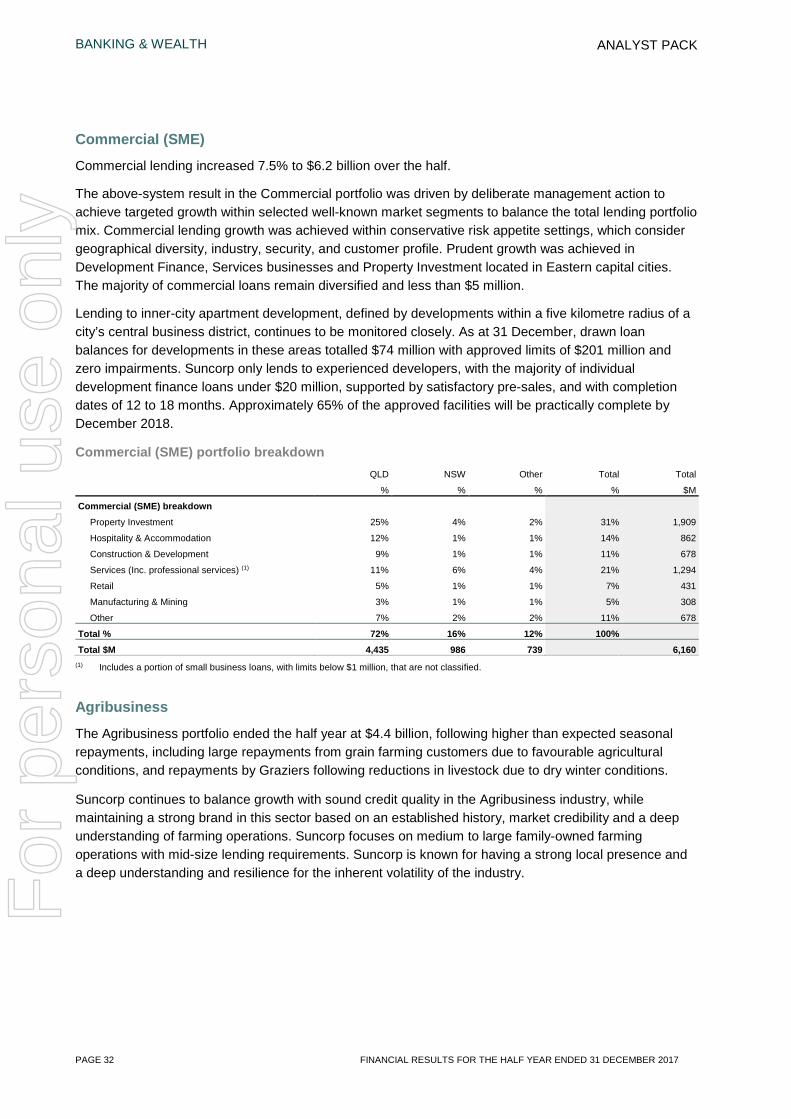
Commercial lending increased 7.5% to $6.2 billion over the half.
The above-system result in the Commercial portfolio was driven by deliberate management action to achieve targeted growth within selected well-known market segments to balance the total lending portfolio mix. Commercial lending growth was achieved within conservative risk appetite settings, which consider geographical diversity, industry, security, and customer profile. Prudent growth was achieved in Development Finance, Services businesses and Property Investment located in Eastern capital cities. The majority of commercial loans remain diversified and less than $5 million.
Lending to inner-city apartment development, defined by developments within a five kilometre radius of a city’s central business district, continues to be monitored closely. As at 31 December, drawn loan balances for developments in these areas totalled $74 million with approved limits of $201 million and zero impairments. Suncorp only lends to experienced developers, with the majority of individual development finance loans under $20 million, supported by satisfactory pre-sales, and with completion dates of 12 to 18 months. Approximately 65% of the approved facilities will be practically complete by December 2018.
Commercial (SME) portfolio breakdown QLD NSW Other Total Total
% % % % $M
Commercial (SME) breakdown
Property Investment 25% 4% 2% 31% 1,909
Hospitality & Accommodation 12% 1% 1% 14% 862
Construction & Development 9% 1% 1% 11% 678
Services (Inc. professional services) (1) 11% 6% 4% 21% 1,294
Retail 5% 1% 1% 7% 431
Manufacturing & Mining 3% 1% 1% 5% 308
Other 7% 2% 2% 11% 678
Total % 72% 16% 12% 100% Total $M 4,435 986 739 6,160
(1) Includes a portion of small business loans, with limits below $1 million, that are not classified.
Agribusiness
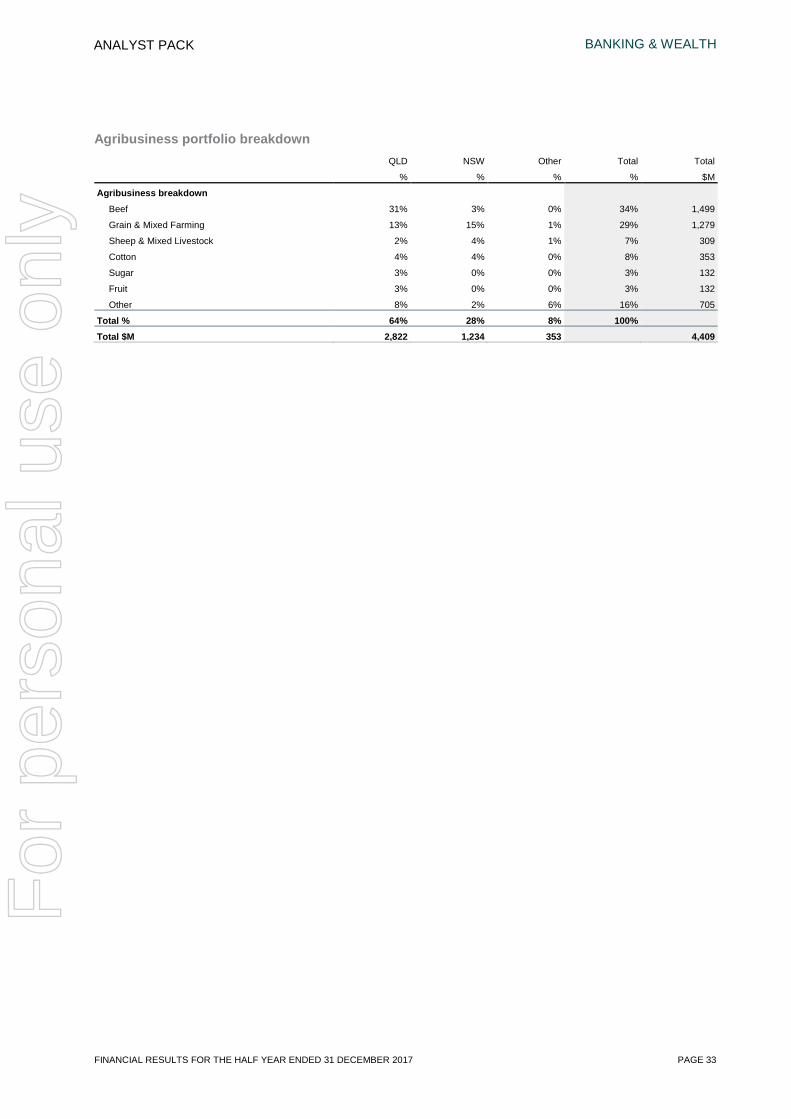
The Agribusiness portfolio ended the half year at $4.4 billion, following higher than expected seasonal repayments, including large repayments from grain farming customers due to favourable agricultural conditions, and repayments by Graziers following reductions in livestock due to dry winter conditions.
Suncorp continues to balance growth with sound credit quality in the Agribusiness industry, while maintaining a strong brand in this sector based on an established history, market credibility and a deep understanding of farming operations. Suncorp focuses on medium to large family-owned farming operations with mid-size lending requirements. Suncorp is known for having a strong local presence and a deep understanding and resilience for the inherent volatility of the industry.
For
per
sona
l use
onl
y
BANKING & WEALTH
FINANCIAL RESULTS FOR THE HALF YEAR ENDED 31 DECEMBER 2017 PAGE 33
ANALYST PACK
Agribusiness portfolio breakdown QLD NSW Other Total Total
% % % % $M
Agribusiness breakdown
Beef 31% 3% 0% 34% 1,499
Grain & Mixed Farming 13% 15% 1% 29% 1,279
Sheep & Mixed Livestock 2% 4% 1% 7% 309
Cotton 4% 4% 0% 8% 353
Sugar 3% 0% 0% 3% 132
Fruit 3% 0% 0% 3% 132
Other 8% 2% 6% 16% 705
Total % 64% 28% 8% 100% Total $M 2,822 1,234 353 4,409
For
per
sona
l use
onl
y
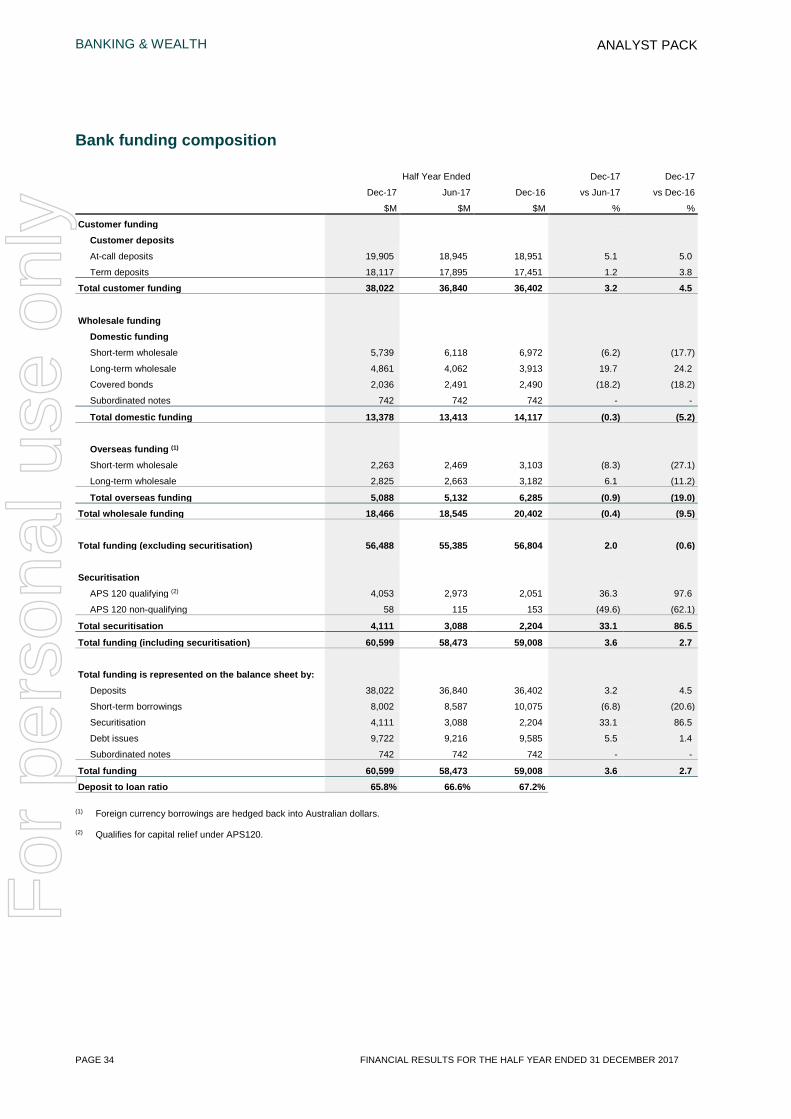
BANKING & WEALTH
PAGE 34 FINANCIAL RESULTS FOR THE HALF YEAR ENDED 31 DECEMBER 2017
ANALYST PACK
Bank funding composition
Half Year Ended Dec-17 Dec-17
Dec-17 Jun-17 Dec-16 vs Jun-17 vs Dec-16
$M $M $M % %
Customer funding
Customer deposits
At-call deposits 19,905 18,945 18,951 5.1 5.0
Term deposits 18,117 17,895 17,451 1.2 3.8
Total customer funding 38,022 36,840 36,402 3.2 4.5
Wholesale funding
Domestic funding
Short-term wholesale 5,739 6,118 6,972 (6.2) (17.7)
Long-term wholesale 4,861 4,062 3,913 19.7 24.2
Covered bonds 2,036 2,491 2,490 (18.2) (18.2)
Subordinated notes 742 742 742 - -
Total domestic funding 13,378 13,413 14,117 (0.3) (5.2)
Overseas funding (1)
Short-term wholesale 2,263 2,469 3,103 (8.3) (27.1)
Long-term wholesale 2,825 2,663 3,182 6.1 (11.2)
Total overseas funding 5,088 5,132 6,285 (0.9) (19.0) Total wholesale funding 18,466 18,545 20,402 (0.4) (9.5)
Total funding (excluding securitisation) 56,488 55,385 56,804 2.0 (0.6)
Securitisation
APS 120 qualifying (2) 4,053 2,973 2,051 36.3 97.6
APS 120 non-qualifying 58 115 153 (49.6) (62.1)
Total securitisation 4,111 3,088 2,204 33.1 86.5
Total funding (including securitisation) 60,599 58,473 59,008 3.6 2.7
Total funding is represented on the balance sheet by:
Deposits 38,022 36,840 36,402 3.2 4.5
Short-term borrowings 8,002 8,587 10,075 (6.8) (20.6)
Securitisation 4,111 3,088 2,204 33.1 86.5
Debt issues 9,722 9,216 9,585 5.5 1.4
Subordinated notes 742 742 742 - -
Total funding 60,599 58,473 59,008 3.6 2.7 Deposit to loan ratio 65.8% 66.6% 67.2%
(1) Foreign currency borrowings are hedged back into Australian dollars.
(2) Qualifies for capital relief under APS120.
For
per
sona
l use
onl
y
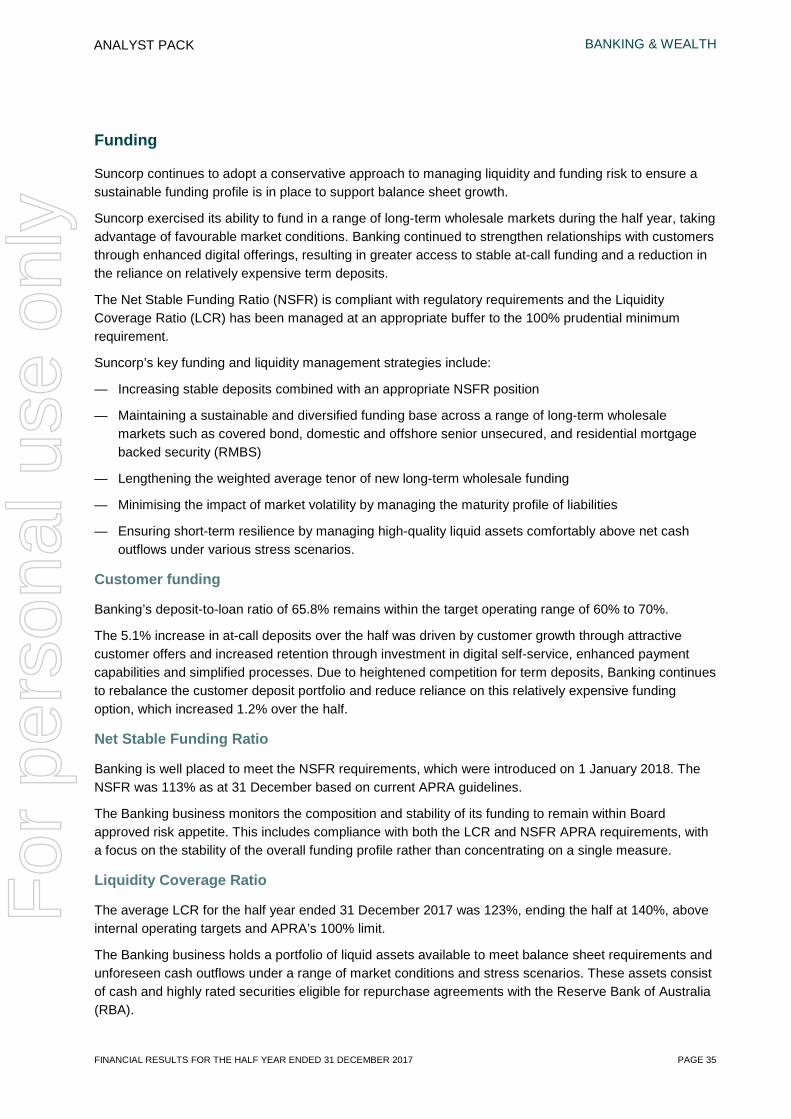
BANKING & WEALTH
FINANCIAL RESULTS FOR THE HALF YEAR ENDED 31 DECEMBER 2017 PAGE 35
ANALYST PACK
Funding
Suncorp continues to adopt a conservative approach to managing liquidity and funding risk to ensure a sustainable funding profile is in place to support balance sheet growth.
Suncorp exercised its ability to fund in a range of long-term wholesale markets during the half year, taking advantage of favourable market conditions. Banking continued to strengthen relationships with customers through enhanced digital offerings, resulting in greater access to stable at-call funding and a reduction in the reliance on relatively expensive term deposits.
The Net Stable Funding Ratio (NSFR) is compliant with regulatory requirements and the Liquidity Coverage Ratio (LCR) has been managed at an appropriate buffer to the 100% prudential minimum requirement.
Suncorp’s key funding and liquidity management strategies include:
— Increasing stable deposits combined with an appropriate NSFR position
— Maintaining a sustainable and diversified funding base across a range of long-term wholesale markets such as covered bond, domestic and offshore senior unsecured, and residential mortgage backed security (RMBS)
— Lengthening the weighted average tenor of new long-term wholesale funding
— Minimising the impact of market volatility by managing the maturity profile of liabilities
— Ensuring short-term resilience by managing high-quality liquid assets comfortably above net cash outflows under various stress scenarios.
Customer funding
Banking’s deposit-to-loan ratio of 65.8% remains within the target operating range of 60% to 70%.
The 5.1% increase in at-call deposits over the half was driven by customer growth through attractive customer offers and increased retention through investment in digital self-service, enhanced payment capabilities and simplified processes. Due to heightened competition for term deposits, Banking continues to rebalance the customer deposit portfolio and reduce reliance on this relatively expensive funding option, which increased 1.2% over the half.
Net Stable Funding Ratio
Banking is well placed to meet the NSFR requirements, which were introduced on 1 January 2018. The NSFR was 113% as at 31 December based on current APRA guidelines.
The Banking business monitors the composition and stability of its funding to remain within Board approved risk appetite. This includes compliance with both the LCR and NSFR APRA requirements, with a focus on the stability of the overall funding profile rather than concentrating on a single measure.
Liquidity Coverage Ratio
The average LCR for the half year ended 31 December 2017 was 123%, ending the half at 140%, above internal operating targets and APRA’s 100% limit.
The Banking business holds a portfolio of liquid assets available to meet balance sheet requirements and unforeseen cash outflows under a range of market conditions and stress scenarios. These assets consist of cash and highly rated securities eligible for repurchase agreements with the Reserve Bank of Australia (RBA).
For
per
sona
l use
onl
y
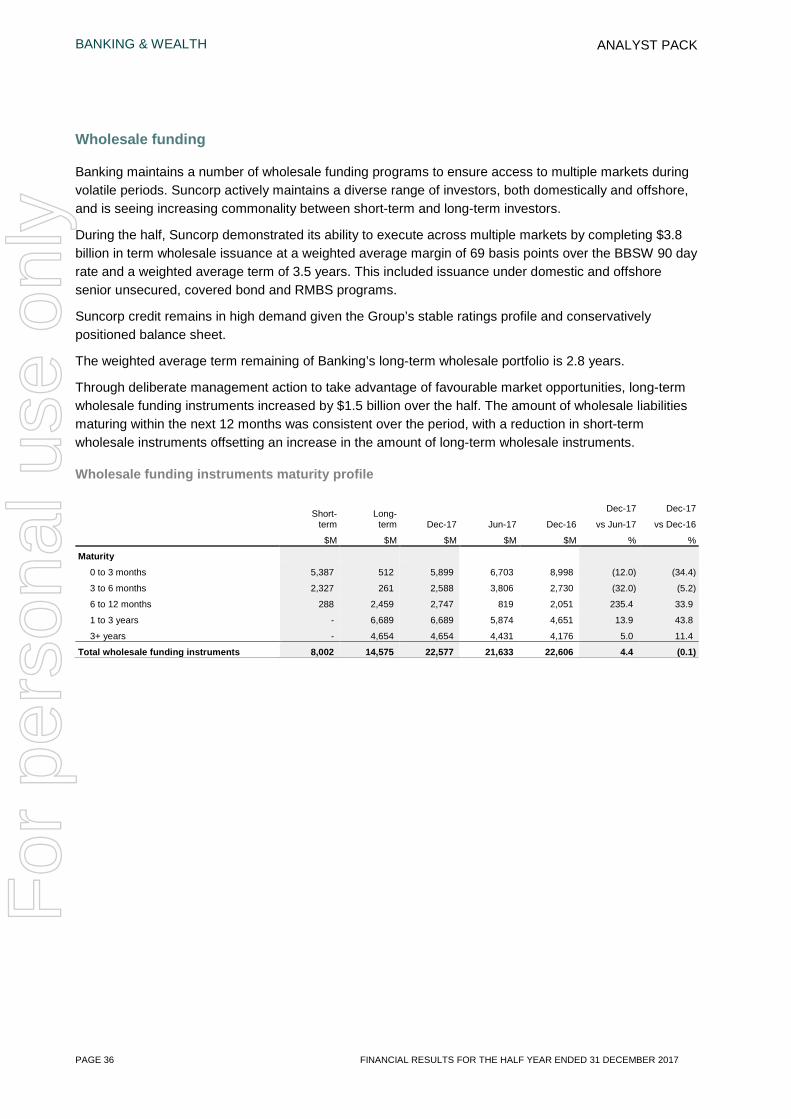
BANKING & WEALTH
PAGE 36 FINANCIAL RESULTS FOR THE HALF YEAR ENDED 31 DECEMBER 2017
ANALYST PACK
Wholesale funding
Banking maintains a number of wholesale funding programs to ensure access to multiple markets during volatile periods. Suncorp actively maintains a diverse range of investors, both domestically and offshore, and is seeing increasing commonality between short-term and long-term investors.
During the half, Suncorp demonstrated its ability to execute across multiple markets by completing $3.8 billion in term wholesale issuance at a weighted average margin of 69 basis points over the BBSW 90 day rate and a weighted average term of 3.5 years. This included issuance under domestic and offshore senior unsecured, covered bond and RMBS programs.
Suncorp credit remains in high demand given the Group’s stable ratings profile and conservatively positioned balance sheet.
The weighted average term remaining of Banking’s long-term wholesale portfolio is 2.8 years.
Through deliberate management action to take advantage of favourable market opportunities, long-term wholesale funding instruments increased by $1.5 billion over the half. The amount of wholesale liabilities maturing within the next 12 months was consistent over the period, with a reduction in short-term wholesale instruments offsetting an increase in the amount of long-term wholesale instruments.
Wholesale funding instruments maturity profile
Short- term
Long- term
Dec-17 Dec-17
Dec-17 Jun-17 Dec-16 vs Jun-17 vs Dec-16
$M $M $M $M $M % %
Maturity
0 to 3 months 5,387 512 5,899 6,703 8,998 (12.0) (34.4)
3 to 6 months 2,327 261 2,588 3,806 2,730 (32.0) (5.2)
6 to 12 months 288 2,459 2,747 819 2,051 235.4 33.9
1 to 3 years - 6,689 6,689 5,874 4,651 13.9 43.8
3+ years - 4,654 4,654 4,431 4,176 5.0 11.4
Total wholesale funding instruments 8,002 14,575 22,577 21,633 22,606 4.4 (0.1)
For
per
sona
l use
onl
y
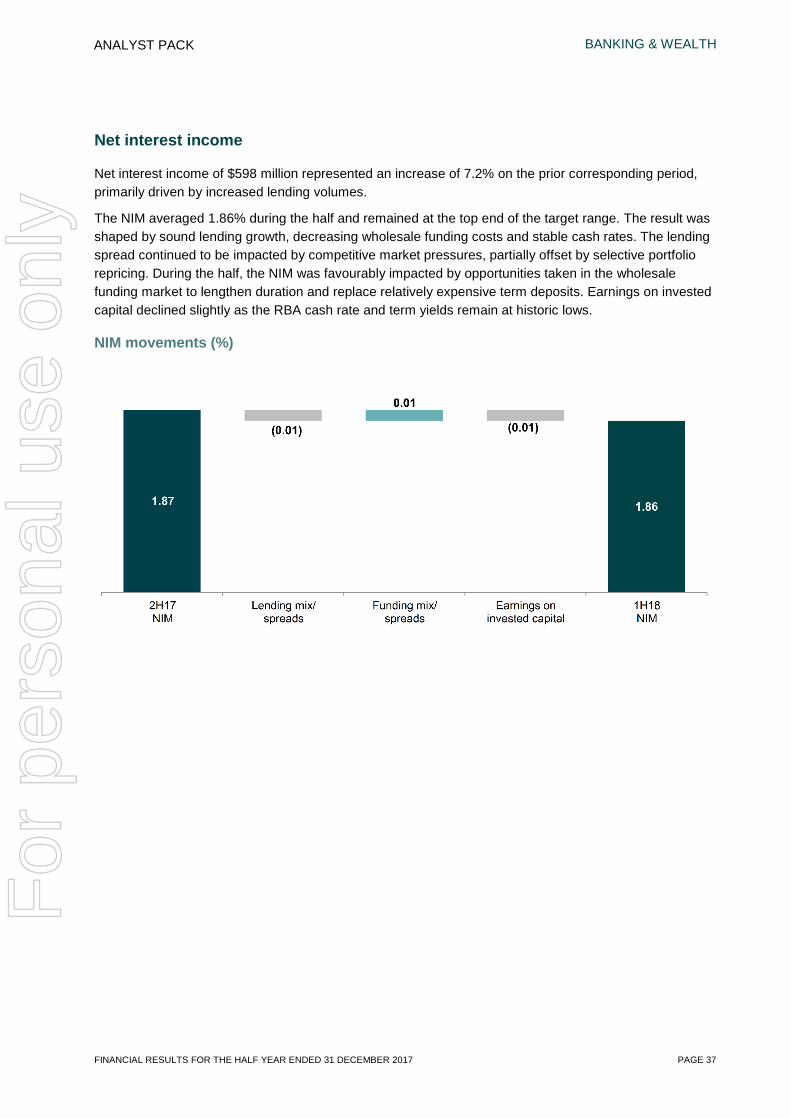
BANKING & WEALTH
FINANCIAL RESULTS FOR THE HALF YEAR ENDED 31 DECEMBER 2017 PAGE 37
ANALYST PACK
Net interest income
Net interest income of $598 million represented an increase of 7.2% on the prior corresponding period, primarily driven by increased lending volumes.
The NIM averaged 1.86% during the half and remained at the top end of the target range. The result was shaped by sound lending growth, decreasing wholesale funding costs and stable cash rates. The lending spread continued to be impacted by competitive market pressures, partially offset by selective portfolio repricing. During the half, the NIM was favourably impacted by opportunities taken in the wholesale funding market to lengthen duration and replace relatively expensive term deposits. Earnings on invested capital declined slightly as the RBA cash rate and term yields remain at historic lows.
NIM movements (%)
For
per
sona
l use
onl
y
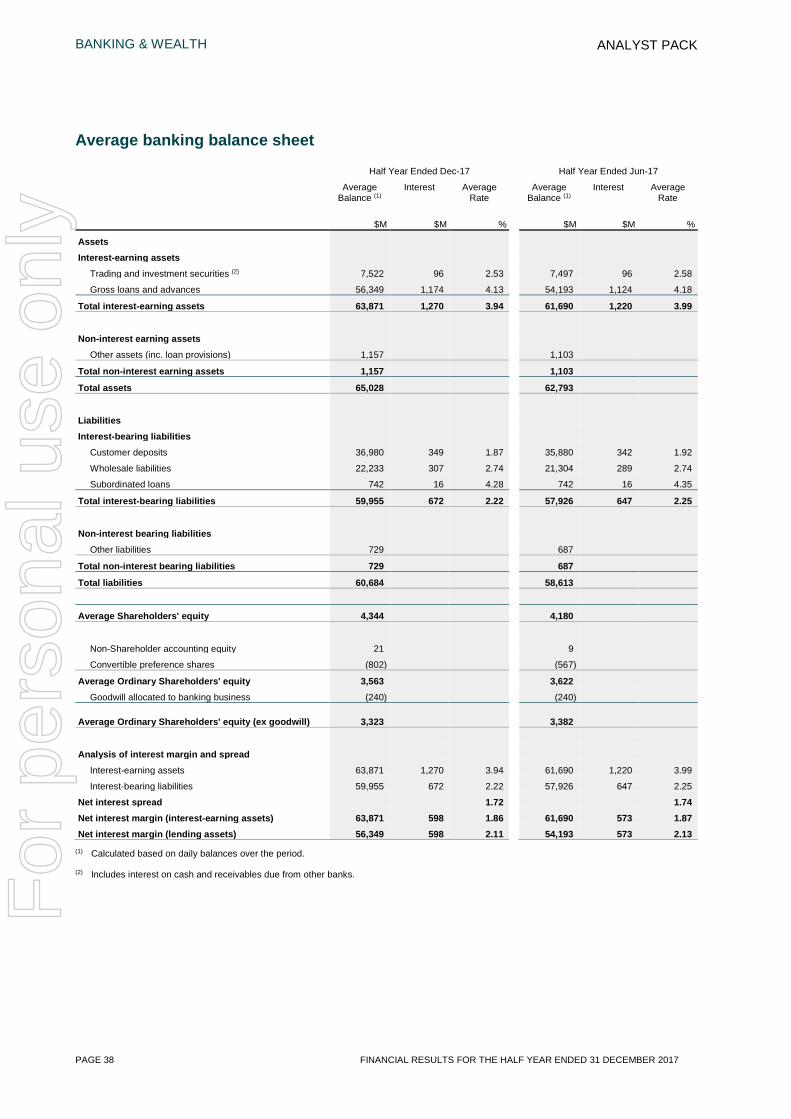
BANKING & WEALTH
PAGE 38 FINANCIAL RESULTS FOR THE HALF YEAR ENDED 31 DECEMBER 2017
ANALYST PACK
Average banking balance sheet
Half Year Ended Dec-17 Half Year Ended Jun-17
Average Balance (1)
Interest Average Rate
Average Balance (1)
Interest Average Rate
$M $M % $M $M %
Assets
Interest-earning assets
Trading and investment securities (2) 7,522 96 2.53 7,497 96 2.58
Gross loans and advances 56,349 1,174 4.13 54,193 1,124 4.18
Total interest-earning assets 63,871 1,270 3.94 61,690 1,220 3.99
Non-interest earning assets
Other assets (inc. loan provisions) 1,157 1,103
Total non-interest earning assets 1,157 1,103
Total assets 65,028 62,793
Liabilities
Interest-bearing liabilities
Customer deposits 36,980 349 1.87 35,880 342 1.92
Wholesale liabilities 22,233 307 2.74 21,304 289 2.74
Subordinated loans 742 16 4.28 742 16 4.35
Total interest-bearing liabilities 59,955 672 2.22 57,926 647 2.25
Non-interest bearing liabilities
Other liabilities 729 687
Total non-interest bearing liabilities 729 687
Total liabilities 60,684 58,613
Average Shareholders' equity 4,344 4,180
Non-Shareholder accounting equity 21 9
Convertible preference shares (802) (567)
Average Ordinary Shareholders' equity 3,563 3,622
Goodwill allocated to banking business (240) (240)
Average Ordinary Shareholders' equity (ex goodwill) 3,323 3,382
Analysis of interest margin and spread
Interest-earning assets 63,871 1,270 3.94 61,690 1,220 3.99
Interest-bearing liabilities 59,955 672 2.22 57,926 647 2.25
Net interest spread 1.72 1.74 Net interest margin (interest-earning assets) 63,871 598 1.86 61,690 573 1.87 Net interest margin (lending assets) 56,349 598 2.11 54,193 573 2.13
(1) Calculated based on daily balances over the period.
(2) Includes interest on cash and receivables due from other banks.
For
per
sona
l use
onl
y
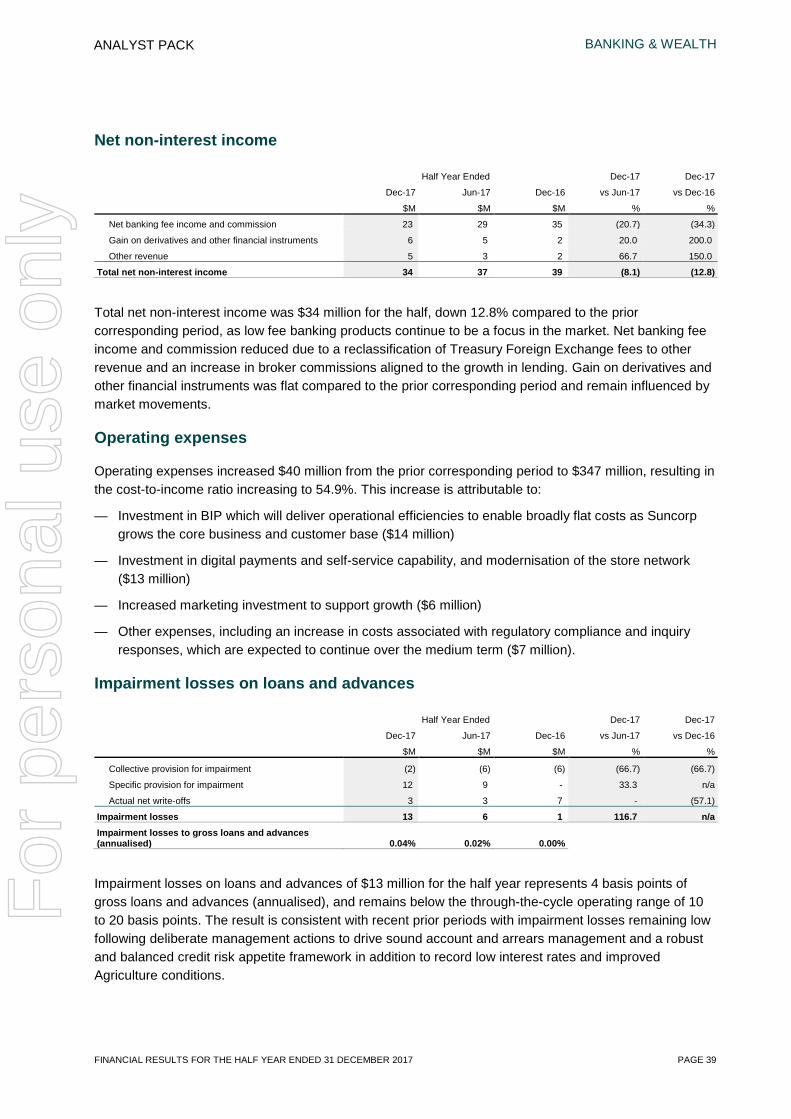
BANKING & WEALTH
FINANCIAL RESULTS FOR THE HALF YEAR ENDED 31 DECEMBER 2017 PAGE 39
ANALYST PACK
Net non-interest income
Half Year Ended Dec-17 Dec-17
Dec-17 Jun-17 Dec-16 vs Jun-17 vs Dec-16
$M $M $M % %
Net banking fee income and commission 23 29 35 (20.7) (34.3)
Gain on derivatives and other financial instruments 6 5 2 20.0 200.0
Other revenue 5 3 2 66.7 150.0
Total net non-interest income 34 37 39 (8.1) (12.8)
Total net non-interest income was $34 million for the half, down 12.8% compared to the prior corresponding period, as low fee banking products continue to be a focus in the market. Net banking fee income and commission reduced due to a reclassification of Treasury Foreign Exchange fees to other revenue and an increase in broker commissions aligned to the growth in lending. Gain on derivatives and other financial instruments was flat compared to the prior corresponding period and remain influenced by market movements.
Operating expenses
Operating expenses increased $40 million from the prior corresponding period to $347 million, resulting in the cost-to-income ratio increasing to 54.9%. This increase is attributable to:
— Investment in BIP which will deliver operational efficiencies to enable broadly flat costs as Suncorp grows the core business and customer base ($14 million)
— Investment in digital payments and self-service capability, and modernisation of the store network ($13 million)
— Increased marketing investment to support growth ($6 million)
— Other expenses, including an increase in costs associated with regulatory compliance and inquiry responses, which are expected to continue over the medium term ($7 million).
Impairment losses on loans and advances
Half Year Ended Dec-17 Dec-17
Dec-17 Jun-17 Dec-16 vs Jun-17 vs Dec-16
$M $M $M % %
Collective provision for impairment (2) (6) (6) (66.7) (66.7)
Specific provision for impairment 12 9 - 33.3 n/a
Actual net write-offs 3 3 7 - (57.1)
Impairment losses 13 6 1 116.7 n/a Impairment losses to gross loans and advances (annualised) 0.04% 0.02% 0.00%
Impairment losses on loans and advances of $13 million for the half year represents 4 basis points of gross loans and advances (annualised), and remains below the through-the-cycle operating range of 10 to 20 basis points. The result is consistent with recent prior periods with impairment losses remaining low following deliberate management actions to drive sound account and arrears management and a robust and balanced credit risk appetite framework in addition to record low interest rates and improved Agriculture conditions.
For
per
sona
l use
onl
y

BANKING & WEALTH
PAGE 40 FINANCIAL RESULTS FOR THE HALF YEAR ENDED 31 DECEMBER 2017
ANALYST PACK
Despite an increase in the overall lending portfolio, collective provision for impairment reduced over the half due to an improvement in quality of the Retail Banking portfolio.
Specific provisions for impairment expense totalled $12 million over the half, representing a net increase of $3 million, due to a sophisticated customer fraud in the equipment finance portfolio and one large agribusiness exposure.
Net write-offs for the half year remained low at $3 million and relate to a large number of smaller retail exposures.
Impaired assets
Half Year Ended Dec-17 Dec-17
Dec-17 Jun-17 Dec-16 vs Jun-17 vs Dec-16
$M $M $M % %
Retail lending 47 34 30 38.2 56.7
Agribusiness lending 50 79 96 (36.7) (47.9)
Commercial/SME lending 39 60 59 (35.0) (33.9)
Gross impaired assets 136 173 185 (21.4) (26.5) Specific provision for impairment (37) (44) (46) (15.9) (19.6)
Net impaired assets 99 129 139 (23.3) (28.8)
Gross impaired assets to gross loans and advances 0.24% 0.31% 0.34%
Gross impaired assets decreased by 21.4% over the half to $136 million, representing 24 basis points of gross loans and advances.
Impairment levels tracked favourably for Agribusiness and Commercial customers, decreasing by a combined $50 million during the half year. This is reflective of improving credit quality in the portfolios, an improvement in the Agriculture environment, the finalisation of longer running Banking recovery exposures and receipts from secured asset sales.
Retail impaired assets increased by $13 million over the half to $47 million, partially due to higher Mortgagee in Possession (MIP) property sales late in the period with more active management of long dated arrears. The increase is expected to be temporary as the majority of the loans are mortgage insured.
The average work-out period for impaired assets continues to reduce, driven by the reduction in Agribusiness impaired exposures. Impairments in the Agribusiness portfolio typically have longer work-out periods with customers to achieve the best outcome, and frequently involve Farm Debt Mediation.
For
per
sona
l use
onl
y

BANKING & WEALTH
FINANCIAL RESULTS FOR THE HALF YEAR ENDED 31 DECEMBER 2017 PAGE 41
ANALYST PACK
Non-performing loans
Dec-17 Dec-17
Dec-17 Jun-17 Dec-16 vs Jun-17 vs Dec-16
$M $M $M % %
Gross balances of individually impaired loans Gross impaired assets 136 173 185 (21.4) (26.5)
Specific provision for impairment (37) (44) (46) (15.9) (19.6)
Net impaired assets 99 129 139 (23.3) (28.8)
Size of gross individually impaired assets Less than one million 46 38 26 21.1 76.9
Greater than one million but less than ten million 74 73 102 1.4 (27.5)
Greater than ten million 16 62 57 (74.2) (71.9)
Gross impaired assets 136 173 185 (21.4) (26.5)
Past due loans not shown as impaired assets 411 426 338 (3.5) 21.6
Gross non-performing loans 547 599 523 (8.7) 4.6 Analysis of movements in gross individually impaired assets
Balance at the beginning of the half year 173 185 206 (6.5) (16.0)
Recognition of new impaired assets 53 40 55 32.5 (3.6)
Increases in previously recognised impaired assets 2 1 3 100.0 (33.3)
Impaired assets written off/sold during the half year (17) (9) (7) 88.9 142.9 Impaired assets which have been reclassed as performing assets or repaid (75) (44) (72) 70.5 4.2
Balance at the end of the half year 136 173 185 (21.4) (26.5)
Gross non-performing loans decreased 8.7% over the half to $547 million. This result was primarily driven by $75 million of impaired exposures reclassified as performing assets or repaid, including one large Agricultural exposure following successful support from the Bank. Lower volumes of new impaired loans, better arrears management and an increase in written off accounts due to the finalisation of three larger exposures also contributed to the result.
Net impaired assets have consistently decreased since the 2016 financial year in line with an overall improvement in portfolio credit quality.
The Development Finance Portfolio continues to exhibit nil arrears and no impaired assets.
For
per
sona
l use
onl
y
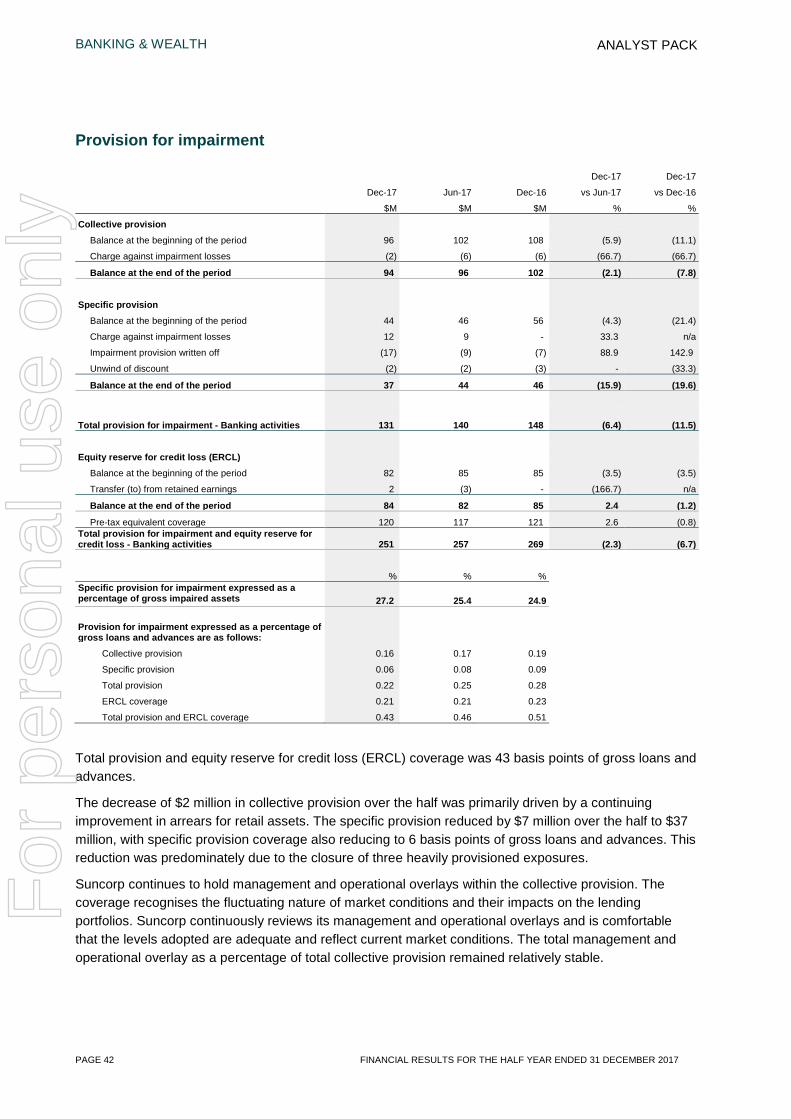
BANKING & WEALTH
PAGE 42 FINANCIAL RESULTS FOR THE HALF YEAR ENDED 31 DECEMBER 2017
ANALYST PACK
Provision for impairment
Dec-17 Dec-17
Dec-17 Jun-17 Dec-16 vs Jun-17 vs Dec-16
$M $M $M % %
Collective provision
Balance at the beginning of the period 96 102 108 (5.9) (11.1)
Charge against impairment losses (2) (6) (6) (66.7) (66.7)
Balance at the end of the period 94 96 102 (2.1) (7.8)
Specific provision
Balance at the beginning of the period 44 46 56 (4.3) (21.4)
Charge against impairment losses 12 9 - 33.3 n/a
Impairment provision written off (17) (9) (7) 88.9 142.9
Unwind of discount (2) (2) (3) - (33.3)
Balance at the end of the period 37 44 46 (15.9) (19.6)
Total provision for impairment - Banking activities 131 140 148 (6.4) (11.5)
Equity reserve for credit loss (ERCL)
Balance at the beginning of the period 82 85 85 (3.5) (3.5)
Transfer (to) from retained earnings 2 (3) - (166.7) n/a
Balance at the end of the period 84 82 85 2.4 (1.2)
Pre-tax equivalent coverage 120 117 121 2.6 (0.8) Total provision for impairment and equity reserve for credit loss - Banking activities 251 257 269 (2.3) (6.7)
% % % Specific provision for impairment expressed as a percentage of gross impaired assets 27.2 25.4 24.9
Provision for impairment expressed as a percentage of gross loans and advances are as follows:
Collective provision 0.16 0.17 0.19
Specific provision 0.06 0.08 0.09
Total provision 0.22 0.25 0.28
ERCL coverage 0.21 0.21 0.23
Total provision and ERCL coverage 0.43 0.46 0.51
Total provision and equity reserve for credit loss (ERCL) coverage was 43 basis points of gross loans and advances.
The decrease of $2 million in collective provision over the half was primarily driven by a continuing improvement in arrears for retail assets. The specific provision reduced by $7 million over the half to $37 million, with specific provision coverage also reducing to 6 basis points of gross loans and advances. This reduction was predominately due to the closure of three heavily provisioned exposures.
Suncorp continues to hold management and operational overlays within the collective provision. The coverage recognises the fluctuating nature of market conditions and their impacts on the lending portfolios. Suncorp continuously reviews its management and operational overlays and is comfortable that the levels adopted are adequate and reflect current market conditions. The total management and operational overlay as a percentage of total collective provision remained relatively stable.
For
per
sona
l use
onl
y
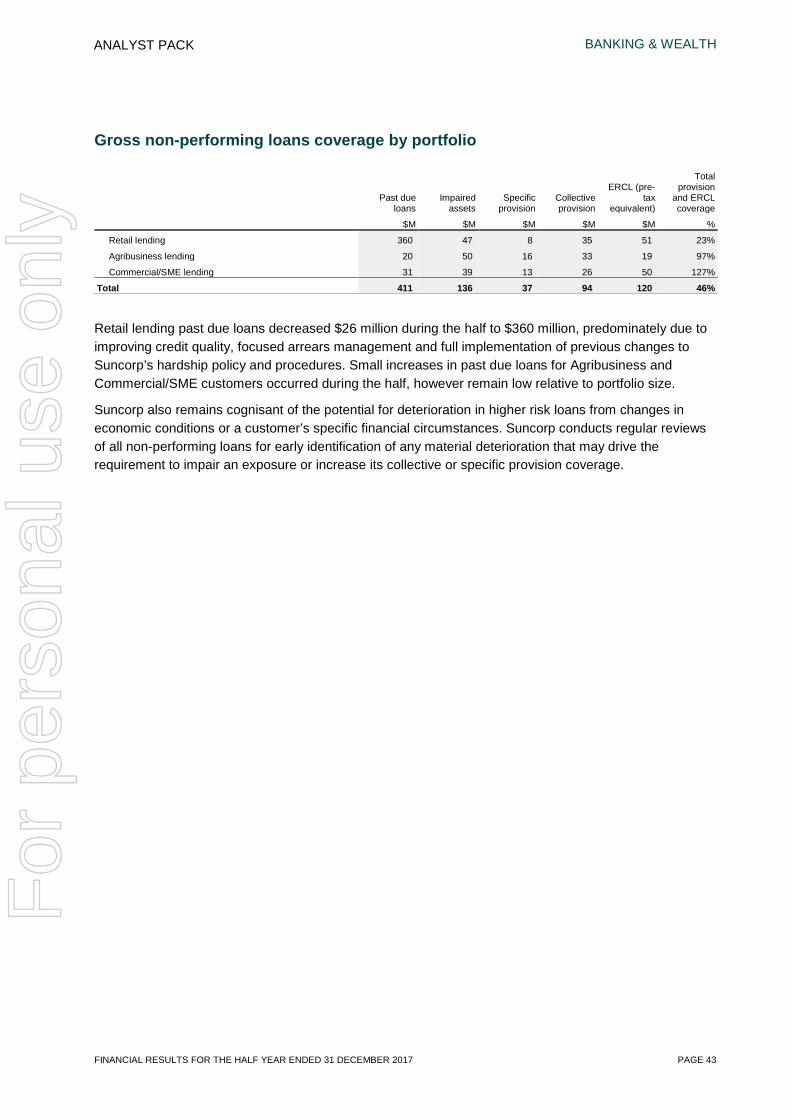
BANKING & WEALTH
FINANCIAL RESULTS FOR THE HALF YEAR ENDED 31 DECEMBER 2017 PAGE 43
ANALYST PACK
Gross non-performing loans coverage by portfolio
Past due
loans Impaired
assets Specific
provision Collective provision
ERCL (pre-tax
equivalent)
Total provision
and ERCL coverage
$M $M $M $M $M %
Retail lending 360 47 8 35 51 23%
Agribusiness lending 20 50 16 33 19 97%
Commercial/SME lending 31 39 13 26 50 127%
Total 411 136 37 94 120 46%
Retail lending past due loans decreased $26 million during the half to $360 million, predominately due to improving credit quality, focused arrears management and full implementation of previous changes to Suncorp’s hardship policy and procedures. Small increases in past due loans for Agribusiness and Commercial/SME customers occurred during the half, however remain low relative to portfolio size.
Suncorp also remains cognisant of the potential for deterioration in higher risk loans from changes in economic conditions or a customer’s specific financial circumstances. Suncorp conducts regular reviews of all non-performing loans for early identification of any material deterioration that may drive the requirement to impair an exposure or increase its collective or specific provision coverage.
For
per
sona
l use
onl
y
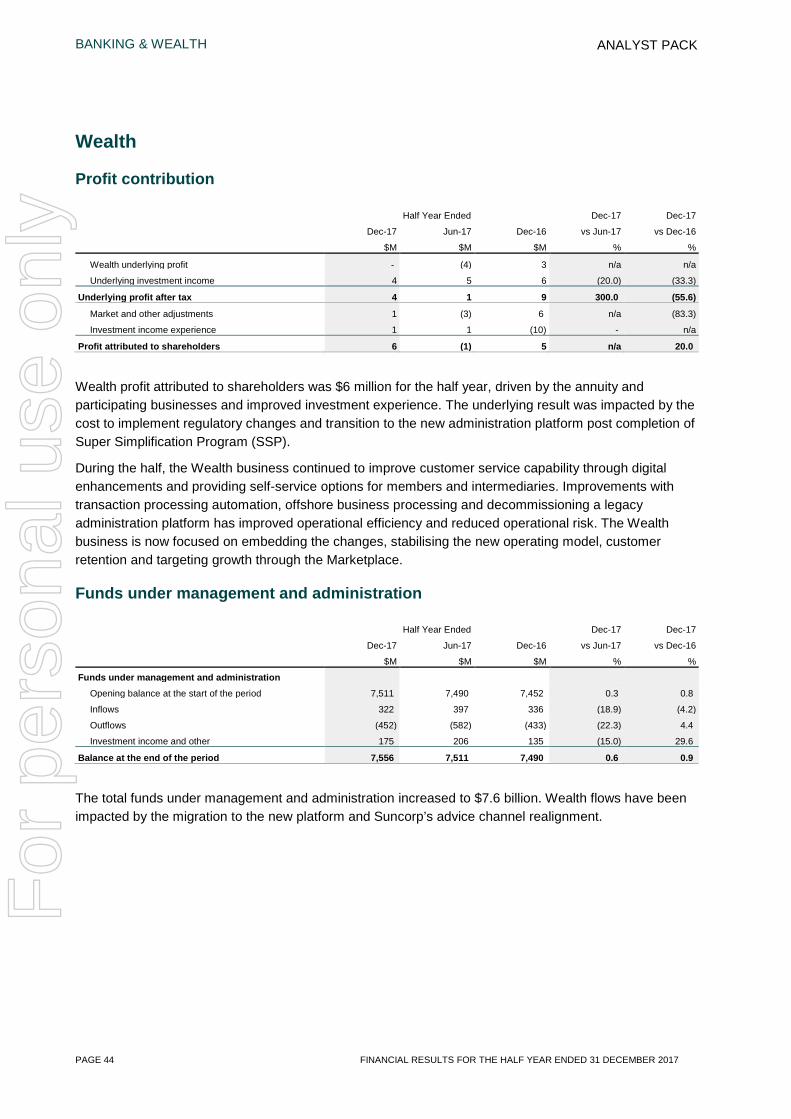
BANKING & WEALTH
PAGE 44 FINANCIAL RESULTS FOR THE HALF YEAR ENDED 31 DECEMBER 2017
ANALYST PACK
Wealth
Profit contribution
Half Year Ended Dec-17 Dec-17
Dec-17 Jun-17 Dec-16 vs Jun-17 vs Dec-16
$M $M $M % %
Wealth underlying profit - (4) 3 n/a n/a
Underlying investment income 4 5 6 (20.0) (33.3)
Underlying profit after tax 4 1 9 300.0 (55.6)
Market and other adjustments 1 (3) 6 n/a (83.3)
Investment income experience 1 1 (10) - n/a
Profit attributed to shareholders 6 (1) 5 n/a 20.0
Wealth profit attributed to shareholders was $6 million for the half year, driven by the annuity and participating businesses and improved investment experience. The underlying result was impacted by the cost to implement regulatory changes and transition to the new administration platform post completion of Super Simplification Program (SSP).
During the half, the Wealth business continued to improve customer service capability through digital enhancements and providing self-service options for members and intermediaries. Improvements with transaction processing automation, offshore business processing and decommissioning a legacy administration platform has improved operational efficiency and reduced operational risk. The Wealth business is now focused on embedding the changes, stabilising the new operating model, customer retention and targeting growth through the Marketplace.
Funds under management and administration
Half Year Ended Dec-17 Dec-17
Dec-17 Jun-17 Dec-16 vs Jun-17 vs Dec-16
$M $M $M % %
Funds under management and administration
Opening balance at the start of the period 7,511 7,490 7,452 0.3 0.8
Inflows 322 397 336 (18.9) (4.2)
Outflows (452) (582) (433) (22.3) 4.4
Investment income and other 175 206 135 (15.0) 29.6
Balance at the end of the period 7,556 7,511 7,490 0.6 0.9
The total funds under management and administration increased to $7.6 billion. Wealth flows have been impacted by the migration to the new platform and Suncorp’s advice channel realignment.
For
per
sona
l use
onl
y
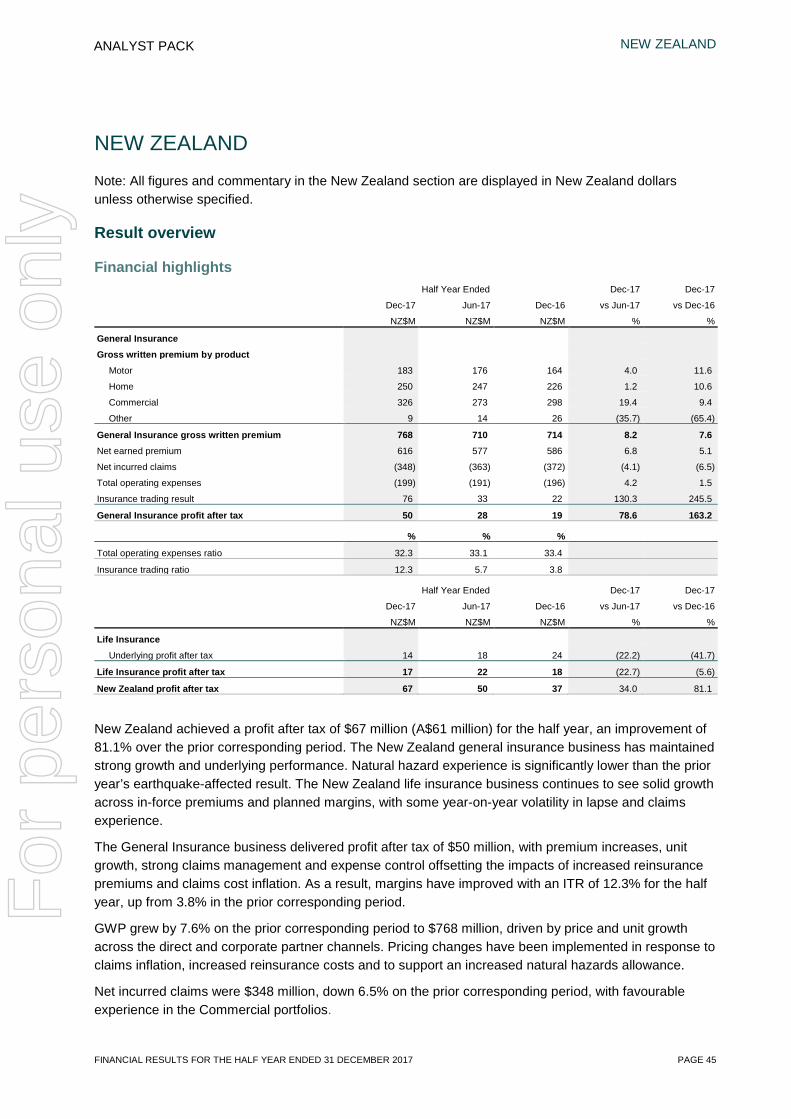
NEW ZEALAND
FINANCIAL RESULTS FOR THE HALF YEAR ENDED 31 DECEMBER 2017 PAGE 45
ANALYST PACK
NEW ZEALAND Note: All figures and commentary in the New Zealand section are displayed in New Zealand dollars unless otherwise specified.
Result overview
Financial highlights Half Year Ended Dec-17 Dec-17
Dec-17 Jun-17 Dec-16 vs Jun-17 vs Dec-16
NZ$M NZ$M NZ$M % %
General Insurance
Gross written premium by product Motor 183 176 164 4.0 11.6
Home 250 247 226 1.2 10.6
Commercial 326 273 298 19.4 9.4
Other 9 14 26 (35.7) (65.4)
General Insurance gross written premium 768 710 714 8.2 7.6 Net earned premium 616 577 586 6.8 5.1
Net incurred claims (348) (363) (372) (4.1) (6.5)
Total operating expenses (199) (191) (196) 4.2 1.5
Insurance trading result 76 33 22 130.3 245.5
General Insurance profit after tax 50 28 19 78.6 163.2
% % %
Total operating expenses ratio 32.3 33.1 33.4
Insurance trading ratio 12.3 5.7 3.8
Half Year Ended Dec-17 Dec-17
Dec-17 Jun-17 Dec-16 vs Jun-17 vs Dec-16
NZ$M NZ$M NZ$M % %
Life Insurance
Underlying profit after tax 14 18 24 (22.2) (41.7)
Life Insurance profit after tax 17 22 18 (22.7) (5.6)
New Zealand profit after tax 67 50 37 34.0 81.1
New Zealand achieved a profit after tax of $67 million (A$61 million) for the half year, an improvement of 81.1% over the prior corresponding period. The New Zealand general insurance business has maintained strong growth and underlying performance. Natural hazard experience is significantly lower than the prior year’s earthquake-affected result. The New Zealand life insurance business continues to see solid growth across in-force premiums and planned margins, with some year-on-year volatility in lapse and claims experience.
The General Insurance business delivered profit after tax of $50 million, with premium increases, unit growth, strong claims management and expense control offsetting the impacts of increased reinsurance premiums and claims cost inflation. As a result, margins have improved with an ITR of 12.3% for the half year, up from 3.8% in the prior corresponding period.
GWP grew by 7.6% on the prior corresponding period to $768 million, driven by price and unit growth across the direct and corporate partner channels. Pricing changes have been implemented in response to claims inflation, increased reinsurance costs and to support an increased natural hazards allowance.
Net incurred claims were $348 million, down 6.5% on the prior corresponding period, with favourable experience in the Commercial portfolios.
For
per
sona
l use
onl
y
NEW ZEALAND
PAGE 46 FINANCIAL RESULTS FOR THE HALF YEAR ENDED 31 DECEMBER 2017
ANALYST PACK
Operating expenses increased 1.5% over the prior corresponding period, with cost control initiatives largely offsetting the impacts of inflation and new software amortisation ($1 million).
Overall investment income decreased $5 million to $4 million, driven by mark-to-market losses of $12 million over the period on the Tower shareholding, which was partly offset by gains on the fixed-income portfolio due to a decrease in bond yields.
The New Zealand Life Insurance business delivered profit after tax of $17 million, down $1 million on the prior corresponding period. This was driven by short-term volatility in experience with prior year favourable experience reversing over the half. In-force premium grew 5.0% to $252 million, driven by new business and policy retention.
Outlook
Suncorp continues to focus on building a more resilient business to meet a greater number of customer and business partner needs. The key initiatives in progress support New Zealand’s earning performance, which is expected to be maintained at the current strong levels through FY18.
GWP growth across the portfolio will continue to be supported by strong new business performance and the pricing response to both claims cost trends and the reinsurance impacts of recent natural hazard events. Price increases implemented during the half year will continue to flow into the renewal book.
Motor claims cost inflation remains an area of focus. This continues to be managed by both pricing for risk and improving claims management processes, including the development of improved tools such as ClaimCentre. SMART repair centres are a key response to motor repair cost inflation. Increasing repair volumes are being processed through the existing three SMART centres in North Auckland, South Auckland and Christchurch and the newly established SMART Plus Centre in South East Auckland which opened during the period.
New Zealand’s balance sheet remains well protected by the Group reinsurance program. New Zealand continues to manage earthquake risk exposure to certain geographical areas and asset classes and the business is confident that adequate coverage is in place for key risks.
Life in-force premium continues to grow strongly, driven by a continued focus on sustainable commissions, strong intermediary relationships and market leading retention. The newly launched AsteronConnect online service for advisers is expected to drive new business growth in the second half year.
For
per
sona
l use
onl
y

NEW ZEALAND
FINANCIAL RESULTS FOR THE HALF YEAR ENDED 31 DECEMBER 2017 PAGE 47
ANALYST PACK
Profit contribution (NZ$)
Half Year Ended Dec-17 Dec-17
Dec-17 Jun-17 Dec-16 vs Jun-17 vs Dec-16
NZ$M NZ$M NZ$M % %
General Insurance Gross written premium 768 710 714 8.2 7.6
Gross unearned premium movement (50) (19) (36) 163.2 38.9
Gross earned premium 718 691 678 3.9 5.9
Outwards reinsurance expense (102) (114) (92) (10.5) 10.9
Net earned premium 616 577 586 6.8 5.1
Net incurred claims
Claims expense (396) (570) (1,327) (30.5) (70.2)
Reinsurance and other recoveries revenue 48 207 955 (76.8) (95.0)
Net incurred claims (348) (363) (372) (4.1) (6.5)
Total operating expenses
Acquisition expenses (141) (132) (139) 6.8 1.4
Other underwriting expenses (58) (59) (57) (1.7) 1.8
Total operating expenses (199) (191) (196) 4.2 1.5
Underwriting result 69 23 18 200.0 283.3 Investment income - insurance funds 7 10 4 (30.0) 75.0
Insurance trading result 76 33 22 130.3 245.5
General Insurance operational earnings 76 33 22 130.3 245.5 Investment income - shareholder funds (3) 5 5 n/a n/a
General Insurance profit before tax 73 38 27 92.1 170.4
Income tax (23) (10) (8) 130.0 187.5
General Insurance profit after tax 50 28 19 78.6 163.2
Life Insurance
Underlying profit after tax 14 18 24 (22.2) (41.7)
Market adjustments 3 4 (6) (25.0) n/a
Life Insurance profit after tax 17 22 18 (22.7) (5.6)
New Zealand profit after tax 67 50 37 34.0 81.1
General Insurance ratios
Half Year Ended
Dec-17 Jun-17 Dec-16
% % % Acquisition expenses ratio 22.9 22.9 23.7 Other underwriting expenses ratio 9.4 10.2 9.7 Total operating expenses ratio 32.3 33.1 33.4 Loss ratio 56.5 62.9 63.5 Combined operating ratio 88.8 96.0 96.9
Insurance trading ratio 12.3 5.7 3.8
For
per
sona
l use
onl
y

NEW ZEALAND
PAGE 48 FINANCIAL RESULTS FOR THE HALF YEAR ENDED 31 DECEMBER 2017
ANALYST PACK
Profit contribution (AU$)
Half Year Ended Dec-17 Dec-17
Dec-17 Jun-17 Dec-16 vs Jun-17 vs Dec-16
AU$M AU$M AU$M % %
General Insurance Gross written premium 703 666 679 5.6 3.5
Gross unearned premium movement (46) (18) (34) 155.6 35.3
Gross earned premium 657 648 645 1.4 1.9
Outwards reinsurance expense (93) (106) (88) (12.3) 5.7
Net earned premium 564 542 557 4.1 1.3
Net incurred claims
Claims expense (364) (535) (1,262) (32.0) (71.2)
Reinsurance and other recoveries revenue 45 196 908 (77.0) (95.0)
Net incurred claims (319) (339) (354) (5.9) (9.9)
Total operating expenses
Acquisition expenses (129) (124) (132) 4.0 (2.3)
Other underwriting expenses (53) (56) (54) (5.4) (1.9)
Total operating expenses (182) (180) (186) 1.1 (2.2)
Underwriting result 63 23 17 173.9 270.6 Investment income - insurance funds 7 9 4 (22.2) 75.0
Insurance trading result 70 32 21 118.8 233.3
General Insurance operational earnings 70 32 21 118.8 233.3 Investment income - shareholder funds (3) 5 5 n/a n/a
General Insurance profit before tax 67 37 26 81.1 157.7
Income tax (21) (11) (7) 90.9 200.0
General Insurance profit after tax 46 26 19 76.9 142.1
Life Insurance
Underlying profit after tax 13 16 23 (18.8) (43.5)
Market adjustments 2 4 (6) (50.0) n/a
Life Insurance profit after tax 15 20 17 (25.0) (11.8)
New Zealand profit after tax 61 46 36 32.6 69.4
Note: Transactions denominated in foreign currencies, including New Zealand dollars, are translated into Australian dollars using the spot exchange rates at the date of the transaction. Foreign currency monetary assets and liabilities at reporting date are translated into Australian dollars using the spot exchange rates current on that date.
General Insurance ratios
Half Year Ended
Dec-17 Jun-17 Dec-16
% % % Acquisition expenses ratio 22.9 22.9 23.7 Other underwriting expenses ratio 9.4 10.3 9.7 Total operating expenses ratio 32.3 33.2 33.4 Loss ratio 56.6 62.5 63.6 Combined operating ratio 88.9 95.7 97.0
Insurance trading ratio 12.4 5.9 3.8
For
per
sona
l use
onl
y
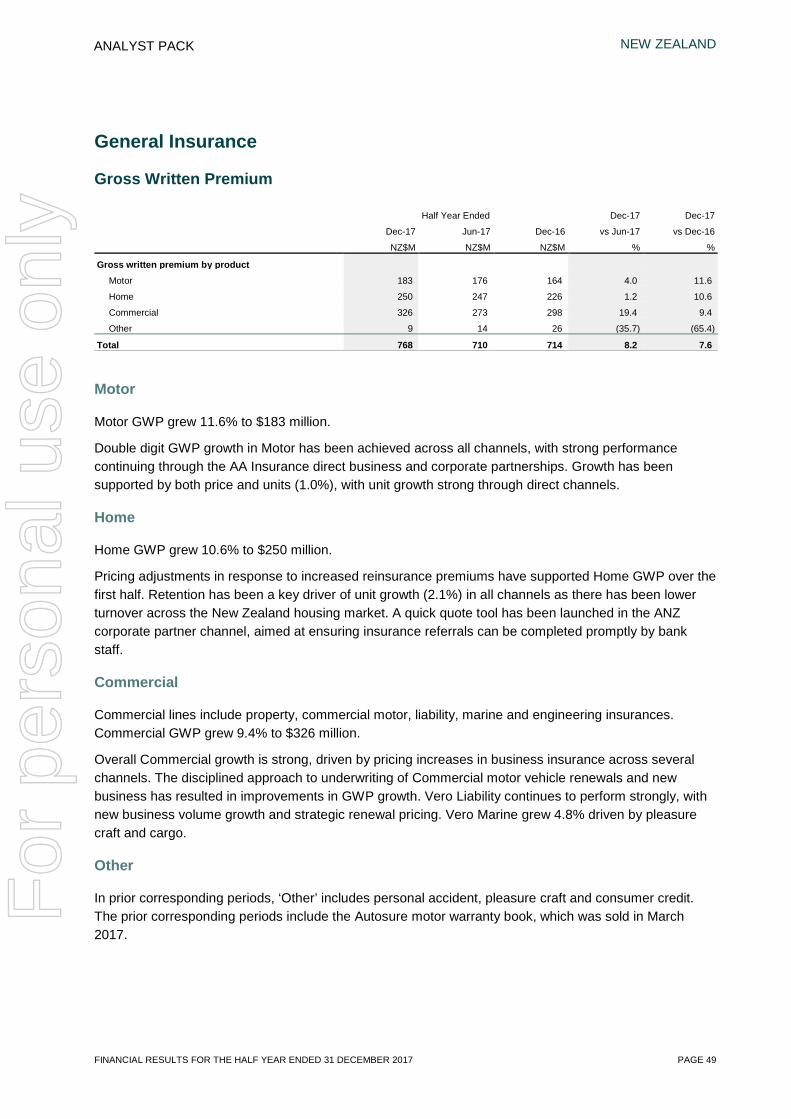
NEW ZEALAND
FINANCIAL RESULTS FOR THE HALF YEAR ENDED 31 DECEMBER 2017 PAGE 49
ANALYST PACK
General Insurance
Gross Written Premium
Half Year Ended Dec-17 Dec-17
Dec-17 Jun-17 Dec-16 vs Jun-17 vs Dec-16
NZ$M NZ$M NZ$M % %
Gross written premium by product
Motor 183 176 164 4.0 11.6
Home 250 247 226 1.2 10.6
Commercial 326 273 298 19.4 9.4
Other 9 14 26 (35.7) (65.4)
Total 768 710 714 8.2 7.6
Motor
Motor GWP grew 11.6% to $183 million.
Double digit GWP growth in Motor has been achieved across all channels, with strong performance continuing through the AA Insurance direct business and corporate partnerships. Growth has been supported by both price and units (1.0%), with unit growth strong through direct channels.
Home
Home GWP grew 10.6% to $250 million.
Pricing adjustments in response to increased reinsurance premiums have supported Home GWP over the first half. Retention has been a key driver of unit growth (2.1%) in all channels as there has been lower turnover across the New Zealand housing market. A quick quote tool has been launched in the ANZ corporate partner channel, aimed at ensuring insurance referrals can be completed promptly by bank staff.
Commercial
Commercial lines include property, commercial motor, liability, marine and engineering insurances. Commercial GWP grew 9.4% to $326 million.
Overall Commercial growth is strong, driven by pricing increases in business insurance across several channels. The disciplined approach to underwriting of Commercial motor vehicle renewals and new business has resulted in improvements in GWP growth. Vero Liability continues to perform strongly, with new business volume growth and strategic renewal pricing. Vero Marine grew 4.8% driven by pleasure craft and cargo.
Other
In prior corresponding periods, ‘Other’ includes personal accident, pleasure craft and consumer credit. The prior corresponding periods include the Autosure motor warranty book, which was sold in March 2017.
For
per
sona
l use
onl
y

NEW ZEALAND
PAGE 50 FINANCIAL RESULTS FOR THE HALF YEAR ENDED 31 DECEMBER 2017
ANALYST PACK
Net incurred claims
Net incurred claims costs decreased 6.5% to $348 million, with the prior corresponding period impacted by Kaikoura.
Natural hazard event costs were $19 million, $2 million above allowance. There were two natural hazard weather events in the half year with the balance in attritional claims.
While there was some development of prior year events, this was mitigated by the Group’s aggregate cover and the main catastrophe program.
Major natural hazard events are shown in the table below.
Net costs Date Event NZ$M
Jul 17 Winter Storm 3 Jul 17 Major Storm 7
Total events over $2 million (1) 10 Other natural hazards attritional claims 9
Total natural hazards 19
Less: allowance for natural hazards (17)
Natural hazards costs above allowance 2
(1) Events with a gross cost over $2 million, shown net of recoveries from reinsurance.
The backlog of prior period event claims reduced over the half, with the current year claims experience favourable to expectations.
Motor claims continue to be impacted by strong unit growth and industry-wide trends in cost inflation. Claims frequency is slightly higher than prior corresponding period due to windscreen claims. Excluding these, motor claims frequency is down. Average repair costs were impacted by a greater mix of newer vehicles on the road, more complex parts and increasing labour costs. New Zealand has launched a fourth SMART centre over the half in South East Auckland, with plans for further centres.
Home claims were up marginally on the prior corresponding period with working claims growth in line with premium growth.
There have been fewer large Commercial claims this half year, reflecting general volatility.
For
per
sona
l use
onl
y
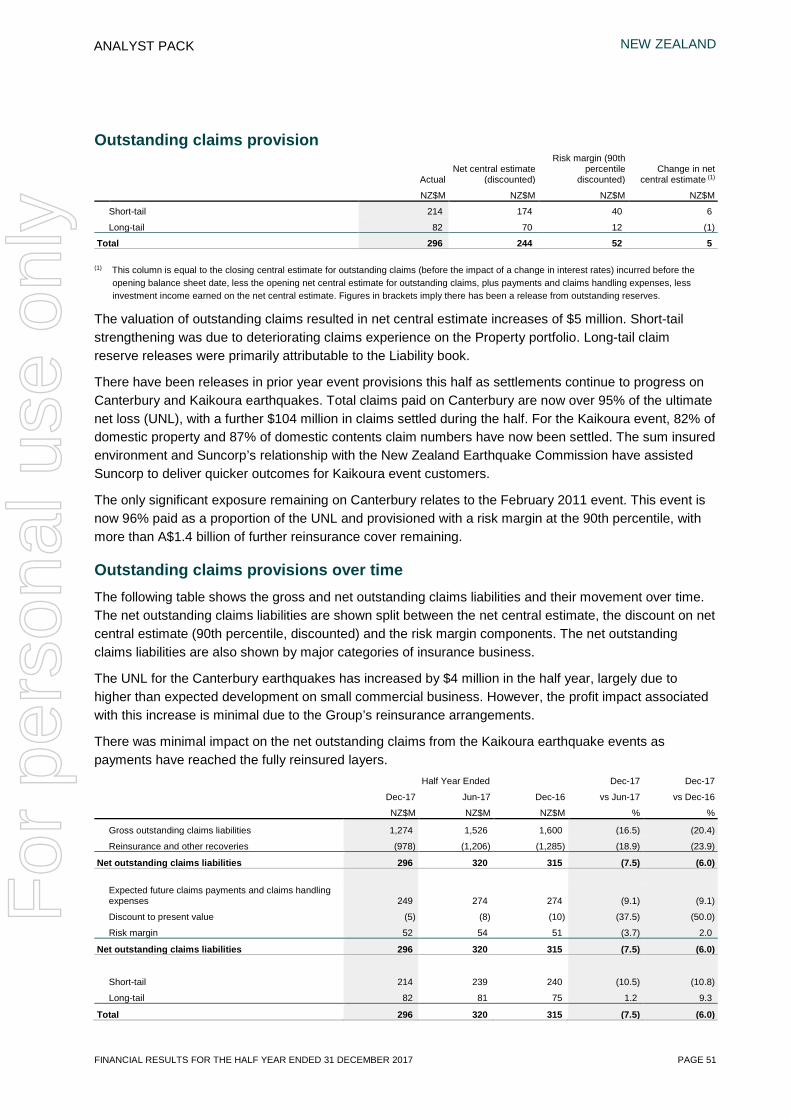
NEW ZEALAND
FINANCIAL RESULTS FOR THE HALF YEAR ENDED 31 DECEMBER 2017 PAGE 51
ANALYST PACK
Outstanding claims provision
Actual Net central estimate
(discounted)
Risk margin (90th percentile
discounted) Change in net
central estimate (1)
NZ$M NZ$M NZ$M NZ$M
Short-tail 214 174 40 6
Long-tail 82 70 12 (1)
Total 296 244 52 5
(1) This column is equal to the closing central estimate for outstanding claims (before the impact of a change in interest rates) incurred before the opening balance sheet date, less the opening net central estimate for outstanding claims, plus payments and claims handling expenses, less investment income earned on the net central estimate. Figures in brackets imply there has been a release from outstanding reserves.
The valuation of outstanding claims resulted in net central estimate increases of $5 million. Short-tail strengthening was due to deteriorating claims experience on the Property portfolio. Long-tail claim reserve releases were primarily attributable to the Liability book.
There have been releases in prior year event provisions this half as settlements continue to progress on Canterbury and Kaikoura earthquakes. Total claims paid on Canterbury are now over 95% of the ultimate net loss (UNL), with a further $104 million in claims settled during the half. For the Kaikoura event, 82% of domestic property and 87% of domestic contents claim numbers have now been settled. The sum insured environment and Suncorp’s relationship with the New Zealand Earthquake Commission have assisted Suncorp to deliver quicker outcomes for Kaikoura event customers.
The only significant exposure remaining on Canterbury relates to the February 2011 event. This event is now 96% paid as a proportion of the UNL and provisioned with a risk margin at the 90th percentile, with more than A$1.4 billion of further reinsurance cover remaining.
Outstanding claims provisions over time The following table shows the gross and net outstanding claims liabilities and their movement over time. The net outstanding claims liabilities are shown split between the net central estimate, the discount on net central estimate (90th percentile, discounted) and the risk margin components. The net outstanding claims liabilities are also shown by major categories of insurance business.
The UNL for the Canterbury earthquakes has increased by $4 million in the half year, largely due to higher than expected development on small commercial business. However, the profit impact associated with this increase is minimal due to the Group’s reinsurance arrangements.
There was minimal impact on the net outstanding claims from the Kaikoura earthquake events as payments have reached the fully reinsured layers.
Half Year Ended Dec-17 Dec-17
Dec-17 Jun-17 Dec-16 vs Jun-17 vs Dec-16
NZ$M NZ$M NZ$M % %
Gross outstanding claims liabilities 1,274 1,526 1,600 (16.5) (20.4)
Reinsurance and other recoveries (978) (1,206) (1,285) (18.9) (23.9)
Net outstanding claims liabilities 296 320 315 (7.5) (6.0)
Expected future claims payments and claims handling expenses 249 274 274 (9.1) (9.1)
Discount to present value (5) (8) (10) (37.5) (50.0)
Risk margin 52 54 51 (3.7) 2.0
Net outstanding claims liabilities 296 320 315 (7.5) (6.0)
Short-tail 214 239 240 (10.5) (10.8)
Long-tail 82 81 75 1.2 9.3
Total 296 320 315 (7.5) (6.0)
For
per
sona
l use
onl
y
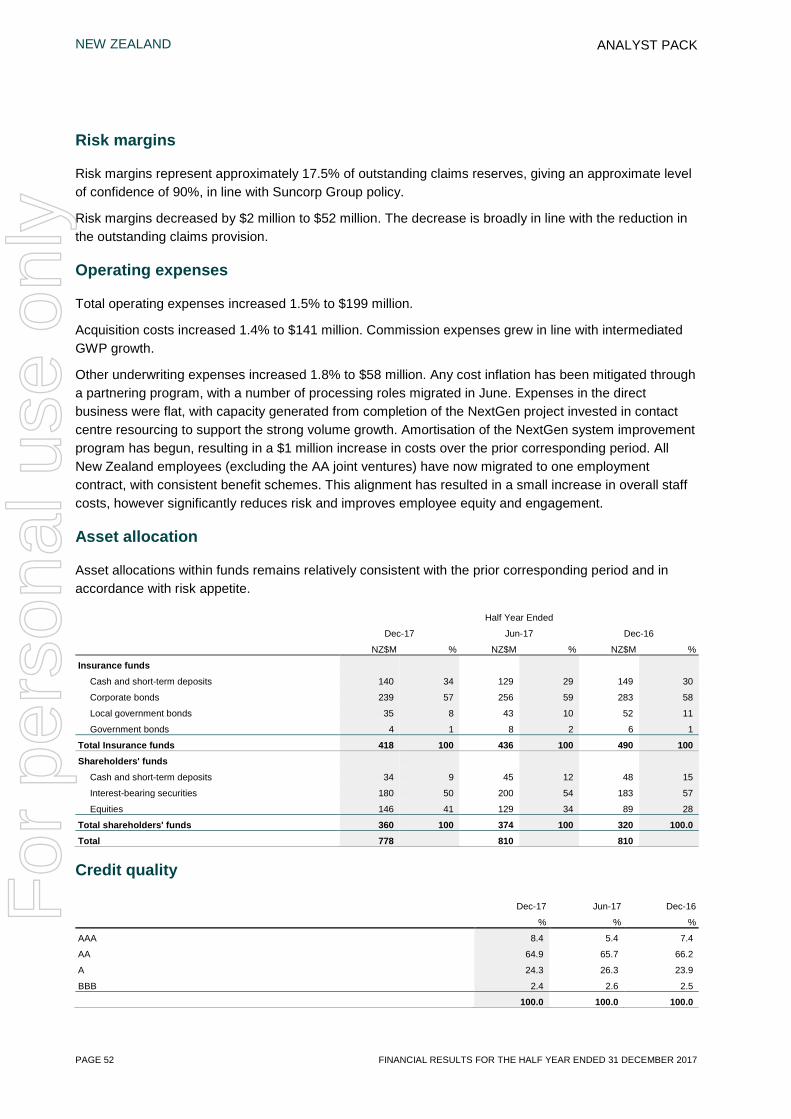
NEW ZEALAND
PAGE 52 FINANCIAL RESULTS FOR THE HALF YEAR ENDED 31 DECEMBER 2017
ANALYST PACK
Risk margins
Risk margins represent approximately 17.5% of outstanding claims reserves, giving an approximate level of confidence of 90%, in line with Suncorp Group policy.
Risk margins decreased by $2 million to $52 million. The decrease is broadly in line with the reduction in the outstanding claims provision.
Operating expenses
Total operating expenses increased 1.5% to $199 million.
Acquisition costs increased 1.4% to $141 million. Commission expenses grew in line with intermediated GWP growth.
Other underwriting expenses increased 1.8% to $58 million. Any cost inflation has been mitigated through a partnering program, with a number of processing roles migrated in June. Expenses in the direct business were flat, with capacity generated from completion of the NextGen project invested in contact centre resourcing to support the strong volume growth. Amortisation of the NextGen system improvement program has begun, resulting in a $1 million increase in costs over the prior corresponding period. All New Zealand employees (excluding the AA joint ventures) have now migrated to one employment contract, with consistent benefit schemes. This alignment has resulted in a small increase in overall staff costs, however significantly reduces risk and improves employee equity and engagement.
Asset allocation
Asset allocations within funds remains relatively consistent with the prior corresponding period and in accordance with risk appetite.
Half Year Ended
Dec-17 Jun-17 Dec-16
NZ$M % NZ$M % NZ$M %
Insurance funds
Cash and short-term deposits 140 34 129 29 149 30
Corporate bonds 239 57 256 59 283 58
Local government bonds 35 8 43 10 52 11
Government bonds 4 1 8 2 6 1
Total Insurance funds 418 100 436 100 490 100 Shareholders' funds
Cash and short-term deposits 34 9 45 12 48 15
Interest-bearing securities 180 50 200 54 183 57
Equities 146 41 129 34 89 28
Total shareholders' funds 360 100 374 100 320 100.0 Total 778 810 810
Credit quality
Dec-17 Jun-17 Dec-16 % % %
AAA 8.4 5.4 7.4
AA 64.9 65.7 66.2
A 24.3 26.3 23.9
BBB 2.4 2.6 2.5
100.0 100.0 100.0
For
per
sona
l use
onl
y

NEW ZEALAND
FINANCIAL RESULTS FOR THE HALF YEAR ENDED 31 DECEMBER 2017 PAGE 53
ANALYST PACK
Duration
Dec-17 Jun-17 Dec-16
Years Years Years
Insurance funds Interest rate duration 1.3 1.2 1.2
Shareholders' funds
Interest rate duration 2.6 2.4 2.5
Investment performance
Total investment income for the half of $4 million, representing an annualised return of 0.5%, was lower than the prior corresponding period ($9 million), primarily due to the mark-to-market losses on the shareholding in Tower. Normalising for this impact, the annualised investment return is 2.0%. Underlying investment income was steady throughout the period, with movements in global bonds yields generating mark-to-market gains. Investment income generating assets were lower over the half year compared to the prior corresponding period primarily due to cash outflows related to natural hazard claim events.
Investment income on insurance funds was $7 million, representing an annualised return of 1.5%, which included mark-to-market gains of $0.4 million.
Investment income on shareholders’ funds was a net loss of $3 million. Mark-to-market losses were $10 million, which includes $12 million relating to the shareholding in Tower. Excluding these losses, underlying investment income on shareholders’ funds was $9 million, representing an annualised return of 2.6%. To preserve its investment, New Zealand participated fully in Tower’s capital raising rights issue which occurred in the period.
Half Year Ended Dec-17 Dec-17
Dec-17 Jun-17 Dec-16 vs Jun-17 vs Dec-16
NZ$M NZ$M NZ$M % %
Investment income on insurance funds
Cash and short-term deposits 1 1 1 - -
Interest-bearing securities and other 6 9 3 (33.3) 100.0
Total 7 10 4 (30.0) 75.0
Investment income on shareholders' funds
Cash and short-term deposits - 1 1 (100.0) (100.0)
Interest-bearing securities 4 3 1 33.3 300.0
Equities (excluding Tower shareholding) 5 4 3 n/a n/a
Tower shareholding (12) (3) - n/a n/a
Total (3) 5 5 n/a n/a
Total investment income 4 15 9 (73.3) (55.6)
For
per
sona
l use
onl
y

NEW ZEALAND
PAGE 54 FINANCIAL RESULTS FOR THE HALF YEAR ENDED 31 DECEMBER 2017
ANALYST PACK
Life Insurance
Profit after tax was $17 million, with an underlying profit after tax of $14 million. The lower result over the prior corresponding period is due to short-term volatility in experience, with prior year favourable experience reversing this half. The nature and size of the life book generates short-term volatility in results, however planned profit margins reflect the long-run expectations for this business.
Planned margins reflected favourable growth in in-force premiums.
Claims experience reflected general volatility of mortality claims, with experience investigations showing no adverse underlying trends in claims volumes or costs. Closure and settlement of disability income claims remains strong.
Lapse assumptions were strengthened following retention improvements over the past few years, however experience over the half has shown a slight reversal of this trend.
Growth remained strong with in-force premium increasing 5.0% to $252 million. The revised hybrid incentive structure rolled out in October 2017 and the implementation of AsteronConnect quote and online application capability are expected to lead to improvements in the new business outlook.
Profit contribution
Half Year Ended Dec-17 Dec-17
Dec-17 Jun-17 Dec-16 vs Jun-17 vs Dec-16
NZ$M NZ$M NZ$M % %
Planned profit margin 16 16 15 - 6.7
Experience (5) 1 5 n/a n/a
Other 3 1 4 200.0 (25.0)
Underlying profit after tax 14 18 24 (22.2) (41.7) Market adjustments 3 4 (6) (25.0) n/a
Net profit after tax 17 22 18 (22.7) (5.6)
Life risk in-force annual premium by channel
In-force premium increased 5.0% to $252 million, driven by new business and policy retention. Suncorp continues to lead the New Zealand market with low cancellation rates and a strong customer and retention focus fully embedded in the business.
Half Year Ended Dec-17 Dec-17
Dec-17 Jun-17 Dec-16 vs Jun-17 vs Dec-16
NZ$M NZ$M NZ$M % %
Advised 203 198 194 2.5 4.6
Direct 40 39 39 2.6 2.6
Group and other 9 8 7 12.5 28.6
Total 252 245 240 2.9 5.0
For
per
sona
l use
onl
y
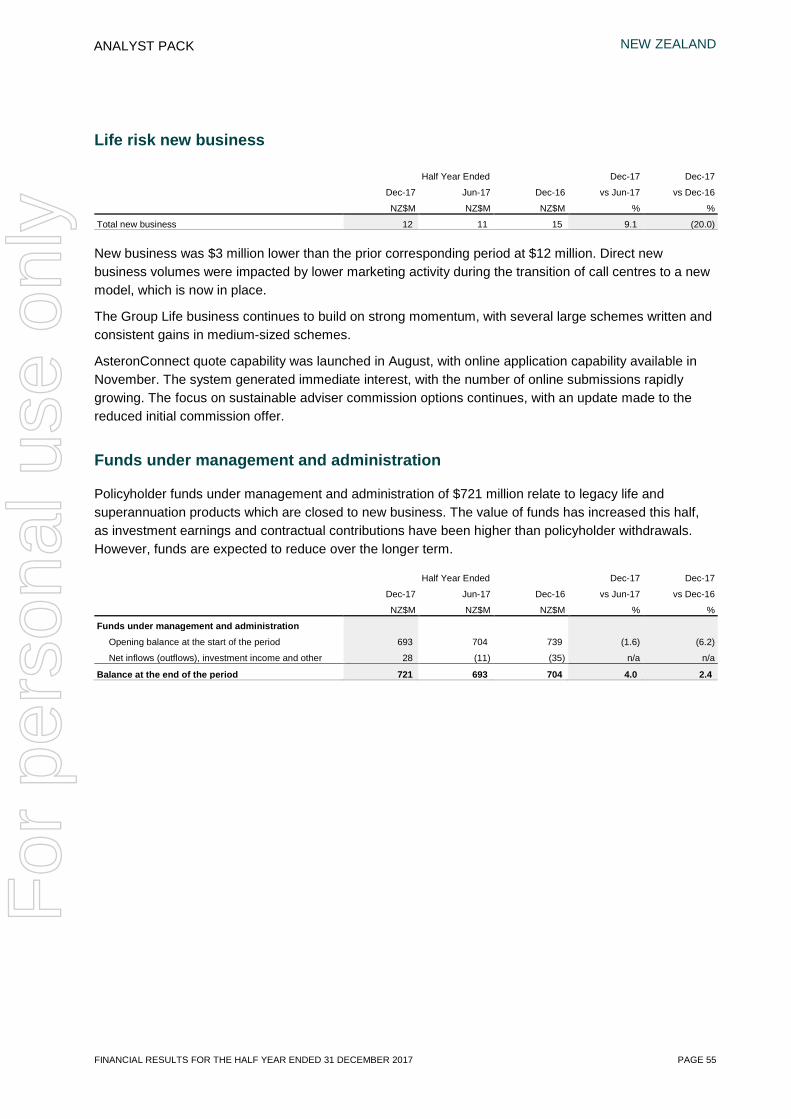
NEW ZEALAND
FINANCIAL RESULTS FOR THE HALF YEAR ENDED 31 DECEMBER 2017 PAGE 55
ANALYST PACK
Life risk new business
Half Year Ended Dec-17 Dec-17
Dec-17 Jun-17 Dec-16 vs Jun-17 vs Dec-16
NZ$M NZ$M NZ$M % %
Total new business 12 11 15 9.1 (20.0)
New business was $3 million lower than the prior corresponding period at $12 million. Direct new business volumes were impacted by lower marketing activity during the transition of call centres to a new model, which is now in place.
The Group Life business continues to build on strong momentum, with several large schemes written and consistent gains in medium-sized schemes.
AsteronConnect quote capability was launched in August, with online application capability available in November. The system generated immediate interest, with the number of online submissions rapidly growing. The focus on sustainable adviser commission options continues, with an update made to the reduced initial commission offer.
Funds under management and administration
Policyholder funds under management and administration of $721 million relate to legacy life and superannuation products which are closed to new business. The value of funds has increased this half, as investment earnings and contractual contributions have been higher than policyholder withdrawals. However, funds are expected to reduce over the longer term.
Half Year Ended Dec-17 Dec-17
Dec-17 Jun-17 Dec-16 vs Jun-17 vs Dec-16
NZ$M NZ$M NZ$M % %
Funds under management and administration
Opening balance at the start of the period 693 704 739 (1.6) (6.2)
Net inflows (outflows), investment income and other 28 (11) (35) n/a n/a
Balance at the end of the period 721 693 704 4.0 2.4
For
per
sona
l use
onl
y
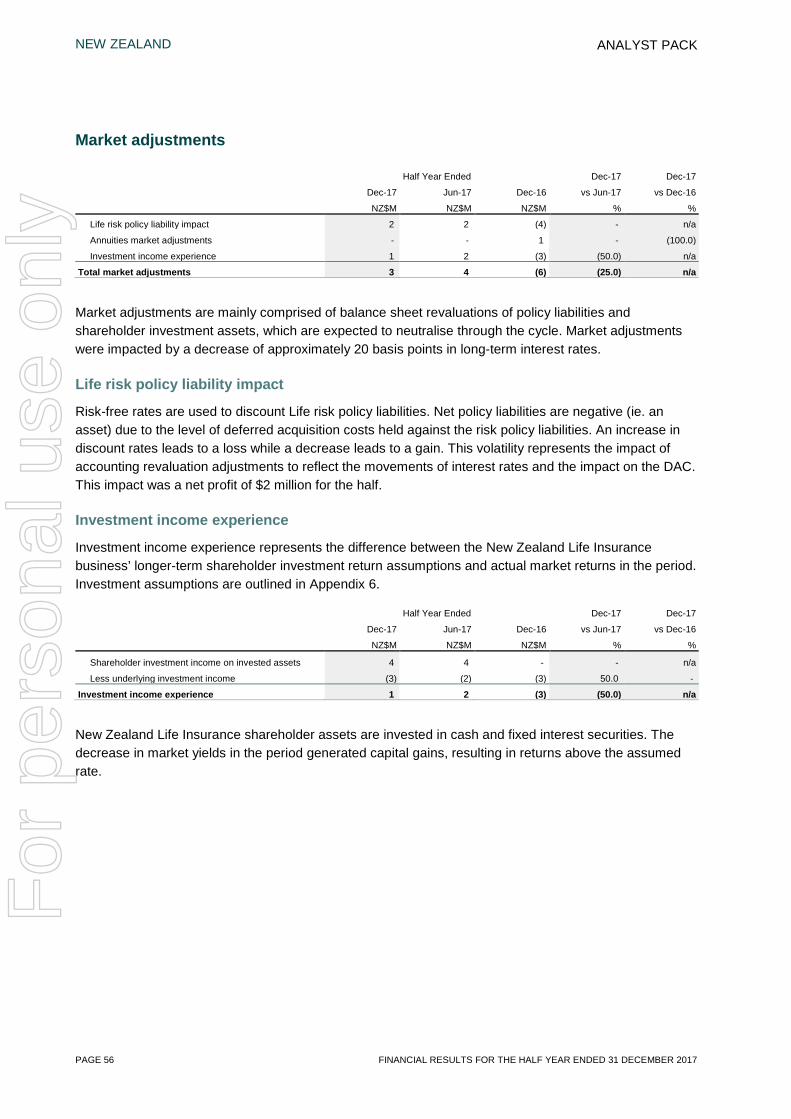
NEW ZEALAND
PAGE 56 FINANCIAL RESULTS FOR THE HALF YEAR ENDED 31 DECEMBER 2017
ANALYST PACK
Market adjustments
Half Year Ended Dec-17 Dec-17
Dec-17 Jun-17 Dec-16 vs Jun-17 vs Dec-16
NZ$M NZ$M NZ$M % %
Life risk policy liability impact 2 2 (4) - n/a
Annuities market adjustments - - 1 - (100.0)
Investment income experience 1 2 (3) (50.0) n/a
Total market adjustments 3 4 (6) (25.0) n/a
Market adjustments are mainly comprised of balance sheet revaluations of policy liabilities and shareholder investment assets, which are expected to neutralise through the cycle. Market adjustments were impacted by a decrease of approximately 20 basis points in long-term interest rates.
Life risk policy liability impact
Risk-free rates are used to discount Life risk policy liabilities. Net policy liabilities are negative (ie. an asset) due to the level of deferred acquisition costs held against the risk policy liabilities. An increase in discount rates leads to a loss while a decrease leads to a gain. This volatility represents the impact of accounting revaluation adjustments to reflect the movements of interest rates and the impact on the DAC. This impact was a net profit of $2 million for the half.
Investment income experience
Investment income experience represents the difference between the New Zealand Life Insurance business’ longer-term shareholder investment return assumptions and actual market returns in the period. Investment assumptions are outlined in Appendix 6.
Half Year Ended Dec-17 Dec-17
Dec-17 Jun-17 Dec-16 vs Jun-17 vs Dec-16
NZ$M NZ$M NZ$M % %
Shareholder investment income on invested assets 4 4 - - n/a
Less underlying investment income (3) (2) (3) 50.0 -
Investment income experience 1 2 (3) (50.0) n/a
New Zealand Life Insurance shareholder assets are invested in cash and fixed interest securities. The decrease in market yields in the period generated capital gains, resulting in returns above the assumed rate.
For
per
sona
l use
onl
y
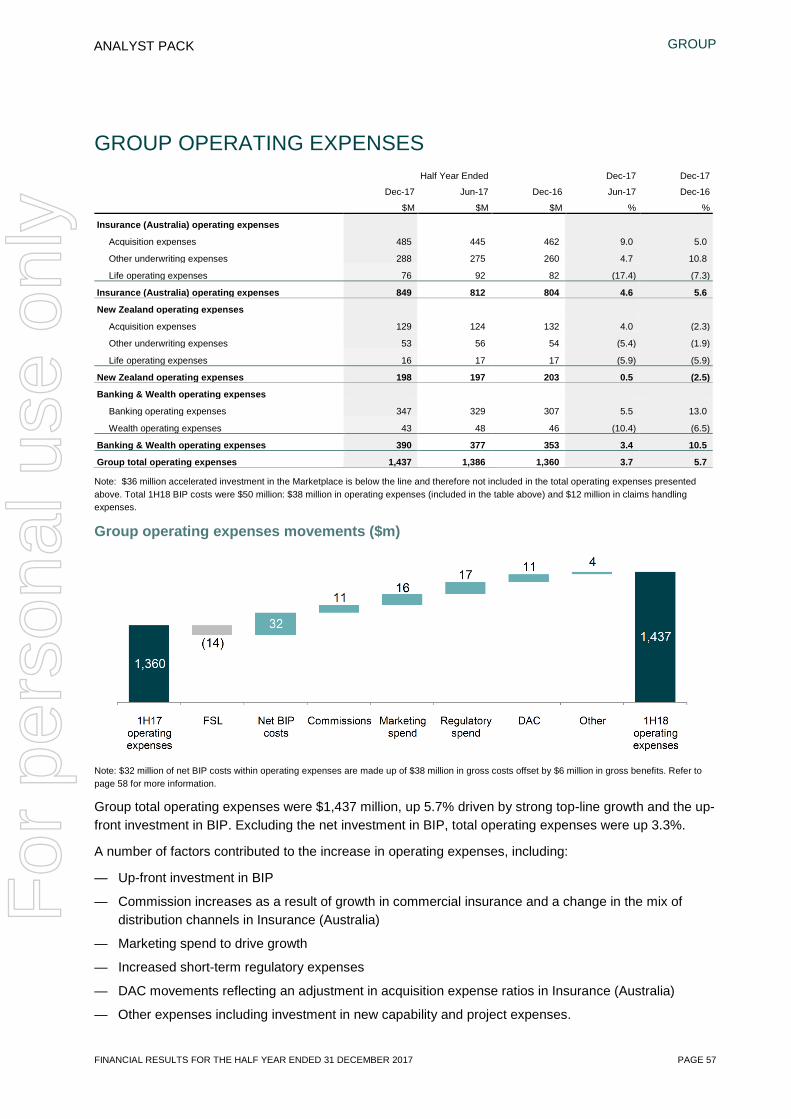
GROUP
FINANCIAL RESULTS FOR THE HALF YEAR ENDED 31 DECEMBER 2017 PAGE 57
ANALYST PACK
GROUP OPERATING EXPENSES Half Year Ended Dec-17 Dec-17 Dec-17 Jun-17 Dec-16 Jun-17 Dec-16 $M $M $M % %
Insurance (Australia) operating expenses
Acquisition expenses 485 445 462 9.0 5.0
Other underwriting expenses 288 275 260 4.7 10.8
Life operating expenses 76 92 82 (17.4) (7.3)
Insurance (Australia) operating expenses 849 812 804 4.6 5.6
New Zealand operating expenses
Acquisition expenses 129 124 132 4.0 (2.3)
Other underwriting expenses 53 56 54 (5.4) (1.9)
Life operating expenses 16 17 17 (5.9) (5.9)
New Zealand operating expenses 198 197 203 0.5 (2.5)
Banking & Wealth operating expenses
Banking operating expenses 347 329 307 5.5 13.0
Wealth operating expenses 43 48 46 (10.4) (6.5)
Banking & Wealth operating expenses 390 377 353 3.4 10.5
Group total operating expenses 1,437 1,386 1,360 3.7 5.7
Note: $36 million accelerated investment in the Marketplace is below the line and therefore not included in the total operating expenses presented above. Total 1H18 BIP costs were $50 million: $38 million in operating expenses (included in the table above) and $12 million in claims handling expenses.
Group operating expenses movements ($m)
Note: $32 million of net BIP costs within operating expenses are made up of $38 million in gross costs offset by $6 million in gross benefits. Refer to page 58 for more information.
Group total operating expenses were $1,437 million, up 5.7% driven by strong top-line growth and the up-front investment in BIP. Excluding the net investment in BIP, total operating expenses were up 3.3%.
A number of factors contributed to the increase in operating expenses, including:
— Up-front investment in BIP
— Commission increases as a result of growth in commercial insurance and a change in the mix of distribution channels in Insurance (Australia)
— Marketing spend to drive growth
— Increased short-term regulatory expenses
— DAC movements reflecting an adjustment in acquisition expense ratios in Insurance (Australia)
— Other expenses including investment in new capability and project expenses.
For
per
sona
l use
onl
y
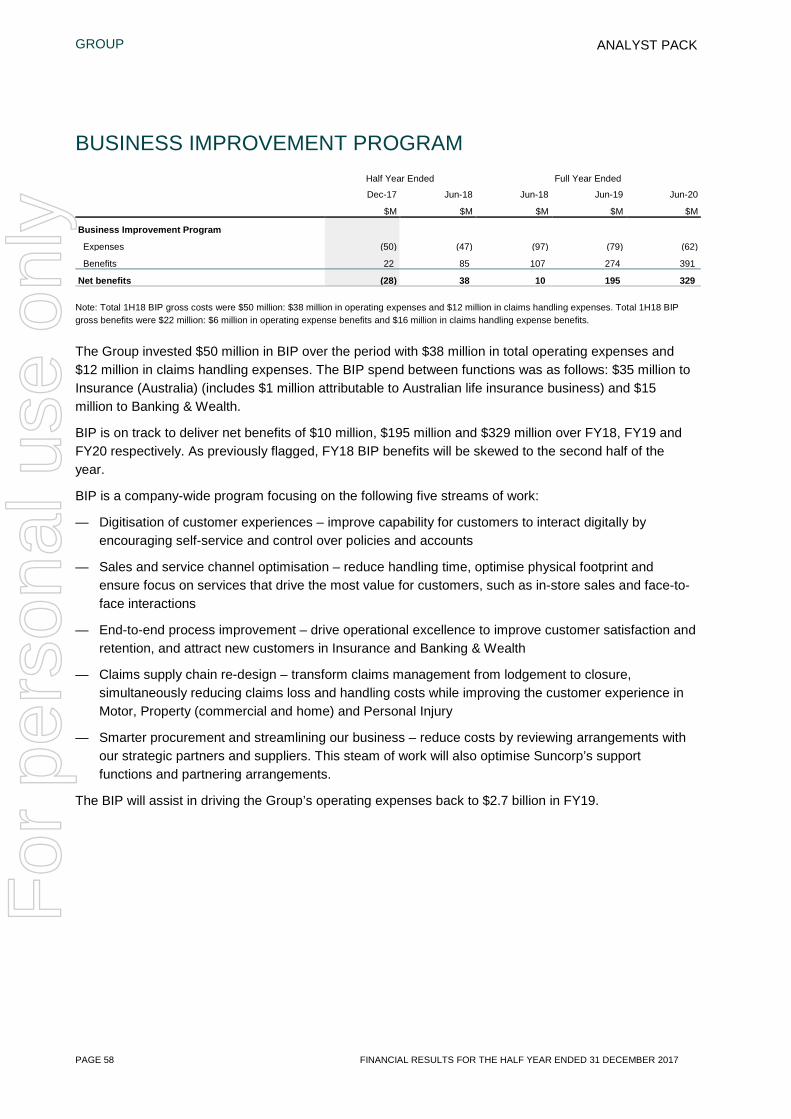
GROUP
PAGE 58 FINANCIAL RESULTS FOR THE HALF YEAR ENDED 31 DECEMBER 2017
ANALYST PACK
BUSINESS IMPROVEMENT PROGRAM Half Year Ended Full Year Ended
Dec-17 Jun-18 Jun-18 Jun-19 Jun-20
$M $M $M $M $M
Business Improvement Program
Expenses (50) (47) (97) (79) (62)
Benefits 22 85 107 274 391
Net benefits (28) 38 10 195 329
Note: Total 1H18 BIP gross costs were $50 million: $38 million in operating expenses and $12 million in claims handling expenses. Total 1H18 BIP gross benefits were $22 million: $6 million in operating expense benefits and $16 million in claims handling expense benefits.
The Group invested $50 million in BIP over the period with $38 million in total operating expenses and $12 million in claims handling expenses. The BIP spend between functions was as follows: $35 million to Insurance (Australia) (includes $1 million attributable to Australian life insurance business) and $15 million to Banking & Wealth.
BIP is on track to deliver net benefits of $10 million, $195 million and $329 million over FY18, FY19 and FY20 respectively. As previously flagged, FY18 BIP benefits will be skewed to the second half of the year.
BIP is a company-wide program focusing on the following five streams of work:
— Digitisation of customer experiences – improve capability for customers to interact digitally by encouraging self-service and control over policies and accounts
— Sales and service channel optimisation – reduce handling time, optimise physical footprint and ensure focus on services that drive the most value for customers, such as in-store sales and face-to-face interactions
— End-to-end process improvement – drive operational excellence to improve customer satisfaction and retention, and attract new customers in Insurance and Banking & Wealth
— Claims supply chain re-design – transform claims management from lodgement to closure, simultaneously reducing claims loss and handling costs while improving the customer experience in Motor, Property (commercial and home) and Personal Injury
— Smarter procurement and streamlining our business – reduce costs by reviewing arrangements with our strategic partners and suppliers. This steam of work will also optimise Suncorp’s support functions and partnering arrangements.
The BIP will assist in driving the Group’s operating expenses back to $2.7 billion in FY19.
For
per
sona
l use
onl
y
GROUP
FINANCIAL RESULTS FOR THE HALF YEAR ENDED 31 DECEMBER 2017 PAGE 59
ANALYST PACK
CUSTOMER Suncorp remains focused on its four key priorities to elevate the customer, create the Marketplace, maintain momentum and grow, and inspire our people.
The Marketplace is a key enabler for Suncorp to deliver improved customer experience outcomes across both digital and physical channels. Importantly, the Marketplace also represents the essential investment required to ensure that Suncorp can deliver sustained and resilient growth across Suncorp’s core business areas. The additional $142 million (pre-tax) investment in FY18 is allowing Suncorp to execute the key deliverables of the Marketplace faster – accelerating the delivery of improved customer experience outcomes, business performance and benefits for shareholders.
Suncorp invested $36 million over the half to accelerate the Group’s Marketplace strategic priority and has made good progress against each of the six deliverables.
Key achievements include:
— Reward and Recognition pilot was launched, attracting 55,000 registered customers
— Suncorp and AAMI customers were given a single view across insurance and banking products
— Four Integrated Offers were launched, providing customers incentives to connect to other key products
— Successful opening of the Sydney Discovery Store in the Pitt Street Mall and 34 stores updated to support Suncorp’s new brand
— Home Buyers Guide was launched to assist customers with the complex steps required to purchase a property
— Home Inspection Plus was launched in December, connecting customers to qualified home inspection experts to assist customers when buying a home
— Marketplace app is due to be completed within six months and will enable customers to manage their financial wellbeing in one place among other unique features.
Outlook The execution of the Marketplace program is expected to deliver strong business outcomes and will contribute to the achievement of the Group’s FY19 targets by driving:
— An ongoing increase in the volume of customer transactions completed online
— An increase in the volume of customers retained
— An increase in the number of products per customer
— Strong Net Promoter Score performance.
For
per
sona
l use
onl
y
GROUP
PAGE 60 FINANCIAL RESULTS FOR THE HALF YEAR ENDED 31 DECEMBER 2017
ANALYST PACK
GENERAL INSURANCE REINSURANCE Outwards reinsurance expense for the half-year was $545 million, a reduction of $5 million.
Suncorp reduces its concentration risk arising from its significant share of the Queensland home insurance market through a multi-year, 30% quota share arrangement.
In addition, Suncorp has a 50% quota share in place for its retained share of CTP business in ACT and South Australia.
The upper limit on Suncorp’s main catastrophe program, which covers the Group’s home, motor and commercial property portfolios for major events such as earthquakes, cyclones, storms, floods and bushfires is $6.9 billion for the 2018 financial year. In line with Reserve Bank of New Zealand (RBNZ) regulatory requirements, New Zealand protection is 100% placed to $6.3 billion. Additional protection for New Zealand, up to $6.9 billion is partially placed at 65%.
The Group’s maximum event retention is $250 million. Additional cover is in place to reduce this retention to $200 million for a second Australian event and to $50 million for third and fourth events. For New Zealand risks, the Group has a multi-year cover which reduces the first event retention to NZ$50 million and the second event retention to NZ$25 million. For capital efficiency purposes, an internal reinsurance arrangement reduces the Suncorp New Zealand retention to NZ$20 million for the first and second events.
Due to the increased frequency and severity of natural hazards in recent years, Suncorp has a natural hazards aggregate protection cover in place. This provides $300 million of cover over the retained portion of natural hazard events greater than $10 million that exceed a total of $475 million.
Reinsurance security has been maintained for the 2018 financial year program, with over 85% of business protected by reinsurers rated ‘A+’ or better.
For
per
sona
l use
onl
y
GROUP
FINANCIAL RESULTS FOR THE HALF YEAR ENDED 31 DECEMBER 2017 PAGE 61
ANALYST PACK
GROUP CAPITAL AND DIVIDENDS Suncorp Group’s capital management strategy is to optimise shareholder value by managing the level, mix and use of capital resources. The primary objective is to ensure there are sufficient capital resources to maintain and grow the business, in accordance with risk appetite.
The Group is subject to, and complies with, external capital requirements set and monitored by APRA and the RBNZ.
The Group’s Internal Capital Adequacy Assessment Process (ICAAP) provides the framework to ensure that the Group as a whole and each regulated entity, is capitalised to meet both internal and external requirements. The ICAAP is reviewed regularly and, where appropriate, adjustments are made to reflect changes in the Group’s capital requirements.
A range of instruments and methodologies are used to effectively manage capital including share issues, reinsurance, dividend policies and Tier 1 and Tier 2 instruments. Capital targets are structured according to risk appetite, business lines regulatory frameworks and APRA’s Non-Operating Holding Company conditions.
For regulatory purposes, capital is classified as follows:
— CET1 comprising accounting equity with adjustments for intangible assets and regulatory reserves
— Tier 1 Capital comprising CET1 plus Additional Tier 1 Capital such as hybrid securities with ‘equity-like’ qualities
— Tier 2 Capital comprising certain securities recognised as Tier 2 Capital, together with specific Bank reserves eligible as regulatory capital
— Total Capital is the sum of Tier 1 Capital and Tier 2 Capital.
CET1 has the greatest capacity to absorb potential losses, followed by Additional Tier 1 Capital and then Tier 2 Capital.
Dividend
The Group aims to pay annual dividends based on a target payout ratio of 60% to 80% of cash earnings. For the 2018 financial year, the Board intends to increase the dividend payout ratio above the top end of the usual range to offset the impact on cash earnings of the additional investment to deliver key components of the Marketplace.
The Group’s profit result for the half year has led to a fully franked interim dividend of 33 cents per share, which equates to a payout ratio of 90.1% of cash earnings. The interim dividend is in line with the prior corresponding period interim dividend of 33 cents per share and is supported by the Group’s strong capital position.
The Group intends to issue new shares under the Dividend Reinvestment Plan for the interim dividend.
The interim ordinary dividend of 33 cents per share will be fully franked and paid on 5 April 2018. The ex-dividend date is 21 February 2018. The Group’s franking credit balance is set out below.
Half Year Ended
Dec-17 Jun-17 Dec-16
$M $M $M
Franking credits Franking credits available for subsequent financial periods based on a tax rate of 30% after proposed dividends 158 235 230
For
per
sona
l use
onl
y
GROUP
PAGE 62 FINANCIAL RESULTS FOR THE HALF YEAR ENDED 31 DECEMBER 2017
ANALYST PACK
Capital position at 31 December 2017
During the half year, the Group issued $375 million of Additional Tier 1 capital notes through SGL as part of its capital management strategy. These notes, along with the $375 million of SGL Capital Notes issued in May 2017, facilitated the repayment of the $560 million CPS2 Additional Tier 1 capital securities. The additional $190 million of capital raised over and above that required to repay CPS2 has been deployed to the following businesses:
— $100 million to Bank to support continued growth in the Bank balance sheet
— $35 million to the Australian Life business, to improve the efficiency of the Life capital structure.
A further $55 million is currently held by SGL and is expected to be deployed to the New Zealand General Insurance business in early 2018, in the form of RBNZ compliant perpetual capital securities, to improve the efficiency of the New Zealand capital structure.
Over the half year, the Group’s Excess CET1 (ex dividend) remained relatively stable at $381 million. The main impacts on the Group’s excess capital position were:
— NPAT less the interim dividend (net of DRP)
— An increase in the General Insurance PCA due to a combination of higher Assets Risk Charge and higher Insurance Risk Charge
— A reduction in excess technical provisions due to normal seasonality arising as Suncorp enters the peak natural hazard season
— An increase in Bank Risk Weighted Assets due to balance sheet growth partially offset by the capital benefits from a securitisation transaction
— A reduction in the Life Insurance policy liability adjustment (DAC)
— Unwind of the temporary increase in Group Target that was established at 30 June 2017.
As at 31 December 2017
General
Insurance (2) Bank (2) Life
SGL, Corp Services &
Consol Total Total
30 June 2017
$M $M $M $M $M $M
CET1 2,948 2,930 535 193 6,606 6,625
CET1 target 2,655 2,846 331 - 5,832 5,772
Excess to CET1 target (pre div) 293 84 204 193 774 853
Group dividend (3) (393) (476)
Group excess to CET1 target (ex div) 381 377 Common Equity Tier 1 ratio (1) 1.22x 9.01% 2.37x Total capital 4,013 4,381 670 248 9,312 9,512
Total target capital 3,620 3,985 391 (19) 7,977 7,880
Excess to target (pre div) 393 396 279 267 1,335 1,632
Group dividend (3) (393) (476)
Group excess to target (ex div) 942 1,156 Total capital ratio (1) 1.66x 13.47% 2.96x
(1) Capital ratios are expressed as coverage of the PCA for General Insurance and Life, and as a percentage of Risk Weighted Assets for the
Bank. (2) The Bank and General Insurance targets are shown as the midpoint of the target operating ranges. (3) Group dividend net of expected shares issued under the Dividend Reinvestment Plan.
For
per
sona
l use
onl
y
GROUP
FINANCIAL RESULTS FOR THE HALF YEAR ENDED 31 DECEMBER 2017 PAGE 63
ANALYST PACK
In terms of the CET1 positions across the Group (pre dividend):
— The General Insurance businesses’ CET1 position was 1.22 times the PCA, above its target operating range of 1.0 - 1.2 times PCA
— The Bank’s CET1 Ratio was 9.01%, at the top of its target operating range of 8.5% - 9.0%
— Life businesses’ excess CET1 to target was $204 million
— An additional $193 million of excess CET1 was held at the SGL and Corporate Services level.
The Group maintains a strong capital position with all businesses holding CET1 in excess of targets. The Group’s excess to CET1 target is $381 million after adjusting for the final dividend.
Appendix 5 contains further information on the capital position of the Suncorp Group.
For
per
sona
l use
onl
y
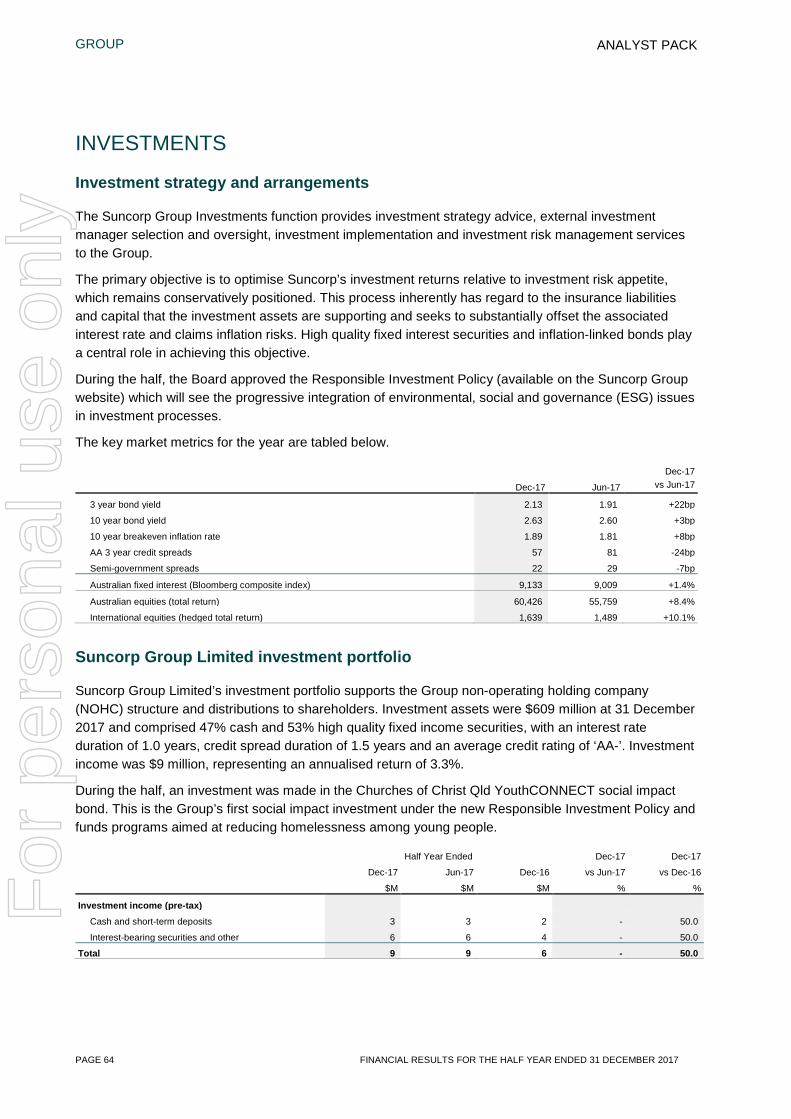
GROUP
PAGE 64 FINANCIAL RESULTS FOR THE HALF YEAR ENDED 31 DECEMBER 2017
ANALYST PACK
INVESTMENTS
Investment strategy and arrangements
The Suncorp Group Investments function provides investment strategy advice, external investment manager selection and oversight, investment implementation and investment risk management services to the Group.
The primary objective is to optimise Suncorp’s investment returns relative to investment risk appetite, which remains conservatively positioned. This process inherently has regard to the insurance liabilities and capital that the investment assets are supporting and seeks to substantially offset the associated interest rate and claims inflation risks. High quality fixed interest securities and inflation-linked bonds play a central role in achieving this objective.
During the half, the Board approved the Responsible Investment Policy (available on the Suncorp Group website) which will see the progressive integration of environmental, social and governance (ESG) issues in investment processes.
The key market metrics for the year are tabled below.
Dec-17 Dec-17 Jun-17 vs Jun-17
3 year bond yield 2.13 1.91 +22bp
10 year bond yield 2.63 2.60 +3bp
10 year breakeven inflation rate 1.89 1.81 +8bp
AA 3 year credit spreads 57 81 -24bp
Semi-government spreads 22 29 -7bp
Australian fixed interest (Bloomberg composite index) 9,133 9,009 +1.4%
Australian equities (total return) 60,426 55,759 +8.4%
International equities (hedged total return) 1,639 1,489 +10.1%
Suncorp Group Limited investment portfolio
Suncorp Group Limited’s investment portfolio supports the Group non-operating holding company (NOHC) structure and distributions to shareholders. Investment assets were $609 million at 31 December 2017 and comprised 47% cash and 53% high quality fixed income securities, with an interest rate duration of 1.0 years, credit spread duration of 1.5 years and an average credit rating of ‘AA-’. Investment income was $9 million, representing an annualised return of 3.3%.
During the half, an investment was made in the Churches of Christ Qld YouthCONNECT social impact bond. This is the Group’s first social impact investment under the new Responsible Investment Policy and funds programs aimed at reducing homelessness among young people.
Half Year Ended Dec-17 Dec-17
Dec-17 Jun-17 Dec-16 vs Jun-17 vs Dec-16
$M $M $M % %
Investment income (pre-tax)
Cash and short-term deposits 3 3 2 - 50.0
Interest-bearing securities and other 6 6 4 - 50.0
Total 9 9 6 - 50.0
For
per
sona
l use
onl
y
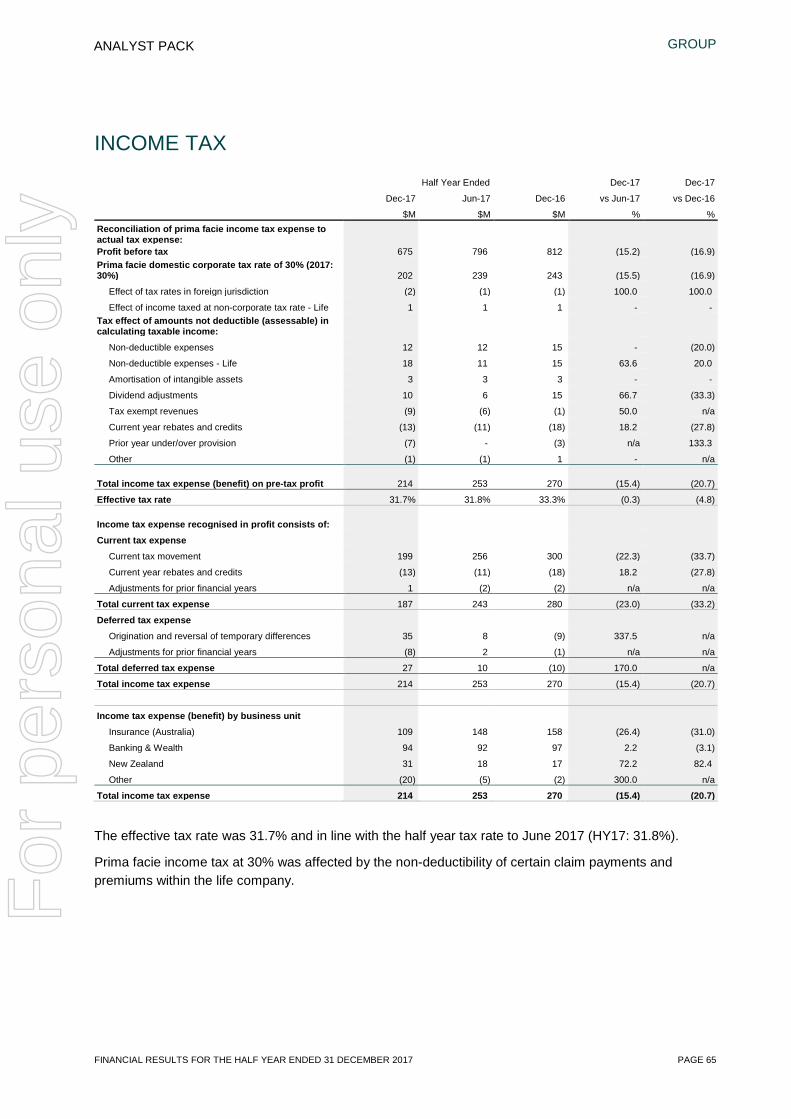
GROUP
FINANCIAL RESULTS FOR THE HALF YEAR ENDED 31 DECEMBER 2017 PAGE 65
ANALYST PACK
INCOME TAX
Half Year Ended Dec-17 Dec-17
Dec-17 Jun-17 Dec-16 vs Jun-17 vs Dec-16
$M $M $M % % Reconciliation of prima facie income tax expense to actual tax expense: Profit before tax 675 796 812 (15.2) (16.9) Prima facie domestic corporate tax rate of 30% (2017: 30%) 202 239 243 (15.5) (16.9)
Effect of tax rates in foreign jurisdiction (2) (1) (1) 100.0 100.0
Effect of income taxed at non-corporate tax rate - Life 1 1 1 - - Tax effect of amounts not deductible (assessable) in calculating taxable income:
Non-deductible expenses 12 12 15 - (20.0)
Non-deductible expenses - Life 18 11 15 63.6 20.0
Amortisation of intangible assets 3 3 3 - -
Dividend adjustments 10 6 15 66.7 (33.3)
Tax exempt revenues (9) (6) (1) 50.0 n/a
Current year rebates and credits (13) (11) (18) 18.2 (27.8)
Prior year under/over provision (7) - (3) n/a 133.3
Other (1) (1) 1 - n/a
Total income tax expense (benefit) on pre-tax profit 214 253 270 (15.4) (20.7)
Effective tax rate 31.7% 31.8% 33.3% (0.3) (4.8)
Income tax expense recognised in profit consists of:
Current tax expense
Current tax movement 199 256 300 (22.3) (33.7)
Current year rebates and credits (13) (11) (18) 18.2 (27.8)
Adjustments for prior financial years 1 (2) (2) n/a n/a
Total current tax expense 187 243 280 (23.0) (33.2)
Deferred tax expense
Origination and reversal of temporary differences 35 8 (9) 337.5 n/a
Adjustments for prior financial years (8) 2 (1) n/a n/a
Total deferred tax expense 27 10 (10) 170.0 n/a
Total income tax expense 214 253 270 (15.4) (20.7)
Income tax expense (benefit) by business unit
Insurance (Australia) 109 148 158 (26.4) (31.0)
Banking & Wealth 94 92 97 2.2 (3.1)
New Zealand 31 18 17 72.2 82.4
Other (20) (5) (2) 300.0 n/a
Total income tax expense 214 253 270 (15.4) (20.7)
The effective tax rate was 31.7% and in line with the half year tax rate to June 2017 (HY17: 31.8%).
Prima facie income tax at 30% was affected by the non-deductibility of certain claim payments and premiums within the life company.F
or p
erso
nal u
se o
nly
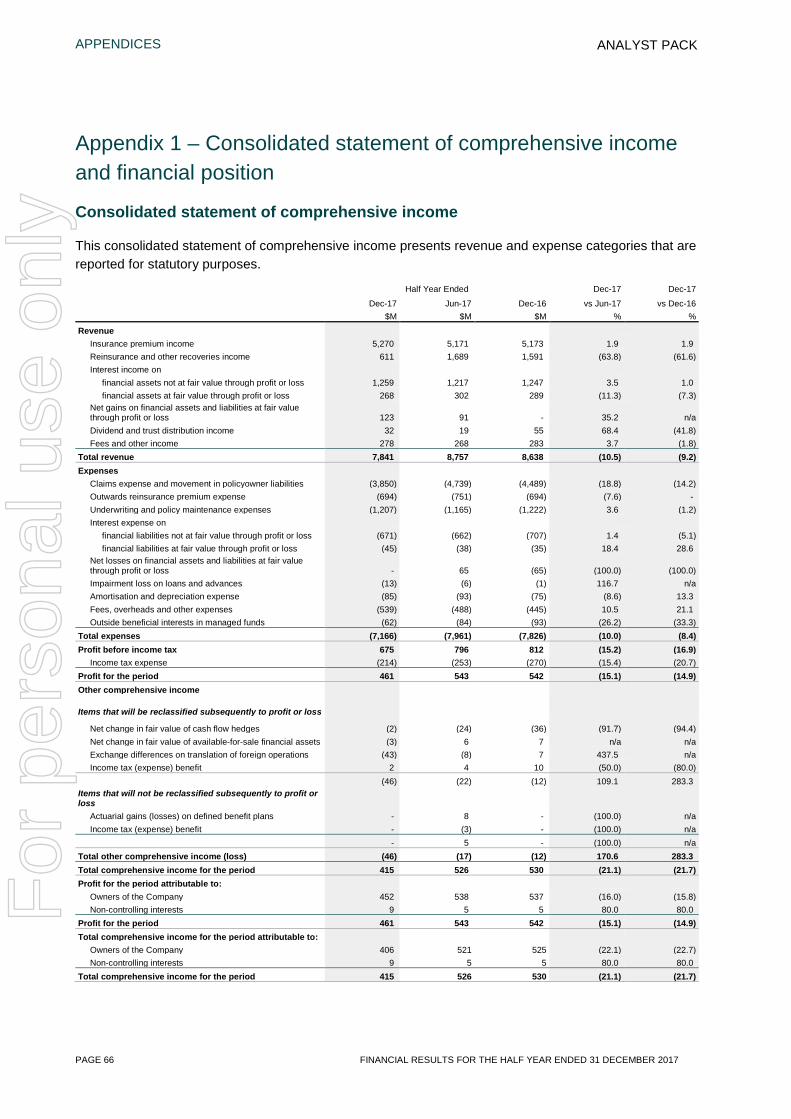
APPENDICES
PAGE 66 FINANCIAL RESULTS FOR THE HALF YEAR ENDED 31 DECEMBER 2017
ANALYST PACK
Appendix 1 – Consolidated statement of comprehensive income and financial position
Consolidated statement of comprehensive income
This consolidated statement of comprehensive income presents revenue and expense categories that are reported for statutory purposes.
Half Year Ended Dec-17 Dec-17
Dec-17 Jun-17 Dec-16 vs Jun-17 vs Dec-16 $M $M $M % %
Revenue Insurance premium income 5,270 5,171 5,173 1.9 1.9 Reinsurance and other recoveries income 611 1,689 1,591 (63.8) (61.6) Interest income on
financial assets not at fair value through profit or loss 1,259 1,217 1,247 3.5 1.0 financial assets at fair value through profit or loss 268 302 289 (11.3) (7.3)
Net gains on financial assets and liabilities at fair value through profit or loss 123 91 - 35.2 n/a Dividend and trust distribution income 32 19 55 68.4 (41.8) Fees and other income 278 268 283 3.7 (1.8)
Total revenue 7,841 8,757 8,638 (10.5) (9.2) Expenses
Claims expense and movement in policyowner liabilities (3,850) (4,739) (4,489) (18.8) (14.2) Outwards reinsurance premium expense (694) (751) (694) (7.6) - Underwriting and policy maintenance expenses (1,207) (1,165) (1,222) 3.6 (1.2) Interest expense on
financial liabilities not at fair value through profit or loss (671) (662) (707) 1.4 (5.1) financial liabilities at fair value through profit or loss (45) (38) (35) 18.4 28.6
Net losses on financial assets and liabilities at fair value through profit or loss - 65 (65) (100.0) (100.0) Impairment loss on loans and advances (13) (6) (1) 116.7 n/a Amortisation and depreciation expense (85) (93) (75) (8.6) 13.3 Fees, overheads and other expenses (539) (488) (445) 10.5 21.1 Outside beneficial interests in managed funds (62) (84) (93) (26.2) (33.3)
Total expenses (7,166) (7,961) (7,826) (10.0) (8.4) Profit before income tax 675 796 812 (15.2) (16.9)
Income tax expense (214) (253) (270) (15.4) (20.7) Profit for the period 461 543 542 (15.1) (14.9) Other comprehensive income
Items that will be reclassified subsequently to profit or loss
Net change in fair value of cash flow hedges (2) (24) (36) (91.7) (94.4) Net change in fair value of available-for-sale financial assets (3) 6 7 n/a n/a Exchange differences on translation of foreign operations (43) (8) 7 437.5 n/a Income tax (expense) benefit 2 4 10 (50.0) (80.0)
(46) (22) (12) 109.1 283.3 Items that will not be reclassified subsequently to profit or loss
Actuarial gains (losses) on defined benefit plans - 8 - (100.0) n/a Income tax (expense) benefit - (3) - (100.0) n/a
- 5 - (100.0) n/a
Total other comprehensive income (loss) (46) (17) (12) 170.6 283.3 Total comprehensive income for the period 415 526 530 (21.1) (21.7) Profit for the period attributable to:
Owners of the Company 452 538 537 (16.0) (15.8) Non-controlling interests 9 5 5 80.0 80.0
Profit for the period 461 543 542 (15.1) (14.9) Total comprehensive income for the period attributable to:
Owners of the Company 406 521 525 (22.1) (22.7) Non-controlling interests 9 5 5 80.0 80.0
Total comprehensive income for the period 415 526 530 (21.1) (21.7)
For
per
sona
l use
onl
y
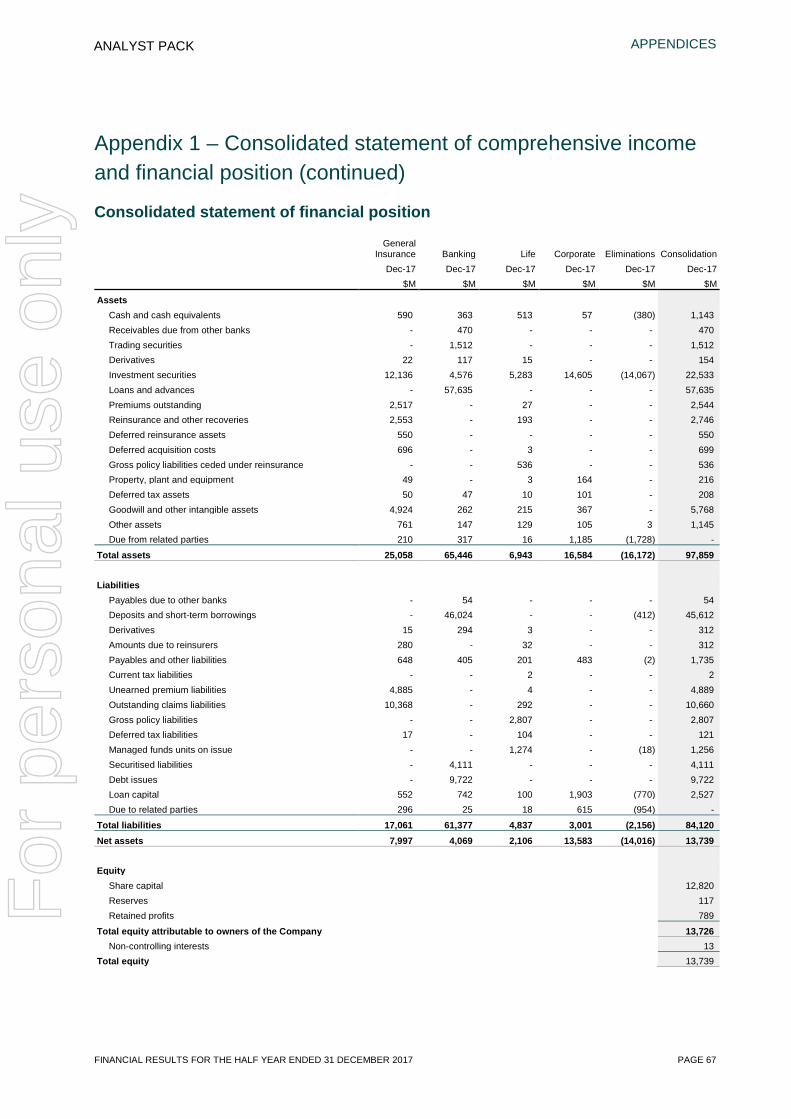
APPENDICES
FINANCIAL RESULTS FOR THE HALF YEAR ENDED 31 DECEMBER 2017 PAGE 67
ANALYST PACK
Appendix 1 – Consolidated statement of comprehensive income and financial position (continued)
Consolidated statement of financial position
General
Insurance Banking Life Corporate Eliminations Consolidation Dec-17 Dec-17 Dec-17 Dec-17 Dec-17 Dec-17 $M $M $M $M $M $M
Assets Cash and cash equivalents 590 363 513 57 (380) 1,143 Receivables due from other banks - 470 - - - 470 Trading securities - 1,512 - - - 1,512 Derivatives 22 117 15 - - 154 Investment securities 12,136 4,576 5,283 14,605 (14,067) 22,533 Loans and advances - 57,635 - - - 57,635 Premiums outstanding 2,517 - 27 - - 2,544 Reinsurance and other recoveries 2,553 - 193 - - 2,746 Deferred reinsurance assets 550 - - - - 550 Deferred acquisition costs 696 - 3 - - 699 Gross policy liabilities ceded under reinsurance - - 536 - - 536 Property, plant and equipment 49 - 3 164 - 216 Deferred tax assets 50 47 10 101 - 208 Goodwill and other intangible assets 4,924 262 215 367 - 5,768 Other assets 761 147 129 105 3 1,145 Due from related parties 210 317 16 1,185 (1,728) -
Total assets 25,058 65,446 6,943 16,584 (16,172) 97,859 Liabilities
Payables due to other banks - 54 - - - 54 Deposits and short-term borrowings - 46,024 - - (412) 45,612 Derivatives 15 294 3 - - 312 Amounts due to reinsurers 280 - 32 - - 312 Payables and other liabilities 648 405 201 483 (2) 1,735 Current tax liabilities - - 2 - - 2 Unearned premium liabilities 4,885 - 4 - - 4,889 Outstanding claims liabilities 10,368 - 292 - - 10,660 Gross policy liabilities - - 2,807 - - 2,807 Deferred tax liabilities 17 - 104 - - 121 Managed funds units on issue - - 1,274 - (18) 1,256 Securitised liabilities - 4,111 - - - 4,111 Debt issues - 9,722 - - - 9,722 Loan capital 552 742 100 1,903 (770) 2,527 Due to related parties 296 25 18 615 (954) -
Total liabilities 17,061 61,377 4,837 3,001 (2,156) 84,120 Net assets 7,997 4,069 2,106 13,583 (14,016) 13,739 Equity
Share capital 12,820 Reserves 117 Retained profits 789
Total equity attributable to owners of the Company 13,726 Non-controlling interests 13
Total equity 13,739
For
per
sona
l use
onl
y
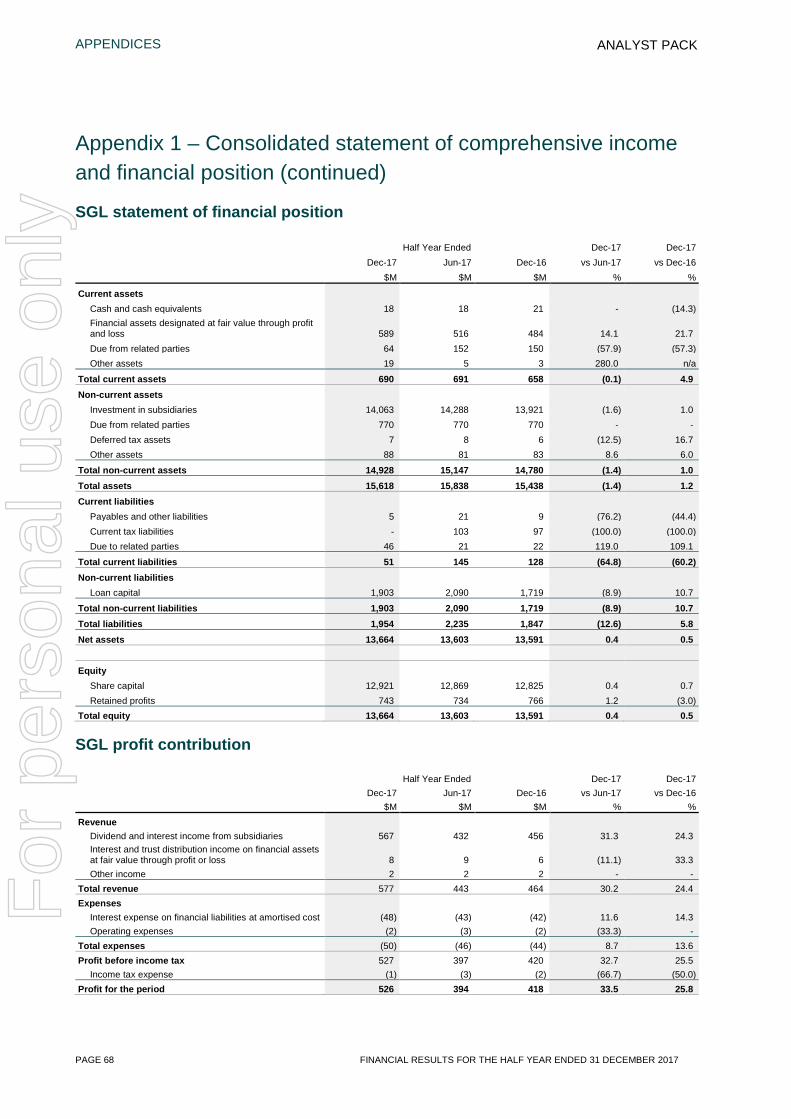
APPENDICES
PAGE 68 FINANCIAL RESULTS FOR THE HALF YEAR ENDED 31 DECEMBER 2017
ANALYST PACK
Appendix 1 – Consolidated statement of comprehensive income and financial position (continued)
SGL statement of financial position
Half Year Ended Dec-17 Dec-17 Dec-17 Jun-17 Dec-16 vs Jun-17 vs Dec-16 $M $M $M % %
Current assets Cash and cash equivalents 18 18 21 - (14.3) Financial assets designated at fair value through profit and loss 589 516 484 14.1 21.7 Due from related parties 64 152 150 (57.9) (57.3) Other assets 19 5 3 280.0 n/a
Total current assets 690 691 658 (0.1) 4.9 Non-current assets
Investment in subsidiaries 14,063 14,288 13,921 (1.6) 1.0 Due from related parties 770 770 770 - - Deferred tax assets 7 8 6 (12.5) 16.7 Other assets 88 81 83 8.6 6.0
Total non-current assets 14,928 15,147 14,780 (1.4) 1.0 Total assets 15,618 15,838 15,438 (1.4) 1.2 Current liabilities
Payables and other liabilities 5 21 9 (76.2) (44.4) Current tax liabilities - 103 97 (100.0) (100.0) Due to related parties 46 21 22 119.0 109.1
Total current liabilities 51 145 128 (64.8) (60.2) Non-current liabilities
Loan capital 1,903 2,090 1,719 (8.9) 10.7
Total non-current liabilities 1,903 2,090 1,719 (8.9) 10.7 Total liabilities 1,954 2,235 1,847 (12.6) 5.8 Net assets 13,664 13,603 13,591 0.4 0.5
Equity Share capital 12,921 12,869 12,825 0.4 0.7 Retained profits 743 734 766 1.2 (3.0)
Total equity 13,664 13,603 13,591 0.4 0.5
SGL profit contribution
Half Year Ended Dec-17 Dec-17 Dec-17 Jun-17 Dec-16 vs Jun-17 vs Dec-16 $M $M $M % % Revenue
Dividend and interest income from subsidiaries 567 432 456 31.3 24.3 Interest and trust distribution income on financial assets at fair value through profit or loss 8 9 6 (11.1) 33.3 Other income 2 2 2 - -
Total revenue 577 443 464 30.2 24.4 Expenses
Interest expense on financial liabilities at amortised cost (48) (43) (42) 11.6 14.3 Operating expenses (2) (3) (2) (33.3) -
Total expenses (50) (46) (44) 8.7 13.6 Profit before income tax 527 397 420 32.7 25.5
Income tax expense (1) (3) (2) (66.7) (50.0) Profit for the period 526 394 418 33.5 25.8
For
per
sona
l use
onl
y
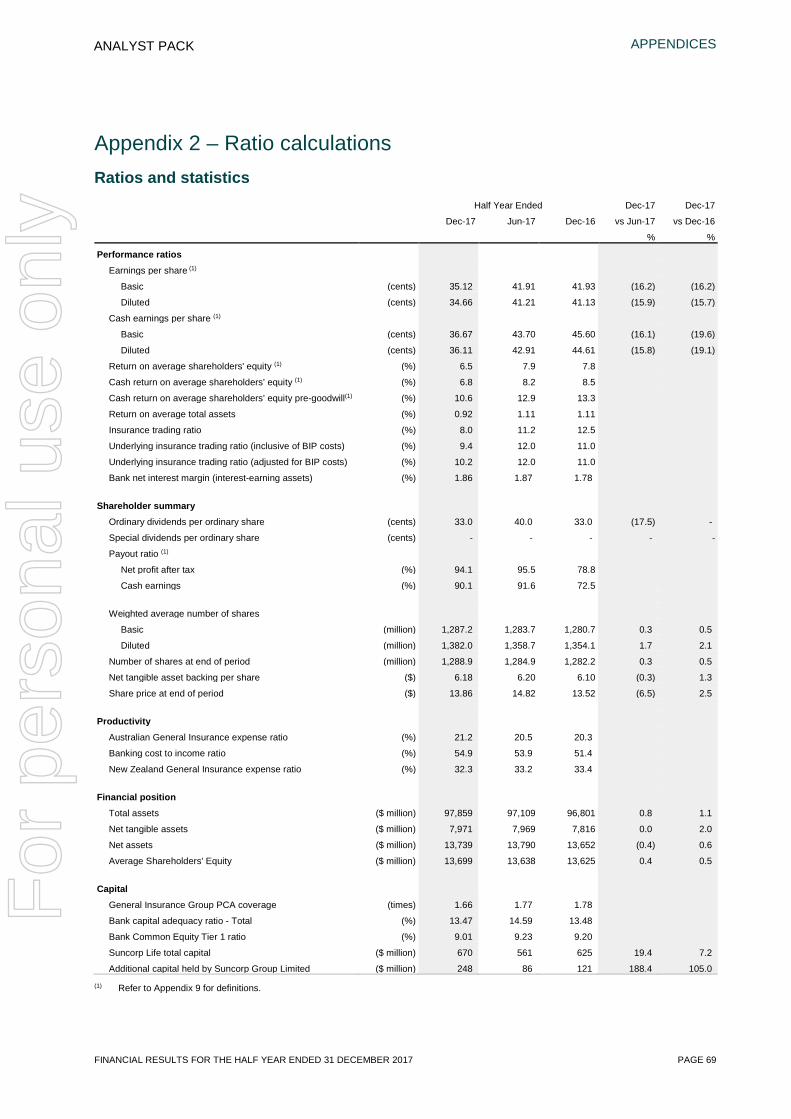
APPENDICES
FINANCIAL RESULTS FOR THE HALF YEAR ENDED 31 DECEMBER 2017 PAGE 69
ANALYST PACK
Appendix 2 – Ratio calculations Ratios and statistics Half Year Ended Dec-17 Dec-17
Dec-17 Jun-17 Dec-16 vs Jun-17 vs Dec-16
% %
Performance ratios
Earnings per share (1)
Basic (cents) 35.12 41.91 41.93 (16.2) (16.2)
Diluted (cents) 34.66 41.21 41.13 (15.9) (15.7)
Cash earnings per share (1)
Basic (cents) 36.67 43.70 45.60 (16.1) (19.6)
Diluted (cents) 36.11 42.91 44.61 (15.8) (19.1)
Return on average shareholders' equity (1) (%) 6.5 7.9 7.8
Cash return on average shareholders' equity (1) (%) 6.8 8.2 8.5
Cash return on average shareholders' equity pre-goodwill(1) (%) 10.6 12.9 13.3
Return on average total assets (%) 0.92 1.11 1.11
Insurance trading ratio (%) 8.0 11.2 12.5
Underlying insurance trading ratio (inclusive of BIP costs) (%) 9.4 12.0 11.0
Underlying insurance trading ratio (adjusted for BIP costs) (%) 10.2 12.0 11.0
Bank net interest margin (interest-earning assets) (%) 1.86 1.87 1.78
Shareholder summary
Ordinary dividends per ordinary share (cents) 33.0 40.0 33.0 (17.5) -
Special dividends per ordinary share (cents) - - - - -
Payout ratio (1)
Net profit after tax (%) 94.1 95.5 78.8
Cash earnings (%) 90.1 91.6 72.5
Weighted average number of shares
Basic (million) 1,287.2 1,283.7 1,280.7 0.3 0.5
Diluted (million) 1,382.0 1,358.7 1,354.1 1.7 2.1
Number of shares at end of period (million) 1,288.9 1,284.9 1,282.2 0.3 0.5
Net tangible asset backing per share ($) 6.18 6.20 6.10 (0.3) 1.3
Share price at end of period ($) 13.86 14.82 13.52 (6.5) 2.5
Productivity
Australian General Insurance expense ratio (%) 21.2 20.5 20.3
Banking cost to income ratio (%) 54.9 53.9 51.4
New Zealand General Insurance expense ratio (%) 32.3 33.2 33.4
Financial position
Total assets ($ million) 97,859 97,109 96,801 0.8 1.1
Net tangible assets ($ million) 7,971 7,969 7,816 0.0 2.0
Net assets ($ million) 13,739 13,790 13,652 (0.4) 0.6
Average Shareholders' Equity ($ million) 13,699 13,638 13,625 0.4 0.5
Capital
General Insurance Group PCA coverage (times) 1.66 1.77 1.78
Bank capital adequacy ratio - Total (%) 13.47 14.59 13.48
Bank Common Equity Tier 1 ratio (%) 9.01 9.23 9.20
Suncorp Life total capital ($ million) 670 561 625 19.4 7.2
Additional capital held by Suncorp Group Limited ($ million) 248 86 121 188.4 105.0
(1) Refer to Appendix 9 for definitions.
For
per
sona
l use
onl
y
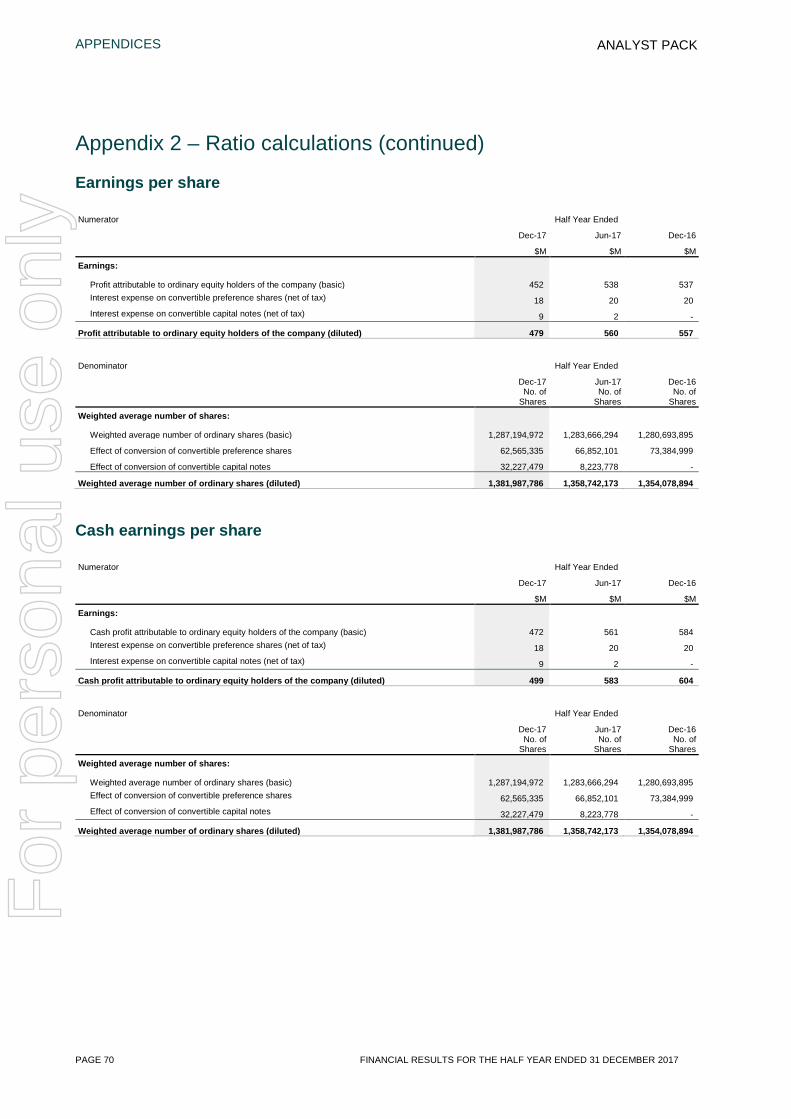
APPENDICES
PAGE 70 FINANCIAL RESULTS FOR THE HALF YEAR ENDED 31 DECEMBER 2017
ANALYST PACK
Appendix 2 – Ratio calculations (continued)
Earnings per share
Numerator Half Year Ended
Dec-17 Jun-17 Dec-16
$M $M $M
Earnings:
Profit attributable to ordinary equity holders of the company (basic) 452 538 537 Interest expense on convertible preference shares (net of tax) 18 20 20 Interest expense on convertible capital notes (net of tax) 9 2 -
Profit attributable to ordinary equity holders of the company (diluted) 479 560 557
Denominator Half Year Ended
Dec-17 Jun-17 Dec-16
No. of
Shares No. of
Shares No. of
Shares
Weighted average number of shares:
Weighted average number of ordinary shares (basic) 1,287,194,972 1,283,666,294 1,280,693,895
Effect of conversion of convertible preference shares 62,565,335 66,852,101 73,384,999
Effect of conversion of convertible capital notes 32,227,479 8,223,778 -
Weighted average number of ordinary shares (diluted) 1,381,987,786 1,358,742,173 1,354,078,894
Cash earnings per share
Numerator Half Year Ended
Dec-17 Jun-17 Dec-16
$M $M $M
Earnings:
Cash profit attributable to ordinary equity holders of the company (basic) 472 561 584 Interest expense on convertible preference shares (net of tax) 18 20 20 Interest expense on convertible capital notes (net of tax) 9 2 -
Cash profit attributable to ordinary equity holders of the company (diluted) 499 583 604
Denominator Half Year Ended
Dec-17 Jun-17 Dec-16
No. of
Shares No. of
Shares No. of
Shares
Weighted average number of shares:
Weighted average number of ordinary shares (basic) 1,287,194,972 1,283,666,294 1,280,693,895 Effect of conversion of convertible preference shares 62,565,335 66,852,101 73,384,999 Effect of conversion of convertible capital notes 32,227,479 8,223,778 -
Weighted average number of ordinary shares (diluted) 1,381,987,786 1,358,742,173 1,354,078,894
For
per
sona
l use
onl
y
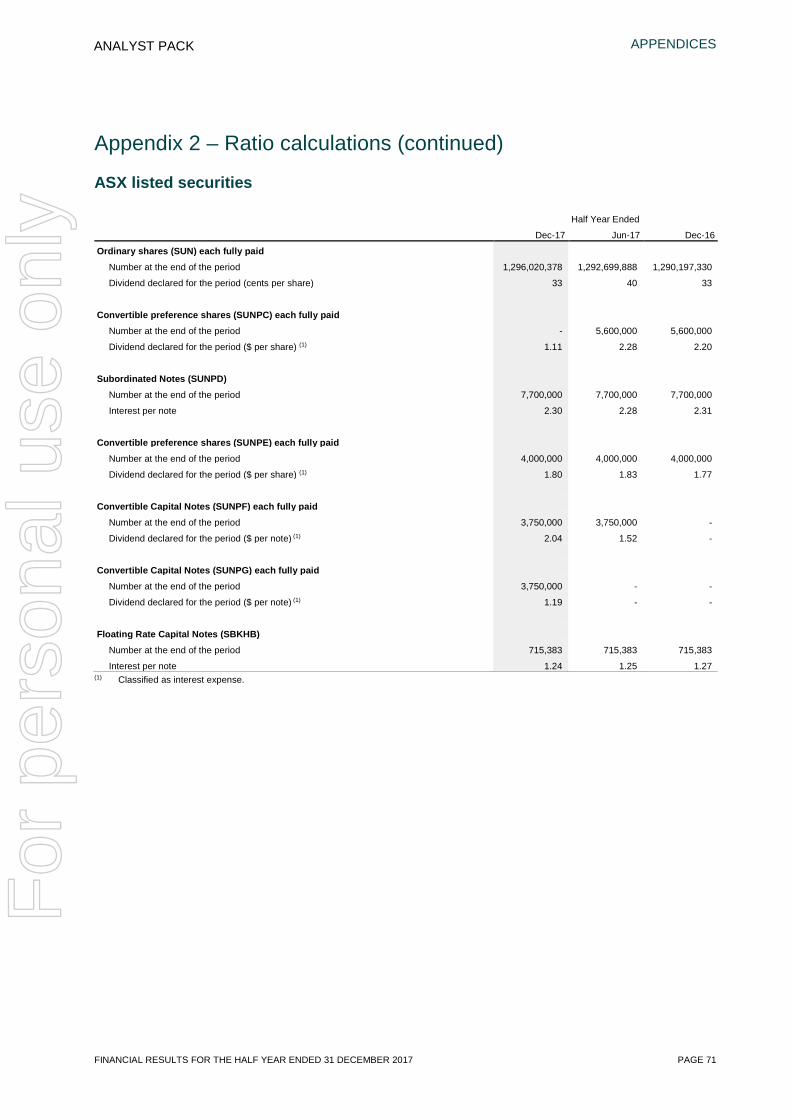
APPENDICES
FINANCIAL RESULTS FOR THE HALF YEAR ENDED 31 DECEMBER 2017 PAGE 71
ANALYST PACK
Appendix 2 – Ratio calculations (continued)
ASX listed securities
Half Year Ended
Dec-17 Jun-17 Dec-16
Ordinary shares (SUN) each fully paid
Number at the end of the period 1,296,020,378 1,292,699,888 1,290,197,330
Dividend declared for the period (cents per share) 33 40 33
Convertible preference shares (SUNPC) each fully paid
Number at the end of the period - 5,600,000 5,600,000
Dividend declared for the period ($ per share) (1) 1.11 2.28 2.20
Subordinated Notes (SUNPD)
Number at the end of the period 7,700,000 7,700,000 7,700,000
Interest per note 2.30 2.28 2.31
Convertible preference shares (SUNPE) each fully paid
Number at the end of the period 4,000,000 4,000,000 4,000,000
Dividend declared for the period ($ per share) (1) 1.80 1.83 1.77
Convertible Capital Notes (SUNPF) each fully paid
Number at the end of the period 3,750,000 3,750,000 -
Dividend declared for the period ($ per note) (1) 2.04 1.52 -
Convertible Capital Notes (SUNPG) each fully paid
Number at the end of the period 3,750,000 - -
Dividend declared for the period ($ per note) (1) 1.19 - -
Floating Rate Capital Notes (SBKHB)
Number at the end of the period 715,383 715,383 715,383
Interest per note 1.24 1.25 1.27 (1) Classified as interest expense.
For
per
sona
l use
onl
y
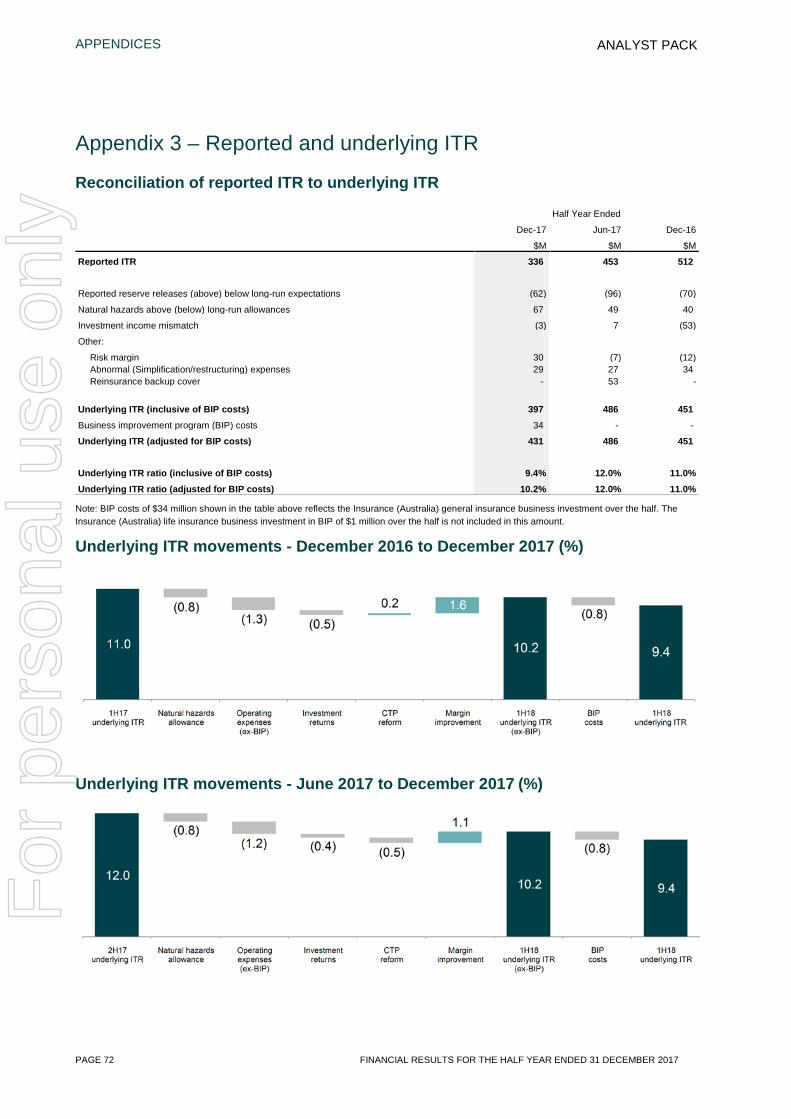
APPENDICES
PAGE 72 FINANCIAL RESULTS FOR THE HALF YEAR ENDED 31 DECEMBER 2017
ANALYST PACK
Appendix 3 – Reported and underlying ITR
Reconciliation of reported ITR to underlying ITR Half Year Ended Dec-17 Jun-17 Dec-16 $M $M $M
Reported ITR 336 453 512 Reported reserve releases (above) below long-run expectations (62) (96) (70)
Natural hazards above (below) long-run allowances 67 49 40
Investment income mismatch (3) 7 (53)
Other:
Risk margin 30 (7) (12) Abnormal (Simplification/restructuring) expenses 29 27 34 Reinsurance backup cover - 53 -
Underlying ITR (inclusive of BIP costs) 397 486 451 Business improvement program (BIP) costs 34 - -
Underlying ITR (adjusted for BIP costs) 431 486 451 Underlying ITR ratio (inclusive of BIP costs) 9.4% 12.0% 11.0% Underlying ITR ratio (adjusted for BIP costs) 10.2% 12.0% 11.0%
Note: BIP costs of $34 million shown in the table above reflects the Insurance (Australia) general insurance business investment over the half. The Insurance (Australia) life insurance business investment in BIP of $1 million over the half is not included in this amount.
Underlying ITR movements - December 2016 to December 2017 (%)
Underlying ITR movements - June 2017 to December 2017 (%)
For
per
sona
l use
onl
y
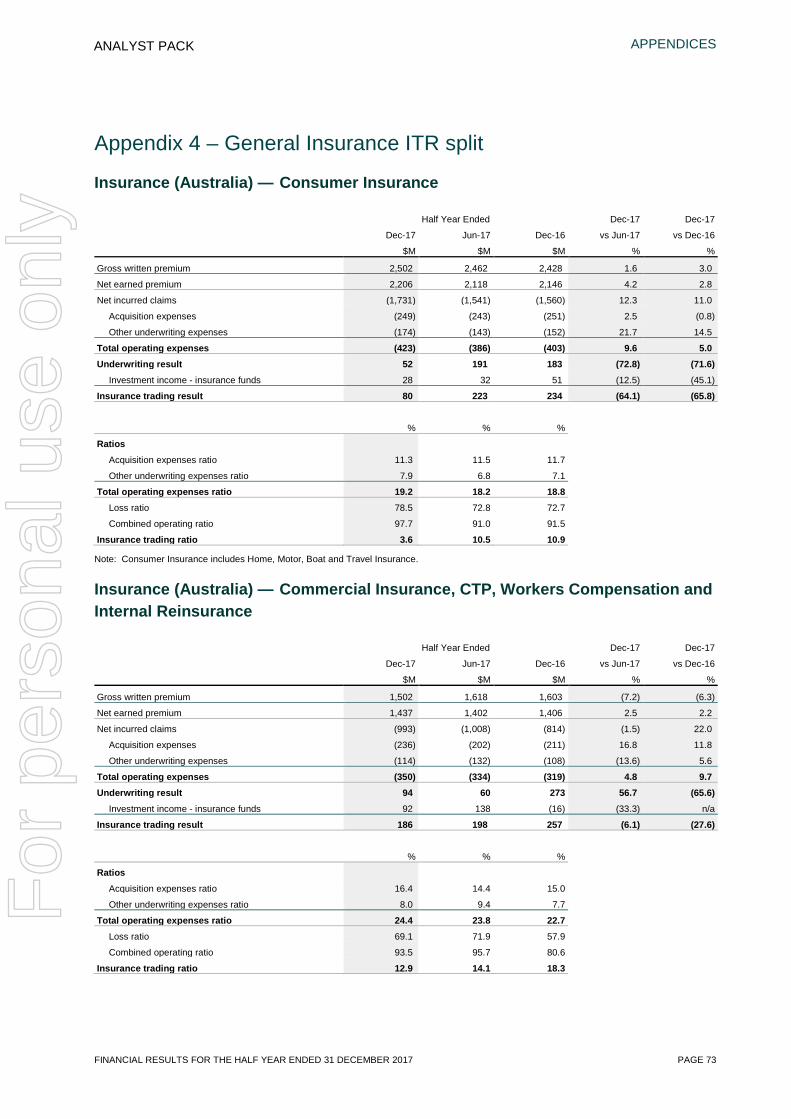
APPENDICES
FINANCIAL RESULTS FOR THE HALF YEAR ENDED 31 DECEMBER 2017 PAGE 73
ANALYST PACK
Appendix 4 – General Insurance ITR split
Insurance (Australia) — Consumer Insurance
Half Year Ended Dec-17 Dec-17
Dec-17 Jun-17 Dec-16 vs Jun-17 vs Dec-16
$M $M $M % %
Gross written premium 2,502 2,462 2,428 1.6 3.0
Net earned premium 2,206 2,118 2,146 4.2 2.8
Net incurred claims (1,731) (1,541) (1,560) 12.3 11.0
Acquisition expenses (249) (243) (251) 2.5 (0.8)
Other underwriting expenses (174) (143) (152) 21.7 14.5
Total operating expenses (423) (386) (403) 9.6 5.0 Underwriting result 52 191 183 (72.8) (71.6)
Investment income - insurance funds 28 32 51 (12.5) (45.1)
Insurance trading result 80 223 234 (64.1) (65.8)
% % %
Ratios
Acquisition expenses ratio 11.3 11.5 11.7
Other underwriting expenses ratio 7.9 6.8 7.1
Total operating expenses ratio 19.2 18.2 18.8
Loss ratio 78.5 72.8 72.7
Combined operating ratio 97.7 91.0 91.5
Insurance trading ratio 3.6 10.5 10.9
Note: Consumer Insurance includes Home, Motor, Boat and Travel Insurance.
Insurance (Australia) — Commercial Insurance, CTP, Workers Compensation and Internal Reinsurance
Half Year Ended Dec-17 Dec-17
Dec-17 Jun-17 Dec-16 vs Jun-17 vs Dec-16
$M $M $M % %
Gross written premium 1,502 1,618 1,603 (7.2) (6.3)
Net earned premium 1,437 1,402 1,406 2.5 2.2
Net incurred claims (993) (1,008) (814) (1.5) 22.0
Acquisition expenses (236) (202) (211) 16.8 11.8
Other underwriting expenses (114) (132) (108) (13.6) 5.6
Total operating expenses (350) (334) (319) 4.8 9.7 Underwriting result 94 60 273 56.7 (65.6)
Investment income - insurance funds 92 138 (16) (33.3) n/a
Insurance trading result 186 198 257 (6.1) (27.6)
% % %
Ratios
Acquisition expenses ratio 16.4 14.4 15.0
Other underwriting expenses ratio 8.0 9.4 7.7
Total operating expenses ratio 24.4 23.8 22.7
Loss ratio 69.1 71.9 57.9
Combined operating ratio 93.5 95.7 80.6
Insurance trading ratio 12.9 14.1 18.3
For
per
sona
l use
onl
y
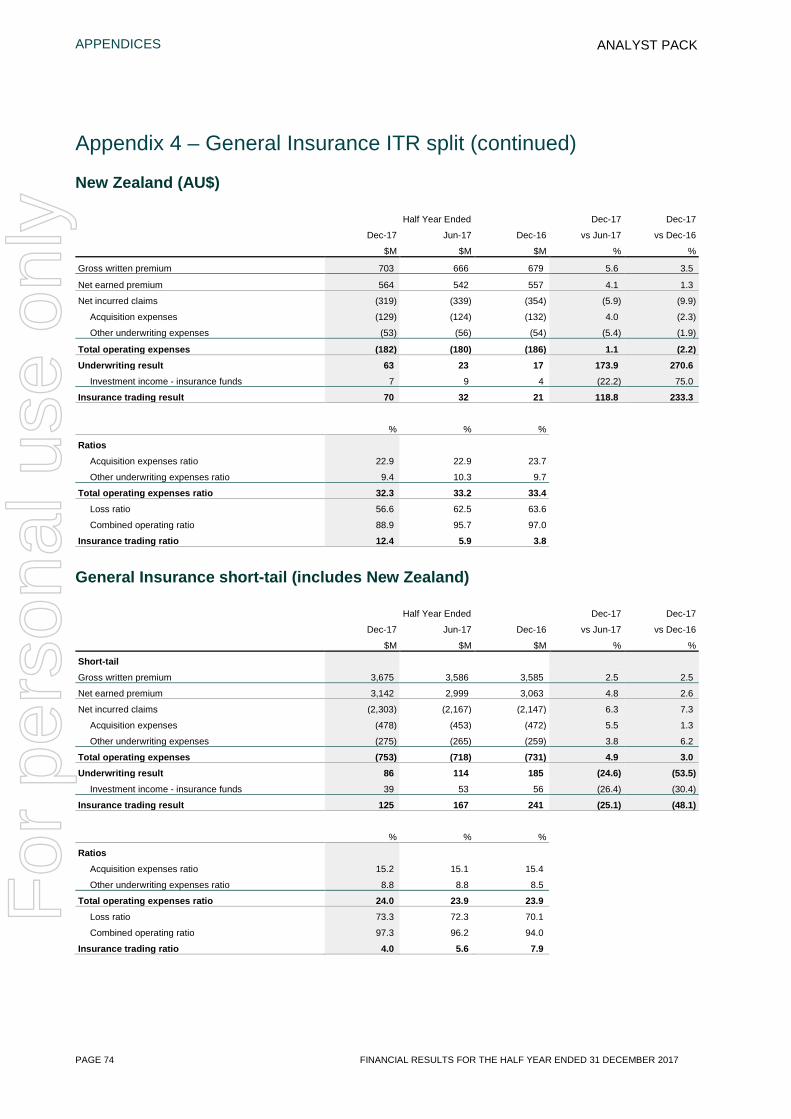
APPENDICES
PAGE 74 FINANCIAL RESULTS FOR THE HALF YEAR ENDED 31 DECEMBER 2017
ANALYST PACK
Appendix 4 – General Insurance ITR split (continued)
New Zealand (AU$)
Half Year Ended Dec-17 Dec-17
Dec-17 Jun-17 Dec-16 vs Jun-17 vs Dec-16
$M $M $M % %
Gross written premium 703 666 679 5.6 3.5
Net earned premium 564 542 557 4.1 1.3
Net incurred claims (319) (339) (354) (5.9) (9.9)
Acquisition expenses (129) (124) (132) 4.0 (2.3)
Other underwriting expenses (53) (56) (54) (5.4) (1.9)
Total operating expenses (182) (180) (186) 1.1 (2.2) Underwriting result 63 23 17 173.9 270.6
Investment income - insurance funds 7 9 4 (22.2) 75.0
Insurance trading result 70 32 21 118.8 233.3
% % %
Ratios
Acquisition expenses ratio 22.9 22.9 23.7
Other underwriting expenses ratio 9.4 10.3 9.7
Total operating expenses ratio 32.3 33.2 33.4
Loss ratio 56.6 62.5 63.6
Combined operating ratio 88.9 95.7 97.0
Insurance trading ratio 12.4 5.9 3.8
General Insurance short-tail (includes New Zealand)
Half Year Ended Dec-17 Dec-17
Dec-17 Jun-17 Dec-16 vs Jun-17 vs Dec-16
$M $M $M % %
Short-tail
Gross written premium 3,675 3,586 3,585 2.5 2.5
Net earned premium 3,142 2,999 3,063 4.8 2.6
Net incurred claims (2,303) (2,167) (2,147) 6.3 7.3
Acquisition expenses (478) (453) (472) 5.5 1.3
Other underwriting expenses (275) (265) (259) 3.8 6.2
Total operating expenses (753) (718) (731) 4.9 3.0 Underwriting result 86 114 185 (24.6) (53.5)
Investment income - insurance funds 39 53 56 (26.4) (30.4)
Insurance trading result 125 167 241 (25.1) (48.1)
% % %
Ratios
Acquisition expenses ratio 15.2 15.1 15.4
Other underwriting expenses ratio 8.8 8.8 8.5
Total operating expenses ratio 24.0 23.9 23.9
Loss ratio 73.3 72.3 70.1
Combined operating ratio 97.3 96.2 94.0
Insurance trading ratio 4.0 5.6 7.9
For
per
sona
l use
onl
y
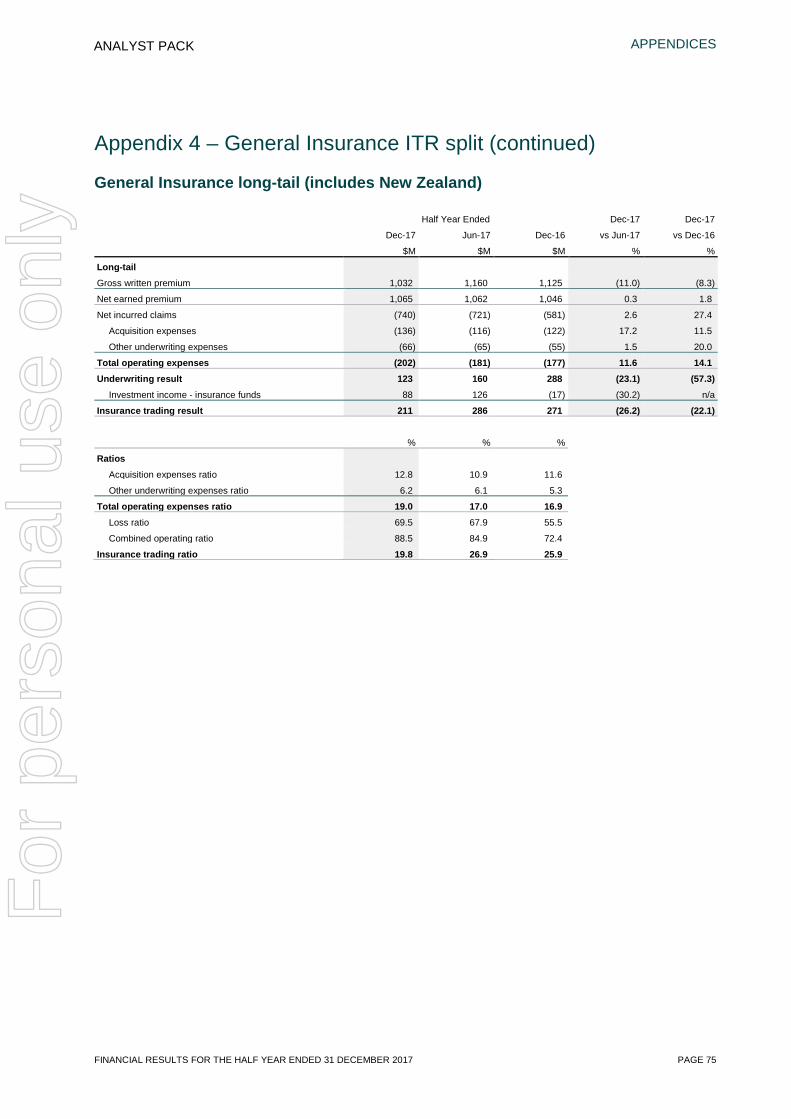
APPENDICES
FINANCIAL RESULTS FOR THE HALF YEAR ENDED 31 DECEMBER 2017 PAGE 75
ANALYST PACK
Appendix 4 – General Insurance ITR split (continued)
General Insurance long-tail (includes New Zealand)
Half Year Ended Dec-17 Dec-17
Dec-17 Jun-17 Dec-16 vs Jun-17 vs Dec-16
$M $M $M % %
Long-tail
Gross written premium 1,032 1,160 1,125 (11.0) (8.3)
Net earned premium 1,065 1,062 1,046 0.3 1.8
Net incurred claims (740) (721) (581) 2.6 27.4
Acquisition expenses (136) (116) (122) 17.2 11.5
Other underwriting expenses (66) (65) (55) 1.5 20.0
Total operating expenses (202) (181) (177) 11.6 14.1 Underwriting result 123 160 288 (23.1) (57.3)
Investment income - insurance funds 88 126 (17) (30.2) n/a
Insurance trading result 211 286 271 (26.2) (22.1)
% % %
Ratios
Acquisition expenses ratio 12.8 10.9 11.6
Other underwriting expenses ratio 6.2 6.1 5.3
Total operating expenses ratio 19.0 17.0 16.9
Loss ratio 69.5 67.9 55.5
Combined operating ratio 88.5 84.9 72.4
Insurance trading ratio 19.8 26.9 25.9
For
per
sona
l use
onl
y
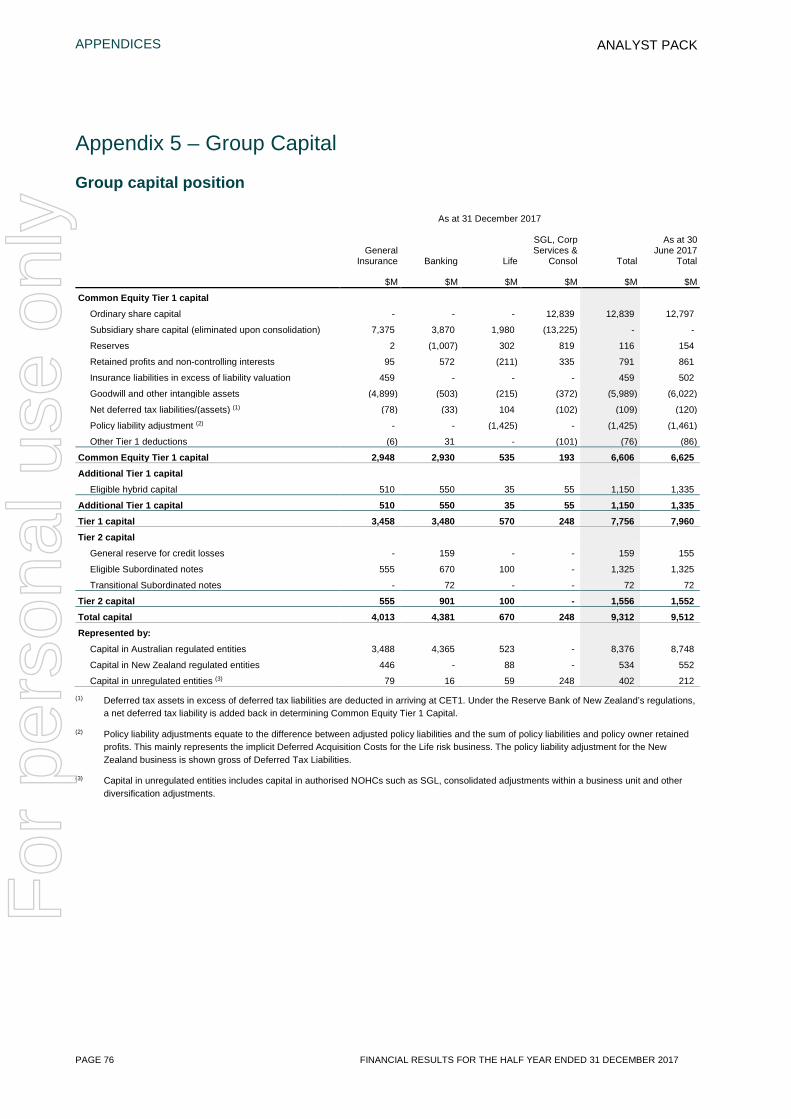
APPENDICES
PAGE 76 FINANCIAL RESULTS FOR THE HALF YEAR ENDED 31 DECEMBER 2017
ANALYST PACK
Appendix 5 – Group Capital
Group capital position
As at 31 December 2017
As at 30 June 2017
Total General
Insurance Banking Life
SGL, Corp Services &
Consol Total
$M $M $M $M $M $M
Common Equity Tier 1 capital
Ordinary share capital - - - 12,839 12,839 12,797
Subsidiary share capital (eliminated upon consolidation) 7,375 3,870 1,980 (13,225) - -
Reserves 2 (1,007) 302 819 116 154
Retained profits and non-controlling interests 95 572 (211) 335 791 861
Insurance liabilities in excess of liability valuation 459 - - - 459 502
Goodwill and other intangible assets (4,899) (503) (215) (372) (5,989) (6,022)
Net deferred tax liabilities/(assets) (1) (78) (33) 104 (102) (109) (120)
Policy liability adjustment (2) - - (1,425) - (1,425) (1,461)
Other Tier 1 deductions (6) 31 - (101) (76) (86)
Common Equity Tier 1 capital 2,948 2,930 535 193 6,606 6,625 Additional Tier 1 capital
Eligible hybrid capital 510 550 35 55 1,150 1,335
Additional Tier 1 capital 510 550 35 55 1,150 1,335 Tier 1 capital 3,458 3,480 570 248 7,756 7,960 Tier 2 capital
General reserve for credit losses - 159 - - 159 155
Eligible Subordinated notes 555 670 100 - 1,325 1,325
Transitional Subordinated notes - 72 - - 72 72
Tier 2 capital 555 901 100 - 1,556 1,552 Total capital 4,013 4,381 670 248 9,312 9,512 Represented by:
Capital in Australian regulated entities 3,488 4,365 523 - 8,376 8,748
Capital in New Zealand regulated entities 446 - 88 - 534 552
Capital in unregulated entities (3) 79 16 59 248 402 212
(1) Deferred tax assets in excess of deferred tax liabilities are deducted in arriving at CET1. Under the Reserve Bank of New Zealand’s regulations, a net deferred tax liability is added back in determining Common Equity Tier 1 Capital.
(2) Policy liability adjustments equate to the difference between adjusted policy liabilities and the sum of policy liabilities and policy owner retained profits. This mainly represents the implicit Deferred Acquisition Costs for the Life risk business. The policy liability adjustment for the New Zealand business is shown gross of Deferred Tax Liabilities.
(3) Capital in unregulated entities includes capital in authorised NOHCs such as SGL, consolidated adjustments within a business unit and other diversification adjustments.
For
per
sona
l use
onl
y
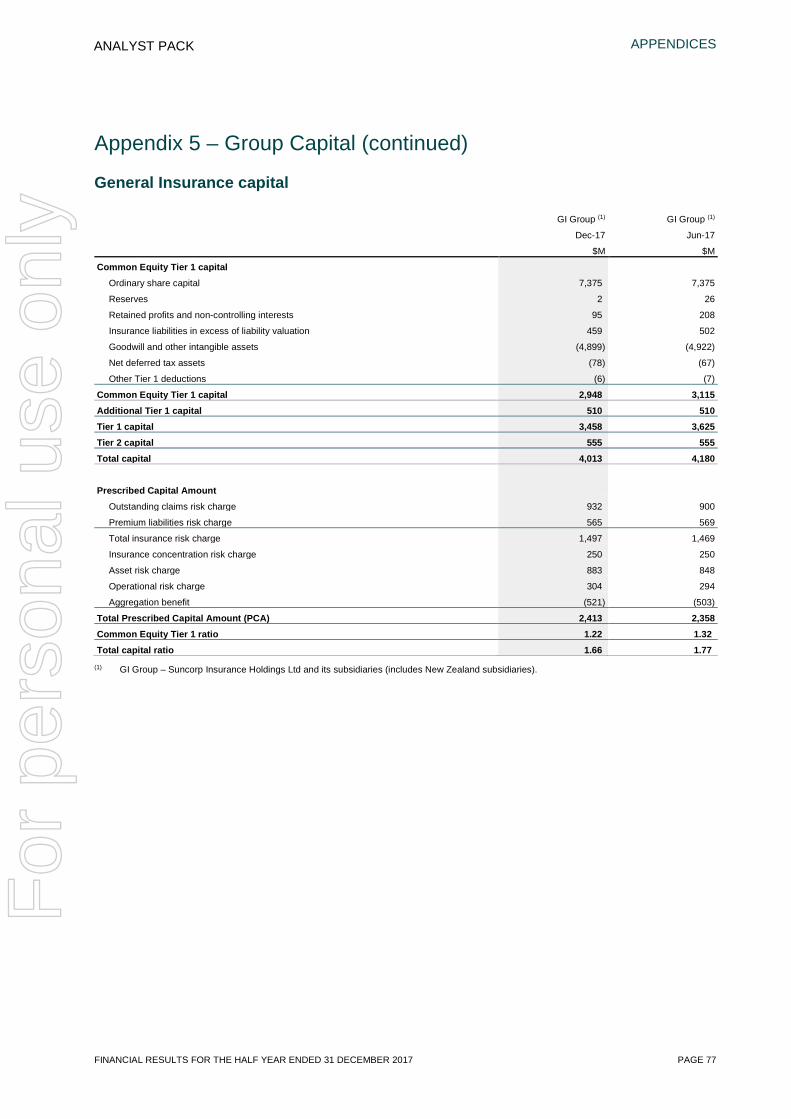
APPENDICES
FINANCIAL RESULTS FOR THE HALF YEAR ENDED 31 DECEMBER 2017 PAGE 77
ANALYST PACK
Appendix 5 – Group Capital (continued)
General Insurance capital
GI Group (1) GI Group (1)
Dec-17 Jun-17
$M $M
Common Equity Tier 1 capital
Ordinary share capital 7,375 7,375
Reserves 2 26
Retained profits and non-controlling interests 95 208
Insurance liabilities in excess of liability valuation 459 502
Goodwill and other intangible assets (4,899) (4,922)
Net deferred tax assets (78) (67)
Other Tier 1 deductions (6) (7)
Common Equity Tier 1 capital 2,948 3,115 Additional Tier 1 capital 510 510 Tier 1 capital 3,458 3,625 Tier 2 capital 555 555 Total capital 4,013 4,180
Prescribed Capital Amount Outstanding claims risk charge 932 900
Premium liabilities risk charge 565 569
Total insurance risk charge 1,497 1,469
Insurance concentration risk charge 250 250
Asset risk charge 883 848
Operational risk charge 304 294
Aggregation benefit (521) (503)
Total Prescribed Capital Amount (PCA) 2,413 2,358 Common Equity Tier 1 ratio 1.22 1.32 Total capital ratio 1.66 1.77
(1) GI Group – Suncorp Insurance Holdings Ltd and its subsidiaries (includes New Zealand subsidiaries).
For
per
sona
l use
onl
y

APPENDICES
PAGE 78 FINANCIAL RESULTS FOR THE HALF YEAR ENDED 31 DECEMBER 2017
ANALYST PACK
Appendix 5 – Group Capital (continued)
Bank capital
Regulatory Banking Group Other Entities Statutory Banking
Group Statutory Banking
Group
Dec-17 Dec-17 Dec-17 Jun-17
$M $M $M $M
Common Equity Tier 1 capital
Ordinary share capital 2,648 1,222 3,870 3,870
Reserves (20) (987) (1,007) (1,003)
Retained profits 551 21 572 591
Goodwill and other intangible assets (263) (240) (503) (486)
Net deferred tax assets (33) - (33) (38)
Other Tier 1 deductions 31 - 31 29
Common Equity Tier 1 capital 2,914 16 2,930 2,963
Additional Tier 1 capital
Eligible hybrid capital 550 - 550 825
Additional Tier 1 capital 550 - 550 825
Tier 1 capital 3,464 16 3,480 3,788
Tier 2 capital
General reserve for credit losses 159 - 159 155
Eligible Subordinated notes 670 - 670 670
Transitional Subordinated notes 72 - 72 72
Tier 2 capital 901 - 901 897
Total capital 4,365 16 4,381 4,685
Risk-Weighted Assets
Credit risk 29,019 - 29,019 28,621
Market risk 70 - 70 62
Operational risk 3,441 - 3,441 3,424
Total Risk-Weighted Assets 32,530 - 32,530 32,107
Common Equity Tier 1 ratio 8.96% 9.01% 9.23%
Total capital ratio 13.42% 13.47% 14.59%
For
per
sona
l use
onl
y
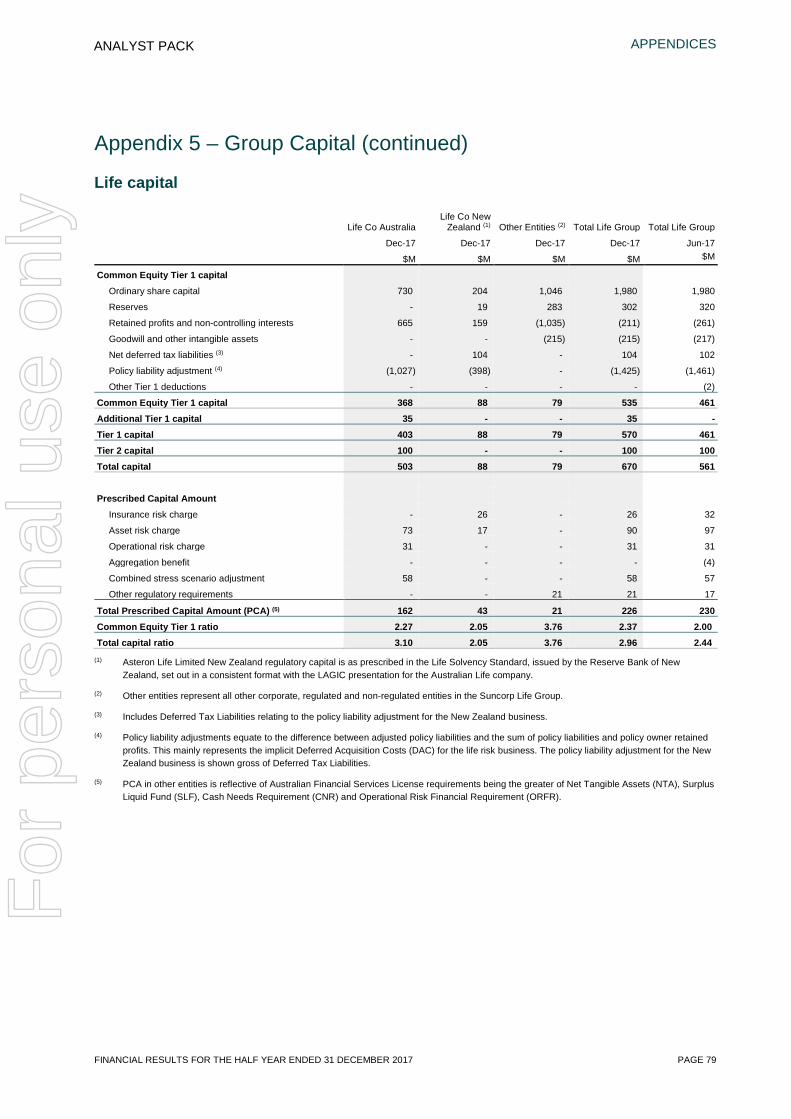
APPENDICES
FINANCIAL RESULTS FOR THE HALF YEAR ENDED 31 DECEMBER 2017 PAGE 79
ANALYST PACK
Appendix 5 – Group Capital (continued)
Life capital
Life Co Australia Life Co New
Zealand (1) Other Entities (2) Total Life Group Total Life Group
Dec-17 Dec-17 Dec-17 Dec-17 Jun-17
$M $M $M $M $M
Common Equity Tier 1 capital
Ordinary share capital 730 204 1,046 1,980 1,980
Reserves - 19 283 302 320
Retained profits and non-controlling interests 665 159 (1,035) (211) (261)
Goodwill and other intangible assets - - (215) (215) (217)
Net deferred tax liabilities (3) - 104 - 104 102
Policy liability adjustment (4) (1,027) (398) - (1,425) (1,461)
Other Tier 1 deductions - - - - (2)
Common Equity Tier 1 capital 368 88 79 535 461 Additional Tier 1 capital 35 - - 35 - Tier 1 capital 403 88 79 570 461 Tier 2 capital 100 - - 100 100 Total capital 503 88 79 670 561 Prescribed Capital Amount
Insurance risk charge - 26 - 26 32
Asset risk charge 73 17 - 90 97
Operational risk charge 31 - - 31 31
Aggregation benefit - - - - (4)
Combined stress scenario adjustment 58 - - 58 57
Other regulatory requirements - - 21 21 17
Total Prescribed Capital Amount (PCA) (5) 162 43 21 226 230 Common Equity Tier 1 ratio 2.27 2.05 3.76 2.37 2.00 Total capital ratio 3.10 2.05 3.76 2.96 2.44
(1) Asteron Life Limited New Zealand regulatory capital is as prescribed in the Life Solvency Standard, issued by the Reserve Bank of New Zealand, set out in a consistent format with the LAGIC presentation for the Australian Life company.
(2) Other entities represent all other corporate, regulated and non-regulated entities in the Suncorp Life Group.
(3) Includes Deferred Tax Liabilities relating to the policy liability adjustment for the New Zealand business.
(4) Policy liability adjustments equate to the difference between adjusted policy liabilities and the sum of policy liabilities and policy owner retained profits. This mainly represents the implicit Deferred Acquisition Costs (DAC) for the life risk business. The policy liability adjustment for the New Zealand business is shown gross of Deferred Tax Liabilities.
(5) PCA in other entities is reflective of Australian Financial Services License requirements being the greater of Net Tangible Assets (NTA), Surplus Liquid Fund (SLF), Cash Needs Requirement (CNR) and Operational Risk Financial Requirement (ORFR).
For
per
sona
l use
onl
y
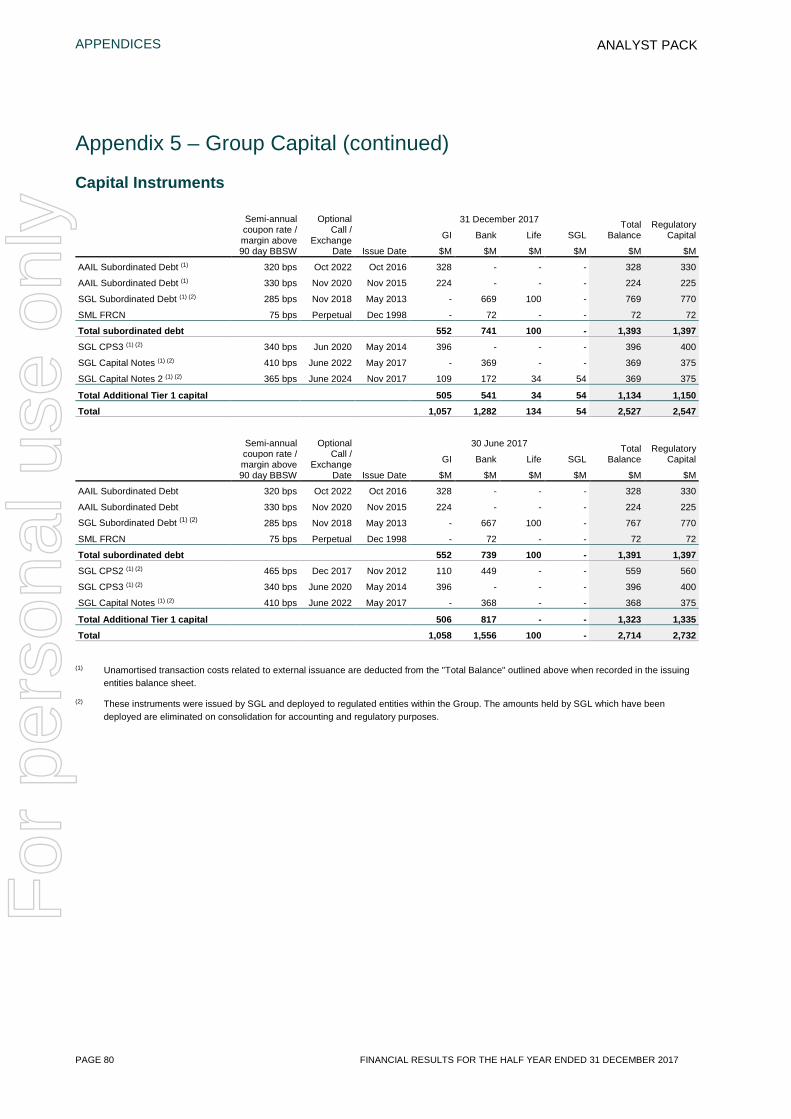
APPENDICES
PAGE 80 FINANCIAL RESULTS FOR THE HALF YEAR ENDED 31 DECEMBER 2017
ANALYST PACK
Appendix 5 – Group Capital (continued)
Capital Instruments
Semi-annual coupon rate / margin above 90 day BBSW
Optional Call /
Exchange Date Issue Date
31 December 2017 Total Balance
Regulatory Capital GI Bank Life SGL
$M $M $M $M $M $M
AAIL Subordinated Debt (1) 320 bps Oct 2022 Oct 2016 328 - - - 328 330
AAIL Subordinated Debt (1) 330 bps Nov 2020 Nov 2015 224 - - - 224 225
SGL Subordinated Debt (1) (2) 285 bps Nov 2018 May 2013 - 669 100 - 769 770
SML FRCN 75 bps Perpetual Dec 1998 - 72 - - 72 72
Total subordinated debt 552 741 100 - 1,393 1,397 SGL CPS3 (1) (2) 340 bps Jun 2020 May 2014 396 - - - 396 400
SGL Capital Notes (1) (2) 410 bps June 2022 May 2017 - 369 - - 369 375
SGL Capital Notes 2 (1) (2) 365 bps June 2024 Nov 2017 109 172 34 54 369 375
Total Additional Tier 1 capital 505 541 34 54 1,134 1,150 Total 1,057 1,282 134 54 2,527 2,547 Semi-annual
coupon rate / margin above 90 day BBSW
Optional Call /
Exchange Date Issue Date
30 June 2017 Total Balance
Regulatory Capital GI Bank Life SGL
$M $M $M $M $M $M
AAIL Subordinated Debt 320 bps Oct 2022 Oct 2016 328 - - - 328 330
AAIL Subordinated Debt 330 bps Nov 2020 Nov 2015 224 - - - 224 225
SGL Subordinated Debt (1) (2) 285 bps Nov 2018 May 2013 - 667 100 - 767 770
SML FRCN 75 bps Perpetual Dec 1998 - 72 - - 72 72
Total subordinated debt 552 739 100 - 1,391 1,397 SGL CPS2 (1) (2) 465 bps Dec 2017 Nov 2012 110 449 - - 559 560
SGL CPS3 (1) (2) 340 bps June 2020 May 2014 396 - - - 396 400
SGL Capital Notes (1) (2) 410 bps June 2022 May 2017 - 368 - - 368 375
Total Additional Tier 1 capital 506 817 - - 1,323 1,335 Total 1,058 1,556 100 - 2,714 2,732
(1) Unamortised transaction costs related to external issuance are deducted from the "Total Balance" outlined above when recorded in the issuing entities balance sheet.
(2) These instruments were issued by SGL and deployed to regulated entities within the Group. The amounts held by SGL which have been deployed are eliminated on consolidation for accounting and regulatory purposes.
For
per
sona
l use
onl
y

APPENDICES
FINANCIAL RESULTS FOR THE HALF YEAR ENDED 31 DECEMBER 2017 PAGE 81
ANALYST PACK
Appendix 6 – Life Embedded Value (includes New Zealand and other) The EV is the sum of the net present value of all future cash flows distributable to shareholders that are expected to arise from in-force business, the value of franking credits at 70% of face value and the net assets in excess of target capital requirements (adjusted net worth). The EV differs from what is known as an Appraisal Value, as it does not consider the value of future new business that Suncorp Life is expected to write.
There has been a change to the capital assumptions, resulting in a slower run-off pattern and therefore a reduced EV.
The components of value are shown in the table below:
Embedded Value
Half Year Ended Dec-17 Dec-17
Dec-17 Jun-17 Dec-16 vs Jun-17 vs Dec-16
$M $M $M % %
Adjusted net worth 203 86 132 136.0 53.8 Value of distributable profits 1,637 1,647 1,670 (0.6) (2.0)
Value of imputation credits 214 228 234 (6.1) (8.5)
Value of in-force 1,851 1,875 1,904 (1.3) (2.8) Traditional Embedded Value 2,054 1,961 2,036 4.7 0.9
Change in Embedded Value
Jun-17 to Dec-17
$M
Opening Embedded Value 1,961 Expected return 63 Experience and future assumption changes
Discount rate and FX (15)
Other (1) 20
Closing Embedded Value prior to 2,029 Dividends / transfers (2) 34
Release of franking credits (9)
Closing Embedded Value 2,054
(1) Other include assumption changes and new business. (2) Dividends/transfers include all dividends recommended or paid up to the parent company over the period.
Dec-17 Jun-17
$M $M
Base Embedded Value 2,054 1,961
Embedded Value assuming
Discount rate and returns 1% higher 2,047 1,926
Discount rate and returns 1% lower 2,062 1,997
Discontinuance rates 10% lower 2,247 2,153
Renewal expenses 10% lower 2,082 1,987
Claims 10% lower 2,263 2,177
For
per
sona
l use
onl
y

APPENDICES
PAGE 82 FINANCIAL RESULTS FOR THE HALF YEAR ENDED 31 DECEMBER 2017
ANALYST PACK
Appendix 6 – Life Embedded Value (includes New Zealand and other) (continued)
Assumptions
The assumptions used for valuing in-force business are based on long-term best estimate assumptions.
Lapses and claims (death and disability) assumptions are best estimate assumptions based on company experience and are consistent with those used for profit reporting.
Life risk assumptions (Australia)
Dec-17 Jun-17
% per annum % per annum
Investment return for underlying asset classes (gross of tax)
Risk-free rate (at 10 years) 2.7 2.7
Cash 2.0 2.7
Fixed interest 3.0 3.7
Australian equities (inc. allowance for franking credits) 6.7 6.7
International equities 7.0 7.0
Property 6.9 6.9
Investment returns (net of tax) 2.5 2.7 Inflation
Benefit indexation 2.5 2.5
Expense Inflation 2.5 2.5
Risk discount rate 6.7 6.7
Life risk assumptions (New Zealand)
Dec-17 Jun-17
% per annum % per annum
Investment return for underlying asset classes (gross of tax)
Risk-free rate (at 10 years) 3.7 3.8
Cash 3.2 3.3
Fixed interest 3.1 3.3
Australian equities (inc. allowance for franking credits) 7.4 7.5
International equities 6.4 6.5
Property 5.4 5.5
Investment returns (net of tax) 2.2 2.4 Inflation
Expense Inflation 2.3 2.3
Risk discount rate 6.8 7.0
For
per
sona
l use
onl
y
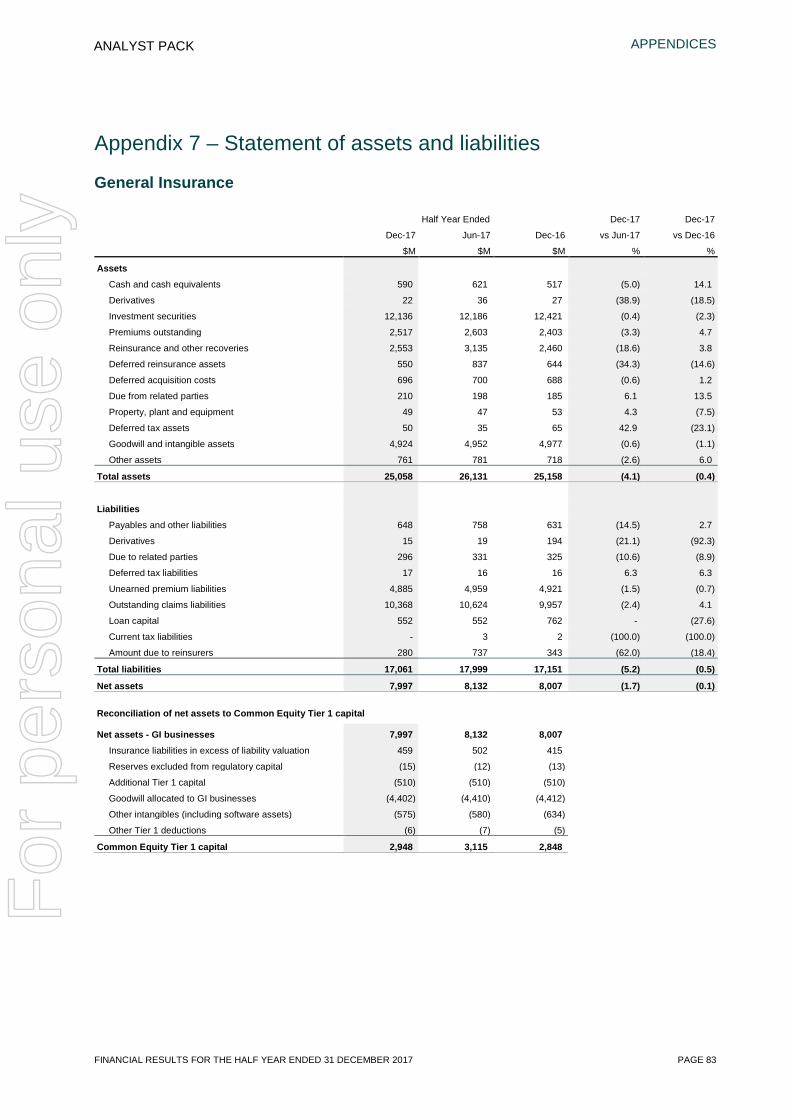
APPENDICES
FINANCIAL RESULTS FOR THE HALF YEAR ENDED 31 DECEMBER 2017 PAGE 83
ANALYST PACK
Appendix 7 – Statement of assets and liabilities
General Insurance
Half Year Ended Dec-17 Dec-17
Dec-17 Jun-17 Dec-16 vs Jun-17 vs Dec-16
$M $M $M % %
Assets
Cash and cash equivalents 590 621 517 (5.0) 14.1
Derivatives 22 36 27 (38.9) (18.5)
Investment securities 12,136 12,186 12,421 (0.4) (2.3)
Premiums outstanding 2,517 2,603 2,403 (3.3) 4.7
Reinsurance and other recoveries 2,553 3,135 2,460 (18.6) 3.8
Deferred reinsurance assets 550 837 644 (34.3) (14.6)
Deferred acquisition costs 696 700 688 (0.6) 1.2
Due from related parties 210 198 185 6.1 13.5
Property, plant and equipment 49 47 53 4.3 (7.5)
Deferred tax assets 50 35 65 42.9 (23.1)
Goodwill and intangible assets 4,924 4,952 4,977 (0.6) (1.1)
Other assets 761 781 718 (2.6) 6.0
Total assets 25,058 26,131 25,158 (4.1) (0.4)
Liabilities
Payables and other liabilities 648 758 631 (14.5) 2.7
Derivatives 15 19 194 (21.1) (92.3)
Due to related parties 296 331 325 (10.6) (8.9)
Deferred tax liabilities 17 16 16 6.3 6.3
Unearned premium liabilities 4,885 4,959 4,921 (1.5) (0.7)
Outstanding claims liabilities 10,368 10,624 9,957 (2.4) 4.1
Loan capital 552 552 762 - (27.6)
Current tax liabilities - 3 2 (100.0) (100.0)
Amount due to reinsurers 280 737 343 (62.0) (18.4)
Total liabilities 17,061 17,999 17,151 (5.2) (0.5)
Net assets 7,997 8,132 8,007 (1.7) (0.1)
Reconciliation of net assets to Common Equity Tier 1 capital Net assets - GI businesses 7,997 8,132 8,007
Insurance liabilities in excess of liability valuation 459 502 415
Reserves excluded from regulatory capital (15) (12) (13)
Additional Tier 1 capital (510) (510) (510)
Goodwill allocated to GI businesses (4,402) (4,410) (4,412)
Other intangibles (including software assets) (575) (580) (634)
Other Tier 1 deductions (6) (7) (5)
Common Equity Tier 1 capital 2,948 3,115 2,848
For
per
sona
l use
onl
y
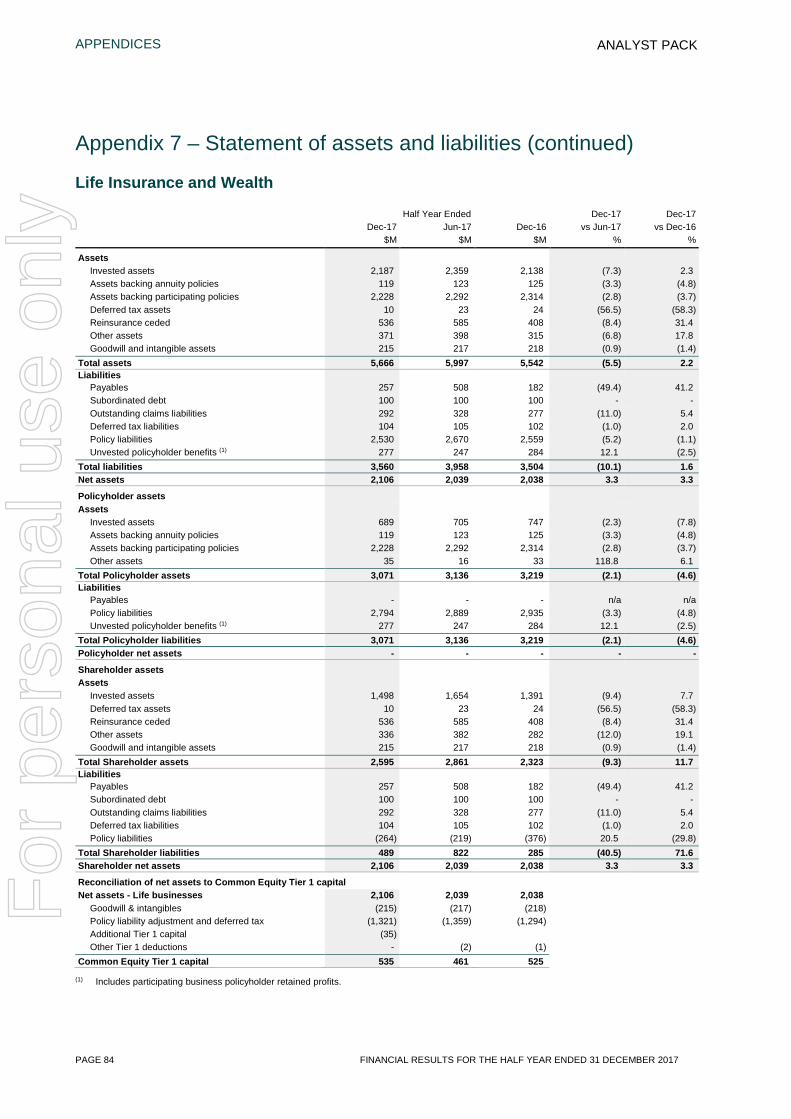
APPENDICES
PAGE 84 FINANCIAL RESULTS FOR THE HALF YEAR ENDED 31 DECEMBER 2017
ANALYST PACK
Appendix 7 – Statement of assets and liabilities (continued)
Life Insurance and Wealth
Half Year Ended Dec-17 Dec-17 Dec-17 Jun-17 Dec-16 vs Jun-17 vs Dec-16 $M $M $M % % Assets
Invested assets 2,187 2,359 2,138 (7.3) 2.3 Assets backing annuity policies 119 123 125 (3.3) (4.8) Assets backing participating policies 2,228 2,292 2,314 (2.8) (3.7) Deferred tax assets 10 23 24 (56.5) (58.3) Reinsurance ceded 536 585 408 (8.4) 31.4 Other assets 371 398 315 (6.8) 17.8 Goodwill and intangible assets 215 217 218 (0.9) (1.4)
Total assets 5,666 5,997 5,542 (5.5) 2.2 Liabilities
Payables 257 508 182 (49.4) 41.2 Subordinated debt 100 100 100 - - Outstanding claims liabilities 292 328 277 (11.0) 5.4 Deferred tax liabilities 104 105 102 (1.0) 2.0 Policy liabilities 2,530 2,670 2,559 (5.2) (1.1) Unvested policyholder benefits (1) 277 247 284 12.1 (2.5)
Total liabilities 3,560 3,958 3,504 (10.1) 1.6 Net assets 2,106 2,039 2,038 3.3 3.3 Policyholder assets Assets
Invested assets 689 705 747 (2.3) (7.8) Assets backing annuity policies 119 123 125 (3.3) (4.8) Assets backing participating policies 2,228 2,292 2,314 (2.8) (3.7) Other assets 35 16 33 118.8 6.1
Total Policyholder assets 3,071 3,136 3,219 (2.1) (4.6) Liabilities
Payables - - - n/a n/a Policy liabilities 2,794 2,889 2,935 (3.3) (4.8) Unvested policyholder benefits (1) 277 247 284 12.1 (2.5)
Total Policyholder liabilities 3,071 3,136 3,219 (2.1) (4.6) Policyholder net assets - - - - - Shareholder assets Assets
Invested assets 1,498 1,654 1,391 (9.4) 7.7 Deferred tax assets 10 23 24 (56.5) (58.3) Reinsurance ceded 536 585 408 (8.4) 31.4 Other assets 336 382 282 (12.0) 19.1 Goodwill and intangible assets 215 217 218 (0.9) (1.4)
Total Shareholder assets 2,595 2,861 2,323 (9.3) 11.7 Liabilities
Payables 257 508 182 (49.4) 41.2 Subordinated debt 100 100 100 - - Outstanding claims liabilities 292 328 277 (11.0) 5.4 Deferred tax liabilities 104 105 102 (1.0) 2.0 Policy liabilities (264) (219) (376) 20.5 (29.8)
Total Shareholder liabilities 489 822 285 (40.5) 71.6 Shareholder net assets 2,106 2,039 2,038 3.3 3.3 Reconciliation of net assets to Common Equity Tier 1 capital Net assets - Life businesses 2,106 2,039 2,038
Goodwill & intangibles (215) (217) (218) Policy liability adjustment and deferred tax (1,321) (1,359) (1,294) Additional Tier 1 capital (35) Other Tier 1 deductions - (2) (1)
Common Equity Tier 1 capital 535 461 525
(1) Includes participating business policyholder retained profits.
For
per
sona
l use
onl
y
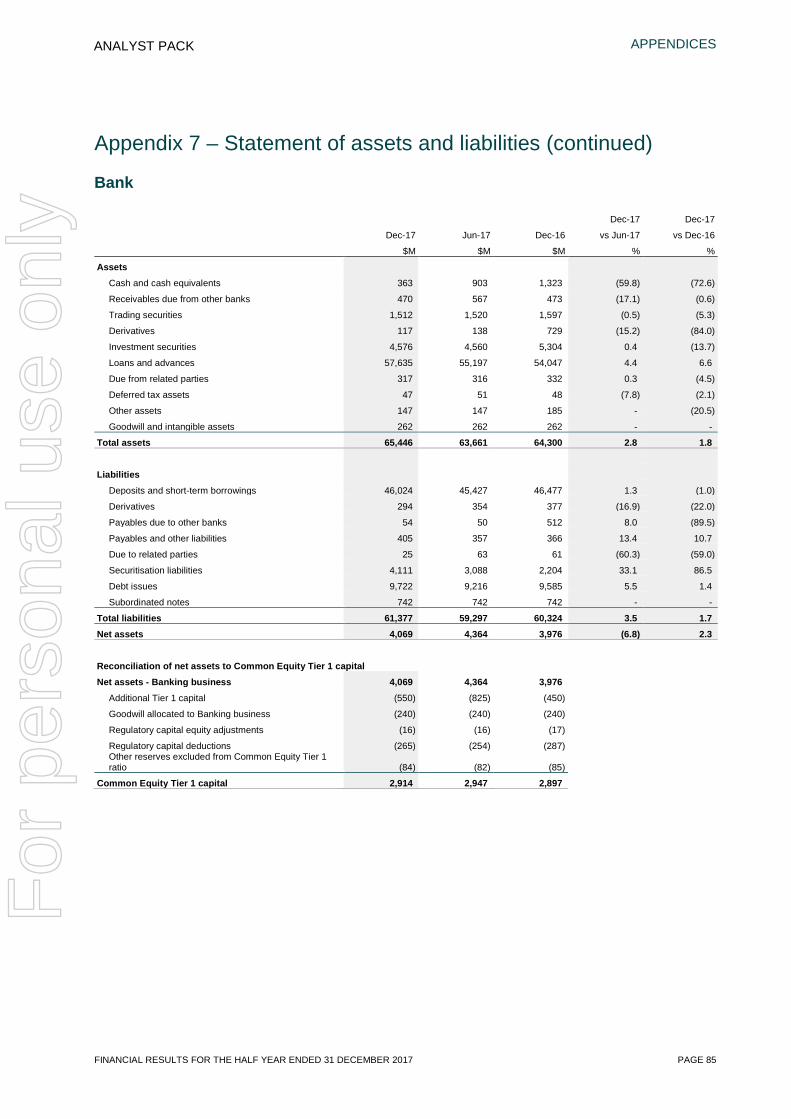
APPENDICES
FINANCIAL RESULTS FOR THE HALF YEAR ENDED 31 DECEMBER 2017 PAGE 85
ANALYST PACK
Appendix 7 – Statement of assets and liabilities (continued)
Bank
Dec-17 Dec-17
Dec-17 Jun-17 Dec-16 vs Jun-17 vs Dec-16
$M $M $M % %
Assets
Cash and cash equivalents 363 903 1,323 (59.8) (72.6)
Receivables due from other banks 470 567 473 (17.1) (0.6)
Trading securities 1,512 1,520 1,597 (0.5) (5.3)
Derivatives 117 138 729 (15.2) (84.0)
Investment securities 4,576 4,560 5,304 0.4 (13.7)
Loans and advances 57,635 55,197 54,047 4.4 6.6
Due from related parties 317 316 332 0.3 (4.5)
Deferred tax assets 47 51 48 (7.8) (2.1)
Other assets 147 147 185 - (20.5)
Goodwill and intangible assets 262 262 262 - -
Total assets 65,446 63,661 64,300 2.8 1.8
Liabilities
Deposits and short-term borrowings 46,024 45,427 46,477 1.3 (1.0)
Derivatives 294 354 377 (16.9) (22.0)
Payables due to other banks 54 50 512 8.0 (89.5)
Payables and other liabilities 405 357 366 13.4 10.7
Due to related parties 25 63 61 (60.3) (59.0)
Securitisation liabilities 4,111 3,088 2,204 33.1 86.5
Debt issues 9,722 9,216 9,585 5.5 1.4
Subordinated notes 742 742 742 - -
Total liabilities 61,377 59,297 60,324 3.5 1.7 Net assets 4,069 4,364 3,976 (6.8) 2.3
Reconciliation of net assets to Common Equity Tier 1 capital
Net assets - Banking business 4,069 4,364 3,976
Additional Tier 1 capital (550) (825) (450)
Goodwill allocated to Banking business (240) (240) (240)
Regulatory capital equity adjustments (16) (16) (17)
Regulatory capital deductions (265) (254) (287)
Other reserves excluded from Common Equity Tier 1 ratio (84) (82) (85)
Common Equity Tier 1 capital 2,914 2,947 2,897
For
per
sona
l use
onl
y
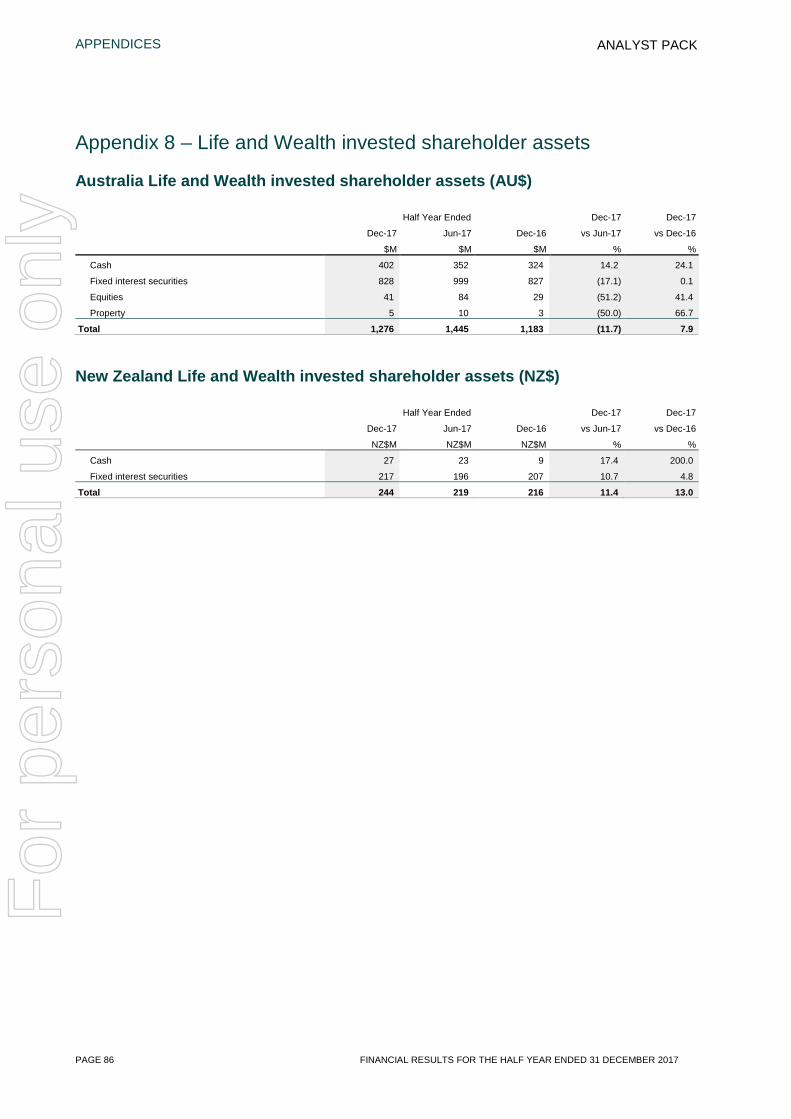
APPENDICES
PAGE 86 FINANCIAL RESULTS FOR THE HALF YEAR ENDED 31 DECEMBER 2017
ANALYST PACK
Appendix 8 – Life and Wealth invested shareholder assets
Australia Life and Wealth invested shareholder assets (AU$)
Half Year Ended Dec-17 Dec-17
Dec-17 Jun-17 Dec-16 vs Jun-17 vs Dec-16
$M $M $M % %
Cash 402 352 324 14.2 24.1
Fixed interest securities 828 999 827 (17.1) 0.1
Equities 41 84 29 (51.2) 41.4
Property 5 10 3 (50.0) 66.7
Total 1,276 1,445 1,183 (11.7) 7.9
New Zealand Life and Wealth invested shareholder assets (NZ$)
Half Year Ended Dec-17 Dec-17
Dec-17 Jun-17 Dec-16 vs Jun-17 vs Dec-16
NZ$M NZ$M NZ$M % %
Cash 27 23 9 17.4 200.0
Fixed interest securities 217 196 207 10.7 4.8
Total 244 219 216 11.4 13.0
For
per
sona
l use
onl
y

APPENDICES
FINANCIAL RESULTS FOR THE HALF YEAR ENDED 31 DECEMBER 2017 PAGE 87
ANALYST PACK
Appendix 9 – Definitions Acquisition expense ratio – general insurance
Acquisition expenses expressed as a percentage of net earned premium
Acquisition expense ratio – life insurance Acquisition expenses, including upfront commissions, as a percentage of new business
ADI Authorised Deposit-taking Institution
Annuities market adjustments The value of annuity obligations are determined by discounting future obligations into today’s dollars using risk-free rates. The value of such obligations fluctuates as market referenced discount rates change. The value of assets backing annuity obligations also fluctuates with investment markets. The net impact of both of these market-driven valuation changes are removed from the Life Insurance underlying profit and recorded as annuity market adjustments
APRA Australian Prudential Regulation Authority
Banking & Wealth function Suncorp's Banking & Wealth business provides banking and wealth solutions to personal, small to medium enterprise and agribusiness customers
Basis points (bps) A ‘basis point’ is 1/100th of a percentage point
Business Improvement Program (BIP) A three-year, company-wide program focusing on five streams of work including digitising of customer experiences, sales and service channel optimisation, end-to-end process improvement, claims supply chain re-design and smarter procurement and streamlining the business
Cash earnings Net profit after tax adjusted for the amortisation of acquisition intangible assets, the profit or loss on divestments and their tax effect
Cash earnings per share Basic: cash earnings divided by the weighted average number of ordinary shares (net of treasury shares) outstanding during the period
Diluted: cash earnings adjusted for consequential changes in income or expenses associated with the dilutive potential ordinary shares divided by the weighted average number of diluted shares (net of treasury shares) outstanding during the period
Cash return on average shareholders' equity
Cash earnings divided by average equity attributable to owners of the Company. Averages are based on monthly balances over the period. The ratio is annualised for half years
Cash return on average shareholders' equity pre-goodwill
Cash earnings divided by average equity attributable to owners of the Company less goodwill. Averages are based on monthly balances over the period. The ratio is annualised for half years
Claims Handling Expenses (CHE) Costs incurred in the investigation, assessment and settlement of a claim
Combined operating ratio The percentage of net earned premium that is used to meet the costs of all claims incurred plus pay the costs of acquiring (including commission), writing and servicing the General Insurance business
Commercial Insurance Commercial products consist of commercial motor insurance, commercial property insurance, marine insurance, industrial special risk insurance, and public liability and professional indemnity insurance
Common Equity Tier 1 (CET1) Common Equity Tier 1 Capital comprises accounting equity plus adjustments for intangible assets and regulatory reserves
Common Equity Tier 1 Ratio Common Equity Tier 1 divided by the Prescribed Capital Amount for Life and General Insurance, or total risk-weighted assets for the Bank
Connected customers A customer is considered to be connected if they have two or more needs met across the need categories of Home, Self, Mobility and Money, or if they hold four or more Suncorp products
Consumer Insurance Consumer Insurance products consist of home and contents insurance, motor insurance, boat insurance, and travel insurance
Cost to income ratio Operating expenses of the Banking business divided by total income from Banking activities
Credit risk-weighted assets Total of the carrying value of each asset class multiplied by their assigned risk weighting, as defined by APRA
Deferred acquisition costs (DAC) The portion of acquisition costs not yet expensed on the basis that it can be reliably measured and it is probable that it will give rise to premium revenue that will be brought to account in subsequent financial periods
Deposit to loan ratio Total retail deposits divided by total loans and advances, excluding other receivables
For
per
sona
l use
onl
y
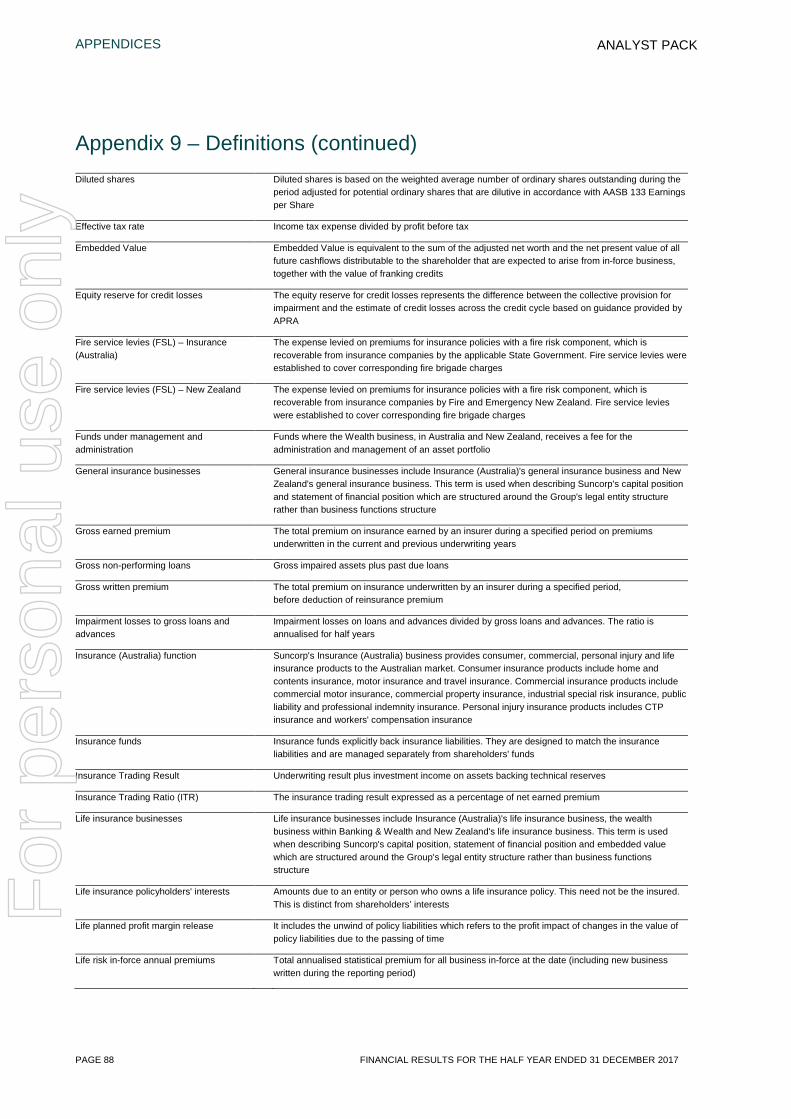
APPENDICES
PAGE 88 FINANCIAL RESULTS FOR THE HALF YEAR ENDED 31 DECEMBER 2017
ANALYST PACK
Appendix 9 – Definitions (continued) Diluted shares Diluted shares is based on the weighted average number of ordinary shares outstanding during the
period adjusted for potential ordinary shares that are dilutive in accordance with AASB 133 Earnings per Share
Effective tax rate Income tax expense divided by profit before tax
Embedded Value Embedded Value is equivalent to the sum of the adjusted net worth and the net present value of all future cashflows distributable to the shareholder that are expected to arise from in-force business, together with the value of franking credits
Equity reserve for credit losses The equity reserve for credit losses represents the difference between the collective provision for impairment and the estimate of credit losses across the credit cycle based on guidance provided by APRA
Fire service levies (FSL) – Insurance (Australia)
The expense levied on premiums for insurance policies with a fire risk component, which is recoverable from insurance companies by the applicable State Government. Fire service levies were established to cover corresponding fire brigade charges
Fire service levies (FSL) – New Zealand The expense levied on premiums for insurance policies with a fire risk component, which is recoverable from insurance companies by Fire and Emergency New Zealand. Fire service levies were established to cover corresponding fire brigade charges
Funds under management and administration
Funds where the Wealth business, in Australia and New Zealand, receives a fee for the administration and management of an asset portfolio
General insurance businesses General insurance businesses include Insurance (Australia)'s general insurance business and New Zealand's general insurance business. This term is used when describing Suncorp's capital position and statement of financial position which are structured around the Group's legal entity structure rather than business functions structure
Gross earned premium The total premium on insurance earned by an insurer during a specified period on premiums underwritten in the current and previous underwriting years
Gross non-performing loans Gross impaired assets plus past due loans
Gross written premium The total premium on insurance underwritten by an insurer during a specified period, before deduction of reinsurance premium
Impairment losses to gross loans and advances
Impairment losses on loans and advances divided by gross loans and advances. The ratio is annualised for half years
Insurance (Australia) function Suncorp's Insurance (Australia) business provides consumer, commercial, personal injury and life insurance products to the Australian market. Consumer insurance products include home and contents insurance, motor insurance and travel insurance. Commercial insurance products include commercial motor insurance, commercial property insurance, industrial special risk insurance, public liability and professional indemnity insurance. Personal injury insurance products includes CTP insurance and workers' compensation insurance
Insurance funds Insurance funds explicitly back insurance liabilities. They are designed to match the insurance liabilities and are managed separately from shareholders' funds
Insurance Trading Result Underwriting result plus investment income on assets backing technical reserves
Insurance Trading Ratio (ITR) The insurance trading result expressed as a percentage of net earned premium
Life insurance businesses Life insurance businesses include Insurance (Australia)'s life insurance business, the wealth business within Banking & Wealth and New Zealand's life insurance business. This term is used when describing Suncorp's capital position, statement of financial position and embedded value which are structured around the Group's legal entity structure rather than business functions structure
Life insurance policyholders' interests Amounts due to an entity or person who owns a life insurance policy. This need not be the insured. This is distinct from shareholders’ interests
Life planned profit margin release It includes the unwind of policy liabilities which refers to the profit impact of changes in the value of policy liabilities due to the passing of time
Life risk in-force annual premiums Total annualised statistical premium for all business in-force at the date (including new business written during the reporting period)
For
per
sona
l use
onl
y
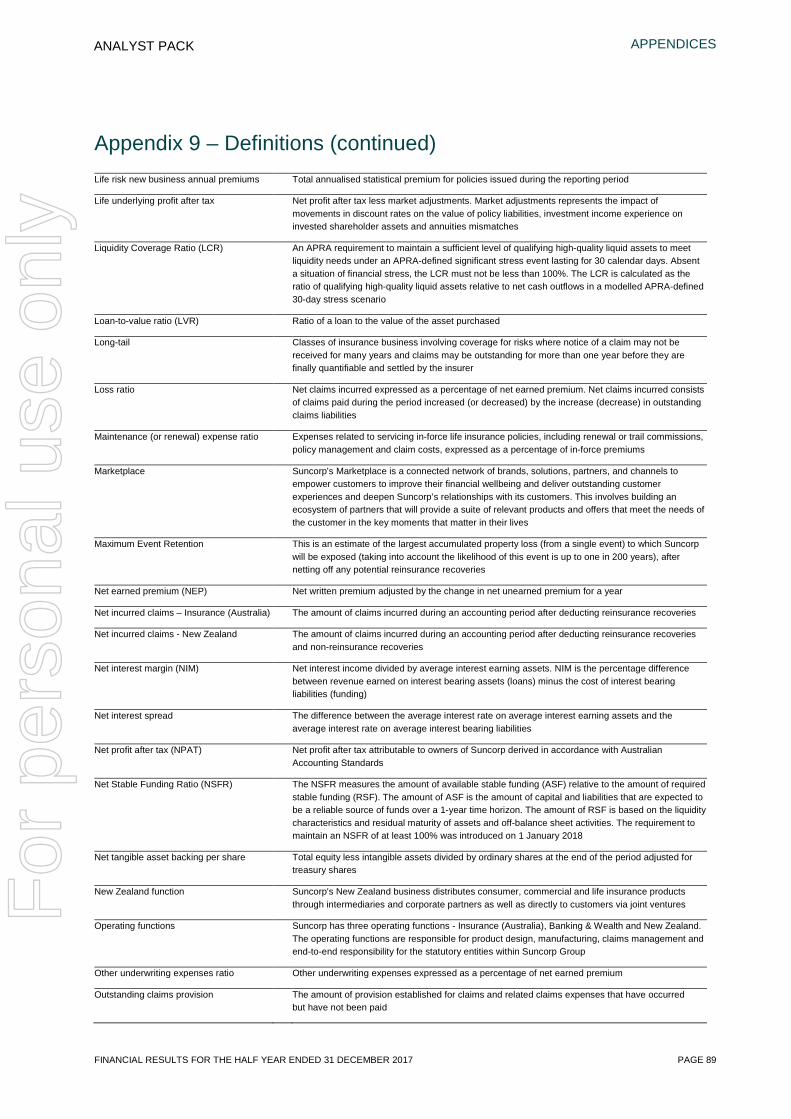
APPENDICES
FINANCIAL RESULTS FOR THE HALF YEAR ENDED 31 DECEMBER 2017 PAGE 89
ANALYST PACK
Appendix 9 – Definitions (continued) Life risk new business annual premiums Total annualised statistical premium for policies issued during the reporting period
Life underlying profit after tax Net profit after tax less market adjustments. Market adjustments represents the impact of movements in discount rates on the value of policy liabilities, investment income experience on invested shareholder assets and annuities mismatches
Liquidity Coverage Ratio (LCR) An APRA requirement to maintain a sufficient level of qualifying high-quality liquid assets to meet liquidity needs under an APRA-defined significant stress event lasting for 30 calendar days. Absent a situation of financial stress, the LCR must not be less than 100%. The LCR is calculated as the ratio of qualifying high-quality liquid assets relative to net cash outflows in a modelled APRA-defined 30-day stress scenario
Loan-to-value ratio (LVR) Ratio of a loan to the value of the asset purchased
Long-tail Classes of insurance business involving coverage for risks where notice of a claim may not be received for many years and claims may be outstanding for more than one year before they are finally quantifiable and settled by the insurer
Loss ratio Net claims incurred expressed as a percentage of net earned premium. Net claims incurred consists of claims paid during the period increased (or decreased) by the increase (decrease) in outstanding claims liabilities
Maintenance (or renewal) expense ratio Expenses related to servicing in-force life insurance policies, including renewal or trail commissions, policy management and claim costs, expressed as a percentage of in-force premiums
Marketplace Suncorp's Marketplace is a connected network of brands, solutions, partners, and channels to empower customers to improve their financial wellbeing and deliver outstanding customer experiences and deepen Suncorp’s relationships with its customers. This involves building an ecosystem of partners that will provide a suite of relevant products and offers that meet the needs of the customer in the key moments that matter in their lives
Maximum Event Retention This is an estimate of the largest accumulated property loss (from a single event) to which Suncorp will be exposed (taking into account the likelihood of this event is up to one in 200 years), after netting off any potential reinsurance recoveries
Net earned premium (NEP) Net written premium adjusted by the change in net unearned premium for a year
Net incurred claims – Insurance (Australia) The amount of claims incurred during an accounting period after deducting reinsurance recoveries
Net incurred claims - New Zealand The amount of claims incurred during an accounting period after deducting reinsurance recoveries and non-reinsurance recoveries
Net interest margin (NIM) Net interest income divided by average interest earning assets. NIM is the percentage difference between revenue earned on interest bearing assets (loans) minus the cost of interest bearing liabilities (funding)
Net interest spread The difference between the average interest rate on average interest earning assets and the average interest rate on average interest bearing liabilities
Net profit after tax (NPAT) Net profit after tax attributable to owners of Suncorp derived in accordance with Australian Accounting Standards
Net Stable Funding Ratio (NSFR) The NSFR measures the amount of available stable funding (ASF) relative to the amount of required stable funding (RSF). The amount of ASF is the amount of capital and liabilities that are expected to be a reliable source of funds over a 1-year time horizon. The amount of RSF is based on the liquidity characteristics and residual maturity of assets and off-balance sheet activities. The requirement to maintain an NSFR of at least 100% was introduced on 1 January 2018
Net tangible asset backing per share Total equity less intangible assets divided by ordinary shares at the end of the period adjusted for treasury shares
New Zealand function Suncorp's New Zealand business distributes consumer, commercial and life insurance products through intermediaries and corporate partners as well as directly to customers via joint ventures
Operating functions Suncorp has three operating functions - Insurance (Australia), Banking & Wealth and New Zealand. The operating functions are responsible for product design, manufacturing, claims management and end-to-end responsibility for the statutory entities within Suncorp Group
Other underwriting expenses ratio Other underwriting expenses expressed as a percentage of net earned premium
Outstanding claims provision The amount of provision established for claims and related claims expenses that have occurred but have not been paid
For
per
sona
l use
onl
y
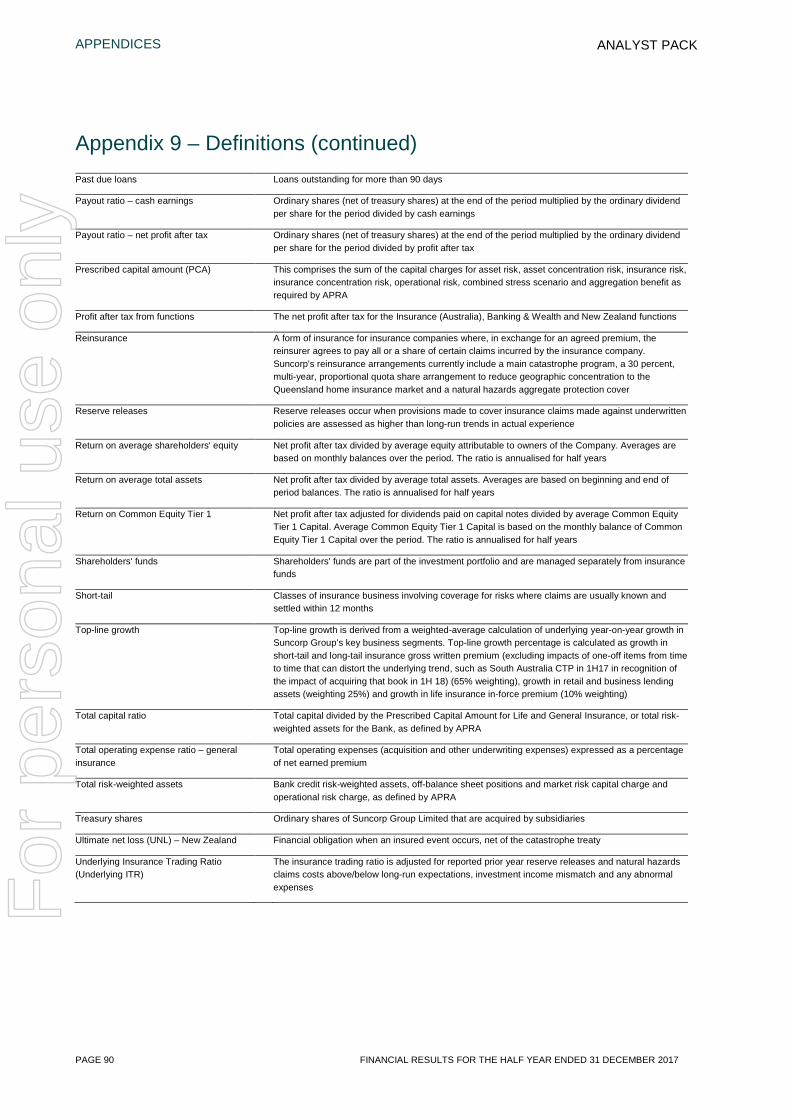
APPENDICES
PAGE 90 FINANCIAL RESULTS FOR THE HALF YEAR ENDED 31 DECEMBER 2017
ANALYST PACK
Appendix 9 – Definitions (continued)
Past due loans Loans outstanding for more than 90 days
Payout ratio – cash earnings Ordinary shares (net of treasury shares) at the end of the period multiplied by the ordinary dividend per share for the period divided by cash earnings
Payout ratio – net profit after tax Ordinary shares (net of treasury shares) at the end of the period multiplied by the ordinary dividend per share for the period divided by profit after tax
Prescribed capital amount (PCA) This comprises the sum of the capital charges for asset risk, asset concentration risk, insurance risk, insurance concentration risk, operational risk, combined stress scenario and aggregation benefit as required by APRA
Profit after tax from functions The net profit after tax for the Insurance (Australia), Banking & Wealth and New Zealand functions
Reinsurance A form of insurance for insurance companies where, in exchange for an agreed premium, the reinsurer agrees to pay all or a share of certain claims incurred by the insurance company. Suncorp's reinsurance arrangements currently include a main catastrophe program, a 30 percent, multi-year, proportional quota share arrangement to reduce geographic concentration to the Queensland home insurance market and a natural hazards aggregate protection cover
Reserve releases Reserve releases occur when provisions made to cover insurance claims made against underwritten policies are assessed as higher than long-run trends in actual experience
Return on average shareholders' equity Net profit after tax divided by average equity attributable to owners of the Company. Averages are based on monthly balances over the period. The ratio is annualised for half years
Return on average total assets Net profit after tax divided by average total assets. Averages are based on beginning and end of period balances. The ratio is annualised for half years
Return on Common Equity Tier 1 Net profit after tax adjusted for dividends paid on capital notes divided by average Common Equity Tier 1 Capital. Average Common Equity Tier 1 Capital is based on the monthly balance of Common Equity Tier 1 Capital over the period. The ratio is annualised for half years
Shareholders' funds Shareholders' funds are part of the investment portfolio and are managed separately from insurance funds
Short-tail Classes of insurance business involving coverage for risks where claims are usually known and settled within 12 months
Top-line growth Top-line growth is derived from a weighted-average calculation of underlying year-on-year growth in Suncorp Group’s key business segments. Top-line growth percentage is calculated as growth in short-tail and long-tail insurance gross written premium (excluding impacts of one-off items from time to time that can distort the underlying trend, such as South Australia CTP in 1H17 in recognition of the impact of acquiring that book in 1H 18) (65% weighting), growth in retail and business lending assets (weighting 25%) and growth in life insurance in-force premium (10% weighting)
Total capital ratio Total capital divided by the Prescribed Capital Amount for Life and General Insurance, or total risk-weighted assets for the Bank, as defined by APRA
Total operating expense ratio – general insurance
Total operating expenses (acquisition and other underwriting expenses) expressed as a percentage of net earned premium
Total risk-weighted assets Bank credit risk-weighted assets, off-balance sheet positions and market risk capital charge and operational risk charge, as defined by APRA
Treasury shares Ordinary shares of Suncorp Group Limited that are acquired by subsidiaries
Ultimate net loss (UNL) – New Zealand Financial obligation when an insured event occurs, net of the catastrophe treaty
Underlying Insurance Trading Ratio (Underlying ITR)
The insurance trading ratio is adjusted for reported prior year reserve releases and natural hazards claims costs above/below long-run expectations, investment income mismatch and any abnormal expenses
For
per
sona
l use
onl
y
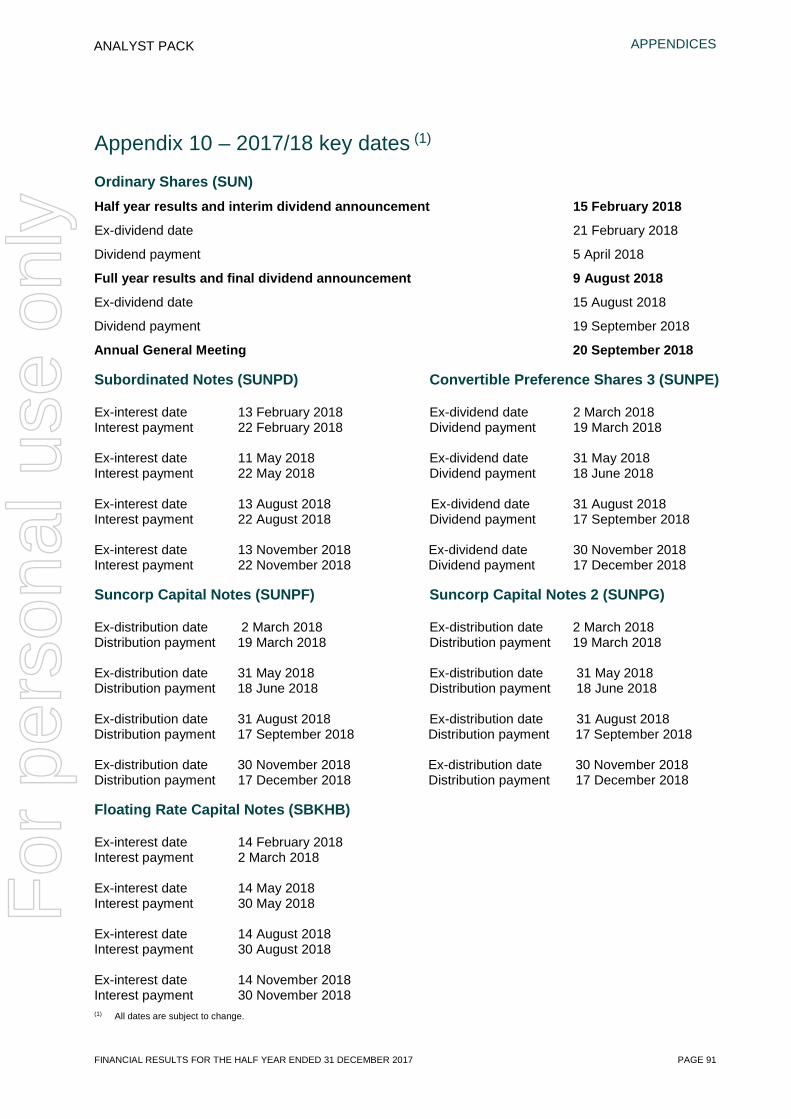
APPENDICES
FINANCIAL RESULTS FOR THE HALF YEAR ENDED 31 DECEMBER 2017 PAGE 91
ANALYST PACK
Appendix 10 – 2017/18 key dates (1)
Ordinary Shares (SUN) Half year results and interim dividend announcement 15 February 2018
Ex-dividend date 21 February 2018
Dividend payment 5 April 2018
Full year results and final dividend announcement 9 August 2018
Ex-dividend date 15 August 2018
Dividend payment 19 September 2018
Annual General Meeting 20 September 2018
Subordinated Notes (SUNPD) Convertible Preference Shares 3 (SUNPE)
Ex-interest date 13 February 2018 Ex-dividend date 2 March 2018 Interest payment 22 February 2018 Dividend payment 19 March 2018 Ex-interest date 11 May 2018 Ex-dividend date 31 May 2018 Interest payment 22 May 2018 Dividend payment 18 June 2018 Ex-interest date 13 August 2018 Ex-dividend date 31 August 2018 Interest payment 22 August 2018 Dividend payment 17 September 2018 Ex-interest date 13 November 2018 Ex-dividend date 30 November 2018 Interest payment 22 November 2018 Dividend payment 17 December 2018
Suncorp Capital Notes (SUNPF) Suncorp Capital Notes 2 (SUNPG)
Ex-distribution date 2 March 2018 Ex-distribution date 2 March 2018 Distribution payment 19 March 2018 Distribution payment 19 March 2018 Ex-distribution date 31 May 2018 Ex-distribution date 31 May 2018 Distribution payment 18 June 2018 Distribution payment 18 June 2018 Ex-distribution date 31 August 2018 Ex-distribution date 31 August 2018 Distribution payment 17 September 2018 Distribution payment 17 September 2018 Ex-distribution date 30 November 2018 Ex-distribution date 30 November 2018 Distribution payment 17 December 2018 Distribution payment 17 December 2018
Floating Rate Capital Notes (SBKHB)
Ex-interest date 14 February 2018 Interest payment 2 March 2018 Ex-interest date 14 May 2018 Interest payment 30 May 2018 Ex-interest date 14 August 2018 Interest payment 30 August 2018 Ex-interest date 14 November 2018 Interest payment 30 November 2018 (1) All dates are subject to change.
For
per
sona
l use
onl
y