for personal use only - asx · 27 october 2016 the manager, company announcements australian...
TRANSCRIPT

Horizon Oil Limited ABN 51 009 799 455 Level 6, 134 William Street, Woolloomooloo NSW Australia 2011
Tel +61 2 9332 5000, Fax +61 2 9332 5050 www.horizonoil.com.au
27 October 2016 The Manager, Company Announcements Australian Securities Exchange Limited Exchange Centre 20 Bridge Street Sydney NSW 2000
HORIZON OIL LIMITED 2016 ANNUAL REPORT AND NOTICE OF AGM
In accordance with Listing Rule 4.7, attached are copies of Horizon Oil Limited’s Annual Report for the year ended 30 June 2016 and the Notice of Annual General Meeting to be held on Tuesday 29 November 2016.
The Notice of Annual General Meeting will be sent to all shareholders. A printed copy of the 2016 Annual Report will be mailed to those shareholders who have made the election to receive it. Copies of these documents can be downloaded from the Company's website www.horizonoil.com.au.
The Annual General Meeting will also be available on live webcast. To register, please copy and paste the link below into your browser:
http://webcasting.boardroom.media/broadcast/57edc857cf09bc4a2cca6079
Yours faithfully,
Monika Fedorczyk Assistant Company Secretary For further information please contact: Ms Monika Fedorczyk Telephone: (+612) 9332 5000 Facsimile: (+612) 9332 5050 Email: [email protected] Or visit www.horizonoil.com.au
For
per
sona
l use
onl
y
ABN 51 009 799 455
Annual Report
2016
For
per
sona
l use
onl
y

2016 at a glance
1.31
1.35
1.43
0.50
0.44
90.6
91.4
94.8
101.5
116.1
1.35mmbbls
Maari Beibu
Maari Beibu
2P
2C
116.1mmboe
2P + 2C Reserves and Contingent Resources (mmboe)
Normalised for partial sale of
PNG interests to Osaka Gas
16
15
14
13
12
Net operating income after opex (incl. China Special Levy), excluding extraordinaries (US$m)
$52.2m
81.1
52.2
93.6
34.0
41.0
16
15
14
13
12
NZ China PNG Other
Exploration & Development Expenditure (US$m)
Production (mmbbls)
Revenue
(US$m)
$24.5m86.8
135.7
95.6
78.0
24.516
15
14
13
12
$76.0m
104.0
76.0
48.1
50.4
138.5
16
15
14
13
12
16
15
14
13
12
9.0 107.1
For
per
sona
l use
onl
y
Horizon Oil Annual Report 2016 1
2016 Highlights
2016 ContentsAreas of Operation
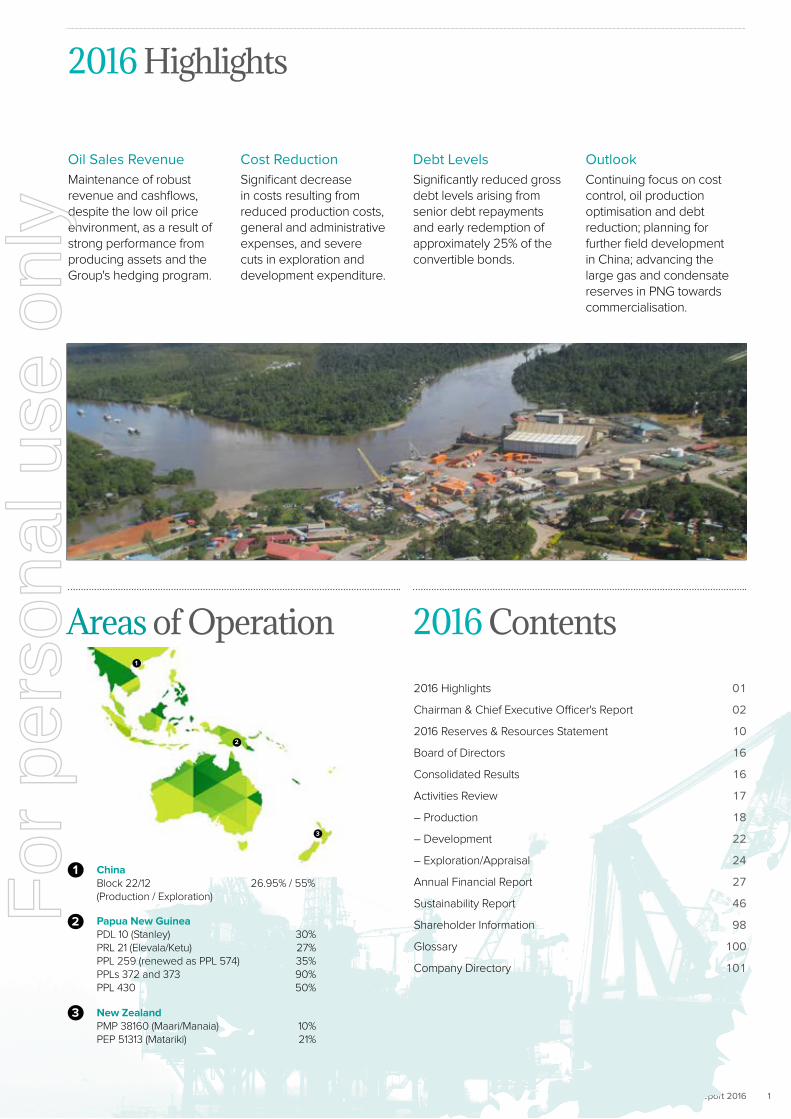
Oil Sales RevenueMaintenance of robust revenue and cashflows, despite the low oil price environment, as a result of strong performance from producing assets and the Group's hedging program.
Cost ReductionSignificant decrease in costs resulting from reduced production costs, general and administrative expenses, and severe cuts in exploration and development expenditure.
Debt LevelsSignificantly reduced gross debt levels arising from senior debt repayments and early redemption of approximately 25% of the convertible bonds.
OutlookContinuing focus on cost control, oil production optimisation and debt reduction; planning for further field development in China; advancing the large gas and condensate reserves in PNG towards commercialisation.
New ZealandPMP 38160 (Maari/Manaia) 10%PEP 51313 (Matariki) 21%
Papua New GuineaPDL 10 (Stanley) 30% PRL 21 (Elevala/Ketu) 27% PPL 259 (renewed as PPL 574) 35% PPLs 372 and 373 90%PPL 430 50%
ChinaBlock 22/12 26.95% / 55% (Production / Exploration)
2
3
1
2
3
1
2016 Highlights 01
Chairman & Chief Executive Officer's Report 02
2016 Reserves & Resources Statement 10
Board of Directors 16
Consolidated Results 16
Activities Review 17
– Production 18
– Development 22
– Exploration/Appraisal 24
Annual Financial Report 27
Sustainability Report 46
Shareholder Information 98
Glossary 100
Company Directory 101
For
per
sona
l use
onl
y

Horizon Oil Annual Report 20162
Chairman & Chief Executive Officer’s Report
John Humphrey Chairman
Brent Emmett Chief Executive Officer
Last year was a challenging one for the petroleum industry. Global oil prices fell sharply from levels of over US$100 per barrel in the first half of 2014 to US$50 in early 2015, reaching a low of less than US$30 in January 2016, before recovering to the current price of approximately US$50 per barrel.
Over the same period, Horizon Oil’s share price fell from 30 - 40 cents (Australian)
to approximately 4 cents today as institutional investors abandoned the sector.
Refinancing of Convertible Bonds
The effect of the aptly described “once-in-a-generation” collapse in oil prices
significantly impacted the Company’s ability to repay the US$80 million in
convertible bonds outstanding at the beginning of Financial Year 2016 and due
to be redeemed on 17 June 2016, subsequently extended with the consent
of shareholders to 19 September 2016. The low oil price resulted in less cash
generation, although this was partially mitigated by oil price hedging and, more
critically, Horizon Oil’s borrowing capacity under its senior debt facility, including
access to an additional “accordion” tranche, was severely reduced.
In response to this and in order to meet our obligations we embarked on a multi-
pronged approach to stabilising the Company’s financial position. The options
pursued included:
• Asset sale(s);
• Extension of the term of the existing convertible bonds with a re-set conversion
price;
• Issue of medium term notes;
• Securing of subordinated debt to supplement the senior debt; and
• Issue of new equity by way of a placement and/or a rights issue.
Pric
e (A
$)
HZN Share Price S&P/ASX 200 Energy Index (Rebased) Brent Crude Oil (Rebased)
Jan
-14
Ja
n-1
4
Fe
b-1
4
Ma
r-14
M
ar-
14
Ap
r-14
M
ay-
14
Ma
y-14
Ju
n-1
4
Jul-14
Ju
l-14
A
ug
-14
S
ep
-14
O
ct-1
4
Oct
-14
N
ov-
14
De
c-14
D
ec-
14
Jan
-15
F
eb
-15
F
eb
-15
M
ar-
15
Ap
r-15
A
pr-
15
Ma
y-15
Ju
n-1
5
Jul-15
Ju
l-15
A
ug
-15
S
ep
-15
S
ep
-15
O
ct-1
5
No
v-15
N
ov-
15
De
c-15
Ja
n-1
6
Jan
-16
F
eb
-16
M
ar-
16
Ma
r-16
A
pr-
16
Ma
y-16
Ju
n-1
6
Jun
-16
$0.00
$0.05
$0.10
$0.15
$0.20
$0.25
$0.30
$0.35
$0.40
$0.45
For
per
sona
l use
onl
y

Horizon Oil Annual Report 2016 3
Having regard to commercial terms, maintaining the favourable existing senior debt
facility, minimising shareholder dilution, certainty of outcome and reducing funding
volatility in the future, the board decided that, after conducting a competitive
process, a US$50 million subordinated, non-amortising loan from the Company’s
largest shareholder, IMC Investments Limited (IMC), was the optimal solution.
Shareholder approval for the loan, which involved the issue of 300 million options
over shares in Horizon Oil, was gained at a general meeting on 6 September
2016, allowing the loan funds to be issued and the outstanding convertible bonds
redeemed by the extended redemption date.
Your board considers this to be a satisfactory outcome, with an acceptable level
of dilution of 18.7% if and when the options issued to IMC are exercised, and which
also avoided the issue of a large number of shares at a price deeply discounted
to the current share price. Importantly the refinancing, in combination with the
existing senior debt facility, provides a stable capital structure for the ongoing
commercialisation of Horizon Oil’s substantial undeveloped resources. The
blended interest rate of the debt is about 6%.
Completion of the refinancing has not diminished our continuing efforts to reduce
debt, with progress to date illustrated below. Gross debt in 2014 (after completion
of the China Block 22/12 development) of US$240 million is expected to reduce to
a forecast net debt position of US$120 million by the end of calendar year 2016.
Chairman & Chief Executive Officer's Report
Importantly the refinancing, in combination with the existing senior debt facility, provides a stable capital structure for the ongoing commercialisation of Horizon Oil’s substantial undeveloped resources.
250
200
150
100
50
0
160 160 160
120 120
120120 120 120
80
1H 2014
Convertible Bonds IMC loan facility limit Senior debt facility limit Gross debt drawn
1H 20162H 2014 2H 20161H 2015 20172H 2015 2018 2019
80 80 80 8059 50 50 50
US
$ m
illio
n
Proposed IMC financing facility results in an average funding cost of LIBOR + ~5%.
For
per
sona
l use
onl
y

Horizon Oil Annual Report 20164
Ongoing Response to Low Oil PricesOur response to the low oil price environment, which began in FY2015, continued
over the year with good achievements in the following areas:
• Further significant reductions in exploration and development expenditure and
elimination of discretionary capital expenditure, without compromising planning
for development projects in China and Papua New Guinea (refer to five year trend
of capital expenditure on the inside cover of this Annual Report);
• Reduced General and Administrative expense achieved by further lowering staff
and consultant numbers, maintaining the freeze on salaries of most staff at 2014
levels and continuing forfeiture of cash bonuses by senior executives; and
• Ongoing focus on cutting unit production costs, which have fallen by over 20% in
the last two years to US$12.90 per barrel.
The significantly lower operating and capital costs that have been achieved are in
part the result of the deliberate actions that we and our field operators have taken,
but we are also seeing a continuing trend in construction and service cost deflation
associated with the fall in oil prices. We expect to be able to take advantage of the
lower cost environment in our upcoming field development work.
Chairman & Chief Executive Officer's Report
We expect to be able to take advantage of the lower cost environment in our upcoming field development work.
5 10 15 20
June 16
June 15
June 14
US$/bbl
Unit production cost has reduced by over 20% in the last 2-years
12.90
14.10
16.62
$14.10
For
per
sona
l use
onl
y

Horizon Oil Annual Report 2016 5
Operational and Financial PerformanceFive year operational and financial performance metrics are shown on the inside
front cover to this Annual Report.
The Company recorded a strong performance from its producing assets, with net oil
production for the year of 1.35 million barrels, a 3% increase over the prior financial
year, resulting predominantly from increased production from Maari field in New
Zealand following completion of the Maari Growth Projects program. This level of
production has been maintained over the last three years despite a 75% reduction
in capital expenditure over the same period. We expect oil production, with the
benefit of the increased production entitlement in China associated with cost
recovery under the Petroleum Contract which began in April 2016, to continue at
this level for the next three to four years. Horizon Oil’s share of future cost recovery
oil from our China fields at 30 June 2016 was US$114 million, the unrecovered
balance of which escalates at 9% per annum.
Clearly low oil prices, with an average realised price of US$41.03 per barrel over
the period, had an effect on oil sales revenue and net operating income. This was
significantly offset by Horizon Oil’s hedging program, which delivered an average
oil price inclusive of hedging of US$55.19 per barrel, as 29% of oil sales over
the reporting period were hedged at a weighted average price of US$95.48 per
barrel. In the circumstances, oil sales revenue of US$76.0 million and net operating
income after operating expense of US$52.2 million represented a strong result.
The Company reported a loss of US$144.5 million for FY2016, which included a
gross profit of US$15.8 million, in large part due to non-cash asset impairments of
US$147.5 million. The impairment of the carrying value of the Company’s Maari
production asset and its gas and condensate resources in Papua New Guinea
reflects the current low oil price and, of necessity, takes into account the valuation
prepared for the recent shareholders’ general meeting by the independent expert,
Grant Samuel.
The 2016 Annual Report marks the third submission of Horizon Oil’s Sustainability
Report as an ongoing component of its corporate reporting. We invite shareholders
to review details of the Company’s policy and results for the reporting period in the
areas of health and safety, security, the environment and community.
This year there were again no fatalities and Horizon Oil achieved a Total
Recordable Injury Frequency Rate (TRIFR) and Lost Time Injury Frequency Rate
(LTIFR) of 0.0.
Year FY14 FY15 FY16
LTIFR 2.8 0.0 0.0
TRIFR 7.0 0.9 0.0
No. of Recordable Injuries 5 1 0
Chairman & Chief Executive Officer's Report
In the circumstances, oil sales revenue of US$76.0 million and net operating income after operating expense of US$52.2 million represented a strong result.
For
per
sona
l use
onl
y

Horizon Oil Annual Report 20166
Activities Review and Highlights
Activities for the 2016 Financial Year are reported in detail in the Activities Review section in the following pages. In addition there are tabulations of Horizon Oil’s net reserves and contingent resources and also the Company’s permit and licence interests.
China (Horizon Oil interest 26.95%)
• Continued strong production from
the WZ 6-12 and WZ 12-8W fields
in the Beibu Gulf, producing 9,300
bopd gross at year end (Horizon Oil
share 2,500 bopd); 3.4 mmbo gross
produced over FY2016 (0.90 mmbo
net to Horizon Oil).
• WZ 12-8W-A6H appraisal/development
well in WZ 12-10-2 field completed
in December 2015 and brought on
stream at 1,400 bopd gross.
• Horizon Oil’s Block 22/12 production
entitlement increased from 26.95%
to over 35% of production revenue,
following commencement of
preferential cost recovery under the
Petroleum Contract.
• Preparation of the development plan
for the WZ 12-8E field continued, with
FID expected in 2017.
New Zealand (Horizon Oil interest 10%)
• Maari Growth Projects program
successfully completed in July 2015,
returning gross field production to in
excess of 16,000 bopd.
• Production during the year averaged
12,300 bopd (1,230 net to Horizon Oil),
with 4.5 mmbo gross produced
during FY2016 (0.45 mmbo net
to Horizon Oil).
• FPSO Raroa’s mooring system was
repaired to ensure long term integrity
of a core joint venture asset, with
a significant portion of the costs
expected to be recovered from
insurance.
Papua New Guinea
• Commercial and technical negotiations
progressed with OkTedi Mining Limited
and regional mining operators with
respect to gas sales from Stanley field
(PDL 10 – Horizon Oil interest 30%) for
power generation.
• Feasibility study for a Western
Province based mid-scale LNG project
progressed, with Elevala/Ketu fields
(PRL 21 – Horizon Oil interest 27%) as
the foundation gas resource.
Chairman & Chief Executive Officer's Report
Operational highlights over the reporting period are as follows:
For
per
sona
l use
onl
y

Horizon Oil Annual Report 2016 7
Papua New Guinea DevelopmentThe chart below highlights the job at hand for Horizon Oil’s board and management
and that is to progress the commercialisation of the Company’s substantial gas and
condensate resources in Papua New Guinea. These account for 87% of our total
audited reserves and contingent resources of 116.1 million barrels of oil equivalent.
Confirmation of the potential value of the PNG resources was received in the recent
Independent Expert’s Report by Grant Samuel, who assessed the value of Horizon
Oil’s PNG assets on an unrisked basis as being in the range US$274 – 552 million.
Of course these values need to be adjusted to reflect the range of uncertainties to
which the project remains exposed (and it was Grant Samuel’s risked valuation of
US$30 - 60 million which necessitated the non-cash impairment referred to earlier).
However, it has to be said that the potential value to the Company of these assets,
as the risk is progressively reduced, is very large indeed.
Pleasingly, based on the work of the last year, our project team has focused in on a
development concept which involves a mid-scale LNG project of capacity 1.2 - 2.0
mtpa, located at or near Daru Island in Western Province. With reference to the
PNG map in the Activities Review section, feed gas for the proposed liquefaction
plant will comprise the aggregation of gas from Stanley field that is not required
to supply the domestic market, from Elevala/Ketu fields and possibly, but not
critically, from other gas resources along the pipeline route (subject of course to the
agreement of the owners of those resources).
Certain elements of the concept are yet to be resolved – mainly the additional
fields to be included in the aggregation, the specific location of the liquefaction
plant and the export route for the condensate – but planning for the upstream
processing facilities and pipeline is advanced and landowner studies and
environmental approvals are also progressing well.
Chairman & Chief Executive Officer's Report
The potential value to the Company of these assets, as the risk is progressively reduced, is very large indeed.
Undeveloped gas (PNG), 82.8 mmboe
Undeveloped liquids (PNG), 18.4 mmbo
Undeveloped oil (NZ and China), 5.9 mmbo
Developed oil (NZ and China), 9.0 mmbo
Portfolio Composition
71%
8%5%
16%
Total audited reserves and contingent resources of 116.1 million barrels of oil equivalent 8% developed / 92% undeveloped - 29% oil / 71% gas
For
per
sona
l use
onl
y

Horizon Oil Annual Report 20168
Outlook for Next Year
Barring unforeseen events and assuming oil prices remain at around current levels,
we expect oil production and net operating income for the coming year to be in
line with, or higher than, that of FY2016. We will continue to maintain tight control
over exploration and development capital expenditure and also focus on further
reducing production operating costs. In particular, in Block 22/12 we anticipate
operating cost to be reduced by about US$4 per barrel beginning at the end of
calendar year 2016 when a critical production milestone is reached.
When we feel that the oil price forward curve is favourable, we will add to the
volume of hedged crude, which is currently 1,054,000 barrels over the period July
2016 to March 2018 (about 40% of net production over that period) at prices of over
US$50 per barrel. This will be implemented in accordance with successful past
practice – a conservative, layered approach within the hedging policy set by the
board. The objective of hedging and other measures we will take is to remove the
volatility of the lending limit of the senior debt facility, which is currently drawn to
US$89.1 million. We believe the substitution of the non-amortising loan from IMC,
a major shareholder with a vested interest in the success of Horizon Oil, for the
previously outstanding convertible bonds has stabilised the financial position of the
Company in a difficult commodity price environment. The board wishes to maintain
this stability and build on it. To this end, as stated earlier in this report, we intend to
continue to work assiduously at reducing overall gearing levels.
In China we will finalise the Overall Development Plan for the WZ 12-8E oil
accumulation and nearby WZ 12-10-1 and WZ 12-3-1 oil discoveries (gross resource
of 11.1 mmbo, net 3.0 mmbo), with the aim of submission to the Chinese Government
in calendar year 2017. This development will have attractive economics even at low
oil prices because it will share facilities with the existing Block 22/12 development
scheme and also because of the current low capital cost environment.
Further optimisation of production from the Maari and Manaia fields offshore New
Zealand will be carried out, utilising the workover rig permanently installed on
the platform. We also expect to finalise insurance recoveries in relation to facility
repairs associated with FPSO Raroa’s mooring system.
Advancing Horizon Oil’s large gas and condensate resources in Papua New Guinea
towards commercialisation will command the greatest attention from the board
and management in the coming year. This is a potentially very valuable asset,
with material scale, located in a jurisdiction with an established track record in
successful major resource development, particularly LNG.
Although LNG prices, along with those of oil, are currently low because of
oversupply of the commodity, the arguments for a balanced LNG market and higher
prices beyond 2020 are compelling. Increased demand for low carbon fuel will
come overwhelmingly from Asia in the future and Horizon Oil's PNG fields are well
placed to supply gas to that market.
Chairman & Chief Executive Officer's Report
Advancing Horizon Oil’s large gas and condensate resources in Papua New Guinea towards commercialisation will command the greatest attention from the board and management in the coming year. F
or p
erso
nal u
se o
nly

Horizon Oil Annual Report 2016 9
The key objectives for PNG next year are to:
• Bring the design of the upstream pipeline and liquefaction components of the
mid-scale LNG development scheme to near finalisation;
• Investigate market opportunities for the gas and initiate discussions with potential
buyers; and
• Commence planning to finance the project. Horizon Oil will be entitled to cash
and work carry payments of US$130 million from Osaka Gas, Co. Ltd. upon FID for
the project, as well as reimbursement of prior costs by the PNG Government if, in
the likely case, it exercises its 22.5% back-in right. In addition, we are examining
the possibility of the pipeline installer and liquefaction plant supplier building and
financing such plant and leasing it back to the upstream producers via a tariff.
While the mid-scale LNG project will be the main focus for the Company, we
will continue to work with potential industrial buyers of gas directly from Stanley
field – Ok Tedi Mining Limited and possibly the developers of the Frieda River
project – for power generation. We remain committed to supplying PNG industrial
and domestic consumers, with the attendant social, economic and employment
benefits to the province and country that will result.
Of course while we are pursuing the greenfield mid-scale LNG project as our
primary development option, we will remain open to participating in a brownfield
expansion of the existing PNG LNG project, should that opportunity arise and
the commercial terms be attractive. That option, which may be appealing from
the point of view of reducing engineering and financial risk, is not something we
can control. In any event having our own viable project as our base case is of
fundamental importance.
J S Humphrey Chairman
B D Emmett
Chief Executive Officer
7 October 2016
Chairman & Chief Executive Officer's ReportF
or p
erso
nal u
se o
nly

Horizon Oil Annual Report 201610
Highlights:
• At 30 June 2016, Horizon Oil's total proved plus probable reserves (2P) and contingent resources (2C) for oil and condensate were 33.3 mmbbl (2P: 9.0 mmbbl, 2C: 24.3 mmbbl). This represents a decrease of 0.2 mmbbl to remaining reserves and resources since 30 June 2015, after net production of 1.4 mmbbl. This was primarily attributable to an increase in China due to cost recovery benefit under the Petroleum Contract, the impact of ongoing production optimisation efforts and the addition of reserves and initiation of production from the WZ 12-10-2 field in Q4 2015, offset by a change to the economic cut-off criteria applied at Maari/Manaia, reflective of lower oil prices.
• The Company's 2C contingent gas resources were 497 bcf, representing a 97 bcf increase to the June 2015 position as a result of modifications to the proposed field development concepts in PDL 10 and PRL 21.
• In China improved reservoir performance from ongoing production optimisation and the addition of production from the WZ 12-8W-A6H well drilled in late 2015 increased 2P net reserves by 1.4 mmbbl.
• In New Zealand, a delay to the reinstatement of water injection in the Maari field and a lower than expected benefit to field performance of the well intervention program also contributed to decreased 2P net reserves of 1.7 mmbbl.
2016 Reserves & Resources Statement
Oil and gas reserves
At 30 June 2016, the Company’s proved plus probable petroleum reserves (2P) were 9.0 mmbbl of oil, distributed as shown in
Table 1.
Table 1: Horizon Oil net economic interest Proved plus Probable petroleum Reserves at 30 June 2016
2P Developed and Undeveloped Reserves
2PDeveloped
Oil (mmbbl)
2PDeveloped
Condensate (mmbbl)
2PDeveloped
Gas (bcf)
2PLiquids
Total1
(mmbbl)
2PGas
Total (bcf)
New Zealand
PMP 38160 Maari/Manaia2 2.4 - - 2.4 -
China
Block 22/12 WZ 6-12 + WZ 12-8W3 6.6 - - 6.6 -
Papua New Guinea
PDL 10 Stanley4 - - - - -
Closing Balance 30 June 16 (Economic Interest) 9.0 - - 9.0 -
1. Estimated in accordance with SPE-PRMS guidelines; liquids total equals oil plus condensate where 1 bbl condensate equals 1 bbl oil.
2. Net of production 31.6 mmboe gross through 30 June 2016.
3. Net of production of 12.3 mmboe gross through 30 June 2016.
4. Subject to reduction to allow for PNG State Nominee participation at 22.5%.
All of the reserves at Maari/Manaia and in China Block 22/12 are classified as developed. In China the 2015 undeveloped
reserves of 0.3 mmbbl were reclassified as developed and increased to 0.9 mmbbl as a result of the WZ 12-8W-A6H well
drilled in late 2015. In PNG, the 3.2 mmbbl of 2P undeveloped reserves at Stanley has been reclassified as 2C contingent
resources with respect to June 2015 due to changes to the proposed field development plan for the Stanley field which is now
envisaged to be a gas sales development as opposed to a condensate stripping project.
For
per
sona
l use
onl
y
Horizon Oil Annual Report 2016 11
2016 Reserves & Resources Statement
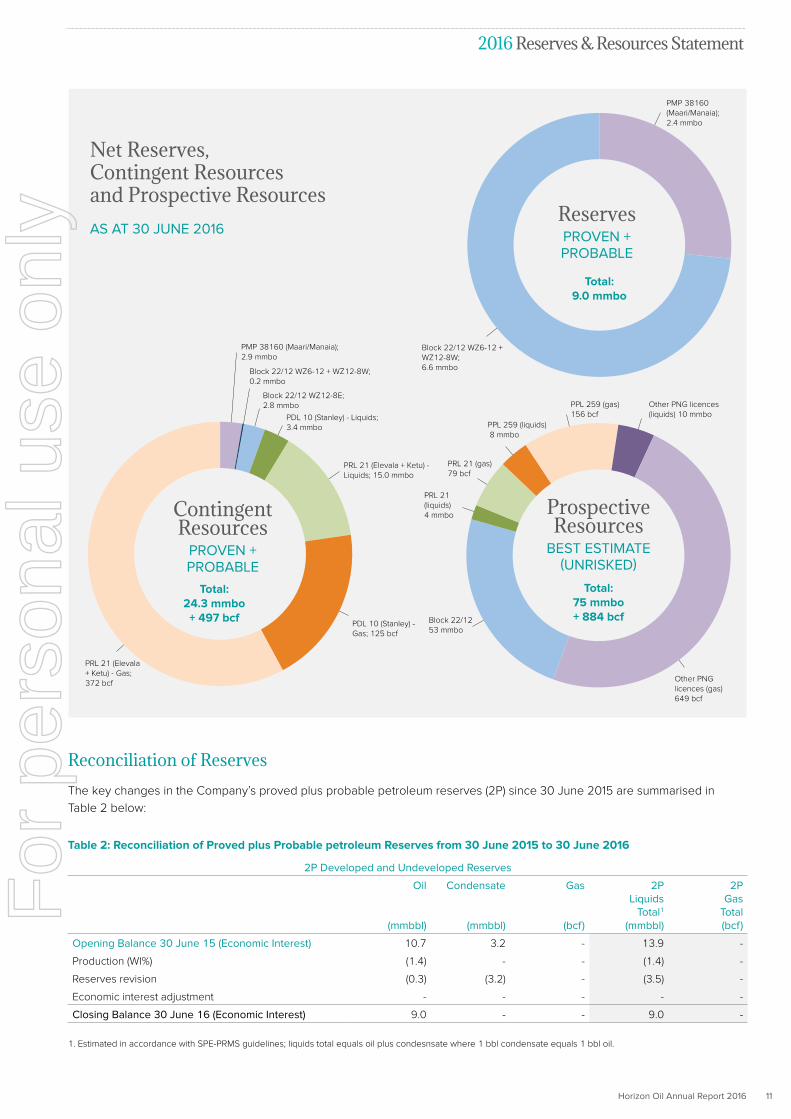
Net Reserves, Contingent Resources and Prospective Resources
AS AT 30 JUNE 2016
PMP 38160 (Maari/Manaia); 2.4 mmbo
Block 22/12 WZ6-12 + WZ12-8W; 6.6 mmbo
Total: 9.0 mmbo
ReservesPROVEN + PROBABLE
PRL 21 (Elevala + Ketu) - Gas; 372 bcf
PDL 10 (Stanley) - Gas; 125 bcf
PRL 21 (Elevala + Ketu) - Liquids; 15.0 mmbo
PDL 10 (Stanley) - Liquids; 3.4 mmbo
Block 22/12 WZ12-8E; 2.8 mmbo
Block 22/12 WZ6-12 + WZ12-8W; 0.2 mmbo
PMP 38160 (Maari/Manaia); 2.9 mmbo
Total: 24.3 mmbo + 497 bcf
Contingent Resources
PROVEN + PROBABLE
Other PNG licences (liquids) 10 mmbo
PPL 259 (gas) 156 bcf
Other PNG licences (gas) 649 bcf
PPL 259 (liquids) 8 mmbo
PRL 21 (gas) 79 bcf
PRL 21 (liquids) 4 mmbo
Block 22/12 53 mmbo
Total: 75 mmbo + 884 bcf
Prospective Resources
BEST ESTIMATE (UNRISKED)
Reconciliation of Reserves
The key changes in the Company’s proved plus probable petroleum reserves (2P) since 30 June 2015 are summarised in
Table 2 below:
Table 2: Reconciliation of Proved plus Probable petroleum Reserves from 30 June 2015 to 30 June 2016
2P Developed and Undeveloped Reserves
Oil
(mmbbl)
Condensate
(mmbbl)
Gas
(bcf)
2PLiquids
Total1
(mmbbl)
2PGas
Total (bcf)
Opening Balance 30 June 15 (Economic Interest) 10.7 3.2 - 13.9 -
Production (WI%) (1.4) - - (1.4) -
Reserves revision (0.3) (3.2) - (3.5) -
Economic interest adjustment - - - - -
Closing Balance 30 June 16 (Economic Interest) 9.0 - - 9.0 -
1. Estimated in accordance with SPE-PRMS guidelines; liquids total equals oil plus condesnsate where 1 bbl condensate equals 1 bbl oil.
For
per
sona
l use
onl
y

Horizon Oil Annual Report 201612
• Production: Reserves at 30 June 2016 reflect net production in the year to 30 June 2016 of 1.4 mmbbl (0.5 mmbbl in Maari/
Manaia and 0.9 mmbbl in Block 22/12, China).
• China: Increased 2P economic reserves in Block 22/12 of 1.4 mmbbl net of production. This increase recognises the effect
of cost recovery benefit under the Petroleum Contract, and results from ongoing production optimisation efforts and the
initiation of production from the WZ 12-10-2 field in Q4 2015. The remaining discovered resources are the subject of ongoing
development planning and are held as 2C resources.
• New Zealand: Downward 2P reserves revision of 1.7 mmbbl at Maari/Manaia resulting from a delay to the reinstatement of
water injection in the Maari Field, a lower than expected benefit to field performance of the well intervention program and a
change to the economic cut-off criteria applied to Maari/Manaia, reflective of lower oil prices.
• Papua New Guinea: Downward 2P reserves revision of 3.2 mmbbl of condensate at PDL 10 due to a change to the
proposed field development plan for the Stanley field, which resulted in a reclassification of undeveloped reserves to
contingent resources. Minor other adjustments result in a net increase in 2C resources of 2.9 mmbbl of condensate.
Contingent Resources
At 30 June 2016, the Company’s net 2C Contingent Resources were 24.3 mmbbl of oil and condensate (liquids), and 497 bcf of
gas as summarised in Table 3.
Table 3: Horizon Oil net economic interest Proved plus Probable Contingent Resources at 30 June 2016
2C Contingent Resources
2C Oil
(mmbbl)
2C Condensate
(mmbbl)
2C Raw Gas
(bcf)
2C Sales Gas1,2
(PJ)
2C Liquids
Total3 (mmbbl)
2C Raw Gas
Total (bcf)
New Zealand
PMP 38160 Maari/Manaia 2.9 - - - 2.9 -
China
Block 22/12 WZ6-12 + WZ12-8W 0.2 - - - 0.2 -
Block 22/12 WZ12-8E4 2.8 - - - 2.8 -
Papua New Guinea
PDL 10 Stanley5 - 3.4 125 106 3.4 125
PRL 21 Elevala + Ketu5 - 15.0 372 350 15.0 372
Closing Balance 30 June 16 (Economic Interest) 5.9 18.4 497 456 24.3 497
1. PDL 10 Stanley Project sales gas assumes an average fuel, flare and shrinkage of 11%; 1 GJ equals 0.957 mscf of gas.
2. PRL 21 Elevala-Ketu Project sales gas assumes an average fuel, flare and shrinkage of 15%; 1 GJ equals 1.103 mscf of gas.
3. Estimated in accordance with SPE-PRMS guidelines; liquids total equals oil plus condensate where 1 bbl condensate equals 1 bbl oil.
4. Reduced to allow for CNOOC participation at 51%.
5. Subject to reduction to allow for PNG State Nominee participation at 22.5%.
2016 Reserves & Resources StatementF
or p
erso
nal u
se o
nly

Horizon Oil Annual Report 2016 13
Reconciliation of Contingent Resources
The key changes in contingent resources since 30 June 2015 are as per Table 4.
Table 4: Reconciliation of Proved plus Probable Contingent Resources from 30 June 2015 to 30 June 2016
2C Contingent Resources
2C Oil
(mmbbl)
2C Condensate
(mmbbl)
2C Raw Gas (bcf)
2C Liquids
Total1 (mmbbl)
2C Raw Gas
Total (bcf)
Opening Balance 30 June 15 (Economic Interest) 5.5 15.5 400 21.0 400
Resource revisions (WI%) 0.4 2.9 97 3.3 97
Economic interest adjustment - - - - -
Closing Balance 30 June 16 (Economic Interest) 5.9 18.4 497 24.3 497
1. Estimated in accordance with SPE-PRMS guidelines; liquids total equals oil plus condensate where 1 bbl condensate equals 1 bbl oil.
• Papua New Guinea: Upward revision of 92 bcf gas in PRL 21 due to an extension of production duration in the development
concept (from 20 years to 30 years), and in PDL 10, reclassification of 3.0 mmbbl of condensate to 2C contingent and an
increase of 5 bcf gas, largely due to a change to the proposed field development concept for the Stanley field.
• China: Downward revision of 1.1 mmbbl of oil resulting from a reclassification of contingent resources to developed reserves
due to the successful WZ 12-8W-A6H well drilled in late 2015.
• New Zealand: Upward revision in Maari/Manaia contingent resources of 1.5 mmbbl, largely due to reclassification of 2P
reserves to 2C contingent resources following a change to the economic cut-off criteria applied to Maari/Manaia as a result
of the prevailing low oil price environment.
Prospective Resources
At 30 June 2016, the Company’s net prospective resources were 75 mmbbl of oil and condensate and 884 bcf of gas, as
summarised in Table 5 below.
Table 5: Horizon Oil net economic interest Best Prospective Resources (unrisked) at 30 June 2016
Unrisked Best Estimate Prospective Resources
Best Estimate Oil1
(mmbbl)
Best Estimate Condensate1
(mmbbl)
Best Estimate Raw Gas1,2
(bcf)
Best Estimate Liquids Total1,3
(mmbbl)
Best Estimate Raw Gas
Total1,2 (bcf)
China
Block 22/124 53 - - 53 -
Papua New Guinea
PRL 215 - 4 79 4 79
PPL 2595,6 - 8 156 8 156
PPL 3725 - 3 61 3 61
PPL 3735 - 2 494 2 494
PPL 4305 - 5 94 5 94
Closing Balance 30 June 16 (Economic Interest) 53 22 884 75 884
1. Best Estimate Prospective Resources are unrisked.
2. Raw gas assumes no adjustments for fuel, flare and shrinkage.
3. Estimated in accordance with SPE-PRMS guidelines; liquids total equals oil plus condensate where 1 bbl condensate equals 1 bbl oil.
4. Subject to reduction to allow for CNOOC participation at 51%.
5. Subject to reduction to allow for PNG State Nominee participation at 22.5%.
6. Licence subject to renewal application. New licence PPL 574 offered and accepted on 26 September 2016.
2016 Reserves & Resources StatementF
or p
erso
nal u
se o
nly

Horizon Oil Annual Report 201614
Reconciliation of Prospective Resources
The key changes in prospective resources since 30 June 2015 are as per Table 6.
Table 6: Reconciliation of Best Estimate Prospective Resources (unrisked) from 30 June 2015 to 30 June 2016
Unrisked Best Estimate Prospective Resources
Best Estimate Liquids Total1
(mmbbl)
Best Estimate Raw Gas Total
(bcf)
Opening Balance 30 June 15 (Economic Interest) 30 286
Resource revisions (WI%) 45 598
Economic interest adjustment - -
Closing Balance 30 June 16 (Economic Interest) 75 884
1. Estimated in accordance with SPE-PRMS guidelines; liquids total equals oil plus condensate where 1 bbl condensate equals 1 bbl oil.
• Papua New Guinea: Upward revision of 598 bcf of prospective resources through identification of new prospects.
• China: Upward revision of 45 mmbbl of prospective resources to 75 mmbbl through identification of new prospects.
• New Zealand: No changes.
Permits, licences and interests held at 30 June 2016
Location Permit or licence Principal assets Interest (%)
New Zealand PMP 38160 Maari and Manaia fields 10.00%
PEP 51313 (Matariki) Matariki, Whio (formerly Pike), Pukeko prospects 21.00%1
China Block 22/12 WZ 6-12, WZ 6-12 South and WZ 12-8 West fields 26.95%
WZ12-8 East field 55.00%2
PNG PDL 10 Stanley field 30.00%3
PRL 21 Elevala/Tingu and Ketu 27.00%3
PPL 259 35.00%4
PPL 372 90.00%5
PPL 373 90.00%5
PPL 430 50.00%
1. The joint venture participants have elected to withdraw from the permit, with completion of withdrawal anticipated in FY2017.
2. China National Offshore Oil Corporation is entitled to participate at up to a 51% equity level in any commercial development within Block 22/12.
3. PNG Govt may appoint a state nominee to acquire up to a 22.5% participating interest in any commercial development within PDL 10 and PRL 21.
4. Licence subject to renewal application. New licence PPL 574 offered and accepted on 26 September 2016.
5. On 22 January 2016 the Group has entered into a transfer agreement whereby 95% undivided participating interest in PPL 372 and 100% undivided participating
interest in PPL 373 will be transferred to Ketu Petroleum Limited effective 1 July 2015. At the date of this report the Group is still awaiting PNG government approval
for the proposed transaction.
2016 Reserves & Resources StatementF
or p
erso
nal u
se o
nly
Horizon Oil Annual Report 2016 15
Governance and 2016 Audit Plan
The governance arrangements for the reporting of
hydrocarbon Reserves and Resources are based on the
following procedure:
• Periodic assessment of proposed changes and additions
to the Company's reserves and resource database, based
on technical work conducted by Horizon Oil staff with
contributions from asset operators, peer review and external
experts where appropriate.
• Regular (normally end of calendar year) audits are
undertaken by independent third party resource evaluators
which are overseen by the General Manager – Exploration
and Development of Horizon Oil, who is a petroleum
reserves and resources evaluator qualified in accordance
with ASX Listing Rule requirements. Historically, Horizon Oil
has engaged RISC Pty Ltd to conduct independent audits of
its reserves and resources.
• No public reporting of any reserves or resources estimate
is permitted without approval of the General Manager –
Exploration and Development and the Chief Executive
Officer.
• All public reporting of the reserves or resources estimates
is in accordance with the requirements set out in Chapter
5 of the ASX Listing Rules and Horizon Oil’s Continuous
Disclosure Policy.
• Annual reports are subject to board approval at the Audit
and Financial Risk Committee.
The Reserves, Contingent Resources and Prospective
Resources estimates used in this section are supported
by Alan Fernie (General Manager – Exploration and
Development and full time employee of Horizon Oil).
Depending on the asset, either deterministic or probabilistic
methods have been used to compile Reserve and Contingent
Resource estimates and the probabilistic method has been
used to compile Prospective Resource estimates. Due to
the portfolio effects of arithmetic summation the aggregate
1P Reserve may be a very conservative estimate and the
aggregate 3P Reserve may be a very optimistic estimate.
Prospective Resources have not been adjusted for risk, i.e.
chance of success.
Estimates of reserves are reported net of lease fuel. The
reference point used for the purposes of measuring and
assessing the estimated reserves is the sales point (at the
plant gate).
The reserve and resource estimates used in this report were
compiled by Alan Fernie (General Manager – Exploration
and Development). Mr Fernie (B.Sc), who is a member of the
American Association of Petroleum Geologists, has more than
35 years relevant experience within the industry. The reserve
and resource estimates are consistent with the definitions of
proved, probable, and possible hydrocarbon reserves and
resources that appear in the ASX Listing Rules.
Alan Fernie is qualified in accordance with the requirements
of ASX Listing Rule 5.42 and consents to the use of the
resource and reserve figures in the form and context in which
they appear in this report.
The 1P and 2P reserves and contingent resource estimates
provided for the China, New Zealand and PNG assets in this
report were audited in early 2015 by independent auditors,
RISC, and reviewed by RISC in July 2016.
Prospective resource estimates provided for China, New
Zealand and PNG are based on recent internal evaluations
conducted by Horizon Oil. These estimates are yet to be
independently audited.
2016 Reserves & Resources StatementF
or p
erso
nal u
se o
nly

Horizon Oil Annual Report 201616
Board of Directors
Consolidated Results
2016 2015 2014 2013 2012
US$’000 US$’000 US$’000 US$’000 US$’000
Revenue from continuing operations 75,952 103,950 138,450 48,071 50,390
Cost of sales (includes amortisation) (60,179) (59,970) (92,716) (22,685) (16,935)
Gross profit 15,773 43,980 45,734 25,386 33,455
Profit from sale of assets - - 23,830 - -
Other income 3,638 6,842 234 30 72
General and administrative expenses (8,094) (7,569) (8,183) (7,038) (8,110)
Exploration and development expenses (1,852) (16,222) (10,520) (606) (303)
Impairment of non-current assets (147,515) - - - -
Financing costs (includes project facility, convertible bonds and FPSO finance lease)
(17,264) (17,360) (18,899) (8,209) (5,974)
Unrealised movement in value of convertible bond conversion rights 5,322 9,063 412 991 4,967
Gain on buyback of convertible bonds during the period 1,193 - - - -
Other expenses (927) (983) (2,581) (529) (418)
Profit/(loss) before income tax expense (149,726) 17,751 30,027 10,025 23,689
Net tax benefit/(expense) 5,201 556 (17,197) (6,551) (16,042)
Profit/(loss) for the financial year from continuing operations (144,525) 18,307 12,830 3,474 7,647
Loss from discontinued operations (net of tax) - - - - -
Profit/(loss) for the financial year (144,525) 18,307 12,830 3,474 7,647
Profit/(loss) attributable to members of Horizon Oil Limited (144,525) 18,307 12,830 3,474 7,647
John Humphrey Chairman
Brent Emmett Chief Executive Officer
Gerrit de Nys Director
Andrew Stock Director
Sandra Birkensleigh Director
For
per
sona
l use
onl
y

Horizon Oil Annual Report 2016 17
Activities Review
China
Block 22/12, Beibu Gulf
(Horizon Oil: 26.95% Production/
55% Exploration)
New Zealand
PMP 38160, Maari and Manaia fields offshore
Taranaki Basin
(Horizon Oil: 10%)
Papua New Guinea
PDL 10, Stanley Field
(Horizon Oil: 30%)
Papua New Guinea
PRL 21, Elevala / Ketu discoveries
(Horizon Oil: 27%)
PPL 259
(Horizon Oil: 35%)
PPL 430
(Horizon Oil: 50%)
PPL 372/PPL 373
(Horizon Oil: 90%)
New Zealand
PEP 51313, offshore Taranaki Basin
(Horizon Oil: 21%)
P.22 Development
P.24 Exploration/ Appraisal
P.18 Production
For
per
sona
l use
onl
y

Horizon Oil Annual Report 201618
Beibu Gulf
100km
MAP AREA Block 22/12
ProductionChina
During the year, Horizon Oil's working interest share of production from the Beibu Gulf fields was 903,598 barrels of oil. Crude oil sales were 903,198 barrels at an average price of US$37.91/bbl exclusive of executed hedging. Cumulative gross oil production from the fields through 30 June 2016 was 12.3 million barrels.
B eib u G ulf
WZ 6-1-1
WZ 6-9-1
WZ 6-9-2
Wushi 1-3-1
WZ 6-12-1WZ 6-12N-1
WZ 6-12W-1
WZ 6-12E-1AWZ 6-12-A7
WZ 6-12-A6
WZ 6-12S-11Sb
Wushi 1-3W-1
6-1-26-1-3
WZ 12-1WZ 6-12S(26.95%)
WZ 6-12N(26.95%)
12’’ pipeline
16” pipeline to weizhou island terminal
NEW VERS - Oct 2016
WZ 12-3-2
WZ 12-3-4
WZ 12-3-1
WZ 12-3-3
WZ 12-10-1 WZ 12-8-3
WZ 12-8-2
WZ 12-10-1Sa
WZ 12-10-2
WZ 12-8W-A6P
WZ 12-7-1
WZ 12-7-2
WZ 12-8W-A1P
WZ 12-8-1
AREA BBlock 22/12
AREA BBlock 22/12
AREA ABlock 22/12
Beibu Gulf
WZ 12-8W
WZ 12-8E
WZ 12-3
Pipeline to WZ 12-1 PUQB
WZ 12-10-2
WZ 12-10-1
WZ 12-3-2 WZ 12-3-4WZ 12-3-1
WZ 12-3-3WZ 12-10-1
WZ 12-8-3
WZ 12-8-2
WZ 12-10-1Sa
WZ 12-10-2
WZ 12-8W-A6PWZ 12-7-1
WZ 12-7-2
WZ 12-8W-A1P
WZ 12-8-1
WZ 12-8W WZ 12-8E
WZ 12-3
WZ 12-10-2
WZ 12-10-1
WZ 12-8W WHP
ProposedWZ 12-8E WHP
WZ 12-8W WHP
ProposedWZ 12-8E WHP
3km
5km
LEGENDProducing Oil FieldDiscovered Oil FieldOil Pipeline
Oil & Gas DiscoveryOil DiscoveryDry WellHorizontal Oil producerDevelopment Area
LEGENDProducing Oil Field
Oil PipelineOil DiscoveryOil and Gas DiscoveryDry Hole
Fault
Gas PipelineProposed Gas Pipeline
Horizontal Oil producer
Proposed Oil Pipeline
Development AreaDiscovered Oil Field
HZN_
China
map
_Aug
ust 2
016_
AnRp
t201
6.ai
CHINA
BeibuGulf
Block 22/12MAP AREA
100km
ACTIVITIES REVIEW
Location
Beibu Gulf
Permit
Block 22/12
Interest (%)
26.95%
Production
55%
Exploration
Gross production averaged 9,161 bopd,
of which Horizon Oil’s share was
2,469 bopd.
Aggregate Block 22/12 production
for the last 6 months is approximately
27% ahead of budget, with full
year production approximately 8%
ahead of budget. During the year,
Horizon Oil’s Block 22/12 production
entitlement increased from 26.95% to
over 35% of production, following the
commencement of its entitlement to
preferential cost recovery.
On 18 December 2015, the WZ 12-10-2
field, located in the Weizhou 12-8 Fields
Area of Block 22/12, Beibu Gulf, People’s
Republic of China, had commenced
production. The WZ 12-8W-A6P1 well
was drilled to appraise the accumulation
discovered by the WZ 12-10-2 well in
2014 and, following this appraisal, a
horizontal production sidetrack (WZ
12-8W-A6H) was completed and brought
on to production. The well was brought
online and after an initial clean up
period, produced at over 1,400 bopd
with a GOR of 40 scf/bbl.
For
per
sona
l use
onl
y

Horizon Oil Annual Report 2016 19
Production China
This well will deliver near term
incremental production to the existing
WZ 12-8W / WZ 6-12 production
facility, and provide data to determine
production and reservoir performance in
the WZ 12-10-2 oil pool to assist in future
development evaluations.
Preparation of the Overall Development
Plan for the WZ 12-8E field continued,
with completion scheduled in 2017. The
audited gross 2C resources for the field
(including WZ 12-10-1 and
WZ 12-3-1) are 11.1 mmbo. To investigate
options that can make this project
economic at low oil prices, contractors
have been invited to bid for this project
through Engineering, Procurement,
Construction and Installation (EPCI) on
lump-sum and competitive cost basis,
with bids due in the second half of
calendar year 2016.
Integrated Development ConceptCNOOC Infrastructure
WZ 12-1B
WZ 12-1A
WZ 12-1PAPWZ 12-8W
WHP
WZ 12-1 PUQB
WZ 6-12 WHP
FutureWZ 12-8E WHP
Gas Pipeline
16” Pipeline to Weizhou Island Terminal
Future CNOOC Fields
Existing production
Future CNOOC Fields
Block 22/12Beibu Gulf
Phase I Development
ProposedPhase II Development
During the year, Horizon Oil's working interest share of
US$37.91/bbl exclusive of executed hedging. Cumulative gross
ACTIVITIES REVIEWF
or p
erso
nal u
se o
nly
Horizon Oil Annual Report 201620
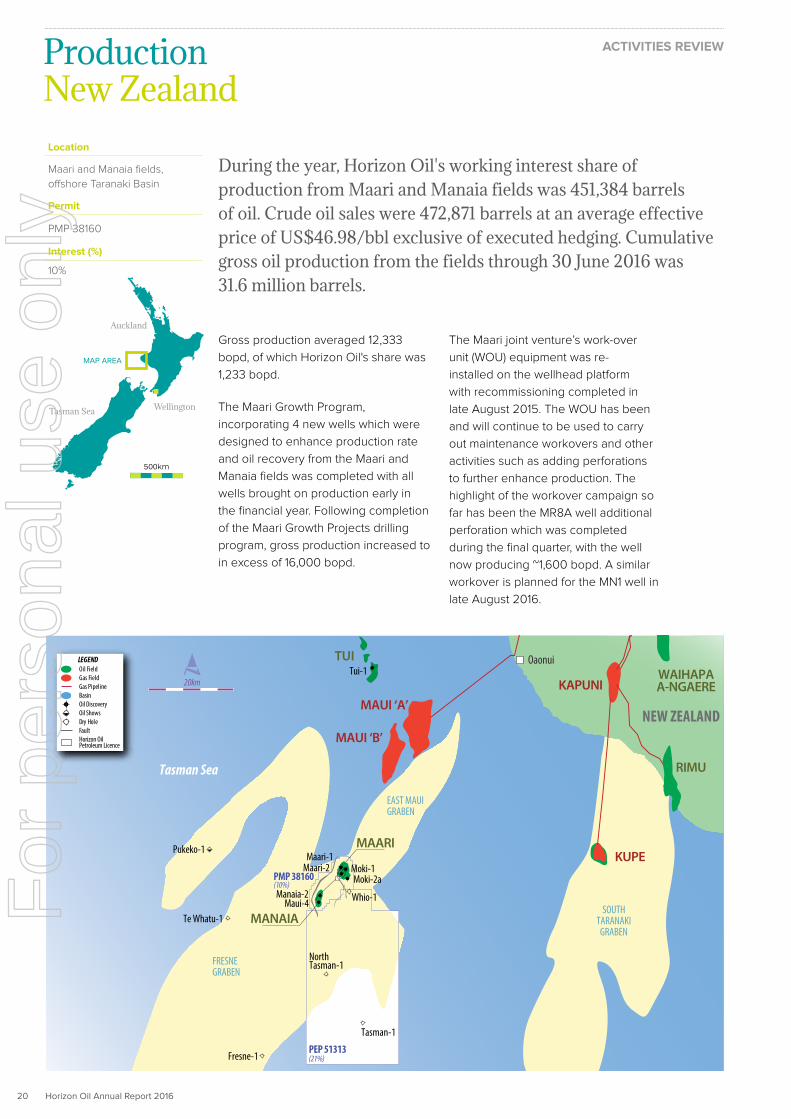
During the year, Horizon Oil's working interest share of production from Maari and Manaia fields was 451,384 barrels of oil. Crude oil sales were 472,871 barrels at an average effective price of US$46.98/bbl exclusive of executed hedging. Cumulative gross oil production from the fields through 30 June 2016 was 31.6 million barrels.
Gross production averaged 12,333
bopd, of which Horizon Oil's share was
1,233 bopd.
The Maari Growth Program,
incorporating 4 new wells which were
designed to enhance production rate
and oil recovery from the Maari and
Manaia fields was completed with all
wells brought on production early in
the financial year. Following completion
of the Maari Growth Projects drilling
program, gross production increased to
in excess of 16,000 bopd.
The Maari joint venture’s work-over
unit (WOU) equipment was re-
installed on the wellhead platform
with recommissioning completed in
late August 2015. The WOU has been
and will continue to be used to carry
out maintenance workovers and other
activities such as adding perforations
to further enhance production. The
highlight of the workover campaign so
far has been the MR8A well additional
perforation which was completed
during the final quarter, with the well
now producing ~1,600 bopd. A similar
workover is planned for the MN1 well in
late August 2016.
Production
Tasman Sea
Auckland
Wellington
500km
MAP AREA
Location
Maari and Manaia fields,
offshore Taranaki Basin
Permit
PMP 38160
Interest (%)
10%
New Zealand
TUI
MAUI ‘A’
MAUI ‘B’
EAST MAUIGRABEN
FRESNEGRABEN
Te Whatu-1Maui-4
MANAIA
Pukeko-1
Tasman Sea
MAARI
Moki-1Moki-2a
Whio-1
Maari-1Maari-2
Manaia-2
OaonuiTui-1
Fresne-1
SOUTHTARANAKIGRABEN
KUPE
RIMU
KAPUNIWAIHAPAA-NGAERE
NorthTasman-1
Tasman-1
NEW ZEALAND
PEP 51313(21%)
PMP 38160(10%)
20km
Oil Shows
Horizon OilPetroleum Licence
LEGENDOil FieldGas FieldGas Pipeline
Fault
Oil DiscoveryBasin
Dry Hole
ACTIVITIES REVIEWF
or p
erso
nal u
se o
nly

Horizon Oil Annual Report 2016 21
The Maari joint venture carried out an upgrade of
the FPSO Raroa’s mooring system during the year.
The work, which will “future-proof” the mooring
system for the next decade, was carried out
during the final quarter, coinciding with the annual
10 day maintenance shutdown. The average oil
production rate in the quarter was impacted by
shut-in and restart periods while the foregoing
activity was undertaken. The cost of the works
was approximately US$4 million, net to Horizon
Oil, before insurance recoveries. The Company
anticipates that a significant portion of these works
will be recovered from insurance.
Production New Zealand ACTIVITIES REVIEW
Maari / Manaia schematic cross-section PMP 38160, Offshore New Zealand
Mangahewa Formation
ManaiaStructure Maari Structure
Depth mss0
100
Maari-1Maui-4 Manaia-2SW
PLIO-PLEISTOCENE
MIOCENE
OLIGOCENE
EOCENE
NE
1000
2000
WellheadPlatform
7km 2km
Upper Manganui Formation
Lower Manganui Formation
Ngatoro Group
M2A Sandstone
Moki Sandstone
F-Sandequivalent
F-Sand equivalent
For
per
sona
l use
onl
y
Horizon Oil Annual Report 201622
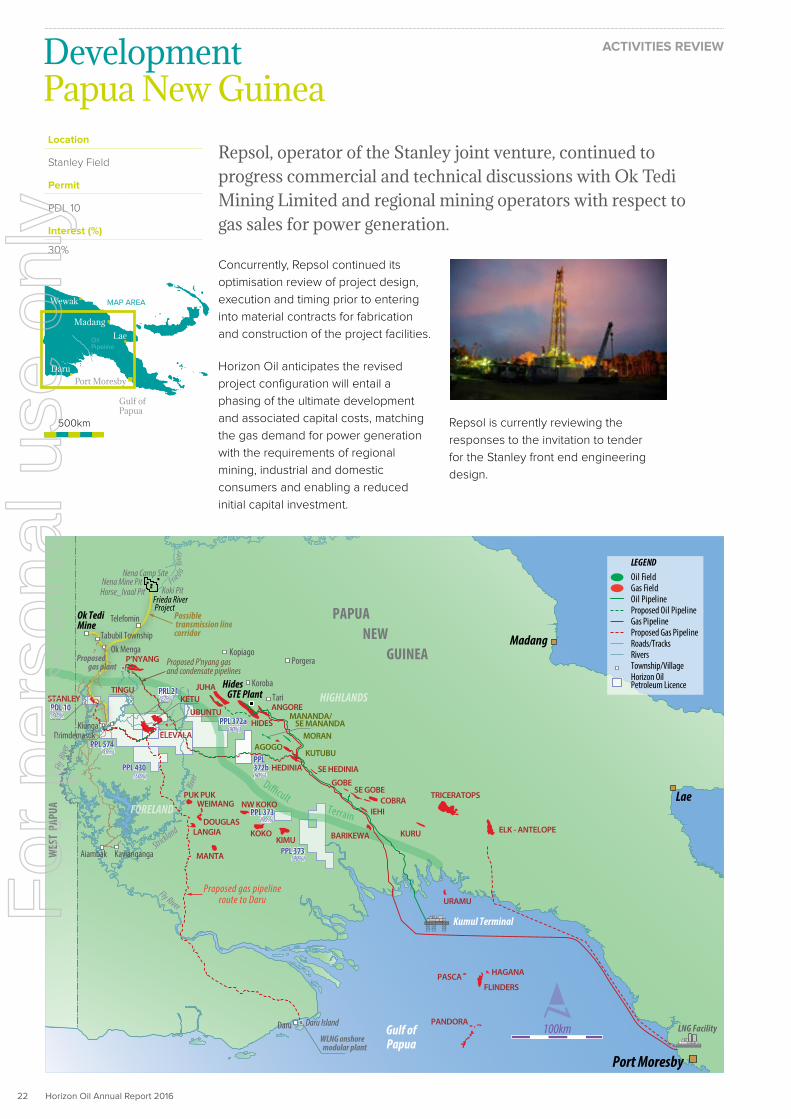
Repsol, operator of the Stanley joint venture, continued to progress commercial and technical discussions with Ok Tedi Mining Limited and regional mining operators with respect to gas sales for power generation.
Concurrently, Repsol continued its
optimisation review of project design,
execution and timing prior to entering
into material contracts for fabrication
and construction of the project facilities.
Horizon Oil anticipates the revised
project configuration will entail a
phasing of the ultimate development
and associated capital costs, matching
the gas demand for power generation
with the requirements of regional
mining, industrial and domestic
consumers and enabling a reduced
initial capital investment.
Repsol is currently reviewing the
responses to the invitation to tender
for the Stanley front end engineering
design.
Development
Location
Stanley Field
Permit
PDL 10
Interest (%)
30%
Papua New GuineaACTIVITIES REVIEW
Gulf ofPapua
PAPUA NEW
GUINEA
WES
T PA
PUA
LNG Facility
PPL 574(35%)
PDL 10(30%)
PPL372bPPL 430
(50%)
Frieda River Project
Ok TediMine
Madang
Lae
Port Moresby
Hides GTE PlantSTANLEY
PUK PUK
MANTA
URAMU
PASCA HAGANA
FLINDERS
PANDORA
DOUGLAS
WEIMANG
LANGIAKIMU
ELK - ANTELOPE
TRICERATOPS
KURUBARIKEWA
IEHICOBRA
GOBE
SE HEDINIAHEDINIA
SE GOBE
KOKO
NW KOKO
Kopiago
KiungaDrimdemasuk
Daru
Fly River
Fly R
iver
Strickland
River
Porgera
Koroba
Aiambak Kavianganga
Tari
Nena Camp SiteNena Mine Pit
Horse_Ivaal Pit Koki Pit
Terrain
Di�cult
100km
Proposed P'nyang gasand condensate pipelines
Proposed gas pipelineroute to Daru
Kumul Terminal
Telefomin
Tabubil TownshipOk Menga
Possible transmission linecorridor
LEGENDOil FieldGas FieldOil PipelineProposed Oil PipelineGas PipelineProposed Gas PipelineRoads/TracksRiversTownship/VillageHorizon Oil Petroleum Licence
Sepik River
Fried a
River
Proposed gas plant
Daru Island
P’NYANG
PPL 372a(90%)
TINGU PRL 21(27%)
ELEVALA
KETUUBUNTU
JUHA
HIDES
ANGORE
MORAN
KUTUBUAGOGO
MANANDA/ SE MANANDA
(90%)
HIGHLANDS
FORELAND PPL 373(90%)
PPL 373(90%)
WLNG onshore modular plant
Gulf of Papua
500km
Wewak
Lae
DaruPort Moresby
MAP AREA
Oil Pipeline
Madang
For
per
sona
l use
onl
y

Horizon Oil Annual Report 2016 23
ACTIVITIES REVIEWF
or p
erso
nal u
se o
nly

Horizon Oil Annual Report 201624
Exploration/AppraisalPapua New Guinea
ACTIVITIES REVIEW
Location
Elevala /Ketu discoveries
Permit
PRL 21
Interest (%)
27%
Further progress was made during the year on pre-development planning and regulatory aspects of the project, including landowner, environmental and technical matters.
A key milestone was achieved with
the formal approval by the PNG
Conservation and Environment
Protection Authority of the Elevala
Development environmental impact
statement.
The PRL 21 joint venture participants
progressed the feasibility study for a
Western Province based mid-scale
LNG development concept, potentially
involving aggregation of the ~2 tcf
of discovered Western Province gas
resources, the cornerstone volumes of
which are the condensate-rich Elevala/
Tingu and Ketu fields operated by
Horizon Oil.
Significant potential also emerged
during the year for sales of large gas
volumes to satisfy future West Papuan
agribusiness and industrial demand
arising from the Merauke Integrated
Food and Energy Estate, an Indonesian
government food security initiative.
After preliminary discussions with
key existing and potential Indonesian
stakeholders, the Company is carrying
out preliminary feasibility studies on
these opportunities.
PAPUA NEW
GUINEA
WESTPAPUA
50km
20km
PAPUA NEW GUINEA
WES
T PA
PUA
Proposedgas pipeline route
to Daru
Proposed P'nyanggas and condensate
pipelines
Proposed P'nyanggas and condensate
pipelines
Possible transmission line to Frieda River Project
Possible transmission line to Frieda River Project
Proposedgas pipeline route
to Daru
ELEVALA
PPL435
P’NYANG
P’NYANG SOUTH
(30%)PDL 10
PRL 21(27%)
PPL 430(50%)
PPL 372(90%)
PPL 372(90%)
PPL 574(35%)Fly River
Strick
land
RiverFORELAND
STANLEY
TINGUKETU
UBUNTU
Terrain
PPL464
PPL 269
PPL 261
APPL 510
APPL 494
APPL 573
PPL 426
PPL 266
PPL 268
PPL 437
PRL 28
PPL 260
PPL 402
PDL9
PPL474PPL
474
PPL 287
PPL376
PPL 287
PPL 462
PRL 8
PPL 422
PPL 367
PPL 564
PDL 7B
PDL 8PDL 1
PDL 5
PDL 2
OkTe
di
PPL 373(90%)
PPL 373(90%)
HIGHLANDS
Proposedgas plant
PPL401
PPL395
PPL 269
PPL460
PPL261
PPL294
PPL260
PPL423
PPL470
PDL 7A
PDL 6
PPL378APPL506
APDL11
APPL462
PPL 277
PPL 277
PPL 405
PPL 452
PRL 9
PRL 14
PDL 3 PDL 4
PDL 4
APPL 501
APPL 496
PPL 287
APPL 459
PPL 235
PPL296
PPL296
PPL 261
PRL3
ELEVALA
PPL435
(30%)PDL 10
PRL 21(27%)
PPL 430(50%)
PPL 372(90%)
PPL 574(35%)Fly River
Strick
land
River
FORELAND
HIGHLANDS
STANLEY
TINGUKETU
UBUNTU
Terrain
PPL 464
PPL 269
PPL 268
PPL 437
PRL 28
PPL 422
OkTe
di
PPL401
PPL395
PPL 269
PPL460
PPL 261
PPL 470
PPL296
PPL 296
ANGORE
PUK PUK
DOUGLAS
LANGIA
WEIMANG
KIMUKOKO
MANTA
NW KOKO
JUHA
JUHANORTH
HEDINIA SE HEDINIA
GOBE
IEHI
SE GOBE
HIDES
KUTUBUAGOGO
MORAN
SE MANANDA
PAUA
Ningerum
Hawenai
Debepare
Honinabi
Yavo
Nomad
Kiunga Drimdemasuk
Ningerum
Hawenai
Debepare
Honinabi
Nomad
Kiunga Drimdemasuk
Siphon-1
Ketu-1Tingu-1 Elevala-2
Elevala-1
Ketu-2Ubuntu-1
Stanley-1
Stanley-2Stanley-4
Kiunga-1X
Stanley-5 Stanley-3
Nama-1
Siphon-1
Ketu-1
Tingu-1 Elevala-2
Elevala-1
Ketu-2Ubuntu-1
Stanley-1
Stanley-2Stanley-4
Kiunga-1X
Stanley-5
Stanley-3
Nama-1
map 3 for AnRpt
map 2 for AnRpt LEGEND
Oil FieldGas FieldOil PipelineProposedOil PipelineGas PipelineProposedGas Pipeline
Township
Horizon Oil Petroleum Licence
Oil and Gas ShowsOil and Gas Discovery
Roads/TracksRivers
Licence Boundary/Application
LEGENDOil FieldGas FieldOil PipelineProposedOil PipelineGas PipelineProposedGas Pipeline
Township
Horizon Oil Petroleum Licence
Oil and Gas ShowsOil and Gas Discovery
Roads/TracksRivers
Licence Boundary/Application
Gulf of Papua
500km
Wewak
Lae
DaruPort Moresby
Oil Pipeline
MAP AREA Madang
For
per
sona
l use
onl
y

Horizon Oil Annual Report 2016 25
Gulf of Papua
500km
Wewak
Lae
DaruPort Moresby
Oil Pipeline
MAP AREA Madang
ACTIVITIES REVIEW
PAPUA NEW
GUINEA
WESTPAPUA
50km
20km
PAPUA NEW GUINEA
WES
T PA
PUA
Proposedgas pipeline route
to Daru
Proposed P'nyanggas and condensate
pipelines
Proposed P'nyanggas and condensate
pipelines
Possible transmission line to Frieda River Project
Possible transmission line to Frieda River Project
Proposedgas pipeline route
to Daru
ELEVALA
PPL435
P’NYANG
P’NYANG SOUTH
(30%)PDL 10
PRL 21(27%)
PPL 430(50%)
PPL 372(90%)
PPL 372(90%)
PPL 574(35%)Fly River
Strick
land
RiverFORELAND
STANLEY
TINGUKETU
UBUNTU
Terrain
PPL464
PPL 269
PPL 261
APPL 510
APPL 494
APPL 573
PPL 426
PPL 266
PPL 268
PPL 437
PRL 28
PPL 260
PPL 402
PDL9
PPL474PPL
474
PPL 287
PPL376
PPL 287
PPL 462
PRL 8
PPL 422
PPL 367
PPL 564
PDL 7B
PDL 8PDL 1
PDL 5
PDL 2
OkTe
di
PPL 373(90%)
PPL 373(90%)
HIGHLANDS
Proposedgas plant
PPL401
PPL395
PPL 269
PPL460
PPL261
PPL294
PPL260
PPL423
PPL470
PDL 7A
PDL 6
PPL378APPL506
APDL11
APPL462
PPL 277
PPL 277
PPL 405
PPL 452
PRL 9
PRL 14
PDL 3 PDL 4
PDL 4
APPL 501
APPL 496
PPL 287
APPL 459
PPL 235
PPL296
PPL296
PPL 261
PRL3
ELEVALA
PPL435
(30%)PDL 10
PRL 21(27%)
PPL 430(50%)
PPL 372(90%)
PPL 574(35%)Fly River
Strick
land
River
FORELAND
HIGHLANDS
STANLEY
TINGUKETU
UBUNTU
Terrain
PPL 464
PPL 269
PPL 268
PPL 437
PRL 28
PPL 422
OkTe
di
PPL401
PPL395
PPL 269
PPL460
PPL 261
PPL 470
PPL296
PPL 296
ANGORE
PUK PUK
DOUGLAS
LANGIA
WEIMANG
KIMUKOKO
MANTA
NW KOKO
JUHA
JUHANORTH
HEDINIA SE HEDINIA
GOBE
IEHI
SE GOBE
HIDES
KUTUBUAGOGO
MORAN
SE MANANDA
PAUA
Ningerum
Hawenai
Debepare
Honinabi
Yavo
Nomad
Kiunga Drimdemasuk
Ningerum
Hawenai
Debepare
Honinabi
Nomad
Kiunga Drimdemasuk
Siphon-1
Ketu-1Tingu-1 Elevala-2
Elevala-1
Ketu-2Ubuntu-1
Stanley-1
Stanley-2Stanley-4
Kiunga-1X
Stanley-5 Stanley-3
Nama-1
Siphon-1
Ketu-1
Tingu-1 Elevala-2
Elevala-1
Ketu-2Ubuntu-1
Stanley-1
Stanley-2Stanley-4
Kiunga-1X
Stanley-5
Stanley-3
Nama-1
map 3 for AnRpt
map 2 for AnRpt LEGEND
Oil FieldGas FieldOil PipelineProposedOil PipelineGas PipelineProposedGas Pipeline
Township
Horizon Oil Petroleum Licence
Oil and Gas ShowsOil and Gas Discovery
Roads/TracksRivers
Licence Boundary/Application
LEGENDOil FieldGas FieldOil PipelineProposedOil PipelineGas PipelineProposedGas Pipeline
Township
Horizon Oil Petroleum Licence
Oil and Gas ShowsOil and Gas Discovery
Roads/TracksRivers
Licence Boundary/Application
Considerable exploration and appraisal
activity commenced in 2016 and will
continue into 2017 immediately to the
north of Horizon Oil’s Western Province
gas fields, with the P’nyang participants
planning to drill up to two appraisal
wells and the PPL 269 participants,
including Repsol, Santos and Oil Search
spudding two exploration wells during
the year, with total drilling costs likely to
be in the order of US$400-500 million.
Horizon Oil considers that these recent
material developments have the
potential to increase the likelihood of
promising alternative commercialisation
pathways emerging for its substantial
gas resources in the Western Province
forelands. The possible export pipeline
route connecting P’nyang gas field to
the existing PNG LNG system at Kutubu,
offers, in Horizon Oil’s view, the potential
for a gas aggregation project involving
Stanley, Elevala/Tingu, Ketu, Ubuntu and
P’nyang fields.
As noted above, the PRL 21 joint venture
will progress planning for a greenfield
LNG project at Daru Island as its base
case and the Company will continue
its feasibility analysis for gas sales to
West Papuan agribusiness and industrial
users. However, the opportunity
to participate in a brownfield LNG
development by way of aggregation of
Horizon Oil’s gas fields with those of
other operators represents a potentially
attractive proposition with less
engineering and financial risk.
For
per
sona
l use
onl
y
Horizon Oil Annual Report 201626
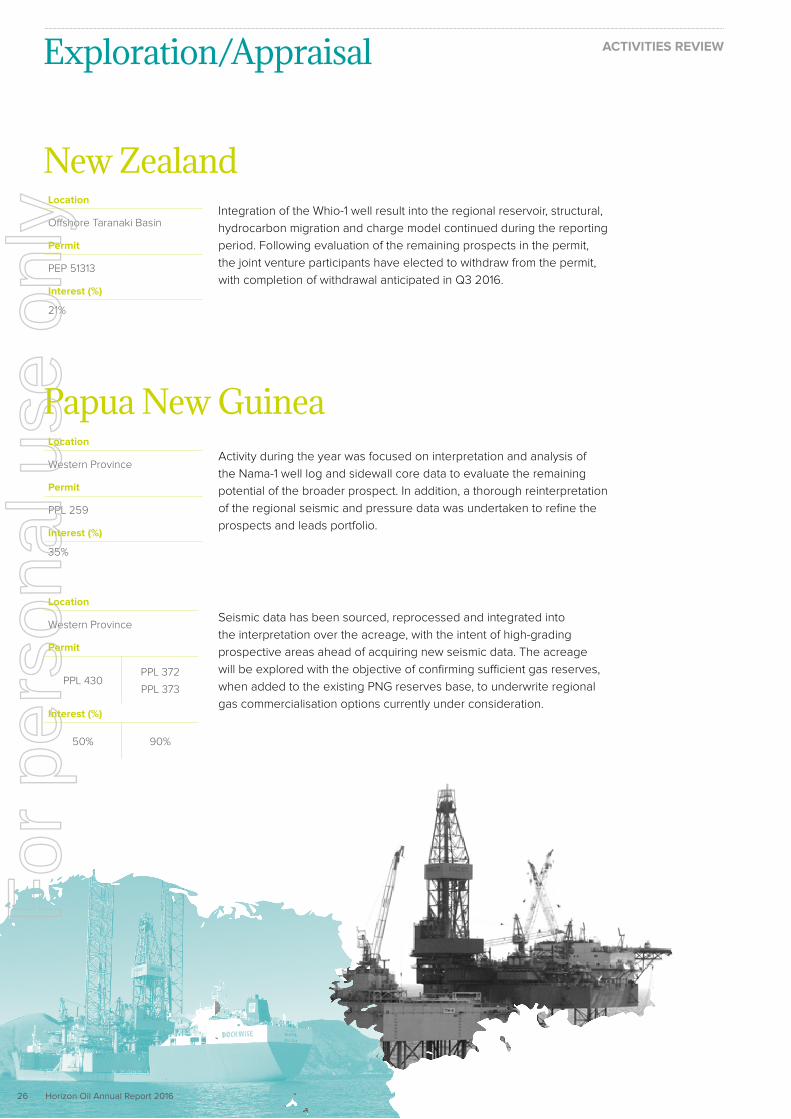
Integration of the Whio-1 well result into the regional reservoir, structural,
hydrocarbon migration and charge model continued during the reporting
period. Following evaluation of the remaining prospects in the permit,
the joint venture participants have elected to withdraw from the permit,
with completion of withdrawal anticipated in Q3 2016.
Exploration/Appraisal
New Zealand
ACTIVITIES REVIEW
Location
Offshore Taranaki Basin
Permit
PEP 51313
Interest (%)
21%
Location
Western Province
Permit
PPL 259
Interest (%)
35%
Location
Western Province
Permit
PPL 430PPL 372
PPL 373
Interest (%)
50% 90%
Papua New GuineaActivity during the year was focused on interpretation and analysis of
the Nama-1 well log and sidewall core data to evaluate the remaining
potential of the broader prospect. In addition, a thorough reinterpretation
of the regional seismic and pressure data was undertaken to refine the
prospects and leads portfolio.
Seismic data has been sourced, reprocessed and integrated into
the interpretation over the acreage, with the intent of high-grading
prospective areas ahead of acquiring new seismic data. The acreage
will be explored with the objective of confirming sufficient gas reserves,
when added to the existing PNG reserves base, to underwrite regional
gas commercialisation options currently under consideration.
For
per
sona
l use
onl
y

Horizon Oil Annual Report 2016 27
This annual financial report covers the consolidated financial statements for the Group, consisting of Horizon Oil Limited (the ‘Company’) and its subsidiaries. The annual financial report is presented in United States dollars.
Horizon Oil Limited is a public company limited by shares and is listed on
the ASX. It is incorporated and domiciled in Australia. Its registered office
and principal place of business is:
Level 6
134 William Street
Woolloomooloo NSW 2011
The annual financial report was authorised for issue by the Board of
Directors on 30 August 2016. The Board of Directors has the power to
amend and reissue the annual financial report.
Annual Financial ReportFor the financial year ended 30 June 2016
Horizon Oil LimitedABN 51 009 799 455
For
per
sona
l use
onl
y

Horizon Oil Annual Report 201628
For the financial year ended 30 June 2016
Your directors present their report on the consolidated entity (referred to hereafter as the ‘Group’) consisting of Horizon Oil Limited (the ‘Company’) and the subsidiaries it controlled at the end of, or during the financial year ended, 30 June 2016.
DIRECTORSThe following persons were directors of Horizon Oil Limited during the whole, or for part where noted, of the financial year and up to the
date of this report:
J S Humphrey
B D Emmett
G de Nys
A Stock
S Birkensleigh was appointed as a non-executive director on 2 February 2016 and continues in office at the date of this report.
E F Ainsworth was a director and chairman of the Group from the beginning of the year until his retirement and resignation from the
board at the Group’s 2015 AGM on 20 November 2015. J S Humphrey was appointed as chairman at the conclusion of the AGM on 20
November 2015.
REVIEW OF OPERATIONS
Principal ActivitiesDuring the financial year, the principal activities of the Group continued to be directed towards petroleum exploration, development and
production.
A detailed review of the operations of the Group during the financial year is set out in the Activities Review on pages 17 to 26 of this
annual financial report.
Group Financial Performance
Consolidated Statement of Profit or Loss and Other Comprehensive Income
2016 Profit after tax drivers
Revenue Operating Costs
General & Admin
and Other income/
(expenses)
Gains on buy back and
revaluation of convertible
bonds
EBITDAX Depreciation &
Amortisation
Impairment of non-current assets
Exploration Expenses
EBIT Finance Costs
Income Tax benefit/
(expense)
Loss after Tax
70
50
30
10
(10)
(30)
(50)
(70)
(90)
(110)
(130)
(150)
76.0 (23.8)
(4.7) 6.5 54.0 (37.1)
(147.5)
(144.5)
(1.9)
(132.5)(17.3)
5.2
Directors’ ReportU
S$
Mill
ion
For
per
sona
l use
onl
y
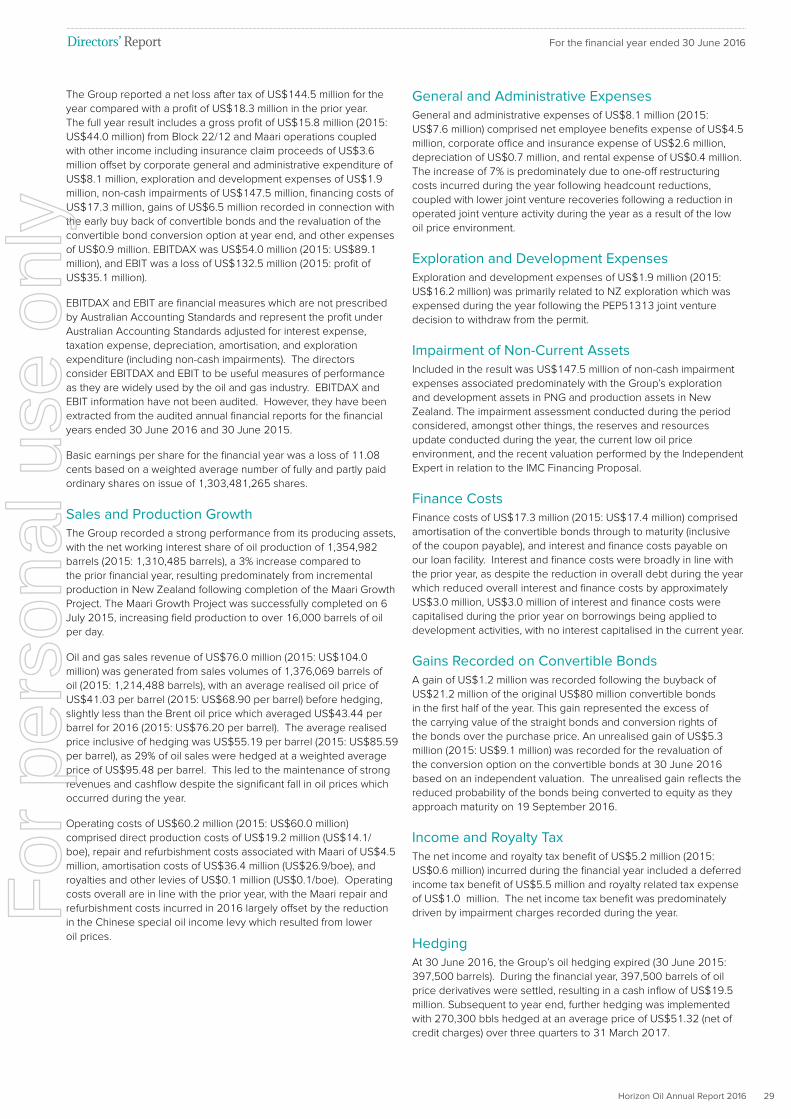
Horizon Oil Annual Report 2016 29
For the financial year ended 30 June 2016
The Group reported a net loss after tax of US$144.5 million for the
year compared with a profit of US$18.3 million in the prior year.
The full year result includes a gross profit of US$15.8 million (2015:
US$44.0 million) from Block 22/12 and Maari operations coupled
with other income including insurance claim proceeds of US$3.6
million offset by corporate general and administrative expenditure of
US$8.1 million, exploration and development expenses of US$1.9
million, non-cash impairments of US$147.5 million, financing costs of
US$17.3 million, gains of US$6.5 million recorded in connection with
the early buy back of convertible bonds and the revaluation of the
convertible bond conversion option at year end, and other expenses
of US$0.9 million. EBITDAX was US$54.0 million (2015: US$89.1
million), and EBIT was a loss of US$132.5 million (2015: profit of
US$35.1 million).
EBITDAX and EBIT are financial measures which are not prescribed
by Australian Accounting Standards and represent the profit under
Australian Accounting Standards adjusted for interest expense,
taxation expense, depreciation, amortisation, and exploration
expenditure (including non-cash impairments). The directors
consider EBITDAX and EBIT to be useful measures of performance
as they are widely used by the oil and gas industry. EBITDAX and
EBIT information have not been audited. However, they have been
extracted from the audited annual financial reports for the financial
years ended 30 June 2016 and 30 June 2015.
Basic earnings per share for the financial year was a loss of 11.08
cents based on a weighted average number of fully and partly paid
ordinary shares on issue of 1,303,481,265 shares.
Sales and Production GrowthThe Group recorded a strong performance from its producing assets,
with the net working interest share of oil production of 1,354,982
barrels (2015: 1,310,485 barrels), a 3% increase compared to
the prior financial year, resulting predominately from incremental
production in New Zealand following completion of the Maari Growth
Project. The Maari Growth Project was successfully completed on 6
July 2015, increasing field production to over 16,000 barrels of oil
per day.
Oil and gas sales revenue of US$76.0 million (2015: US$104.0
million) was generated from sales volumes of 1,376,069 barrels of
oil (2015: 1,214,488 barrels), with an average realised oil price of
US$41.03 per barrel (2015: US$68.90 per barrel) before hedging,
slightly less than the Brent oil price which averaged US$43.44 per
barrel for 2016 (2015: US$76.20 per barrel). The average realised
price inclusive of hedging was US$55.19 per barrel (2015: US$85.59
per barrel), as 29% of oil sales were hedged at a weighted average
price of US$95.48 per barrel. This led to the maintenance of strong
revenues and cashflow despite the significant fall in oil prices which
occurred during the year.
Operating costs of US$60.2 million (2015: US$60.0 million)
comprised direct production costs of US$19.2 million (US$14.1/
boe), repair and refurbishment costs associated with Maari of US$4.5
million, amortisation costs of US$36.4 million (US$26.9/boe), and
royalties and other levies of US$0.1 million (US$0.1/boe). Operating
costs overall are in line with the prior year, with the Maari repair and
refurbishment costs incurred in 2016 largely offset by the reduction
in the Chinese special oil income levy which resulted from lower
oil prices.
General and Administrative ExpensesGeneral and administrative expenses of US$8.1 million (2015:
US$7.6 million) comprised net employee benefits expense of US$4.5
million, corporate office and insurance expense of US$2.6 million,
depreciation of US$0.7 million, and rental expense of US$0.4 million.
The increase of 7% is predominately due to one-off restructuring
costs incurred during the year following headcount reductions,
coupled with lower joint venture recoveries following a reduction in
operated joint venture activity during the year as a result of the low
oil price environment.
Exploration and Development ExpensesExploration and development expenses of US$1.9 million (2015:
US$16.2 million) was primarily related to NZ exploration which was
expensed during the year following the PEP51313 joint venture
decision to withdraw from the permit.
Impairment of Non-Current AssetsIncluded in the result was US$147.5 million of non-cash impairment
expenses associated predominately with the Group’s exploration
and development assets in PNG and production assets in New
Zealand. The impairment assessment conducted during the period
considered, amongst other things, the reserves and resources
update conducted during the year, the current low oil price
environment, and the recent valuation performed by the Independent
Expert in relation to the IMC Financing Proposal.
Finance CostsFinance costs of US$17.3 million (2015: US$17.4 million) comprised
amortisation of the convertible bonds through to maturity (inclusive
of the coupon payable), and interest and finance costs payable on
our loan facility. Interest and finance costs were broadly in line with
the prior year, as despite the reduction in overall debt during the year
which reduced overall interest and finance costs by approximately
US$3.0 million, US$3.0 million of interest and finance costs were
capitalised during the prior year on borrowings being applied to
development activities, with no interest capitalised in the current year.
Gains Recorded on Convertible BondsA gain of US$1.2 million was recorded following the buyback of
US$21.2 million of the original US$80 million convertible bonds
in the first half of the year. This gain represented the excess of
the carrying value of the straight bonds and conversion rights of
the bonds over the purchase price. An unrealised gain of US$5.3
million (2015: US$9.1 million) was recorded for the revaluation of
the conversion option on the convertible bonds at 30 June 2016
based on an independent valuation. The unrealised gain reflects the
reduced probability of the bonds being converted to equity as they
approach maturity on 19 September 2016.
Income and Royalty TaxThe net income and royalty tax benefit of US$5.2 million (2015:
US$0.6 million) incurred during the financial year included a deferred
income tax benefit of US$5.5 million and royalty related tax expense
of US$1.0 million. The net income tax benefit was predominately
driven by impairment charges recorded during the year.
HedgingAt 30 June 2016, the Group’s oil hedging expired (30 June 2015:
397,500 barrels). During the financial year, 397,500 barrels of oil
price derivatives were settled, resulting in a cash inflow of US$19.5
million. Subsequent to year end, further hedging was implemented
with 270,300 bbls hedged at an average price of US$51.32 (net of
credit charges) over three quarters to 31 March 2017.
Directors’ Report F
or p
erso
nal u
se o
nly

Horizon Oil Annual Report 201630
For the financial year ended 30 June 2016
Consolidated Statement of Financial PositionDuring the financial year, total assets decreased to US$286.7 million
(2015: US$523.3 million) and total liabilities decreased to US$182.1
million (2015: US$267.0 million). As a result, net assets decreased to
US$104.5 million (2015: US$256.3 million).
Total assets decreased from the prior year, which was primarily
due to US$147.5 million of non-cash impairment expenses being
recorded associated predominately with the Group’s exploration and
development assets in PNG and production assets in New Zealand.
In addition, US$58.3 million of cash was used to extinguish debt,
composed of US$21.2 million of convertible bonds, US$6.2 million in
redemption and accrued deferred yield and US$30.9 million of senior
debt repayments under the Revolving Cash Advance Facility.
At 30 June 2016, the Group’s net debt position was US$128.3
million (2015: US$133.0 million), consisting of cash and cash
equivalents assets held of US$16.1 million (2015: US$61.3 million)
offset by borrowings of US$144.4 million (2015: US$194.4 million).
At financial year end, borrowings consisted of the outstanding
US$58.8 million in convertible bonds issued during June 2011,
and US$89.1 million principal outstanding on the Revolving Cash
Advance Facility executed with senior lenders in May 2015.
Directors’ Report
Consolidated Statement of Cash Flows
2016 Cash Drivers
Net cash generated from operating activities was 25% lower for the
financial year at US$44.2 million (2015: US$58.8 million) primarily
resulting from lower cash receipts from sales due to the low oil price
environment. Cash and cash equivalents of US$61.3 million from the
prior year, along with cash generated from operating activities, was
used to finance expenditure of US$30.1 million on our exploration,
development and producing assets, including US$3.8 million on
restoration payments for the Beibu Gulf which are required to be
made over the life of the field. The repayment of US$58.3 million
of borrowings during the year, composed of US$21.2 million of
convertible bonds, US$6.2 million in redemption and accrued
deferred yield and US$30.9 million of senior debt repayments under
the Revolving Cash Advance Facility.
Debt FacilitiesOn 14 May 2015, the Group finalised and executed a US$120
million Revolving Cash Advance Facility with Australia and New
Zealand Banking Group (ANZ) as mandated lead arranger and
Westpac Banking Corporation (Westpac). The facility was used to
refinance the previous Reserves Based Debt Facility which was
drawn to US$110 million. Under the facility, the facility limit and thus
future repayments are determined by applying a minimum loan life
coverage ratio to the net present value of estimated future cash
flows from all projects included in the facility. Estimated future cash
flows are dependent on, amongst other things, the lenders’ views
on forecast oil prices, reserve estimates, operating and capital
cost estimates and forecast interest and exchange rates. At 30
June 2016, total debt drawn under the facility was US$89.1 million
with undrawn debt capacity available of approximately US$8.8
million. Floating interest in respect of the facility was at LIBOR plus a
weighted average margin of 2.90%.
Opening cash and cash
equivalents at 30 June 2015
Net Cash from Operating
Activities (excl. G&A/Other)
G&A / Other Expenditure
Debt Repayment
Development Expenditure/Plant
& Equipment
Exploration Expenditure
Prepaid Abandonmnent
costs
Effects of FX rate on cash
Cash and cash equivalents at 30 June
2016
120
100
80
60
40
20
US
$ M
illio
n
61.3
52.5 (8.3)
(58.3)
(17.7)
(8.6)
(3.8 )(1.0 )
16.1
For
per
sona
l use
onl
y

Horizon Oil Annual Report 2016 31
For the financial year ended 30 June 2016Directors’ Report
The Group’s other outstanding debt is the US$58.8 million in
convertible bonds which were issued on 17 June 2011 with a 5
year term. The bonds were issued with an initial conversion price
of US$0.52, equivalent to A$0.49 based on exchange rates at the
time of pricing, and represented a conversion premium of 29% to the
Company’s last closing price of A$0.38 on 2 June 2011. The initial
conversion price was subject to adjustment in certain circumstances
such that the conversion price has been reduced to US$0.409
since issue. During the year the parent entity purchased in the
open market, by private contract, US$21.2 million of the US$80m
5.5% Convertible Bonds and surrendered the purchased bonds for
cancellation in accordance with the bond trust deed. Accordingly,
US$58.8m of the bonds remain outstanding at 30 June 2016. The
bonds were initially due for redemption on 17 June 2016. However,
as part of Horizon Oil’s refinancing arrangements, the Company’s
convertible bondholders unanimously approved the extension of the
bond redemption date to 19 September 2016, providing adequate
time to obtain the requisite shareholder approval and implement the
refinancing arrangements detailed below. While having received the
unanimous approval for the deferral of the principal repayment of
US$58.8 million, the Company satisfied the other conditions of the
convertible bonds at the original redemption date of 17 June 2016,
namely the payment of the accrued yield of US$5.2 million, together
with the scheduled interest payments of US$1.6 million. No bonds
had been converted as at 30 June 2016. On conversion, the Group
may elect to settle the bonds in cash or ordinary shares in the parent
entity. The bonds carried a coupon of 5.5% per annum until their
original maturity date of 17 June 2016, which has now increased to
10% until the extended maturity date of 19 September 2016. The
bonds were listed on the Singapore Securities Exchange on 20
June 2011. Details surrounding the bond redemption strategy are
outlined further below.
During the year, the Company and its major shareholder, IMC
Investments Limited, agreed the terms and conditions for the
provision of a subordinated secured non-amortising debt facility of
US$50 million. The IMC Financing Proposal loan agreement was
signed on 29 July 2016. Under the provisions of the subordinated
loan agreement, the Company is to issue to IMC 300 million warrants
over unissued shares of the Company, which will have the exercise
price of A$0.061 per share. The loan and issue of the warrants to
IMC are subject to Horizon Oil shareholder approval. A General
Meeting of the Company will be held at 9.00am (Sydney time)
on Tuesday, 6 September 2016, at The Sydney Boulevard Hotel,
90 William Street, Sydney. A copy of the Notice of Meeting and
Explanatory Statement was sent to Horizon Oil shareholders during
the week commencing 1 August 2016. Drawdown on the facility
remains subject to satisfaction of customary conditions precedent
and shareholder approval. The proceeds of the loan, together
with the Company’s available cash, will be applied to redeem the
remaining US$58.8 million of convertible bonds. The refinancing
arrangements extend the maturities of the Company’s senior and
subordinated debt to an average of no less than three years at a
volume weighted interest rate of LIBOR plus 5% p.a. The foregoing
refinancing arrangements will continue the progressive reduction
of the Company’s gross debt in 2014 (after completion of the Block
22/12 development) of approximately US$240 million to a forecast
net debt position in Q4 calendar year 2016 of approximately US$120
million. This reduction continues to be funded by revenue generated
from the Company’s high margin production assets in China and New
Zealand.
Group business strategies and prospects for future financial yearsThe Company’s exploration, development and production activities
are focused in Southeast Asia. The robust, long-lived cash flows from
the Company’s interests in the Maari/Manaia fields, offshore New
Zealand and Block 22/12, offshore China, will be applied to fund the
Company’s future capital program. That program is directed to bring
into production the Company’s substantial inventory of discovered
reserves and contingent resources (~116 million barrels of oil
equivalent) in fields in New Zealand, China and Papua New Guinea.
The Company has a conservative and highly selective exploration
policy with specific focus on plays providing material scale and
upside. The identified prospective resources in the Company’s
inventory, together with the reserves and contingent resources
provide shareholders with exposure to commodity price upside,
especially oil price and production growth.
The achievement of these strategic objectives may be affected
by macro-economic and other risks including, but not limited to,
China’s slowing rate of growth, volatile commodity prices, exchange
rates, access to financing and political risks. The speculative nature
of petroleum exploration and development will also impact the
Company’s ability to achieve these objectives; key risks of which
include production and development risk, exploration and drilling
risks, joint operations risk, and geological risk surrounding resources
and reserves.
The Group has various risk management policies and procedures
in place to enable the identification, assessment and mitigation of
risks that may arise. Whilst the Group can mitigate some of the risks
described above, many are beyond the control of the Group. For
further information in relation to the Company’s risk management
framework, refer to the Corporate Governance Statement.
The Group has a working capital deficit of US$60.4 million at 30
June 2016 resulting from the classification as current liabilities of
borrowings associated with the remaining US$58.8 million, 5.5%
convertible bonds which are due for redemption on 19 September
2016, combined with presently scheduled amortisation over the
next 12 months of the Group’s Revolving Cash Advance Facility.
The Group has recorded a cash inflow from operating activities of
US$44.2 million and a net loss after tax for the period of US$144.5
million (including a non-cash impairment loss of US$147.5 million).
Funding for redemption of the bonds, scheduled principal repayments under the Group’s Revolving Cash Advance Facility and the Group’s strategic growth plans, is to be obtained from a variety of sources. Surplus revenues from the Group’s operations in China and New Zealand, combined with existing cash balances and debt drawn from the Group’s US$120 million revolving cash advance facility provide core funding. In addition, the Group has executed a loan agreement with IMC Investments Limited for the provision of a subordinated secured non-amortising debt facility of US$50 million. Financial close and drawdown of the facility are subject to shareholder approval of the IMC financing proposal and other customary conditions for a subordinated loan of this nature.F
or p
erso
nal u
se o
nly

Horizon Oil Annual Report 201632
Taking into account:
• the Group’s cash balance of US$16.1 million at 30 June 2016;
• forecast surplus revenue from the Group’s operations in New Zealand and China;
• materially reduced budgeted/forecast capital expenditure profile over the coming 12 months;
• the provision by IMC Investments Limited of a subordinated secured non-amortising debt facility of US$50 million; and
• hedged production of 270,300 barrels over the following 9 months at an average price of ~US$51/bbl.
The Company expects to have available the necessary cash reserves
to meet redemption obligations under the Company’s remaining
US$58.8 million, 5.5% convertible bonds maturing on 19 September
2016, scheduled principal repayments under the Group’s Revolving
Cash Advance Facility and to pursue the current strategy. Since the
additional IMC debt funding of US$50 million that is required for full
redemption of the bonds is subject to shareholder approval, there is
a material uncertainty that may cast significant doubt on the Group’s
ability to pursue the current strategy. In addition to the IMC financing
proposal, the Company continues to consider other initiatives which
would add strategic value and/or improve liquidity.
Contained elsewhere within this financial report is an independent
auditor’s report which includes an emphasis of matter paragraph in
regard to the existence of the material uncertainty referenced above
that may cast significant doubt about the Group’s ability to continue
as a going concern. For further information, refer to Note 1 to the
financial statements, together with the auditor’s report.
OutlookIt is expected that the 2017 financial year and beyond will be
characterised by continued strong production from the Group’s
New Zealand operations and underpinned by the Group’s China
operations. Oil production from the Group’s New Zealand and
China operations are expected to decrease due to natural reservoir
decline, partially offset by some planned well interventions in New
Zealand. Despite the decline in production, Horizon Oil’s production
entitlement from China is expected to remain elevated at ~35%, well
above Horizon Oil’s net working interest, due to preferential cost
recovery. Accordingly, assuming oil prices average a similar level
to where they closed in the 2016 financial year, revenue (before
hedging) and operating cash flows for the Group are expected to
increase in 2017, barring unforeseen events.
The Group’s short-term focus is on:
• finalisation of the redemption of remaining US$58.8 million Convertible Bonds in September 2016 using proceeds from the IMC subordinated secured non-amortising debt facility of US$50 million, subject to receiving shareholder approval;
• optimising production performance from Maari/Manaia fields through continued workover campaign;
• progressing the Beibu Gulf fields Phase II development plan for WZ 12-8E;
• progress sales of Stanley and Elevala/Ketu gas to regional PNG consumers and larger scale gas commercialisation/export plans; and
• progressing the Elevala/Ketu development planning in PNG.
Significant changes in the state of affairsOther than the matters noted above and disclosed in the review of operations, there have not been any other significant changes in the state of affairs of the Group during the financial year.
Matters subsequent to the end of the financial yearOther than the matters noted above and disclosed in the review of operations, there has not been any matter or circumstance which has arisen since 30 June 2016 that has significantly affected, or may significantly affect:
1. the Group’s operations in future financial years; or
2. the results of those operations in future financial years; or
3. the Group’s state of affairs in future financial years.
Environmental regulationThe Group is subject to significant environmental regulation in
respect of exploration, development and production activities in
all countries in which it operates – New Zealand, China and Papua
New Guinea. Horizon Oil Limited is committed to undertaking
all of its exploration, development and production activities in an
environmentally responsible manner.
The directors believe the Group has adequate systems in place for
managing its environmental requirements and is not aware of any
breach of those environmental requirements as they apply to the
Group.
Reporting currencyThe Company’s and the Group’s functional and reporting currency
is United States dollars. All references in this annual financial report
to “$” or “dollars” are references to United States dollars, unless
otherwise stated.
For the financial year ended 30 June 2016Directors’ Report F
or p
erso
nal u
se o
nly
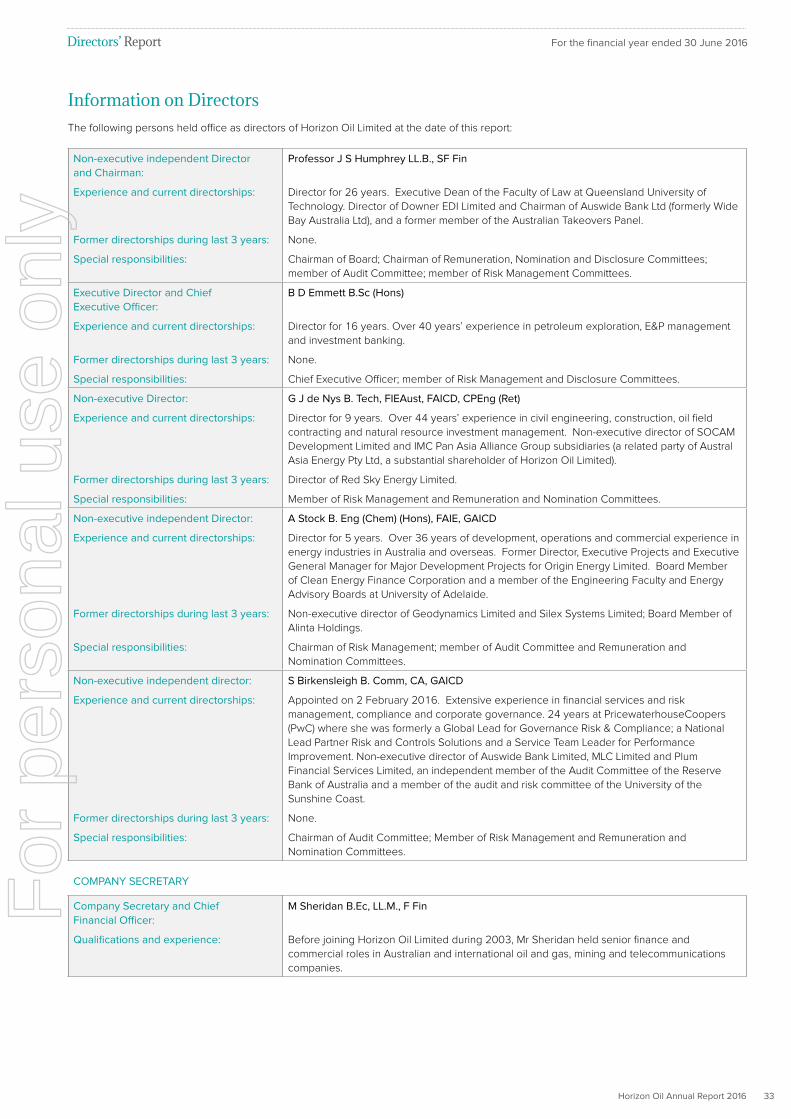
Horizon Oil Annual Report 2016 33
Information on DirectorsThe following persons held office as directors of Horizon Oil Limited at the date of this report:
Non-executive independent Director and Chairman:
Professor J S Humphrey LL.B., SF Fin
Experience and current directorships: Director for 26 years. Executive Dean of the Faculty of Law at Queensland University of
Technology. Director of Downer EDI Limited and Chairman of Auswide Bank Ltd (formerly Wide
Bay Australia Ltd), and a former member of the Australian Takeovers Panel.
Former directorships during last 3 years: None.
Special responsibilities: Chairman of Board; Chairman of Remuneration, Nomination and Disclosure Committees;
member of Audit Committee; member of Risk Management Committees.
Executive Director and Chief Executive Officer:
B D Emmett B.Sc (Hons)
Experience and current directorships: Director for 16 years. Over 40 years’ experience in petroleum exploration, E&P management
and investment banking.
Former directorships during last 3 years: None.
Special responsibilities: Chief Executive Officer; member of Risk Management and Disclosure Committees.
Non-executive Director: G J de Nys B. Tech, FIEAust, FAICD, CPEng (Ret)
Experience and current directorships: Director for 9 years. Over 44 years’ experience in civil engineering, construction, oil field
contracting and natural resource investment management. Non-executive director of SOCAM
Development Limited and IMC Pan Asia Alliance Group subsidiaries (a related party of Austral
Asia Energy Pty Ltd, a substantial shareholder of Horizon Oil Limited).
Former directorships during last 3 years: Director of Red Sky Energy Limited.
Special responsibilities: Member of Risk Management and Remuneration and Nomination Committees.
Non-executive independent Director: A Stock B. Eng (Chem) (Hons), FAIE, GAICD
Experience and current directorships: Director for 5 years. Over 36 years of development, operations and commercial experience in
energy industries in Australia and overseas. Former Director, Executive Projects and Executive
General Manager for Major Development Projects for Origin Energy Limited. Board Member
of Clean Energy Finance Corporation and a member of the Engineering Faculty and Energy
Advisory Boards at University of Adelaide.
Former directorships during last 3 years: Non-executive director of Geodynamics Limited and Silex Systems Limited; Board Member of
Alinta Holdings.
Special responsibilities: Chairman of Risk Management; member of Audit Committee and Remuneration and
Nomination Committees.
Non-executive independent director: S Birkensleigh B. Comm, CA, GAICD
Experience and current directorships: Appointed on 2 February 2016. Extensive experience in financial services and risk
management, compliance and corporate governance. 24 years at PricewaterhouseCoopers
(PwC) where she was formerly a Global Lead for Governance Risk & Compliance; a National
Lead Partner Risk and Controls Solutions and a Service Team Leader for Performance
Improvement. Non-executive director of Auswide Bank Limited, MLC Limited and Plum
Financial Services Limited, an independent member of the Audit Committee of the Reserve
Bank of Australia and a member of the audit and risk committee of the University of the
Sunshine Coast.
Former directorships during last 3 years: None.
Special responsibilities: Chairman of Audit Committee; Member of Risk Management and Remuneration and
Nomination Committees.
COMPANY SECRETARY
Company Secretary and Chief Financial Officer:
M Sheridan B.Ec, LL.M., F Fin
Qualifications and experience: Before joining Horizon Oil Limited during 2003, Mr Sheridan held senior finance and
commercial roles in Australian and international oil and gas, mining and telecommunications
companies.
For the financial year ended 30 June 2016Directors’ Report F
or p
erso
nal u
se o
nly

Horizon Oil Annual Report 201634
For the financial year ended 30 June 2016
Directors’ Interests in the Company’s SecuritiesAs at the date of this Directors’ Report, the directors held the following number of fully and partly paid ordinary shares and options over
unissued ordinary shares in the Company:
Ordinary shares Unlisted options
Director Direct Indirect Total Direct Indirect Total
B Emmett - 18,902,607 18,902,607 - - -
J Humphrey - 5,112,034 5,112,034 - - -
G de Nys - 912,858 912,858 - - -
A Stock - 160,000 160,000 - - -
S Birkensleigh - - - - -
B Emmett also held 23,139,973 share appreciation rights as at the date of this Directors’ Report.
Meetings of DirectorsThe numbers of meetings of the Company’s Board of Directors (the ‘board’) and of each board committee held during the financial year, and
the numbers of meetings attended by each director were:
Board Audit Committee Risk Management Committee
Remuneration and Nomination
Committee
Disclosure Committee
Number of meetings held:
111 2 1 3 1
Number of meetings attended by:
J S Humphrey 11 2 1 3
E F Ainsworth2 4 1 1 3 1
B D Emmett 11 1 1
G de Nys 11 1 3
A Stock 11 2 1 3
S Birkensleigh2 6 1 - - -
1. Four board meetings were held for non-executive directors only immediately prior to full board meetings.
2. Incoming and outgoing directors attended all meetings they were eligible to attend.
Directors’ Report
Corporate GovernanceThe Company and the board are committed to achieving and
demonstrating the highest standards of corporate governance. The
board continues to review the framework and practices to ensure
they meet the interests of shareholders. The Corporate Governance
Statement was approved by the board on 30 August 2016.
The Company’s Corporate Governance Statement for the year ended
30 June 2016 may be accessed from the Company’s website at
www.horizonoil.com.au. A description of the Company’s main
corporate governance practices is set out in the Corporate
Governance Statement. All these practices, unless otherwise stated,
were in place for the full financial year and comply with the ASX
Corporate Governance Council’s revised Corporate Governance
Principles and Recommendations 3rd edition, released in March
2014.
Remuneration Report The Remuneration Report forms part of this Directors’ Report. The
information provided in the Remuneration Report has been audited
by the external auditor as required by section 308(3)(c) of the
Corporations Act 2001.
The remuneration report is set out under the following main
headings:
A Principles used to determine the nature and amount of
remuneration
B Details of remuneration
C Service agreements
D Share-based compensation – options/share appreciation rightsFor
per
sona
l use
onl
y

Horizon Oil Annual Report 2016 35
For the financial year ended 30 June 2016Directors’ Report
A. Principles used to determine the nature and amount of remuneration
The objective of the Group’s executive reward framework is to
ensure reward for performance is competitive and appropriate for
the results delivered. The framework aligns executive reward with
achievement of strategic objectives and the creation of value for
shareholders, and conforms with market best practice for delivery
of reward. The board ensures that executive rewards satisfy the
following key criteria for good reward governance practices:
• competitiveness and reasonableness;
• acceptability to shareholders;
• performance linkage / alignment of executive compensation;
• transparency; and
• capital management.
The board has structured an executive remuneration framework that
is market competitive and complementary to the reward strategy of
the Group. The key elements of the framework are:
Alignment to shareholders’ interests:
• focuses on sustained growth in shareholder value; and
• attracts and retains high calibre executives capable of managing
the Group’s diverse international operations.
Alignment to program participants’ interests:
• rewards capability and experience;
• reflects competitive reward for contribution to growth in
shareholder wealth;
• provides a clear structure for earning rewards; and
• provides recognition for contribution.
The framework provides a mix of fixed pay and a blend of short
and long-term incentives.
Non-executive directors’ feesFees and payments to non-executive directors are set and paid in
Australian Dollars (A$), and reflect the demands which are made on,
and the responsibilities of, the directors. Non-executive directors’
fees and payments are reviewed periodically by the Remuneration
and Nomination Committee.
Non-executive directors’ fees are determined within an aggregate
directors’ fee pool limit, which is periodically recommended for
approval by shareholders. Shareholders approved the current
fee pool limit of A$600,000 at the 2009 Annual General Meeting.
The non-executive directors’ base fee is A$81,555 plus statutory
superannuation per annum and the Chairman’s base fee is
A$163,110 plus statutory superannuation per annum. These fees
have not changed in A$ terms for the last four years. Note that the
remuneration table set out on page 39 shows remuneration in US$ in
line with the Group’s functional currency.
Retirement allowances for directorsThere are no retirement allowances in place for directors.
Executive payExecutive remuneration (which is set and paid in Australian Dollars
(A$) and other terms of employment are reviewed annually by the
Remuneration and Nomination Committee having regard to relevant
comparative information. As well as a base salary, remuneration
packages include superannuation and termination entitlements and
non-monetary benefits. For periods prior to April 2010, executives
were eligible for long-term incentives (LTI) through participation in the
Company’s Employee Option Scheme and Employee Performance
Incentive Plan. The grant of options to executive directors under the
Employee Option Scheme and Employee Performance Incentive Plan
has been subject to the approval of shareholders.
Based on advice received from Guerdon Associates, an independent
remuneration consultant, in 2010 the board put in place a short-
term incentive scheme and long-term incentive arrangements
for the Company’s senior executives. The Company’s Employee
Option Scheme continues to apply to employees other than senior
executives.
Remuneration and other terms of employment for executives are
formalised in service agreements. The quantum and composition
of the executive remuneration is based on advice received in prior
financial years from Guerdon Associates.
Short-term incentivesIf the Group and individuals achieve pre-determined objectives set
in consultation with the board, a short-term incentive (STI) is available
to senior executives during the annual review. Using pre-determined
objectives ensures variable reward is only available when value has
been created for shareholders.
For
per
sona
l use
onl
y

Horizon Oil Annual Report 201636
The following table outlines the major features of the plan:
Objective To drive performance of annual business plans and objectives, at operational and group level, to
achieve increased shareholder value.
Frequency and timing Participation is annual with performance measured over the twelve months to 30 June.
Entitlements under the plan are determined and paid (in cash) in the first quarter of the new
financial year.
Key Performance Indicators (KPIs)
KPIs are determined each financial year in consultation with the board. The performance of each senior
executive against these KPIs is reviewed annually in consultation with the board.
A KPI matrix, directly linked to factors critical to the success of the Group’s business plan for the
financial year, is developed for each executive incorporating health, safety and environment, financial,
operational and other KPIs.
STI opportunity Up to 50% of the senior executive’s fixed remuneration package (base salary plus superannuation).
Performance requirements The executive’s STI payment is calculated with reference to achievement of KPI targets based on a
weighted scorecard approach. Key objectives during the current year included:
• successful refinancing of the Group’s maturing convertible bonds;
• achievement of budgeted production and operating costs across the Maari/Manaia and Block 22/12
fields;
• achievement of no LTIs (lost time injuries) across Horizon Oil’s operated joint ventures; and
• progressing the Elevala/Ketu development planning in PRL 21 towards a final investment decision.
Whilst many of the abovementioned objectives were achieved during the current year, in response to the current depressed share price and
the focus on the refinancing of the convertible bonds, any decision regarding any short-term incentive entitlements in respect of the current
year has been deferred until after the convertible bond refinancing arrangements are finalised. The following table shows the STI awards that
were paid or payable as at the date of this report in respect of the financial year ended 30 June 2016:
STI in respect of 2016 financial year
Senior executives Percentage of maximum STI payment paid
Percentage of maximum STI payment forfeited
B Emmett NIL N/A
A Fernie NIL N/A
M Sheridan NIL N/A
Long-term incentives
For the financial year ended 30 June 2016Directors’ Report
Until April 2010, long-term incentives were provided to certain
employees via the Company’s share option plans. The revised LTI
arrangements approved at the 2010 Annual General Meeting apply
to senior executives and involve the grant of rights which will vest
subject (amongst other things) to the level of total shareholder return
(‘TSR’) achieved in the vesting period, relative to an appropriate
index.
Under the LTI Plan, the board has the discretion, subject to the ASX
Listing Rule requirements, to grant share appreciation rights (‘SARs’)
to executives as long-term incentives. The board has determined
that 50% of senior executive’s fixed remuneration would be long-
term incentives in the form of SARs, with the number of SARs granted
based on the value of a SAR.
A SAR is a right to receive either or both a cash payment or shares in
the Company, as determined by the board, subject to the Company
satisfying certain conditions, including performance conditions.
The LTI Plan provides that the amount of the cash payment or the
number of shares in the Company that the participant receives on
exercise of the SAR is based on the value of the SAR at the time it is
exercised (’SAR Value’). The SAR Value is the excess, if any, of the
volume weighted average price (’VWAP’) of shares in the Company
for the ten business day period up to the date before the date the
SAR is exercised over the VWAP of shares in the Company for the
ten business day period up to the day before the “Effective Allocation
Date” for the SARs. The Effective Allocation Date for the SARs is the
grant date of the SARs or any other day determined by the board, at
the time of the grant. The Effective Allocation Date would generally
be the date the executive’s entitlement was determined.
If the board determines that the SARs are to be satisfied in cash, the
amount of cash that the participant receives on the exercise of the
SARs is the SAR Value multiplied by the number of SARs exercised
(less any deduction for taxes that the Company is required to make
from the payment). If the board determines that the SARs are to
be satisfied in shares, the number of shares that the participant
receives on the exercise of the SARs is the SAR Value divided by the
volume weighted average price of shares in the Company for the
ten business day period up to the day before the day the SARs are
exercised. Where the number of shares calculated is not a whole
number, it will be rounded down to the nearest whole number.
For
per
sona
l use
onl
y

Horizon Oil Annual Report 2016 37
For the financial year ended 30 June 2016Directors’ Report
The following table outlines the major features of the plan;
Key terms and conditions Long Term Incentive Plan
Eligible persons: Under the terms of the LTI Plan, the Company may grant SARs to any employee. However, it is currently
intended by the Company to only grant SARs under the LTI Plan to current senior executive employees
including executive directors.
Exercise price: No price is payable by a participant in the LTI Plan on the exercise of a SAR.
Performance requirements: Under the LTI Plan, the number of SARs that vest is generally determined by reference to whether the
Company achieves certain performance conditions.
The number of SARs that vest is determined by reference to the Company’s total shareholder return
(’TSR’) over the relevant period relative to that of the S&P/ASX200 Energy Index (’Index’). The number
of SARs that vest is:
(a) if the Company’s TSR is equal to that of the Index (’Minimum Benchmark’), 50%;
(b) if the Company’s TSR is 14% or more above that of the Index, 100% (’Maximum Benchmark’); and
(c) if the Company’s TSR is more than the Minimum Benchmark but less than the Maximum Benchmark,
a percentage between 50% and 100% based on the Company’s TSR performance between the
Minimum Benchmark and Maximum Benchmark.
The Maximum Benchmark of 14% above the Index return equates to the performance level likely to
exceed the 75th percentile of market returns of companies (weighted by company size) in the Index.
Furthermore, even where these performance conditions are satisfied, the SARs will not vest unless the
Company achieves a TSR of at least 10% over the relevant period.
The performance conditions are tested on the date that is three years after the Effective Grant Date
of the SARs, and are then re-tested every six months after that until the date that is five years after the
Effective Grant Date of the SARs (the final retesting date). The performance conditions are also tested
where certain circumstances occur, such as a takeover bid for the Company.
The Effective Grant Date for the SARs is the date the SARs are granted, or such other date as the board
determines for the SARs.
If the SARs have not, pursuant to these performance conditions, vested by the final retesting date that is
five years after the date the SARs are granted, the SARs will lapse.
Cessation of employment: If a holder of SARs under the LTI Plan ceases to be employed by a member of the Group, then this
generally does not affect the terms and operation of the SARs. The board does, however, under the LTI
Plan have discretion, to the extent permitted by law, to cause the SARs to lapse or accelerate the date
on which the SARs become exercisable.
Maximum number of shares that can be issued:
Subject to various exclusions, the maximum number of shares that may be issued on the exercise of
SARs granted under the LTI Plan is capped at 5% of the total number of issued shares of the Company.
Restrictions on exercise: A SAR cannot be exercised unless it has vested. Where a SAR vests, a participant may not exercise the
SAR until the first time after the time the SAR vests that the participant is able to deal with shares in the
Company under the Company’s securities trading policy.
SARs are exercised by submitting a notice of exercise to the Company.
Lapse: SARs will lapse where:
• the SARs have not vested by the final retesting date which is five years after the date of grant (see
above);
• if the SARs have vested by the final retesting date that is five years after the date of grant, the SARs
have not been exercised within three months of the date that the SARs would have first been able to
be exercised if they had vested at the final retesting date that is five years after the date of grant;
• This may be more than five years and three months from the date of grant depending on whether the
holder of the SAR is able to deal with shares in the Company under the Company’s securities trading
policy at the date five years after the date of grant;
• the employee ceases to be employed by a member of the Group, and the board determines that
some or all of the SARs lapse (see above);
• the board determines that the employee has committed or it is evident that the employee intends
to commit, any act (whether by commission or omission) which amounts or would amount to fraud or
serious misconduct; or
• the employee provides a notice to the Company that they wish the SARs to lapse.
Share ranking and quotation: Shares provided pursuant to the exercise of a SAR will rank equally with the shares in the Company
then on issue. Quotation on the ASX will be sought for all shares issued upon the exercise of SARs.
SARs are not assignable or transferable.
No right to dividends, bonus or rights issues:
The SARs will not confer on the holder an entitlement to dividends or to participate in bonus issues or
rights issues unless the board determines that the SARs will be satisfied in shares and until the SARs
are exercised and shares are provided to the holder.
For
per
sona
l use
onl
y

Horizon Oil Annual Report 201638
No voting rights: The SARs will not confer an entitlement to vote at general meetings of the Company unless the board
determines that the SARs will be satisfied in shares and until the SARs are exercised and shares are
provided to the holder.
Non-quotation: The Company will not apply to the ASX for official quotation of the SARs.
Capital re-organisation: In the event of a reorganisation of the capital of the Company, the rights of the SARs holder will be
changed to the extent necessary to comply with the ASX Listing Rules and shall not result in any
additional benefits being conferred on SARs holders which are not conferred on members.
Effect of take-over or change
of control of Company, death or
disablement:
The LTI Plan contains provisions to deal with SARs where there is a take-over or change of control of
the Company. Depending on the nature of the take-over or change of control event, the Company will
either have the discretion or be required (if a change of control) to determine a special retesting date
for the performance requirements discussed above.
For example, the board will have discretion to determine a special retesting date where a takeover
bid is made for the Company or a scheme of arrangement is entered into. In that case, the special
retesting date will be the date determined by the board. Where a statement is lodged with the
ASX that a person has become entitled to acquire more than 50% of the Company, the board will
be required to determine a special retesting date, and the special retesting date will be the day the
statement is lodged with the ASX.
The SARs may vest if the performance requirements discussed above are satisfied in relation to that
special retesting date.
For the financial year ended 30 June 2016Directors’ Report
Horizon Oil Limited share price (‘HZN’) versus S&P/ASX200 Energy Index and Brent Crude Oil
Performance of Horizon Oil LimitedThe annual performance objectives and
share price hurdle are the means by which
management links company performance
and remuneration policy. Having regard to
the current stage of the Company’s evolution,
linkage of remuneration policy to share price
performance rather than earnings is seen as
the most sensible method of incentivising
employees. In response to the current
depressed share price and the focus on
refinancing of the convertible bonds, any
decision regarding any short-term incentive
entitlements in respect of the current year has
been deferred until after the convertible bond
refinancing arrangements are finalised. The
share price performance of the Company for
the current and previous four financial years is
displayed in the chart adjacent:
The table below shows Horizon Oil Limited’s profit/(loss) before tax for the current and previous four financial years. As mentioned above,
given the current stage of the Company’s evolution, linkage of remuneration policy to earnings is a less relevant measure of incentivising
employees at this stage.
Financial year ended 30 June: 2012 2013 2014 2015 2016
Profit before tax (US$’000) 23,689 10,025 30,027 17,751 (149,726)
EBITDAX (US$’000) 37,378 27,719 99,481 89,117 53,995
B. Details of remuneration
Amounts of remunerationDetails of the remuneration of the directors and other key management personnel (as defined by AASB 124 ‘Related Party Disclosures’) of the
Company and the Group are set out in the following tables.
The key management personnel of the Company and the Group includes the directors of Horizon Oil Limited as per page 33, and the
following executive officers, who are also the highest paid executives of the Company and Group:
M Sheridan Chief Financial Officer, Company Secretary, Horizon Oil Limited
A Fernie General Manager Exploration and Development, Horizon Oil Limited
5,000,000
10,000,000
15,000,000
20,000,000
25,000,000
30,000,000
35,000,000
40,000,000
$0.00
$0.05
$0.10
$0.15
$0.20
$0.25
$0.30
$0.35
$0.40
$0.45
$0.50
Jun
-11
Au
g-1
1
Oct
-11
De
c-11
Fe
b-1
2
Ap
r-12
Jun
-12
Au
g-1
2
Oct
-12
De
c-12
Fe
b-1
3
Ap
r-13
Jun
-13
Au
g-1
3
Oct
-13
De
c-13
Fe
b-1
4
Ap
r-14
Jun
-14
Au
g-1
4
Oct
-14
De
c-14
Fe
b-1
5
Ap
r-15
Jun
-15
Au
g-1
5
Oct
-15
De
c-15
Fe
b-1
6
Ap
r-16
Jun
-16
Vol
ume
HZN Volume HZN Share Price S&P/ASX 200 Energy Index (Rebased) Brent Crude Oil (Rebased)
Pric
e (A
$)
For
per
sona
l use
onl
y

Horizon Oil Annual Report 2016 39
For the financial year ended 30 June 2016Directors’ Report
Financial year ended 30 June 2016 and 2015
Short-term benefits Post-employment
benefits Total cash or in-kind
benefit
Long-term
benefits
Share-based
paymentsTotal5
Cash salary
and feesCash bonus
Non-Monetary1
Super-annuation2
Long service leave
accrual3Options/
SARs4
Name US$ US$ US$ US$ US$ US$ US$ US$
Directors:
J Humphrey 2016 95,419 - - 9,065 104,484 - - 104,484
Chairman (from 20 November
2015), Non-executive Director
2015 68,360 - - 6,494 74,854 - - 74,854
E F Ainsworth 2016 59,400 - - 5,643 65,043 - - 65,043
Chairman (until 20 November
2015), Non-executive Director
2015 136,720 - - 12,988 149,708 - - 149,708
B D Emmett 2016 622,713 - 115,612 25,492 763,817 22,388 385,576 1,171,781
Chief Executive Officer,
Executive Director
2015 716,640 - 119,312 29,337 865,289 (29,137) 398,682 1,234,834
G de Nys 2016 44,550 - - 20,493 65,043 - - 65,043
Non-executive Director 2015 51,270 - - 23,584 74,854 - - 74,854
A Stock 2016 59,400 - - 5,643 65,043 - - 65,043
Non-executive Director 2015 68,360 - - 6,494 74,854 - - 74,854
S Birkensleigh 2016 24,369 - - 2,315 26,684 - - 26,684
Non-executive Director 2015 - - - - - - - -
Total directors’ remuneration2016 905,851 - 115,612 68,651 1,090,114 22,388 385,576 1,498,078
2015 1,041,350 - 119,312 78,897 1,239,559 (29,137) 398,682 1,609,104
Total directors’ remuneration
(AUD)52016 1,243,707 - 158,732 94,256 1,496,695 30,148 519,224 2,046,067
2015 1,242,354 - 142,342 94,128 1,478,824 (37,938) 475,636 1,916,522
Other key management personnel:
M Sheridan 2016 449,858 - 23,403 25,492 498,753 17,766 282,756 799,275
Chief Financial Officer,
Company Secretary
2015 517,713 - 21,466 29,337 568,516 10,415 292,367 871,298
A Fernie 2016 449,858 - 91,502 25,492 566,852 17,481 282,756 867,089
General Manager -
Exploration and Development
2015 515,384 - 89,376 29,337 634,097 11,825 292,367 938,289
Total other key management personnel remuneration
2016 899,716 - 114,905 50,984 1,065,605 35,247 565,512 1,666,364
2015 1,033,097 - 110,842 58,674 1,202,613 22,240 584,734 1,809,587
Total other key management
personnel remuneration
(AUD)5
2016 1,235,285 - 157,762 70,000 1,463,047 47,464 761,529 2,272,040
2015 1,232,508 - 132,236 70,000 1,434,744 28,958 697,600 2,161,302
1. Non-monetary benefits include the value of car parking, insurances and other expenses inclusive of Fringe Benefits Tax (‘FBT’).
2. Superannuation includes both compulsory superannuation payments and salary sacrifice payments made on election by directors and KMPs.
3. Reflects the movement in the long service accrual between respective reporting dates.
4. Reflects the theoretical value (calculated as at grant date and converted to US dollars at the foreign exchange rate prevailing at the date of grant) of previously
unvested options/SARs which vested during the financial year.
5. Remuneration is paid in Australian dollars and converted to US dollars at the foreign exchange rate prevailing on the date of the transaction.
For
per
sona
l use
onl
y

Horizon Oil Annual Report 201640
At-risk remuneration summary The following table shows the relative proportions of remuneration that are linked to performance and those that are fixed based on the
amounts disclosed in the table on page 39.
Fixed remuneration At Risk – STI At Risk – LTI
Name 2016 2015 2016 2015 2016 2015
Executive Directors:
B D Emmett 67% 68% 0% 0% 33% 32%
Chief Executive Officer, Executive Director
Other key management personnel:
M Sheridan 65% 66% 0% 0% 35% 34%
Chief Financial Officer, Company Secretary
A Fernie 67% 69% 0% 0% 33% 31%
General Manager - Exploration and Development
The maximum potential remuneration of all key management personnel is split 50% fixed remuneration, 25% at risk – STI and 25% at risk –
LTI. Due to the deferral of any decision regarding any short-term incentive entitlements in respect of the current year until after the convertible
bond refinancing arrangements are finalised, the relative proportion of fixed remuneration and at risk – LTI has increased.
C. Service agreementsRemuneration and other terms of employment for the Chief Executive Officer and other key management personnel are formalised in service
agreements which were renewed during 2015. Each of these agreements includes the provision of other benefits such as health insurance,
car parking and participation, where eligible, in the Horizon Oil Short Term Incentive and Long Term Incentive plans. Other major provisions of
the existing agreements relating to remuneration are set out below:
B D Emmett, Chief Executive Officer• Term of agreement – 2 year period expiring on 31 December 2017.
• Payment of termination benefit on early termination by the employer, other than for gross misconduct, equal to 12 months remuneration.
• Salary levels are subject to annual review.
M Sheridan, Chief Financial Officer, Company Secretary• Term of agreement – 2.5 year period expiring 31 December 2018.
• Payment of termination benefit on early termination by the employer, other than for gross misconduct, equal to 12 months remuneration.
• Salary levels are subject to annual review.
A Fernie, General Manager - Exploration and Development• Term of agreement – 2 year period expiring on 31 December 2017.
• Payment of termination benefit on early termination by the employer, other than for gross misconduct, equal to 12 months remuneration.
• Salary levels are subject to annual review.
D. Share-based compensation – options/share appreciation rightsOptions and share appreciation rights (‘SARs’) have been granted to eligible employees under the Horizon Oil Limited Employee Option
Scheme, the Employee Performance Incentive Plan and the Long Term Incentive Plan. The issue of securities under the Employee Option
Scheme, the Employee Performance Incentive Plan and the Long Term Incentive Plan were approved by shareholders for the purposes of the
ASX Listing Rules at the 2010, 2011, 2012 and 2014 Annual General Meetings.
Options/SARs are granted to executive directors in accordance with the terms of the relevant option scheme or plan and are approved on a
case by case basis by shareholders at relevant general meetings.
For the financial year ended 30 June 2016Directors’ Report F
or p
erso
nal u
se o
nly

Horizon Oil Annual Report 2016 41
The terms and conditions of each grant of options/SARs affecting remuneration in the previous, this or future reporting periods are as follows:
Grant date Expiry date Exercise price Value per option/SAR at grant date
Date exercisable
05/8/2011 05/11/2016 A$0.31291,2 A$0.1514 100% after 05/08/2014
13/8/2012 13/08/2017 A$0.27101,2 A$0.1025 100% after 13/08/20153
19/8/2013 19/08/2018 A$0.3326 A$0.1193 100% after 19/08/20163
01/7/2014 01/07/2019 A$0.3729 A$0.1433 100% after 01/07/20173
01/7/2015 01/07/2020 A$0.0865 A$0.0438 100% after 01/07/20183
1. No price is payable by a participant in the Long Term Incentive Plan on the exercise of a SAR.
2. The exercise price of the options and SARS outstanding at 31 July 2013 were reduced by A$0.006 following the rights issue during the 2014 financial year.
3. The SARs will become exercisable subject to the relevant performance hurdles being met on vesting.
No new options were granted as remuneration to directors or key management personnel during the financial year. In place of options, SARs
were granted to the executive director and key management personnel under the new Long Term Incentive Plan. Details of SARs provided as
remuneration to the executive director and each of the key management personnel are set out below:
Name Number of SARs granted during the financial year
Value of SARs at grant date1 US $
Number of SARs vested during the financial year
Number of SARs lapsed during the financial year
Value at lapse date2
US $
Directors:
B D Emmett 10,171,063 341,748 - - -
Other key management personnel:
M Sheridan 7,458,777 250,615 - - -
A Fernie 7,458,777 250,615 - - -
1. The value at grant date calculated in accordance with AASB 2 ‘Share-based Payment’ of SARs granted during the financial year as part of remuneration.
2. The value at lapse date of SARs that were granted as part of remuneration and that lapsed during the financial year because a vesting condition was not satisfied. The
value is determined at the time of lapsing, but assuming the condition was satisfied.
The amounts disclosed for the remuneration of directors and other key management personnel include the assessed fair values of options/
SARs granted during the financial year, at the date they were granted. Fair values have been assessed by an independent expert using a
Monte Carlo simulation. Factors taken into account by this model include the exercise price, the term of the option/SAR, the current price
and expected price volatility of the underlying share, the expected dividend yield and the risk-free interest rate for the term of the option/SAR
(refer below). The value attributable to options/SARs is allocated to particular periods in accordance with AASB 2 ‘Share-based Payment’ and
also with the guidelines issued by the Australian Securities and Investments Commission (‘ASIC’) which require the value of an option/SAR at
grant date to be allocated equally over the period from the grant date to the vesting date, unless it is probable that the individual will cease
service at an earlier date, in which case the value is to be spread over the period from grant date to that earlier date. For options/SARs that
vest immediately at grant date, the value is disclosed as remuneration immediately.
The model inputs for each grant of options/SARs during the financial
year ended 30 June 2016 included:
Grant date 1 July 2015
Expiry date 1 July 2020
Exercise price N/A1
10 Day VWAP of Horizon Shares at grant date
A$0.0865
Expected price volatility 57.10% p.a.
Risk free rate 2.32% p.a.
Expected dividend yield 0.00% p.a.
1. No price is payable by a participant in the Long Term Incentive Plan on the
exercise of a SAR.
Shares issued on the exercise of options/share appreciation rights provided as remunerationNo share appreciation rights or remuneration options were exercised
by directors or key management personnel during the financial year.
Further information on options is set out in Note 33.
For the financial year ended 30 June 2016Directors’ Report
Details of remuneration – options/SARsFor each grant of options/SARs in the current or prior financial years
which results in an amount being disclosed in the remuneration
report as a share-based payment to directors and other key
management personnel for the financial year, the percentage of
the grant that vested in the financial year and the percentage that
was forfeited because the person did not meet the service and/or
performance criteria is set out below. The options vest over a three
year period provided the vesting conditions are met. The SARs vest
after three years have lapsed provided the vesting conditions are
met. No options/SARs will vest if the conditions are not satisfied,
therefore the minimum value of the options/SARs yet to vest is
US$Nil. The maximum value of the options/SARs yet to vest has
been determined as the amount of the grant date fair value of the
options/SARs that is yet to be expensed.
For
per
sona
l use
onl
y

Horizon Oil Annual Report 201642
Options/SARs
Name Financial year granted
Vested %
Forfeited %
Financial years in which options/SARs may vest
Maximum total value of grant yet to vest1
US$
B Emmett 2012 - - 30/06/2015 -
2013 - - 30/06/2016 -
2014 - - 30/06/2017 17,381
2015 - - 30/06/2018 134,877
2016 - - 30/06/2019 227,624
M Sheridan 2012 - - 30/06/2015 -
2013 - - 30/06/2016 -
2014 - - 30/06/2017 12,746
2015 - - 30/06/2018 98,910
2016 - - 30/06/2019 166,924
A Fernie 2012 - - 30/06/2015 -
2013 - - 30/06/2016 -
2014 - - 30/06/2017 12,746
2015 - - 30/06/2018 98,910
2016 - - 30/06/2019 166,924
1. The above values have been converted to dollars at the exchange rate prevailing on the date of the grant of the options/SARs.
Equity Interests held by Key Management Personnel
Key management personnel shareholdings in the Company
The numbers of shares in the Company held during the financial year by each director of Horizon Oil Limited and other key management
personnel of the Group, including their personally-related entities, are set out below:
2016 Name
Balance at start of financial year
Received during financial year on the exercise of options
Other changes during financial year
Balance at end of financial year
Directors:Ordinary shares
E F Ainsworth 4,010,375 - - 4,010,3751
J Humphrey 5,112,034 - - 5,112,034
B D Emmett 18,902,607 - - 18,902,607
G de Nys 912,858 - - 912,858
A Stock 160,000 - - 160,000
S Birkensleigh - - - -
Other key management personnel of the Group:Ordinary shares and partly paid ordinary shares
A Fernie 2,700,000 - - 2,700,000
M Sheridan 7,968,201 - - 7,968,201
1. E F Ainsworth was a director and chairman of the Group from the beginning of the year until his retirement and resignation from the board at the Group’s 2015 AGM
on 20 November 2015. Accordingly, this balance represents his shareholding at the date of his retirement from the board.
Key management personnel option holdings in the CompanyThe numbers of options (both listed and unlisted) in the Company held during the financial year by each director of Horizon Oil Limited and
other key management personnel of the Group, including their personally-related entities, are set out below:
No listed or unlisted options were on issue during the current or prior financial year.
All vested options are exercisable at the end of the financial year.
Details of options provided as remuneration and ordinary shares issued on the exercise of such options, together with terms and conditions
of the options, can be found in section D of the Remuneration Report on pages 40 to 42.
For the financial year ended 30 June 2016Directors’ Report F
or p
erso
nal u
se o
nly

Horizon Oil Annual Report 2016 43
Key management personnel share appreciation right holdings in the CompanyThe numbers of share appreciation rights (‘SARs’) held during the financial year by each executive director of Horizon Oil Limited and other
key management personnel of the Group, including their personally-related entities, are set out below:
Share appreciation rights:
2016 Name
Balance at start of
financial year
Granted as remuneration
during financial year
Exercised during
financial year
Lapsed during
financial year
Balance at end of
financial year
Vested and exercisable
at end of financial year
Unvested
Executive Directors:
Share appreciation rights
B D Emmett 15,682,624 10,171,063 - (2,713,714) 23,139,973 2,626,328 20,513,645
Other key management personnel of the Group:
Share appreciation rights
A Fernie 11,500,596 7,458,777 - (1,990,057) 16,969,316 1,925,974 15,043,342
M Sheridan 11,500,596 7,458,777 - (1,990,057) 16,969,316 1,925,974 15,043,342
Details of SARs provided as remuneration and ordinary shares issued on the exercise of such SARs, together with terms and conditions of the
SARs, can be found in section D of the Remuneration Report on pages 40 to 42.
Loans to Directors and Other Key Management PersonnelThere were no loans to Directors or other key management
personnel during the financial year.
Other Transactions with Directors and Other Key Management PersonnelThere were no other transactions with Directors and other key
management personnel during the financial year.
Shares under optionUnissued ordinary shares of Horizon Oil Limited under option at the
date of this report are as follows:
Date options granted
Number options
Issue price of ordinary shares
Expiry date
28/05/2012 1,666,667 A$0.2641,2,3 28/05/2017
17/09/2012 500,000 A$0.2941,2,3 17/09/2017
20/02/2013 350,000 A$0.4341,2,3 20/02/2018
16/04/2013 350,000 A$0.4041,2,3 16/04/2018
02/11/2015 1,500,000 A$0.2001,2 02/11/2020
4,366,667
1. Subject to restrictions on exercise.
2. General options issued.
3. The exercise price of the options outstanding at 31 July 2013 were reduced by
A$0.006 following the rights issue during the prior year.
No option holder has any right under the options to participate in any
other share issue of the Company or any other entity.
DividendsNo dividend has been paid or declared by the Company to the
shareholders since the end of the prior financial year.
For the financial year ended 30 June 2016Directors’ Report
Insurance of OfficersDuring the financial year, Horizon Oil Limited paid a premium to
insure the directors and secretaries of the Company and related
bodies corporate. The insured liabilities exclude conduct involving
a wilful breach of duty or improper use of information or position to
gain a personal advantage. The contract prohibits the disclosure of
the premium paid.
The officers of the Company covered by the insurance policy include
the directors and secretaries, and other officers who are directors or
secretaries of subsidiaries who are not also directors or secretaries of
Horizon Oil Limited.
The liabilities insured include costs and expenses that may be
incurred in defending civil or criminal proceedings that may be
brought against the officers in their capacity as officers of the
Company or a related body corporate.
Non-Audit ServicesThe Company may decide to employ PricewaterhouseCoopers on
assignments additional to its statutory audit duties where the external
auditor’s expertise and experience with the Company and/or the
Group are important.
Details of the amounts paid or payable to PricewaterhouseCoopers
for audit and non-audit services provided during the financial year are
set out below.
The Board of Directors has considered the position and, in
accordance with the written advice received from the Audit
Committee, is satisfied that the provision of non-audit services is
compatible with the general standard of independence for external
auditors imposed by the Corporations Act 2001. The directors are
satisfied that the provision of non-audit services by the external
auditor, as set out below, did not compromise the external auditor
independence requirements of the Corporations Act 2001 for the
following reasons:
• all non-audit services have been reviewed by the Audit Committee
to ensure they do not impact the impartiality and objectivity of the
external auditor; and
• none of the services undermine the general principles relating to
auditor independence as set out in Australian Professional Ethical
Standards 110 Code of Ethics for Professional Accountants,
including reviewing or auditing the auditor’s own work, acting in a
management or a decision-making capacity for the Group, acting
as advocate for the Group or jointly sharing economic risk and
rewards.
For
per
sona
l use
onl
y

Horizon Oil Annual Report 201644
Consolidated
2016 2015
US$ US$
During the financial year, the following fees were paid or payable for services provided by the
external auditor of the parent entity and its related practices:
1. PwC Australia
Audit and other assurance services
Audit and review of financial reports 144,082 154,228
Other assurance services 15,114 156,589
Other services - 2,419
Total remuneration for audit and other assurance services 159,196 313,236
Taxation services
Tax compliance1 24,555 111,717
Total remuneration for taxation services 24,555 111,717
2. Non-PwC audit firms
Audit and other assurance services 11,187 18,833
Other services - -
Total remuneration for audit and other assurance services 11,187 18,833
Total auditors’ remuneration 194,938 443,786
1. Remuneration for taxation services has been recorded on a gross basis, some of these fees were for services provided to PNG operated joint ventures.
External Auditor’s Independence DeclarationA copy of the external auditors’ independence declaration as required under section 307C of the Corporations Act 2001 is set out on
page 45.
Rounding of amounts to the nearest thousand dollarsThe amounts contained in this report, and in the financial report, have been rounded under the option available to the Group under ASIC
Corporations (Rounding in Financial/Directors’ Reports) Instrument 2016/191. The Group is an entity of the kind to which the Class Order
applies, and accordingly amounts in the Directors’ Report have been rounded off in accordance with that Class Order to the nearest thousand
dollars or, in certain cases, to the nearest dollar.
External AuditorPricewaterhouseCoopers continues in office in accordance with section 327 of the Corporations Act 2001.
This report is made in accordance with a resolution of the directors.
J S Humphrey Chairman
B D Emmett Chief Executive Officer
Sydney
30 August 2016
For the financial year ended 30 June 2016Directors’ Report F
or p
erso
nal u
se o
nly

Horizon Oil Annual Report 2016 45
Auditors’ Independence Declaration
Auditor’s Independence DeclarationAs lead auditor for the audit of Horizon Oil Limited for the year ended 30 June 2016, I declare that to the best of my knowledge and belief, there have been:
1. no contraventions of the auditor independence requirements of the Corporations Act 2001 in relation to the audit; and
2. no contraventions of any applicable code of professional conduct in relation to the audit.
This declaration is in respect of Horizon Oil Limited and the entities it controlled during the period.
Peter Buchholz SydneyPartner 30 August 2016PricewaterhouseCoopers
PricewaterhouseCoopers, ABN 52 780 433 757Darling Park Tower 2, 201 Sussex Street, GPO BOX 2650, SYDNEY NSW 1171T: +61 2 8266 0000, F: +61 2 8266 9999, www.pwc.com.au
Liability limited by a scheme approved under Professional Standards Legislation.
PricewaterhouseCoopers, ABN 52 780 433 757Darling Park Tower 2, 201 Sussex Street, GPO BOX 2650, SYDNEY NSW 1171T: +61 2 8266 0000, F: +61 2 8266 9999, www.pwc.com.au
Liability limited by a scheme approved under Professional Standards Legislation.
Auditor’s Independence Declaration
As lead auditor for the audit of Horizon Oil Limited for the year ended 30 June 2015, I declare that tothe best of my knowledge and belief, there have been:
a) no contraventions of the auditor independence requirements of the Corporations Act 2001 inrelation to the audit; and
b) no contraventions of any applicable code of professional conduct in relation to the audit.
This declaration is in respect of Horizon Oil Limited and the entities it controlled during the period.
Peter Buchholz SydneyPartnerPricewaterhouseCoopers
25 August 2015
F
or p
erso
nal u
se o
nly

Horizon Oil Annual Report 201646
Sustainability ReportIntroduction
Horizon Oil is committed to the sustainable development of its operations. This Sustainable Development Report focuses on assets for which Horizon Oil was the designated operator. Where Horizon Oil is a non-operating joint venture partner it is assumed that sustainable development reporting is undertaken on behalf of the joint venture by the designated operator. Horizon Oil is committed to the audit and assessment of joint venture partners operating on its behalf to ensure that activities are conducted in a manner consistent with our expectations around the sustainable development of our assets. This report is for the financial year ending 30 June 2016.
Horizon Oil’s philosophy towards sustainable development remains
based upon the foundations of its corporate policy. This includes
the following four areas that Horizon Oil regards as the pillars of its
sustainable development strategy:
• Health and Safety;
• Security;
• Environment; and
• Community.
Each pillar is discussed in greater detail within this Sustainable
Development Report.
Health and Safety Horizon Oil is committed to maintaining a safe and healthy working
environment for all its personnel including sub-contractors, attending
vendors and visitors.
Horizon Oil targets an injury rate that outperforms the average within
the overall industry as reported in the Safety Performance Indicator
Series published annually by the International Association of Oil
& Gas Producers. This year, Horizon Oil outperformed this target.
There were no fatalities, and Horizon Oil achieved a Total Recordable
Injury Frequency Rate (TRIFR) and a Lost Time Injury Frequency Rate
(LTIFR) of 0.0.
In August of 2015, Horizon Oil celebrated 12 months free of
recordable injuries. The current injury-free performance period
represents the longest period recordable injury free of any time in
Horizon Oil’s operational history.
Year FY14 FY15 FY16
LTIFR 2.8 0.0 0.0
TRIFR 7.0 0.9 0.0
No. of Recordable
Injuries
5 1 0
Table 1 – Total Recordable Injury Frequency Rate (TRIFR) for Horizon Oil
This year there was a significant reduction in the nature and scale
of in-field activities conducted by the Company. Total exposure
hours during the year were < 20% of those experienced at any other
reporting period.
Health ProgramsHorizon Oil is committed to the health and welfare of its workforce.
During the year, Horizon Oil implemented a periodic health
assessment program for its employees in Papua New Guinea. This
included a targeted vaccination program for employees locally
sourced, working and living in high-risk environments. Employee
health is tracked via periodic medical examination and supported by
the provision of a full range of vaccinations to combat key identified
health risks. This includes preventative vaccination against common
disease such as cholera, typhoid, Japanese encephalitis, polio,
tetanus, influenza and hepatitis.
Horizon Oil continued to contribute to the development of capability
within community health systems by conducting a review of the
capabilities and resources available to local health and medical
facilities. Based on this review, Horizon Oil successfully partnered
equipment, capability and demand to help provide effective
contribution to community health within the Company’s operational
areas.
During the year, Horizon Oil’s Kiunga based personnel conducted
first aid training as part of the ongoing HSSE skills development
program. The training was designed to provide first response
capability in remote locations and when limited medical response
capability is available. As the majority of the Company’s employees
in Papua New Guinea are locally-sourced and residentially-based,
these skills were transferred directly back into the communities.
For the financial year ended 30 June 2016F
or p
erso
nal u
se o
nly

Horizon Oil Annual Report 2016 47
Figure 1: Horizon Oil employees practise their CPR Figure 3: The team presents medical equipment to Kiunga hospital
personnel
SecurityHorizon Oil maintains a Security Policy which sets out standards for
the protection of its personnel, assets and the public. Horizon Oil
conducts its operations in a manner consistent with the Voluntary Principles on Security and Human Rights. During the year, no
breaches of the Principles were reported.
Recent episodes of unrest in Port Moresby have been cause for
some concern. The Company is committed to ensuring that its
personnel are safe and protected from such events. Accordingly,
the Company maintains travel management, vehicle and personal
security systems to safeguard the security of its personnel. Horizon
Oil’s personnel have not been impacted directly by the unrest,
however, Horizon Oil continues to monitor the situation through
both official sources and its extensive network of informal contacts
within the country. The Company remains committed to responding
proactively to developing circumstances that may impact the
personal security of its personnel.
EnvironmentHorizon Oil achieved a key milestone by receiving formal approval
of the Elevala Development Project environment impact statement
from the Conservation and Environment Protection Authority and was
issued an environment permit setting out the conditions and controls
required for the proposed activities. The Company complied with all
of its environmental permit conditions for the year.
During the year, the Company maintained an environmental
monitoring program. The program included quarterly reviews of an
established network to gain an overall understanding of seasonal
variations in the Company’s proposed area of operation. Analysis of
the results indicates a healthy and dynamic riverine system with no
evidence of impact from historical oil and gas activities in the area.
As part of the environmental monitoring program, the Company
expanded the monitoring network to develop and implement a
baseline riverbank erosion program for the project area. This
measure was taken to develop a comprehensive understanding of
riverbank conditions prior to the project and included local land-
owners as key members of the team that assessed and established
the locations.
Figure 2: Taking a break during a sampling run
Figure 4: Taking measurements of riverbank erosion
The 2015/16 El Nino eventEl Nino is a natural, periodic and recurring event. This year Papua
New Guinea experienced one of the strongest El Nino events in
recent history. The impact of El Nino in Papua New Guinea was
primarily through a severe restriction to rainfall (>40% reduction)
throughout the region. The resultant reduction in water levels along
the Fly River rendered it unnavigable to anything other than small
watercraft for long periods during the event. The supply of critical
materials such as food and fuel was seriously disrupted for a number
of months with the Ok Tedi mining operations taking the step to
cease operations until weather conditions had recovered to a level
that allowed reliable access to shipping along the Fly River.
Restrictions to supply had a significant impact on availability and cost
of basic living materials within the community. Horizon Oil took the
initiative to reduce its presence to business-critical and residential
personnel thereby avoiding exacerbation of existing supply shortfalls.
During El Nino field-based personnel continued to undertake
monitoring of the environmental impacts of the event. This included
water quality, flows and availability. It also included assessment of the
impacts on local environmental systems of flora and fauna. A study of
produce available revealed a reduction in the availability of fruit and
vegetables, however protein produce increased as the community
took advantage of the concentrated fish stocks that resulted from the
low water levels.
Studies conducted by Horizon Oil during the recent El Nino event
provide invaluable insights that allow Horizon Oil to frame its
response and planned activities should a similar event occur in the
future.
For the financial year ended 30 June 2016Sustainability Report F
or p
erso
nal u
se o
nly

Horizon Oil Annual Report 201648
CommunityHorizon Oil seeks to conduct its operations in a manner that is
transparent, respectful of the rights of all stakeholders and promotes
sustainable social and economic development within the Company’s
project area communities. Horizon Oil recognises that strong
relationships with host communities are essential in maintaining both
a sustainable business and its social licence to operate.
This year saw a significant reduction in the nature and the scale
of in-field activities conducted by the Company. Nonetheless,
engagement with project area communities remained ongoing, with
face to face contact - essential for building positive relationships -
being a core aspect of that engagement. During the year, Horizon
Oil continued its program of regular 'village patrols' supplemented
by the publication of its monthly newsletter, 'Komuniti Nius', in order
to disseminate information about current and planned activities.
Many of Horizon Oil's project area communities are located in
remote, difficult to reach areas where access to postal services or
telecommunications is extremely limited or non-existent. The village
patrols, which involve Company personnel travelling to remote
communities (often staying overnight) to conduct face to face
information sessions, provide community members with an important
opportunity to ask questions, share their views or offer insights into
Horizon Oil's activities.
Horizon Oil continues to support a number of social investment
programs in Papua New Guinea. In particular, substantial financial
and in-kind support is provided to two non-government organisations
active in the Western Province, namely Australian Doctors
International (ADI) and Mercy Works. Both organisations are focused
on improving healthcare services in the North Fly region of the
Western Province, where they seek to build partnerships with local
communities to enhance capacity and self reliance in areas where
access to basic health care is limited or non-existent. With Horizon
Oil's support, this year saw the re-establishment of ADI’s remote area
medical patrols in the Western Province for the first time in 6 years.
In the course of these medical patrols, a single ADI Doctor treated
499 patients and delivered 35 hours of in-service training to rural
community health workers. Also, during the year, a series of small
scale community investment projects were being developed for
implementation in partnership with project area communities. These
projects are on track to be rolled out in 2017.
The 2015/2016 El Nino event and associated severe dry weather
conditions had a significant impact on communities in and around
Horizon Oil's project area. Supplies of food and water were greatly
restricted and many community members were obliged to leave their
usual village houses for remote bush camps in search of reliable
sources of food and water. Disaster relief in the form of staple
foodstuffs (e.g. rice) was ultimately made available by the Fly River
Provincial Government. In addition to its social investment programs
and consistent with its desire to be a good corporate citizen, Horizon
Oil, along with other businesses active in the region, assisted the Fly
River Provincial Government with in-kind assistance to transport and
distribute these much needed relief supplies to various communities
in the North Fly region of Western Province.
Figure 5: Dr Anna Morris of ADI examining a patient at Gasuke village, Western
Province, PNG
Figure 6: Horizon Oil Community Affairs officer conducting a community
information session at Gusiore Village, Western Province, PNG
ConclusionHorizon Oil is committed to the sustainable development of its
operations within the communities and environments that host its
activities. The Company regards this commitment as an integral
component of an ongoing, long-term engagement with its host
communities.
Horizon Oil builds its activities on a framework established by
corporate policy and assesses its performance against both internal
and industry standards.
The 2016 Annual Report marks the third submission of Horizon
Oil’s Sustainability Report as an ongoing component of its corporate
reporting. The Company remains open to feedback from its
stakeholders regarding the content and structure of sustainable
development reporting.
For the financial year ended 30 June 2016Directors’ Report F
or p
erso
nal u
se o
nly

Horizon Oil Annual Report 2016 49
Independent auditor’s report to the members of Horizon Oil Limited
Report on the financial reportWe have audited the accompanying financial report of Horizon Oil Limited (the company), which comprises the consolidated statement of financial position as at 30 June 2016, the consolidated statement of profit or loss and other comprehensive income, consolidated statement of changes in equity and consolidated statement of cash flows for the year ended on that date, a summary of significant accounting policies, other explanatory notes and the directors’ declaration for Horizon Oil Limited Group (the consolidated entity). The consolidated entity comprises the company and the entities it controlled at year’s end or from time to time during the financial year.
Directors' responsibility for the financial reportThe directors of the company are responsible for the preparation of the financial report that gives a true and fair view in accordance with Australian Accounting Standards and the Corporations Act 2001 and for such internal control as the directors determine is necessary to enable the preparation of the financial report that is free from material misstatement, whether due to fraud or error. In Note 1, the directors also state, in accordance with Accounting Standard AASB 101 Presentation of Financial Statements, that the financial statements comply with International Financial Reporting Standards.
Auditor’s responsibilityOur responsibility is to express an opinion on the financial report based on our audit. We conducted our audit in accordance with Australian Auditing Standards. Those standards require that we comply with relevant ethical requirements relating to audit engagements and plan and perform the audit to obtain reasonable assurance whether the financial report is free from material misstatement.
An audit involves performing procedures to obtain audit evidence about the amounts and disclosures in the financial report. The procedures selected depend on the auditor’s judgement, including the assessment of the risks of material misstatement of the financial report, whether due to fraud or error. In making those risk assessments, the auditor considers internal control relevant to the consolidated entity’s preparation and fair presentation of the financial report in order to design audit procedures that are appropriate in the circumstances, but not for the purpose of expressing an opinion on the effectiveness of the entity’s internal control. An audit also includes evaluating the appropriateness of accounting policies used and the reasonableness of accounting estimates made by the directors, as well as evaluating the overall presentation of the financial report.
We believe that the audit evidence we have obtained is sufficient and appropriate to provide a basis for our audit opinion.
IndependenceIn conducting our audit, we have complied with the independence requirements of the Corporations Act 2001.
PricewaterhouseCoopers, ABN 52 780 433 757Darling Park Tower 2, 201 Sussex Street, GPO BOX 2650, SYDNEY NSW 1171T: +61 2 8266 0000, F: +61 2 8266 9999, www.pwc.com.au
Liability limited by a scheme approved under Professional Standards Legislation. PricewaterhouseCoopers, ABN 52 780 433 757
Darling Park Tower 2, 201 Sussex Street, GPO BOX 2650, SYDNEY NSW 1171T: +61 2 8266 0000, F: +61 2 8266 9999, www.pwc.com.au
Liability limited by a scheme approved under Professional Standards Legislation.
Auditor’s Independence Declaration
As lead auditor for the audit of Horizon Oil Limited for the year ended 30 June 2015, I declare that tothe best of my knowledge and belief, there have been:
a) no contraventions of the auditor independence requirements of the Corporations Act 2001 inrelation to the audit; and
b) no contraventions of any applicable code of professional conduct in relation to the audit.
This declaration is in respect of Horizon Oil Limited and the entities it controlled during the period.
Peter Buchholz SydneyPartnerPricewaterhouseCoopers
25 August 2015
For the financial year ended 30 June 2016F
or p
erso
nal u
se o
nly

Horizon Oil Annual Report 201650
Auditor’s opinionIn our opinion:
(a) the financial report of Horizon Oil Limited is in accordance with the Corporations Act 2001,including:
1. giving a true and fair view of the consolidated entity's financial position as at 30 June 2016 and of its performance for the year ended on that date; and
2. complying with Australian Accounting Standards and the Corporations Regulations 2001. (b) the financial report and notes also comply with International Financial Reporting Standards as disclosed in Note 1.
Material Uncertainty Regarding Continuation as a Going ConcernWithout modifying our audit report, we draw attention to Note 1 b) in the financial report, which indicates that the consolidated entity incurred a net loss after tax of US $144,525,000 during the year ended 30 June 2016, has a net current asset deficiency of US $60,413,000 at that date and comments on the consolidated entity’s plans to address the net current asset deficiency. These conditions, along with other matters set forth in Note 1, indicate the existence of a material uncertainty that may cast significant doubt about the consolidated entity’s ability to continue as a going concern and therefore, the consolidated entity may be unable to realise its assets and discharge its liabilities in the normal course of business and at the amounts stated in the financial report.
Report on the Remuneration ReportWe have audited the remuneration report included in pages 34 to 43 of the directors’ report for the year ended 30 June 2016. The directors of the company are responsible for the preparation and presentation of the remuneration report in accordance with section 300A of the Corporations Act 2001. Our responsibility is to express an opinion on the remuneration report, based on our audit conducted in accordance with Australian Auditing Standards.
Auditor’s opinionIn our opinion, the remuneration report of Horizon Oil Limited for the year ended 30 June 2016 complies with section 300A of the Corporations Act 2001.
PricewaterhouseCoopers
Peter Buchholz SydneyPartner 30 August 2016
PricewaterhouseCoopers, ABN 52 780 433 757Darling Park Tower 2, 201 Sussex Street, GPO BOX 2650, SYDNEY NSW 1171T: +61 2 8266 0000, F: +61 2 8266 9999, www.pwc.com.au
Liability limited by a scheme approved under Professional Standards Legislation.
Auditor’s Independence Declaration
As lead auditor for the audit of Horizon Oil Limited for the year ended 30 June 2015, I declare that tothe best of my knowledge and belief, there have been:
a) no contraventions of the auditor independence requirements of the Corporations Act 2001 inrelation to the audit; and
b) no contraventions of any applicable code of professional conduct in relation to the audit.
This declaration is in respect of Horizon Oil Limited and the entities it controlled during the period.
Peter Buchholz SydneyPartnerPricewaterhouseCoopers
25 August 2015
For the financial year ended 30 June 2016Independent Audit Report to the members of Horizon Oil LimitedF
or p
erso
nal u
se o
nly

Horizon Oil Annual Report 2016 51
Directors’ Declaration
In the directors’ opinion:
(a) the financial statements and notes are in accordance with the Corporations Act 2001 including:
(i) complying with Australian Accounting Standards, the Corporations Regulations 2001 and other mandatory professional reporting
requirements; and
(ii) giving a true and fair view of the consolidated entity’s financial position as at 30 June 2016 and of its performance for the financial year
ended on that date; and
(b) there are reasonable grounds to believe that the Company will be able to pay its debts as and when they become due and payable; and
Note 1 confirms that the financial statements also comply with International Financial Reporting Standards as issued by the International
Accounting Standards Board.
The directors have been given the declarations by the Chief Executive Officer and Chief Financial Officer required by Section 295A of the
Corporations Act 2001.
This declaration is made in accordance with a resolution of the directors.
J S Humphrey Chairman
B D Emmett Chief Executive Officer
Sydney
30 August 2016
For the financial year ended 30 June 2016F
or p
erso
nal u
se o
nly

Horizon Oil Annual Report 201652
Consolidated
Note 2016 2015
US$’000 US$’000
Revenue from continuing operations 5 75,952 103,950
Cost of sales 6 (60,179) (59,970)
Gross profit 15,773 43,980
Other income 5 3,638 6,842
General and administrative expenses 6 (8,094) (7,569)
Exploration and development expenses 6 (1,852) (16,222)
Impairment of non-current assets 6, 29 (147,515) -
Financing costs 6 (17,264) (17,360)
Unrealised movement in value of convertible bond conversion rights 5 5,322 9,063
Gain on buyback of convertible bonds during the period 5 1,193 -
Other expenses 6 (927) (983)
(Loss)/profit before income tax expense (149,726) 17,751
NZ royalty tax expense 7a (988) (4,299)
Income tax benefit/(expense) 7b 6,189 4,855
(Loss)/profit for the financial year (144,525) 18,307
Other comprehensive income
Items that may be reclassified to profit or lossChanges in the fair value of cash flow hedges
25a (8,237) 14,394
Total comprehensive (loss)/income for the financial year (152,762) 32,701
(Loss)/profit attributable to:
Security holders of Horizon Oil Limited (144,471) 18,333
Non-controlling interests (54) (26)
(Loss)/profit for the period (144,525) 18,307
Total comprehensive (loss)/income attributable to:
Security holders of Horizon Oil Limited (152,708) 32,727
Non-controlling interests (54) (26)
Total comprehensive (loss)/income for the period (152,762) 32,701
Earnings per share for (loss)/profit attributable to ordinary equity holders of Horizon Oil Limited:
US cents
US cents
Basic earnings per ordinary share 41a (11.08) 1.41
Diluted earnings per ordinary share 41b (11.08) 1.41
The above consolidated statement of profit or loss and other comprehensive income should be read in conjunction with the accompanying
notes.
Consolidated statement of profit or loss and other comprehensive income
For the financial year ended 30 June 2016F
or p
erso
nal u
se o
nly

Horizon Oil Annual Report 2016 53
Consolidated statement of financial position As at 30 June 2016
Consolidated
Note 2016 2015
US$’000 US$’000
Current assets
Cash and cash equivalents 8 16,079 61,343
Receivables 9 9,932 14,580
Inventories 10 1,792 4,907
Derivative financial instruments 19 - 11,399
Current tax receivable 11 650 2,091
Other assets 12 1,655 1,435
Total current assets 30,108 95,755
Non-current assets
Deferred tax assets 13 6,453 11,165
Plant and equipment 14 1,886 5,065
Exploration phase expenditure 15 53,613 96,959
Oil and gas assets 16 194,612 314,395
Total non-current assets 256,564 427,584
Total assets 286,672 523,339
Current liabilities
Payables 17 12,501 16,781
Deferred income 18 - 2,212
Current tax payable 125 271
Borrowings 20 76,937 97,104
Other financial liabilities 21 530 7,961
Provisions 23 428 3,181
Total current liabilities 90,521 127,510
Non-current liabilities
Payables 22 15
Deferred tax liabilities 22 15,924 29,408
Borrowings 20 67,428 97,286
Provisions 23 8,243 12,803
Total non-current liabilities 91,617 139,512
Total liabilities 182,138 267,022
Net assets 104,534 256,317
Equity
Contributed equity 24 174,801 174,801
Reserves 25a 12,030 19,288
Retained profits 25b (82,217) 62,254
Total equity attributable to equity holders of the Company 104,614 256,343
Non-controlling interest (80) (26)
Total equity 104,534 256,317
The above consolidated statement of financial position should be read in conjunction with the accompanying notes.For
per
sona
l use
onl
y
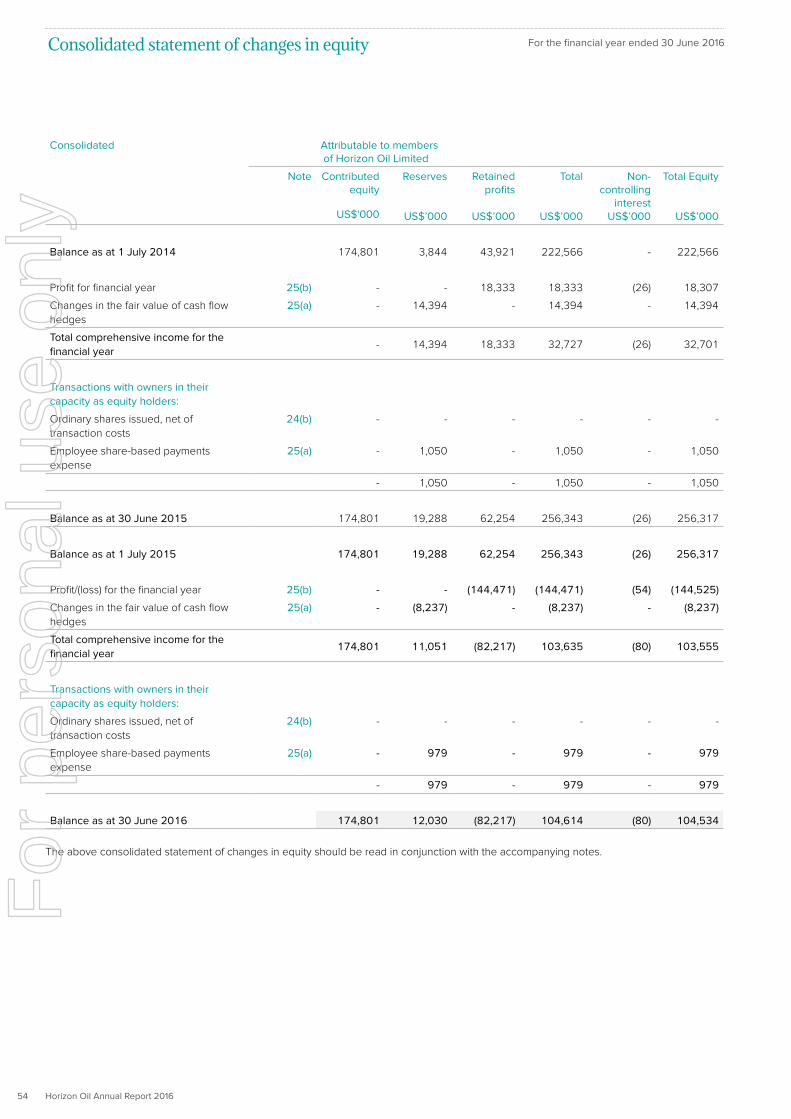
Horizon Oil Annual Report 201654
Consolidated Attributable to members of Horizon Oil Limited
Note Contributed equity
US$'000
Reserves
US$’000
Retained profits
US$’000
Total
US$’000
Non-controlling
interest US$’000
Total Equity
US$’000
Balance as at 1 July 2014 174,801 3,844 43,921 222,566 - 222,566
Profit for financial year 25(b) - - 18,333 18,333 (26) 18,307
Changes in the fair value of cash flow
hedges
25(a) - 14,394 - 14,394 - 14,394
Total comprehensive income for the financial year
- 14,394 18,333 32,727 (26) 32,701
Transactions with owners in their capacity as equity holders:
Ordinary shares issued, net of
transaction costs
24(b) - - - - - -
Employee share-based payments
expense
25(a) - 1,050 - 1,050 - 1,050
- 1,050 - 1,050 - 1,050
Balance as at 30 June 2015 174,801 19,288 62,254 256,343 (26) 256,317
Balance as at 1 July 2015 174,801 19,288 62,254 256,343 (26) 256,317
Profit/(loss) for the financial year 25(b) - - (144,471) (144,471) (54) (144,525)
Changes in the fair value of cash flow
hedges
25(a) - (8,237) - (8,237) - (8,237)
Total comprehensive income for the financial year
174,801 11,051 (82,217) 103,635 (80) 103,555
Transactions with owners in their capacity as equity holders:
Ordinary shares issued, net of
transaction costs
24(b) - - - - - -
Employee share-based payments
expense
25(a) - 979 - 979 - 979
- 979 - 979 - 979
Balance as at 30 June 2016 174,801 12,030 (82,217) 104,614 (80) 104,534
The above consolidated statement of changes in equity should be read in conjunction with the accompanying notes.
Consolidated statement of changes in equity
For the financial year ended 30 June 2016F
or p
erso
nal u
se o
nly

Horizon Oil Annual Report 2016 55
Consolidated
Note 2016 2015
US$’000 US$’000
Cash flows from operating activities
Receipts from customers 76,254 104,088
Payments to suppliers and employees (23,180) (33,718)
53,074 70,370
Interest received 25 146
Interest paid (9,806) (8,722)
Income taxes refunded/(paid) 910 (2,951)
Net cash inflow from operating activities 40 44,203 58,843
Cash flows from investing activities
Payments for exploration phase expenditure (8,627) (36,934)
Payments for oil and gas assets (17,487) (45,847)
Payments for China restoration costs (3,774) (12,310)
Payments for plant and equipment (220) (191)
Net cash (outflow) from investing activities (30,108) (95,282)
Cash flows from financing activities
Proceeds from borrowings (net of transaction costs) - 8,076
Repayment of borrowings (58,303) (9,165)
Net cash (outflow) from financing activities (58,303) (1,089)
Net (decrease)/increase in cash and cash equivalents (44,208) (37,528)
Cash and cash equivalents at the beginning of the financial year 61,343 98,911
Effects of exchange rate changes on cash and cash equivalents held in foreign currencies (1,056) (40)
Cash and cash equivalents at the end of the financial year 16,079 61,343
The above consolidated statement of cash flows should be read in conjunction with the accompanying notes.
Consolidated statement of cash flows For the financial year ended 30 June 2016F
or p
erso
nal u
se o
nly
Horizon Oil Annual Report 201656
Note 1. Summary of Significant Accounting PoliciesA summary of the significant accounting policies adopted in the
preparation of the financial statements are set out below. These
policies have been consistently applied, unless otherwise stated.
The financial statements are for the consolidated entity consisting
of Horizon Oil Limited and its subsidiaries (the ‘Group’). For the
purposes of preparing the financial statements, the consolidated
entity is a for profit entity.
The nature of the operations and principal activities for the Group are
described in the Directors’ Report.
a) Statement of complianceThese general purpose financial statements have been prepared in
accordance with Australian Accounting Standards, other authoritative
pronouncements of the Australian Accounting Standards Board
(‘AASB’), Urgent Issues Group Interpretations and the Corporations Act 2001.
The consolidated financial statements comply with Australian
Accounting Standards as issued by the AASB and International
Financial Reporting Standards (‘IFRS’) as issued by the International
Accounting Standards Board (‘IASB’).
b) Basis of preparationThese financial statements are presented in United States dollars
and have been prepared under the historical cost convention, as
modified by the revaluation of financial assets and liabilities (including
derivative instruments) at fair value through profit or loss, or other
comprehensive income where hedge accounting is adopted.
The Company is of a kind referred to in ASIC Corporations (Rounding
in Financial/Directors’ Reports) Instrument 2016/191 and accordingly
amounts in the financial statements are rounded off to the nearest
thousand dollars, unless otherwise indicated.
The general purpose financial statements for the year ended 30
June 2016 have been prepared on a going concern basis which
contemplates the realisation of assets and settlement of liabilities
in the normal course of business as they become due. As at 30
June 2016, the Group had cash reserves of US$16,079,000 and a
net current asset deficiency of US$60,413,000 resulting from the
classification as current liabilities of borrowings associated with the
remaining US$58,800,000, 5.5% convertible bonds which are due
for redemption on 19 September 2016, combined with presently
scheduled amortisation over the next 12 months of the Group’s
Revolving Cash Advance Facility (refer to Note 20). The Group has
recorded a cash inflow from operating activities of US$44,203,000
and a net loss after tax for the period of US$144,525,000 (including
a non-cash impairment loss of US$147,515,000).
Funding for redemption of the bonds, scheduled principal
repayments under the Group’s Revolving Cash Advance Facility
and the Group’s strategic growth plans, is to be obtained from a
variety of sources. Surplus revenues from the Group’s operations
in China and New Zealand, combined with existing cash balances
and debt drawn from the Group’s US$120 million revolving cash
advance facility provide core funding. In addition, the Group has
executed a loan agreement with IMC Investments Limited for the
provision of a subordinated secured non-amortising debt facility
of US$50 million. Under the provisions of the subordinated loan
agreement, the Company is to issue to IMC 300 million warrants over
unissued shares of the Company, which will have the exercise price
of A$0.061 per share. The loan and issue of the warrants to IMC are
subject to Horizon Oil shareholder approval. A General Meeting of
the Company will be held at 9.00am (Sydney time) on Tuesday,
6 September 2016. A copy of the Notice of Meeting and Explanatory
Statement was sent to Horizon Oil shareholders during the week
commencing 1 August 2016. Financial close and drawdown of the
facility are subject to shareholder approval of the IMC financing
proposal and other customary conditions for a subordinated loan of
this nature.
Taking into account:
• the Group’s cash balance of US$16.1 million at 30 June 2016;
• forecast surplus revenue from the Group’s operations in
New Zealand and China;
• materially reduced budgeted/forecast capital expenditure profile
over the coming 12 months;
• the provision by IMC Investments Limited of a subordinated
secured non-amortising debt facility of US$50 million; and
• hedged production of 270,300 barrels over the following
9 months at an average price of ~US$51/bbl.
The directors expect to have available the necessary cash
reserves to meet redemption obligations under the Company’s
remaining US$58.8 million, 5.5% convertible bonds maturing on
19 September 2016, scheduled principal repayments under the
Group’s Revolving Cash Advance Facility and to pursue the current
strategy. Accordingly, the financial report has been prepared on a
going concern basis. Since the additional IMC debt funding of US$50
million that is required for full redemption of the bonds is subject
to shareholder approval, there is a material uncertainty that may
cast significant doubt on the Group’s ability to continue as a going
concern, and therefore it may be unable to realise its assets and
settle its liabilities and commitments in the normal course of business
and at the amounts stated in the financial report. In addition to the
IMC financing proposal, the directors continue to consider other
initiatives which would add strategic value and/or improve liquidity.
At the date of this report, the directors are of the opinion that no
asset is likely to be realised for amounts less than the amount at
which it is recorded in the financial report as at 30 June 2016.
Accordingly, no adjustments have been made to the financial report
relating to the recoverability and classification of the asset carrying
amounts or the amounts and classification of liabilities that might be
necessary should the Group not continue as a going concern.
New and amended standards adopted by the Group
The Group has adopted all of the new and revised Australian
Accounting Standards and Interpretations issued by the Australian
Accounting Standards Board (‘AASB’) that are relevant to its
operations and effective for the financial year ended 30 June 2016.
None of the new and revised standards and interpretations were
deemed to have a material impact on the results of the Group.
Notes to the financial statements For the financial year ended 30 June 2016F
or p
erso
nal u
se o
nly
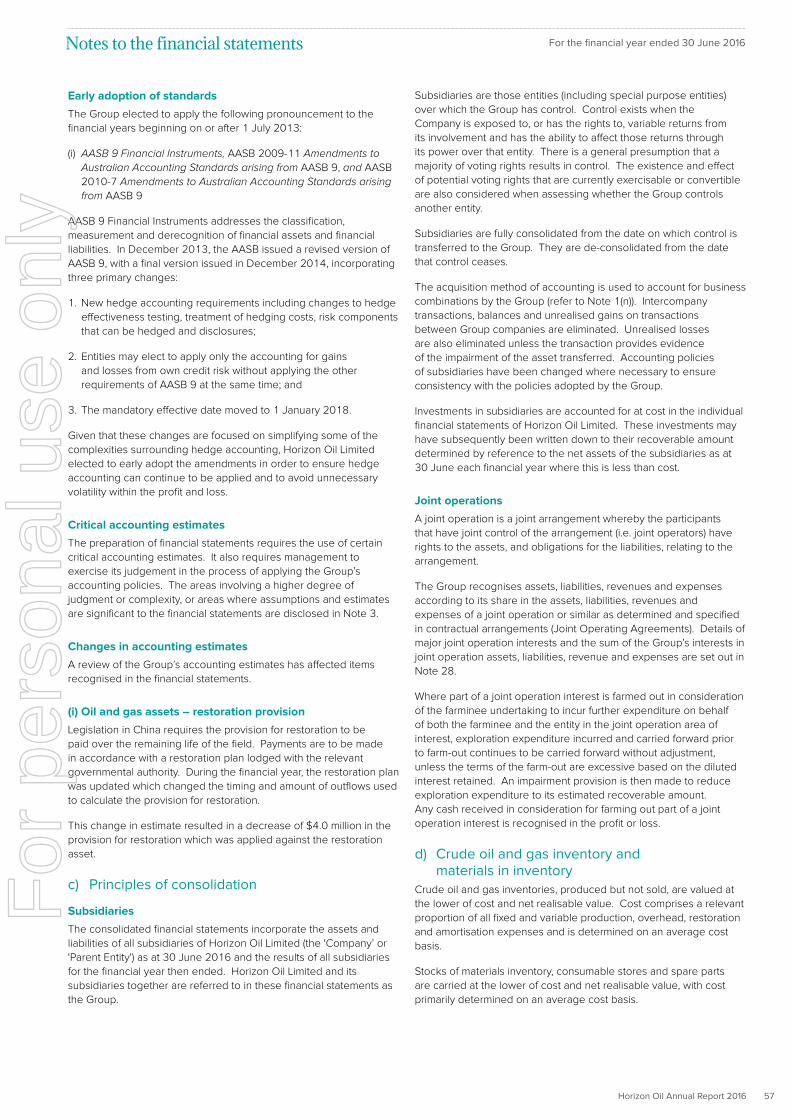
Horizon Oil Annual Report 2016 57
Early adoption of standards
The Group elected to apply the following pronouncement to the
financial years beginning on or after 1 July 2013:
(i) AASB 9 Financial Instruments, AASB 2009-11 Amendments to Australian Accounting Standards arising from AASB 9, and AASB
2010-7 Amendments to Australian Accounting Standards arising from AASB 9
AASB 9 Financial Instruments addresses the classification,
measurement and derecognition of financial assets and financial
liabilities. In December 2013, the AASB issued a revised version of
AASB 9, with a final version issued in December 2014, incorporating
three primary changes:
1. New hedge accounting requirements including changes to hedge
effectiveness testing, treatment of hedging costs, risk components
that can be hedged and disclosures;
2. Entities may elect to apply only the accounting for gains
and losses from own credit risk without applying the other
requirements of AASB 9 at the same time; and
3. The mandatory effective date moved to 1 January 2018.
Given that these changes are focused on simplifying some of the
complexities surrounding hedge accounting, Horizon Oil Limited
elected to early adopt the amendments in order to ensure hedge
accounting can continue to be applied and to avoid unnecessary
volatility within the profit and loss.
Critical accounting estimates
The preparation of financial statements requires the use of certain
critical accounting estimates. It also requires management to
exercise its judgement in the process of applying the Group’s
accounting policies. The areas involving a higher degree of
judgment or complexity, or areas where assumptions and estimates
are significant to the financial statements are disclosed in Note 3.
Changes in accounting estimates
A review of the Group’s accounting estimates has affected items
recognised in the financial statements.
(i) Oil and gas assets – restoration provision
Legislation in China requires the provision for restoration to be
paid over the remaining life of the field. Payments are to be made
in accordance with a restoration plan lodged with the relevant
governmental authority. During the financial year, the restoration plan
was updated which changed the timing and amount of outflows used
to calculate the provision for restoration.
This change in estimate resulted in a decrease of $4.0 million in the
provision for restoration which was applied against the restoration
asset.
c) Principles of consolidation
Subsidiaries
The consolidated financial statements incorporate the assets and
liabilities of all subsidiaries of Horizon Oil Limited (the 'Company’ or
'Parent Entity') as at 30 June 2016 and the results of all subsidiaries
for the financial year then ended. Horizon Oil Limited and its
subsidiaries together are referred to in these financial statements as
the Group.
Subsidiaries are those entities (including special purpose entities)
over which the Group has control. Control exists when the
Company is exposed to, or has the rights to, variable returns from
its involvement and has the ability to affect those returns through
its power over that entity. There is a general presumption that a
majority of voting rights results in control. The existence and effect
of potential voting rights that are currently exercisable or convertible
are also considered when assessing whether the Group controls
another entity.
Subsidiaries are fully consolidated from the date on which control is
transferred to the Group. They are de-consolidated from the date
that control ceases.
The acquisition method of accounting is used to account for business
combinations by the Group (refer to Note 1(n)). Intercompany
transactions, balances and unrealised gains on transactions
between Group companies are eliminated. Unrealised losses
are also eliminated unless the transaction provides evidence
of the impairment of the asset transferred. Accounting policies
of subsidiaries have been changed where necessary to ensure
consistency with the policies adopted by the Group.
Investments in subsidiaries are accounted for at cost in the individual
financial statements of Horizon Oil Limited. These investments may
have subsequently been written down to their recoverable amount
determined by reference to the net assets of the subsidiaries as at
30 June each financial year where this is less than cost.
Joint operations
A joint operation is a joint arrangement whereby the participants
that have joint control of the arrangement (i.e. joint operators) have
rights to the assets, and obligations for the liabilities, relating to the
arrangement.
The Group recognises assets, liabilities, revenues and expenses
according to its share in the assets, liabilities, revenues and
expenses of a joint operation or similar as determined and specified
in contractual arrangements (Joint Operating Agreements). Details of
major joint operation interests and the sum of the Group’s interests in
joint operation assets, liabilities, revenue and expenses are set out in
Note 28.
Where part of a joint operation interest is farmed out in consideration
of the farminee undertaking to incur further expenditure on behalf
of both the farminee and the entity in the joint operation area of
interest, exploration expenditure incurred and carried forward prior
to farm-out continues to be carried forward without adjustment,
unless the terms of the farm-out are excessive based on the diluted
interest retained. An impairment provision is then made to reduce
exploration expenditure to its estimated recoverable amount.
Any cash received in consideration for farming out part of a joint
operation interest is recognised in the profit or loss.
d) Crude oil and gas inventory and materials in inventory
Crude oil and gas inventories, produced but not sold, are valued at
the lower of cost and net realisable value. Cost comprises a relevant
proportion of all fixed and variable production, overhead, restoration
and amortisation expenses and is determined on an average cost
basis.
Stocks of materials inventory, consumable stores and spare parts
are carried at the lower of cost and net realisable value, with cost
primarily determined on an average cost basis.
Notes to the financial statements For the financial year ended 30 June 2016F
or p
erso
nal u
se o
nly

Horizon Oil Annual Report 201658
e) Operating segment reportingOperating segments are reported in a manner consistent with the
internal reporting provided to the chief operating decision maker.
The chief operating decision maker, who is responsible for allocating
resources and assessing performance of the operating segments,
has been identified as the Board of Directors.
f) Foreign currency translation
(i) Functional and presentation currency
Items included in the financial statements of each of the Group’s
subsidiaries are measured using the currency of the primary
economic environment in which the subsidiary operates (the
‘functional currency’). The consolidated financial statements are
presented in United States dollars, which is Horizon Oil Limited’s
functional and presentation currency. Horizon Oil Limited has
selected US dollars as its presentation currency for the following
reasons:
(a) a significant portion of Horizon Oil Limited’s activity is denominated
in US dollars; and
(b) it is widely understood by Australian and international investors
and analysts.
(ii) Transactions and balances
Foreign currency transactions are translated into the functional
currency using the exchange rates prevailing at the dates of the
transactions. Foreign exchange gains and losses resulting from
the settlement of such transactions and from the translation at
financial year end exchange rates of monetary assets and liabilities
denominated in foreign currencies are generally recognised in the
profit or loss. They are deferred in equity if they relate to qualifying
cash flow hedges and qualifying net investment hedges or are
attributable to part of the net investment in a foreign operation.
(iii) Group companies
All Group subsidiaries have a functional currency of United States
dollars and, as a result, there is no exchange differences arising from
having a different functional currency to the presentation currency of
Horizon Oil Limited.
g) Revenue recognitionRevenue is measured at the fair value of the consideration received
or receivable to the extent it is probable that economic benefits
will flow to the Group and the revenue can be reliably measured.
Amounts disclosed as revenue are net of returns, trade allowances
and amounts collected on behalf of third parties. All revenue is
stated net of the amount of GST.
For product sales, revenue is bought to account when the product
is passed from the Group’s physical control under an enforceable
contract, when selling prices are known or can be reasonably
estimated and the products are in a form that requires no further
treatment by the Group.
Interest income is recognised on a time proportion basis using the
effective interest method.
h) Deferred incomeA liability is recorded for obligations under petroleum sales contracts
where the risks and rewards of ownership have not passed to the
customer and payment has already been received.
i) Taxation
(i) Income tax
The income tax expense or revenue for the reporting period is the
tax payable on the current period’s taxable income based on the
applicable income tax rate for each jurisdiction adjusted by changes
in deferred tax assets and liabilities attributable to temporary
differences between the tax bases of assets and liabilities and their
carrying amounts in the financial statements, and to unused tax
losses.
The current income tax charge is calculated on the basis of the tax
laws enacted or substantially enacted at the end of the reporting
period in the countries where the Company’s subsidiaries operate
and generate taxable income. It establishes provisions where
appropriate on the basis of amounts expected to be paid to the tax
authorities.
Deferred income tax is provided in full, using the liability method,
on temporary differences arising between the tax bases of assets
and liabilities and their carrying amounts in the financial statements.
Deferred income tax is determined using tax rates (and laws)
that have been enacted or substantially enacted by the end of
the reporting period and are expected to apply when the related
deferred income tax asset is realised or deferred income tax liability
is settled.
Deferred tax assets are recognised for deductible temporary
differences and unused tax losses only if it is probable that future
taxable amounts will be available to utilise those temporary
differences and losses.
Deferred tax liabilities and assets are not recognised for temporary
differences between the carrying amount and tax bases of
investments in subsidiaries where the parent entity is able to control
the timing of the reversal of the temporary differences and it is
probable that the differences will not reverse in the foreseeable
future.
Current and deferred tax is recognised in profit or loss, except to
the extent that it relates to items recognised in other comprehensive
income or directly in equity. In this case, the tax is also recognised in
other comprehensive income or directly in equity, respectively.
(ii) Government royalties
Government royalties are treated as taxation arrangements when
they are imposed under Government authority and when the
calculation of the amount payable is derived from a measure of profit
that falls within the definition of ‘taxable profit’ for the purposes of
AASB 112 Income Taxes. Current and deferred tax is then provided
on the same basis as described in (i) above. Royalty arrangements
that do not meet the criteria for treatment as a tax are recognised on
an accruals basis.
j) LeasesLeases in which a significant portion of the risks and rewards of
ownership are retained by the lessor are classified as operating
leases (Note 38). Payments made under operating leases (net of any
incentives received from the lessor) are charged to profit or loss on
a straight-line basis over the period of the lease. The Company has
no leases which are classified as finance leases under AASB 117
Leases at 30 June 2016.
Notes to the financial statements For the financial year ended 30 June 2016F
or p
erso
nal u
se o
nly

Horizon Oil Annual Report 2016 59
k) Impairment of assetsAssets are reviewed for impairment at each reporting date to
determine whether there is any indication of impairment. If an
impairment indicator exists a formal estimate of the recoverable
amount is calculated. An impairment loss is recognised for the
amount by which the asset’s carrying amount exceeds its recoverable
amount. The recoverable amount is the higher of an asset’s fair
value less costs to sell and value in use. For the purposes of
assessing impairment, assets are grouped at the lowest levels for
which there are separately identifiable cash inflows which are largely
independent of the cash inflows from other assets or groups of
assets (‘cash-generating units’).
In assessing the recoverable amount, an asset’s estimated future
cash flows are discounted to their present value using an after tax
discount rate that reflects current market assessments of the time
value of money and the risks specific to the asset.
Exploration phase expenditure is assessed for impairment in
accordance with Note 1(o).
l) Cash and cash equivalentsFor presentation purposes in the statement of cash flows, cash and
cash equivalents includes cash at banks and on hand (including
share of joint operation cash balances), deposits held at call with
financial institutions, other short-term, highly liquid investments with
original maturities of three months or less that are readily convertible
to known amounts of cash and which are subject to an insignificant
risk of changes in value, and bank overdrafts. Bank overdrafts are
shown within borrowings in current liabilities in the consolidated
statement of financial position.
m) Trade receivablesTrade receivables are recognised initially at fair value and
subsequently measured at amortised cost, less provision for doubtful
debts. Trade receivables are generally due for settlement within
30 days from the date of recognition. They are included in current
assets, except for those with maturities greater than one year after
the end of the reporting period which are classified as non-current
assets.
Collectability of trade receivables is reviewed on an ongoing
basis. Debts which are known to be uncollectible are written off.
A provision for doubtful receivables is established when there is
objective evidence that the Group will not be able to collect all
amounts due according to the original terms of receivables. The
amount of the provision is the difference between the asset’s
carrying amount and the present value of estimated future cash flows,
discounted at the original effective interest rate. The amount of the
provision is recognised in profit or loss.
n) Business combinationsThe acquisition method of accounting is used to account for all
business combinations, regardless of whether equity instruments
or other assets are acquired. The consideration transferred for the
acquisition of a subsidiary comprises the fair values of the assets
transferred, the liabilities incurred, equity interests issued by the
Group, fair value of any asset or liability resulting from a contingent
consideration arrangement, and fair value of any pre-existing equity
interest in the subsidiary. Identifiable assets acquired and liabilities
and contingent liabilities assumed in a business combination are,
with limited exceptions, measured initially at their fair values at the
acquisition date. Acquisition related costs are expensed as incurred.
For purchase combinations which do not constitute the acquisition
of a business, the Group identifies and recognises the individual
identifiable assets acquired and liabilities assumed. The
consideration paid is allocated to the individual identifiable assets
and liabilities on the basis of their relative fair values at the date of
purchase. Transaction costs associated with the acquisition are
a component of the consideration transferred and are therefore
capitalised.
o) Exploration phase expenditureExploration phase expenditure in respect of each area of interest
is accounted for using the successful efforts method of accounting.
The successful efforts method requires all exploration phase
expenditure to be expensed in the period it is incurred, except the
costs of successful wells, the costs of acquiring interests in new
exploration assets and pre-development costs where there is a high
degree of probability that the development will go ahead, which are
capitalised. Costs directly associated with the drilling of exploration
wells and any associated geophysical and geological costs are
initially capitalised pending determination of whether potentially
economic reserves of hydrocarbons have been discovered. Areas
of interest are recognised at the cash-generating unit level, being
the smallest grouping of assets generating independent cash flows
which usually is represented by an individual oil or gas field.
When an oil or gas field has been approved for development,
the capitalised exploration phase expenditure is reclassified as
oil and gas assets in the statement of financial position. Prior
to reclassification, capitalised exploration phase expenditure is
assessed for impairment.
Where an ownership interest in an exploration and evaluation asset
is purchased, any cash consideration paid net of transaction costs is
treated as an asset acquisition. Alternatively, where an ownership
interest is sold, any cash consideration received net of transaction
costs is treated as a recoupment of costs previously capitalised,
with any excess accounted for as a gain on disposal of non-current
assets.
Impairment of capitalised exploration phase expenditure
Exploration phase expenditure is reviewed for impairment semi-
annually in accordance with the requirements of AASB 6 ‘Exploration
for and Evaluation of Mineral Resources’. The carrying value
of capitalised exploration phase expenditure is assessed for
impairment at the asset or cash-generating unit level (which usually
is represented by an exploration permit or licence) whenever facts
and circumstances (as defined in AASB 6) suggest that the carrying
amount of the asset may exceed its recoverable amount. If any
indication of impairment exists, an estimate of the asset’s recoverable
amount is calculated.
An impairment loss exists when the carrying amount of an asset or
cash-generating unit exceeds its estimated recoverable amount. The
asset or cash-generating unit is then written-down to its recoverable
amount. Impairment losses are recognised as an expense in profit
or loss.
Capitalised exploration phase expenditure that suffered impairment
is tested for possible reversal of the impairment loss whenever facts
or changes in circumstances indicate that the impairment may have
reversed.
Notes to the financial statements For the financial year ended 30 June 2016F
or p
erso
nal u
se o
nly

Horizon Oil Annual Report 201660
p) Oil and gas assets
(i) Development expenditure
Development expenditure is stated at cost less any accumulated
impairment losses. Development expenditure incurred by or on
behalf of the Group is accumulated separately for fields in which
proven and probable hydrocarbon reserves have been identified to
the satisfaction of directors. Such expenditure comprises direct costs
and overhead expenditure incurred which can be directly attributable
to the development phase or is acquired through the acquisition of a
permit.
Once a development decision has been taken on an oil or gas
field, the carrying amount of the relevant exploration and evaluation
expenditure in respect of the relevant area of interest is aggregated
with the relevant development expenditure.
Development expenditure is reclassified as ’production assets’ at the
end of the commissioning phase, when the oil or gas field is capable
of operating in the manner intended by management (that is, when
commercial levels of production are capable of being achieved).
Development expenditure is tested for impairment in accordance with
the accounting policy set out in Note 1(k).
(ii) Production assets
When further development costs are incurred in respect of a
production asset after the commencement of production, such
expenditure is carried forward as part of the production asset when it
is probable that additional future economic benefits associated with
the expenditure will flow to the Group. Otherwise such expenditure
is classified as production expense in income statements when
incurred.
Production assets are stated at cost less accumulated amortisation
and any accumulated impairment losses.
Once commercial levels of production commence, amortisation is
charged using the unit-of-production method. The unit-of-production
method results in an amortisation expense proportional to the
depletion of proven and probable hydrocarbon reserves for the
field. Production assets are amortised by area of interest in the
proportion of actual production for the financial period to the proven
and probable hydrocarbon reserves of the field. The proven and
probable hydrocarbon reserves figure is that estimated at the end of
the financial period plus production during the financial period.
The cost element of the unit-of-production calculation is the
capitalised costs incurred to date for the field together with the
estimated/anticipated future development costs (stated at current
financial period-end unescalated prices) of obtaining access to all the
proven and probable hydrocarbon reserves included in the unit-of-
production calculation.
Production assets are tested for impairment in accordance with the
accounting policy set out in Note 1(k).
(iii) Restoration provision
The estimated costs of decommissioning and removing an asset and
restoring the site are included in the cost of the asset as at the date
the obligation first arises and to the extent that it is first recognised
as a provision. This restoration asset is subsequently amortised on a
unit-of-production basis.
The corresponding provision, of an amount equivalent to the
restoration asset created, is reviewed at the end of each reporting
period. The provision is measured at the best estimate of the present
value amount required to settle the present obligation at the end of
the reporting period based on current legal and other requirements
and technology, discounted where material using market yields at the
balance sheet date on US Treasury bonds with terms to maturity and
currencies that match, as closely as possible, to the estimated future
cash outflows.
Where there is a change in the expected restoration, rehabilitation
or decommissioning costs, an adjustment is recorded against the
carrying value of the provision and any related restoration asset, and
the effects are recognised in profit or loss on a prospective basis
over the remaining life of the operation.
The unwinding of the effect of discounting on the restoration
provision is included within finance costs in profit or loss.
Legislation in China requires the provision for restoration to be paid
over the life of the field. As such, payments relating to restoration
provisions of US$0.4 million are recognised as current, being due
within 12 months.
(iv) Reserves
The estimated reserves include those determined on an annual basis
by Mr Alan Fernie, General Manager – Exploration and Development,
Horizon Oil Limited. Mr Fernie has forty years’ relevant experience
within the sector. The reserve estimates are determined by Mr Fernie
based on assumptions, interpretations, and assessments. These
include assumptions regarding commodity prices, foreign exchange
rates, operating costs and capital expenditures, and interpretations
of geological and geophysical models to make assessments of the
quantity of hydrocarbons and anticipated recoveries.
q) Investments and other financial assetsSubsidiaries are accounted for in the consolidated financial
statements as set out in Note 1(c).
Loans and receivables are non-derivative financial assets with fixed
or determinable payments that are not quoted in an active market.
They arise when the Group provides money, goods or services
directly to a debtor with no intention of selling the receivable. They
are included in current assets, except for those with maturities
greater than 12 months after the end of the reporting period which
are classified as non-current assets. Loans and receivables are
included in receivables in the statement of financial position.
r) Plant and equipmentThe cost of improvements to, or on, leasehold property is
depreciated over the unexpired period of the lease or the estimated
useful life of the improvement to the Group, whichever is shorter.
Depreciation on other assets is calculated using the straight-line
method to allocate their cost or revalued amounts, net of their
residual values, over their estimated useful lives, as follows:
• Computer equipment 3 – 4 years
• Furniture, fittings and equipment 3 – 10 years
• Leasehold improvement 10 years
The assets’ residual values and useful lives are reviewed, and
adjusted if appropriate, at the end of the reporting period.
An asset’s carrying amount is written down immediately to its
recoverable amount if the asset’s carrying amount is greater than its
estimated recoverable amount.
Gains and losses on disposals are determined by comparing
proceeds with carrying amount. These are included in profit or loss.
Notes to the financial statements For the financial year ended 30 June 2016F
or p
erso
nal u
se o
nly

Horizon Oil Annual Report 2016 61
s) Trade and other payablesThese amounts represent liabilities for goods and services provided
to the Group prior to the end of financial year which are unpaid. Due
to their short-term nature they are not discounted. The amounts are
unsecured and are usually paid within 30 days of recognition. They
are included in current liabilities, except for those with maturities
greater than one year after the end of the reporting period which are
classified as non-current liabilities.
t) DerivativesDerivatives are initially recognised at fair value on the date a
derivative contract is entered into and are subsequently remeasured
to their fair value at each reporting date. The accounting for
subsequent changes in fair value depends on whether the derivative
is designated as a hedging instrument, and if so, the nature of the
item being hedged. The Group designates certain derivatives as
either; (1) hedges of the fair value of recognised assets or liabilities
or a firm commitment (fair value hedge); or (2) hedges of the cash
flows of recognised assets and liabilities and highly probable forecast
transactions (cash flow hedges). The Group currently does not have
any derivatives designated as fair value hedges.
The Group documents at the inception of the hedging transaction the
relationship between hedging instruments and hedged items, as well
as its risk management objective and strategy for undertaking various
hedge transactions. The Group also documents its assessment,
both at hedge inception and on an ongoing basis, of whether the
derivatives that are used in hedging transactions have been and will
continue to be highly effective in offsetting changes in fair values or
cash flows of hedged items.
The fair values of derivative financial instruments used for hedging
purposes are disclosed in Note 19. Movements in the hedging
reserve in equity are shown in Note 25(a).
(i) Cash flow hedge
The effective portion of changes in the fair value of derivatives
that are designated and qualify as cash flow hedges is recognised
in equity in the hedging reserve. The gain or loss relating to the
ineffective portion is recognised immediately in profit or loss within
other income or other expense.
Amounts accumulated in equity are recycled to profit or loss in the
periods when the hedged item will affect profit or loss (for instance
when the forecast sale that is hedged takes place). The gain or
loss relating to the effective portion of interest rate swaps hedging
variable rate borrowings is recognised in profit or loss within
“finance costs”. The gain or loss relating to the effective portion of
forward foreign exchange contracts and commodity price contracts
hedging export sales is recognised in profit or loss within ‘sales’.
However, when the forecast transaction that is hedged results in the
recognition of a non-financial asset (for example, inventory) or a non-
financial liability, the gains and losses previously deferred in equity
are transferred from equity and included in the measurement of the
initial cost or carrying amount of the asset or liability.
When a hedging instrument expires or is sold or terminated, or
when a hedge no longer meets the criteria for hedge accounting,
any cumulative gain or loss existing in equity at that time remains in
equity and is recognised when the forecast transaction is ultimately
recognised in profit or loss.
When a forecast transaction is no longer expected to occur, the
cumulative gain or loss that was reported in equity is immediately
transferred to the profit or loss.
(ii) Derivatives that do not qualify for hedge accounting
Certain derivative instruments do not qualify for hedge accounting.
Changes in the fair value of any derivative instrument that does not
qualify for hedge accounting are recognised immediately in profit or
loss and are included in other income or other expense.
u) BorrowingsBorrowings are initially recognised at fair value, net of transaction
costs incurred. Borrowings are subsequently measured at amortised
cost. Any difference between the proceeds (net of transaction
costs) and the redemption amount is recognised in profit or loss over
the period of the borrowings using the effective interest method.
Fees paid on the establishment of loan facilities which are not an
incremental cost relating to the actual drawdown of the facility, are
recognised as prepayments and amortised on a straight line basis
over the term of the facility.
The fair value of the liability portion of a convertible bond is
determined using a market interest rate for an equivalent non-
convertible bond. This amount is recorded as a liability on an
amortised cost basis until extinguished on conversion or maturity
of the bonds. The remainder of the proceeds is allocated to the
conversion right. This is recognised and included in shareholders’
equity when the conversion right meets the equity definition at
inception. Where the conversion right does not meet the definition
of equity, as for convertible bonds which include a cash settlement
option or conversion price resets, the conversion right is fair valued
at inception and recorded as a financial liability. The financial liability
for the conversion right is subsequently remeasured at balance date
to fair value with gains and losses recorded in the profit or loss.
Borrowings are classified as current liabilities unless the Group has
an unconditional right to defer settlement of the liability for at least 12
months after the end of the reporting period.
v) Borrowing costsBorrowing costs which includes the costs of arranging and obtaining
financing, incurred for the acquisition or construction of any qualifying
asset are capitalised during the period of time that is required to
complete and prepare the asset for its intended use or sale. Other
borrowing costs are expensed when incurred.
There were no borrowing costs capitalised during the current
financial year (2015: US$2,983,000) and the amount of borrowing
costs amortised to the income statement were US$1,817,000 (2015:
US$1,924,000).
w) Employee benefits
(i) Wages and salaries and annual leave
Liabilities for wages and salaries, including non-monetary benefits,
annual leave and related on-costs expected to be settled within 12
months of the end of the reporting period are recognised in other
payables in respect of employees' services up to the end of the
reporting period and are measured at the amounts expected to be
paid when the liabilities are settled. The liabilities are recognised in
other creditors.
Notes to the financial statements For the financial year ended 30 June 2016F
or p
erso
nal u
se o
nly

Horizon Oil Annual Report 201662
(ii) Long service leave
The liability for long service leave is recognised as a provision for
employee benefits and measured as the present value of expected
future payments to be made in respect of services provided by
employees up to the end of the reporting period using the projected
unit credit method. Consideration is given to expected future wage
and salary levels, experience of employee departures and periods
of service. Expected future payments are discounted using market
yields at the end of the reporting period on national government
bonds with terms to maturity and currency that match, as closely as
possible, the estimated future cash outflows.
(iii) Share-based payments
Share-based payment compensation benefits are provided to
employees and consultants via the Horizon Oil Long Term Incentive
Plan, the Horizon Oil Limited Employee Option Scheme, the
Employee Performance Incentive Plan and the General Option Plan.
Information relating to these schemes is set out in Note 33.
The fair value of options and share appreciation rights (‘SARs’)
granted under the Horizon Oil Long Term Incentive Plan, Horizon
Oil Limited Employee Option Scheme and Employee Performance
Incentive Plan are recognised as an employee share-based
payments expense with a corresponding increase in equity. The
total amount to be expensed is determined by reference to the fair
value of the options and SARs granted, which includes any market
performance conditions but excludes the impact of any service and
non-market performance vesting conditions and the impact of any
non-vesting conditions. Non-market performance vesting conditions
are included in assumptions about the number of options and SARs
that are expected to vest.
The fair value is measured at grant date. The total expense is
recognised over the vesting period, which is the period over which
all of the specified vesting conditions are to be satisfied. At the
end of each reporting period, the Group revises its estimates of the
number of options and SARs that are expected to vest based on the
non-market performance vesting conditions. It recognises the impact
of the revision to original estimates, if any, in profit or loss, with a
corresponding adjustment to equity.
The fair value at grant date is independently determined using either
a Black-Scholes or Monte Carlo simulation option pricing model that
takes into account the exercise price, the term of the option or SAR,
the impact of dilution, the share price at grant date and expected
price volatility of the underlying share, the expected dividend yield
and the risk free interest rate for the term of the option or SAR.
The Company has elected to retain any amounts originally
recognised in the share-based payments reserve, regardless of
whether the associated options are exercised, cancelled or lapse
unexercised.
x) Contributed equityOrdinary shares are classified as equity.
Incremental costs directly attributable to the issue of new ordinary
shares or options over unissued ordinary shares are shown in share
capital as a deduction, net of related income tax, from the proceeds.
Incremental costs directly attributable to the issue of new shares
or options for the acquisition of a business are not included in the
cost of the acquisition as part of the purchase consideration but are
expensed.
y) Earnings per share
(i) Basic earnings per share
Basic earnings per share is calculated by dividing the profit
attributable to equity holders of the Company, excluding any costs of
servicing equity other than ordinary shares, by the weighted average
number of ordinary shares outstanding during the financial year,
adjusted for bonus elements in ordinary shares issued during the
financial year.
(ii) Diluted earnings per share
Diluted earnings per share adjusts the figures used in the
determination of basic earnings per share to take into account
the after income tax effect of interest and other financing costs
associated with dilutive potential ordinary shares and the weighted
average number of shares assumed to have been issued for
no consideration in relation to dilutive potential ordinary shares.
Potential ordinary shares are not considered dilutive where the
Group incurs a loss per share as calculated above.
z) Goods and Services Tax (‘GST’)Revenues, expenses and assets are recognised net of the amount of
associated GST, unless the GST incurred is not recoverable from the
taxation authority. In this case it is recognised as part of the cost of
acquisition of the asset or as part of the expense.
Receivables and payables are stated inclusive of the amount of GST
receivable or payable. The net amount of GST recoverable from, or
payable to, the taxation authority is included with other receivables or
payables in the statement of financial position.
Cash flows are presented on a gross basis. The GST components
of cash flows arising from investing or financing activities which are
recoverable from, or payable to the taxation authority, are presented
as operating cash flow.
aa) Parent entity financial informationThe financial information for the parent entity, Horizon Oil Limited,
disclosed in Note 42 has been prepared on the same basis as the
consolidated financial statements, except as set out below.
(i) Investments in subsidiaries, associates and joint venture entities
Investments in subsidiaries, associates and joint venture entities
are accounted for at cost in the financial statements of Horizon Oil
Limited. Dividends received from associates are recognised in the
parent entity’s profit or loss, rather than being deducted from the
carrying amount of these investments.
(ii) Financial guarantees
Where the parent entity has provided financial guarantees in relation
to loans and payables of subsidiaries for no compensation, the fair
values of these guarantees are accounted for as contributions and
recognised as part of the cost of the investment.
Notes to the financial statements For the financial year ended 30 June 2016F
or p
erso
nal u
se o
nly

Horizon Oil Annual Report 2016 63
bb) New Australian Accounting Standards and interpretations
Certain new accounting standards and interpretations have been
published that are not mandatory for 30 June 2016 reporting
periods. The Group’s assessment of the impact of these new
standards and interpretations is set out below:
(i) AASB 2014-3 'Amendments to Australian Accounting Standards – Accounting for Acquisitions of Interests in Joint Operations’
The AASB has amended AASB 11 ‘Joint Arrangements’. The
amendments require an investor to apply the principles of
business combination accounting when it acquires an interest in
a joint operation that constitutes a ‘business’ as defined in AASB
3 ‘Business Combinations’. The amendments to AASB 11 will be
applied prospectively for annual periods on or after 1 January 2016.
Earlier application is permitted. The Group has interests in a number
of joint operations. The Group is yet to assess the full impact of the
amendments given it will only apply to future potential transactions.
The Group does not intend to adopt the new standard before its
operative date, which means that it would be first applied in the
financial year ending 30 June 2017.
(ii) AASB 15 ‘Revenue from Contracts with Customers’
AASB 15 ‘Revenue from Contracts with Customers’ (issued during
January 2015) is the new standard for revenue recognition, replacing
AASB 111 ‘Construction Contracts’, AASB 118 ‘Revenue’ and
AASB 1004 ‘Contributions’. It is applicable for annual reporting
periods beginning on or after 1 January 2018, with early adoption
permitted. The Group is yet to assess AASB 15's full impact. The
new standard’s core principle is that an entity recognises revenue
in accordance with the transfer of promised goods or services to
customers in an amount that reflects the consideration to which the
entity expects to be entitled in exchange for those goods or services.
The Group does not intend to adopt the new standard before its
operative date, which means that it would be first applied in the
financial year ending 30 June 2018.
There are no other Australian Accounting Standards that are not
yet effective and that are expected to have a material impact on the
Group in the current or future financial years and on foreseeable
future transactions.
(iii) AASB 16 ‘Leases’
AASB 16 ‘Leases’ (issued during January 2016) is the new standard
for lease accounting which eliminates the classification of leases as
either ‘operating’ or ‘finance’ and requires a lessee to recognise on
statements of financial positions assets and liabilities for leases with
terms of more than 12 months unless the underlying asset is of low
value. The Group does not intend to adopt the new standard before
its operative date, which means that it would be first applied in the
financial year ending 30 June 2019.
Notes to the financial statements For the financial year ended 30 June 2016
Note 2. Financial risk managementThe Group's activities expose it to a variety of financial risks: market risk (including currency risk, interest rate risk and commodity price risk),
credit risk and liquidity risk. The Group's overall risk management program focuses on the unpredictability of financial markets and seeks to
minimise potential adverse effects on the financial performance of the Group. The Group uses derivative financial instruments such as oil
price swaps to hedge certain risk exposures. Derivatives are exclusively used for hedging purposes, i.e. not as trading or other speculative
instruments. The Group uses different methods to measure the different types of risk to which it is exposed. These methods include
sensitivity analysis in the case of interest rate, foreign exchange and commodity price risks, and aging analysis for credit risk.
Risk management is carried out by the finance function under policies approved by the Board of Directors. The finance function identifies,
evaluates and if necessary hedges financial risks in close co-operation with Group management. The board provides written principles for
overall risk management, as well as written policies covering specific areas, such as mitigating foreign exchange, interest rate and credit risks,
use of derivative financial instruments and investment of excess liquidity.
The Group has no off-balance sheet financial assets or liabilities as at the end of the reporting period.
The Group holds the following financial instruments:
Consolidated
30 June 2016 30 June 2015
US$’000 US$’000
Financial Assets
Cash and cash equivalents 16,079 61,343
Receivables 9,932 14,580
Derivative financial instruments - 11,399
Current tax receivable 650 2,091
26,661 89,413
Financial Liabilities
Payables (current) 12,501 16,781
Current tax payable 125 271
Payables (non-current) 22 15
Borrowings (net of borrowing costs capitalised) 144,365 194,390
Other financial liabilities 530 7,961
157,543 219,418
For
per
sona
l use
onl
y

Horizon Oil Annual Report 201664
(a) Market risk
(i) Foreign exchange risk
Foreign exchange risk is the risk that the fair value or future cash flows of a financial instrument will fluctuate because of changes in foreign
exchange rates.
Foreign exchange risk arises when future commercial transactions and recognised financial assets and financial liabilities are denominated in
a currency that is not the Group’s functional currency.
The Group operates internationally and is exposed to foreign exchange risk arising predominately from Australian and New Zealand dollars,
Chinese renminbi, Papua New Guinea kina and Singapore dollar.
The Group manages foreign exchange risk by monitoring forecast cash flows in currencies other than US dollars and ensuring that adequate
Australian dollar, New Zealand dollar, Chinese renminbi, Papua New Guinea kina and Singapore dollar cash balances are maintained.
The objective of the Group’s foreign exchange risk management policy is to ensure its financial viability despite potential periods of
unfavourable exchange rates. Regular sensitivity analysis is conducted to evaluate the potential impact of unfavourable exchange rates on
the Group’s future financial position. The results of this evaluation are used to determine the most appropriate risk mitigation tool to be used.
The Group will hedge when it is deemed the most appropriate risk mitigation tool to be used.
No foreign currency hedging transactions were entered into during the current or prior financial year.
Exposure to foreign exchange risk
The Group’s exposure to foreign exchange risk at the end of each reporting period was as follows:
Group 30 June 2016 30 June 2015
AUD NZD PGK RMB SGD AUD NZD PGK RMB SGD
US$’000 US$’000 US$’000 US$’000 US$’000 US$’000 US$’000 US$’000 US$’000 US$’000
Cash and cash
equivalents
358 380 37 3 16 4,401 2,600 1,009 80 -
Receivables 145 203 27 - - 676 343 428 - -
Current tax payable - 125 - - - - 271 - - -
Current payables 1,764 923 169 - - 1,315 176 222 - -
Non-current payables 22 - - - - 15 - - - -
For the financial year ended and as at 30 June 2016, if the currencies set out in the table below strengthened or weakened against the US
dollar by the percentage shown, with all other variables held constant, the net result for the financial year would increase/(decrease) and net
assets would increase/ (decrease) by:
Group Net Result Net Assets Net Result Net Assets
2016 2015 2016 2015 2016 2015 2016 2015
US$’000 US$’000 US$’000 US$’000 US$’000 US$’000 US$’000 US$’000
Change in currency1 +10% +10% +10% +10% -10% -10% -10% -10%
Australian dollar impact (763) (1,093) (92) 270 763 1,093 92 (270)
New Zealand dollar impact (966) 14 (33) 180 966 (14) 33 (180)
Papua New Guinea kina impact (56) 69 (8) 88 56 (69) 8 (88)
Chinese Renminbi impact (71) (1) - 6 71 1 - (6)
Singapore dollar impact - - - - - - - -
1. This has been based on the change in the exchange rate against the US dollar in the financial years ended 30 June 2016 and 30 June 2015. The sensitivity analysis
has been based on the sensitivity rates when reporting foreign exchange risk internally to key management personnel and represents management’s assessment of
the possible change in foreign exchange rates based on historic volatility. In management’s opinion, the sensitivity analysis is not fully representative of the inherent
foreign exchange risk as the end of the reporting period exposure does not necessarily reflect the exposure during the course of the financial year.
(ii) Commodity price risk
Commodity price risk is the risk that the fair value or future cash flows of a financial instrument will fluctuate because of change in market
commodity prices for crude oil.
The objective of the Group’s commodity price risk management policy is to ensure its financial viability despite potential periods of
unfavourable prices. Regular sensitivity analysis is conducted to evaluate the potential impact of unfavourable prices on the Group’s future
financial position. The results of this evaluation are used to determine the most appropriate risk mitigation tool to be used. The Group will
hedge when it is deemed the most appropriate risk mitigation tool to be used or where required by its financing arrangements. During the
current financial year, oil price hedging was undertaken as a risk mitigation measure to ensure the Group’s financial position remains sound
and that the Group is able to meet its financial obligations in the event of low oil prices.
Notes to the financial statements For the financial year ended 30 June 2016F
or p
erso
nal u
se o
nly

Horizon Oil Annual Report 2016 65
As at 30 June 2016, the Group had no derivative assets or liabilities (30 June 2015: US$11,399,000 derivative asset) as there were no bbls
hedged at this date (30 June 2015: 397,500 bbls).
For the financial year ended and as at 30 June 2016, if the crude oil price rose or fell by the percentage shown, with all other variables held
constant, the result for the financial year would increase/(decrease) and net assets would increase/(decrease) by:
Group Net Result Net Assets Net Result Net Assets
2016 2015 2016 2015 2016 2015 2016 2015
US$’000 US$’000 US$’000 US$’000 US$’000 US$’000 US$’000 US$’000
Change in crude oil price +10% +10% +10% +10% -10% -10% -10% -10%
Impact 2,312 1,268 2,312 1,268 (2,312) (1,268) (2,312) (1,268)
(iii) Interest rate risk
Interest rate risk is the risk that the fair value of future cash flows of a financial instrument will fluctuate because of changes in market interest
rates.
The Group has no interest-bearing assets considered to materially expose the Group’s core income and/or operating cash flows to changes in
market interest rates.
As at 30 June 2016 and 30 June 2015, the Group’s interest rate risk arises from long term borrowings, issued at variable rates, exposing the
Group to cash flow interest rate risk. Group policy is to manage material interest rate exposure. Regular sensitivity analysis is conducted to
evaluate the potential impact of unfavourable interest rate movements on the Group’s future financial position. The results of this evaluation
are used to determine the most appropriate risk mitigation tool to be used. During the current and prior financial year, the Group did not enter
into any interest rate swap contracts.
The Group manages its cash flow interest rate risk by using floating to fixed interest rate swaps. Such interest rate swaps have the economic
effect of converting borrowings from floating to fixed rates. Under the interest rate swaps, the Group agrees with other parties to exchange, at
specific intervals, the difference between fixed contract rates and floating-rate interest amounts calculated by reference to the agreed notional
principal amounts.
The Group’s exposure to interest rate risk for financial instruments is set out below:
Floating interest rate
Fixed interest rate maturing in: Non-interest bearing
Carrying amount
1 year or less Over 1 to 2 years
Over 2 to 5 years
US$’000 US$’000 US$’000 US$’000 US$’000 US$’000
As at 30 June 2016
Financial assets
Cash and cash equivalents 13,514 - - - 2,565 16,079
Receivables - - - - 9,932 9,932
Derivative financial instruments (net) - - - - - -
Current tax receivable - - - - 650 650
13,514 - - - 13,147 26,661
Weighted average interest rate p.a. 0.10%
Financial liabilities
Trade and other payables - - - - 12,523 12,523
Current tax payable - - - - 125 125
Borrowings 85,565 58,800 - - - 144,365
85,565 58,800 - - 12,648 157,013
Weighted average interest rate p.a. 3.45% 10%
Net financial assets/(liabilities) (72,051) (58,800) - - 499 (130,352)
Notes to the financial statements For the financial year ended 30 June 2016F
or p
erso
nal u
se o
nly

Horizon Oil Annual Report 201666
Floating interest rate
Fixed interest rate maturing in: Non-interest bearing
Carrying amount
1 year or less Over 1 to 2 years
Over 2 to 5 years
US$’000 US$’000 US$’000 US$’000 US$’000 US$’000
As at 30 June 2015
Financial assets
Cash and cash equivalents 53,953 - - - 7,390 61,343
Receivables - - - - 14,580 14,580
Derivative financial
instruments (net)
- - - - 11,399 11,399
Current tax receivable - - - - 2,091 2,091
53,953 - - - 35,460 89,413
Weighted average interest
rate p.a.
0.04%
Financial liabilities
Trade and other payables - - - - 16,796 16,796
Current tax payable - - - - 271 271
Borrowings 115,115 79,275 - - - 194,390
115,115 79,275 - - 17,067 211,457
Weighted average interest
rate p.a.
3.70% 14.81%
Net financial assets/(liabilities) (61,162) (79,275) - - 18,393 (122,044)
As at 30 June 2016, the Group had the following variable rate borrowings outstanding:
30 June 2016 30 June 2015
Weighted average
interest rate
Balance Weighted average
interest rate
Balance
% p.a. US$’000 % p.a. US$’000
Bank loans
Net exposure to cash flow interest rate risk
3.45% 89,141 3.70% 120,000
89,141 120,000
At 30 June 2016, if the interest rates had been 1.0% p.a. higher or lower and all other variables held constant, the net result for the financial
year would increase/(decrease) and net assets as at 30 June 2016 would increase/(decrease) by:
Group
Net Result Net Assets Net Result Net Assets
2016 2015 2016 2015 2016 2015 2016 2015
US$’000 US$’000 US$’000 US$’000 US$’000 US$’000 US$’000 US$’000
Change in interest rate p.a. +1% +1% +1% +1% -1% -1% -1% -1%
Impact of Assets 240 521 240 521 (24) (20) (24) (20)
Impact of Liabilities 742 849 742 849 (742) (849) (742) (849)
Impact of Net Assets (502) (328) (502) (328) 718 829 718 829
Notes to the financial statements For the financial year ended 30 June 2016F
or p
erso
nal u
se o
nly

Horizon Oil Annual Report 2016 67
b) Credit riskCredit risk is managed on a Group basis. Credit risk refers to the risk
that a counterparty will default on its contractual obligations resulting
in financial loss to the Group. Credit risk arises from cash and
cash equivalents, derivative financial instruments, as well as credit
exposures to customers, including outstanding receivables.
It is acknowledged that the Group’s sales of crude oil are currently
concentrated with two counterparties. However, the Group has
policies in place to ensure that sales of products and services are
made to customers with an appropriate credit history, and that the
Group has the ability to sell crude to other parties if desired.
Derivative counterparties and cash transactions are limited to high
credit quality financial institutions. Where commercially practical
the Group seeks to limit the amount of credit exposure to any one
financial institution.
The maximum exposure to credit risk at the end of each reporting
period is the carrying amount of the financial assets as summarised
in this note.
The credit quality of financial assets that are neither past due nor
impaired can be assessed by reference to external credit ratings (if
available) or to historical information about counterparty default rates.
Notes to the financial statements For the financial year ended 30 June 2016
Consolidated
2016 2015
US$’000 US$’000
Cash and cash equivalents
Counterparties with external credit rating (Standard & Poors)
AA- 13,508 56,571
13,508 56,571
Counterparties without external credit rating
Share of joint operations cash balances 2,508 4,368
Overseas financial institutions 63 404
Cash on hand - -
2,571 4,772
Total cash and cash equivalents 16,079 61,343
Receivables
Counterparties with external credit rating (Standard & Poors / Fitch)
AAA 69 175
AA- 4,255 12,798
AA 213 348
A+ 4,381 -
A- 309 -
9,227 13,321
Counterparties without external credit rating
Share of joint operation receivables balances 400 282
Joint operations partners 264 209
Related parties (partly paid ordinary shares) - 331
Other 41 437
705 1,259
Total receivables 9,932 14,580
As at 30 June 2016, there were US$38,750 (30 June 2015: US$291,767) financial assets that are past due. Management has assessed the
collectability of these amounts based on the customer relationships and historical payment behaviour and believe that the amounts are still
collectible in full.
(c) Liquidity riskLiquidity risk is the risk that the Group will encounter difficulty in meeting obligations associated with financial liabilities.
The Group has policies in place to manage liquidity risk by maintaining adequate reserves and by continuously monitoring forecast and actual
cash flows and matching profiles of financial assets and liabilities.
Financing arrangements
The Group had access to the following undrawn borrowing facilities as at the end of each reporting period:
Consolidated
2016 2015
US$’000 US$’000
Floating rate:
Expiring within one year 8,758 -
Expiring beyond one year - -
For
per
sona
l use
onl
y

Horizon Oil Annual Report 201668
Maturities of financial liabilities
An analysis of the Group’s financial liability maturities for the current and prior financial year is set out below:
Non-interest bearing Variable rate Fixed rate
As at 30 June 2016 US$’000 US$’000 US$’000
Less than 6 months 12,626 6,195 60,314
6 – 12 months - 15,822 -
Between 1 and 2 years - 25,360 -
Between 2 and 5 years 22 44,721 -
Over 5 years - - -
Total contractual cash flows 12,648 92,098 60,314
Non-interest bearing Variable rate Fixed rate
As at 30 June 2015 US$’000 US$’000 US$’000
Less than 6 months 17,052 1,963 2,200
6 – 12 months - 19,688 89,240
Between 1 and 2 years - 29,427 -
Between 2 and 5 years 15 79,327 -
Over 5 years - - -
Total contractual cash flows 17,067 130,405 91,440
d) Fair value estimationThe fair value of financial assets and financial liabilities must be estimated for recognition and measurement or for disclosure purposes.
AASB 7 ‘Financial Instruments: Disclosures’ requires disclosure of fair value measurements by level of the following fair value measurement
hierarchy:
(a) quoted prices (unadjusted) in active markets for identical assets or liabilities (level 1);
(b) inputs other than quoted prices included within level 1 that are observable for the asset or liability, either directly (as prices) or indirectly
(derived from prices) (level 2); and
(c) inputs for the asset or liability that are not based on observable market data (unobservable inputs) (level 3).
The following table presents the Group’s assets and liabilities measured and recognised at fair value as at 30 June 2016 and 30 June 2015:
Level 1 Level 2 Level 3 Total
As at 30 June 2016 US$’000 US$’000 US$’000 US$’000
Assets
Derivatives used for hedging - - - -
Total assets - - - -
Liabilities
Derivatives used for hedging - - - -
Financial liabilities at fair value through profit or loss:
Conversion rights on convertible bonds - - 530 530
Total liabilities - - 530 530
Level 1 Level 2 Level 3 Total
As at 30 June 2015 US$’000 US$’000 US$’000 US$’000
Assets
Derivatives used for hedging - 11,399 - 11,399
Total assets - 11,399 - 11,399
Liabilities
Derivatives used for hedging - - - -
Financial liabilities at fair value through profit or loss:
Conversion rights on convertible bonds - - 7,961 7,961
Total liabilities - - 7,961 7,961
Notes to the financial statements For the financial year ended 30 June 2016F
or p
erso
nal u
se o
nly
Horizon Oil Annual Report 2016 69
The fair value of financial instruments traded in active markets (such
as publicly traded derivatives) was based on quoted market prices at
the end of each reporting period. The quoted market price used for
financial assets held by the Group was the current bid price. These
instruments are included in level 1.
The fair value of financial instruments that are not traded in an active
market (for example, over-the-counter derivatives) is determined
using valuation techniques. These valuation techniques maximise
the use of observable market data where it is available and rely as
little as possible on entity specific estimates. If all significant inputs
required to fair value an instrument are observable, the instrument is
included in level 2.
If one or more of the significant inputs is not based on observable
market data, the instrument is included in level 3.
Specific valuation techniques used to value financial instruments
include:
• the fair value of oil price swaps is calculated as the present value
of the estimated future cash flows based on forward prices at
balance sheet date;
• the fair value of interest rate swaps is calculated as the present
value of the estimated future cash flows based on observable yield
curves; and
• other techniques, such as discounted cash flow analysis and
Monte Carlo simulations, are used to determine fair value for the
remaining financial instruments.
The fair value of conversion rights on convertible bonds is
determined based on a simulation-based pricing methodology using
a Monte Carlo simulation. A simulation-based pricing methodology
was applied in order to model the dynamics of the underlying
variables and to account for the individual specifications of the
convertible bonds such as the inherent path dependency. Monte
Carlo simulation uses random numbers as inputs to iteratively
evaluate a deterministic model. The method involves simulating the
various sources of uncertainty that affect the value of the relevant
instrument and then calculating a representative value by substituting
a range of values – in this case a lognormal probability distribution –
for any factor that has inherent uncertainty. The results are calculated
repeatedly, each time using a different set of random values from the
probability functions. Depending upon the number of uncertainties
and the ranges specified for them, a Monte Carlo simulation may
typically involve thousands or tens of thousands (for Horizon Oil
convertible bonds - 100,000) of recalculations before it is complete.
The result is a probability distribution of possible outcomes providing
a more comprehensive view of both what could happen and its
likelihood. Market interest rates were applied in the model with a
credit spread of 7.0%, together with a calculated share price volatility
of 51.2% when quoted in US dollar terms. All other parameters were
based on the specific terms of the convertible bonds issued.
The carrying value of receivables and payables are assumed to
approximate their fair values due to their short-term nature.
The fair value of other financial liabilities (being financial guarantees),
after factoring in the likelihood that the parent entity would be
required to perform under the guarantees, was not considered
material.
The fair value of borrowings for disclosure purposes is not materially
different to their carrying value given the likely anticipated repayment
profile.
The fair value of other classes of financial instruments not yet
covered above were determined to approximate their carrying value.
(d) Capital riskThe consolidated entity manages its capital to ensure that entities in
the consolidated group will be able to continue as a going concern
while maximising the return to stakeholders through the optimisation
of the debt and equity balances.
Note 3. Critical accounting estimates and judgementsEstimates and judgements which are continually evaluated and
are based on historical experience and other factors, including
expectations of future events that may have a financial impact
on the Group and that are believed to be reasonable under the
circumstances.
(a) Critical accounting estimates and assumptionsThe Group makes estimates and assumptions concerning the
future. The resulting accounting estimates will, by definition, seldom
equal the related actual results. The most significant estimates
and assumptions that have a significant risk of causing a material
adjustment to the carrying amount of assets and liabilities relate to:
(i) Exploration and evaluation assets
The Group’s policy for exploration and evaluation expenditure
is discussed in Note 1(o). The application of this policy requires
management to make certain estimates and assumptions as to future
events and circumstances. These estimates and assumptions include
whether commercially viable reserves have been found and whether
the capitalised exploration and evaluation expenditure will be
recovered through future exploitation or sale. The carrying amount
of exploration and evaluation assets has been disclosed in Note 15.
A detailed impairment assessment of the Group’s exploration and
evaluation assets has been performed in Note 29.
(ii) Reserve estimates
The estimated quantities of proven and probable hydrocarbons
reported by the Group are integral to the calculation of amortisation
expense (depletion), assessments of impairment of assets, provision
for restoration and the recognition of deferred tax assets due
to changes in expected future cash flows. Reserve estimates
require interpretation of complex and judgemental geological
and geophysical models in order to make an assessment of the
size, shape, depth and quality of reservoir, and their anticipated
recoveries. The economic, geological and technical factors used
to estimate reserves may change from period to period. Reserve
estimates are prepared in accordance with guidelines prepared by
the Society of Petroleum Engineers.
(iii) Provisions for restoration
The Group estimates the future removal and restoration costs of
petroleum production facilities, wells, pipelines and related assets at
the time of installation of the assets and reviews these assessments
periodically. In most instances the removal of these assets will occur
well into the future. The estimate of future removal costs therefore
requires management to make judgements around the timing of
the required restoration, rehabilitation and decommissioning, as
well as, the discount rate. The carrying amount of the provision for
restoration is disclosed in Note 23.
(iv) Impairment of oil and gas assets
The Group assesses whether its oil and gas assets are impaired on
a semi-annual basis. This requires an estimation of the recoverable
amount of the cash generating unit to which each asset belongs.
The recoverable amount of an asset is the higher of its fair value
Notes to the financial statements For the financial year ended 30 June 2016F
or p
erso
nal u
se o
nly

Horizon Oil Annual Report 201670
less cost to sell and value in use. The fair value less cost to sell is
assessed on the basis of the estimated net cash flows that will be
received from the asset’s continued employment and subsequent
disposal. The estimated future cash flows are based on estimates
of hydrocarbon reserves, future production profiles, commodity
prices, operating costs and future development costs necessary to
access the reserves. The estimated future cash flows are discounted
back to today’s dollars to obtain the value in use amount using an
after-tax discount rate of between 10% and 11% to take into account
risks which have not already been adjusted for in the cash flows. A
detailed impairment assessment of the Group’s oil and gas assets
has been performed in Note 29.
(v) Share-based payments
Share-based payment transactions with directors and employees are
measured by reference to the fair value of the share performance
rights or options at the date they were granted. The fair value is
ascertained using an appropriate pricing model, either Black-Scholes
or Monte Carlo simulation, depending on the terms and conditions
upon which the share performance rights or options were granted.
The Group also applies assumptions around the likelihood of the
share performance rights or options vesting which will have an
impact on the expense and equity recorded in the financial year. The
number of share performance rights and options outstanding are
disclosed in Note 33.
(vi) Recoverability of deferred tax assets
The recoverability of deferred tax assets is based on the probability
that future taxable amounts will be available to utilise those
temporary differences and losses. The Group has not recognised
deferred tax assets in respect of some tax losses and temporary tax
differences as the future utilisation of these losses and temporary
tax differences is not considered probable at this point in time.
Assessing the future utilisation of tax losses and temporary tax
differences requires the Group to make significant estimates related
to expectations of future taxable income. Estimates of future
taxable income are based on forecast cash flows from operations
and the application of existing tax laws. To the extent that future
utilisation of these tax losses and temporary tax differences becomes
probable, this could result in significant changes to deferred tax
assets recognised, which would in turn impact future financial results.
During the current year, tax losses and temporary tax differences in
Australia have been recognised as deferred tax assets on the basis
that it is expected the operations will generate sufficient taxable
profits to fully utilise those losses.
(b) Critical judgements in applying the Group’s accounting policies
No critical judgements are considered to have a significant risk of
causing a material adjustment to the carrying amounts of the assets
and liabilities within the next financial year were made during the
preparation of this report.
Note 4. Segment information
(a) Description of segmentsOperating segments are reported in a manner consistent with the
internal reporting provided to the chief operating decision maker.
The chief operating decision maker has been identified as the Board
of Directors.
The operating segments identified are broadly based on the Group’s
working interest in each individual oil and gas permit, arranged
by developmental phase. Discrete pre-tax financial information
(including pre-tax operating profit and capital expenditure on
exploration and evaluation assets and oil and gas assets) for each
oil and gas permit is prepared and provided to the chief operating
decision maker on a regular basis. In certain circumstances,
individual oil and gas permits are aggregated into a single operating
segment where the economic characteristics and long-term planning
and operational considerations of the individual oil and gas permits
are such that they are considered interdependent. The Group has
identified five operating segments:
• New Zealand development – the Group is currently producing
crude oil from the Maari/Manaia fields, located offshore New
Zealand;
• New Zealand exploration – during the year the Group was
involved in the exploration and evaluation of hydrocarbons in the
offshore permit area: PEP 51313;
• China exploration and development – the Group is currently
involved in the developing and producing of crude oil from the
Block 22/12 – WZ 6-12 and WZ 12-8W oil field development and
in the exploration and evaluation of hydrocarbons within Block
22/12;
• PNG exploration and development - the Group is currently
involved in the Stanley condensate/gas development, and the
exploration and evaluation of hydrocarbons in five onshore permit
areas – PRL 21, PPL 259, PPL 372, PPL 373 and PPL 430; and
• ‘All other segments’ include amounts of a corporate nature not
specifically attributable to an operating segment.
Notes to the financial statements For the financial year ended 30 June 2016F
or p
erso
nal u
se o
nly

Horizon Oil Annual Report 2016 71
(b) Segment information provided to the chief operating decision maker
New Zealand Development
New Zealand Exploration
China Exploration
and Development
Papua New Guinea
Exploration and
Development
All other segments
Total
2016 US$’000 US$’000 US$’000 US$’000 US$’000 US$’000
Segment revenue:
Revenue from external customers
40,466
-
35,486
-
-
75,952
Profit (loss) before tax (29,132) (5,306) (3,455) (107,558) (14,229) (159,680)
Depreciation and amortisation (13,769) - (22,631) (432) (258) 37,090
Total segment assets as at 30 June 2016
65,061
56
143,644
62,706
15,205
286,672
Additions to non-current assets
other than financial assets and
deferred tax during the financial
year ended:
Exploration phase expenditure: - 155 2,614 6,547 - 9,316
Development and production
phase expenditure:
3,147 - 8,575 3,247 - 14,969
Plant and equipment: - - - - 220 220
Total segment liabilities as at 30 June 2016
47,921
56
71,258
1,011
61,892
182,138
New Zealand Development
New Zealand Exploration
China Exploration
and Development
Papua New Guinea
Exploration and
Development
All other segments
Total
2015 US$’000 US$’000 US$’000 US$’000 US$’000 US$’000
Segment revenue:
Revenue from external customers 33,447 - 70,503 - - 103,950
Profit (loss) before tax 15,993 (12) 16,129 (15,556) (13,399) 3,155
Depreciation and amortisation 9,023 - 28,074 443 239 37,779
Total segment assets as at
30 June 2015 135,656 5,207 166,170 176,767 39,539 523,339
Additions to non-current assets
other than financial assets and
deferred tax during the financial
year ended:
Exploration phase expenditure: - 92 8,179 26,116 - 34,387
Development and production phase
expenditure:
21,295 - 1,116 21,025 - 43,436
Plant and equipment: - - - 48 143 191
Total segment liabilities as at
30 June 2015 80,225 238 92,246 5,022 89,291 267,022
Notes to the financial statements For the financial year ended 30 June 2016F
or p
erso
nal u
se o
nly

Horizon Oil Annual Report 201672
(c) Other segment information
(i) Segment revenue
The Group’s revenue is derived from the sale of crude oil produced in China and New Zealand. The Group sells to external customers
through back-to-back sales agreements with the respective joint venture operators.
Segment revenue reconciles to total consolidated revenue as follows:
Consolidated
2016 2015
US$’000 US$’000
Total segment revenue 75,952 103,950
Proceeds from insurance claims 3,613 6,600
Interest income 25 146
Other non-operating income - 96
Total revenue 79,590 110,792
(ii) Segment profit before tax
The chief operating decision maker assesses the performance of operating segments based on a measure of profit before tax.
Segment profit before tax reconciles to consolidated profit before tax as follows:
Consolidated
2016 2015
US$’000 US$’000
Total segment (loss)/profit before tax (159,680) 3,155
Proceeds from insurance claims 3,613 6,600
Interest income 25 146
Other non-operating income - 96
Unrealised movement in value of convertible bond conversion rights 5,322 9,063
Realised gain on purchase of bonds 1,193 -
Net foreign exchange (losses) (199) (1,309)
Profit before tax (149,726) 17,751
(iii) Segment assets
The amounts provided to the chief operating decision maker with respect to total assets are measured in a manner consistent with that of the
financial statements.
Reportable segment assets are equal to consolidated total assets.
(iv) Segment liabilities
The amounts provided to the chief operating decision maker with respect to total liabilities are measured in a manner consistent with that of
the financial statements.
Reportable segment liabilities are equal to consolidated total liabilities.
Notes to the financial statements For the financial year ended 30 June 2016F
or p
erso
nal u
se o
nly

Horizon Oil Annual Report 2016 73
Consolidated
2016 2015
US$’000 US$’000
Note 5. RevenueFrom continuing operations
Crude oil sales 56,455 83,683
Net realised gain/(loss) on oil hedging derivatives 19,497 20,267
75,952 103,950
Other income
Insurance claim income1 3,613 6,600
Other operating income - 96
Interest received from unrelated entities 25 146
3,638 6,842
Gains – Conversion rights on convertible bonds
Unrealised movement in fair value of convertible bond conversion rights2 5,322 9,063
Gain on buyback of convertible bonds3 1,193 -
6,515 9,063
1. Insurance claims of US $813,000 received for repair costs associated with FPSO mooring and loss of production claims received of US$2,800,000.
2. The amount shown is the movement during the financial year of the fair value of the conversion rights relating to the 5.5% convertible bonds issued on 17 June 2011.
The conversion rights can be settled in cash or ordinary shares of the parent entity, at the option of the issuer, and the number of shares to be issued at conversion is
subject to the conversion price which may reset under certain circumstances. Accordingly, the conversion rights are a derivative financial liability and are marked to
market through the profit and loss. Fair value of conversion rights at issuance on 17 June 2011 was US$20,043,000. The redemption date of the bonds has been
extended to 19 September 2016. Refer to Note 20 for further details of the convertible bonds issued.
3. Horizon Oil purchased in the open market, by private contract, US$21.2 million of the US$80 million 5.5% convertible bonds, and surrendered the purchased bonds
for cancellation in accordance with the bond trust deed. A gain has been realised to reflect the excess of the carrying value of the straight bonds and the conversion
rights over the purchase price paid. Refer to Note 20 for further details of the convertible bonds issued.
Consolidated
2016 2015
US$’000 US$’000
Note 6. ExpensesCost of sales
Direct production costs 22,858 19,641
Inventory adjustments1 817 (1,181)
Amortisation expense 36,400 37,096
Royalties and other levies2 104 4,414
60,179 59,970
1. Includes production overlift/underlift and inventory adjustments.
2. Includes Chinese special oil income levy.
General and administrative expenses
Employee benefits expense (net) 4,454 3,383
Corporate office expense 1,160 685
Insurance expense 1,427 1,950
Depreciation expense 690 683
Rental expense relating to operating leases 363 868
8,094 7,569
Exploration and development expenses
Exploration and development expenditure written off/expensed 1,852 16,222
1,852 16,222
Impairment of non-current assets
Impairment of non-current assets1 147,515 -
147,515 -
1. Refer to Note 29 for detailed impairment assessment of the Group’s non-current assets.
Notes to the financial statements For the financial year ended 30 June 2016F
or p
erso
nal u
se o
nly

Horizon Oil Annual Report 201674
Consolidated
2016 2015
US$’000 US$’000
Financing costs
Interest and finance charges 15,189 15,075
Discount unwinding on provision for restoration 258 416
Amortisation of prepaid financing costs 1,817 1,869
17,264 17,360
Other expenses
Net foreign exchange losses 199 1,309
Other expenses 728 (326)
927 983
Consolidated
2016 2015
US$’000 US$’000
Note 7. Income tax expense(a) Royalty tax expense/(benefit)Royalty paid/payable in New Zealand – current tax expense 1,078 1,028
Tax expense/(benefit) related to movements in deferred tax balances (90) 3,271
Total royalty tax expense/(benefit) 988 4,299
(b) Income tax expenseCurrent tax expense - 51
Tax expense/(benefit) related to movements in deferred tax balances (5,520) (2,990)
Adjustments for current tax of prior periods (669) (1,916)
Total income tax expense/(benefit) (6,189) (4,855)
Income tax expense/(benefit) is attributable to:
Profit from continuing operations (6,189) (4,855)
Profit from discontinued operations - -
Aggregate income tax expense/(benefit) (6,189) (4,855)
Deferred income tax (benefit)/expense included in income tax expense comprises:
Decrease/(increase) in deferred tax assets 6,953 (8,859)
(Decrease)/increase in deferred tax liabilities (12,473) 5,869
(5,520) (2,990)
(c) Numerical reconciliation between profit before tax and tax expense (benefit)Profit/(loss) from continuing operations before income tax (149,726) 17,751
Less: Royalty paid/payable (1,078) (1,028)
(150,804) 16,722
Tax at the Australian tax rate of 30% (2015: 30%) (45,241) 5,017
Tax effect of amounts which are not deductible (taxable) in calculating taxable income:
Expenditure not allowed for income tax purposes 1,357 8,429
Other deductible items (5,255) (8,825)
Non-assessable income (78) (2,597)
(49,217) 2,024
Effect of overseas tax rates 1,596 (1,668)
Deferred tax asset not brought to account 42,101 3,649
Previously unrecognised tax losses now recognised to reduce deferred tax expense - (6,143)
Previously unrecognised tax losses now recouped to reduce current tax expense - (801)
Adjustments for current tax of prior periods (669) (1,916)
Income tax expense/(benefit) (6,189) (4,855)
Royalty tax expense/(benefit) 988 4,299
Total tax expense/(benefit) recognised in statement of profit or loss (5,201) (556)
Notes to the financial statements For the financial year ended 30 June 2016F
or p
erso
nal u
se o
nly

Horizon Oil Annual Report 2016 75
Consolidated
2016 2015
US$’000 US$’000
(d) Amounts recognised in other comprehensive incomeAggregate deferred tax arising in the reporting period and not recognised in net profit or loss but
directly debited to other comprehensive income.
Deferred tax: Changes in fair value of cash flow hedges (3,162) 3,162
Total tax expense/(benefit) recognised in other comprehensive income (3,162) 3,162
(e) Tax lossesUnused tax losses (and applicable tax rate) for which no deferred tax asset has been recognised:
Horizon Oil Limited – 30% (2015: 30%) - -
Horizon Oil (USA) Inc. and other US entities – 34% (2015: 34%) - 10,615
Horizon Oil (Papua) Limited and other PNG entities – 45% / 30% (2015: 45% / 30%) - -
- 10,615
Potential tax benefit at applicable tax rates - 3,609
The Company has no Australian subsidiaries and therefore it is not subject to the Australian tax consolidation regime.
Consolidated
2016 2015
US$’000 US$’000
Note 8. Current assets – Cash and cash equivalentsCash at bank and on hand 9,615 41,279
Restricted cash1 6,464 20,064
16,079 61,343
1. Under the terms of our finance facility (refer to Note 20), certain cash balances are available to the Group after certain conditions of the relevant facility agreement are
satisfied. The restricted cash balance was held on deposit at average floating interest rates of approximately 0.00% pa (2015: 0.00%).
Consolidated
2016 2015
US$’000 US$’000
Note 9. Current assets – ReceivablesOther receivables1 9,932 14,580
9,932 14,580
1. Of this balance US$Nil (2015: US$331,339) related to amounts receivable from related parties. Refer to Note 32 for further details.
Information about the Company’s exposure to credit and market risks, and collectability of overdue amounts, is included in Note 2(b).
Notes to the financial statements For the financial year ended 30 June 2016F
or p
erso
nal u
se o
nly

Horizon Oil Annual Report 201676
Consolidated
2016 2015
US$’000 US$’000
Note 10. InventoriesCrude oil, at cost 1,370 2,186
Drilling inventory, at cost 422 2,721
1,792 4,907
Consolidated
2016 2015
US$’000 US$’000
Note 11. Current tax receivableIncome tax – China 650 2,091
650 2,091
Consolidated
2016 2015
US$’000 US$’000
Note 12. Current – Other assetsPrepayments 1,655 1,435
1,655 1,435
Consolidated
2016 2015
US$’000 US$’000
Note 13. Non-current assets – Deferred tax assetsRecognised deferred tax assets are attributable to:
Tax losses 5,118 5,135
Development expenditure - 5,022
Provisions and other 1,335 1,008
Total deferred tax assets 6,453 11,165
Set off of deferred tax liabilities pursuant to set off provisions - -
Net deferred tax assets 6,453 11,165
2016 Movements
Tax Losses
US$’000
Development expenditure
$US’000
Provisions and other
$US’000
Total
$US’000
At 1 July 2015 (Charged)/credited
5,135 5,022 1,008 11,165
- to profit or loss (17) (5,022) 327 (4,712)
At 30 June 2016 5,118 - 1,335 6,453
Notes to the financial statements For the financial year ended 30 June 2016F
or p
erso
nal u
se o
nly

Horizon Oil Annual Report 2016 77
2015 Movements
Tax losses
US$’000
Development expenditure
$US’000
Provisions and other $US’000
Total
$US’000
At 1 July 2014 1,880 - 426 2,306
(Charged)/credited
- to profit or loss 3,255 5,022 582 8,859
At 30 June 2015 5,135 5,022 1,008 11,165
Note 14. Non-current assets – Plant and equipment
Consolidated
Other plant and equipment
US$’000
Leasehold improvements
US$’000
Total
US$’000
As at 1 July 2014
Cost 2,749 4,928 7,677
Accumulated depreciation (1,436) (683) (2,119)
Net book amount 1,313 4,245 5,558
Financial year ended 30 June 2015
Opening net book amount 1,313 4,245 5,558
Additions 154 37 191
Disposals (1) - (1)
Depreciation expense (414) (269) (683)
Closing net book amount 1,052 4,013 5,065
As at 30 June 2015
Cost 2,846 4,965 7,811
Accumulated depreciation (1,794) (952) (2,746)
Net book amount 1,052 4,013 5,065
Consolidated
Other plant and equipment
US$’000
Leasehold improvements
US$’000
Total
US$’000
Financial year ended 30 June 2016
Opening net book amount 1,052 4,013 5,065
Additions 220 - 220
Disposals (322) (980) (1,302)
Impairment losses1 - (1,407) (1,407)
Depreciation expense (418) (272) (690)
Closing net book amount 532 1,354 1,886
1. Refer to Note 29 for details of impairment expense for the financial year.
As at 30 June 2016
Cost 2,157 1,863 4,020
Accumulated depreciation (1,625) (509) (2,134)
Net book amount 532 1,354 1,886
Notes to the financial statements For the financial year ended 30 June 2016F
or p
erso
nal u
se o
nly

Horizon Oil Annual Report 201678
Note 15. Non-current assets – Exploration phase expenditure Consolidated
2016 2015
US$’000 US$’000
Exploration phase expenditure
Deferred geological, geophysical, drilling and other exploration and evaluation expenditure 53,613 96,959
The reconciliation of exploration phase expenditure carried forward above is as follows:
Balance at beginning of financial year 96,959 74,658
Expenditure incurred during financial year 9,317 34,387
Transferred to development phase (3,486) -
Disposals during the financial year - -
Expenditure written off during financial year (1,110) (12,086)
Impairment losses (48,067) -
Balance at end of financial year 53,613 96,959
Note 16. Non-current assets – Oil and gas assets Consolidated
2016 2015
US$’000 US$’000
Development and production phase expenditure
Producing oil and gas property acquisition, deferred geological, seismic and drilling, production and
distribution facilities and other development expenditure
447,048 432,390
Impairment losses1 (98,041) -
Less accumulated amortisation (154,395) (117,995)
194,612 314,395
1. Refer to Note 29 for details of impairment expense for the financial year.
The reconciliation of development and production phase expenditure carried forward above is follows:
Consolidated
Development phase
expenditure
Production phase expenditure
Total
US$’000 US$’000 US$’000
Balance at 1 July 2014 60,670 250,368 311,038
Transferred from development phase (9,125) - (9,125)
Transfer to production phase - 9,125 9,125
Reassessment of rehabilitation asset - 640 640
Amortisation incurred - (37,096) (37,096)
Expenditure incurred during financial year 21,025 22,411 43,436
Oil and gas asset expense1 - (3,623) (3,623)
Balance at 30 June 2015 72,570 241,825 314,395
Transferred from exploration phase 3,486 - 3,486
Transfer to production phase (3,486) 3,486 -
Reassessment of rehabilitation asset - (3,797) (3,797)
Amortisation incurred - (36,400) (36,400)
Expenditure incurred during financial year 3,247 11,722 14,969
Impairment losses2 (60,460) (37,581) (98,041)
Balance at 30 June 2016 15,357 179,255 194,612
1. Relates to expenditure in the prior year on proposed production wells in the Maari field in New Zealand, a decision was made during the prior year not to proceed
with the drilling of these wells.
2. Refer to Note 29 for details of impairment expense for the financial year.
Notes to the financial statements For the financial year ended 30 June 2016F
or p
erso
nal u
se o
nly

Horizon Oil Annual Report 2016 79
Consolidated
2016 2015
US$’000 US$’000
Note 17. Current liabilities – PayablesTrade creditors 2,102 1,722
Share of joint operation creditors and accruals 7,232 10,472
Other creditors 3,167 4,587
12,501 16,781
Consolidated
2016 2015
US$’000 US$’000
Note 18. Deferred incomeDeferred income - 2,212
- 2,212
.
Consolidated
2016 2015
US$’000 US$’000
Note 19. Derivative financial instrumentsCurrent:
Derivative asset - Oil price swaps – cash flow hedges - 11,399
- 11,399
The Group is party to derivative financial instruments in the normal course of business in order to hedge exposure to oil price fluctuations in
accordance with the Group’s financial risk management policies (refer to Note 2(a)(ii)).
Oil price swap contracts (cash flow hedges)
During the financial year, oil price hedging was undertaken as a risk mitigation measure to ensure the Group’s financial position remains sound
and that the Group is able to meet its financial obligations in the event of low oil prices. As at 30 June 2016, the Group has no further open
hedges outstanding.
The gain or loss from remeasuring the hedging instruments at fair value is deferred in equity in the hedging reserve, to the extent that
the hedge is effective, and re-classified into profit or loss when the hedged oil price transaction is recognised. The ineffective portion is
recognised in profit or loss immediately. During the financial year, a gain of US$19,497,000 (2015: US$20,267,000) was transferred to profit
or loss.
Consolidated
2016 2015
US$’000 US$’000
Note 20. BorrowingsCurrent:
Bank loans 18,137 17,829
Convertible Bonds 58,800 79,275
76,937 97,104
Non-current:
Bank loans 67,428 97,286
67,428 97,286
Total Borrowings 144,365 194,390
Notes to the financial statements For the financial year ended 30 June 2016F
or p
erso
nal u
se o
nly

Horizon Oil Annual Report 201680
Bank loans –Revolving Cash Advance FacilityOn 14 May 2015, the Group finalised and executed a US$120 million
Revolving Cash Advance Facility with Australia and New Zealand
Banking Group (ANZ), as mandated lead arranger, and Westpac
Banking Corporation (Westpac). The facility retained key elements
of the previous Reserves Based Debt Facility, with key changes
including the removal of the forced repayment schedule, additional
tenor to May 2019 and potential access to a new accordion
tranche of up to US$50 million (subject to debt capacity criteria
and lender approvals). Under the facility, the facility limit and thus
future repayments are determined by applying a minimum loan life
coverage ratio to the net present value of estimated future cash
flows from all projects included in the facility. Estimated future cash
flows are dependent on, amongst other things, the lenders views
on forecast oil prices, reserve estimates, operating and capital cost
estimates and forecast interest and exchange rates.
At 30 June 2016, total debt drawn under the facility was US$89.1
million with undrawn debt capacity available of approximately US$8.8
million. Floating interest in respect of the facility was at LIBOR plus a
weighted average margin of 2.90%.
The facility was secured by a floating charge over the shares and
assets of the borrowers (Horizon Oil International Limited, Horizon
Oil (Papua) Limited and Horizon Oil (Beibu) Limited which are wholly
owned subsidiaries of Horizon Oil Limited) and other Horizon Oil
Limited subsidiaries, in favour of ANZ Fiduciary Services Pty Limited
as security trustee. Horizon Oil Limited and other Horizon Oil
Limited subsidiaries have guaranteed the performance of Horizon
Oil International Limited, Horizon Oil (Papua) Limited and Horizon Oil
(Beibu) Limited (which have also given guarantees) in relation to the
loan facility from ANZ and Westpac. In addition, the shares of the
following Horizon Oil Limited subsidiaries have been mortgaged to
ANZ Fiduciary Services Pty Limited: Horizon Oil International Limited,
Horizon Oil (Papua) Limited, Horizon Oil (Beibu) Limited, Horizon Oil
International Holdings Limited, Ketu Petroleum Limited, Horizon Oil
(PNG Holdings) Limited and Horizon Oil (China Holdings) Limited.
The Group is subject to covenants which are common for a facility
of this nature.
Convertible BondsThe parent entity issued 400 5.5% convertible bonds for US$80
million on 17 June 2011. The bonds were issued with an initial
conversion price of US$0.52, equivalent to A$0.49 based on
exchange rates at the time of pricing, and represented a conversion
premium of 29% to the Company's last closing price of A$0.38 on 2
June 2011. The initial conversion price was subject to adjustment
in certain circumstances such that the conversion price has been
reduced to US$0.409 since issue. During the year the parent entity
purchased in the open market, by private contract, US$21.2 million
of the US$80m 5.5% Convertible Bonds and has surrendered the
purchased bonds for cancellation in accordance with the bond trust
deed. Accordingly, US$58.8m of the bonds remain outstanding at 30
June 2016. The bonds were initially due for redemption on 17 June
2016. However, as part of Horizon Oil’s refinancing arrangements,
the Company’s convertible bondholders unanimously approved
the extension of the bond redemption date to 19 September 2016,
providing adequate time to obtain the requisite shareholder approval
and implement the refinancing arrangements detailed below. While
having received the unanimous approval for the deferral of the
principal repayment of US$58.8 million, the Company satisfied the
other conditions of the convertible bonds at the original redemption
date of 17 June 2016, namely the payment of the accrued yield of
US$5.2 million, together with the scheduled interest payments of
US$1.6 million.
No bonds had been converted as at 30 June 2016. On conversion,
the Group may elect to settle the bonds in cash or ordinary shares
in the parent entity. Based on the adjusted conversion price and
following the buy back and cancellation of US$21.2 million in bonds
during the year, the maximum number of shares that could be issued
on conversion is 143,765,281 ordinary shares in the parent entity.
The bonds carried a coupon of 5.5% per annum until their original
maturity date of 17 June 2016, which has now increased to 10%
until the extended maturity date of 19 September 2016. The bonds
were listed on the Singapore Securities Exchange on 20 June 2011.
Details surrounding the bond redemption strategy are outlined in the
Directors’ Report and Note 1.
2016 2015
US$’000 US$’000
Face value of bonds issued 80,000 80,000
Less: Other financial liabilities – value of conversion rights (Note 21) (20,043) (20,043)
Less: Transaction costs (3,362) (3,362)
56,595 56,595
Finance costs in prior periods1 40,449 29,120
Finance costs1 9,579 11,329
Less: CB buybacks (21,589) -
Less: Coupon paid in prior periods (17,600) (13,200)
Less: Coupon paid during the financial year (3,234) (4,400)
Less: Coupon accrued (226) (169)
Less: Premium paid (5,174) -
Current liability 58,800 79,275
1. Finance costs are calculated by applying the effective interest rate of 14.8% to the liability component.
Notes to the financial statements For the financial year ended 30 June 2016F
or p
erso
nal u
se o
nly

Horizon Oil Annual Report 2016 81
Consolidated
2016 2015
US$’000 US$’000
Note 21. Current – Other financial liabilitiesConversion rights on convertible bonds 530 7,961
530 7,961
The amount shown for other financial liabilities is the fair value of the conversion rights relating to the 5.5% convertible bonds. The conversion
rights can be settled in cash or ordinary shares of the parent entity, at the option of the issuer, and the number of shares to be issued at
conversion is subject to the conversion price which may reset under certain circumstances. Accordingly, the conversion rights are a derivative
financial liability and are marked to market. Fair value of conversion rights at issuance on 17 June 2011 was US$20,043,000. Refer to Note
20 for further details of the convertible bonds issued.
Consolidated
2016 2015
US$’000 US$’000
Note 22. Non-current liabilities – Deferred tax liabilitiesRecognised deferred tax liabilities are attributable to:
Exploration expenditure - 1,440
Development and production expenditure 14,940 19,695
Accounting profits royalty 8,004 8,094
Cash flow hedges - 3,162
Other 1,118 3,632
Total deferred tax liabilities 24,062 36,023
Set off of deferred tax assets pursuant to set off provisions (8,138) (6,615)
Net deferred tax liabilities 15,924 29,408
2016
Movements Exploration expenditure
US$’000
Development and production
expenditure US$’000
Accounting profits royalty
US$’000
Cash flow hedges
US$’000
Other US$,000
Total US$’000
At 1 July 2015 1,440 19,695 8,094 3,162 3,632 36,023
Charged/(credited)
- to profit or loss (1,440) (4,755) (90) - (2,514) (8,799)
- to other comprehensive income - - - (3,162) - (3,162)
At 30 June 2016 - 14,940 8,004 - 1,118 24,062
2015
Movements Exploration expenditure
US$’000
Development and production
expenditure US$’000
Accounting profits royalty
US$’000
Cash flow hedges
US$,000
Other US$’000
Total US$’000
At 1 July 2014 1,414 13,021 4,823 - 1,601 20,859
Charged/(credited)
- to profit or loss 26 6,674 3,271 - 2,031 12,002
- to other comprehensive income - - - 3,162 - 3,162
At 30 June 2015 1,440 19,695 8,094 3,162 3,632 36,023
Notes to the financial statements For the financial year ended 30 June 2016F
or p
erso
nal u
se o
nly
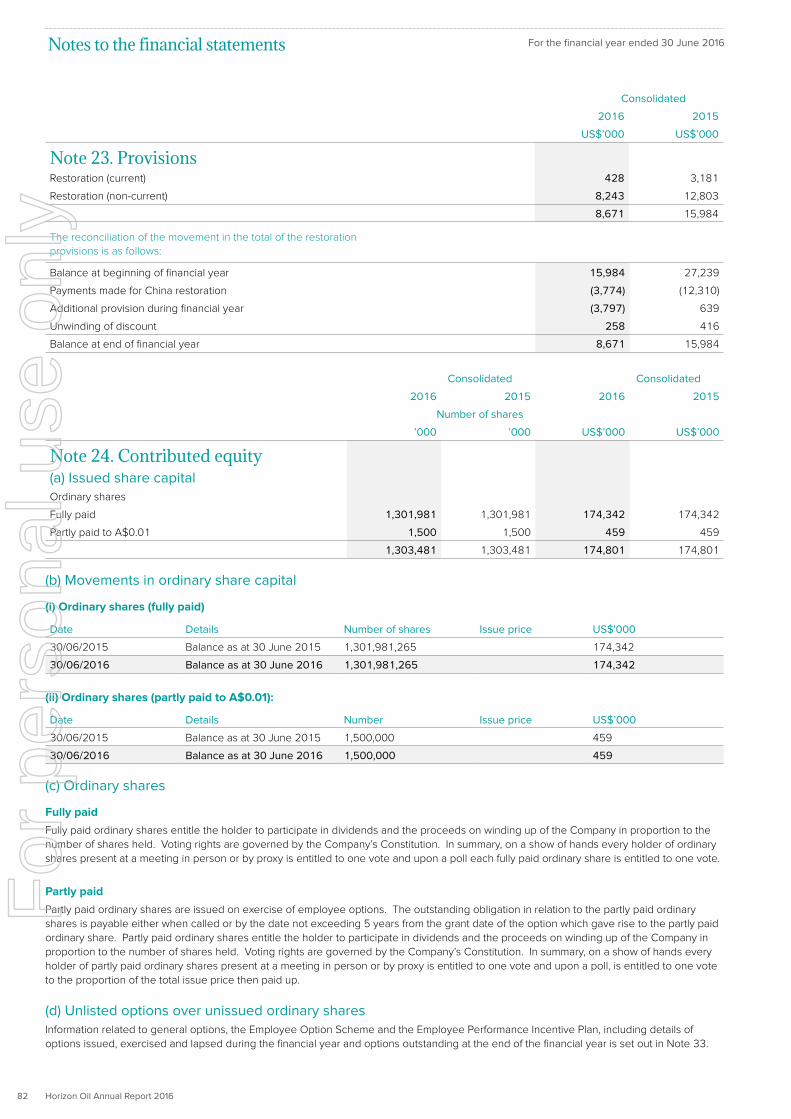
Horizon Oil Annual Report 201682
Consolidated
2016 2015
US$’000 US$’000
Note 23. ProvisionsRestoration (current) 428 3,181
Restoration (non-current) 8,243 12,803
8,671 15,984
The reconciliation of the movement in the total of the restoration provisions is as follows:
Balance at beginning of financial year 15,984 27,239
Payments made for China restoration (3,774) (12,310)
Additional provision during financial year (3,797) 639
Unwinding of discount 258 416
Balance at end of financial year 8,671 15,984
Consolidated Consolidated
2016 2015 2016 2015
Number of shares
’000 ’000 US$’000 US$’000
Note 24. Contributed equity(a) Issued share capitalOrdinary shares
Fully paid 1,301,981 1,301,981 174,342 174,342
Partly paid to A$0.01 1,500 1,500 459 459
1,303,481 1,303,481 174,801 174,801
(b) Movements in ordinary share capital
(i) Ordinary shares (fully paid)
Date Details Number of shares Issue price US$'000
30/06/2015 Balance as at 30 June 2015 1,301,981,265 174,342
30/06/2016 Balance as at 30 June 2016 1,301,981,265 174,342
(ii) Ordinary shares (partly paid to A$0.01):
Date Details Number Issue price US$’000
30/06/2015 Balance as at 30 June 2015 1,500,000 459
30/06/2016 Balance as at 30 June 2016 1,500,000 459
(c) Ordinary shares
Fully paid
Fully paid ordinary shares entitle the holder to participate in dividends and the proceeds on winding up of the Company in proportion to the
number of shares held. Voting rights are governed by the Company’s Constitution. In summary, on a show of hands every holder of ordinary
shares present at a meeting in person or by proxy is entitled to one vote and upon a poll each fully paid ordinary share is entitled to one vote.
Partly paid
Partly paid ordinary shares are issued on exercise of employee options. The outstanding obligation in relation to the partly paid ordinary
shares is payable either when called or by the date not exceeding 5 years from the grant date of the option which gave rise to the partly paid
ordinary share. Partly paid ordinary shares entitle the holder to participate in dividends and the proceeds on winding up of the Company in
proportion to the number of shares held. Voting rights are governed by the Company’s Constitution. In summary, on a show of hands every
holder of partly paid ordinary shares present at a meeting in person or by proxy is entitled to one vote and upon a poll, is entitled to one vote
to the proportion of the total issue price then paid up.
(d) Unlisted options over unissued ordinary shares Information related to general options, the Employee Option Scheme and the Employee Performance Incentive Plan, including details of
options issued, exercised and lapsed during the financial year and options outstanding at the end of the financial year is set out in Note 33.
Notes to the financial statements For the financial year ended 30 June 2016F
or p
erso
nal u
se o
nly

Horizon Oil Annual Report 2016 83
Note 25. Reserves and retained profits Consolidated
2016 2015
US$’000 US$’000
(a) ReservesShare-based payments reserve 12,030 11,052
Movements:
Balance at beginning of financial year 11,051 10,002
Employee share-based payments expense 979 1,050
Balance at end of financial year 12,030 11,052
Hedge reserve - 8,236
Movements:
Balance at beginning of financial year 8,237 (6,158)
Movement in net market value of hedge contracts (11,399) 17,556
Deferred tax 3,162 (3,162)
Balance at end of financial year - 8,236
Total reserves 12,030 19,288
(b) Retained profitsRetained profits at beginning of financial year 62,254 43,921
Net profit for financial year (144,471) 18,333
Retained profits at end of financial year (82,217) 62,254
(c) Nature and purpose of reserves
Share-based payment reserve:
The fair value of options and share appreciation rights granted to employees results in an increase in equity upon recognition of the
corresponding employee benefits expense, as described in the accounting policy set out in Note 1(w)(iii). The fair value of general options
granted also results in an increase in equity.
The Company has elected to retain any amounts originally recognised in the share-based payments reserve, regardless of whether the
associated options or share appreciation rights are exercised, cancelled or lapse unexercised.
Hedge reserve:
Changes in the market value of the effective portion of derivatives is reflected directly in equity until such time as the hedge is ineffective or
expires, as described in the accounting policy set out in Note 1(t).
Consolidated
2016 2015
US$’000 US$’000
Note 26. New Zealand Imputation CreditsImputation credits available for subsequent financial years1 2,857 2,857
1. The franking credits available for subsequent financial years are only available to New Zealand resident shareholders under the Trans-Tasman imputation legislation.
Notes to the financial statements For the financial year ended 30 June 2016F
or p
erso
nal u
se o
nly
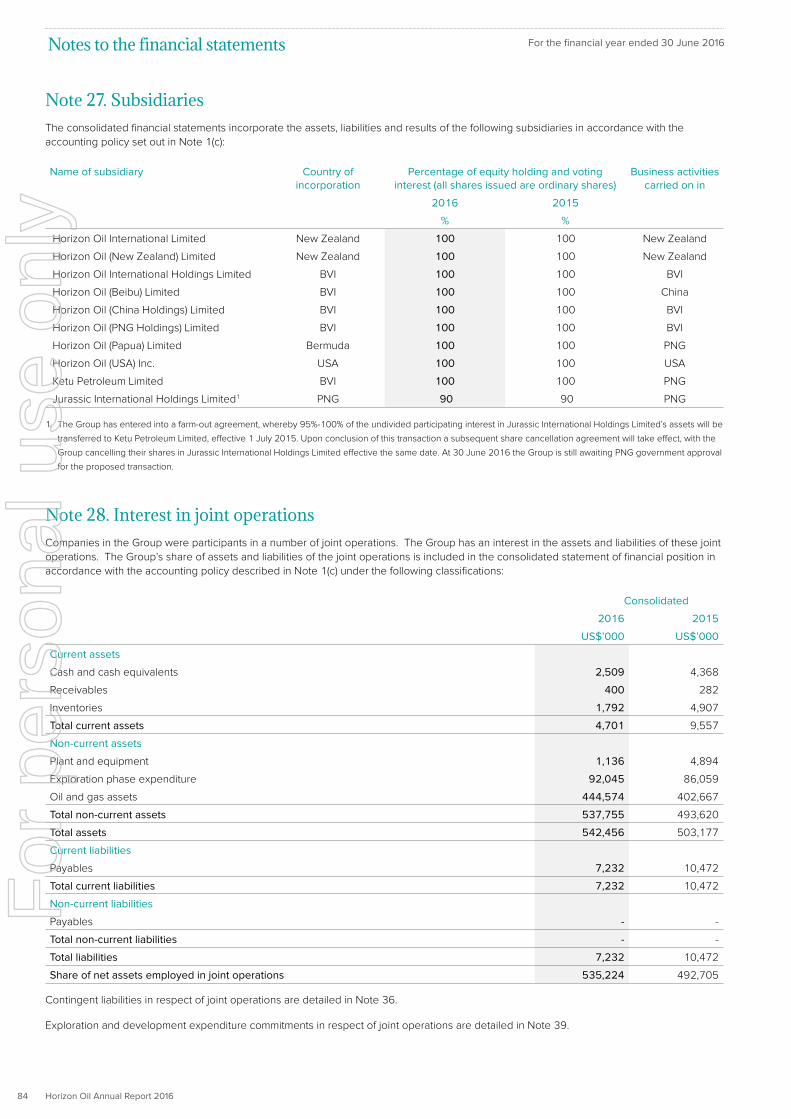
Horizon Oil Annual Report 201684
Note 27. SubsidiariesThe consolidated financial statements incorporate the assets, liabilities and results of the following subsidiaries in accordance with the
accounting policy set out in Note 1(c):
Name of subsidiary Country of incorporation
Percentage of equity holding and voting interest (all shares issued are ordinary shares)
Business activities carried on in
2016 2015
% %
Horizon Oil International Limited New Zealand 100 100 New Zealand
Horizon Oil (New Zealand) Limited New Zealand 100 100 New Zealand
Horizon Oil International Holdings Limited BVI 100 100 BVI
Horizon Oil (Beibu) Limited BVI 100 100 China
Horizon Oil (China Holdings) Limited BVI 100 100 BVI
Horizon Oil (PNG Holdings) Limited BVI 100 100 BVI
Horizon Oil (Papua) Limited Bermuda 100 100 PNG
Horizon Oil (USA) Inc. USA 100 100 USA
Ketu Petroleum Limited BVI 100 100 PNG
Jurassic International Holdings Limited1 PNG 90 90 PNG
1. The Group has entered into a farm-out agreement, whereby 95%-100% of the undivided participating interest in Jurassic International Holdings Limited’s assets will be
transferred to Ketu Petroleum Limited, effective 1 July 2015. Upon conclusion of this transaction a subsequent share cancellation agreement will take effect, with the
Group cancelling their shares in Jurassic International Holdings Limited effective the same date. At 30 June 2016 the Group is still awaiting PNG government approval
for the proposed transaction.
Note 28. Interest in joint operationsCompanies in the Group were participants in a number of joint operations. The Group has an interest in the assets and liabilities of these joint
operations. The Group’s share of assets and liabilities of the joint operations is included in the consolidated statement of financial position in
accordance with the accounting policy described in Note 1(c) under the following classifications:
Consolidated
2016 2015
US$’000 US$’000
Current assets
Cash and cash equivalents 2,509 4,368
Receivables 400 282
Inventories 1,792 4,907
Total current assets 4,701 9,557
Non-current assets
Plant and equipment 1,136 4,894
Exploration phase expenditure 92,045 86,059
Oil and gas assets 444,574 402,667
Total non-current assets 537,755 493,620
Total assets 542,456 503,177
Current liabilities
Payables 7,232 10,472
Total current liabilities 7,232 10,472
Non-current liabilities
Payables - -
Total non-current liabilities - -
Total liabilities 7,232 10,472
Share of net assets employed in joint operations 535,224 492,705
Contingent liabilities in respect of joint operations are detailed in Note 36.
Exploration and development expenditure commitments in respect of joint operations are detailed in Note 39.
Notes to the financial statements For the financial year ended 30 June 2016F
or p
erso
nal u
se o
nly

Horizon Oil Annual Report 2016 85
The Group had an interest in the following joint operations:
Permit or licence Principal activities Interest (%) Interest (%)
30 June 2016 30 June 2015
New Zealand
PMP 38160 (Maari/Manaia) Oil and gas production,
exploration and development
10.00% 10.00%
PEP 51313 (Matariki) Oil and gas exploration 21.00%1 21.00%1
China
Block 22/12 Oil and gas exploration and
development
26.95% / 55%2 26.95% / 55%2
PNG
PDL 10 Oil and gas development 30.00%3 30.00%3
PRL 21 Oil and gas exploration and
development
27.00%3 27.00%3
PPL 259 Oil and gas exploration 35.00%3 35.00%3
PPL 372 Oil and gas exploration 90.00%3,4 90.00%3
PPL 373 Oil and gas exploration 90.00%3,4 90.00%3
PPL 430 Oil and gas exploration 50.00%3 50.00%3
1. Under the terms of the farm in agreement executed in November 2012, in the event of commercial discovery at the Whio prospect, Horizon Oil Limited’s interest over
the Whio prospect would reduce to 10%. No commercial hydrocarbons were discovered when this well was drilled in July 2014. The joint venture participants have
elected to withdraw from the permit with completion of withdrawal anticipated in Q3 2016.
2. China National Offshore Oil Corporation is entitled to participate at up to a 51% equity level in any commercial development within Block 22/12. During 2011 CNOOC
exercised their right to participate in the development of WZ 6-12 and WZ 12-8W within Block 22/12 at 51%.
3. The PNG government may appoint a state nominee to acquire up to a 22.5% participating interest in any commercial development within the PNG licence areas.
4. On 22 January 2016 the Group has entered into a farm-out agreement whereby 95% undivided participating interest in PPL 372 and 100% undivided participating
interest in PPL 373 will be transferred to Ketu Petroleum Limited effective 1 July 2015. At 30 June 2016 the Group is still awaiting PNG government approval for the
proposed transaction.
Note 29. Impairment of Non-current assetsAt 30 June 2016, the Group reassessed the carrying amounts of its
non-current assets for indicators of impairment in accordance with
the Group’s accounting policy.
Estimates of recoverable amount are based on an asset’s value-in-
use or fair value less costs to sell (level 3 value hierarchy), using a
discounted cash flow method, and are most sensitive to the following
key assumptions:
For oil and gas assets, the estimated future cash flows for the
value-in-use calculation are based on estimates, the most significant
of which are 2P hydrocarbon reserves, future production profiles,
commodity prices, operating costs and any future development
costs necessary to produce the reserves. Under a fair value less
costs to sell calculation, future cash flows are based on estimates
of 2P hydrocarbon reserves in addition to other relevant factors
such as value attributable to additional resource and exploration
opportunities beyond 2P reserves based on production plans.
Estimates of future commodity prices are based on the Group’s best
estimate of future market prices with reference to external market
analysts’ forecasts, current and historical spot prices and forward
curves. Future commodity prices are reviewed at least annually.
Forecasts of the foreign exchange rate for foreign currencies, where
relevant, are estimated with reference to observable external market
data and forward values, including analysis of broker and consensus
estimates.
The discount rates applied to the future forecast cash flows are
based on the Group’s post-tax weighted average cost of capital,
adjusted for risks where appropriate, including the risk profile of the
countries in which the asset operates.
For capitalised exploration phase expenditure, in conjunction with
consideration of the key assumptions detailed above, a further
assessment is performed at each balance date, to determine whether
any of the following indicators of impairment exists:
(i) tenure over the licence area has expired during the period or will
expire in the near future, and is not expected to be renewed; or
(ii) substantive expenditure on further exploration for and evaluation
of mineral resources in the specific area is not budgeted or
planned; or
(iii) exploration for and evaluation of resources in the specific area
have not led to the discovery of commercially viable quantities of
resources, and the Group has decided to discontinue activities in
the specific area; or
(iv) sufficient data exists to indicate that although a development
is likely to proceed, the carrying amount of the exploration and
evaluation asset is unlikely to be recovered in full from successful
development or from sale.
For plant and equipment, an assessment is performed at each
balance date to determine if an asset’s carrying amount is greater
than its estimated recoverable amount. This assessment considers,
amongst other things, whether the asset is still in use and the value
that would likely be recovered from sale.
Notes to the financial statements For the financial year ended 30 June 2016F
or p
erso
nal u
se o
nly
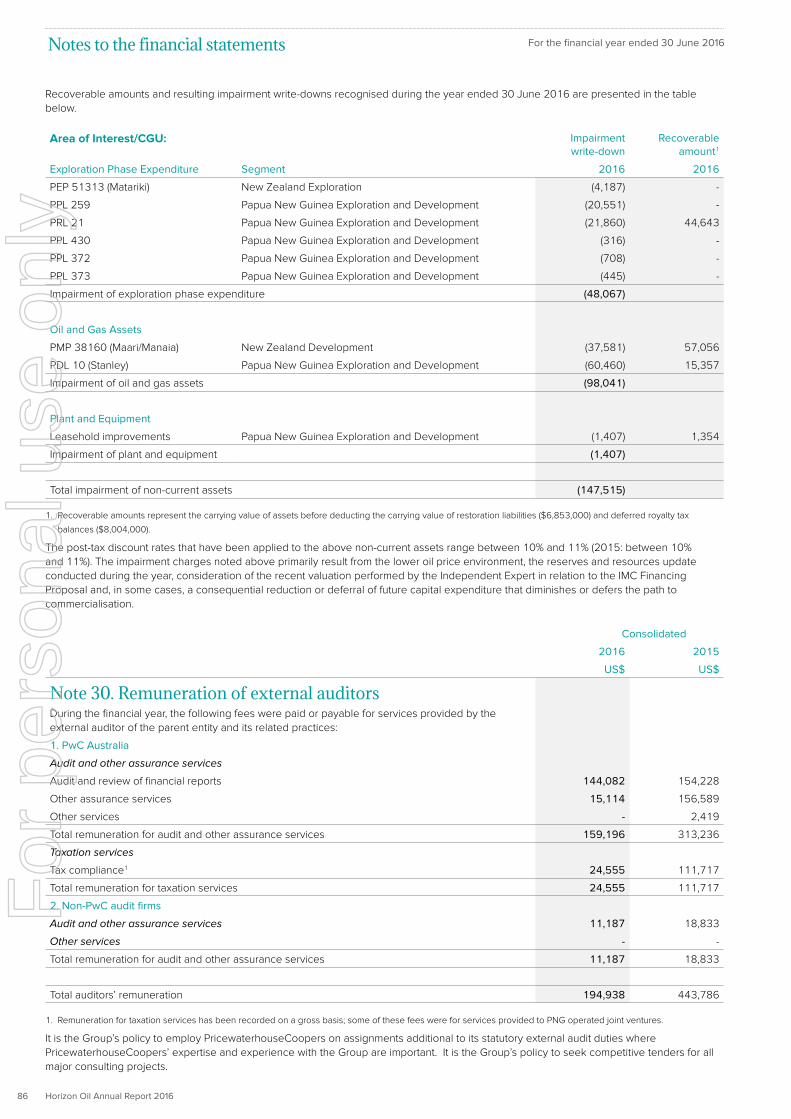
Horizon Oil Annual Report 201686
Recoverable amounts and resulting impairment write-downs recognised during the year ended 30 June 2016 are presented in the table
below.
Area of Interest/CGU: Impairment write-down
Recoverable amount1
Exploration Phase Expenditure Segment 2016 2016
PEP 51313 (Matariki) New Zealand Exploration (4,187) -
PPL 259 Papua New Guinea Exploration and Development (20,551) -
PRL 21 Papua New Guinea Exploration and Development (21,860) 44,643
PPL 430 Papua New Guinea Exploration and Development (316) -
PPL 372 Papua New Guinea Exploration and Development (708) -
PPL 373 Papua New Guinea Exploration and Development (445) -
Impairment of exploration phase expenditure (48,067)
Oil and Gas Assets
PMP 38160 (Maari/Manaia) New Zealand Development (37,581) 57,056
PDL 10 (Stanley) Papua New Guinea Exploration and Development (60,460) 15,357
Impairment of oil and gas assets (98,041)
Plant and Equipment
Leasehold improvements Papua New Guinea Exploration and Development (1,407) 1,354
Impairment of plant and equipment (1,407)
Total impairment of non-current assets (147,515)
1. Recoverable amounts represent the carrying value of assets before deducting the carrying value of restoration liabilities ($6,853,000) and deferred royalty tax
balances ($8,004,000).
The post-tax discount rates that have been applied to the above non-current assets range between 10% and 11% (2015: between 10%
and 11%). The impairment charges noted above primarily result from the lower oil price environment, the reserves and resources update
conducted during the year, consideration of the recent valuation performed by the Independent Expert in relation to the IMC Financing
Proposal and, in some cases, a consequential reduction or deferral of future capital expenditure that diminishes or defers the path to
commercialisation.
Consolidated
2016 2015
US$ US$
Note 30. Remuneration of external auditors
During the financial year, the following fees were paid or payable for services provided by the
external auditor of the parent entity and its related practices:
1. PwC Australia
Audit and other assurance services
Audit and review of financial reports 144,082 154,228
Other assurance services 15,114 156,589
Other services - 2,419
Total remuneration for audit and other assurance services 159,196 313,236
Taxation services
Tax compliance1 24,555 111,717
Total remuneration for taxation services 24,555 111,717
2. Non-PwC audit firms
Audit and other assurance services 11,187 18,833
Other services - -
Total remuneration for audit and other assurance services 11,187 18,833
Total auditors’ remuneration 194,938 443,786
1. Remuneration for taxation services has been recorded on a gross basis; some of these fees were for services provided to PNG operated joint ventures.
It is the Group’s policy to employ PricewaterhouseCoopers on assignments additional to its statutory external audit duties where
PricewaterhouseCoopers’ expertise and experience with the Group are important. It is the Group’s policy to seek competitive tenders for all
major consulting projects.
Notes to the financial statements For the financial year ended 30 June 2016F
or p
erso
nal u
se o
nly

Horizon Oil Annual Report 2016 87
Note 31. Remuneration of key management personnelSee the Remuneration Report within the Directors’ Report for details of directors and other key management and their detailed remuneration.
Key management personnel compensation
Consolidated
2016 2015
US$ US$
Short-term employee benefits 2,036,084 2,304,601
Post-employment benefits 119,635 137,571
Long-term benefits 57,635 (6,897)
Share-based payments (non-cash) 951,088 983,416
Total key management personnel remuneration 3,164,442 3,418,691
Detailed remuneration disclosures are provided in sections A-D of the audited Remuneration Report.
Loans to key management personnelThere were no loans to directors or other key management personnel during the current or prior financial year.
Other transactions with key management personnelThere were no other transactions with key management personnel during the current or prior financial year.
Note 32. Related partiesTransactions between related parties are on normal commercial terms and conditions no more favourable than those available to other
parties, unless otherwise stated.
Directors and other key management personnelThere were no related party transactions with directors and other key management personnel during the current or prior year other than as
disclosed in sections A – D of the Remuneration report and Note 31.
SubsidiariesInterests in subsidiaries are set out in Note 27.
Details in respect of guarantees provided to subsidiaries are set out in Note 42 (ii).
Transactions with related partiesTransactions between Horizon Oil Limited and related parties in the wholly-owned Group during the financial years ended 30 June 2016 and
30 June 2015 consisted of:
(a) Contributions to share capital by Horizon Oil Limited;
(b) Loans advanced by Horizon Oil Limited;
(c) Loans repaid to Horizon Oil Limited;
(d) Payments to Horizon Oil Limited under financial guarantee contract arrangements;
(e) Interest payments to Horizon Oil Limited on loans advanced to subsidiaries;
(f ) Dividends paid to Horizon Oil Limited;
(g) Reimbursement of expenses to Horizon Oil Limited; and
(h) Uncalled share capital.
The reimbursement of expenses to Horizon Oil Limited by subsidiaries is based on costs recharged on a relevant time allocation of
consultants and employees and associated office charges.
Notes to the financial statements For the financial year ended 30 June 2016F
or p
erso
nal u
se o
nly
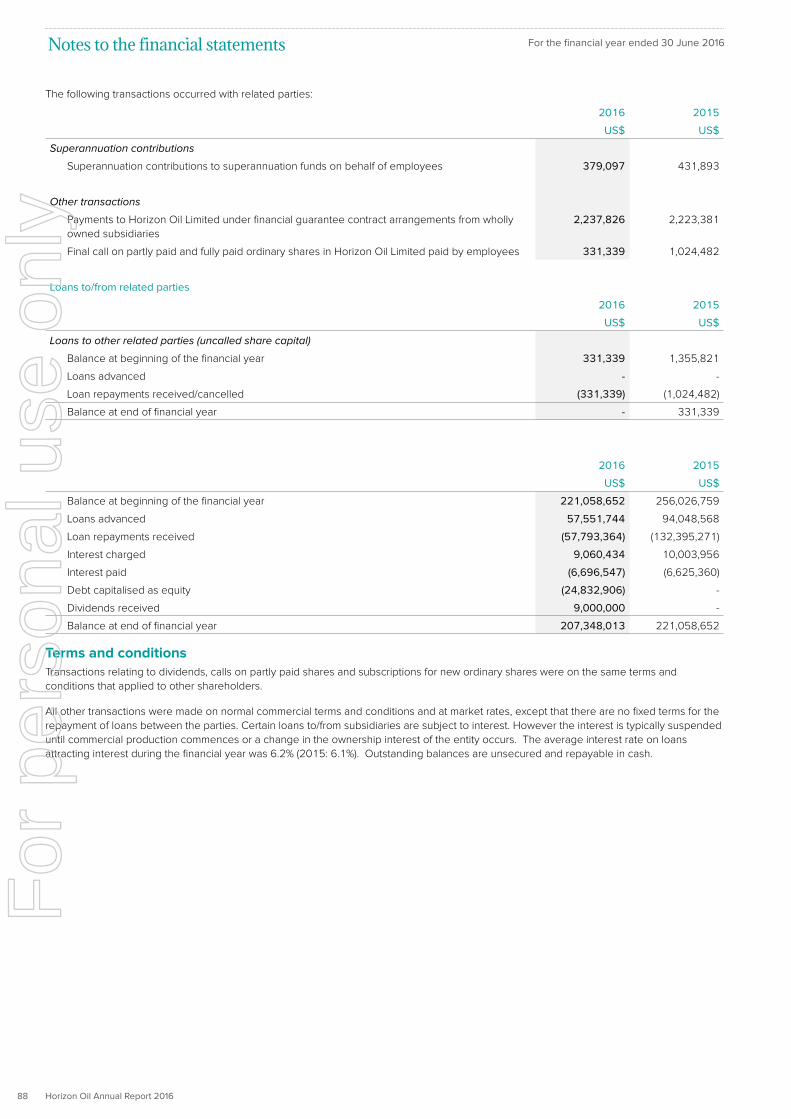
Horizon Oil Annual Report 201688
The following transactions occurred with related parties:
2016 2015
US$ US$
Superannuation contributions
Superannuation contributions to superannuation funds on behalf of employees 379,097 431,893
Other transactions
Payments to Horizon Oil Limited under financial guarantee contract arrangements from wholly
owned subsidiaries
2,237,826 2,223,381
Final call on partly paid and fully paid ordinary shares in Horizon Oil Limited paid by employees 331,339 1,024,482
Loans to/from related parties
2016 2015
US$ US$
Loans to other related parties (uncalled share capital)
Balance at beginning of the financial year 331,339 1,355,821
Loans advanced - -
Loan repayments received/cancelled (331,339) (1,024,482)
Balance at end of financial year - 331,339
2016 2015
US$ US$
Balance at beginning of the financial year 221,058,652 256,026,759
Loans advanced 57,551,744 94,048,568
Loan repayments received (57,793,364) (132,395,271)
Interest charged 9,060,434 10,003,956
Interest paid (6,696,547) (6,625,360)
Debt capitalised as equity (24,832,906) -
Dividends received 9,000,000 -
Balance at end of financial year 207,348,013 221,058,652
Terms and conditionsTransactions relating to dividends, calls on partly paid shares and subscriptions for new ordinary shares were on the same terms and
conditions that applied to other shareholders.
All other transactions were made on normal commercial terms and conditions and at market rates, except that there are no fixed terms for the
repayment of loans between the parties. Certain loans to/from subsidiaries are subject to interest. However the interest is typically suspended
until commercial production commences or a change in the ownership interest of the entity occurs. The average interest rate on loans
attracting interest during the financial year was 6.2% (2015: 6.1%). Outstanding balances are unsecured and repayable in cash.
Notes to the financial statements For the financial year ended 30 June 2016F
or p
erso
nal u
se o
nly

Horizon Oil Annual Report 2016 89
Note 33. Share-based paymentsSet out below is a summary of unlisted options and share appreciation rights on issue:
Grant date Expiry date Exercise price
Balance start of financial
year
Granted during
financial year
Exercised during
financial year
Forfeited during
financial year
Balance end of financial
year
Vested and exercisable
at end of financial year
Number Number Number Number Number Number
Consolidated Entity 2016
Share Appreciation Rights issued
27/10/2010 27/10/2015 A$0.303 6,693,828 - - (6,693,828) - -
05/08/2011 05/11/2016 A$0.313 6,478,276 - - - 6,478,276 6,478,276
13/08/2012 13/08/2017 A$0.273 9,561,936 - - - 9,561,936 -
19/08/2013 19/08/2018 A$0.333 8,547,599 - - - 8,547,599 -
01/07/2014 01/07/2019 A$0.373 7,402,177 - - - 7,402,177 -
01/07/2015 01/07/2020 A$0.093 - 25,088,617 - - 25,088,617
Total 38,683,816 25,088,617 - (6,693,828) 57,078,605 6,478,276
Weighted average exercise price A$0.32 A$0.09 - - A$0.22 A$0.31
Options issued
16/09/2010 16/09/2015 A$0.302 350,000 - - (350,000) - -
28/05/2012 28/08/2015 A$0.261 1,000,000 - - (1,000,000) - -
28/05/2012 28/05/2017 A$0.262 1,666,667 - - - 1,666,667 1,666,667
17/09/2012 17/09/2017 A$0.292 500,000 - - - 500,000 500,000
20/02/2013 20/02/2018 A$0.432 350,000 - - - 350,000 -
16/04/2013 16/04/2018 A$0.402 350,000 - - - 350,000 -
02/11/2015 02/11/2020 A$0.202 - 1,500,000 - - 1,500,000 -
Total 4,216,667 1,500,000 - (1,350,000) 4,366,667 2,166,667
Weighted average exercise price A$0.30 A$0.20 - - A$0.27 A$0.27
1. Relates to general options issued to third party consultants.
2. Relates to options issued under the Employee Option Scheme.
3. No price is payable by a participant in the Long Term Incentive Plan on the exercise of a SAR.
4. The exercise price of the options and SARS outstanding at 31 July 2013 were reduced by A$0.006 following the rights issue during the year.
Notes to the financial statements For the financial year ended 30 June 2016F
or p
erso
nal u
se o
nly
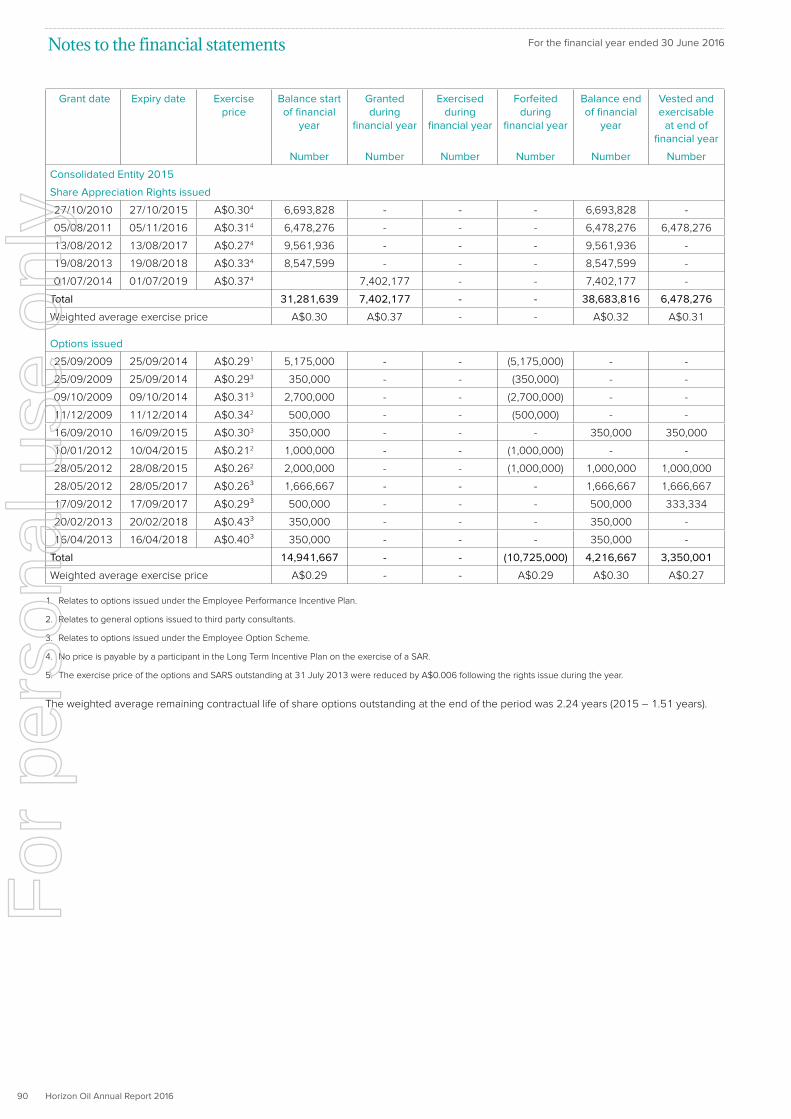
Horizon Oil Annual Report 201690
Grant date Expiry date Exercise price
Balance start of financial
year
Granted during
financial year
Exercised during
financial year
Forfeited during
financial year
Balance end of financial
year
Vested and exercisable
at end of financial year
Number Number Number Number Number Number
Consolidated Entity 2015
Share Appreciation Rights issued
27/10/2010 27/10/2015 A$0.304 6,693,828 - - - 6,693,828 -
05/08/2011 05/11/2016 A$0.314 6,478,276 - - - 6,478,276 6,478,276
13/08/2012 13/08/2017 A$0.274 9,561,936 - - - 9,561,936 -
19/08/2013 19/08/2018 A$0.334 8,547,599 - - - 8,547,599 -
01/07/2014 01/07/2019 A$0.374 7,402,177 - - 7,402,177 -
Total 31,281,639 7,402,177 - - 38,683,816 6,478,276
Weighted average exercise price A$0.30 A$0.37 - - A$0.32 A$0.31
Options issued
25/09/2009 25/09/2014 A$0.291 5,175,000 - - (5,175,000) - -
25/09/2009 25/09/2014 A$0.293 350,000 - - (350,000) - -
09/10/2009 09/10/2014 A$0.313 2,700,000 - - (2,700,000) - -
11/12/2009 11/12/2014 A$0.342 500,000 - - (500,000) - -
16/09/2010 16/09/2015 A$0.303 350,000 - - - 350,000 350,000
10/01/2012 10/04/2015 A$0.212 1,000,000 - - (1,000,000) - -
28/05/2012 28/08/2015 A$0.262 2,000,000 - - (1,000,000) 1,000,000 1,000,000
28/05/2012 28/05/2017 A$0.26³ 1,666,667 - - - 1,666,667 1,666,667
17/09/2012 17/09/2017 A$0.29³ 500,000 - - - 500,000 333,334
20/02/2013 20/02/2018 A$0.43³ 350,000 - - - 350,000 -
16/04/2013 16/04/2018 A$0.40³ 350,000 - - - 350,000 -
Total 14,941,667 - - (10,725,000) 4,216,667 3,350,001
Weighted average exercise price A$0.29 - - A$0.29 A$0.30 A$0.27
1. Relates to options issued under the Employee Performance Incentive Plan.
2. Relates to general options issued to third party consultants.
3. Relates to options issued under the Employee Option Scheme.
4. No price is payable by a participant in the Long Term Incentive Plan on the exercise of a SAR.
5. The exercise price of the options and SARS outstanding at 31 July 2013 were reduced by A$0.006 following the rights issue during the year.
The weighted average remaining contractual life of share options outstanding at the end of the period was 2.24 years (2015 – 1.51 years).
Notes to the financial statements For the financial year ended 30 June 2016F
or p
erso
nal u
se o
nly

Horizon Oil Annual Report 2016 91
Long Term Incentive PlanUntil April 2010, long-term incentives were provided to certain
employees via the Company’s share option plans. The revised LTI
arrangements approved at the 2010 annual general meeting apply to
senior executives and involve the grant of share appreciation rights
which may vest subject (amongst other things) to the level of total
shareholder return (‘TSR’) achieved in the vesting period, relative to
an appropriate index.
Under the LTI Plan, the board has the discretion, subject to the ASX
Listing Rule requirements, to grant share appreciation rights (’SARs’)
to executives as long-term incentives. The board has determined
that 25% of senior executive’s total remuneration would be long-term
incentives in the form of SARs, with the number of SARs granted
based on the value of a SAR.
A SAR is a right to receive either or both a cash payment or shares in
the Company, as determined by the board, subject to the Company
satisfying certain conditions, including performance conditions.
The LTI Plan provides that the amount of the cash payment or the
number of shares in the Company that the participant receives on
exercise of the SAR is based on the value of the SAR at the time it is
exercised (’SAR Value’). The SAR Value is the excess, if any, of the
volume weighted average price (’VWAP’) of shares in the Company
for the ten business day period up to the date before the date the
SAR is exercised over the VWAP of shares in the Company for the
ten business day period up to the day before the “Effective Allocation
Date” for the SARs. The Effective Allocation Date for the SARs is the
grant date of the SARs or any other day determined by the board, at
the time of the grant. The Effective Allocation Date would generally
be the date the executive’s entitlement was determined.
If the board determines that the SARs are to be satisfied in cash, the
amount of cash that the participant receives on the exercise of the
SARs is the SAR Value multiplied by the number of SARs exercised
(less any deduction for taxes that the Company is required to make
from the payment). If the board determines that the SARs are to
be satisfied in shares, the number of shares that the participant
receives on the exercise of the SARs is the SAR Value divided by the
volume weighted average price of shares in the Company for the
ten business day period up to the day before the day the SARs are
exercised. Where the number of shares calculated is not a whole
number, it will be rounded down to the nearest whole number.
No price is payable by a participant in the Long Term Incentive Plan
on the exercise of a SAR.
Notes to the financial statements For the financial year ended 30 June 2016
Employee Option SchemeThe issue of securities under the Employee Option Scheme was
approved by shareholders for the purposes of the ASX Listing
Rules at the 2011 Annual General Meeting. The scheme is open
to permanent full time or part time employees of the Company.
Executive directors and the Company’s senior executives were
eligible to participate until April 2010, when the board resolved to
modify the remuneration arrangements for the Company’s senior
executives.
The maximum number of ordinary shares in respect of which options
may be issued pursuant to the Employee Option Scheme, together
with the number of partly paid ordinary shares on issue pursuant to
any other employee share scheme of the Company, must not exceed
5% of the number of ordinary shares in the Company on issue from
time to time.
Each option entitles the employee to subscribe for one share in
the Company and each option expires 5 years from the date of
issue. Options granted are progressively exercisable in three equal
tranches from dates which are 12, 24 and 36 months after grant date.
Upon exercise of the option, only one cent of the exercise price
will be payable, with the balance being paid at the expiration of the
period which is 5 years from the date of the issue of the options.
The exercise price will be the greater of:
(a) the price determined by directors but will not be less than the
weighted average sale price per share of all sale prices at which
fully paid ordinary shares are sold on the ASX during the period of
5 business days ending on the business day prior to the date of
the directors’ meeting at which the directors resolved to grant the
option; and
(b) 20 cents per option.
The option exercise prices are subject to adjustment in certain
circumstances in line with the ASX Listing Rule 6.22.2.
Options/Share Appreciation Rights Issued25,088,617 share appreciation rights were issued under the Long
Term Incentive Plan. The exercise price of these SARs is A$0.0865
with performance hurdles to be achieved prior to exercise. The
independently assessed fair value at grant date of these share
appreciation rights was A$0.0438 per SAR.
The fair value at grant date is independently determined using a
Monte Carlo Simulation method that takes into account the exercise
price, the term of the option/SAR, the impact of dilution, the share
price at grant date and expected volatility of the underlying share, the
expected dividend yield and the risk free interest rate for the term of
the option/SAR.
For
per
sona
l use
onl
y

Horizon Oil Annual Report 201692
The model inputs for the grant of share appreciation rights during the financial year ended 30 June 2016 included:
Grant date 1 July 2015
Expiry date 1 July 2020
Exercise price N/A
10 Day VWAP of Horizon Oil shares at grant date A$0.0865
Expected price volatility 57.10% p.a.
Risk free rate 2.32% p.a.
Expected dividend yield 0.00% p.a.
No options were issued during the year.
Expenses arising from share-based payment transactionsTotal expenses arising from share-based payment transactions recognised during the financial year as part of employee benefits expense in
profit or loss were as follows:
Consolidated
2016 2015
US$’000 US$’000
Share Appreciation Rights issued under:
Long Term Incentive Plan 951 1,034
Options issued under:
Employee Option Scheme 28 16
Total employee share-based payments expense 979 1,050
Options/SARs in respect of which expiry dates were modified during the financial yearNo options/SARs were modified during the financial year.
Options/SARs exercised during the financial yearNo options/SARs were exercised during the financial year.
Options/SARs lapsing or cancelled during the financial yearDuring the financial year, 1,350,000 unlisted general options lapsed or were cancelled.
During the financial year, 6,693,828 SARs lapsed or were cancelled.
Options/SARs exercised and options/SARs issued subsequent to 30 June 2016No options or SARS have been granted subsequent to financial year end.
No options or SARs have been exercised subsequent to financial year end.
Consolidated
2016 2015
US$’000 US$’000
Note 34. Employee entitlements
Employee entitlement liabilities are included within:
Current – other creditors (Note 17) 771 667
Non-current - other creditors 23 15
Number
2016 2015
Employee numbers
Average number of employees during financial year 39 30
Notes to the financial statements For the financial year ended 30 June 2016F
or p
erso
nal u
se o
nly

Horizon Oil Annual Report 2016 93
Note 35. Contingent asset(i) On 23 May 2013, the Group advised ASX that it had entered into an Agreement to sell 40% of its Papua New Guinea assets to Osaka Gas
Niugini Pty Ltd (‘Osaka Gas’), a subsidiary of Osaka Gas Co. Ltd. of Japan. In addition to the cash on completion, a further US$130 million
in cash is due upon a project development decision which gives rise to Osaka Gas achieving equity LNG from its acquired gas volumes,
plus potential production payments where threshold condensate production is exceeded. Due to the conditions required for the deferred
consideration of US$130 million, and the potential production payments, all remaining consideration under the Agreement is disclosed as
a contingent asset as at 30 June 2016.
(ii) The Maari joint venture carried out an upgrade of the FPSO Raroa’s mooring system during the year. The upgrade, maintenance and repair
works were carried out safely, within budget and the the Group anticipates that a significant portion of these works will be recovered from
insurance. The field returned to production on schedule. The Group’s share of the repair costs was approximately US$4 million.
Note 36. Contingent liabilitiesThe Group had contingent liabilities as at 30 June 2016 and 30 June 2015 that may become payable in respect of:
In accordance with normal oil and gas industry practice, the Group has entered into joint operations and farm-out agreements with other
parties for the purpose of exploring and developing its petroleum interests. If a participant to a joint operation defaults and fails to contribute
its share of joint operation obligations, then the remaining joint operation participants are jointly and severally liable to meet the obligations
of the defaulting participant. In this event, the interest in the permit or licence held by the defaulting participant may be redistributed to the
remaining participants. In the event of a default, a contingent liability exists in respect of expenditure commitments due to be met by the
Group in respect of defaulting joint operation participants.
The Group occasionally receives claims arising from its operations in the normal course of business. In the opinion of the directors, all such
matters are either covered by insurance or, if not covered, are without merit or are of such a nature the amounts involved would not have a
material impact on the results.
No material losses are anticipated in respect of any of the above contingent liabilities.
Note 37. Events after balance sheet dateOther than the matters disclosed in this report, there has not been any matter or circumstance which has arisen since 30 June 2016 that has
significantly affected, or may significantly affect:
• the Group’s operations in future financial years; or
• the results of those operations in future financial years; or
• the Group’s state of affairs in future financial years.
The financial statements were authorised for issue by the Board of Directors on 30 August 2016. The Board of Directors has the power to
amend and reissue the financial statements.
Note 38. Commitments for expenditure
(i) Non-cancellable operating leases
The Group leases an office premises in Sydney under a non-cancellable operating lease expiring within 1 to 5 years.
Consolidated
2016 2015
US$’000 US$’000
Commitments for minimum lease payments in relation to non-cancellable operating leases, not
recognised in the financial statements, are payable as follows:
Within one financial year 407 277
Later than one financial year but not later than five financial years 788 75
1,195 352
(ii) Finance leases
The Group had no outstanding finance leases as at 30 June 2016 or 30 June 2015.
Notes to the financial statements For the financial year ended 30 June 2016F
or p
erso
nal u
se o
nly

Horizon Oil Annual Report 201694
Note 39. Exploration and development commitmentsThe Group has entered into joint operations for the purpose of exploring, developing and producing from certain petroleum interests. To
maintain existing interests or rights to earn interests in those joint operations the Group will be expected to make contributions to ongoing
exploration and development programs. Since such programs are subject to continual review by operating committees, upon which the
Group is represented, the extent of future contributions in accordance with these arrangements is subject to continual renegotiation.
Subject to the above mentioned limitations, the directors have prepared the following disclosure of exploration and development expenditure
commitments not recognised in the consolidated financial statements. These are payable as follows, based on current status and knowledge
of estimated quantum and timing of such commitments by segment.
2016 New Zealand Development
New Zealand Exploration1
China Exploration & Development
Papua New Guinea Exploration & Development
Total
US$’000 US$’000 US$’000 US$’000 US$’000
Within one financial year 5,183 16 836 5,036 11,071
Later than one financial year but
not later than 5 financial years
- - - 6,084 6,084
After 5 financial years - - - 6,006 6,006
Total 5,183 16 836 17,126 23,161
2015 New Zealand Development
New Zealand Exploration1
China Exploration & Development
Papua New Guinea Exploration & Development
Total
US$’000 US$’000 US$’000 US$’000 US$’000
Within one financial year 6,525 280 12,195 10,550 29,550
Later than one financial year but
not later than 5 financial years
- - - - -
Total 6,525 280 12,195 10,550 29,550
1. The joint venture participants have elected to withdraw from the permit, with completion of withdrawal anticipated in Q3 2016. Horizon Oil are committed to meeting
all budgeted work obligations until formal withdrawal has occurred.
The above commitments may be deferred or modified with the agreement of the host government, by variations to the terms of individual
petroleum interests, or extensions to the terms thereof. Another factor likely to delay timing of these commitments is the potential lack of
availability of suitable drilling rigs in the area of interest.
The commitments may also be reduced by the Group entering into farm-out agreements or working interest trades, both of which are typical
of the normal operating activities of the Group.
In addition to the above commitments, the Group has invested funds in other petroleum exploration interests, but is not exposed to a
contingent liability in respect of these, as it may choose to exit such interests at any time at no cost penalty other than the loss of the interests.
Notes to the financial statements For the financial year ended 30 June 2016F
or p
erso
nal u
se o
nly

Horizon Oil Annual Report 2016 95
Note 40. Reconciliation of profit/(loss) after income tax to net cash flows from operating activities
Consolidated
2016 2015
US$’000 US$’000
Profit/(loss) for financial year (144,525) 18,307
Exploration and development expenditure written off/expensed 1,110 16,222
Impairment expense 147,515 -
Depreciation expense 690 683
Disposal of fixed assets 127 -
Movement in employee entitlement liabilities 112 114
Non-cash employee share-based payments expense 979 1,050
Amortisation expense 36,400 37,096
Amortisation of prepaid financing costs 1,817 1,775
Provision for restoration 258 416
Unrealised movement in value of convertible bond conversion rights (5,322) -
Realised gain on purchase of bonds (1,193) (9,063)
Non-cash convertible bond interest expense 5,600 6,257
Net unrealised foreign currency losses/(gains) 1,056 40
Change in operating assets and liabilities:
(Increase)/Decrease in trade debtors (317) 5,012
(Increase)/Decrease in other debtors and prepayments 8,245 (8,561)
(Increase)/Decrease in inventory 817 (1,181)
Increase/(Decrease) in net deferred tax liabilities (8,772) 3,443
(Increase)/Decrease in tax receivable/payable 1,294 (3,416)
Increase/(Decrease) in trade creditors 381 (11,006)
Increase/(Decrease) in deferred income (2,212) 2,212
Increase/(Decrease) in other creditors 143 (557)
Net cash inflow from operating activities 44,203 58,843
2016 US cents
2015 US cents
Note 41. Earnings per share(a) Basic earnings per shareFrom continuing operations attributable to the ordinary equity holders of the Company (11.08) 1.41
Total basic earnings per share attributable to the ordinary equity holders of the Company (11.08) 1.41
(b) Diluted earnings per shareFrom continuing operations attributable to the ordinary equity holders of the Company (11.08) 1.41
Total diluted earnings per share attributable to the ordinary equity holders of the Company (11.08) 1.41
Notes to the financial statements For the financial year ended 30 June 2016F
or p
erso
nal u
se o
nly

Horizon Oil Annual Report 201696
2016 2015
Number Number
Weighted average number of shares used as the denominator
Weighted average number of ordinary shares used as the denominator in calculating basic earnings
per share
1,303,481,265 1,303,481,265
Weighted average number of ordinary shares and potential ordinary shares used as the denominator
in calculating diluted earnings per share
1,303,481,265 1,304,795,974
2016 2015
US$’000 US$’000
Reconciliation of earnings used in calculating earnings per share
Profit/(loss) attributable to the ordinary equity holders of the company used in calculating earnings
per share
Basic earnings per ordinary share:
from continuing operations (144,471) 18,333
(144,471) 18,333
Diluted earnings per ordinary share:
from continuing operations (144,471) 18,333
(144,471) 18,333
Information concerning the classification of securities
(a) Partly paid ordinary shares
Partly paid ordinary shares carry the rights of fully paid ordinary shares and to that extent they have been recognised as ordinary share
equivalents in the determination of basic earnings per share.
Details regarding the partly paid ordinary shares are set out in Note 24.
(b) Options and share appreciation rights granted as compensation
Options and share appreciation rights granted to employees under the Long Term Incentive Plan, Employee Option Scheme or Employee
Performance Incentive Plan; and general options issued, are included in the calculation of diluted earnings per share to the extent to which
they are dilutive. They have not been included in the determination of basic earnings per share.
Details regarding the options and share appreciation rights are set out in Note 33.
(c) Convertible bonds
Convertible bonds issued during the financial year are included in the calculation of diluted earnings per share to the extent to which they are
dilutive from their date of issue. They have not been included in the determination of basic earnings per share.
Details regarding the convertible bonds are set out in Note 20 and 21.
Notes to the financial statements For the financial year ended 30 June 2016F
or p
erso
nal u
se o
nly

Horizon Oil Annual Report 2016 97
Note 42. Parent entity financial information
(i) Summary financial informationThe individual financial statements for the Parent Entity show the following aggregate amounts:
Parent Entity
2016 2015
US$’000 US$’000
Statement of financial position
Current assets 7,860 32,007
Non-current assets 256,687 250,235
Total assets 264,547 282,242
Current liabilities 61,618 89,024
Non-current liabilities 274 266
Total liabilities 61,892 89,290
Net assets 202,655 192,952
Contributed equity 174,801 174,801
Share-based payments reserve 12,030 11,052
Retained earnings 15,824 7,099
Total equity 202,655 192,952
Profit/(loss) for the financial year 8,725 21,381
Total comprehensive income/(loss) for the financial year 8,725 21,381
(ii) Guarantees entered into by the parent entityThe parent entity has provided guarantees in respect of bank loans and leases of its subsidiaries amounting to US$89,141,000 (2015:
US$120,000,000).
No liability has been recognised for guarantees provided. After factoring in the likelihood that the parent entity would be required to perform
under the guarantees the fair value of the liability was not considered material.
(iii) Contingent liabilities of the parent entityThe parent entity did not have any contingent liabilities as at 30 June 2016 or 30 June 2015. For information about guarantees given by the
parent entity, please see above.
(iv) Contractual commitment for the acquisition of property, plant or equipmentAs at 30 June 2016, the parent entity had no contractual commitments for the acquisition of property, plant or equipment (30 June 2015 –
US$Nil).
Notes to the financial statements For the financial year ended 30 June 2016F
or p
erso
nal u
se o
nly
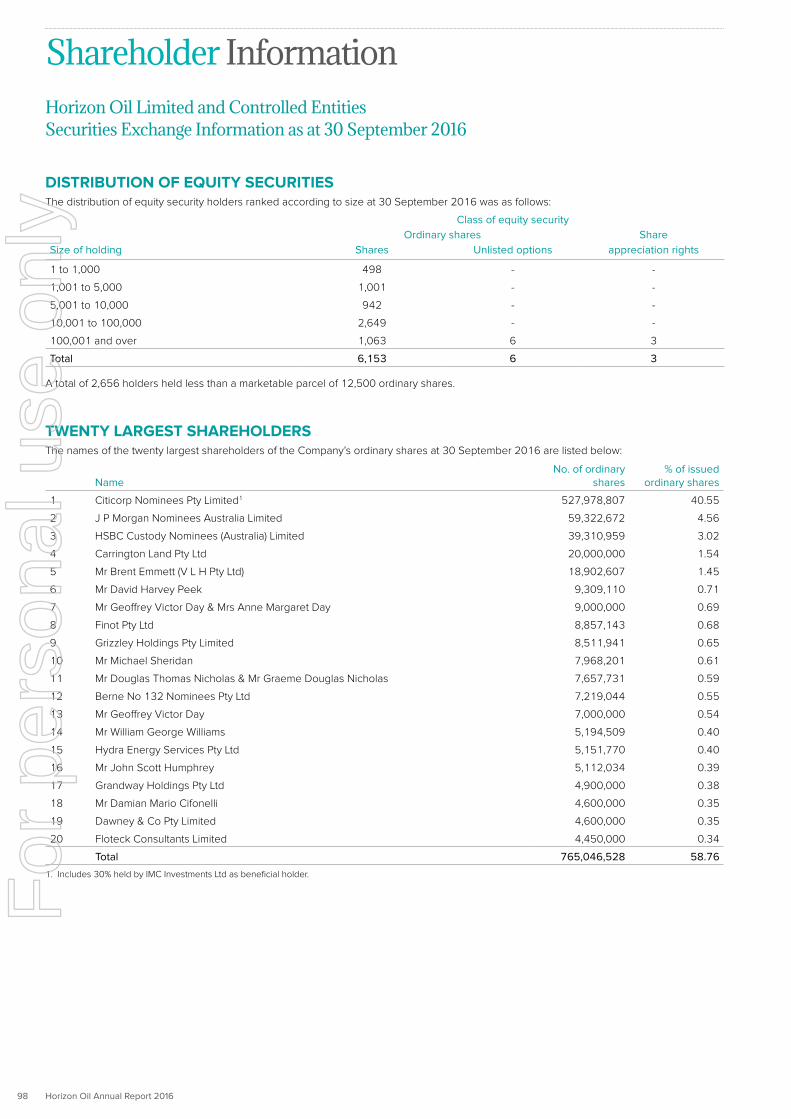
Horizon Oil Annual Report 201698
Horizon Oil Limited and Controlled EntitiesSecurities Exchange Information as at 30 September 2016
DISTRIBUTION OF EQUITY SECURITIESThe distribution of equity security holders ranked according to size at 30 September 2016 was as follows:
Class of equity securityOrdinary shares Share
Size of holding Shares Unlisted options appreciation rights
1 to 1,000 498 - -
1,001 to 5,000 1,001 - -
5,001 to 10,000 942 - -
10,001 to 100,000 2,649 - -
100,001 and over 1,063 6 3
Total 6,153 6 3
A total of 2,656 holders held less than a marketable parcel of 12,500 ordinary shares.
TWENTY LARGEST SHAREHOLDERSThe names of the twenty largest shareholders of the Company’s ordinary shares at 30 September 2016 are listed below:
Name
No. of ordinary shares
% of issued ordinary shares
1 Citicorp Nominees Pty Limited1 527,978,807 40.55
2 J P Morgan Nominees Australia Limited 59,322,672 4.56
3 HSBC Custody Nominees (Australia) Limited 39,310,959 3.02
4 Carrington Land Pty Ltd 20,000,000 1.54
5 Mr Brent Emmett (V L H Pty Ltd) 18,902,607 1.45
6 Mr David Harvey Peek 9,309,110 0.71
7 Mr Geoffrey Victor Day & Mrs Anne Margaret Day 9,000,000 0.69
8 Finot Pty Ltd 8,857,143 0.68
9 Grizzley Holdings Pty Limited 8,511,941 0.65
10 Mr Michael Sheridan 7,968,201 0.61
11 Mr Douglas Thomas Nicholas & Mr Graeme Douglas Nicholas 7,657,731 0.59
12 Berne No 132 Nominees Pty Ltd 7,219,044 0.55
13 Mr Geoffrey Victor Day 7,000,000 0.54
14 Mr William George Williams 5,194,509 0.40
15 Hydra Energy Services Pty Ltd 5,151,770 0.40
16 Mr John Scott Humphrey 5,112,034 0.39
17 Grandway Holdings Pty Ltd 4,900,000 0.38
18 Mr Damian Mario Cifonelli 4,600,000 0.35
19 Dawney & Co Pty Limited 4,600,000 0.35
20 Floteck Consultants Limited 4,450,000 0.34
Total 765,046,528 58.76 1. Includes 30% held by IMC Investments Ltd as beneficial holder.
Shareholder InformationF
or p
erso
nal u
se o
nly

Horizon Oil Annual Report 2016 99
ISSUED SECURITIESIssued securities as at 30 September 2016:
Security Number on issue
Number of holders
Ordinary fully paid shares1 1,301,981,265 6,153
Ordinary partly paid shares1 1,500,000 1
Unlisted general options2 300,000,000 1
Unlisted employee options 3,866,667 5
Unlisted share appreciation rights 57,078,605 3
1. The Company’s ordinary fully paid shares are listed on the Australian Securities Exchange. Partly paid ordinary shares have been forfeited and are held in
trust by the Company.
2. The Company issued 300 million warrants over unissued shares of the Company in accordance with the terms of the subordinated debt facility with IMC Investments
Limited signed on 15 September 2016.
SUBSTANTIAL HOLDERS
Substantial holders in the Company are set out below:
Ordinary shares
No. of ordinary shares
% of issued ordinary shares
IMC Investments Ltd (an associate of Austral-Asia Energy Pty Ltd) 390,574,175 30.00
Commonwealth Bank of Australia 101,312,290 7.78
Total 491,886,465 37.78
VOTING RIGHTS
a) Ordinary shares – fully paidVoting of members is governed by the Company’s Constitution. In summary, every member present in person or by proxy attorney or
representative shall have one vote on a show of hands and one vote for each share on a poll.
b) Ordinary shares – partly paidVoting of members is governed by the Company’s Constitution. In summary, every member present in person or by proxy attorney or
representative shall have one vote on a show of hands and upon a poll, is entitled to one vote to the proportion of the total issue price then
paid up.
c) Options (employee/general) - unlistedNo voting rights.
d) Share appreciation rights - unlistedNo voting rights.
Shareholder InformationF
or p
erso
nal u
se o
nly
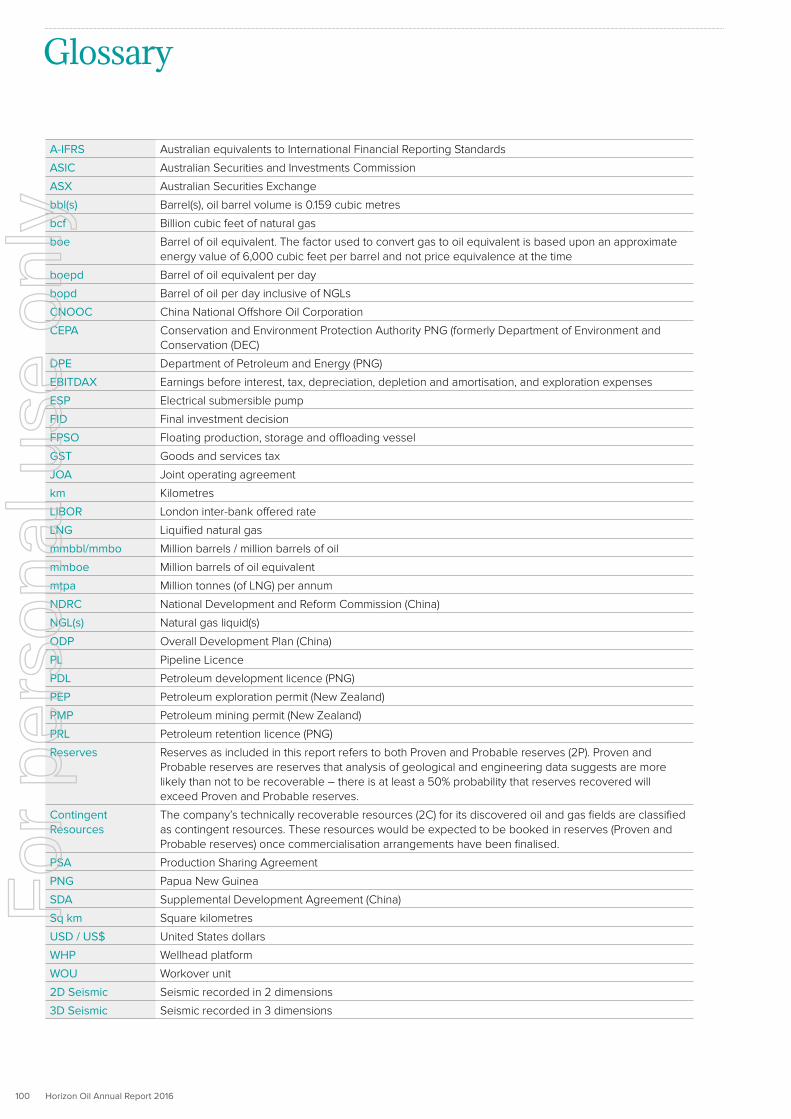
Horizon Oil Annual Report 2016100
Glossary
A-IFRS Australian equivalents to International Financial Reporting Standards
ASIC Australian Securities and Investments Commission
ASX Australian Securities Exchange
bbl(s) Barrel(s), oil barrel volume is 0.159 cubic metres
bcf Billion cubic feet of natural gas
boe Barrel of oil equivalent. The factor used to convert gas to oil equivalent is based upon an approximate energy value of 6,000 cubic feet per barrel and not price equivalence at the time
boepd Barrel of oil equivalent per day
bopd Barrel of oil per day inclusive of NGLs
CNOOC China National Offshore Oil Corporation
CEPA Conservation and Environment Protection Authority PNG (formerly Department of Environment and Conservation (DEC)
DPE Department of Petroleum and Energy (PNG)
EBITDAX Earnings before interest, tax, depreciation, depletion and amortisation, and exploration expenses
ESP Electrical submersible pump
FID Final investment decision
FPSO Floating production, storage and offloading vessel
GST Goods and services tax
JOA Joint operating agreement
km Kilometres
LIBOR London inter-bank offered rate
LNG Liquified natural gas
mmbbl/mmbo Million barrels / million barrels of oil
mmboe Million barrels of oil equivalent
mtpa Million tonnes (of LNG) per annum
NDRC National Development and Reform Commission (China)
NGL(s) Natural gas liquid(s)
ODP Overall Development Plan (China)
PL Pipeline Licence
PDL Petroleum development licence (PNG)
PEP Petroleum exploration permit (New Zealand)
PMP Petroleum mining permit (New Zealand)
PRL Petroleum retention licence (PNG)
Reserves Reserves as included in this report refers to both Proven and Probable reserves (2P). Proven and Probable reserves are reserves that analysis of geological and engineering data suggests are more likely than not to be recoverable – there is at least a 50% probability that reserves recovered will exceed Proven and Probable reserves.
Contingent Resources
The company’s technically recoverable resources (2C) for its discovered oil and gas fields are classified as contingent resources. These resources would be expected to be booked in reserves (Proven and Probable reserves) once commercialisation arrangements have been finalised.
PSA Production Sharing Agreement
PNG Papua New Guinea
SDA Supplemental Development Agreement (China)
Sq km Square kilometres
USD / US$ United States dollars
WHP Wellhead platform
WOU Workover unit
2D Seismic Seismic recorded in 2 dimensions
3D Seismic Seismic recorded in 3 dimensions
For
per
sona
l use
onl
y

Horizon Oil Annual Report 2016 101
Directory
Horizon Oil Limited ABN 51 009 799 455
Board of Directors John Humphrey (Chairman) Brent Emmett (Chief Executive Officer) Gerrit de Nys Andrew Stock Sandra Birkensleigh
Company Secretary Michael Sheridan
Assistant Company Secretary Monika Fedorczyk
Australian Registered Office
(Principal place of business)
Level 6, 134 William Street, Woolloomooloo NSW 2011
Telephone: +(612) 9332 5000 Facsimile: +(612) 9332 5050 E-mail: [email protected] Web site: www.horizonoil.com.au
Domicile and country of incorporation
Australia
Share Registrar Boardroom Pty Limited Level 12, 225 George Street SYDNEY NSW 2000
Telephone: +(612) 9290 9600
Solicitors King & Wood Mallesons Level 33 Waterfront Place 1 Eagle Street BRISBANE QLD 4000
Auditor PricewaterhouseCoopers Darling Park Tower 2 201 Sussex Street SYDNEY NSW 1171
Stock Exchanges Horizon Oil Limited shares are listed on the ASX (ASX code: HZN)
Notice of Annual General Meeting The Annual General Meeting of Horizon Oil Limited will be held at Level 1, Grand Ballroom, The Sydney Boulevard Hotel, 90 William Street, Sydney
Time: 10.00am
Date: 29 November 2016
Company DirectoryF
or p
erso
nal u
se o
nly

Level 6, 134 William Street
Woolloomooloo NSW 2011 Australia
t +612 9332 5000 f +612 9332 5050
www.horizonoil.com.au
ABN 51 009 799 455
For
per
sona
l use
onl
y

Horizon Oil Limited ABN 51 009 799 455
NOTICE OF 2016 ANNUAL GENERAL MEETING
The Annual General Meeting (“AGM”) of the members of Horizon Oil Limited ACN 009 799 455 (the “Company”) will be held at 10.00am (Sydney time) on Tuesday, 29 November 2016 at Level 1, Grand Ballroom, The Sydney Boulevard Hotel, 90 William Street, Sydney, New South Wales, 2011 to transact the business set out below.
Members should refer to the accompanying Explanatory Memorandum for further information concerning the business to be carried out at the AGM.
Business
1. Consideration of reports
To receive and consider the Annual Financial Statements, the Directors’ Report and the Independent Audit Report of the Company for the year ended 30 June 2016.
Note: There is no requirement for members to vote on this item of business.
2. Remuneration Report
To consider and, if thought appropriate, to pass the following as an ordinary resolution:
“That the Remuneration Report for the year ended 30 June 2016 (set out in the
Directors’ Report) be adopted.”
Note: The vote on this resolution is advisory only and does not bind the Company or the directors.
Note: A voting exclusion applies to this item – see the Explanatory Memorandum.
3. Election of director – Ms Sandra Birkensleigh
To consider and, if thought appropriate, to pass the following as an ordinary resolution:
“That Ms Sandra Birkensleigh, a non-executive director appointed as an addition to the existing directors, being eligible, is elected as a non-executive director of the Company.”
Further information in relation to this resolution and Ms Birkensleigh is set out in the Explanatory Memorandum.
4. Re-election of director – Mr Gerrit de Nys
To consider and, if thought appropriate, to pass the following as an ordinary resolution:
“That Mr Gerrit de Nys, a non-executive director retiring in accordance with the Company’s Constitution, being eligible, is re-elected as a non-executive director of the Company.”
Further information in relation to this resolution and Mr de Nys is set out in the Explanatory Memorandum.
5. Approval of 2016 grant of long term incentives (“LTIs”) to Mr Brent Emmett,
Chief Executive Officer and Managing Director
To consider and, if thought appropriate, to pass the following as an ordinary resolution:
“That approval be given for all purposes for the grant of up to 16,617,522 securities (including share appreciation rights (“SARs”) and shares which may be issued as a result of the exercise or vesting of SARs) to the Chief Executive Officer and Managing Director, Mr Brent Emmett, in accordance with the terms of his employment agreement and as set out in the accompanying Explanatory Memorandum.”
Further information in relation to this resolution is set out in the Explanatory Memorandum.
Note: A voting exclusion applies to this item – see the Explanatory Memorandum.
6. Renewal of Proportional Takeover Provisions in Company’s Constitution
To consider and, if thought appropriate, pass the following as a special resolution:
“That Article 6.2 of the Company’s Constitution be renewed for a period of three years in accordance with Part 6.5 of the Corporations Act.”
Further information in relation to this resolution is set out in the Explanatory Memorandum.
By order of the Board. Dated: 21 October 2016
.............................................................................
Michael Sheridan Company Secretary
Eligibility to attend and vote
For the purposes of the meeting and in accordance with regulation 7.11.37 of the Corporations Regulations 2001 and ASX Settlement Operating Rule 5.6.1, shares will be taken to be held by the persons who are registered as members as at 7.00pm (Sydney time) on Sunday, 27 November 2016.
Proxies
If you are a member entitled to attend and vote, you are entitled to appoint a proxy to attend and vote on your behalf. If you are a member entitled to attend and cast two or more votes, you are entitled to appoint no more than two proxies. Where two proxies are appointed, you may specify the number or proportion of votes that each may exercise, failing which, each may exercise half of the votes. A proxy need not be a member of the Company.
If you want to appoint one proxy, please use the proxy form provided. If you want to appoint two proxies, please follow the instructions on the reverse of the proxy form.
The Company’s Constitution provides that, on a show of hands, every person present and qualified to vote shall have one vote. If you appoint one proxy, that proxy may vote on a show of hands, but if you appoint two proxies, only the proxy first-mentioned in the instrument appointing the proxy may vote on a show of hands.
If you appoint a proxy who is also a member or is also a proxy for another member, your directions may not be effective on a show of hands. Your directions will be effective if a poll is required and your proxy votes.
To be effective, the proxy form must be received by Boardroom Pty Limited, by online submission or at the address or facsimile number below, or by the Company at its registered office, Level 6, 134 William Street, Woolloomooloo NSW 2011, not later than 10.00am (Sydney time) on Sunday, 27 November 2016, being 48 hours before the commencement of the meeting.
If the Chairman of the meeting is your proxy, and you fail to provide a voting direction in respect of Item 2 or Item 5 or on the proxy form (which you may do by ticking ‘For’, ‘Against’ or ‘Abstain’ opposite Item 2 or Item 5, as applicable, on the proxy form), you are expressly authorising the Chairman of the meeting to vote in favour of Item 2 or Item 5, as applicable, even if that resolution is connected directly or indirectly with the remuneration of directors or members of the key management personnel of the Company (“KMP”). Subject to any applicable laws or voting exclusions, the Chairman of the meeting intends to vote all available proxies in favour of the resolutions in this Notice of Meeting (including Item 2 and Item 5).
To vote online:
TO VOTE ONLINE
Step 1: VISIT www.votingonline.com.au/horizonoilagm2016
Step 2: Enter your Postcode OR Country of Residence (if outside Australia)Step 3: Enter your Voting Access Code:
By mail: Boardroom Pty Limited GPO Box 3993 Sydney NSW 2001 AUSTRALIA
For delivery: Boardroom Pty Limited Level 12, 225 George Street Sydney NSW 2000 AUSTRALIA
By fax: Boardroom Pty Limited +61 2 9290 9655
Admission to meeting
Members who will be attending the meeting and who will not be appointing a proxy are asked to bring the proxy form to the meeting to help with admission.
Members who do not plan to attend the meeting are encouraged to complete and return a proxy form for each of their holdings of shares in the Company.
A replacement proxy form may be obtained from the Company’s external share registry:
Boardroom Pty Limited Level 12, 225 George Street Sydney NSW 2000 Telephone: +61 2 9290 9600 or 1300 737 760 Fax: +61 2 9279 0664Email: [email protected]
For
per
sona
l use
onl
y

Horizon Oil Limited ABN 51 009 799 455
EXPLANATORY MEMORANDUM
This Explanatory Memorandum contains information about the resolutions to be considered at the 2016 AGM, which are set out in the accompanying Notice of Meeting, to assist shareholders to determine how they wish to vote on the resolutions. This Explanatory Memorandum forms part of the accompanying Notice of Meeting and should be read together with the Notice of Meeting.
Items of business
1. Consideration of reports
There is no requirement for members to approve the reports described in Item 1. In accordance with the Corporations Act 2001 (“Corporations Act”) and the Company’s usual practice, the Chairman will allow a reasonable opportunity for shareholders to ask questions or make comments about the reports and the management of the Company. A reasonable opportunity will also be given to members, as a whole, to ask the auditor, or their representative, questions relevant to the conduct of the audit, the preparation and content of the auditor’s report, the accounting policies adopted by the Company and the independence of the auditor in relation to the conduct of the audit.
Written questions to the Company’s auditor about:
> the content of the Independent Auditor Report; or
> the conduct of the audit of the Annual Financial Statement,
must be submitted no later than Tuesday 22 November 2016 to:
The Company SecretaryLevel 6 134 William Street Woolloomooloo, NSW 2011 AustraliaFacsimile: +61 2 9332 5050
Copies of the questions, if any, to the Company’s auditor will be available at or before the 2016 AGM.
2. Remuneration Report
The Remuneration Report is contained in the ‘Directors’ Report’ of the Company’s 2016 Annual Report. A copy of the 2016 Annual Report is available on the Company’s website www.horizonoil.com.au.
The Remuneration Report:
> explains the principles used by the board to determine the nature and amount of remuneration of directors and executives; and
> sets out remuneration details for each director and each named executive.
The Chairman will give shareholders a reasonable opportunity to ask questions about or make comments on the Remuneration Report. The Corporations Act requires the Company to propose a resolution that the Remuneration Report be adopted.
The vote on this item is advisory only and does not bind the Company or the directors. However, the board will take the outcome of this vote into consideration when reviewing the remuneration practices and policies of the Company.
Voting exclusion statement – Item 2
No votes may be cast on this item by or on behalf of members of the key management personnel of the Company (“KMP”) or their closely related parties.
However, a vote may be cast on Item 2 if the vote is not cast on behalf of a member of the KMP or their closely related parties and either the vote is cast:
• by a member of the KMP, or their closely related party, if the vote is cast as a proxy for a person who is entitled to vote on this item, and the proxy appointment is in writing and specifies how the proxy is to vote on Item 2; or
• by the Chairman of the meeting, if the vote is cast as a proxy appointed in writing that does not specify the way the proxy is to vote on Item 2, and expressly authorises the Chairman of the meeting to exercise the proxy even if the resolution is connected directly or indirectly with the remuneration of a member of the KMP.
If you appoint the Chairman of the meeting as your proxy, and you do not direct your proxy how to vote on Item 2, you will be expressly authorising the Chairman of the meeting to exercise your proxy even if Item 2 is connected directly or indirectly with the remuneration of a member of the KMP. The Chairman intends to vote all undirected proxies in favour of Item 2.
3. Election of director – Ms Sandra Birkensleigh
Ms Birkensleigh was appointed to the board as a director with effect from 2 February 2016.
Ms Birkensleigh has extensive experience in financial services particularly in respect to risk management, compliance and corporate governance. Ms Birkensleigh’s career includes 24 years at PricewaterhouseCoopers (PwC) where she was formerly a Global Lead for Governance Risk & Compliance; a National Lead Partner Risk and Controls Solutions and a Service Team Leader for Performance Improvement.
She is currently a non-executive director of several companies including Auswide Bank Limited, MLC Limited and Plum Financial Services Limited. She is chair of the board audit committee and a member of the board risk committee for those companies and is an independent member of the audit committee of the Reserve Bank of Australia and a member of the audit and risk committee of the University of the Sunshine Coast.
Ms Birkensleigh is also chair to the Audit Committee, member of Remuneration and Nomination Committee, Risk Management and Disclosure Committees.
The directors (with Ms Birkensleigh abstaining) recommend that you vote in favour of this ordinary resolution.
4. Re-election of director – Mr Gerrit de Nys
The Company’s Constitution provides that a director (other than the managing director) will not retain office for a period of more than three years or beyond the third annual general meeting following that person’s election (whichever is greater).
Accordingly, Mr de Nys is required to retire at the end of this AGM and seeks re-election in accordance with the requirements of the Company’s Constitution.
Mr de Nys, has been a director since 2007. He is a member of the Risk Management and Remuneration and Nomination Committees. Mr de Nys has over 44 years’ experience in civil engineering, construction, oil field contracting and natural resource investment management. He is a non-executive director of SOCAM Development Limited and IMC Pan Asia Alliance Group subsidiaries (a related party of Austral Asia Energy Pty Ltd a substantial shareholder of Horizon Oil Limited), and a former director of Red Sky Energy Limited.
The directors (with Mr de Nys abstaining) recommend that you vote in favour of this ordinary resolution.
5. Approval of 2016 grant of long term incentives (“LTIs”) to Mr Brent Emmett,
Chief Executive Officer and Managing Director
The Company introduced the LTI Plan during 2010 to provide annual performance incentives to the Company’s key employees. Members last approved the LTI Plan for the purposes of ASX Listing Rule 7.2, exception 9 at the Company’s 2013 annual general meeting.
On 21 October 2016, the board (with Mr Emmett abstaining) approved the grant of 40,989,917 share appreciation rights (“SARs”) to employees under the LTI Plan.
Of those, 16,617,522 SARs were approved by the board (with Mr Emmett abstaining) to be granted to Mr Emmett, subject to the approval of shareholders. As at the date of this Notice of Meeting, Mr Emmett’s total fixed remuneration is A$889,968. The amount of 16,617,522 SARs to be granted to Mr Emmett (subject to the resolution of this Item 5) was calculated in accordance with the LTI Plan by dividing 50% of Mr Emmett’s fixed remuneration by the present day value of the SARs as calculated by an independent valuer, Dalway Securities, on the effective allocation date for the SARS (“Effective Allocation Date”) (A$0.026778). The VWAP of shares in the Company for the 10 business day period up to the day before the Effective Allocation Date for the purposes of the 2016 SARs award is A$0.0483.
The remaining 24,372,395 SARs were approved to be granted to employees who are not directors of the Company. The proposed grant to Mr Emmett is on the terms and conditions as outlined below.
For
per
sona
l use
onl
y

EXPLANATORY MEMORANDUM
Summary of the terms of the LTI PlanIn order to provide annual performance incentives to the Company’s executives the board resolved on 1 April 2010 to establish the LTI Plan to replace previous LTI arrangements for the Company’s senior executives. The grant of LTIs in accordance with the Company’s LTI arrangements to Mr Emmett was last approved by members at the Company’s 2015 annual general meeting. The LTI arrangements apply to senior executives and involve the grant of rights which will vest subject (amongst other things) to the level of total shareholder return (“TSR”) achieved in the vesting period, relative to an appropriate index. Under the LTI Plan, the board has the discretion, subject to ASX Listing Rule requirements, to grant SARs to executives as LTIs. The board has determined that 50% of senior executives’ fixed remuneration would be LTIs in the form of SARs, with the number of SARs granted to be based on the present day value of a SAR.
A SAR is a right to receive either or both a cash payment or shares in the Company, as determined by the board, subject to the Company satisfying certain conditions, including performance conditions.
The LTI Plan provides that the amount of the cash payment or the number of shares in the Company that the participant receives on exercise of the SAR is based on the value of the SAR at the time it is exercised (“SAR Value”). The SAR Value is the excess, if any, of the volume weighted average price (“VWAP”) of shares in the Company for the ten business day period up to the date before the date the SAR is exercised over the VWAP of shares in the Company for the ten business day period up to the day before the Effective Allocation Date for the SARs. The Effective Allocation Date for the SARs is the grant date of the SARs or any other day determined by the board, at the time of the grant. The Effective Allocation Date would generally be the date the executive’s entitlement was determined.
If the board determines that the SARs are to be satisfied in cash, the amount of cash that the participant receives on the exercise of the SARs is the SAR Value multiplied by the number of SARs exercised (less any deduction for taxes that the Company is required to make from the payment).
If the board determines that the SARs are to be satisfied in shares, the number of shares that the participant receives on the exercise of the SARs is the SAR Value divided by the VWAP of shares in the Company for the ten business day period up to the day before the day the SARs are exercised. Where the number of shares calculated is not a whole number, it will be rounded down to the nearest whole number.
Other key terms and conditions of the SARs that may be granted under the LTI Plan include:
Key terms &
conditions
Long Term Incentive Plan
Eligible persons: Under the terms of the LTI Plan, the Company may grant SARs to any employee. However, it is currently intended by the Company to only grant SARs under the LTI Plan to current senior executive employees including executive directors.
Exercise price: No price is payable by a participant in the LTI Plan on the exercise of a SAR.
Performance requirements:
Under the LTI Plan, the number of SARs that vest is generally determined by reference to whether the Company achieves certain performance conditions.
The number of SARs that vest is determined by reference to the Company’s total shareholder return (“TSR”) over the relevant period relative to that of the S&P/ASX200 Energy Index (“Index”). The number of SARs that vest is:
• if the Company’s TSR is equal to that of the Index (“Minimum Benchmark”), 50%;
• if the Company’s TSR is 14% or more above that of the Index, 100% (“Maximum Benchmark”); and
• if the Company’s TSR is more than the Minimum Benchmark but less than the Maximum Benchmark, a percentage between 50% and 100% based on the Company’s TSR performance between the Minimum Benchmark and Maximum Benchmark.
The Maximum Benchmark of 14% above the Index return equates to the performance level likely to exceed the 75th percentile of market returns of companies (weighted by company size) in the Index.
Furthermore, even where these performance conditions are satisfied, the SARs will not vest unless the Company achieves a TSR of at least 10% over the relevant period.
The performance conditions are tested on the date that is three years after the Effective Allocation Date of the SARs, and are then re-tested every six months after that until the date that is five years after the Effective Allocation Date of the SARs (the final retesting date). The performance conditions are also tested where certain circumstances occur, such as a takeover bid for the Company.
If the SARs have not, pursuant to these performance conditions, vested by the final retesting date that is five years after the date the SARs are granted, the SARs will lapse.
Cessation of employment:
If a holder of SARs under the LTI Plan ceases to be employed by a member of the Company’s corporate group, then this generally does not affect the terms and operation of the SARs. The board does, however, under the LTI Plan have discretion, to the extent permitted by law, to cause the SARs to lapse or accelerate the date on which the SARs become exercisable.
Maximum number of shares that can be issued:
Subject to various exclusions, the maximum number of shares that may be issued on the exercise of SARs granted under the LTI Plan is capped at 5% of the total number of issued shares of the Company.
Restrictions on exercise:
A SAR cannot be exercised unless it has vested. Where a SAR vests, a participant may not exercise the SAR until the first time after the time the SAR vests that the participant is able to deal with shares in the Company under the Company’s securities trading policy.
SARs are exercised by submitting a notice of exercise to the Company.
For
per
sona
l use
onl
y

EXPLANATORY MEMORANDUM
Listing Rule Content requirement Item 4
LTI Plan
10.15.2 The maximum number of Company’s ordinary shares that may be acquired on exercise of the proposed grant of securities and the formula for calculating the number of securities to be issued:
The maximum number of shares that may be acquired by Mr Emmett is 16,617,522.
The number of shares that may be acquired by Mr Emmett on exercise of the SARs proposed to be granted to him, is determined at the time of exercise by reference to the SAR Value at the time the SAR is exercised and the VWAP of shares in the Company for the 10 business day period up to the day before the day the SAR is exercised (as described above).
10.15.3 Formula for calculating the price of securities to be acquired under the scheme:
Mr Emmett is not required to pay any price in order to acquire SARs under the LTI Plan. However, the value of what Mr Emmett receives if his SARs become exercisable is the SAR Value. This is based on the appreciation in the share price of the Company from the Effective Allocation Date until the date of exercise (see discussion above). The proposed Effective Allocation Date for Mr Emmett’s SARs is 1 July 2016.
10.15.4 Names of directors and associates who have received securities under the scheme since the last approval; number received; and acquisition price:
Mr Emmett was granted 10,171,063 SARs following approval at the 2015 AGM which are exercisable at A$0.0865.
10.15.4A Names of directors and associates entitled to participate in scheme: Mr Emmett.
10.15.5 Voting exclusion statement: Included – see below.
10.15.6 Terms of any loan in relation to acquisition: There are no loans in relation to the acquisition of SARs or securities issued under the LTI Plan.
10.15.7 Date on which securities will be issued: Subject to shareholder approval of the issue of the SARs, within five business days of the 2016 AGM, but in any event no later than 12 months after the date of the 2016 AGM.
Lapse: SARs will lapse where:• the SARs have not vested by the final retesting date which is five years after the date of grant (see above);• if the SARs have vested by the final retesting date that is five years after the date of grant, the SARs have not been exercised within three months of the
date that the SARs would have first been able to be exercised if they vested at the final retesting date that is five years after the date of grant. This may be more than five years and three months from the date of grant depending on whether the holder of the SAR is able to deal with shares in the Company under the Company’s securities trading policy at the date five years after the date of grant;
• the employee ceases to be employed by the Company (or a member of its corporate group), and the board determines that some or all of the SARs lapse (see above);
• the board determines that the employee has committed or it is evident that the employee intends to commit, any act (whether by commission or omission) which amounts or would amount to fraud or serious misconduct; or
• the employee provides a notice to the Company that they wish the SARs to lapse.
Share ranking and quotation:
Shares provided pursuant to the exercise of a SAR will rank equally with the shares in the Company then on issue. Quotation on the ASX will be sought for all shares issued upon the exercise of SARs. SARs are not assignable or transferable.
No right to dividends, bonus or rights issues:
The SARs will not confer on the holder an entitlement to dividends or to participate in bonus issues or rights issues unless the board determines that the SARs will be satisfied in shares and until the SARs are exercised and shares are provided to the holder.
No voting rights: The SARs will not confer an entitlement to vote at general meetings of the Company unless the board determines that the SARs will be satisfied in shares and until the SARs are exercised and shares are provided to the holder.
Non-quotation: The Company will not apply to the ASX for official quotation of the SARs.
Capital re-organisation:
In the event of a reorganisation of the capital of the Company, the rights of the SARs holder will be changed to the extent necessary to comply with the ASX Listing Rules and shall not result in any additional benefits being conferred on SARs holders which are not conferred on members.
Effect of take-over or change of control of Company, death or disablement:
The LTI Plan contains provisions to deal with SARs where there is a takeover or change of control of the Company. Depending on the nature of the takeover or change of control event, the Company will either have the discretion or be required (if a change of control occurs) to determine a special retesting date for the performance requirements discussed above.
For example, the board will have discretion to determine a special retesting date where a takeover bid is made for the Company or a scheme of arrangement is entered into. In that case, the special retesting date will be the date determined by the board. Where a statement is lodged with the ASX that a person has become entitled to acquire more than 50% of the Company, the board will be required to determine a special retesting date, and the special retesting date will be the day the statement is lodged with the ASX.
The SARs may vest if the performance requirements discussed above are satisfied in relation to that special retesting date.
As at the date of this Notice of Meeting, Mr Emmett’s total fixed remuneration is A$889,968. The amount of 16,617,522 SARs to be granted to Mr Emmett (subject to the resolution of this Item 5) was calculated in accordance with the LTI Plan by dividing 50% of Mr Emmett’s fixed remuneration by the present day value of the SARs as calculated by an independent valuer, Dalway Securities, on the Effective Allocation Date (A$0.026778). The VWAP of shares in the Company for the 10 business day period up to the day before the Effective Allocation Date for the purposes of the 2016 SARs award is A$0.0483.
Shareholder approval of the grant of securities under the LTI Plan to Mr Emmett is sought for all purposes under the Corporations Act and the Listing Rules of the ASX, including Listing Rule 10.14.
As required by Listing Rule 10.15, the following information is provided in respect of the grant of SARs under the LTI Plan to an executive director:
For
per
sona
l use
onl
y

Voting exclusion statement – Item 5
The Company will disregard any votes cast on Item 5 by:
• Mr Brent Emmett, being the only director eligible to participate in the LTI Plan; or
• an associate of Mr Emmett.
However, the Company need not disregard a vote if:
• it is cast by a person as proxy for a person who is entitled to vote, in accordance with the directions on the proxy form; or
• it is cast by the person chairing the meeting as proxy for a person who is entitled to vote, in accordance with a direction on the proxy form to vote as the proxy decides.
A vote must not be cast on Item 5 by a member of the KMP, or their closely related parties, acting as proxy, if their appointment does not specify the way the proxy is to vote on Item 5. However, this voting restriction does not apply if the member of the KMP is the Chairman of the meeting acting as proxy and their appointment expressly authorises the Chairman of the meeting to exercise the proxy even if that item is connected directly or indirectly with the remuneration of a member of the KMP.
If you appoint the Chairman of the meeting as your proxy, and you do not direct your proxy how to vote on Item 5, you will be expressly authorising the Chairman of the meeting to exercise your proxy even if Item 5 is connected directly or indirectly with the remuneration of a member of the KMP. The Chairman intends to vote undirected proxies in favour of Item 5.
The directors (with Mr Emmett abstaining) recommend that you vote in favour of Item 5.
6. Renewal of Proportional Takeover Provisions
It is proposed to renew, by special resolution of shareholders, Article 6.2 of the Company’s Constitution for a three year period in accordance with Part 6.5 of the Corporations Act (“Proportional Takeover Provisions”).
Section 648G of the Corporations Act requires a company’s shareholders to approve the renewal of proportional takeover provisions at least every three years in order for those provisions to remain effective. The resolution in Item 6 proposes to renew Article 6.2 as a proportional takeover provision for the purposes of Part 6.5 of the Corporations Act.
Effect of renewing Proportional Takeover Provisions
The effect of approving the Proportional Takeover Provisions will be:
> if a proportional takeover bid is received by the Company, the directors are required to ensure that a resolution is voted on to approve the bid before the fourteenth day before the bid closes;
> a majority of the shares voted, excluding the shares of the offeror and its associates, is required for the resolution to be passed;
> if no resolution is voted on before the fourteenth day before the bid closes, such resolution is deemed to have been passed; and
> if the resolution is rejected:
– all offers that have not been accepted or that have been accepted and from whose acceptance binding contracts have not resulted shall be deemed to be withdrawn; and
– the bidder must rescind each contract resulting from the acceptance of an offer made under the takeover bid.
The Proportional Takeover Provisions do not apply to full takeover bids.
Reasons for approving the provisions
The board of directors considers that shareholders should have the opportunity to vote on a proposed proportional takeover bid.
A proportional takeover bid may result in effective control of the Company changing hands without shareholders having the opportunity of disposing of all of their shares. Shareholders could be at risk of passing control to the bidder without payment of an adequate control premium for all their shares whilst leaving themselves as a part of a minority interest in the Company.
Present acquisition proposals
As at the date of this notice, no director is aware of a proposal by any person to acquire, or increase the extent of, a substantial interest in the Company.
Review of the advantages and disadvantages of the Proportional Takeover Provisions
The potential advantages and disadvantages of the Proportional Takeover Provisions for the directors and shareholders of the Company are set out below. There has not been any proportional takeover bid as at the date of this notice.
Potential advantages:
> the board is able to formally ascertain the views of shareholders in respect of a proportional takeover;
> shareholders are given the right to determine whether a proportional takeover bid should proceed;
> shareholders have greater ability to avoid being locked in as a minority;
> bidders may be more inclined to structure their offer in a way which is more attractive to a majority of shareholders as a result of the shareholders’ greater bargaining power; and
> knowing the view of a majority of shareholders may assist each individual shareholder in assessing the likely outcome of the bid and whether to approve or reject the offer under the bid.
Potential disadvantages:
> potential bidders may be discouraged from making a proportional takeover bid;
> the discouragement of potential bidders may lead to a depressed share price;
> an increased likelihood that a proportional takeover bid would not be successful; and
> the provisions may be considered by some shareholders as an unreasonable restriction on their ability to freely deal with their shares.
The directors recommend that you vote in favour of Item 6. The Chairman intends to vote undirected proxies in favour of Item 6.
Sydney
21 October 2016
EXPLANATORY MEMORANDUMF
or p
erso
nal u
se o
nly

YOUR VOTE IS IMPORTANT For your vote to be effective it must be recorded before 10:00am (Sydney time) on Sunday, 27 November 2016.
TO VOTE ONLINE BY SMARTPHONE
STEP 1: VISIT www.votingonline.com.au/horizonoilagm2016
STEP 2: Enter your Postcode OR Country of Residence (if outside Australia)
STEP 3: Enter your Voting Access Code (VAC):
Scan QR Code using smartphone
QR Reader App
PLEASE NOTE: For security reasons it is important you keep the above information confidential.
TO VOTE BY COMPLETING THE PROXY FORM
STEP 1 APPOINTMENT OF PROXY Indicate who you want to appoint as your Proxy. If you wish to appoint the Chair of the Meeting as your proxy, mark the box. If you wish to appoint someone other than the Chair of the Meeting as your proxy please write the full name of that individual or body corporate. If you leave this section blank, or your named
proxy does not attend the meeting, the Chair of the Meeting will be your proxy. A proxy need not be a security holder of the company. Do not write the name of the issuer company or the registered securityholder in the space.
Appointment of a Second Proxy You are entitled to appoint up to two proxies to attend the meeting and vote. If you wish to appoint a second proxy, an additional Proxy Form may be obtained by contacting the company’s securities registry or you may copy this form.
To appoint a second proxy you must: (a) complete two Proxy Forms. On each Proxy Form state the percentage of your voting rights or the number of securities applicable to that form. If the appointments do not
specify the percentage or number of votes that each proxy may exercise, each proxy may exercise half your votes. Fractions of votes will be disregarded; and (b) return both forms together in the same envelope.
STEP 2 VOTING DIRECTIONS TO YOUR PROXY To direct your proxy how to vote, mark one of the boxes opposite each item of business.
All your securities will be voted in accordance with such a direction unless you indicate only a portion of securities are to be voted on any item by inserting the percentage or number that you wish to vote in the appropriate box or boxes. If you do not mark any of the boxes on a given item, your proxy may vote as he or she chooses (subject to any
applicable voting restrictions). If you mark more than one box on an item for all your securities your vote on that item will be invalid. Proxy which is a Body Corporate
Where a body corporate is appointed as your proxy, the representative of that body corporate attending the meeting must have provided an “Appointment of Corporate Representative” prior to admission. An Appointment of Corporate Representative form can be obtained from the company’s securities registry.
STEP 3 SIGN THE FORM The form must be signed as follows: Individual: This form is to be signed by the securityholder. Joint Holding: where the holding is in more than one name, all the securityholders should sign.
Power of Attorney: to sign under a Power of Attorney, you must have already lodged it with the registry. Alternatively, attach a certified photocopy of the Power of Attorney to this form when you return it. Companies: this form must be signed by a Director jointly with either another Director or a
Company Secretary. Where the company has a Sole Director who is also the Sole Company Secretary, this form should be signed by that person. Please indicate the office held by signing in the appropriate place.
STEP 4 LODGEMENT Proxy forms (and any Power of Attorney under which it is signed) must be received no later
than 48 hours before the commencement of the meeting, therefore by 10:00am (Sydney time) on Sunday, 27 November 2016. Any Proxy Form received after that time will not be valid for the scheduled meeting.
Proxy forms may be lodged using the enclosed Reply Paid Envelope or:
Attending the Meeting If you wish to attend the meeting please bring this form with you to assist registration.
Online
By Fax
By Mail
In Person
www.votingonline.com.au/horizonoilagm2016
+ 61 2 9290 9655 Boardroom Pty Limited GPO Box 3993
Sydney NSW 2001 Australia Boardroom Pty Limited Level 12, 225 George Street
Sydney NSW 2000 Australia
All Correspondence to:
By Mail Boardroom Pty Limited
GPO Box 3993 Sydney NSW 2001 Australia
By Fax: +61 2 9290 9655
Online: www.boardroomlimited.com.au
By Phone: (within Australia) 1300 737 760
(outside Australia) +61 2 9290 9600
For
per
sona
l use
onl
y
Horizon Oil Limited ACN 009 799 455
Your Address This is your address as it appears on the company’s share register. If this is incorrect, please mark the box with an “X” and make the correction in the space to the left. Securityholders
sponsored by a broker should advise their broker of any changes. Please note, you cannot change ownership of your securities using this form.
PROXY FORM
STEP 1 APPOINT A PROXY
I/We being a member/s of Horizon Oil Limited (Company) and entitled to attend and vote hereby appoint:
the Chair of the Meeting (mark box)
OR if you are NOT appointing the Chair of the Meeting as your proxy, please write the name of the person or body corporate (excluding the registered shareholder) you are appointing as your proxy below
or failing the individual or body corporate named, or if no individual or body corporate is named, the Chair of the Meeting as my/our proxy at the Annual General Meeting (Meeting) of the Company to be held at The Sydney Boulevard Hotel, Grand Ballroom, Level 1, 90 William Street, Sydney NSW 2011 on Tuesday 29 November 2016 at
10:00am (Sydney time) and at any adjournment or postponement of that meeting, to act on my/our behalf and to vote in accordance with the following directions or if no directions have been given, as the proxy sees fit. If the Chair of the Meeting is your proxy or becomes your proxy by default: If I/we have appointed the Chair of the Meeting as my/our proxy or the Chair of the Meeting becomes
my/our proxy by default and I/we have not directed my/our proxy how to vote in respect of Resolutions 2 or 5, I/we expressly authorise the Chair of the Meeting to exercise my/our proxy in respect of Resolutions 2 and/or 5 (as applicable) even though Resolutions 2 and 5 are connected directly or indirectly with the remuneration of a member of the key management personnel of the Company.
Subject to any applicable laws or voting exclusions, the Chair of the Meeting will vote all undirected or available proxies in favour of all Items of business (including Resolutions 2 and 5). In exceptional circumstances, the Chair of the Meeting may change his/her voting intention on any item of business, in which case an ASX announcement will be made
by the Company. If you wish to appoint the Chair of the Meeting as your proxy with a direction to vote against, or to abstain from voting on an item of business, you must provide a direction by marking the 'Against' or 'Abstain' box opposite that item of business.
The Chair of the Meeting intends to vote all undirected or available proxies in favour of each item of business.
STEP 2 VOTING DIRECTIONS * If you mark the Abstain box for a particular item, you are directing your proxy not to vote on your behalf on a show of hands or on a poll and your vote will not be counted in calculating the required majority if a poll is called.
Resolution 2
To Adopt the Remuneration Report
For Against Abstain*
Resolution 3
Election of director – Ms Sandra Birkensleigh
Resolution 4
Re-election of director – Mr Gerrit de Nys
Resolution 5
Approval of 2016 grant of long term incentives (“LTIs”) to Mr Brent Emmett, Chief Executive Off icer and Managing Director
Resolution 6
Renewal of Proportional Takeover Provisions in Company’s Constitution
STEP 3 SIGNATURE OF SHAREHOLDERS This form must be signed to enable your directions to be implemented.
Individual or Securityholder 1
Sole Director and Sole Company Secretary
Securityholder 2
Director
Securityholder 3
Director / Company Secretary
Contact Name…………………………………………….... Contact Daytime Telephone………………………................................ Date / / 2016
For
per
sona
l use
onl
y