for personal use only - asx · 2017-10-29 · for personal use only over 150 wells drilled and...
TRANSCRIPT

ASX|SEHsinogasenergy.com
October 30, 2017
Development PlanLinxing and SanjiaobeiFuelling China’s Clean Energy Future
For
per
sona
l use
onl
y

sinogasenergy.com ASX|SEH2
World Class Development
1. Refer to slide 8 & 10 and the disclaimer statement on slides 23 & 24, all production numbers are gross field.
2. Bernstein Research, “Bernstein Global Gas: China steps on the gas. Will this trigger the next LNG super-cycle”, October 2017
3. Capex plus Opex; Refer to disclaimer statement on slide 24
4. Based on IHS Markit China Natural Gas Price Outlook, August 2017
Material progress towards unlocking significant value and returns
Low cost production underpins strong margin potential• One of lowest cost producers in China, targeting <$2/Mscf3
• Forecast well-head prices US$6.50 - $9.00+/Mscf4
Substantial production & cashflow targeted• 350 to >550 MMscf/d with significant Free Cash Flow targeted from 20201
• Extensively derisked and consistent with major nearby producing fields
Well established in large, fast growing gas market• Chinese gas demand forecast to triple by 20302
• Demonstrated gas marketing strategy with take or pay contracts under negotiation
Funding secured for development• Funding in place for development through existing cash, cash flow from operations
and new US$100mm Macquarie facility
ODP approvals nearing completion• First Linxing ODP submitted, Sanjiaobei submission targeted Q4 2017 • Production ramp-up in parallel with ODP approvals
For
per
sona
l use
onl
y

sinogasenergy.com ASX|SEH3
▪ Demand growth outstrips supply, with import dependency currently over 35%2
▪ Robust gas prices underpinned by high marginal cost of supply
▪ Tackling air pollution key Government priority
▪ Key policy reforms:• Spur gas demand• Encourage domestic production• Improve mid-stream availability and cost
Serving China’s Large, Fast Growing Gas Needs
1. Bernstein Research, “Bernstein Global Gas: China steps on the gas. Will this trigger the next LNG super-cycle”, October 2017
2. Source: IHS Markit, China’s Provincial Gas Demand and National Supply Outlook, August 2017
3. Source: BP Statistical Review of Energy, June 2017
-
50
100
150
200
250
300
350
2005
2006
2007
2008
2009
2010
2011
2012
2013
2014
2015
2016E
2017E
2018E
2019E
2020E
bc
m/y
ear
Supply-demand gap – domestic gas a priority
2016 Natural Gas Consumption
-5%
-
5%
10%
15%
20%
- 10% 20% 30% 40%
2005-2
016 D
em
an
d G
row
th
(% C
AG
R)
Natural Gas Share of Primary Energy Mix (%)
China
US
Europe
Australia
Asia ex China
China vs. world natural gas demand3
Growth, % of Primary Energy, 2016 consumption
Demand outpacing domestic supply2
China demand
China domestic production
Tripling of gas demand expected by 20301
For
per
sona
l use
onl
y

sinogasenergy.com ASX|SEH4
Sino Gas Ideally Positioned in Ordos Basin
1. Source: IHS Markit, China’s Natural Gas Supply and Cost Outlooks, August 2017
2. Based on population of Shanxi, Beijing, Tianjin, Shandong, Hebei and Henan
China’s most prolific gas basin, a strategic supply source
▪ Production ~4 bcf/d1
▪ Supplies key demand centres - ~330 million people2
▪ Extensive regional and national pipeline network
▪ Designated strategic supply source under 13th Five Year Plan
For
per
sona
l use
onl
y

sinogasenergy.com ASX|SEH5
Gro
ss F
ield
Pro
du
ctio
n(M
Msc
f/d
)C
um
ula
tive
We
lls D
rille
d(n
um
ber
)
Cu
mu
lati
ve S
eis
mic
(km
)C
um
ula
tive
Gro
ss P
SC
Exp
en
dit
ure
to
Dat
e (U
S$m
m)
-
5
10
15
20
2013 2014 2015 2016 2017E
-
100
200
300
400
2013 2014 2015 2016 2017E
-
50
100
150
200
2013 2014 2015 2016 2017E
-
1,000
2,000
3,000
4,000
2013 2014 2015 2016 2017E
Long-term production data supports deliverability
Proven Assets Significantly Derisked
1. 2017E gross field production based on full year guidance as of Q3 2017 Activities report of 16-18 MMscf/d
Historical investment drives expected cash flows
Blanket 2D seismic across the acreageOver 150 wells drilled and tested
For
per
sona
l use
onl
y

sinogasenergy.com ASX|SEH6
Analogous to Major Ordos Gas Fields
▪ ~1000m of gross gas bearing section
▪ Low risk sandstone reservoir with proven deliverability
▪ Higher quality reservoir reduces fracture stimulation requirements
▪ Stacked reservoirs drive high ultimate recoveries per well
▪ Higher gas volumes per km2
1. Source: Third Party Fields: Wood Mackenzie, August 2017; Sino Gas based on P50 Gas Initially in Place estimate from RISC as of 31 Dec 2016 – refer to announcement dated 6 March 2017; Area based on total block area ; GIIP estimate NA for Daniudi
Stacked reservoirs result in high gas in place
Key Producing Reservoirs1
Sino Gas benefits from more producing zones
-
1.0
2.0
3.0
4.0
Sino Gas South Sulige Changbei Sulige
Gas Initially in Place (GIIP) density1
GII
P B
cf/
km
2
~1.5-2x other Ordos fields1
For
per
sona
l use
onl
y

sinogasenergy.com ASX|SEH7
Standout Producer in Proven Hydrocarbon Basin
Source: Third Party Fields: Wood Mackenzie, August 2017, Mizhi production also includes adjacent field Zizhou, GIIP estimate NA for Daniudi,; Sino Gas: Area - total block size; GIIP - P50 Discovered Gas Initially in Place estimate from RISC as of 31 Dec 2016 – refer to announcement dated 6 March 2017; Permeability and Porosity - average across discovered area; Plateau Gas Rate – J Energy estimate of Phase 1 and Phase 1 Optimised, refer to disclaimer statement slide 24.
Large scale asset with higher quality reservoir drives high productivity
Larg
e S
cale High Productivity
Hig
he
r Q
ual
ity
Re
serv
oir
ChangbeiSouth Sulige
Mizhi
Sulige
Daniudi
Sino Gas
-
0.5
1.0
1.5
2.0
4 5 6 7 8 9
Pe
rme
abili
ty (
mD
)
Porosity (%)
Higher quality
Gas Initially In Place (GIIP)(Tcf)
-
5
10
55
60
Sulige Sino Gas South Sulige Changbei
Plateau Gas Rate(MMscf/d)
-
100
200
300
400
500
2,100
2,200
Sulige Sino Gas Daniudi Changbei SouthSulige
Mizhi
For
per
sona
l use
onl
y
sinogasenergy.com ASX|SEH8
Development Plan
1. J Energy estimate of 30 year Estimated Ultimate Recovery (EUR), refer to slides 28 & 29 and the disclaimer statement on slide 24 for additional details
2. All production numbers gross field. Gas converted at 6Mscf:1boe; J Energy estimate of Phase 1, Phase 1 Optimised and Phase 2 for Conceptual Development Plan, Phase 2 includes prospective area, unrisked, refer to disclaimer statement on slide 24, to be read in conjunction with slide 23.
3. Conceptual development plan is indicative only and not guidance, and remains subject to any necessary regulatory approvals and applicable investment decisions
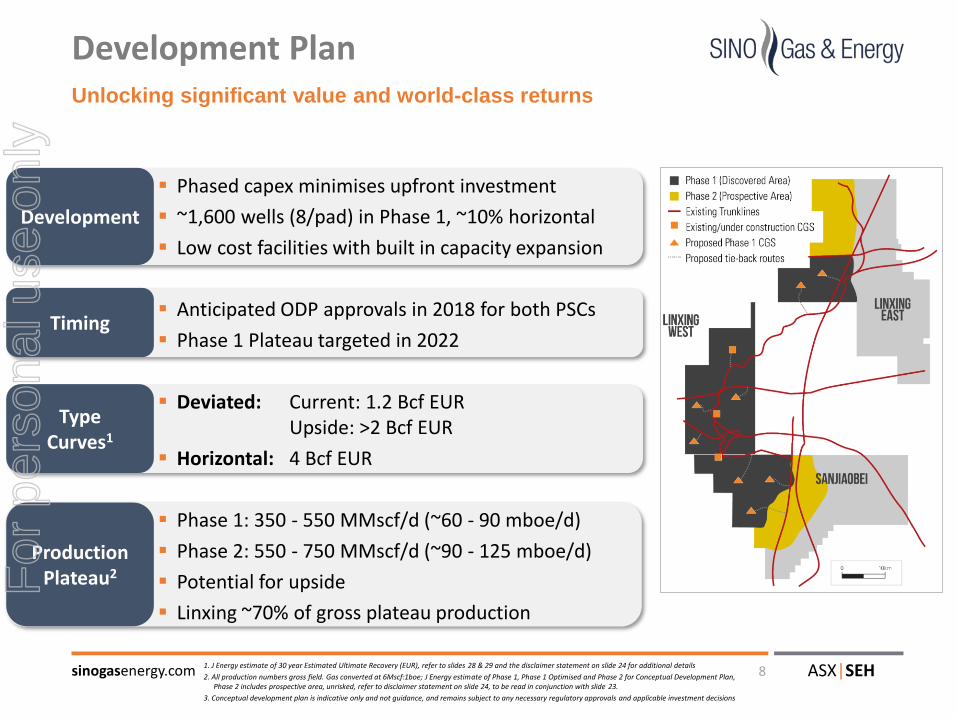
Unlocking significant value and world-class returns
Development
TypeCurves1
ProductionPlateau2
Timing
▪ Phased capex minimises upfront investment
▪ ~1,600 wells (8/pad) in Phase 1, ~10% horizontal
▪ Low cost facilities with built in capacity expansion
▪ Anticipated ODP approvals in 2018 for both PSCs
▪ Phase 1 Plateau targeted in 2022
▪ Deviated: Current: 1.2 Bcf EURUpside: >2 Bcf EUR
▪ Horizontal: 4 Bcf EUR
▪ Phase 1: 350 - 550 MMscf/d (~60 - 90 mboe/d)
▪ Phase 2: 550 - 750 MMscf/d (~90 - 125 mboe/d)
▪ Potential for upside
▪ Linxing ~70% of gross plateau production
For
per
sona
l use
onl
y

sinogasenergy.com ASX|SEH91. Illustrative purposes only; not to scale
Surface and Sub-Surface View
Pad drilling minimises footprint and cost
Modular, low cost expansions of CGS as production ramps up
Multiple zones targeted simultaneously
Multiple gas offtake routes for each CGS targeted
Sandstone reservoirs
Deviated and horizontal wells on the same pad
For
per
sona
l use
onl
y
sinogasenergy.com ASX|SEH10
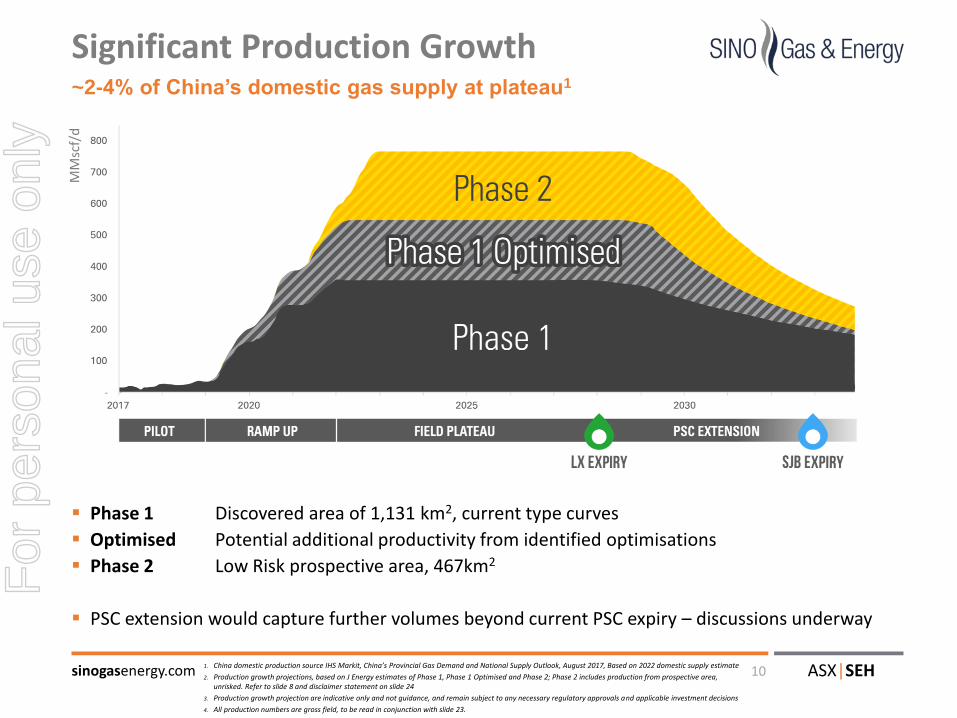
Significant Production Growth
1. China domestic production source IHS Markit, China’s Provincial Gas Demand and National Supply Outlook, August 2017, Based on 2022 domestic supply estimate
2. Production growth projections, based on J Energy estimates of Phase 1, Phase 1 Optimised and Phase 2; Phase 2 includes production from prospective area, unrisked. Refer to slide 8 and disclaimer statement on slide 24
3. Production growth projection are indicative only and not guidance, and remain subject to any necessary regulatory approvals and applicable investment decisions
4. All production numbers are gross field, to be read in conjunction with slide 23.
▪ Phase 1 Discovered area of 1,131 km2, current type curves
▪ Optimised Potential additional productivity from identified optimisations
▪ Phase 2 Low Risk prospective area, 467km2
▪ PSC extension would capture further volumes beyond current PSC expiry – discussions underway
~2-4% of China’s domestic gas supply at plateau1M
Msc
f/d
For
per
sona
l use
onl
y

sinogasenergy.com ASX|SEH11
Pad drilling drives efficiencies and minimises footprint
Well Design OptionalityWells tailored to reservoir characteristics to maximise production
Well Type 1: Deviated Wells
• 4 horizontals drilled and tested to date• Target thick, laterally extensive sands delineated by deviated wells• Higher EUR to cost ratio drives robust economics• Multilaterals where there are stacked thick sands• ~10% of expected well count
Well Type 2: Horizontal / Multilateral Wells
• ~150 deviated wells drilled and tested to date • Exploit multiple stacked sands• Multi-zone / dual completions maximises productivity• ~90% of expected well count
For
per
sona
l use
onl
y

sinogasenergy.com ASX|SEH12
- 10 20 30 40
Batch Drilling
Logging Optimisation
Demonstrated capability to reduce well costs, ~75% total project capex
Strengthening Low Cost Advantage
1. Based on average drilling time per well in 2016; Target drilling time based on J Energy estimates, refer to disclaimer statement slide 24.
2. Average drilling and completion cost per deviated well, excludes tie-in cost; Target cost based on J Energy estimates, refer to slide 24.
Further efficiencies identified to further drive down costs
Average days per deviated well1
NPT Reduction
Directional Control
Mud Optimisation
Bit Optimisation
Cement Optimisation
Rig Modification
Offline activities
Today
2019 / 20
Deviated well costs reduced by half (2013-2017 YTD)2
-
50
100
150
200
-
0.5
1.0
1.5
2013 2014 2015 2016 2017 TargetA
ve
rag
e w
ell
co
st (U
S$
mm
)
Cu
mu
lative
We
lls D
rille
d
2013
For
per
sona
l use
onl
y

sinogasenergy.com ASX|SEH13
Proven Technology Application
Drilling
Completions
Subsurface
Production
Horizontal drilling technology Batch drilling Slim hole drilling
Dual Completions to manage varying gas pressures between reservoir units Coilfrac, perf and plug, casing sleeve Slick water/low gel fracking
Seismic amplitude mapping Channel sweet spot identification through well-log modelling Advanced geological modelling and sand prediction
Remotely controlled production systems Pressure control via downhole choke, automatic shut-in safety device Plunge and/ or velocity string to lift water
Focus
AreasKey Technologies Deployed Planning to implement
Lowering costs, increasing recovery and productivity
For
per
sona
l use
onl
y

sinogasenergy.com ASX|SEH14
Established Gas Marketing Strategy
• Multiple buyers
• Leverage SOE Partners’ networks
• Take Or Pay Contracts
• Buyer diversity• Target high price markets
• Sell locally when possible
Strong relationships with partners and multiple buyers
✓ Proximal high demand markets
✓ Five offtake routes in place with multiple buyers
✓ Fixed term GSA’s in-place / Take or Pay under discussion
For
per
sona
l use
onl
y

sinogasenergy.com ASX|SEH15
Large Markets with Diverse Buyer Universe
▪ Extensive and growing pipeline network
▪ Proximal, large and growing demand centres, with ~330 million people
▪ Diverse universe of gas buyers
xx
3.3
15
12
30
15
3
5.89.8
16
7.2
6.0
X
Xiong’an
End users1:
Regional demand expected to double by 20251
39%
16%
15%
12%
4%
Commerical / Industrial ResidentialTransportation HeatingGas Fired Power Gen.
1. Source: IHS Markit, China’s Provincial Gas Demand and National Supply Outlook, August 2017, Target markets defined as Shanxi, Shandong, Hebei, Beijing, Tianjin and Henan, doubles between 2015 and 2025.
2. Map source: SIA Energy, October 2017, major pipelines only
For
per
sona
l use
onl
y

sinogasenergy.com ASX|SEH16
-
$2
$4
$6
$8
$10
$12
2016 2017 2018 2019 2020 2021 2022 2023 2024 2025
Shanxi City-Gate US Henry Hub
Low Cost, Robust Prices Drive High Margins
1. Source: Shanxi: IHS Markit, China’s Natural Gas Citygate Price Outlook, August 2017, Real 2016 prices; US: Factset, Annual average Henry Hub historical and forward strip as of 6 October 2017
2. Source: IHS, China’s Natural Gas Supply and Cost Outlooks, August 2016, assumes oil price in 2020 of US$72.60/bbl, inclusive of transportation to city-gate, current weighted average city-gate price as of September 2017, exchange rate of US:RMB of 6.47
3. J Energy estimates, refer to slide 18 and disclaimer statement on slides 23 & 24
One of the lowest cost natural gas producers in China
-
$2
$4
$6
$8
$10
$12
$14
- 50 100 150 200 250 Bcm
CB
M
LN
G
Sh
ale
Con
ve
ntio
na
l
Ord
os B
asin
Pip
elin
e
imp
ort
s
2016 total
demandCurrent weighted avg
city-gate price
Cost of Supply at City Gate, 2020E
US$/mmbtu (including transportation)2
Shanxi City-Gate vs. US Hub Prices1
US$/mmbtu
▪ Targeting full-cycle Opex + Capex less than US$2/Mscf3
▪ Low cost drivers:• Simple development, limited fraccing• Moderate reservoir depths (~1,200-2,000m)• Stacked reservoirs• Export quality gas (~95% methane) • Proximity to pipeline infrastructure
For
per
sona
l use
onl
y

sinogasenergy.com ASX|SEH17
-
10
20
30
40
Sino Beach AWE AAG Cooper Senex GDG
Stand-out Production Growth
1. Source: Peer Production: Company Reports – Full year average as of most recent annual report as of October 2017. Sino Gas current production middle of 2017 guidance of 16-18 MMscf/d gross; Net working interest production shown; Refer to slide 11 for additional details of Sino Gas projected production growth; Mscf:boe conversion 6:1; Market cap: Source Factset, as of 25 October 2017
2. Beach shown pre Lattice acquisition
Targeting to be one of the largest producers in the peer group
Production of Select Peers1
mboe/dP
has
e 1
Op
tim
ised
Cu
rren
t
Ph
ase
1P
has
e 2
2
158 1,565 197 436 353 376 117MarketCap (US$mm)
For
per
sona
l use
onl
y

sinogasenergy.com ASX|SEH18
High Cash MarginsLow cost advantage and attractive PSC terms drive robust cash generation
Government Take
Income Tax (25%)
SGE Take
PSC Gross Revenue split: Investment Phase
42%
50%
8%
21%
76%
3%
▪ Favourable PSC terms result in significant share of revenue
▪ Cost-reduction culture and increased scale expected to reduce unit opex by ~40%
▪ Rapid single well cost payback, under 0.2 Bcf break-even volume
▪ High cash margins underpin attractive full cycle returns
Investment Phase Margins5:
US$
/Msc
f
SGE margin Government take Unit opex
30 Years Average
Payback months 12 11 9
IRR % 116% 139% 193%
$6.50 Flat $7.00 Flat $8.00 Flat
2.00
4.00
6.00
8.00
Single deviated well:Payback months 12 11 9
IRR4% 116% 139% 193%
1. Assumes current type curves, well cost of US$800,000 drilled in Investment Phase (i.e. prior to recovery of all historical costs) and 76% SGE take
2. Government Take includes VAT, Fees and SOE share of Cost Recovery and Profit Split averaged over Linxing and Sanjiaobei PSCs.
3. J Energy estimates for conceptual development plan, refer to disclaimer statement slide 24
4. 30 year well life IRR
5. Refer to non-IFRS Financial Information note on slide 24
For
per
sona
l use
onl
y
sinogasenergy.com ASX|SEH19
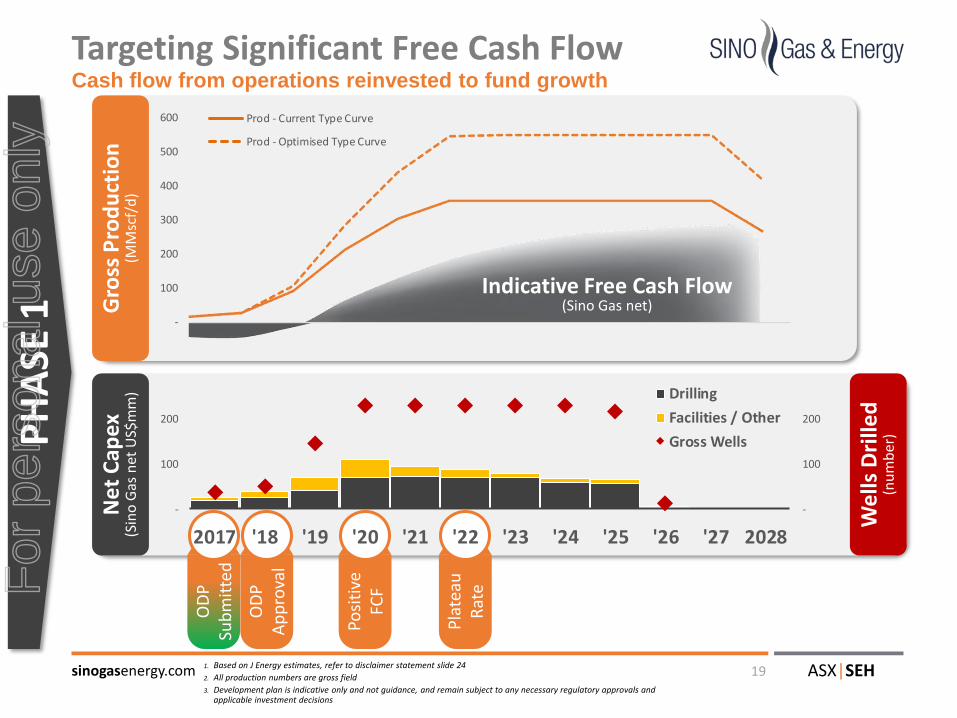
Targeting Significant Free Cash Flow
1. Based on J Energy estimates, refer to disclaimer statement slide 24
2. All production numbers are gross field
3. Development plan is indicative only and not guidance, and remain subject to any necessary regulatory approvals and applicable investment decisions
Ne
t C
apex
(Sin
o G
as n
et U
S$m
m)
Gro
ss P
rod
uct
ion
(MM
scf/
d)
PH
ASE
1
We
lls D
rille
d(n
um
ber
)
Drilling
Facilities / Other
Gross Wells
OD
PA
pp
rova
l
Posi
tive
FC
F
Pla
teau
R
ate
Cash flow from operations reinvested to fund growth
OD
PSu
bm
itte
d
Prod - Current Type Curve
Prod - Optimised Type Curve
-
100
200
300
400
500
600
-
100
200
-
100
200
2017 '18 '19 '20 '21 '22 '23 '24 '25 '26 '27 2028
Indicative Free Cash Flow(Sino Gas net)
For
per
sona
l use
onl
y

sinogasenergy.com ASX|SEH20
50
100
CurrentFacility
NewFacility
Committed Uncommitted
Project Development Funding Secured
Multiple sources of liquidity:
▪ US$35mm cash at 30th September1
▪ Cash flow from operations
▪ US$100 million Macquarie debt facility
1. Includes SGEH’s share of SGE cash
2. Subject to Macquarie approval
3. Refer to announcement 30 October 2017 for additional details
▪ Leveraged Macquarie relationship to secure competitive committed pre-ODP financing
▪ Committed amount expected to fund development plan
▪ Uncommitted amount provides further optionality2
▪ Subject to final transaction documentation and customary conditions precedent
Key Terms
▪ Refinance existing facility, project development, exercise Linxing Option
▪ 5 Year, senior secured non-revolving
▪ US$68mm committed / US$32mm uncommitted
▪ Pre-ODP = LIBOR + 8.2%Post-ODP = LIBOR + 6.5%
▪ No pre-payment penalty
New five-year, US$100 million debt facility
Significant de-risking supports increased credit commitment
Facility AmountUS$mm
For
per
sona
l use
onl
y

sinogasenergy.com ASX|SEH21
Selected Pictures
1. Third-part equipment shown
Lin County, Shanxi Province, May 2017
Fracking operations1
Linxing CGS Drilling rig1
For
per
sona
l use
onl
y
sinogasenergy.com ASX|SEH22
World Class Development
1. Refer to slide 8 & 10 and the disclaimer statement on slides 23 & 24, all production numbers are gross field.
2. Bernstein Research, “Bernstein Global Gas: China steps on the gas. Will this trigger the next LNG super-cycle”, October 2017
3. Capex plus Opex; Refer to disclaimer statement on slide 24
4. Based on IHS Markit China Natural Gas Price Outlook, August 2017
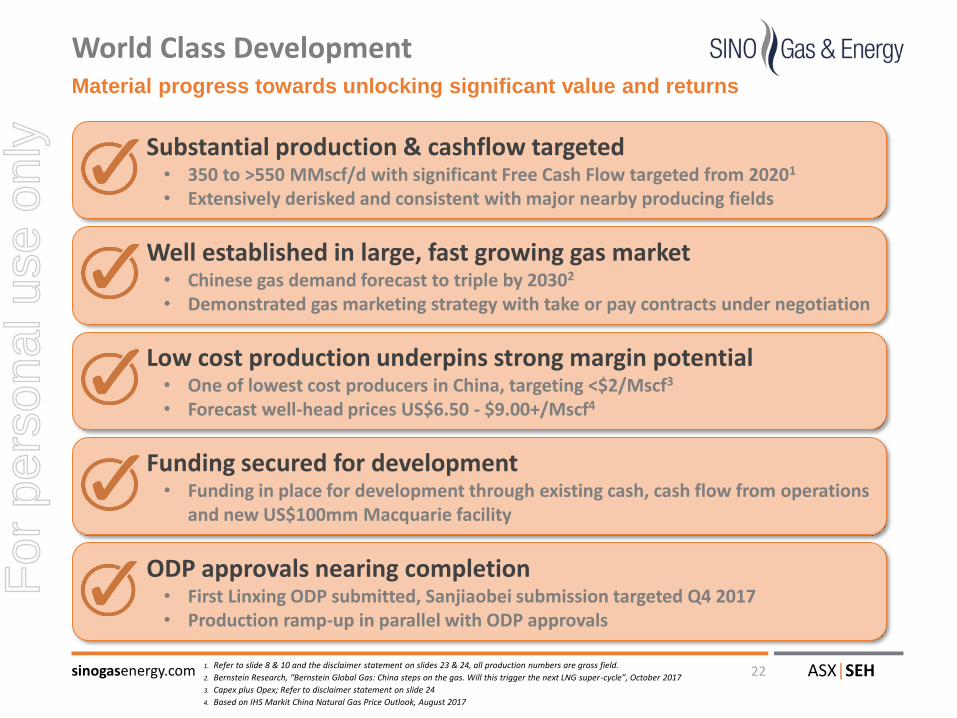
Material progress towards unlocking significant value and returns
Low cost production underpins strong margin potential• One of lowest cost producers in China, targeting <$2/Mscf3
• Forecast well-head prices US$6.50 - $9.00+/Mscf4
Substantial production & cashflow targeted• 350 to >550 MMscf/d with significant Free Cash Flow targeted from 20201
• Extensively derisked and consistent with major nearby producing fields
Well established in large, fast growing gas market• Chinese gas demand forecast to triple by 20302
• Demonstrated gas marketing strategy with take or pay contracts under negotiation
Funding secured for development• Funding in place for development through existing cash, cash flow from operations
and new US$100mm Macquarie facility
ODP approvals nearing completion• First Linxing ODP submitted, Sanjiaobei submission targeted Q4 2017 • Production ramp-up in parallel with ODP approvals
For
per
sona
l use
onl
y

sinogasenergy.com ASX|SEH23
Disclaimer (1 / 2)
Sino Gas & Energy Holdings Limited (“Sino Gas” ASX: SEH) is an Australian energy company focused on developing natural gas assets in China. Sino Gas holds a 49% interest in Sino Gas & Energy Limited (“SGE”), the operator of the Linxing and Sanjiaobei Production Sharing Contracts (PSCs) in the Ordos Basin, China's largest gas producing basin. SGE has been established in Beijing since 2005 and is jointly owned with China New Energy Mining Limited (“CNEML”) via a strategic partnership.
SGE’s interest in the Linxing PSC with CUCBM (a CNOOC wholly-owned subsidiary) is 70% and 49% for the Sanjiaobei PSC held with PCCBM (a Petrochinawholly-owned subsidiary). SGE has a 100% working interest during the exploration phase of the PSC, and SGE’s PSC partners are entitled to participate upon Overall Development Plan (ODP) approval up to their PSC working interest by contributing their future share of costs.
Sino Gas also holds an option to acquire a 5.25% participating interest from SGE (assuming full SOE partner participation) in the Linxing PSC at ODP by contributing 7.5% of historical back costs to SGE. Upon exercise of the option, Sino Gas will hold the largest net working interest in the Linxing PSC.
Certain statements included in this release constitute forward looking information. This information is based upon a number of estimates and assumptions made on a reasonable basis by the Company in light of its experience, current conditions and expectations of future developments, as well as other factors that the Company believes are appropriate in the circumstances. While these estimates and assumptions are considered reasonable, they are inherently subject to business, economic, competitive, political and social uncertainties and contingencies. Whilst the Company considers all the material assumptions to be based on reasonable grounds, there is no certainty that they will prove correct or that the outcomes indicated in the Development Plan will be achieved. Production profile, plateau rates and other conceptual development plan parameters are indicative only and not guidance, and remain subject to any necessary regulatory approvals and applicable investment decisions.
Many factors could cause the Company’s actual results to differ materially from those expressed or implied in any forward-looking information provided by the Company, or on behalf of, the Company. Such factors include, among other things, risks relating to gas prices, exploration, acquisition, development and operating risks, gas production rates, the costs associated with producing these volumes, access to product markets, product prices, competition, production risks, regulatory restrictions, including environmental regulation and liability, potential title disputes and additional funding requirements. Further, despite the Company having attempted to identify all material factors that may cause actual results to differ, there may be other factors that cause results not to be as anticipated, estimated or intended. Forward-looking information is no guarantee of future performance and, accordingly, investors are cautioned not to put undue reliance on forward-looking information due to the inherent uncertainty therein. Forward-looking information is made as at the date of this release (or as otherwise specified) and the Company disclaims any intent or obligation to update publicly such forward-looking information, whether as a result of new information, future events or results or otherwise.
The purpose of this presentation is to provide general information about the Company (it is in summary form and does not purport to be all inclusive or complete). No representation or warranty, express or implied, is made by the Company that the material contained in this presentation will be achieved or prove to be correct. Except for statutory liability which cannot be excluded, each of the Company, its officers, employees and advisers expressly disclaims any responsibility for the accuracy or completeness of the material contained in this presentation and excludes all liability whatsoever (including in negligence) for any loss or damage which may be suffered by any person as a consequence of any information in this presentation or any error or omission therefrom.
This presentation should be read in conjunction with the Annual Financial Report as at 31 December 2016, the half year financial statements together with any ASX announcements made by the Company in accordance with its continuous disclosure obligations arising under the Corporations Act 2001 (Cth). This document is protected by copyright laws.
For
per
sona
l use
onl
y

sinogasenergy.com ASX|SEH24
Disclaimer (2 / 2)
The statements of resources in this release have been determined to Society of Petroleum Engineers (SPE) Petroleum Resource Management Systems (PRMS) standards.
The reserves and resources (as per below table) have been independently determined by internationally recognised oil and gas consultants RISC Operations Pty Ltd (RISC) (refer to announcement of 6 March 2017)
using probabilistic and deterministic estimation methods. These statements were not prepared to comply with the China Petroleum Reserves Office (PRO-2005) standards or the U.S. Securities and Exchange
Commission regulations and have not been verified by SGE’s PSC partners CNPC and CUCBM.
All resource figures quoted are unrisked mid-case unless otherwise noted. Sino Gas’ attributable net Reserves & Resources assumes PSC partner back-in upon ODP approval (i.e. CUCBM take their entitlement of
30% interest in Linxing PSC and CNPC take their entitlement to 51% in the Sanjiaobei PSC) and does not include Sino Gas’ option to acquire an interest of 5.25% in the Linxing PSC (by paying 7.5% of back costs)
which was purchased in April 2017 (after the assessment date), rather it assumes exercise by a third party. Reserves & Resources are net of 4% in-field fuel for field compression and field operations. Reference point
is defined to be at the field gate. No material changes have occurred in the material assumptions that would materially impact the reserves and resources as per the table below and subsequent work program
exploration and appraisal results have been in line with expectations.
Information on the Reserves and Resources in the table below is based on an independent evaluation conducted by RISC Operations Pty Ltd (RISC), a leading independent petroleum advisory firm. The evaluation
was carried out by RISC under the supervision of Mr. Peter Stephenson, RISC Partner, in accordance with the SPE-PRMS guidelines. Mr Stephenson has a M.Engin Petroleum Engineering and 30 years of
experience in the oil and gas industry. Mr. Stephenson is a member of the SPE and MIChemE and is a qualified petroleum reserves and resources evaluator (QPPRE) as defined by ASX listing rules. Mr Stephenson
has consented to the form and context in which the estimated reserves and resources and the supporting information are presented in the table below. RISC is independent with respect to Sino Gas in accordance
with the Valmin Code, ASX listing rules and ASIC requirements.
Reserves and Resources
Sino Gas’ Attributable Net Reserves & Resources as at 31 December 2016
SEH Attributable Net Reserves & Resources
1P Reserves (Bcf)
2P Reserves (Bcf)
3PReserves
(Bcf)
2C Contingent Resources
(bcf)
P50Prospective Resources
(bcf)1
31 December 2016 (Announced 6
March 2017)385 579 778 899 821
31 December 2015 (Announced
10 March 2016)362 552 751 814 733
Total 2016 Change (+/-%) +5% (2P) +10% +12%
Gross Project
31 December 20161,377 2,147 2,951 3,171 3,499
Note 1. The estimated quantities of petroleum that may potentially
be recovered by the application of future development project(s)
relate to undiscovered accumulations. These estimates have both
an associated risk of discovery and a risk of development. Further
exploration and appraisal is required to determine the existence of a
significant quantity of potentially moveable hydrocarbons. The
probability of development of the contingent area is estimated to be
90%, with the additional probability of geological success assigned
to prospective resources estimated to be 60-80%.
Development Plan ReviewSino Gas and Energy Holdings Limited have commissioned Beijing J-energy Company Limited (J-Energy) to provide technical advisory services. The review, and the production information and economic
assumptions contained in this release relating to the review, for the purposes of the conceptual development plan is based on, and fairly represents, data and supporting documentation prepared by, or under the
supervision of Mr Jin Po Dong and Mr Frank Fu. The review assumes PSC partner back-in upon ODP approval (i.e. CUCBM take their entitlement of 30% interest in Linxing PSC and CNPC take their entitlement to
51% in the Sanjiaobei PSC) and the exercise of Sino Gas’ option to acquire an interest of 5.25% in the Linxing PSC (by paying 7.5% of back costs) which was purchased in April 2017. Mr Dong is a Vice-President of
J-Energy Ltd and has a Bachelor of Petroleum Engineering from South West Petroleum University of China, has over 20 years of industry experience and is a member of the Society of Petroleum Engineers (SPE).
Mr Fu is the Chief Operating Officer of Sino Gas & Energy Holdings Limited, holds a Bachelor of Science degree in Geology and Exploration, and has over 25 years of relevant experience in both conventional and
unconventional hydrocarbon exploration & production in China and multiple international basins and a member of the Society of Petroleum Engineers (SPE). Such statements were issued with the prior written
consent of Mr Dong and Mr Fu in the form and context in which they appear. The statements and opinions attributable to J-Energy are given in good faith and in the belief that such statements are reasonable and
neither false nor misleading. J-Energy has considered and relied upon information obtained from the Company and information in the public domain. J-Energy has no pecuniary interest, other than to the extent of the
professional fees receivable for their engagement, or other interest in the assets evaluated, that could reasonably be regarded as affecting our ability to give an unbiased view of these assets.
Financial Terms This presentation contains terms commonly used in the oil and gas industry which are not defined by or calculated in accordance with International Financial Reporting Standards (“IFRS”), such as margin and free
cashflow, which are non-IFRS measures. These terms should not be considered an alternative to, or more meaningful than the comparable measures determined in accordance with IFRS. The measures provide
additional information to evaluate the conceptual development plan. The non-IFRS measures have not been subject to audit or review by Sino Gas’ external auditors. Sino Gas’ determination of these measures may
not be comparable to that reported by other companies.
For
per
sona
l use
onl
y

sinogasenergy.com ASX|SEH25
Definitions and Conversions
1. Sources: BP Statistical Review, June 2016, Factset October 2017, company calculations
Bcf – billion cubic feetBOE – barrels of oil equivalentCGS – Central gathering stationCNEML – China New Energy Mining Limited – 51% owner of SGECRR – Chinese Reserve ReportCUCBM – China United Coal Bed Methane, subsidiary of China National
Offshore Oil Company (CNOOC), PSC Partner in Linxing PSCEUR – Estimated Ultimate RecoveryGIIP – Gas Initially in PlaceGSA – Gas Sales AgreementHSE – Health, Safety and EnvironmentIRR – Internal Rate of ReturnJMC – Joint Management CommitteeMboe/d – thousand barrel of oil equivalent per daymm – millionMMbtu – Million British Thermal UnitsMMscf/d – Million standard cubic feet per dayMscf/d – Thousand standard cubic feet per dayNDRC – National Development and Reform CommissionODP – Overall Development PlanPCCBM – PetroChina CBM, subsidiary of PetroChina, PSC Partner in
SanjiaobeiPSC – Production sharing contractSGE – Sino Gas Energy Limited – Sino Gas’ 49% owned Joint Venture
CompanySOE – State Owned Enterprise Tcf – trillion cubic feetToP – Take or Pay YOY – Year on Year
Definitions
1 barrel of oil equivalent (boe) = 6 thousand standard cubic feet gas (Mscf)
1 billion cubic meter (bcm) = 35.3 billion cubic feet (bcf)
1 BCM/annum = 0.1 bcf/d
1 million ton LNG = 48 bcf gas
1 US dollar (US$) = 6.6 Chinese Remnimbi (RMB)
1 RMB/meter cubed = US$4.26/Mscf (at 6.6RMB/US$)
1 million tonnes oil equivalent (mmtoe) = 39.2 bcf
1 million british thermal units (mmbtu) = 0.99 Mscf
1 bcf natural gas generates aprox. 112 gigawatt hours of electricity (in a modern power plant)
1 tonne of coal equivalent (tce)= 0.7 tonnes of oil equivalent (toe) = 27 Mscf gas
Approximate conversion factors 1
For
per
sona
l use
onl
y

ASX|SEHsinogasenergy.com
APPENDIX
For
per
sona
l use
onl
y

sinogasenergy.com ASX|SEH27
PSC Mechanism
Government Take Income Tax (25%)SGE Take
Gross Revenue splits1
InvestmentPhase
Full Cycle▪ China attractive fiscal and regulatory regime
▪ Accelerated Cost Recovery provides immediate cash flow to contractor
▪ Supports funding of investment phase
▪ Full cycle take attractive by global standards
VAT, Fees, Surcharges
Gross Revenues
SGE priority recovery of pre-ODP costs
Cost Recovery
~95% split via working interests~5% Government royalty
Profit Recovery
Net Revenues
UnusedRecoverygas
Illustrative PSC waterfall
~80% ~20%
~12%
42%
50%
8%
21%
76%
3%
1. Assumes IHS Markit August 2017 price (refer to slide 16) with Sino Gas’ realised wellhead gas price $1/Mscf less than Shanxi Province city-gate price
For
per
sona
l use
onl
y
sinogasenergy.com ASX|SEH28
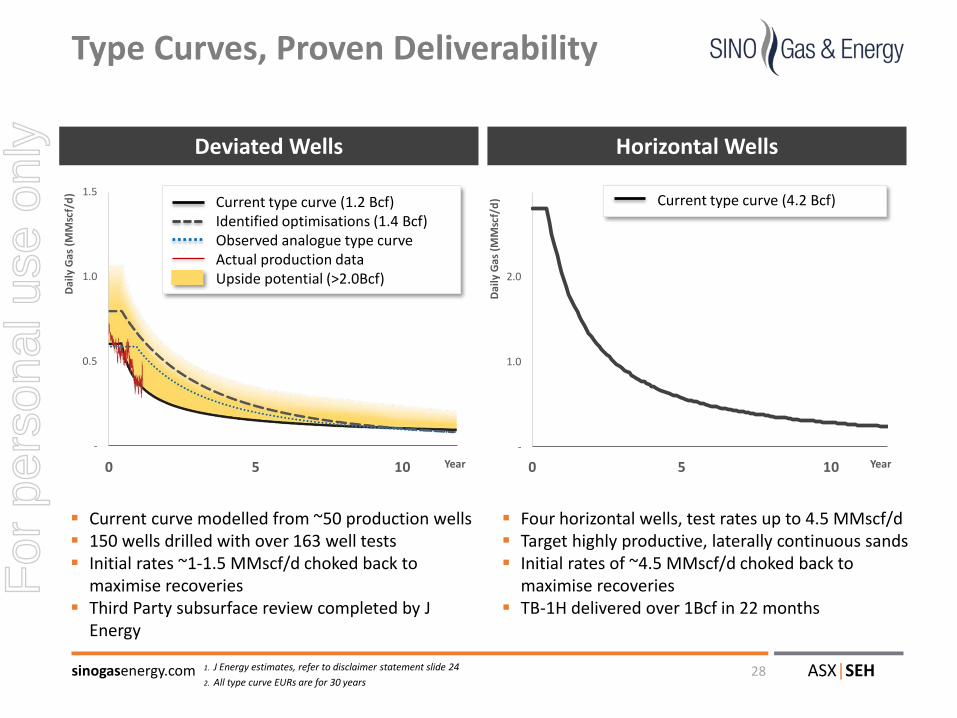
▪ Current curve modelled from ~50 production wells▪ 150 wells drilled with over 163 well tests▪ Initial rates ~1-1.5 MMscf/d choked back to
maximise recoveries▪ Third Party subsurface review completed by J
Energy
▪ Four horizontal wells, test rates up to 4.5 MMscf/d▪ Target highly productive, laterally continuous sands▪ Initial rates of ~4.5 MMscf/d choked back to
maximise recoveries▪ TB-1H delivered over 1Bcf in 22 months
Type Curves, Proven Deliverability
1. J Energy estimates, refer to disclaimer statement slide 24
2. All type curve EURs are for 30 years
Current type curve (4.2 Bcf)
Deviated Wells Horizontal Wells
Current type curve (1.2 Bcf)Identified optimisations (1.4 Bcf)Observed analogue type curveActual production dataUpside potential (>2.0Bcf)
0 5 10
-
0.5
1.0
1.5
Dai
ly G
as (
MM
scf/
d)
Year
-
1.0
2.0
0 5 10
Dai
ly G
as
(MM
scf/
d)
Year
For
per
sona
l use
onl
y

sinogasenergy.com ASX|SEH29
Current
Optimised
Additional
Upside
Type Curve with Significant UpsideIdentified optimisations accelerate production and increase EUR
Unlocking with proven methods and technology:1. subsurface well locations2. drilling procedures, reducing near well-bore damage3. well completion procedures4. fracking fluid recipe and procedures5. production practices6. pipeline design7. drilling horizontal wells
1.2Bcf
1.4Bcf
>2.0Bcf
Current Optimised Upside
1.2Bcf
1.4Bcf
>2.0Bcf
Current Optimised Upside
1.2Bcf
1.4Bcf
>2.0Bcf
Current Optimised Upside
1. Deviated wells; 30 year EURs
2. J Energy Estimates, refer to disclaimer statement slide 24
For
per
sona
l use
onl
y
sinogasenergy.com ASX|SEH30
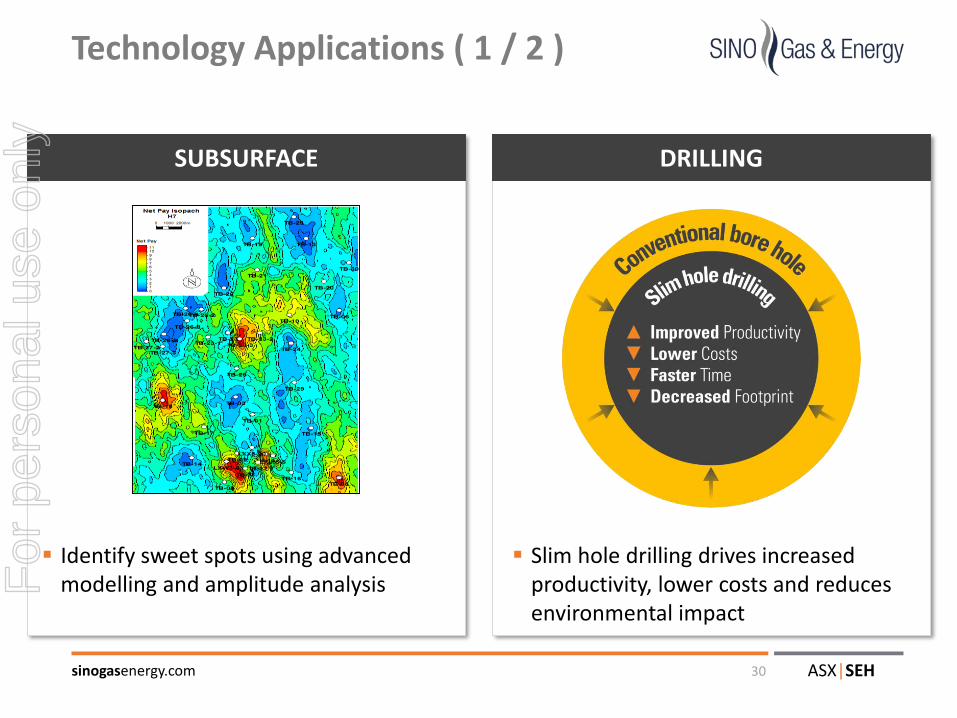
DRILLING
▪ Slim hole drilling drives increased productivity, lower costs and reduces environmental impact
Technology Applications ( 1 / 2 )
▪ Identify sweet spots using advanced modelling and amplitude analysis
SUBSURFACE
For
per
sona
l use
onl
y

sinogasenergy.com ASX|SEH31
Technology Applications ( 2 / 2 )
PRODUCTION
Plunger Lifting Velocity String
▪ Improved liquids handling offsets production decline
▪ Frac optimization results in improved well EUR and productivity
COMPLETION
For
per
sona
l use
onl
y

sinogasenergy.com ASX|SEH32
Strong Strategic Partnerships
1. Sino Gas has an option to acquire 5.25% of Linxing from SGE by paying 7.5% of back costs. If exercised SGE interest 64.75%
▪ SGE – Joint Venture Subsidiary
• PSC Operator partnered with major State Owned Enterprises (SOE) with extensive field development experience
▪ China New Energy Mining Ltd
• Well funded private Hong Kong company with strong China and international oil and gas expertise, strong China backing
▪ CUCBM – Linxing PSC Partner
• 100% owned subsidiary of CNOOC with an extensive international presence including in unconventional resources
▪ PetroChina – Sanjiaobei PSC Partner
• Subsidiary of CNPC, China’s largest oil and gas producer
Linxing PSC Sanjiaobei PSC
Sino Gas Energy Limited (SGE)
Foreign Contractor
49% 51%
64.75%1 49%
PSC Partner PSC Partner
51%30%
5.25%1
For
per
sona
l use
onl
y

sinogasenergy.com ASX|SEH
Investor Relations+86 10 8458 30011300 746 642 (local call within Australia)[email protected]
For
per
sona
l use
onl
y