for personal use only - asx · 2017-02-15 · markets australia emerging markets frontier markets...
TRANSCRIPT

For
per
sona
l use
onl
y

Investment updateFebruary 2017
For
per
sona
l use
onl
y

DisclaimerThis presentation has been prepared by Walsh & Company Asset Management Pty Limited as Investment Manager of the Emerging Markets Masters Fund (Fund).
The information in this presentation is of a general nature and does not purport to be complete, nor does it contain all information which would be required in a
product disclosure statement (PDS) prepared in accordance with the requirements of the Corporations Act.
An investment in units of the Fund is subject to various risks, many of which are beyond the control of the Investment Manager. The past performance of the Fund is
not a guarantee of the future performance of the Fund.
This presentation contains statements, opinions, projections, forecasts and other material (forward looking statements), based on various assumptions. Those
assumptions may or may not prove to be correct. None of the Responsible Entity, the Investment Manager, their respective officers, employees, agents, advisers nor
any other person named in this presentation makes any representation as to the accuracy or likelihood of fulfilment of the forward looking statements or any of the
assumptions upon which they are based.
This presentation may contain general advice. Any general advice provided has been prepared without taking into account your objectives, financial situation or
needs. Before acting on the advice, you should consider the appropriateness of the advice with regard to your objectives, financial situation and needs. Where the
presentation relates to the purchase of a particular product, you should obtain a copy of the relevant product disclosure statement or offer document before making
any decisions in relation to the product.
Any opinions expressed reflect the Fund’s position at the date of this presentation and are subject to change. The information is taken from sources which are
believed to be accurate, but the Responsible Entity accepts no liability of any kind to any person who relies on the information contained in this presentation. Unless
expressly stated, none of the information should be taken to be a recommendation. You are acting independently at your own risk.
To the extent permitted by law, the Responsible Entity, the Investment Manager or their respective officers, employees, agents and advisers give no warranty,
representation or guarantee as to the accuracy or completeness or reliability of the information contained in this presentation. Further, none of the Responsible
Entity, the Investment Manager or their respective officers, employees, agents and advisers accept, except to the extent permitted by law, responsibility for any loss,
claim, damages, costs or expenses arising out of, or in connection with, the information contained in this presentation. Any recipient of this presentation should
independently satisfy themselves as to the accuracy of all information contained herein.
MSCI indices source: MSCI. Neither MSCI nor any other party involved in or related to compiling, computing or creating the MSCI data makes any express or implied
warranties or representations with respect to such data (or the results to be obtained by the use thereof), and all such parties hereby expressly disclaim all
warranties of originality, accuracy, completeness, merchantability or fitness for a particular purpose with respect to any such data. Without limiting any of the
foregoing, in no event shall MSCI, any of its affiliates or any third party involved in or related to compiling, computing or creating the data have any liability for any
direct, indirect, special, punitive, consequential or any other damages (including lost profits) even if notified of the possibility of such damages. No further distribution
or dissemination of the MSCI data is permitted without MSCI’s express written consent.
3 Investor update 2017
For
per
sona
l use
onl
y

Walsh & Company
Asset Management
• Walsh & Co is a Sydney-based specialist global fund manager
co-founded by Max Walsh in 2007
• Walsh & Co has approximately A$3.1 billion client assets under
management across global equities, residential and commercial
property, private equity, fixed income, and sustainable and social
investments
• We believe the best investment opportunities are often not readily
accessible to investors. We provide investors with access to market
segments that are often beyond reach, helping them build high quality
diversified portfolios
• Offices in Australia and New York
4 Investor update 2017
For
per
sona
l use
onl
y
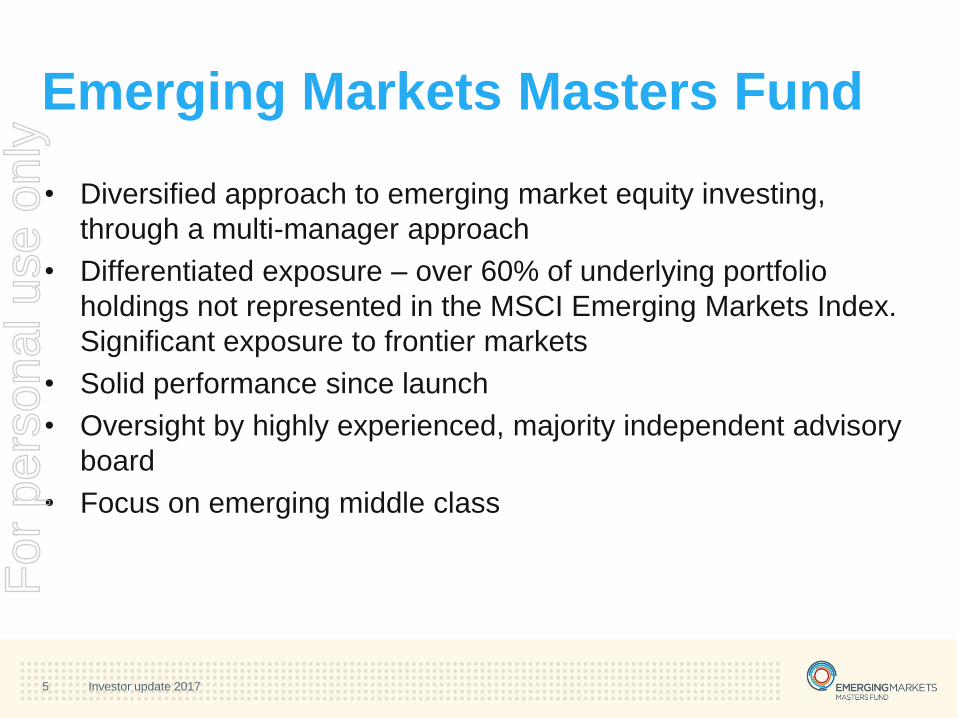
Emerging Markets Masters Fund
• Diversified approach to emerging market equity investing,
through a multi-manager approach
• Differentiated exposure – over 60% of underlying portfolio
holdings not represented in the MSCI Emerging Markets Index.
Significant exposure to frontier markets
• Solid performance since launch
• Oversight by highly experienced, majority independent advisory
board
• Focus on emerging middle class
5 Investor update 2017
For
per
sona
l use
onl
y

1. 2016 Review
For
per
sona
l use
onl
y

2016 – a year of rotation
• Chinese stabilisation after concerns over debt and capital
outflows
• Recovery of energy and commodity prices
• Significant dispersion across country and sector returns
– Commodity and energy dependent markets (Brazil and
Russia) performed best
• Significant style rotation
– Recovery of cyclicals and value stocks
– Quality and growth lagged
• India demonetisation caused short-term shock
7 Investor update 2017
For
per
sona
l use
onl
y

2. Emerging market
considerations
For
per
sona
l use
onl
y
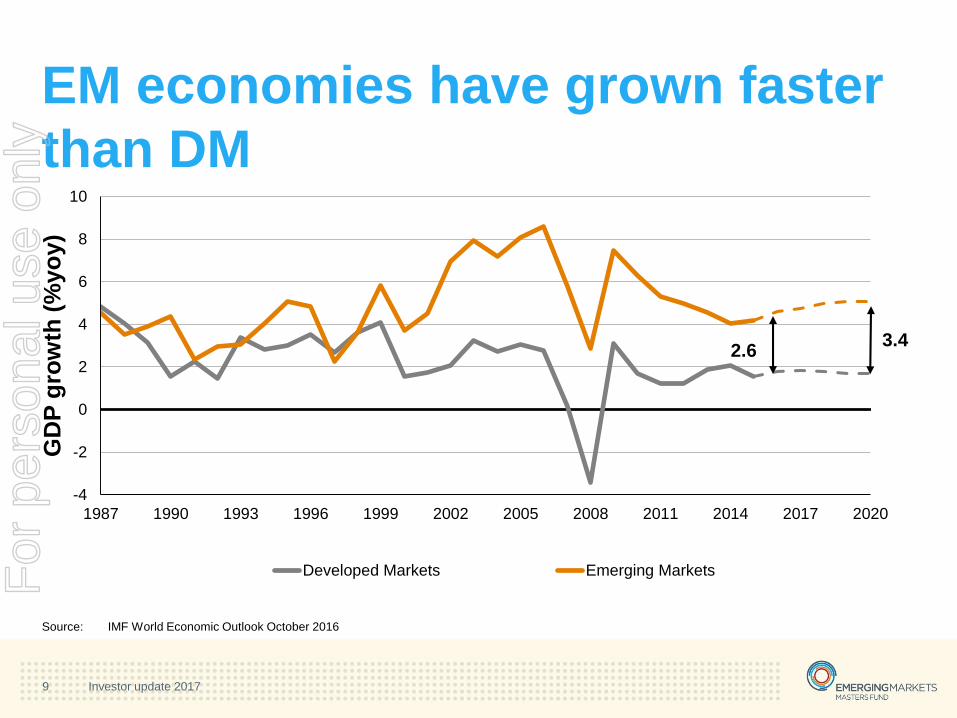
-4
-2
0
2
4
6
8
10
1987 1990 1993 1996 1999 2002 2005 2008 2011 2014 2017 2020
GD
P g
row
th (
%yo
y)
Developed Markets Emerging Markets
3.4
EM economies have grown faster
than DM
Source: IMF World Economic Outlook October 2016
2.6
9 Investor update 2017
For
per
sona
l use
onl
y

Growth and return in emerging
markets
Source: IMF World Economic Outlook October 2016; Bloomberg: Annual total returns between 1987 – 2016 by MSCI Emerging Market Index and
MSCI World Index.
-1.0%
0.0%
1.0%
2.0%
3.0%
4.0%
5.0%
6.0%
7.0%
0%
20%
40%
60%
80%
100%
120%
140%
160%
180%
1996 2001 2006 2011 2016
MSCI EM / MSCI World Relative Return (LH1) EM/DM Growth Differential (RH1)
Estimated differential by IMF
10 Investor update 2017
For
per
sona
l use
onl
y

Stronger balance sheets
Source: IMF World Economic Outlook October 2016
0
20
40
60
80
100
120
140
2001 2004 2007 2010 2013 2016
Go
vt
Deb
t as %
of
GD
P
Developed Markets Emerging Markets
11 Investor update 2017
For
per
sona
l use
onl
y

MSCI emerging markets sectors – % state control
Source: “Finding value in your emerging-market investments”, September 2016, Newton Investment Management
Dominated by state ownership?
12 Investor update 2017
4.6% 3.3%
58.8%
41.5%
14.6%
35.8%
1.6%
15.9%
49.5%
75.4%
27.4%
0.0%
10.0%
20.0%
30.0%
40.0%
50.0%
60.0%
70.0%
80.0%
Co
nsu
me
r d
iscre
tio
na
ry
Co
nsu
me
r sta
ple
s
En
erg
y
Fin
an
cia
ls
He
alth
care
Ind
ustr
ials IT
Ma
teria
ls
Te
leco
mm
un
ica
tio
ns
Utilit
ies
To
tal e
me
rgin
g m
ark
ets
For
per
sona
l use
onl
y
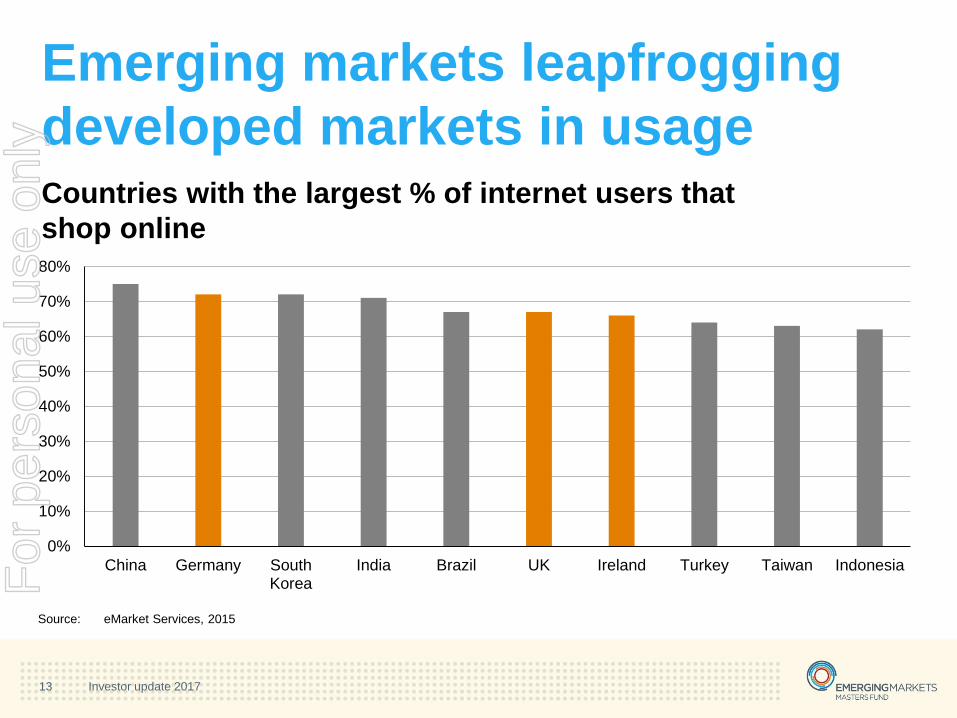
Emerging markets leapfrogging
developed markets in usageCountries with the largest % of internet users that
shop online
0%
10%
20%
30%
40%
50%
60%
70%
80%
China Germany SouthKorea
India Brazil UK Ireland Turkey Taiwan Indonesia
Source: eMarket Services, 2015
13 Investor update 2017
For
per
sona
l use
onl
y

Source: Raghuram Rajan, Former
Governor of the Reserve
Bank of India. Image IMF.
Source: Elvira Nabiullina, Economist and
Head of the Central Bank of Russia.
WTO. Photo: Studio Casagrande (Jay
Louvion/Kryvosheiev Nikita).
Source: Sri Mulyani Indrawati, Finance Minister of
Indonesia. Image by Patrick Tsui/FCO.
Reform
14 Investor update 2017
For
per
sona
l use
onl
y
Key takeaways
The reality is more nuanced than the press would have
you believe
Disposable income growth is driving changes in behaviour
Requires specialist knowledge …and a dynamic approach to
managing strategy
Invest in these markets with professionals who know the market
well
15 Investor update 2017
For
per
sona
l use
onl
y

3. Outlook
For
per
sona
l use
onl
y

Developed
Markets Australia
Emerging
Markets
Frontier
Markets
Forward P/E 18.1x 16.6x 13.5x 12.3x
Price/Book 2.6x 2.0x 1.4x 1.5x
Emerging markets – compelling
valuations
• Low in absolute terms
• Cheaper than developed markets
• Supported by solid earnings recovery potential
Source: Bloomberg, MSCI, data to 31 December 2016
17 Investor update 2017
For
per
sona
l use
onl
y

Emerging Market valuations
Source: Bloomberg, MSCI to 31 December 2016.
1.0x
1.5x
2.0x
2.5x
3.0x
2007 2008 2009 2010 2011 2012 2013 2014 2015 2016
Current Average +/- 1 Standard Deviation
MSCI Emerging Markets Index – price to book ratio
18 Investor update 2017
For
per
sona
l use
onl
y

Frontier markets
• >20% of EMF is invested in frontier markets
• Unique underlying exposure – otherwise extremely difficult for retail
investors to access
• Uncorrelated markets
• Inefficient, providing great opportunities for active management
Correlations FM EM World
MSCI Frontier Markets Index 1
MSCI Emerging Markets Index 0.84 1
MSCI World Index 0.37 0.84 1
Source: Bloomberg, Walsh & Co. Asset Management, MSCI data (correlation calculated based on index weekly gross returns from May
2002 to Dec 2016
19 Investor update 2017
For
per
sona
l use
onl
y
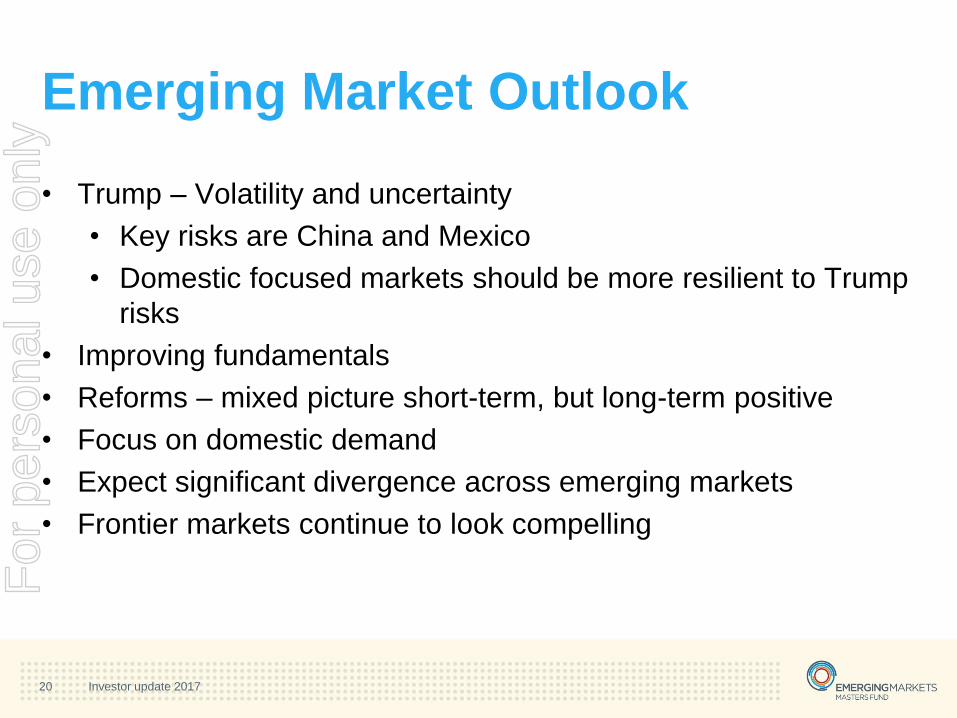
Emerging Market Outlook
• Trump – Volatility and uncertainty
• Key risks are China and Mexico
• Domestic focused markets should be more resilient to Trump
risks
• Improving fundamentals
• Reforms – mixed picture short-term, but long-term positive
• Focus on domestic demand
• Expect significant divergence across emerging markets
• Frontier markets continue to look compelling
20 Investor update 2017
For
per
sona
l use
onl
y

4. Appendix
For
per
sona
l use
onl
y

Portfolio
Fund31 Dec 2016
weight (%)
Glo
ba
l/R
eg
ion
al
BMO LGM Frontier Markets Fund 11.8%
Lazard Emerging Markets Fund 9.9%
Polunin Discovery Frontier Markets Fund 8.5%
Somerset Emerging Markets Dividend Growth Fund 8.0%
Arisaig Latin America Consumer Fund 4.8%
Arisaig Africa Consumer Fund 4.8%
Co
un
try
Steadview Capital Fund 14.1%
Wells Fargo China Equity Fund 9.4%
Cephei QFII China Absolute Return Fund 5.1%
APS China A-Share Fund 5.0%
Russian Prosperity Fund 5.0%
NCC China A-Share Fund 3.8%
Schroder International Emerging Europe Fund 3.6%
GBM Crecimiento Fund 3.5%
Brasil Capital Equity Fund 1.4%
Cash 1.1%
Total1 100.0%
Source: Walsh & Co AM
Notes:
1. Some figures may not reconcile due to rounding
Partnering with best-in-class EM specialist managers to build
a high quality, diversified portfolio
22 Investor update 2017
For
per
sona
l use
onl
y

Source: Walsh & Co. Asset Management
Notes:
1. Data are as at 31 December 2016, some figures may not reconcile due to rounding. 2. Active weights are relative to MSCI Emerging Markets Index. *
Excludes cash held by the underlying fund managers
24.2%
21.7%16.3%
15.9%
7.8%
5.8%
4.6%2.5% 1.1%
China
Frontier
India
Other
Russia
Mexico
Brazil
South Africa
Cash* -26.4%
-4.6%
-3.0%
-2.3%
1.1%
2.2%
3.3%
7.9%
21.7%
Other
South Africa
Brazil
China
Cash*
Mexico
Russia
India
Frontier
Portfolio – country weights
Country allocation1 Country active weights2
23 Investor update 2017
For
per
sona
l use
onl
y

Source: Walsh & Co. Asset Management
Notes:
1. Data are as at 31 December 2016, some figures may not reconcile due to rounding. 2. Active weights are relative to MSCI Emerging Markets
Index. * Excludes cash held by the underlying fund managers
-10.6%
-4.8%
-2.7%
-2.6%
-1.9%
-1.1%
-0.7%
1.1%
1.3%
2.4%
4.7%
14.9%
Information technology
Financials
Telecommunication…
Energy
Materials
Real estate
Utilities
Cash*
Consumer discretionary
Health care
Industrials
Consumer staples
22.1%
19.6%
12.6%
11.5%
10.5%
5.4%
5.3%
4.9%
3.2%2.2%
1.5%1.1%
Consumer staples
Financials
InformationtechnologyConsumerdiscretionaryIndustrials
Materials
Energy
Health care
TelecommunicationservicesUtilities
Real estate
Portfolio – sector weights
Sector allocation1 Sector active weights2
24 Investor update 2017
For
per
sona
l use
onl
y

Consumer exposure
25 Investor update 2017
For
per
sona
l use
onl
y
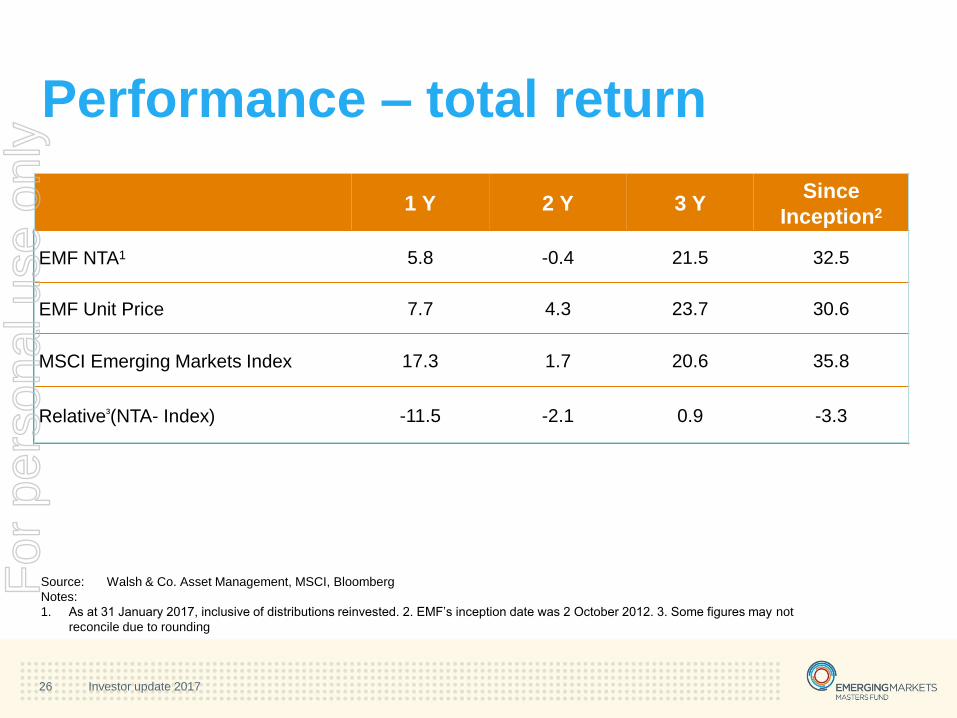
1 Y 2 Y 3 YSince
Inception2
EMF NTA1 5.8 -0.4 21.5 32.5
EMF Unit Price 7.7 4.3 23.7 30.6
MSCI Emerging Markets Index 17.3 1.7 20.6 35.8
Relative³(NTA- Index) -11.5 -2.1 0.9 -3.3
Source: Walsh & Co. Asset Management, MSCI, Bloomberg
Notes:
1. As at 31 January 2017, inclusive of distributions reinvested. 2. EMF’s inception date was 2 October 2012. 3. Some figures may not
reconcile due to rounding
Performance – total return
26 Investor update 2017
For
per
sona
l use
onl
y
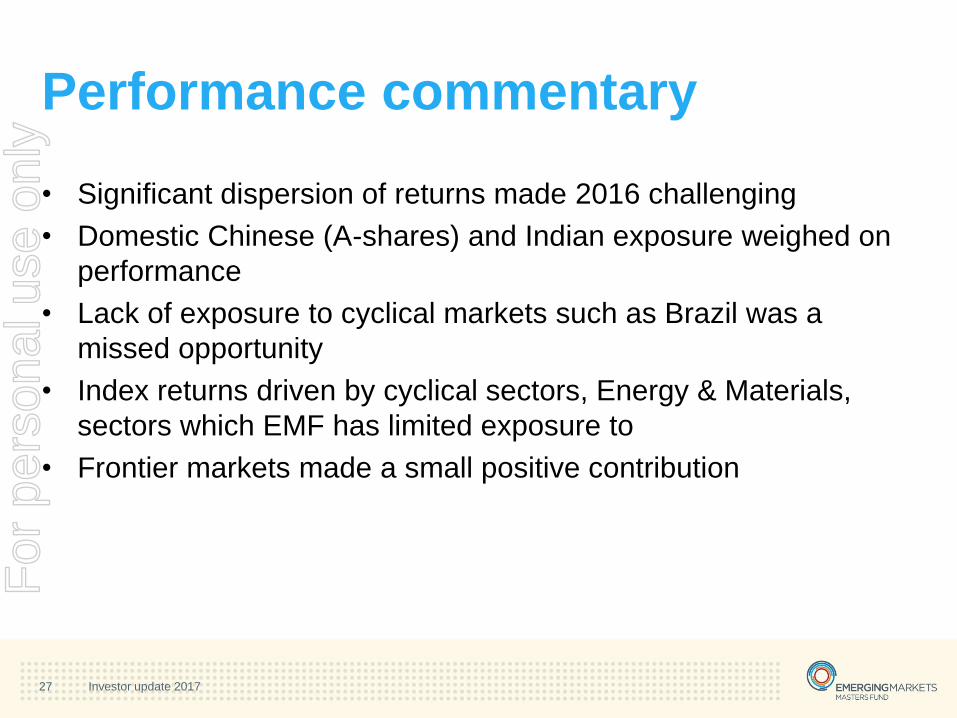
Performance commentary
• Significant dispersion of returns made 2016 challenging
• Domestic Chinese (A-shares) and Indian exposure weighed on
performance
• Lack of exposure to cyclical markets such as Brazil was a
missed opportunity
• Index returns driven by cyclical sectors, Energy & Materials,
sectors which EMF has limited exposure to
• Frontier markets made a small positive contribution
27 Investor update 2017
For
per
sona
l use
onl
y
Emerging Markets
Masters Fund
Contact
Adam Coughlan - Head of Distribution
T 02 8662 9792 | M 0418 653 560 | W walshandco.com.au
28 Investor update 2017
For
per
sona
l use
onl
y