for personal use only · 03/09/2014 · corporate overview about resolute mining limited key...
TRANSCRIPT

01
ASX ANNOUNCEMENT
3 September 2014
CHIEF EXECUTIVE OFFICER’S PRESENTATION AT AFRICA DOWN UNDER CONFERENCE Attached is a copy of the Chief Executive Officer’s presentation to be given at the Africa Down Under Conference.
GREG FITZGERALD Company Secretary
About Resolute: Resolute is an unhedged gold miner with two operating mines in Africa and Australia. The Company is one of the largest gold producers by volume listed on the ASX. Resolute’s flagship Syama project in Mali is on track for an increase in production to 270,000oz of gold a year following an approved expansion to be undertaken through FY2016. At its Ravenswood mine in Queensland Resolute is investigating a number of opportunities to add value by increasing gold production and lowering operating costs. In Ghana, the Company is now the owner and operator of the advanced Bibiani gold project where work is being undertaken on an underground feasibility study including a 20,000m drill program. The Company controls an extensive footprint along the highly prospective Syama Shear and Greenstone Belts in Mali and Cote d’Ivoire. Resolute has also identified a number of highly promising exploration targets at its Ravenswood operations and holds a number of exploration projects in Tanzania surrounding its now completed Golden Pride mine.
For
per
sona
l use
onl
y

AFRICA DOWN UNDERChief Executive Officer – Peter Sullivan3 September 2014F
or p
erso
nal u
se o
nly

Africa remains an attractive mining destination for Australian companies
• Hosts 30% of world mineral reserves and even higher proportion of deposits of Gold, Platinum, Bauxite, Diamonds and Manganese.
• Reported that <5% of the total global mineral exploration and extraction budget is invested in the Continent.
• Around 220 Australian exploration and mining companies operate in Africa, more than any other foreign region.
• Ghana, Tanzania, Mali, Guinea and Burkina Faso account for around 9% of world gold production.
• Opportunities for mining, resources and infrastructure companies are extensive.
But … the business risks also present challenges
• Many pitfalls remain to establishing and operating mining projects in African countries.
• Different countries have different levels of risk. Apart from political stability and regulatory frameworks, key challenges facing countries include inadequate data on minerals, capacity to monitor fiscal payments, planning and forecasting, funding etc.
Therefore … having experience in Africa is a valuable commodity
• Resolute is an established Australian miner in Africa with a proven and long term track record of development and production.
2
Why Africa?Opportunities, risks, experience…
For
per
sona
l use
onl
y

• One of the largest gold producers listed on the ASX
• Long term operator in Africa and Australia
• FY2015 guidance of 315,000oz at A$890/oz
• 100% unhedged, strong leverage to gold price
• Cash generating over wide range of gold price
• Pursuing organic growth opportunities
• Lightly geared balance sheet provides flexibility for capital management and future growth
3
A sustainable gold producerLong term operator in Africa and Australia
For
per
sona
l use
onl
y
4
Corporate overviewAbout Resolute Mining Limited
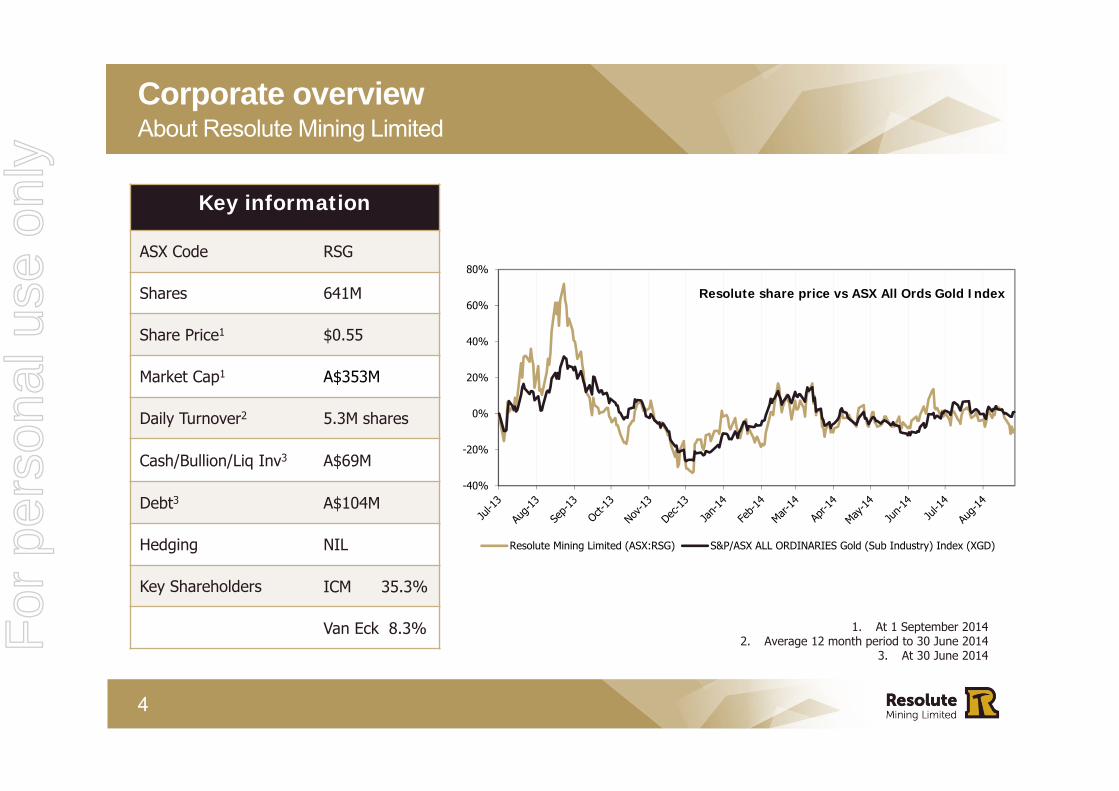
Key information
ASX Code RSG
Shares 641M
Share Price1 $0.55
Market Cap1 A$353M
Daily Turnover2 5.3M shares
Cash/Bullion/Liq Inv3 A$69M
Debt3 A$104M
Hedging NIL
Key Shareholders ICM 35.3%
Van Eck 8.3% 1. At 1 September 20142. Average 12 month period to 30 June 2014
3. At 30 June 2014
-40%
-20%
0%
20%
40%
60%
80%
Resolute share price vs ASX All Ords Gold Index
Resolute Mining Limited (ASX:RSG) S&P/ASX ALL ORDINARIES Gold (Sub Industry) Index (XGD)
For
per
sona
l use
onl
y
5
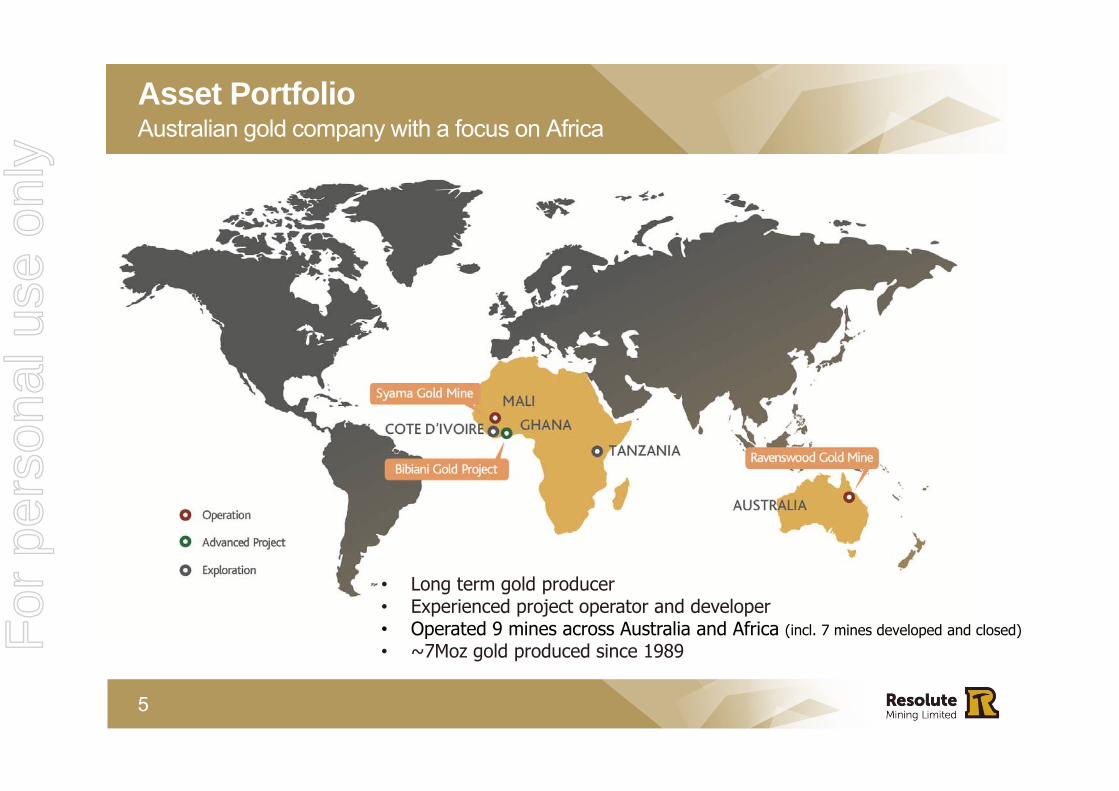
Asset PortfolioAustralian gold company with a focus on Africa
• Long term gold producer• Experienced project operator and developer• Operated 9 mines across Australia and Africa (incl. 7 mines developed and closed)• ~7Moz gold produced since 1989F
or p
erso
nal u
se o
nly

6
FY2014 in reviewFocus on cash │Solid financials through the gold cycle
• Operating versatility and cash generating, shows flexibility in a year of fluctuating gold price
• Revenue of $527M at average gold price received of A$1,413/oz (FY13: A$1,562/oz)
• Reported NPAT of $33M impacted by closure of Golden Pride and tighter profit margins
• Implementing modified mine plan for Syama, with reduced capital expenditure
• Ongoing commitment to capital management ensures strong financial position retained
• Over $104 million cash flow from operations in FY14, despite weaker gold price
Financial Highlights FY14
Gold production 342,774 oz
Cash Costs A$922/oz
Gold price received A$1,413/oz
Net profit after tax A$33.3M
Cash flow from operations A$104.7M
Cash/Bullion/Liq Inv A$69M
Net Assets A$699M
Gearing1 ~13%
1. Gearing = Debt / (Debt + Equity)For
per
sona
l use
onl
y

7
Growth strategyPursuing a range of opportunities in CY2015
Syama – Mali• Expansion project +78% complete• 70,000 oz/pa production lift to ~270,000oz/pa from 2015• Independent underground Pre-Feasibility Study increased reserves by 54%
Bibiani Gold Mine – Ghana• 90% ownership completed in June 2014, with Ghanaian Government to hold 10% • Feasibility study for an underground operation planned to be completed within 24
months, including 20,000m drill program to better understand the resource• 1.7Moz Mineral Resources, 3Mtpa CIL processing facility, and +4Moz of gold produced
to date
Underexplored tenure – Highly prospective• FY2015 exploration budget of $10m• Highly prospective, underexplored tenure across Mali, Cote d’Ivoire, Tanzania, Australia• Regional drill programs ongoing in Mali and Australia; exploration work at Cote d’Ivoire
For
per
sona
l use
onl
y

• Total Reserves and Resources 20%
• Reserves at +5Moz of gold:– 30% compared to FY13 after mining
depletion– 1.1Moz underground Reserve added to
Syama
– 46% to Mt Wright
• Resources 20% to 10.4Moz of gold– New 1.28Moz Resource at Buck Reef
West, Queensland– Bibiani underground Resource 1.7Moz
8
Reserves and Resources update30 June 2014
8.62 10.41
4.30
5.06
0
2
4
6
8
10
12
14
16
30 June 2013 30 June 2014
Gol
d co
ntai
ned
ounc
es (M
oz)
Total Mineral Resource and Ore Reserve
Mineral Resource Ore Reserve
For
per
sona
l use
onl
y

9
OPERATING PROJECTS
For
per
sona
l use
onl
y

10
SyamaA profitable, long life project
Key statistics
RSG ownership 80%
Commissioned 2009
Production ( FY14) 165,493 oz
Production grade 3.73 g/t
Cash costs ( FY14) US$922/oz
Mine life (30 Jun 14) 10+ years
Total reserves 3.2 Moz
Reserve grade 2.5 g/t
Total resources 3.5 Moz
Resource grade 2.3 g/t “A major expansion of Syama is underway and scheduled to be completed in early 2015.”F
or p
erso
nal u
se o
nly
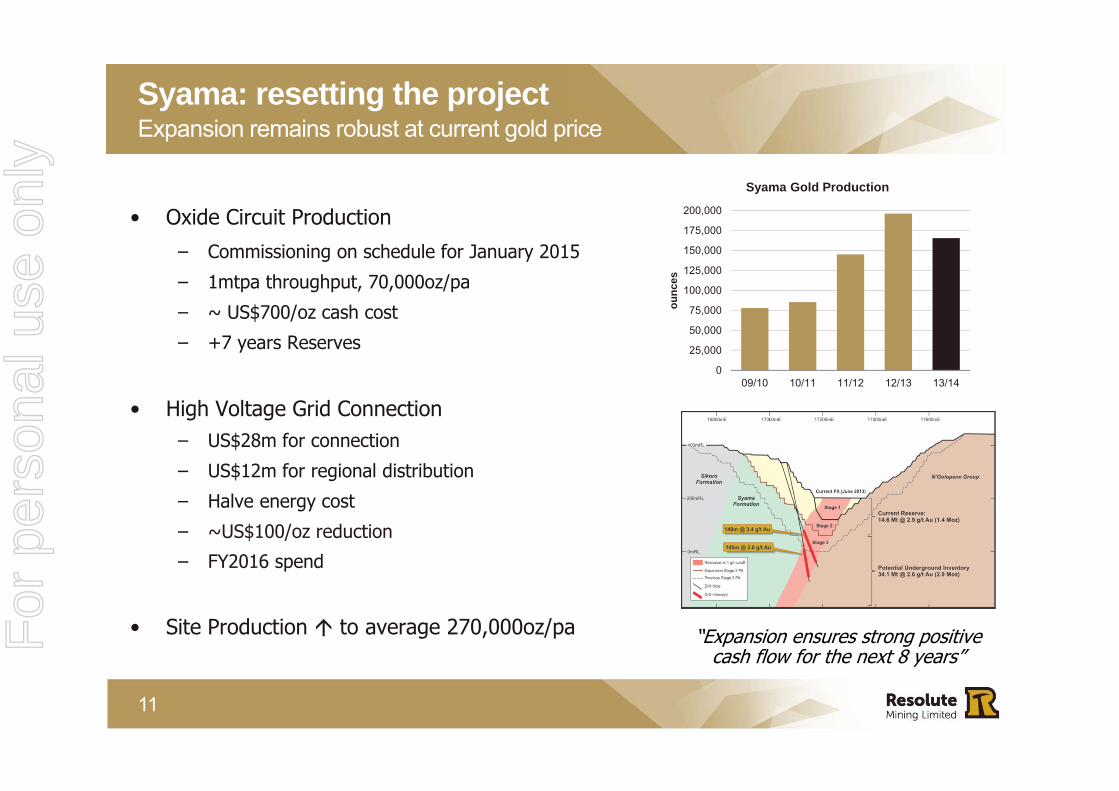
• Oxide Circuit Production
– Commissioning on schedule for January 2015
– 1mtpa throughput, 70,000oz/pa
– ~ US$700/oz cash cost
– +7 years Reserves
• High Voltage Grid Connection– US$28m for connection
– US$12m for regional distribution
– Halve energy cost
– ~US$100/oz reduction
– FY2016 spend
• Site Production to average 270,000oz/pa
11
Syama: resetting the projectExpansion remains robust at current gold price
“Expansion ensures strong positive cash flow for the next 8 years”
0
25,000
50,000
75,000
100,000
125,000
150,000
175,000
200,000
09/10 10/11 11/12 12/13 13/14
ounc
es
Syama Gold Production
For
per
sona
l use
onl
y

12
Syama at depthUnderground boosting ore reserves
• Pre-Feasibility Study increases ore reserves by 54% to 3.2Moz1
• Supports viable underground operation extending long term mine life at least 7 years beyond 2025
• Further 10,000m drilling through 2014 to upgrade and extend, results support premise
– 55m @ 3.17g/t Au (from 398m) in SYRD388
– 39m @ 3.51 g/t Au (from 454m) in SYDD396
• Definitive feasibility study to commence 2015
1 As announced 28 March 2014
“Underground reserves support long term high volume, low cost production at this world class gold mine”F
or p
erso
nal u
se o
nly

13
RavenswoodStable, long-term production
Key statistics
RSG ownership 100%
Commissioned 2004
Production (FY14) 139,291 oz
Production grade 2.75 g/t
Cash costs (FY14) A$832/oz
Mine life (30 Jun 14) 10+ years
Total reserves 1.4 Moz
Reserve grade 0.9 g/t
Total resources 3.0 Moz
Resource grade 0.9 g/t
For
per
sona
l use
onl
y

• Ore production consistent 1.4Mtpa from sub-level shrinkage
• Grade dilution well within expectation
• 46% increase to Mt Wright ore reserve1
– Mining to extend below 600RL base
– Additional 1.7Mt of ore, 137,000oz gold extending mine life to Sep 20161
• Exploration drilling continues, seeking further mineralisation extension
14
Ravenswood: Mt Wright Mine deliveringExtended mine life
1 As announced 20 February 2014
0
25,000
50,000
75,000
100,000
125,000
150,000
09/10 10/11 11/12 12/13 13/14
ounc
es
Ravenswood Gold Production
For
per
sona
l use
onl
y

15
Ravenswood: Beyond Mt WrightNew resource provides potential extension to Ravenswood
Buck Reef West• New 1.3Moz gold resource defined1
• Opportunity for a larger scale open pit
• Reserves close to Ravenswood processing facility
• Scoping study commenced to assess open pit mining schedule options, maximise resource conversion, minimise capital using existing processing and tailings storage facilities
Re-opening Sarsfield
• Potential to re-opening Sarsfield pit:‒ Reserve/Resources of 2.5Moz
‒ Additional 110kozpa output
‒ 9 year mine life extension
• Feasibility Study estimated capital cost of $123M and LOM average cash costs of $1106/oz
• Opportunities to improve returns being examined
1 As announced 20 June 2014
For
per
sona
l use
onl
y

• Closure of Golden Pride end of 2013 after 15 years in production
• Rehabilitation well advanced as progressively undertaken since commencement
• Spend of ~US$5M to complete
• Demolition of treatment plant completed
• Handover to Government planned Dec 2014
16
Golden PrideEnd of a long mine life
Key statistics
RSG ownership 100%
Commissioned 1998
Production (FY14) 37,989 oz
Production grade 0.89 g/t
Cash costs (FY14) US$814/oz
Total Mine Life 15 years
Total Production 2.2 Moz
For
per
sona
l use
onl
y

17
DEVELOPMENT PROJECTS
For
per
sona
l use
onl
y

18
BibianiAdvanced Ghana gold project
• Advanced gold project in West Africa:‒ 1.7Moz Mineral Resources
‒ 3Mtpa CIL processing facility
‒ +4Moz historic production
• Fully developed site, recommencing production primarily a mine planning exercise
• 90% ownership completed in June 2014, with Ghanaian Government to hold 10%, in line with Ghanaian Mining code
• Feasibility study for an underground operation:‒ Planned completion within 24 months
‒ 20,000m drill program to better delineate and enhance the underground resourceF
or p
erso
nal u
se o
nly

19
Bibiani Underground Mineral Resource
Category Tonnes Grade Ounces
Indicated 7.6 Mt 3.4 g/t 0.8 Moz
Inferred 7.7 Mt 3.5 g/t 0.9 Moz
Total 15.3 Mt 3.4 g/t 1.7 Moz
• Bibiani Resource at >2.0 g/t Au Cut-off
• Coffey Mining Resource Study (June 2012)
• JORC 2004 Compliant Resource
• Coffey Mining are internationally recognised mining consultants
• Validation of resource model data indicates the process complies with Industry standards F
or p
erso
nal u
se o
nly

20
Bibiani Feasibility Drilling
Surface drilling target (South Hill)
Underground drilling target (Central Panel)
Surface drilling target (Main Pit North & Big Mug)
• Historic underground workings over 2.0km strike length and 800m depth, reported 2.0Mozs @ 9.5g/t recovered
• Decline for mechanised equipment down 200m beneath pit with 500m total development strike length
• Drilling to infill and test depth and strike extensions
For
per
sona
l use
onl
y
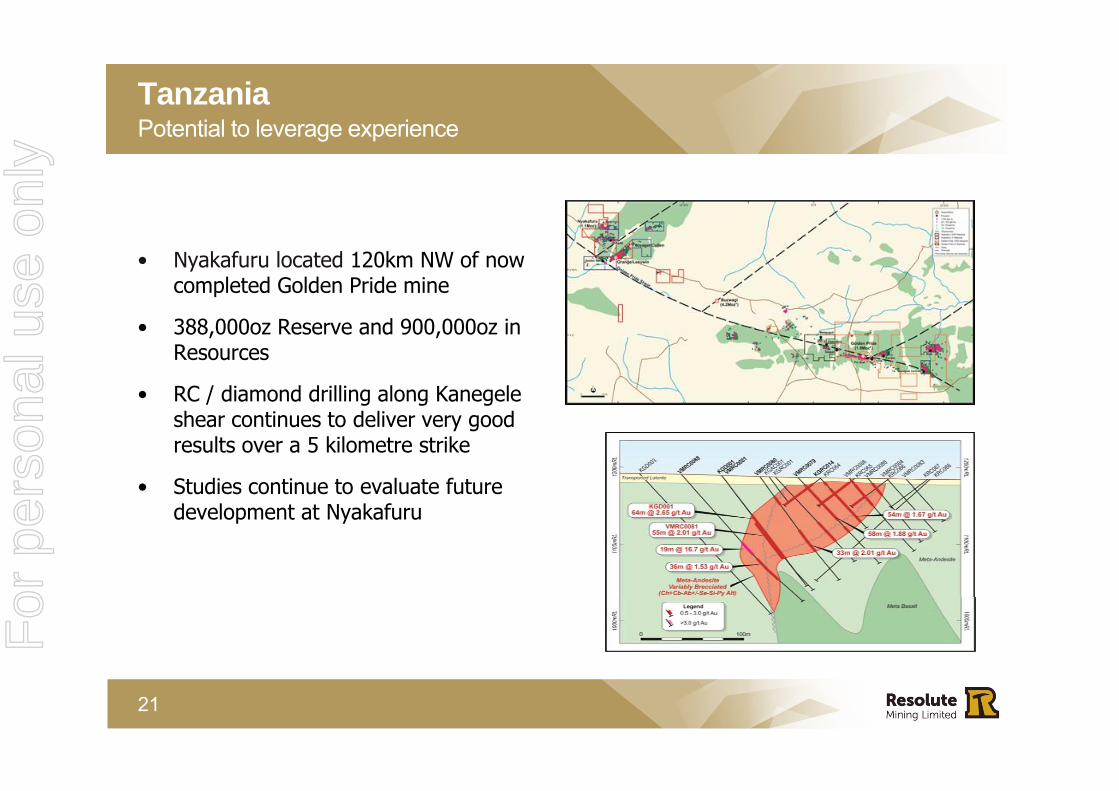
• Nyakafuru located 120km NW of now completed Golden Pride mine
• 388,000oz Reserve and 900,000oz in Resources
• RC / diamond drilling along Kanegele shear continues to deliver very good results over a 5 kilometre strike
• Studies continue to evaluate future development at Nyakafuru
21
TanzaniaPotential to leverage experience
For
per
sona
l use
onl
y

• Highly prospective, underexplored tenure spread across Mali, Cote d’Ivoire, Tanzania and Australia
• Strong balance sheet enables renewed exploration focus to unlock value and add exploration premium
• Exploration budget for FY15 US$10M
• Multiple high quality targets close to existing infrastructure at Syama in Mali and Ravenswood in Queensland
• Drilling currently ongoing in Mali, Cote d’Ivoire and Australia
22
High value exploration portfolioProspective upside
“Resolute is exploring more than 13,500km2 of prospective tenure across three countries in Africa”
Syama regional exploration
For
per
sona
l use
onl
y

23
OUTLOOK
For
per
sona
l use
onl
y

24
Strategic focus
• Production growth and extension‒ Syama sulphide and oxide to 270koz pa ‒ Bibiani step change to production profile‒ Syama underground extension- current
+1Moz Reserve‒ Ravenswood extension - Buck Reef West,
Nolans East and Sarsfield open pits
• Retain focus on costs‒ Syama grid power
• Strong operating cash flow to fund activities
• Robust balance sheet
0
100,000
200,000
300,000
400,000
500,000
600,000
FY14 FY15 FY16 FY17
ounc
es
Resolute Production Potential
Golden Pride Syama Mt Wright Bibiani
with Bibianiopportunity
Current producing mines
For
per
sona
l use
onl
y

25
Flexibility for future growthA sustainable gold producer
• One of the largest gold producers listed on the ASX
• Long-term operator in Africa and Australia
• FY2015 guidance of 315,000oz at $890/oz
• 100% unhedged – strong leverage to gold price
• Cash generating over wide range of gold prices
• Growth opportunities
For
per
sona
l use
onl
y

Thank you
rml.com.au
DISCLAIMER• This presentation includes certain statements, estimates and projections with respect to the future performances
of Resolute Mining. Such statements, estimates and projections reflect various assumptions concerning anticipated results, which assumptions may prove not to be correct. The projections are merely estimates by Resolute Mining, of the anticipated future performance of Resolute Mining’s business based on interpretations of existing circumstances, and factual information and certain assumptions of economic results, which may prove to be incorrect. Such projections and estimates are not necessarily indicative of future performance, which may be significantly less favourable than as reflected herein. Accordingly, no representations are made as to the fairness, accuracy, correctness or completeness of the information contained in this presentation including estimates or projections and such statements, estimates and projections should not be relied upon as indicative of future value, or as a guarantee of value of future results. This presentation does not constitute an offer, invitation or recommendation to subscribe for or purchase securities in Resolute Mining Limited.
• The information in this report that relates to the Exploration Results, Mineral Resources and Ore Reserves is based on information compiled by Mr Richard Bray who is a Registered Professional Geologist with the Australian Institute of Geoscientists and Mr Andrew Goode, a member of The Australasian Institute of Mining and Metallurgy. Mr Richard Bray and Mr Andrew Goode both have more than 5 years’ experience relevant to the styles of mineralisation and type of deposit under consideration and to the activity which they are undertaking to qualify as a Competent Person, as defined in the 2012 Edition of the “Australasian Code for Reporting of Exploration Results, Mineral Resources and Ore Reserves”. Mr Richard Bray and Mr Andrew Goode are full time employees of Resolute Mining Limited Group and each hold equity securities in the Company. They have consented to the inclusion of the matters in this report based on their information in the form and context in which it appears. This information was prepared and first disclosed under the JORC Code 2004. Except where noted, it has not been updated since to comply with the JORC Code 2012 on the basis that the information has not materially changed since it was last reported.
• In providing this presentation, Resolute Mining has not considered the objectives, financial position or the needs of the recipient. The recipient should obtain and rely on its own financial advice from its tax legal accounting and other professional advisers in respect of the recipients objectives financial position and needs. To the maximum extent permitted by law neither Resolute Mining nor its related corporations ,directors, employees or agents nor any other person accepts liability for any loss arising from the use of this presentation or its contents or otherwise arising in connection with it. You represent and confirm by attending and or retaining this presentation that you accept the above conditions.
For
per
sona
l use
onl
y

27
JORC Reserves RESOLUTE GROUP RESERVES and RESOURCES
Reserves and Resources comply with the Australian code for reporting of Mineral Resources and Reserves (The JORC Code 2004 and JORC Code 2012)
Reserves and Resources Statement as at 30 June 2014 As at 30 June 2013
Gold Reserves Gold Project Group Group Gold Project Group Group
(includes stockpiles) Project grade Contained Share Share Project grade Contained Share Share
Tonnes (g/t) Ounces % Ounces Tonnes (g/t) Ounces % Ounces
RESERVES RESERVES Comments on Differences
Reserves ( Proved) Reserves ( Proved) Australia
Mt Wright (insitu)3 2,655,000 2.7 226,000 100% 226,000 3,271,000 2.8 290,000 100% 290,000 Depletion due to annual production offset by reserve extension (February 2014) - JORC 2012
Sarsfield (insitu)2 28,450,000 0.8 747,000 100% 747,000 28,450,000 0.8 747,000 100% 747,000 No change
Mali
Syama (insitu) 9,026,000 2.9 856,000 80% 685,000 11,191,000 3.0 1,077,000 80% 862,000 Depletion due to annual production
Stockpiles 196,000 3.2 20,000 80% 16,000 249,000 2.6 21,000 80% 17,000 Movement in operating stockpiles
Syama Satellites (insitu) 3,122,000 2.2 224,000 80% 179,000 3,122,000 2.2 224,000 80% 179,000 No change
Tabakoroni (insitu) 1,335,000 3.1 133,000 85% 113,000 1,335,000 3.1 133,000 51% 68,000 Increase in Group share due to ownership change
Total (Proved) 44,784,000 1.5 2,206,000 1,966,000 47,618,000 1.6 2,492,000 2,163,000 Decrease in Proven Reserves mainly due to MTW & Syama annual production
Reserves ( Probable) Reserves ( Probable)
Australia
Mt Wright (insitu)3 626,000 1.8 37,000 100% 37,000 0 0.0 0 100% 0 Reserve extension (February 2014) - JORC 2012
Mt Wright Stockpiles3 9,000 2.5 1,000 100% 1,000 60,000 2.9 6,000 100% 6,000 Movement in operating stockpiles - JORC 2012
Sarsfield (insitu)2 18,640,000 0.7 423,000 100% 423,000 18,640,000 0.7 423,000 100% 423,000 No change
Mali
Syama (insitu) 2,955,000 2.6 243,000 80% 194,000 3,439,000 2.6 288,000 80% 230,000 Depletion due to annual production
Syama UG (insitu)5 14,296,000 2.4 1,103,000 80% 882,000 0 0.0 0 80% 0 Additional reserves from UG Pre-Feasibility (March 2014) - JORC 2012
Stockpiles 2,627,000 1.9 157,000 80% 126,000 2,199,000 1.9 136,000 80% 109,000 Movement in operating stockpiles
Syama Satellites (insitu) 4,986,000 2.1 337,000 80% 270,000 4,986,000 2.1 337,000 80% 270,000 No change
Tabakoroni (insitu) 1,821,000 2.8 163,000 85% 139,000 1,821,000 2.8 163,000 51% 83,000 Increase in Group share due to ownership change
Tanzania
Nyakafuru JV (insitu)2 7,360,000 1.6 388,000 98% 380,000 7,360,000 1.6 388,000 98% 380,000 No change
Golden Pride (insitu) 0 0.0 0 100% 0 480,000 2.0 30,000 100% 30,000 Depletion due to annual production - Operation closed 2014
Golden Pride Stockpiles 0 0.0 0 100% 0 1,264,000 0.9 37,000 100% 37,000 Depletion due to annual production - Operation closed 2014
Total (Probable) 53,320,000 1.7 2,852,000 2,452,000 40,249,000 1.4 1,808,000 1,567,000 Increase in Probable Reserves mainly from Syama Underground and MTW
Proved and Probable 98,104,000 1.6 5,058,000 4,418,000 87,867,000 1.5 4,300,000 3,730,000 Increase in Reserves exceeds the 401koz. 2013/14 production depletion
For
per
sona
l use
onl
y

28
JORC Measured & Indicated ResourcesGold Resources 1 Gold Project Group Group Gold Project Group Group
(includes stockpiles) Project grade Contained Share Share Project grade Contained Share Share
Tonnes (g/t) Ounces % Ounces Tonnes (g/t) Ounces % Ounces
RESOURCES 1 RESOURCES 1 Comments on Differences
Resources (Measured) Resources (Measured)
Australia
Mt Wright (insitu)3 281,000 2.9 26,000 100% 26,000 0 0.0 0 100% 0 Upgrading of Resources from Indicated and Inferred - JORC 2012.
Stockpiles (Mt Wright) 42,000 2.1 3,000 100% 3,000 0 0.0 0 100% 0 Movement in operating stockpiles
Sarsfield (insitu)2 16,185,000 0.8 393,000 100% 393,000 16,185,000 0.8 393,000 100% 393,000 No change
Buck Reef West (insitu) 2 17,857,000 1.1 598,000 100% 598,000 0 0.0 0 0% 0 New Resource identified at Ravenswood (June 2014) - JORC 2012
Mali
Syama (insitu) 6,900,000 2.4 525,000 80% 420,000 14,769,000 2.6 1,256,000 80% 1,005,000 Resources converted to Reserves
Syama Satellites (insitu) 1,051,000 1.7 56,000 80% 45,000 1,051,000 1.7 56,000 80% 45,000 No change
Tabakoroni (insitu) 996,000 2.7 87,000 85% 74,000 996,000 2.7 87,000 60% 52,000 Increase in Group share due to ownership change
Tanzania
Golden Pride (insitu) 3,786,000 2.0 238,000 100% 238,000 3,786,000 2.0 238,000 100% 238,000 No change
Total (Measured) 47,098,000 1.3 1,926,000 1,797,000 36,787,000 1.7 2,030,000 1,733,000 Increase in Measured Resources mainly due to new resources offset by conversion to Reserves
Resources (Indicated) Resources (Indicated)
Australia
Mt Wright (insitu)3 290,000 2.8 26,000 100% 26,000 604,000 3.2 63,000 100% 63,000 Resources converted to Reserves (February 2014) - JORC 2012
Sarsfield (insitu)2 20,384,000 0.7 444,000 100% 444,000 20,384,000 0.7 444,000 100% 444,000 No change
Buck Reef West (insitu) 2 11,582,000 0.9 323,000 100% 323,000 0 0.0 0 0% 0 New Resource identified at Ravenswood (June 2014) - JORC 2012
Mali
Syama (insitu) 12,482,000 2.9 1,153,000 80% 922,000 19,285,000 2.6 1,595,000 80% 1,276,000 Resources converted to Reserves
Stockpiles 4,069,000 1.4 177,000 80% 142,000 3,774,000 1.3 164,000 80% 131,000 Movement in operating stockpiles
Syama Satellites (insitu) 4,840,000 1.9 288,000 80% 231,000 4,840,000 1.9 288,000 80% 231,000 No change
Tabakoroni (insitu) 2,674,000 2.6 224,000 85% 190,000 2,674,000 2.6 224,000 60% 134,000 Increase in Group share due to ownership change
Tanzania
Golden Pride (insitu) 6,744,000 1.8 401,000 100% 401,000 6,744,000 1.8 401,000 100% 401,000 No change
Nyakafuru JV (insitu)2 19,067,000 1.1 672,000 95% 638,000 19,067,000 1.1 672,000 95% 638,000 No change
Ghana
Bibiani (insitu)4 7,629,000 3.4 834,000 90% 751,000 0 0.0 0 0% 0 New Project - Coffey 2012 study (Refer to Table 1)
Total (Indicated) 89,761,000 1.6 4,542,000 4,067,000 77,372,000 1.5 3,851,000 3,318,000 Increase Indicated Resources mainly due to new resources and New Project
Measured and Indicated 136,859,000 1.5 6,468,000 5,860,000 114,159,000 1.6 5,881,000 5,051,000 Increase in Resources due to New project and new resources offset by conversions to Reserves
For
per
sona
l use
onl
y

29
JORC Inferred Resources
Gold Resources 1 Gold Project Group Group Project Group Group
(includes stockpiles) Project grade Contained Share Share
Project Gold grade Contained Share Share
Tonnes (g/t) Ounces Gold % Ounces
Tonnes (g/t) Ounces % Ounces Comments on Differences
Resources (Inferred) Resources (Inferred)
Australia
Mt Wright (insitu)3 967,000 3.1 95,000 100% 95,000 1,090,000 3.1 108,000 100% 108,000 Resources converted
Sarsfield (insitu) 2 22,192,000 0.7 521,000 100% 521,000 22,192,000 0.7 521,000 100% 521,000 No change
Buck Reef West (insitu) 2 12,360,000 0.9 356,000 100% 356,000 0 0.0 0 0% 0 New Resource identified at Ravenswood (June 2014) - JORC 2012
Welcome Breccia (insitu) 2,036,000 3.2 208,000 100% 208,000 2,036,000 3.2 208,000 100% 208,000 No change
Mali
Syama (insitu) 3,403,000 2.3 249,000 80% 199,000 3,425,000 2.3 251,000 80% 201,000 Resources converted
Syama Satellites (insitu) 6,946,000 2.1 479,000 80% 383,000 6,946,000 2.1 479,000 80% 383,000 No change
Tabakoroni (insitu) 3,132,000 2.2 219,000 85% 186,000 3,132,000 2.2 219,000 60% 131,000 Increase in Group share due to ownership change
Tanzania
Golden Pride (insitu) 12,945,000 1.7 724,000 100% 724,000 12,945,000 1.7 724,000 100% 724,000 No change
Nyakafuru JV (insitu) 2 6,312,000 1.1 227,000 90% 204,000 6,312,000 1.1 227,000 90% 204,000 No change
Ghana
Bibiani (insitu)4 7,667,000 3.5 866,000 90% 779,000 0 0.0 0 0% 0 New Project - Coffey 2012 study (Refer to Table 1)
Total (Inferred) 77,960,000 1.6 3,944,000 3,655,000
58,078,000 1.5 2,737,000 2,480,000
Increase in Inferred Resources mainly due to new resources and New Project
Total Resources 214,819,000 1.5 10,412,000 9,519,000 172,237,000 1.6 8,618,000 7,531,000 Increase in Resources due to New project and new resources offset by conversions to Reserves
1) Mineral resources are exclusive of the Reserves - differences may occur due to rounding.
2) All Resources and Reserves are reported above 1.0 g/t cut-off except Nyakafuru and Buck Reef West above 0.5 g/t cut off and Sarsfield above 0.4 g/t cut off.
3) Mt Wright Reserves are reported above 2.3 g/t cut off and Resources above 1.8 g/t cut off.
4) Bibiani Resources quoted above a 2.0 g/t cut off.
5) Syama Underground Reserves quoted above a 1.8 g/t cut off. For
per
sona
l use
onl
y