for online publication - booth school of business/media/10ffae54ff474a879682730b... · we obtain...
TRANSCRIPT
1
For Online Publication
Internet Appendix for “The Effect of Regulatory Harmonization on Cross-border Labor
Migration: Evidence from the Accounting Profession”
This appendix provides supplemental discussion and analysis for our manuscript “The Effect of
Regulatory Harmonization on Cross-border Labor Migration: Evidence from the Accounting
Profession.” We summarize the content as follows:
Section IA1: Quotes Regarding Labor Mobility from Comment Letters to the European
Commission’s Consultation on the Impact of IAS Regulation in the EU
Section IA2: Differences between National Audit Standards and ISA
Section IA3: Distribution of Key Characteristics for Treatment and Control Groups
Section IA4: Descriptive Statistics on Mobility by Country
Section IA5: Mobility Trends for Extended Period from 1998 to 2013
Section IA6: Assessing Alternative Explanations
Section IA7: Correlation in Country-level Migration In- and Outflows
Section IA8: Double-Matched Legal Professionals and Business People
Section IA9: Cross-Sectional Variation in the Treatment Effect
2
Section IA1: Quotes Regarding Labor Mobility from Comment Letters to the European
Commission’s Consultation on the Impact of IAS Regulation in the EU
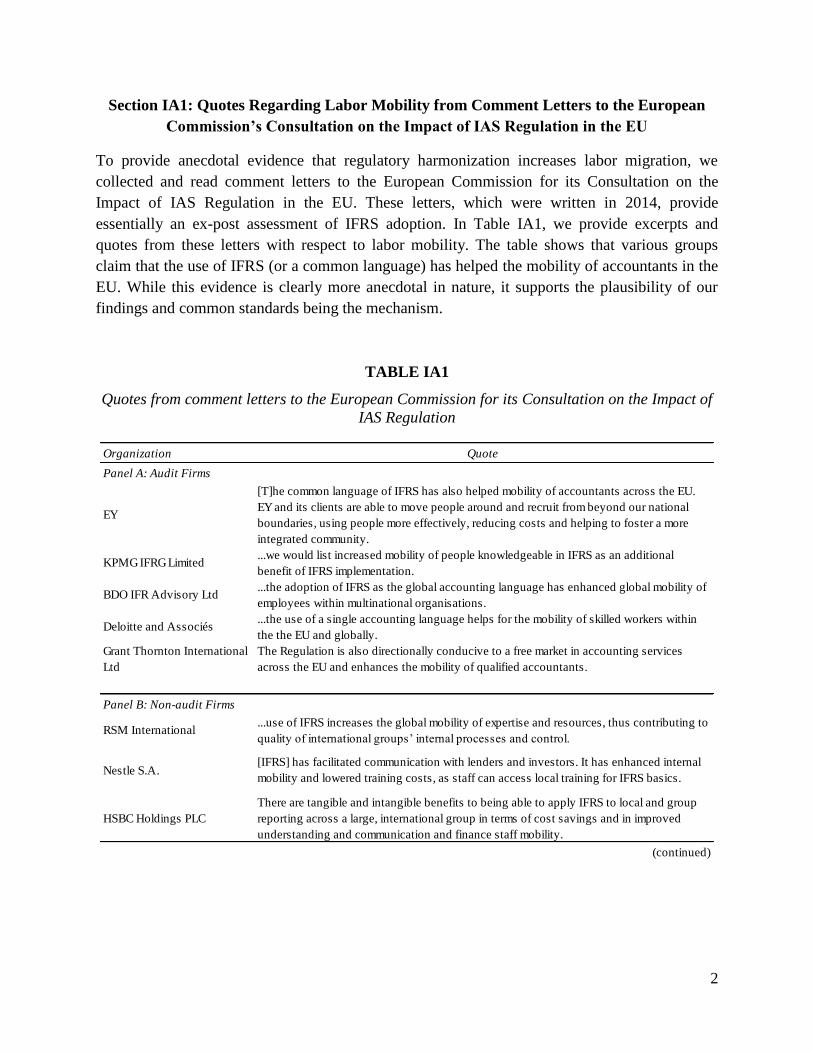
To provide anecdotal evidence that regulatory harmonization increases labor migration, we
collected and read comment letters to the European Commission for its Consultation on the
Impact of IAS Regulation in the EU. These letters, which were written in 2014, provide
essentially an ex-post assessment of IFRS adoption. In Table IA1, we provide excerpts and
quotes from these letters with respect to labor mobility. The table shows that various groups
claim that the use of IFRS (or a common language) has helped the mobility of accountants in the
EU. While this evidence is clearly more anecdotal in nature, it supports the plausibility of our
findings and common standards being the mechanism.
TABLE IA1
Quotes from comment letters to the European Commission for its Consultation on the Impact of
IAS Regulation
Organization Quote
Panel A: Audit Firms
EY
[T]he common language of IFRS has also helped mobility of accountants across the EU.
EY and its clients are able to move people around and recruit from beyond our national
boundaries, using people more effectively, reducing costs and helping to foster a more
integrated community.
KPMG IFRG Limited ...we would list increased mobility of people knowledgeable in IFRS as an additional
benefit of IFRS implementation.
BDO IFR Advisory Ltd...the adoption of IFRS as the global accounting language has enhanced global mobility of
employees within multinational organisations.
Deloitte and Associés ...the use of a single accounting language helps for the mobility of skilled workers within
the the EU and globally.
Grant Thornton International
Ltd
The Regulation is also directionally conducive to a free market in accounting services
across the EU and enhances the mobility of qualified accountants.
Panel B: Non-audit Firms
RSM International ...use of IFRS increases the global mobility of expertise and resources, thus contributing to
quality of international groups’ internal processes and control.
Nestle S.A.[IFRS] has facilitated communication with lenders and investors. It has enhanced internal
mobility and lowered training costs, as staff can access local training for IFRS basics.
HSBC Holdings PLC
There are tangible and intangible benefits to being able to apply IFRS to local and group
reporting across a large, international group in terms of cost savings and in improved
understanding and communication and finance staff mobility.
(continued)

3
TABLE IA1 (continued)
Table IA1 presents selected quotes from comment letters sent to the European Commission for its Consultation on the Impact of
IAS Regulation. The comment period began in August 2014 and ended in November 2014 (i.e., more than eight years after IFRS
became mandatory). All selected quotes are from qualitative responses to the open ended question no. 19: “Do you see other
benefits from applying IFRS as required under the IAS Regulation?”
ACCA
…the development of IFRS as the single accounting language, has permitted greater
mobility for accounting staff between companies and between countries. It has also
allowed for easier and improved training and education of accountants.
FEE – Federation of European
Accountants
FEE believes that the use of international standards increases the mobility of expertise and
resources across different jurisdictions.
Financial Accounting and
Reporting Special Interest
Group (FARSIG
There is a major advantage in providing global education in accounting across EU
universities and also in facilitating training of professional accountants across the EU, all
of which is consistent with the EU aims of mobility of labour.
100 Group of Finance
Directors
...the adoption of a single accounting language [i.e., IFRS] by listed companies has
improved the mobility of finance professionals across the EU.
International Swaps and
Derivatives Association Inc
(ISDA)
It has also significantly increased the transferability and career mobility of accountants
and other finance professionals across the EU and globally by providing them with a
common language applicable for financial reporting of all EU companies.
Panel C: Organizations of Auditors or Finance Professionals
4
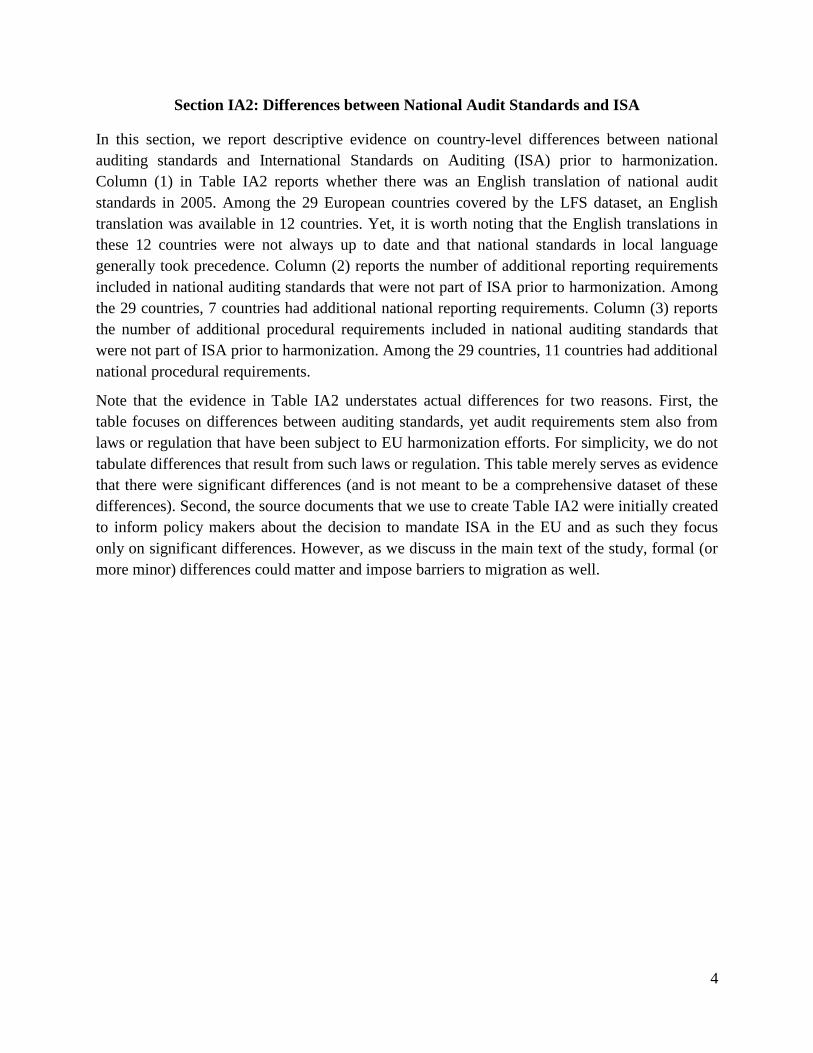
Section IA2: Differences between National Audit Standards and ISA
In this section, we report descriptive evidence on country-level differences between national
auditing standards and International Standards on Auditing (ISA) prior to harmonization.
Column (1) in Table IA2 reports whether there was an English translation of national audit
standards in 2005. Among the 29 European countries covered by the LFS dataset, an English
translation was available in 12 countries. Yet, it is worth noting that the English translations in
these 12 countries were not always up to date and that national standards in local language
generally took precedence. Column (2) reports the number of additional reporting requirements
included in national auditing standards that were not part of ISA prior to harmonization. Among
the 29 countries, 7 countries had additional national reporting requirements. Column (3) reports
the number of additional procedural requirements included in national auditing standards that
were not part of ISA prior to harmonization. Among the 29 countries, 11 countries had additional
national procedural requirements.
Note that the evidence in Table IA2 understates actual differences for two reasons. First, the
table focuses on differences between auditing standards, yet audit requirements stem also from
laws or regulation that have been subject to EU harmonization efforts. For simplicity, we do not
tabulate differences that result from such laws or regulation. This table merely serves as evidence
that there were significant differences (and is not meant to be a comprehensive dataset of these
differences). Second, the source documents that we use to create Table IA2 were initially created
to inform policy makers about the decision to mandate ISA in the EU and as such they focus
only on significant differences. However, as we discuss in the main text of the study, formal (or
more minor) differences could matter and impose barriers to migration as well.

5
TABLE IA2
National auditing standards versus ISA
Table IA2 presents descriptive statistics at the country level on the differences between national auditing standards and ISA prior
to regulatory harmonization. Column (1) indicates countries with an English translation of national auditing standards in 2005.
We obtain data on the language of national audit standards from answers to IFAC’s Compliance Program Responses and Action
Plans (Section 9A). Column (2) [(3)] reports the number of significant reporting [procedural] requirements in national auditing
standards that do not exist in International Auditing Standards. We cannot publicly reveal the source of the data in Columns (2)
and (3) for contractual reasons but have identified the source to the Editor in compliance with JAR’s data policy.
English in 2005?
Yes=1
No.of Significant
Additional National
Reporting in 2003
No. of Significant
Additional National
Procedures in 2003
(1) (2) (3)
Austria 0 0 0
Belgium 0 1 0
Bulgaria 1 0 0
Cyprus 1 0 0
Czech Republic 1 0 3
Denmark 0 0 7
Estonia 1 0 0
Finland 1 0 0
France 0 0 0
Germany 0 4 8
Greece 0 0 2
Hungary 0 0 0
Iceland 1 0 0
Ireland 1 2 10
Italy 0 0 6
Latvia 1 0 0
Lithuania 0 0 0
Luxembourg 0 0 0
Netherlands 0 1 12
Norway 0 0 0
Poland 0 1 5
Portugal 0 1 2
Romania 1 0 0
Slovakia 1 0 0
Slovenia 1 0 0
Spain 0 0 0
Sweden 0 0 0
Switzerland 0 0 1
United Kingdom 1 2 10
Country

6
Section IA3: Distribution of Key Characteristics for Treatment and Control Groups
In Table IA3, we provide descriptive statistics for key characteristics of the individuals in the
treatment group (accounting professionals) and the control groups (legal professionals, all
professionals and business people). The statistics are based on the raw number of survey
respondents in the LFS dataset who are between 20 and 59 years old over the sample period
(years 2002 to 2004 and 2008 to 2010, respectively). The LFS dataset provides information from
29 European countries. The final sample comprises a subset of 26 countries (see Table 1 for
further details).
TABLE IA3
Distribution of key demographic characteristics for treatment and control groups
The LFS dataset provides information on the gender of the survey respondents (item SEX).
The LFS dataset provides information on the age (measured in bins of 5 years) of the survey respondents (item AGE).
Panel A: Gender
Obs. Share Obs. Share Obs. Share Obs. Share
Male 53,314 50% 19,915 50% 261,759 44% 478,454 64%
Female 52,626 50% 19,565 50% 339,223 56% 269,859 36%
Total 105,940 100% 39,480 100% 600,982 100% 748,313 100%
GenderAccountants Legal pros All pros Biz people
Panel B: Age
Obs. Share Obs. Share Obs. Share Obs. Share
20-24 4,572 4% 788 2% 20,344 3% 27,608 4%
25-29 13,762 13% 4,894 12% 69,734 12% 64,112 9%
30-34 17,049 16% 7,255 18% 86,222 14% 93,097 12%
35-39 17,816 17% 7,319 19% 91,212 15% 118,186 16%
40-44 16,469 16% 6,358 16% 91,532 15% 127,704 17%
45-49 14,196 13% 5,243 13% 89,746 15% 123,035 16%
50-54 12,026 11% 4,361 11% 85,253 14% 109,032 15%
55-59 10,050 9% 3,262 8% 66,939 11% 85,539 11%
Total 105,940 100% 39,480 100% 600,982 100% 748,313 100%
AgeAccountants Legal pros All pros Biz people

7
TABLE IA3 (continued)
The LFS dataset provides information on the marital status of the survey respondents (item MARSTAT).
The LFS dataset provides information on the number of children (aged less than 15 years) in the household of the survey
respondents based on the items QHHNUM (serial number of household), HHLINK (relationship to reference person in
household), and AGE.
The LFS dataset provides information on the highest level of education that the survey respondent obtained (item
HATLEVEL). This item is based on the International Standard Classification of Education (ISCED) from 1997.
Panel C: Marital status
Obs. Share Obs. Share Obs. Share Obs. Share
Divorced 8,312 8% 2,480 6% 47,773 8% 63,647 9%
Single 36,060 34% 14,043 36% 199,718 33% 193,849 26%
Married 61,526 58% 22,941 58% 353,100 59% 490,579 66%
Missing 42 0% 16 0% 391 0% 238 0%
Total 105,940 100% 39,480 100% 600,982 100% 748,313 100%
Marital
status
Accountants Legal pros All pros Biz people
Panel D: Number of children
Obs. Share Obs. Share Obs. Share Obs. Share
0 43,827 41% 20,589 52% 289,753 48% 364,656 49%
1 12,094 11% 5,926 15% 80,311 13% 115,246 15%
2 9,695 9% 5,106 13% 62,679 10% 88,314 12%
3 1,850 2% 1,041 3% 13,235 2% 17,699 2%
4 230 0% 138 0% 1,976 0% 2,468 0%
5 or more 40 0% 25 0% 383 0% 456 0%
Missing 38,204 36% 6,655 17% 152,645 25% 159,474 21%
Total 105,940 100% 39,480 100% 600,982 100% 748,313 100%
Number
of children
Accountants Legal pros All pros Biz people
Panel E: Level of education
Obs. Share Obs. Share Obs. Share Obs. Share
Pre-primary 10 0% 10 0% 140 0% 898 0%
Primary 171 0% 15 0% 879 0% 30,123 4%
Lower secondary 2,418 2% 125 0% 8,051 1% 89,679 12%
Upper secondary 23,324 22% 978 2% 70,621 12% 325,422 43%
Post secondary 4,548 4% 228 1% 16,498 3% 35,836 5%
Tertiary 72,818 69% 35,658 90% 473,722 79% 255,928 34%
Doctoral 1,910 2% 2,296 6% 28,325 5% 5,629 1%
Missing 741 1% 170 0% 2,746 0% 4,798 1%
Total 105,940 100% 39,480 100% 600,982 100% 748,313 100%
Level of
education
Accountants Legal pros All pros Biz people

8
Section IA4: Descriptive Migration Statistics by Country
This section provides country-specific migration statistics for accountants as well as changes in
these rates over time. The statistics are based on the double-matched sample from Table 3, Panel
C (see manuscript) with LFS weights. Table IA4 reports descriptive statistics for the pre-
treatment period (2002-2004), the post-treatment period (2008-2010), changes from the pre- to
the post-period, and changes from the pre- to the post-period of accountants relative to all
professionals. We report these statistics for our migration metrics NATBIRTH and
NATBIRTH_CHG. The descriptive statistics show that there is considerable cross-sectional
variation in the fraction of migrants across host countries. Small host countries such as
Luxembourg and Switzerland exhibit the highest migration base rates. The rates are the lowest in
Eastern European countries such as Latvia, Lithuania, and Slovakia. This cross-country variation
in mobility is largely in line with the statistics presented in Münz (2007). As one would expect,
the fraction of migrants is not always higher in the post-treatment period for all countries. The
average change from the pre- to the post-period across countries is 1.60 (1.28) percentage points
for NATBIRTH (NATBIRTH_CHG). When we compare these changes for accountants relative to
all professionals, the change in the country-level average drops to 0.78 (0.79) percentage points
for NATBIRTH (NATBIRTH_CHG), which is (only a descriptive statistic but) close to the
changes documented in Table 3, Panel C in the manuscript when using the double-matched
approach. We further use a t-test to assess the statistical significance of these results and find that
the average changes are positive and significant, at the 5%-level, for both NATBIRTH and
NATBIRTH_CHG.
Table IA4 shows that certain, in particular smaller, countries exhibit strong increases in migrants
(e.g., Austria, Cyprus, Luxembourg, and Switzerland), which seems plausible. These countries
have a high fraction of firms that operate internationally and therefore are able to exploit
regulatory harmonization. For instance, Nestle S.A., headquartered in Switzerland, argue in a
comment letter to the European Commission from March 2014 that IFRS adoption has
“enhanced internal mobility” of their workforce (see Table IA1). Iceland is the only country that
exhibits a larger and consistently negative change, which likely reflects the fact that its financial
sector was hit particularly hard by the financial crisis during the post-treatment period.
As reported in Footnotes 17 and 34, we also estimate treatment effects within six regions, for the
primary purpose of gauging the robustness of our inferences for cross-sectional dependencies.
However, this analysis also provides insights into regional heterogeneity in the treatment effects.
Unlike the descriptive statistics in Table IA4, these regional analyses use the same difference-in-
differences design as the regressions reported in Table 3, Panels A and B. We divide the EU
countries into six groups based on geography and language: West (BE, FR, LU and NL), Middle
(AT, CH and DE), East (CZ, EE, HU, LT, LV, RO and SK), South (CY, ES, GR, IT and PT),
Scandinavia (DK, FI, IS, NO and SE), and English (UK, IE). Among these regions, we find the
strongest treatment effects for the English-speaking region (UK, IE), consistent with the
expectation that for these countries language poses a lower barrier to migration. However,

9
controlling for demand effects, there are also strong treatment effects in the West, the South and,
in unweighted regressions, for the Middle. The latter illustrates that one has to exercise caution
when interpreting Table IA4 because some countries that exhibit larger pre-post differences
below, such as Austria and Switzerland, receive relatively small weights in the LFS-weighted
regressions presented in Table 3 (Panels A and B). The East is the only region for which we do
not find significantly positive treatment effects in any of the specifications. This finding
comports with the fact that we essentially measure migration into a country as well as the
broader migration pattern from Eastern countries to the rest of the EU shown in prior work,
which likely reflects the economic situation in Eastern countries coupled with EU enlargement.

10
TABLE IA4
Country-specific mobility statistics
Table IA4 reports country-level statistics on mobility in the pre-treatment period (2002 to 2004), post-treatment period (2008 to
2010), the change in mobility from the pre- to the post-period, and the change in mobility from the pre- to the post-period for
accountants relative to all professionals. All statistics are calculated based on the double-matched sample used in Table 3, Panel
C of the manuscript. These statistics cannot be calculated for some countries because job codes are not available at the three digit
level (Bulgaria, Poland and Slovenia) or because of missing data in the pre-treatment period (Italy and Romania). The t-statistics
at the bottom of the table (in parentheses) are based on robust standard errors with one-way clustering by country-job group. ***,
**, * indicate statistical significance at the 1%, 5% and 10% levels (two-sided), respectively.
2002-2004
(Pre)
2008-2010
(Post)
Diff
(Post-Pre)
Diff relative
all pros
2002-2004
(Pre)
2008-2010
(Post)
Diff
(Post-Pre)
Diff relative
all pros
Austria 6.69% 13.80% 7.12% 3.71% 1.76% 7.62% 5.86% 3.27%
Belgium 6.55% 6.21% -0.33% -1.05% 3.51% 3.15% -0.36% -0.31%
Bulgaria
Cyprus 5.73% 9.83% 4.10% 4.75% 3.36% 5.92% 2.56% 3.07%
Czech Republic 1.11% 0.78% -0.33% -0.48% 0.58% 0.39% -0.19% -0.33%
Denmark 1.76% 2.28% 0.52% 0.70% 1.25% 1.38% 0.13% 0.28%
Estonia 4.29% 1.22% -3.07% -1.48% 0.00% 0.00% 0.00% 0.51%
Finland 0.28% 0.21% -0.06% -0.42% 0.09% 0.00% -0.09% -0.20%
France 3.29% 3.99% 0.70% 0.63% 1.14% 3.06% 1.92% 1.73%
Germany 3.31% 4.45% 1.14% -0.28% 1.78% 1.92% 0.14% -0.30%
Greece 1.70% 1.66% -0.05% 0.02% 1.09% 0.24% -0.85% -0.97%
Hungary 0.46% 0.22% -0.25% -0.48% 0.26% 0.22% -0.04% -0.14%
Iceland 2.76% 0.96% -1.81% -1.41% 2.76% 0.27% -2.49% -2.06%
Ireland 5.35% 9.27% 4.40% 1.61% 4.09% 5.81% 1.71% 1.03%
Italy
Latvia 0.00% 2.63% 2.63% -0.60% 0.00% 0.00% 0.00% -1.81%
Lithuania 0.18% 0.56% 0.38% 1.48% 0.00% 0.56% 0.56% 0.97%
Luxembourg 64.76% 75.26% 10.50% 4.63% 27.64% 38.30% 10.66% 7.12%
Netherlands 1.94% 2.60% 0.65% 0.70% 0.51% 1.38% 0.87% 0.92%
Norway 1.27% 4.18% 2.91% 2.37% 0.67% 2.54% 1.87% 0.45%
Poland
Portugal 1.17% 1.68% 0.51% 0.95% 1.17% 1.59% 0.42% 0.73%
Romania
Slovakia 0.00% 0.26% 0.26% -0.04% 0.00% 0.00% 0.00% -0.15%
Slovenia
Spain 3.89% 5.53% 1.64% 0.61% 1.96% 4.51% 2.55% 1.94%
Sweden 3.00% 3.32% 0.32% -0.24% 1.65% 1.67% 0.02% -0.45%
Switzerland 17.34% 18.45% 1.11% 1.11% 9.22% 11.23% 2.01% 2.34%
United Kingdom 4.71% 10.02% 5.31% 1.84% 3.21% 6.67% 3.46% 1.31%
Total 5.90% 7.47% 1.60% 0.78%** 2.82% 4.10% 1.28% 0.79%**
(2.22) (2.04)
Host country
NATBIRTH NATBIRTH_CHG
11
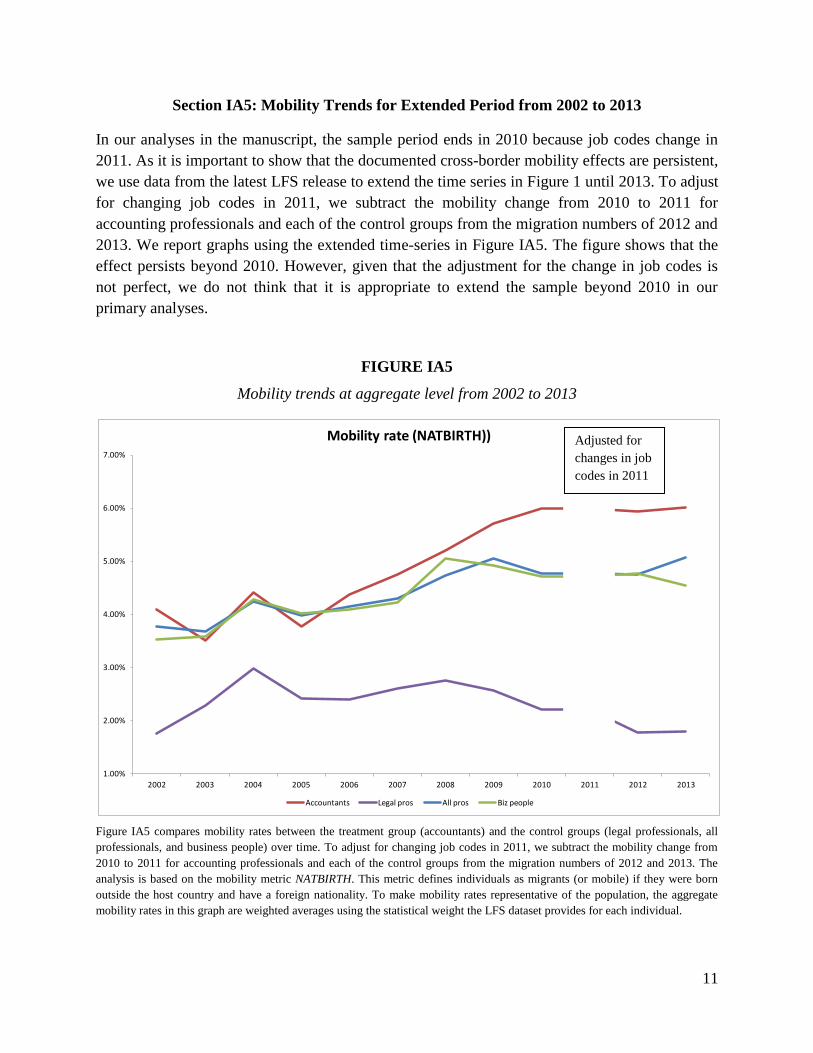
Section IA5: Mobility Trends for Extended Period from 2002 to 2013
In our analyses in the manuscript, the sample period ends in 2010 because job codes change in
2011. As it is important to show that the documented cross-border mobility effects are persistent,
we use data from the latest LFS release to extend the time series in Figure 1 until 2013. To adjust
for changing job codes in 2011, we subtract the mobility change from 2010 to 2011 for
accounting professionals and each of the control groups from the migration numbers of 2012 and
2013. We report graphs using the extended time-series in Figure IA5. The figure shows that the
effect persists beyond 2010. However, given that the adjustment for the change in job codes is
not perfect, we do not think that it is appropriate to extend the sample beyond 2010 in our
primary analyses.
FIGURE IA5
Mobility trends at aggregate level from 2002 to 2013
Figure IA5 compares mobility rates between the treatment group (accountants) and the control groups (legal professionals, all
professionals, and business people) over time. To adjust for changing job codes in 2011, we subtract the mobility change from
2010 to 2011 for accounting professionals and each of the control groups from the migration numbers of 2012 and 2013. The
analysis is based on the mobility metric NATBIRTH. This metric defines individuals as migrants (or mobile) if they were born
outside the host country and have a foreign nationality. To make mobility rates representative of the population, the aggregate
mobility rates in this graph are weighted averages using the statistical weight the LFS dataset provides for each individual.
1.00%
2.00%
3.00%
4.00%
5.00%
6.00%
7.00%
2002 2003 2004 2005 2006 2007 2008 2009 2010 2011 2012 2013
Mobility rate (NATBIRTH))
Accountants Legal pros All pros Biz people
Adjusted for
changes in job
codes in 2011

12
Section IA6: Assessing Alternative Explanations
Our difference-in-differences estimation combined with matching of individuals of various
professions by country (and year) implies a within-bin and within-country comparison across
professions. This approach alleviates many concerns about concurrent events that are unrelated
to accounting harmonization, provided these events apply to all professionals in a given country
(and year). However, events and/or institutional changes that differentially affect the mobility
rates of accounting professionals and of the control groups over time could affect our analysis.
Such events or institutional changes essentially violate the parallel-trends assumption. In this
section, we explore two potential violations and alternative explanations: (i) differential changes
in cross-border student mobility and (ii) differential responses to changes in the recognition of
professional qualifications.
Cross-Border Student Mobility
One concern arises from potentially differential trends in student mobility. Prior literature shows
that studying abroad increases the likelihood that an individual works abroad later in life (e.g.,
Parey and Waldinger, 2011). Moreover, it is possible that cross-border student mobility differs
across study subjects. For instance, if the fraction of business students that study abroad
increases earlier than the fraction of law students, then such differential trends could be an
alternative explanation for our findings. The launch of the Bologna Process in 1999 adds to this
concern. The Bologna Process aims to facilitate mutual recognition of degrees and student
mobility through exchange programs. If business schools, which educate the majority of
accounting professionals, were more responsive to the Bologna Process than law schools, then
the parallel-trends assumption would be invalid.
The concern about differential student mobility trends seems particularly pertinent for the control
group consisting of legal professionals. Individuals in the business people control group and the
accounting professionals likely have similar educational backgrounds. In fact, the use of business
people as a control group could be seen as another way to mitigate the concern. As the control
group consisting of all professionals spans a large set of educational backgrounds, it is unlikely
that differential student mobility trends across treatment and control groups line up such that they
induce our results. Thus, the first sensitivity test focuses on accounting and legal professionals.
The second sensitivity test explores this alternative explanation for all three control groups.
First, we obtain data on the number of students participating in the European Community Action
Scheme for the Mobility of University Students (ERASMUS) and hence visiting another
European country during their studies.1 The total number of participating students increases over
time, as expected. To assess the relative trends, we compute the proportion of business and law
students relative to the total number of ERASMUS students and inspect the trends over time.
1
ERASMUS was created in 1987. It is the largest student exchange program in Europe. By 2013, over 3 million
students have participated in the program.

13
Figure IA6 shows that between 2000 and 2010 the relative proportions of business and law
students that participate in the ERASMUS program remain fairly constant over time.2
Second, in first three columns of Table IA6, we include the number of years since graduation
(i.e., the difference between the sample year and the graduation year of the individual) as an
additional control variable. Together with the country-year fixed effects, this variable controls
for differences in mobility that are explained by differences in the year of graduation across
treatment and control groups (which in turn could be related to differential student mobility). The
estimated treatment effects after including this control variable are very similar to those reported
in the main analyses in Table 3 of the manuscript.
Finally, in the last column of Table IA6, we include the share of business and law students
among all ERASMUS students at host country-year level for accountants and legal professionals,
respectively, as an additional control variable (with a two year lag to account for the likely time
lag between studying abroad and seeking employment). Again, the estimated treatment effect
after including this control variable is very similar to the treatment effect we report in Table 3 of
the manuscript.
In sum, there is little evidence that differential trends in student mobility over time explain our
results.
Recognition of Professional Qualifications
Another concern arises from differential trends in the recognition of professional qualifications
obtained in other EU member states. The EU has taken several regulatory initiatives aimed at
promoting the free movement of professionals, including those in the accounting profession,
since 1988 (Directive 89/48). During our sample period, the EU enacted Directive 2005/36,
which confers individuals that obtained their professional qualifications in one EU member state
access to the same profession in another member state. This directive came into force in 2007,
although individual member states implemented some of the provisions after this date. Thus,
Directive 2005/36 and related prior EU directives offer a path to temporary or permanent
recognition of a professional qualification from another EU member state.
To the extent that the accounting profession is more responsive to such regulatory changes than
our control professions, the parallel-trends assumption could be violated. That is, the increased
mobility of accounting professionals relative to other professions could be due to changes in the
explicit recognition of foreign professional qualifications rather than the harmonization of
accounting and auditing standards. To address this concern, we obtain data on the number of
individuals applying for the recognition of a professional qualification. We compare the number
2
The ERASMUS program data have two drawbacks. They cover only a specific exchange program (albeit the
largest) and they do not allow us to scale the number of participating students with the total number of (foreign and
domestic) students in an area. Therefore, Figure IA6 also presents data on the proportion of all foreign students at
German universities scaled by the total number of students in the respective field of study, i.e., business, law and
economics over the period from 1990 to 2013. While these proportions change substantially over time, the trends are
again similar across fields of study. The drawback of this dataset is that it covers only one country.

14
of these applications from accounting professionals (in this dataset narrowly defined as
accountants and auditors) and other professionals.
Each year an average of 94 accounting professionals across the EU applied for the recognition of
a professional qualification from another EU member state over our sample period (only 6%
percent of these received a negative answer). This number is relatively small and much too small
to influence our estimated treatment effects (which are at least two orders of magnitude larger).3
Moreover, the number of applications by accounting professionals is much smaller than the
number of applications by legal professionals (also narrowly defined as lawyers, barristers and
solicitors). Importantly, we do not see a change in the frequency of applications for recognition
in our sample countries around years 2005 to 2007. Thus, although there were changes in the
regulation of professional qualifications around the time of IFRS and ISAs adoption, these
changes cannot explain the results in our main analyses.
3 On top of that, two-thirds of the 94 applications are submitted in Cyprus and Romania for qualifications obtained
in the UK. In Cyprus, the accounting qualification is identical to the UK ACCA qualification. Romania also
automatically accepts the UK qualification in place of its national qualification. Hence, the likely explanation for the
high number of applications for the recognition of UK qualifications in Cyprus and Romania is that their citizens
take the exam in the UK and then apply for recognition in their home country. Cyprus and Romania do not enter our
main analyses (due to lack of LFS data) and hence these applications are not relevant for our analysis.

15
FIGURE IA6
Mobility trends for business and law students
Figure IA6 presents statistics on student mobility over time. The upper graph shows the proportion of business and law students
in the group of students who went abroad with the ERASMUS program (i.e., European Community Action Scheme for the
Mobility of University Students) during academic years 2000-01 to 2008-09. This dataset was provided by the German Academic
Exchange Service (DAAD). The lower graph shows the proportion of all foreign students at German universities relative to
number of total students (foreign and domestic) in the respective fields: business administration, law and economics over the
period 1990 to 2013. These data were obtained from the website of the Federal Statistical Office of Germany (www.destatis.de).
0.0%
5.0%
10.0%
15.0%
20.0%
25.0%
30.0%
2000-01 2001-02 2002-03 2003-04 2004-05 2005-06 2006-07 2007-08 2008-09
Percentage of all Erasmus students
Business students Law students
0%
2%
4%
6%
8%
10%
12%
14%
16%
201320122011201020092008200720062005200420032002200120001999199819971996199519941993199219911990
Proportion of foreign students at German universities
Business Administration Law Economics

16
TABLE IA6
Controlling for years since graduation
Table IA6 presents results from sensitivity analyses related to differential student mobility trends. The sample comprises
individuals from 26 countries for the years 2002 to 2004 and 2008 to 2010, respectively. The research design is the same as in the
regression analysis presented in Panel B of Table 3 (NATBIRTH_CHG). Results are reported using LFS-weighted regressions
and controlling for domestic job mobility as well as two additional control variables: Years since graduation is defined as the
difference between the sample year and the graduation year of the respondent. Student mobility is the share of students in the
respective field among all ERASMUS students at host country-year level. In constructing this variable, we use business students
for accountants and law students for legal professionals.
Independent variables
Accountant * Post 1.113* 0.827*** 0.805** 1.038*
(1.89) (2.70) (2.29) (1.97)
Years since graduation -0.087* -0.091*** -0.075***
(-1.84) (-2.78) (-4.14)
Student mobility -0.043
(-1.00)
Domestic job mobility 0.033 0.031 0.103*** 0.029
(0.98) (0.88) (3.16) (0.85)
Control group Legal pros All pros Biz people Legal pros
Observations 123,780 579,102 601,207 127,639
R-squared 0.07 0.04 0.03 0.06
Country * Accountant
Country * Year
Fixed effects
Dependent variable: Mobility yes/no (NATBIRTH_CHG)
Bin

17
Section IA7: Correlation in Country-level Migration In- and Outflows
Our analysis deliberately scales by the number of professionals in the country and year. Such
scaling captures some demand effects. For instance, if a (non-harmonizing) regulatory shock
increases the demand for accountants and does so symmetrically for domestic and foreign
accountants, then the demand effect is already controlled for in the construction of the mobility
measure. However, a regulatory change could also lead to asymmetric demand shocks across the
EU countries. For instance, it is conceivable that IFRS adoption leads to more demand in some
countries than others irrespective of harmonization. In this scenario, countries with relatively
small demand shocks should act as “sources,” having increases in outflows and declines in
inflows, while countries with relatively large demand shocks act as “sinks,” having increases in
inflows and declines in outflows. Thus, under the asymmetric demand story, changes in inflow
and outflow rates for accountants relative to control groups will be negatively correlated because
sources (sinks) will have decreased (increased) inflows and increased (decreased) outflows. In
contrast, under the harmonization story, relative changes in inflow and outflow rates will be
positively correlated because harmonization allows mobility in both directions.
Testing this hypothesis is difficult with LFS data as it requires inflow and outflow data by
country. As explained in Section 3, the LFS dataset comes with a host country perspective,
surveying people that are located in a given country. It does not allow tracking of individuals,
and origin information for migrants is limited to the LFS variable COUNTR1Y (country of
residence last year). Despite the limitations of COUNTR1Y (see Sections 3.3 and 5.2), we can
construct the following flow measures: INFLOW is the proportion of people living in country X
who did not live in country X in the prior year (but lived elsewhere in the EU); and OUTFLOW
is the proportion of people not living in country X (but elsewhere in the EU) who lived in
country X in the prior year. Since the COUNTR1Y variable is sparsely populated, we can
construct the measures for only 18 countries.
We use a difference-in-differences design by benchmarking pre- versus post-treatment changes
(2002 to 2004 versus 2008 to 2010) in accountants’ inflow and outflow rates against changes in
the inflow and outflow rates of all professionals, both at the country-level. Table IA7a reports
results from rank regressions. We find that relative changes in accountants’ inflows are
positively correlated with relative changes in accountants’ outflows. This result is consistent with
the harmonization explanation. In Table IA7b, we cross-tabulate all 18 countries based on the
sign of their relative inflow and outflow changes. We find that 15 out of 18 countries have either
both positive inflow and outflow changes or both negative inflow and outflow changes relative to
all professionals, both with LFS weights (Panel A) and without LFS weights (Panel B).
Taken together, the results in Tables IA7a and IA7b do not support the asymmetric demand
shock explanation.

18
TABLE IA7a
Correlation in country-level migration in- and outflows of accounting professionals
relative to all professionals
Table IA7a presents the association between country-level changes in accountants’ inflow rates and changes in accountants’
outflow rates. Using a difference-in-differences design, we benchmark pre- versus post-treatment changes (2002 to 2004 versus
2008 to 2010) in accountants’ inflow and outflow rates against changes in the inflow and outflow rates of all professionals. The
unit of observation is the host country. Due to the kurtosis of the difference-in-difference estimates, we perform a ranked
regression instead of OLS. We present results both with and without LFS weights. Inflow and outflow rates are estimated using
the COUNTR1Y variable.
LFS weighted
(yes)
LFS weighted
(no)
Outflow Diff-in-Diff Rank 0.822*** 0.575**
(5.78) (2.81)
Constant 1.686 4.039*
(1.10) (1.82)
Observations 18 18
R-squared 0.66 0.33
Independent variables
Dependent variable:
Inflow Diff-in-Diff Rank

19
TABLE IA7b
Cross-tabulation of countries with positive and negative in- and outflows of accounting
professionals relative to all professionals
Table IA7b presents cross-tabulations comparing the sign of changes in accountants’ inflow rates and with the sign of changes in
accountants’ outflow rates. Using a difference-in-differences design, we benchmark post-treatment changes (2002 to 2004 versus
2008 to 2010) in accountants’ inflow and outflow rates against changes in the inflow and outflow rates of all professionals. The
unit of observation is the host country. We present results both with (Panel A) and without LFS weights (Panel B). Inflow and
outflow rates are estimated using the COUNTR1Y variable.
Panel A: LFS weighted (yes)
Positive
Outflow Dif-in-
dif
Negative
Outflow Dif-in-
dif Total
Positive Inflow Dif-in-dif 8 1 9
Negative Inflow Dif-in-dif 2 7 9
Total 10 8 18
Panel B: LFS weighted (no)
Positive
Outflow Dif-in-
dif
Negative
Outflow Dif-in-
dif Total
Positive Inflow Dif-in-dif 7 1 8
Negative Inflow Dif-in-dif 2 8 10
Total 9 9 18

20
Section IA8: Double-Matched Analysis using Legal Professionals and Business People
In Table IA8, we report the double-matched difference-in-difference analyses for accountants
against two alternative control groups: legal professionals and business people. The sample
selection criteria, double-matching procedure and the specifications shown are identical to those
reported in Table 3C of the manuscript.
Panel A presents the results relative to legal professionals, while Panel B presents results relative
to business people. Results relative to business people are weaker than those relative to all pros
(see Table 3, Panel C) or legal pros, especially for the analyses that do not use the LFS weights.
The reason for this finding is the inclusion of Ireland, which comprises roughly 8% of the sample
of business people, but only represents approximately 1.5% of the population. Compounding this
issue is the fact that the distribution of job codes within business people (in particular, their job
levels) differs substantially for Ireland relative to the distribution of job codes within business
people for the EU as a whole. In untabulated analyses, we drop Ireland and find that our
difference-in-differences results using business people as a control group become substantially
stronger (and more in line with those reported for the other two control groups), both in terms of
magnitude and statistical significance.
TABLE IA8
Double matched difference-in-differences analysis of cross-border mobility effects from
regulatory harmonization using legal and business professionals as control groups
Panel A: Legal pros as control group
LFS weighted (yes)
(a) Treatment (Accountants) 3.216 4.969 1.753 1.773 2.834 1.061 3.922 7.231 3.309
(b) Control (Legal pros) 1.882 2.551 0.669 0.898 1.425 0.528 1.959 3.170 1.211
Difference (a) - (b) 1.333 2.4181.084***
(3.29)0.876 1.409
0.533*
(1.80 )1.963 4.061
2.098***
(4.17)
Observations
LFS weighted (no)
(a) Treatment (Accountants) 5.318 7.293 1.975 2.769 3.968 1.199 6.833 10.531 3.698
(b) Control (Legal pros) 3.332 4.295 0.963 1.798 2.422 0.624 5.051 5.900 0.849
Difference (a) - (b) 1.986 2.9981.014**
(2.37)0.971 1.546
0.575**
(2.01)1.782 4.631
2.849***
(2.70 )
Observations
78,624 78,624 23,449
80,432 80,432 23,794
Double matched
diff-in-diff analysis
Full sample Only recent job changers
Mobility rate: NATBIRTH Mobility rate: NATBIRTH_CHG Mobility rate: NATBIRTH
Pre-period
(1)
Post-period
(2)
Difference
(2) - (1)
Pre-period
(1)
Post-period
(2)
Difference
(2) - (1)
Pre-period
(1)
Post-period
(2)
Difference
(2) - (1)

21
TABLE IA8 (continued)
Table IA8 presents results from a double matched difference-in-differences analysis that tests for differences in mobility trends
between the treatment group (accountants) and the control groups of legal professionals (Panel A) and business people (Panel B).
The research design is the same as in Table 3, Panel C of the manuscript.
Panel B: Biz people as control group
LFS weighted (yes)
(a) Treatment (Accountants) 2.923 4.833 1.910 1.594 2.774 1.181 4.386 7.439 3.053
(b) Control (Biz people) 3.431 4.784 1.352 1.658 2.496 0.838 5.096 7.561 2.465
Difference (a) - (b) -0.508 0.0490.557**
(1.72)-0.064 0.278
0.342
(1.27)-0.711 -0.122
0.589**
(2.62)
Observations
LFS weighted (no)
(a) Treatment (Accountants) 5.264 6.799 1.535 2.743 3.765 1.022 6.754 9.183 2.429
(b) Control (Biz people) 5.655 6.946 1.291 2.705 3.639 0.934 7.745 9.609 1.864
Difference (a) - (b) -0.391 -0.1470.244
(0.84)0.038 0.126
0.089
(0.47)-0.991 -0.426
0.566
(1.18)
Observations
453,481 453,481 118,548
Double matched
diff-in-diff analysis
Full sample Only recent job changers
Mobility rate: NATBIRTH Mobility rate: NATBIRTH_CHG Mobility rate: NATBIRTH
Pre-period
(1)
Post-period
(2)
Difference
(2) - (1)
Pre-period
(1)
Post-period
(2)
Difference
(2) - (1)
Pre-period
(1)
470,994 470,994 121,466
Post-period
(2)
Difference
(2) - (1)

22
Section IA9: Cross-Sectional Variation in the Treatment Effect
In this section, we report the results of a descriptive analysis of the cross-sectional variation in
the treatment effects with respect to certain country characteristics. We describe but do not
tabulate the analysis in Section 5.2.2 of the manuscript. There are two important caveats to this
analysis.
First, it is difficult to make signed predictions for the cross-sectional effects. The reason is that
cross-country variation also affects the size of the profession in the first place. In addition,
migration is not the only margin along which the system can adjust after the regulatory change.
Take the prediction that countries with a larger fraction of publicly-listed firms that need to
report under IFRS should see a larger inflow of migrants. While sensible, it is also conceivable
that these countries already had a much larger audit profession to begin with and hence even if
they receive a larger number of migrants, the relative effect of migration could be larger in
countries with fewer publicly-traded firms reporting under IFRS (and a smaller audit profession).
Furthermore, in countries with a larger fraction of publicly-traded firms, IFRS adoption could
also lead to a larger inflow of domestic people into the accounting and auditing profession. As a
result, it is not clear that the effect (as measured by us) is necessarily larger in these countries.
Second, identification in these tests is based on cross-sectional variation in country
characteristics. However, at the country level, many variables are highly correlated (for
endogenous reasons) and hence it is difficult to isolate the effect of any particular factor.
For these two reasons, we view the tests below as primarily descriptive in nature. We have
identified and collected data for several constructs for which we can make reasonable predictions
(still acknowledging the concern discussed above). Our split variables capture (i) the extent to
which standards are harmonized and (ii) to which regulatory harmonization is likely to affect
migration. We proxy for the extent of harmonization with the degree of harmonization of audit
standards and the share of the economy that is subject to mandatory IFRS (two first proxies
discussed below). We proxy for the extent to which regulatory harmonization is likely to affect
migration with the strength of licensing rules and the market share of Big-4 auditors (two last
proxies discussed below).
Degree of Regulatory Harmonization of Auditing Standards
To capture the harmonization of auditing standards, we focus on changes in standards that have
occurred over the sample period. Specifically, we classify countries as “high harmonization”
countries if they are full ISA adopters by 2012. We expect migration inflows to be greater in
countries with high harmonization.
Share of Market Subject to Mandatory IFRS
Unlike auditing standards that apply to all firms, IFRS adoption affected primarily publicly listed
firms in most countries. Thus, we can use the market capitalization of listed firms to GDP as a

23
size-weighted measure for the degree to which the accounting standard harmonization affected a
country. We classify those countries with an above median market capitalization of listed firms
to GDP as “high harmonization” countries. We expect migration inflows to be greater in
countries with high harmonization.
Licensing Rules
Licensing rules constitute a barrier to migration that still exists after IFRS and ISA adoption. We
measure the extent of this barrier by coding variation in three national licensing-requirements: 1)
whether a candidate needs at least three years of practical experience, 2) whether there is a final
qualifying exam, and 3) whether the practical experience must be completed before the final
qualifying exam. If the answer is yes to at least two of these three questions, we classify the
country as a “high licensing requirements” country. We expect migration inflows to be lower in
countries with high licensing requirements.
Market Share of Big-4 Auditors
The audit market is characterized by a few large firms. For these Big-4 auditors, IFRS and ISA
are likely to be much more important because they are set up as international networks, which
can facilitate cross-border labor migration (see discussion in Section 2 of the manuscript). Put
differently, regulatory harmonization is likely more important to the Big-4 and their networks are
likely better able to take advantage of regulatory harmonization.4 Based on this logic, we split
countries by the median market share of Big-4 auditors and classify those above the median as
high Big-4 market share countries. We expect migration inflows to be greater in countries with a
high Big-4 market share.
Table IA9a reports descriptive statistics on the institutional variables. In Table IA9b, we report
results for regressions in which we include the interaction between the coefficient of interest
(Accountant*Post) and the above institutional variables to test for heterogeneity in the treatment
effects. For these tests, we focus on the weighted regressions because the weights assure
comparability across countries and across time, which is important when examining country-
level variation in the treatment effect. We find that the interaction of interest is positive in all
cases and often quite large in magnitude. However, the interaction term is often not statistically
significant. Nevertheless, the results indicate directionally that the treatment effects tend to be
larger when the harmonization of standards is greater (Table IA9b, Panels A and B) and when
regulatory harmonization is expected to affect migration the most (Table IA9b, Panels C and D).
However, considering the lack of statistical significance and the conceptual concerns about the
cross-sectional tests using country-level variables, we caution the reader to interpret the results
carefully. The evidence is nevertheless suggestive and descriptively useful.
4 As an illustration of our point that cross-sectional predictions are tricky, we note that one could also argue that Big-
4 networks provided ways to overcome the barrier that different standards created prior to regulatory harmonization.

24
TABLE IA9a
Institutional variables used to examine cross-sectional variation in treatment effects
Table IA9a presents country-level proxies for 1) the extent of ISA adoption; 2) the size of public equity markets; 3) strength of
licensing requirements; and the market share of Big4 auditors. ISA Adoption is assumed to be harmonized more if national
standards were fully harmonized with ISA in 2012 (We cannot publicly reveal the source of the data for contractual reasons but
we have identified the source to the Editor in compliance with JAR’s data policy). Size of public equity market is defined to be
high if the market capitalization of listed companies (which are generally subject to mandatory IFRS) as a percent of GDP
(MCAP/GDP) exceeds the median of all EU countries in 2005 (data obtained from the Worldbank). Licensing requirements are
defined as high if certified auditors must meet at least two of the following three requirements: i) have at least three years of
practical experience; ii) pass a qualifying exam, iii) have practical experience before taking the qualifying exam (data obtained
from the FEE website). Big4 market share is defined as high if the market share of Big-4 audit firms in a country exceeds the
median of all countries in 2009 (data obtained from Le Vourc’h and Morand, P., 2011).
Ratio HighExperience
> 3 yrs.
Final
Qualifying
Experience
before examAggregate Percent High
Austria No 39.53 0 0 1 1 2 14% 0
Belgium Yes 74.56 1 0 1 0 1 22% 1
Bulgaria Yes 17.36 0 0 1 0 1 14% 0
Cyprus Yes 36.03 0 0 1 0 1 20% 1
Czech Republic Yes 28.20 0 0 0 0 0 5% 0
Denmark Yes 67.30 1 0 1 0 1 40% 1
Estonia Yes 24.96 0 0 1 0 1 6% 0
Finland Yes 102.48 1 0 1 0 1 26% 1
France No 79.81 1 0 1 0 1 21% 1
Germany No 42.74 0 1 1 1 3 19% 0
Greece Yes 58.55 1 1 1 1 3 na na
Hungary Yes 29.11 0 0 0 0 0 9% 0
Iceland Yes 165.48 1 0 1 1 2 na na
Ireland Yes 54.26 1 0 0 0 0 25% 1
Italy No 43.06 0 0 1 0 1 12% 0
Latvia Yes 14.79 0 0 1 0 1 15% 0
Lithuania Yes 31.32 0 0 1 1 2 25% 1
Luxembourg Yes 138.43 1 0 1 0 1 44% 1
Netherlands Yes 88.18 1 0 1 1 2 29% 1
Norway Yes 61.85 1 0 1 0 1 na na
Poland No 30.84 0 0 1 0 1 7% 0
Portugal No 33.95 0 0 1 0 1 11% 0
Romania Yes 20.76 0 0 1 0 1 14% 0
Slovakia Yes 7.01 0 1 1 0 2 24% 1
Slovenia Yes 21.73 0 1 1 1 3 2% 0
Spain No 82.96 1 0 0 0 0 13% 0
Sweden Yes 103.83 1 0 1 0 1 35% 1
Switzerland Yes 230.32 1 0 1 1 2 na na
United Kingdom Yes 126.78 1 0 1 0 1 40% 1
Country
Licensing requirements Big4 market shareAudit
Standards =
ISA in 2012
MCAP/GDP

25
TABLE IA9b
Cross-sectional variation in treatment effects
Table IA9b presents results cross-sectional variation in the treatment effect. The research design is the same as in the regression analysis presented in Panel B of Table 3
(NATBIRTH_CHG). Results are reported using LFS-weighted regressions and controlling for domestic job mobility. Partitioning variables are defined in the notes to Table IA9a.
Panel A: ISA adoption Panel B: Size of public equity market
Yes No High Low
Legal pros 1.646** 0.345 1.301 Legal pros 1.903*** -0.286 2.189***
(2.43) (0.73) (1.54) (3.57) (-1.08) (3.78)
All pros 0.829*** 0.606 0.223 All pros 1.156*** 0.090 1.066***
(2.92) (1.05) (0.35) (4.44) (0.40) (3.19)
Biz people 0.845** 0.557 0.288 Biz people 1.083*** 0.164 0.919**
(2.15) (1.35) (0.51) (3.20) (0.81) (2.39)
Panel C: Licensing requirements Panel D: Big 4 market share
Low High High Low
Legal pros 1.938*** -0.030 1.968*** Legal pros 2.015*** 0.201 1.814**
(3.47) (-0.09) (3.09) (2.80) (0.51) (2.18)
All pros 0.916*** 0.549 0.367 All pros 0.946*** 0.434 0.512
(2.80) (1.37) (0.72) (3.27) (0.95) (0.95)
Biz people 0.938** 0.476* 0.462 Biz people 1.014** 0.372 0.642
(2.24) (1.74) (0.95) (2.48) (1.15) (1.25)
Diff.
Treatment effect by
control group
Audit standards = ISA in 2012Diff.
Treatment effect by
control group
Big 4 market shareLicensing requirementsTreatment effect by
control groupDiff.
Treatment effect by
control group
MCAP/GDPDiff.

26
References in Internet Appendix
Le Vourc’h, J. Morand, P., 2011. Study on the effects of the implementation of the acquis on
statutory audits of annual and consolidated accounts including the consequences on the audit
market. ESCP Europe.
Münz, R., 2007. Migration, labor markets, and integration of migrants: An overview for Europe.
HWWI Policy Paper 3-6, Hamburg Institute of International Economics.
Parey, M., Waldinger, F., 2011, Studying abroad and the effect on international labour market
mobility: Evidence from the introduction of ERASMUS. Economic Journal 121, 194–222.