for nuclear graphite* oak ridge national · pdf file2 rose-tucker model. fracture mechanics,...
TRANSCRIPT

A MICROSTRUCTURALLY BASED FRACTURE MODELFOR NUCLEAR GRAPHITE*
Timothy D. Burchell r, 'Oak Ridge National Laboratory CONP-9109266— 5 { [
Oak Ridge, Tennessee 37831 -6038, USA
ABSTRACT
This paper reports the physical basis of, and assumptions behind, a fracture model for nucleargraphites. MicrostructuraHy related inputs, such as filler particle size, filler particle fracture toughness(Kje), density, pore size distribution, number of pores and specimen geometry (size and volume), areutilized in the model. The model has been applied to two graphites, Great Lakes CarbonCorporation grade H-451 and Toyo Tanso grade IG-110. For each graphite, the predicted tensilefailure probabilities are compared with experimental data generated using ASTM Standard C-749tensiie test specimens. The predicted failure probabilities are in close agreement with theexperimental data, particularly in the case of the H-451. The model is also shown to qualitativelypredict the influence on the failure probabilities of changes in filler particle size, density, pore size,pore size distribution, number of pores and specimen geometry (stressed volume). The goodperformance is attributed to the sound physical basis of the model, which recognizes the dominantrole of porosity in confotliag crack initiation and propagation during graphite fracture.
1.0 INTRODUCTION
Gas-cooled reactors such as the U.S. designed Modular High-Temperature Gas-Cooled Reactor
(MHTGR), and the Japanese High Temperature Test Reactor (HTTR). use near-ir»otropic or
isoiropic grade graphites as the nuclear moderator and for the major core structural components.
During operation the reactor core graphite is subject to complex stresses, such as thermal stresses and
stresses caused by neutron-damage induced dimensional changes. Moreover, seismic and static forces
act on the graphite core components. These stresses acting singularly or in combination should not
be sufficient to cause failure of the graphite core components. Consequently accurate predictions
of core brick stresses are of key importance. However, if safety margins are to be demonstrated, a
credible and acceptable failure criteria for graphite must be available, against which the probability
of failure can be accurately predicted.
7n their review of fracture in graphite. Tucker, Rose and Burchell1 assessed the performance of
several failure theories when applied to graphite. These theories included the Weibull theory, the
'Research sponsored by the Division of MHTGRs. Office of Advanced Reactor Programs. U.S.Department of Energy, under contract DE-AC05-84OR21400 with Martin Marietta Energy Systems,Inc.
&em c a m e Nc Of-: octear** re sutMK or
r* a» r » ^ja tutu- or«KM> —ran :z at K >auS Gowmrwrt
MASTERfcSTRI9UTID!l 0? TH!S SDCUWINT S3 UNLlMfTEB

2
Rose-Tucker model. Fracture Mechanics, Critical Strain Energy, Critical Stress and Critical Strain
Theories. While no single criteria could satisfactorily account for all the situations they examined,
their review showed that a combination of the fracture mechanics and a microstructurally based
fracture criteria might offer the most versatile approach to modelling fracture in graphite.
This paper gives a full account of a model which combines a fracture mechanics failure criteria and
a microstructurally based description of graphite failure. The physical basis and assumptions behind
the model are reported and the necessary .nicrostructural inputs for the model are discussed. The
model predictions are compared with experimental tensile strength data for two nuclear grade
graphites. The performance of the model in predicting the influence of changes in microstructural
features on the failure probability is discussed.
10 THE MECHANISM OF FRACTURE IN GRAPHITE
A microstructural study of fracture in graphite2 has revealed the manner in which certain
microstructural features influence the process of crack initiation and propagation in nuclear graphites;
the principal observations are summarized below.
2.1 POROSITY
Two important roles of porosity in the fracture process have been identified. Firstly, the interaction
between the applied stress field and the pores will cause localized stress intensification, promoting
crack initiation from favorably oriented pores at low applied stresses. Secondly, propagating cracks
can be drawn toward pores in their vicinity, presumably under the influence of the stress field around
the pore. In some instances such pore/crack encounters serve to accelerate crack growth; however,
occasionally a crack will be arrested by a pore, and does not break free until higher applied stresses
are attained. Pores of many shapes and sizes are observed in the microstructure of a graphite. The
larger, niore s!it-shaped pores being more damaging to the graphite.
DISCLAIMER
T>.is report »as prepared as an account of »ork sponsored bv .in agericv of the L'mied SlatesGovernment Neither the United Sl-i-tt Government nor try agency thereof, r.cr anv of theire~p'rr>r»_ rr.iitss in> warranty, express or implied, or assurr.es any legal liability or rtspcr.si--:'.;tv r"-r tt.t accuracy completeness, or usefulnes of any information, apparatus, product, orrrixr-M disclosed, or represents that its use »o-j!d -t infringe pnvater. owned rights Refer-ence herein ;o an> specif;.: commercial product, process, or service bv trade name, trademark,rnar.jfactjrer. cr otherwise does re : rtecessar:.';- constitute cr :rr;pl> its e-dorserr.ent. recom-—endatic-. cr :a»cr.ng b> the L'sittd States Governrr.er.t or an> ager.c\ thereof The viewsa.-.d cpi.-.:^r.s of authors expressed herein do not necessaniv state or reflect those cf theVr.::sd States Gov emrr.er.t cr anv ager.c> thereof

2.2 THE BINDER PHASE
Two arbitrarily defined types of microstructure can be identified in the binder phase: (i; domains,
which are regions of common basal plane alignment extending over linear dimensions greater than
lOO^m, and (ii) mosaics, which are regions of small randomly-oriented pseudo-crystallites with linear
dimensions of common basal plane orientation of less than about I (Van. Cleavage of domains can
occur at stresses well below the fracture stress, and such regions can act as sites for crack initiation,
particularly when in the vicinity of pores. Fracture of mosaic regions is usually only observed at
stresses close to the fracture stress. At lower stresses, propagating cracks which encounter such
regions are arrested or deflected.
2.3 FILLER PARTICLES
Coke filler particles with good basal plane alignment are highly susceptible to microcracking along
basal planes at low stresses. This cleavage is facilitated by the needle-like cracks which lie parallel
to the basal planes, and are formed by anisotropic contraction of the filler-coke particles during the
calcination process. Frequently, when a crack propagating through the binder phase encounters a
welS aligned filler particle, il takes advantage of the easy cleavage path and propagates through the
particle. However, the reverse process, i.e.. propagation of a crack initiated in the filler particle into
the binder phase, was much less commonly observed.
2.4 FRACTURE MECHANISM
Based on the forgoing discussion of graphite fracture processes, it is evident that the microstructure
plays a dominant role in controlling the fracture behavior of the material. Therefore, any new
fracture model should attempt to capture the essence of the microstructural processes influencing
fracture. Particularly, a <Vacture model should embody the following: (i) the distribution of pore
sizes; (ii) the initiation of cracks from stress raising pees, and (iii) the propagation of cracks io a
critical length prior to catastrophic failure of the graphite (i.e., subcritical growth). The fracture
model3 presented here recognizes these aspect of graphite fracture, and applies a fracture mechanics
criteria to describe steps (ii) and (iii) above.
3.0 THE FRACTU^, MODEL
3.1 MODELLING THE GRAPHITE MICROSTRUCTURE
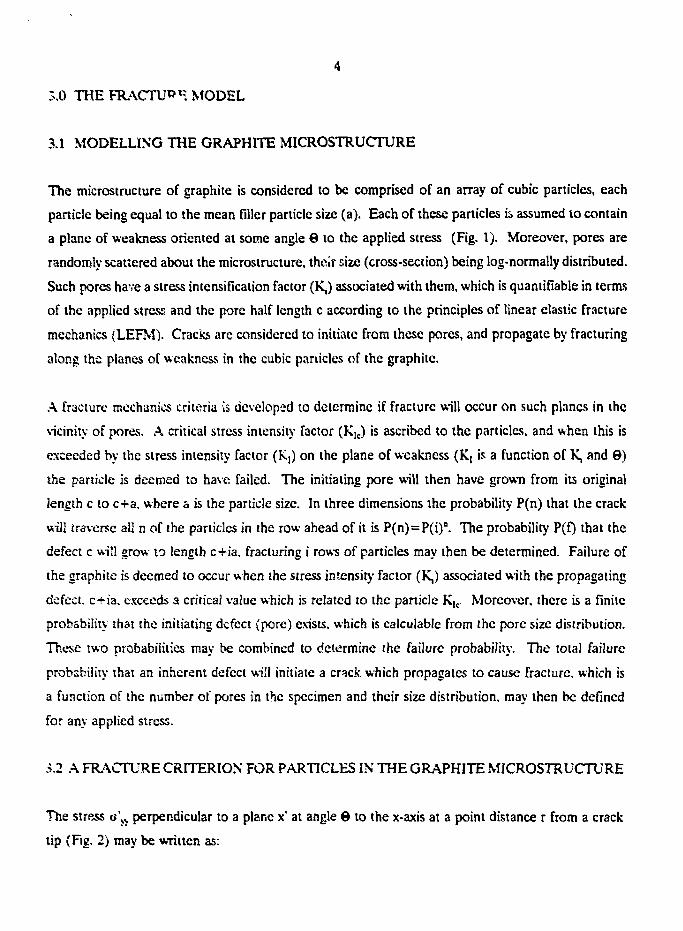
The microstructure of graphite is considered to be comprised of an array of cubic particles, each
particle being equal to the mean filler particle size (a). Each of these particles is assumed to contain
a plane of weakness oriented at some angle © to the applied stress (Fig. 1). Moreover, pores are
randomly scattered about the microstructure, their size (cross-section) being log-normally distributed.
Such pores have a stress intensification factor (Kj) associated with them, which is quantifiable in terms
of the applied stress and the pore half length c according to the principles of linear elastic fracture
mechanics (LEFM). Cracks are considered to initiate from these pores, and propagate by fracturing
along the planes of weakness in the cubic panicles of the graphite.
A fracture mechanics criteria is developed to determine if fracture will occur on such planes in the
vicinity of pores. A critical stress intensity factor (Kk) is ascribed to the particles, and when this is
exxeeded by the slress iniensity factor (Kj) on the plane of weakness (Ki is a function of K, and ©)
the particle is deemed to have failed. The initiating pore will then have grown from its original
length c to c+a. where a is the particle size. In three dimensions the probability P(n) that the crack
will traverse all n of the particles in the row ahead of it is P(n)=P(i)n. The probability P(f) that the
defect c will grow to length c+ia. fracturing i rows of particles may then be determined. Failure of
the graphite is deemed to occur when the stress intensity factor (K,) associated with the propagating
defect, c+ia. exceeds a criticai value which is related to the particle KIc, Moreover, there is a finite
probability that the initiating defect (pore) exists, which is calculable from the pore size distribution.
These two probabilities may be combined to determine the failure probability. The total failure
probability that an inherent defect will initiate a crack which propagates to cause fracture, which is
a function of the number of pores in the specimen and their size distribution, may then be defined
for any applied stress.
1.2 A FRACTURE CRITERION FOR PARTICLES IN THE GRAPHITE MICROSTRUCTURE
The stress o'>y perpendicular to a plane x' at angle © to the x-axis at a point distance r from a crack
tip (Fig. 2) may be written as:

> r ./7?«rl 2cos3(j) (1)
where Ki is the stress intensity factor of the crack length 2c under applies stress o. The stress a\y
may also be defined in terms of the stress intensity factor K: of the plane x' at angle 8 from x:
o' = ** (2)/ ( 2 n r )
where
At the moment of particle failure
where Ku is the critical stress intensity factor associated with fracture of the graphite particles. A
criterion for the fracture of the particles may thus be defined. When K[ of a plane at ar.jle © (which
is a function of the K, associated with the defect length c) exceeds KIc then all of the planes at angle
less than 8 may be assumed to have failed (Fig. 3). From equation (4), at fracture,
(- |) (5)
thus.
For crack in tension. K, is defined as
substituting equation (7) in equation (6) we get

6 = 2 c o s ' l [ ^ ] 1 / J (8)
From equation (8) above we see that B is a function of the applied stress, o4pp, and the crack half
length c. Figure 4 shows a crack of half length c under applied stress o. The crack front abuts a row
of n particles, where n=b/a. and b is the breadth of the specimen. For a given o and c the angle 0
below which a particle may be assumed to have failed is given by equation (8). For simplicity the
orientation of these planes about the z axis is considered to be uniform. Therefore, the fraction of
the particle that is potentially fractured is given by 29/180° or 2©/n. This is also the probability, Pi(
that the particle has failed. Thus we may write:
Substituting for 6 from equation (6):
( •§£) ! / ' (10)" ft Xj
The limits of probability of particle failure may now be defined:
(a) P - 0
i.e.. the particle cannot fail, this occurs when KjsKIc.
(b) Pifzi
i.e.. panicle cleavage is certain to occur. This happens when:
it Ki

that is when
w. 1 (12)
or
Ki \[2 2v/2
Hence, when Kj i 2/2Klc a particle ahead of the crack front is certain to fracture.
(c)
This corresponds to the condition Kk s K^ s 2/2Kk when the probability of a particle failing in the
row ahead of the crack front is given by equation (10).
3.3 DEFINING THE PROBABILITY THAT FAILURE WILL OCCUR FROM A PORE OF
HALF LENGTH c
Equation (9) gives the probability that one particle has fractured. However there are n=b/a particles
in the entire row, therefore:
now substituting for © from equation (8)
^ / a (15)
This is the probability that the initial pore of length c will grow from length c to length c+a, where
a is the particle size, by fracturing ail n particies. Similarly, the probability that the crack will grow
from length c+a to length c+2a is:
Because the crack must extend from c to c+a before it can extend from c+a to c+2a, the probability

8
that the crack will grow from c to c+2a is given by the product of equations (15) and (16). Thus,
the probability that the crack will gr̂ w from c to c+ia, fracturing i rows of particles can be written
as:
P ( n ) .TT [ l c o s - M - — - £ * ) » / » ] * . U 7 )
+4 « o/T*taking logarithms
o / T i t ( e + i a ) ]
which may be approximated to
o / T n < c + i a ) ]
This is the probability that failure will occur due to the propagation of one tip of the initial defect
c under stress o, where K,c is the critical stress intensity factor of the filler particle and a is the filler
particle size.
3.4 DEFINING THE TOTAL PROBABILITY OF FAILURE FOR THE GRAPHITE SPECIMEN
The graphite microstructure is assumed to contain a log-normal distribution of pores. In these
circumstances, for a specific defect, the probability that its length falls between c and c+dc is
f(c)dc. with f(c) defined as:
nc)-Constant x e x p [ - | ( l n 21
C " el n 5 < > ?»] ( 2 0 >
2 l n S
Where So is the mean pore size and Sd is a constant reflecting the spread of the distribution. The
probability that one tip of a single defect will cause failure under applied stress o may now be defined
from equations (19) and (20) as:

ff(c)-Pt(o,c)dc
However there are NV such defects in the specimen, where N is the number of pores per unit
volume and V is the specimen volume. Each has a survival probability of one minus its failure
probability, i.e..
Ps=l-ff(c) -PAo,c)dc (22)
The total survival probability of the volume V under stress o, containing 2NV crack tips, is thus
(p l): sv, and the total probability of failure of the specimen or stressed volume may be written as:
P.oe=l - (Ps) 2 W=l - [ 1 -jf (c) •?, (o, c) del -
(23)
4.0 FRACTURE MODEL PERFORMANCE
4.1 INPUT PARAMETERS
The following input parameters are required to code the model:
Particle Critical Stress Intensity Factor, Ku (MN»m")Mean Filler Particle Size, a (m)Mean Pore Size (log-normal distribution), So (m)Standard Deviation (log-normal distribution), Sd
Density, p (g enr)Number of Pores per Unit Volume. N (m*)Stressed Volume, V (m?)Specimen Breadth, b (m).
The values used for the two graphites modelled in this work are given in Table 1.
Details of the mean filler panicle and pore sizes have been obtained for IG-110 from various
sources.*- For H-451. the data are experimental measurements. The particle KIc is taken as one
tenth of the graphites bulk Kic as reported by Romanoski and Burchell.6 The ratio Kic (bulk) to K!c

10
(particle) was arbitrarily chosen as 10. Huwevcr, particle fracture will occur along the weak planes
between the crystallographic a planes. Consequently, a reduced Kle would be anticipated for such
a fracture process. Moreover, K,c has been shown to reduce with volume6 and the particle volume
much less than thai of the fracture mechanics specimens that would typically be used to determine
bulk Kj=. The stressed volume is taken to be the volume of graphite within the gauge length of the
tensile specimens modelled ( A S T M C749, type 113).7 Further details of the specimen geometry are
given by Strizak.8
Table 1. Model Input Parameters for Grade H-451 and IG-110 Graphites
Model Input Parameters
Particle K!c (MNrnT5-)
Mean Part. Size, a (mm)
Density, p (g, cmJ)
Mean Pore Size, So (um)
Standard Dew, Sd
No. Pores per nv\ N (m5)
Specimen Volume, V (m3)
Specimen Breadth, b (mm)
Grade H-451
0.135
0.50
1.79
4.1
1.75
1.58 x 10!0
3.17 x 10⁻⁶
8.44
Grade IG-110
0.098
0.020
1.75
3.6
1.66
2.19 xlO10
3.17 xlO*
8.44
The specimen breadth is taken as the dimensions of a square with the same cross-sectional area as
the cylindrical ASTM tensile specimens. The number of pores per unit volume (N) is calculated as
follows:
4 Fslit
(24)
where
(25)2 . 2 6
and where p is the graphite bulk density and 2.26 g/cm3 is the theoretical crystal density. There are
certain assumptions inherent in this approach to calculating N. Firstly, it is assumed that all pores
are spherical and of the same size (given by the mean of the pore-size distribution). Secondly, it is

11
assumed that the fractional pore area (as observed from a metallographie section) equals the bulk
pore volume as calculated above. These stereographic assumptions may be valid for an ideal system
containing randomly distributed spherical pores of identical size, but unfortunately graphite is far from
ideal in this respect.
4.2 COMPARISONS OF MODEL PREDICTIONS AND EXPERIMENTAL DATA
Experimental strength data were taken for two nuclear graphites, Great Lakes Carbon Corporation
grade H-451 and Toyo Tanso Company grade IG-11Q, using ASTM C749 type 113 tensile specimens.
For each material the model was coded with the input parameters shown in Table 1. The predicted
failure probabilities are compared with the experimental data in Figs. 5 and 6. In the case of H-451
(Fig. 5) the prediction of the failure probability distribution is excellent. The very close agreement
of the predicted and experimental mean (SQft failure probability) tensile strength of the graphite is
particularly encouraging. Moreover, the shape of the distribution is correctly predicted for this
graphite grade. However, the agreement between experimental data and model prediction is less
good in the case of IG-110 graphite (Fig. 6). This is perhaps evidence that the failure mechanism
assumed in the model is less applicable to fine grained graphites such as IG-110. Indeed, it has been
shown that fine-grained graphites exhibit much less sub-critical cracking, or process-zone activity
during fracture tNn do coarser-grained graphites.3 Quantitatively, this is shown by the lower bulk
Kk of IG-110 compared with that of H-451.6 Despite the poorer performance in the latter case, the
model does display considerable versatility in being able to predict the behavior of two graphites with
significantly different microstructures.
4.3 THE INFLUENCE OF INPUT PARAMETER VARIATION ON MODEL PERFORMANCE
To assess the physical soundness of the fracture model a series of cases where run using the H-451
ASTM type 113 as the base case. In each set of mode) cases, one of the input parameters was
systematically varied, while the other parameters were held constant. The model inputs can be
categorized into three general groups: (i) particle related (Kk and a), (ii) porosity related input
parameters {p, So, Sa and N). and (iii) specimen geometry related parameters (V and b). The model
response to variations of input parameters in each of these categories is discussed below.

12
43.1 Particle Related Inputs
Figure 7 shows the influence of particle Klc on the predicted failure probabilities for H-451. In this
figure, as in all of the figures in section 4.3, the center distribution is the prediction shown in Fig, 5.
The model is clearly very sensitive to variations in the particle KIc, small changes in Ku causing large
changes in the pred cted mean strcng'h. The model predicts increased strength with increasing Kjc.
This is not generally the case vtfth graphites, the stronger graphites usually exhibit lower toughness.
However, here we are not adjusting other parameters such as pore size and distribution, and filler
particle size, which woulu change markedly from coarse to fine grained graphites. The effect of one
of these input parameters, mean filler particle size, is shown in Fig. 8. The model is less sensitive
to changes in particle size than in Ku. Moreover, the prediction of a lower strength for coarser
particle size graphites is qualitatively correct. This result reinforces the view that the basis of the
model is physically sound.
4.3.2 Porosity Related Inputs
The influence of density on the predicted failure distributions is shown in Fig. 9. Three densities are
considered, ranging from 1.65 to 1.95 g/cm3. The dependence of density is weak, but is qualitatively
correct, i.e., lower strengths are predicted for lower density graphites. Again, one must consider that
in reality lower density grade graphites would vary significantly in the number, mean size, and shape
of their pores. In the model, density is linked to the number of pores (N) as described previously.
The influence of N on the predicted failure distributions is shown in Fig. 10. Here changes in the
number of pores have been achieved by taking three different mean pore sizes, 2.0,4.1, and 6.0 am.
The corresponding values of N are then 6.62 x 10¹⁰. 1.58 x 10¹⁰, and 7.36 x 10⁹. The number and
mean size of the pores have a significant effect on the predicted failure probabilities, which is not
surprising, when one considers the importance of porosity in the initiation and propagation of cracks
during graphite fracture. Again, the model is qualitatively correct, predicting lower strengths for
graphites with larger and more numerous pores. The last input parameter in this category is the
standard deviation of the log-normal pore size distribution (Sd). A large value of Sd is indicative of
a wide pore size distribution, such as might be observed in a coarse-grained graphite. The influence
of Sd on the predicted failure probabilities is shown in Fig. 11. The model is extremely sensitive to
small changes in this input parameter. Reducing Sd from 1.75 to 1.65 causes an increase in the

13
predicted mean strength from 16 MPa to approximately 21 MPa. Again, the model is qualitatively
correct- The large effect of Sj variations is reasonable given the prominent role of porosity in
graphite fracture processes. The good performance of the model in accounting for changes in input
parameters in this category can be attributed to the sound physical basis of the fracture model.
433 Specimen Geometry.1 Related Inputs
Variations of specimen geometry were modeled by inputing the stressed volumes and appropriate
equivalent beam breadths for the four recommended ASTM C749 tensile test specimens. The value
of V and b are shown in Fig. 12 along with the models predicted failure probabilities. Th<a model
predicts an increasing strength with decreasing specimen volume, which is in agreement with other
failure theories such as the Weibull model. The model is more sensitive to increases of stress volume
at small initial volumes than it is for increases at larger volumes. This is apparent from a comparison
of the predictions from specimen types 109 and 113, and of types 123 and 129. The effect of stress
volume on the strength of H-451 and IG-110 is discussed in detail elsewhere.8
5.0 CONCLUSIONS
A fracture model has been developed and applied to predict tensile strength distributions for two
nuclear grade graphites. The models performance was assessed by comparison of prediction with
experimental data, and was found to be remarkably good, particularly for the medium-grained H-451
graphite. Moreover, the model demonstrated a high degree of versatility in predicting the failure
probability distribution for the fine-grained grade IG-110 graphite. The effects of varying the
micTcstructural inputs to the model were investigated, fhe model behavior is quantitatively correct
with respect to changes in filler particle size, density, pore size and shape, the number of pores and
the specimen geometry (stressed volume). The impressive performance is attributed the sound
physical basis of the fracture model, which recognizes the dominant role of porosity in the graphite
fracture process.

14
6.0 REFERENCES
1. M. O. Tucker, A. P. G. Rose and T. D. Burchell. The Fracture of Polygrannular Graphite,"Carbon, Vol. 24. No. 5, pp. 581-602, 19S6.
2. T. D. Burchell, M. O. Tucker and B. McEnaney, "Qualitative and Quantitative Studies ofFracture in Nuclear Graphites," in Proc. Materials for Nuclear Reactor Core Application,BNES. London. 19S7.
3. T. D. Burchell. "Studies of Fracture in Nuclear Graphite," Ph.D. Thesis, University of Bath,UK.19S6.
4. Manufactures Product Literature, Toyo Tarr,o Graphite Company Ltd.
5. S. Sato, K. Kawamata, A. Kurumada, H. Ugachi and H. Awaji. "Degradation of ThermalShock Resistance and the Fracture Toughness of Reactor Graphite Subjected to NeutronIrradiation," in Proc. L4E4 Specialist's Meeting on Graphite Component Structural Design,JAERI Tokai, Japan. Sept. 8-lL 1986, p.144, 1987.
6. G, R. Romanoski and T. D. Burchell. "Specimen Size Effects on Fracture Toughness ofNuclear Graphites," in Proc, IAEA Specailists Meeting on The Present Status of GraphiteDevelopment for Gas-Coded Reactors, JAERI Tokai, Japan, Sept 9-12, 1991.
7. ASTM Standard C749-S7. "Standard Test Method for Tensile Stress-Strain of Carbon andGraphite," Annual Book of ASTM Standards, Vol. 1501, 1990.
8. J. P. Strizak. The Effect of Volume on the Tensile Strength of Several Nuclear GradeGraphites," in Proc IAEA Specailist's Meeting on The Present Status of GraphiteDevelopment for Gas-Cooled Reactors, JAERI Tokai, Japan, Sept 9-12, 1991.
15
ORNL-OWG 91 -14137
r
V / / / / / / /
r-^-n ^ | J
INHERENTPOROSITY
CLEAVAGEPLANES
Figure !. Graphite .Microstructure as Conceived in the Fracture Model

16
ORNL-DWG 91H4278A
Figure 2. The Stress o\y acting on a point distance r along a plane x' rotated throughangle © from the plane x.
ORNL-DWG 91-14135
NOT FAILEDKIc
FAILEDKl>K Ic
Figure 3. Scematic illustration of the failure criterion.

17
ORNL-DWG 91-14136
CLEAVAGEPLANES
Figure 4. A row of graphite particles ahead of a crack length c and breadth b.
! 3-.Het SS-293JC - Radius 6 (181 mm),
: ASTM 9 53 mra:- - dia specs
100
o Experimental Data§- • Model Prediction
15 20
ASTM 9 S3 mmdia Specimens
50
70
60
50 (-
40 -
IC -
2C
10 -
oo
ooo
oo
•1
-I
o Experimental Data
• Model Prediction
.Stress.
24 26 2E
Stress. M?c
Figure 5. Comparison of predicted andexperimenta] failure probabilities forgrade H-451 graphite.
Figure 6. Comparison of predicted andexperimental failure probabilities forgrade IG-110 graphite.

18
- ••' - • t.t T T
" 3c o :so• 0 125* 0 150
Sfess.
j ASTM 9 35 mm50 r dia specs
SO i-
70
* £°1 52 j -x i
£ "°p. 30 1-
4•0 -
' . ; O
'Strew,
Mean ParticleS:ie (mm)
o 030• 0 50? 1 so
Figure 7. The influence of particle KIc onthe predicted failure probability.
Figure 8. The influence of mean particle size(a) on the predicted failure probability.
30
3D
70
60
-
"5
Si'ess.
Uensi
c
•
2
M = -
1 65
5 "9
: ss
3 2 :
-'- ~i
20 •-i
•:• -
• c
• o (30* m) (m" )
• 4 1 l 5ExiO'T 60 73SxlD*
Sfess, MPc
Figure 9. The influence of density on thepredicted failure probability.
Figure 10. The influence of mean pore size (So)and number (N) on the predicted failureprobability.

19
100
SOL
,»««»••
: rso r
so -
i 5 0 r
'5
c X 65• 175f 1 65
:o
J3
90
80
70
60
50
40
30
20
10
0
ASTM C-749 '. Designation
o 1C9• • 113
v 123- * 129
w
-
- V
ifSB*O » » ^ 1 -
• o_ ov •
* O•
* o•
o
-
-
*o Spec Volume/W1dthVol
0 Cio-V3)
O 141• 3 17* 12 56* 51 46
Width -(10"3m)
5.62 .8 4414.07 -2251
10
Stress.
15 20
Stress, MPo
25
Figure 11. The influence of pore sizedistribution width (Sd) on the predictedfailure probability-.
Figure 12. The influence of specimen size(V and b) on the predicted failure probability.