for internal use only the us core growth strategy a product that you can trust
TRANSCRIPT

FOR INTERNAL USE ONLY
The US Core Growth StrategyA product that you can trust

The US Core Growth strategy - Introduction
● Proven ability to outperform
● Attractive differentiating points
● Satisfied clients throughout the world
A product that you can trust
2

The US Core Growth strategy – Main characteristics
● Full investment in large US companies at all times– Typical holdings similar in size and liquidity to S&P 500 components
● Truly active approach: risk is fine as long as it is rewarded– Target vs S&P 500 Index: 200-300 bps annualized excess return, 7% tracking-error (*)
● Transparent source of performance– All investment decisions based on pure bottom-up analysis
Simple and pure
3
(*) These performance objectives were set on the basis of simulations as well as actual historical returns. Future performance may differ.

The US Core Growth strategy – Investment philosophyThe best of both quantitative and judgemental methods
4
● In highly efficient markets, structuring intuition to eliminate emotion, and thus focus on what really makes the difference, is key to achieving superior performance results (*)
● A consistent approach, involving a reasonable use of computer processing in those areas where it is more effective than human judgment, will help achieve this objective
● Human judgment remains an important complement to quantitative analysis, in that it combines depth and adaptability
(*) BNPP IP is not guaranteeing superior results. The value of any investment may go up as well as down.
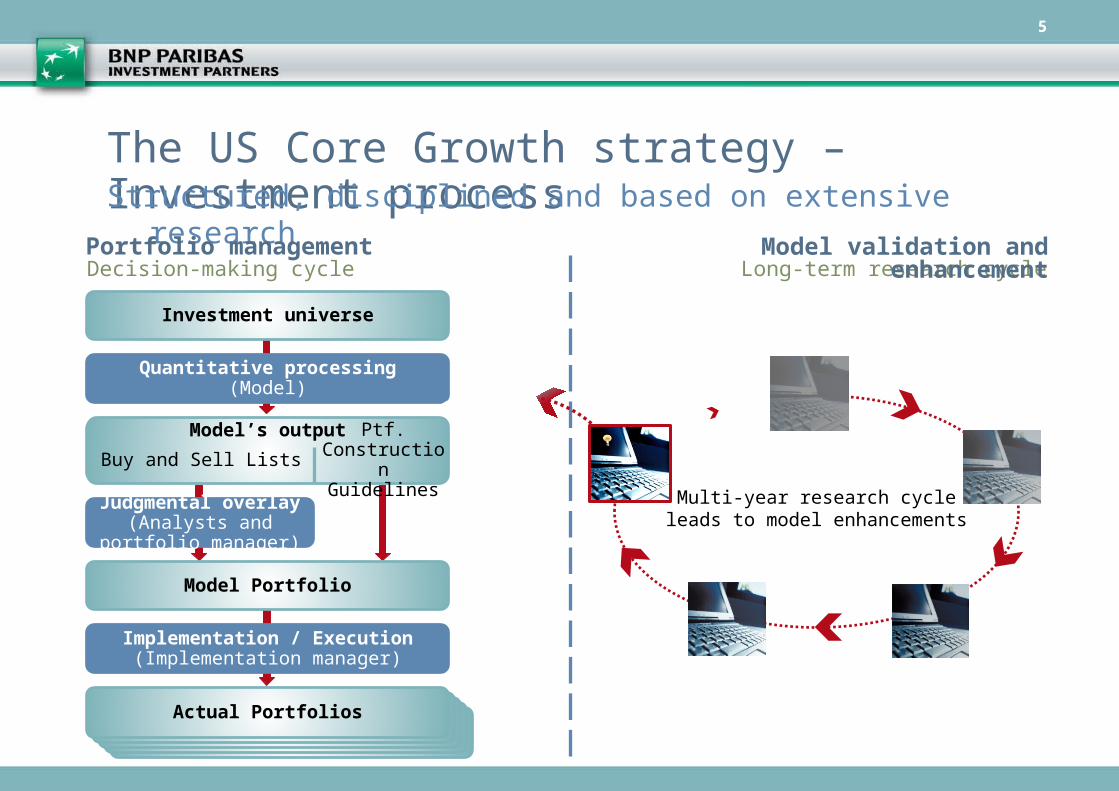
The US Core Growth strategy – Investment processStructured, disciplined and based on extensive research
5
Investment universe
Model Portfolio
Actual PortfoliosActual PortfoliosActual PortfoliosActual PortfoliosActual Portfolios
Quantitative processing(Model)
Judgmental overlay(Analysts and portfolio manager)
Implementation / Execution(Implementation manager)
Model’s outputPtf. Construction
GuidelinesBuy and Sell Lists
Portfolio managementLong-term research cycle
Model validation and enhancementDecision-making cycle
Multi-year research cycleleads to model enhancements
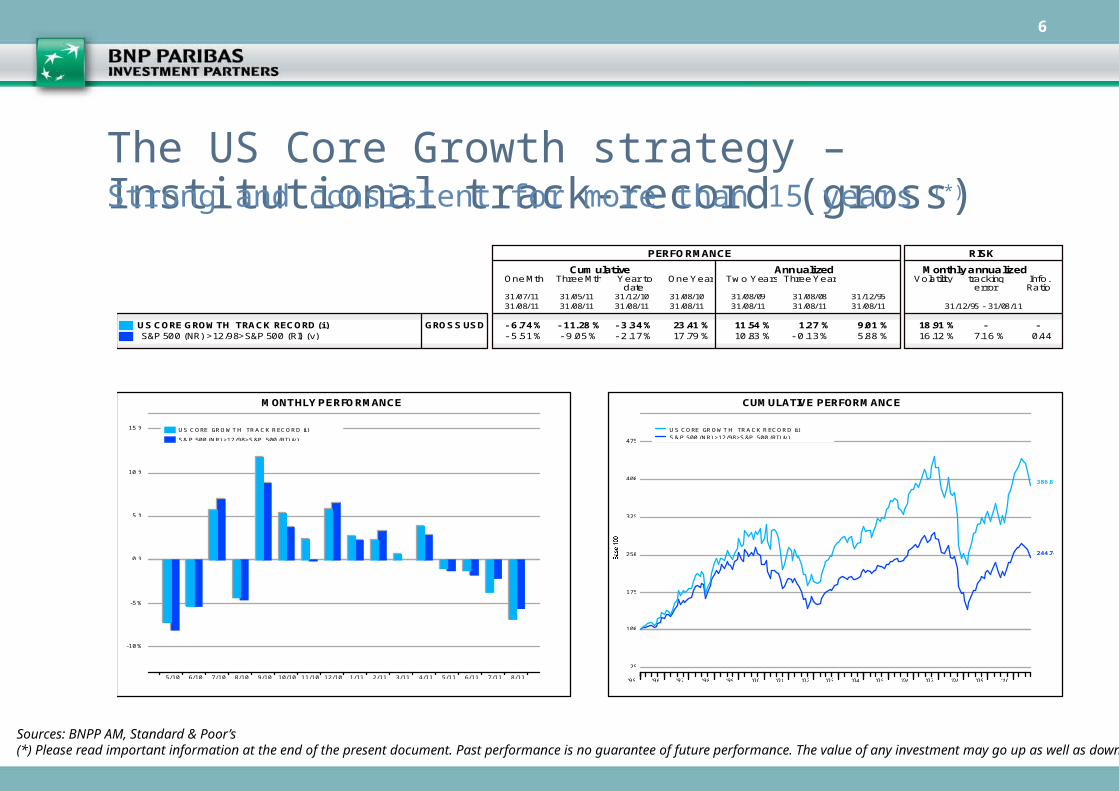
The US Core Growth strategy – Institutional track-record (gross)Strong and consistent for more than 15 years (*)
6
Sources: BNPP AM, Standard & Poor’s(*) Please read important information at the end of the present document. Past performance is no guarantee of future performance. The value of any investment may go up as well as down.
PERFORMANCE RISK
Cumulative Annualized Monthly annualizedOne Mth Three Mth Year to
dateOne Year Tw o Years Three Years Volatility tracking
errorInfo.Ratio
31/07/ 1131/08/ 11
31/05/ 1131/08/ 11
31/12/ 1031/08/ 11
31/08/ 1031/08/ 11
31/08/ 0931/08/ 11
31/08/ 0831/08/ 11
31/12/ 9531/08/ 11 31/12/ 95 - 31/ 08/11
US CORE GROWTH TRACK RECORD (i) GROSS USD - 6.74 % - 11.28 % - 3.34 % 23.41 % 11.54 % 1.27 % 9.01 % 18.91 % - - S&P 500 (NR) >12/98>S&P 500 (RI) (v) - 5.51 % - 9.05 % - 2.17 % 17.79 % 10.83 % - 0.13 % 5.88 % 16.12 % 7.16 % 0.44
US CORE GROWT H TRACK RECORD (i )
S&P 500 (NR) >12/98>S&P 500 (RI ) (v)
5/10 6/10 7/10 8/10 9/10 10/10 11/10 12/10 1/11 2/11 3/11 4/11 5/11 6/11 7/11 8/11
15 %
10 %
5 %
0 %
-5 %
-10 %
MONTHLY PERFORMANCE
'95 '96 '97 '98 '99 '00 '01 '02 '03 '04 '05 '06 '07 '08 '09 '10
475
400
325
250
175
100
25
S&P 500 (NR) >12/98>S&P 500 (RI ) (v)
244.74
US CORE GROWT H TRACK RECORD (i )
386.81
CUMULATIVE PERFORMANCE

The US Core Growth strategy – Performance by calendar yearProven achievements in multiple types of market environments (*)
7
Sources: BNPP AM, Standard & Poor’s(*) Please read important information at the end of the present document. Past performance is no guarantee of future performance. The value of any investment may go up as well as down.
30.3
39.9
28.1
20.6
-0.1
-6.5
-25.
1
39.6
10.8 12
.8
10.8
11.2
-40.
8
33.2
19.9
-3.3
23.0
33.4
28.6
20.6
-9.4
-12.
2
-22.
5
28.0
10.2
4.3
15.1
4.9
-37.
5
25.6
14.4
-2.2
-50
-30
-10
10
30
50
Ret
urn
(%)
August 31, 2011US Core Growth S&P 500
Annual returns – US Core Growth vs S&P 500 Index (net dividend reinvested)

The US Core Growth strategy – Performance vs peer groupAmong the best in our peer group, as monitored by Mercer over the last 15 years
8

Why present the US Core Growth strategy to your clients ?
● Most large investors have a structural exposure to the US equity market– They can’t ignore an area which represents more than half of the MSCI World Index
● There are opportunities even if allocations to US equities are stable or down– Mandates taken away from poor performers represent huge amounts every year
● Interest in equities, and particularly US equities, can only rise in the future– Current valuations should look compelling to long-term investors
A key asset class at all times of the market cycle…
9

What will your clients like in the US Core Growth strategy? (1/5)
● The strategy’s purity facilitates use as part of an asset / style mix– Pure exposure to a precise segment within a specific market– Well-defined investment style– Precise risk and return objectives
● Our 15-year, relevant track-record is a comforting point that few managers can rival– Full consistency between past achievements and stated objectives– Same portfolio manager over the whole period– Regular process enhancements within a stable framework
Investors in US Core Growth know precisely what they are buying
10
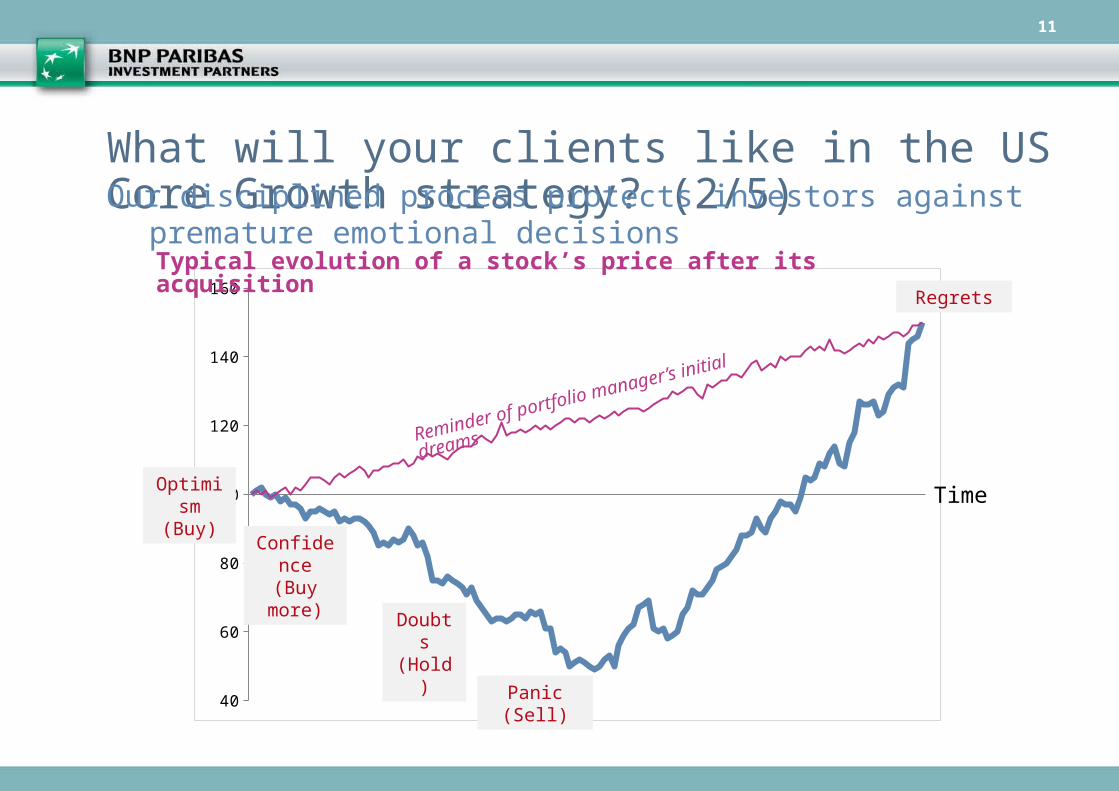
What will your clients like in the US Core Growth strategy? (2/5)Our disciplined process protects investors against premature emotional decisions
11
40
60
80
100
120
140
160
Optimism (Buy)
Confidence (Buy more)
Doubts(Hold)
Panic (Sell)
Regrets
Typical evolution of a stock’s price after its acquisition
Reminder of portfolio manager’s initial dreams
Time
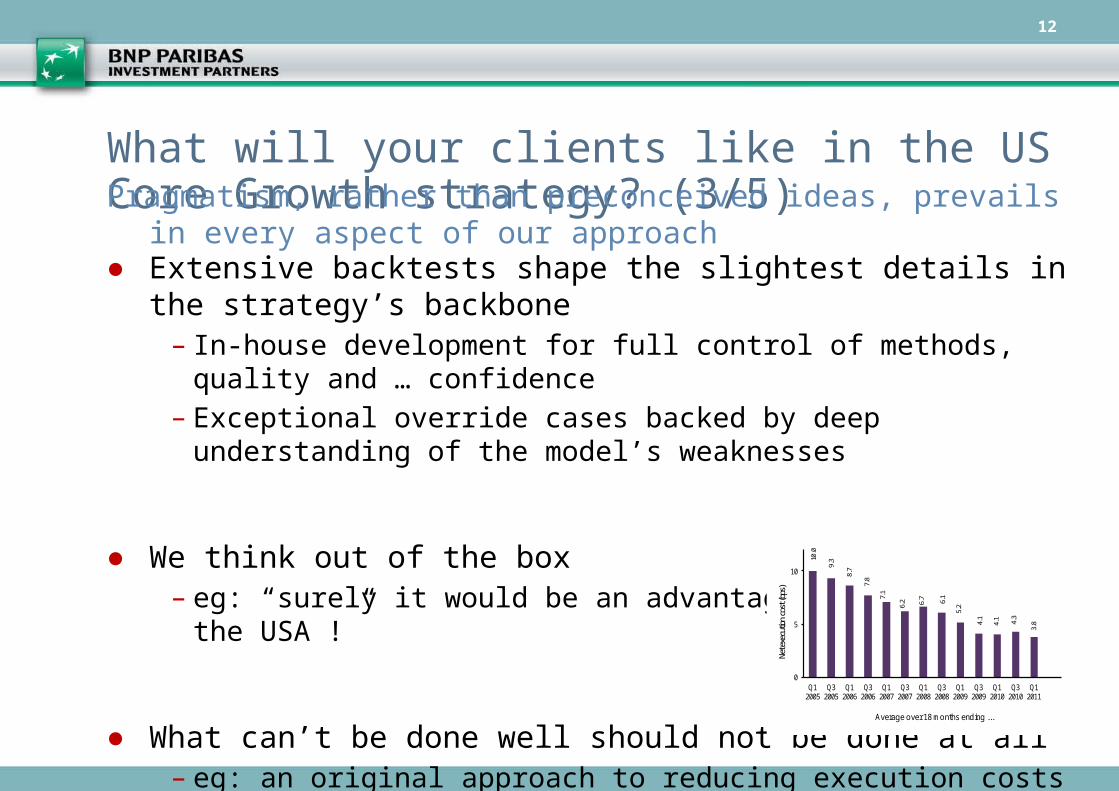
What will your clients like in the US Core Growth strategy? (3/5)
● Extensive backtests shape the slightest details in the strategy’s backbone– In-house development for full control of methods, quality and … confidence– Exceptional override cases backed by deep understanding of the model’s weaknesses
● We think out of the box– eg: “surely it would be an advantage to be based in the USA !”
● What can’t be done well should not be done at all– eg: an original approach to reducing execution costs
Pragmatism, rather than preconceived ideas, prevails in every aspect of our approach
12
10.0
9.3
8.7
7.8
7.1
6.2 6.
7 6.1
5.2
4.1
4.1 4.3
3.8
0
5
10
Q1 2005
Q3 2005
Q1 2006
Q3 2006
Q1 2007
Q3 2007
Q1 2008
Q3 2008
Q1 2009
Q3 2009
Q1 2010
Q3 2010
Q1 2011
Net e
xecu
tion
cost
(bps
)
Average over 18 months ending ...

What will your clients like in the US Core Growth strategy? (4/5)
● Strong experience of professional investors’ expectations– Clientele almost entirely comprised of such demanding customers
● Team trained and dedicated to meeting such investors’ demand– Two dedicated Product Specialists with deep technical knowledge– On-site due-diligence visits very welcome
We are used to managing for sophisticated, highly demanding investors
13
Institutions73%
Wholesale24%
Retail3%
What will your clients like in the US Core Growth strategy? (5/5)
● We are probably the largest specialist US equity manager in continental Europe
● We seem to be the only European manager to manage US equities for US institutions
● The last time we lost an institutional mandate was in 1999
● The best proof of clients’ satisfaction is when they stay and give us more to manage
Our client references should look reassuring to them
14

The US Core Growth strategy - Conclusion
● Proven ability to outperform– Meaningful track-record with 313 bps annualized excess return over more than 15 years
● Attractive differentiating points– Transparency, discipline and pragmatism
● Satisfied clients throughout the world– One of BNPP AM’s best sellers over the last decade
A product that you can trust
15
US Core Growth strategyImportant information
16
This document is produced by BNP Paribas Asset Management (“BNPP AM”)*, a member of BNP Paribas Investment Partner (“BNPP IP”)**, for information purposes only, and does not constitute an offer to buy nor a solicitation to sell, nor shall it form the basis of or be relied upon in connection with any contract or commitment whatsoever, or be taken as investment advice.
The information contained in this document is provided without prior knowledge of your circumstances, including your financial position, risk profile and investment objectives, and does not constitute a personal recommendation nor investment advice. Investors are recommended to seek the advice of their usual financial adviser in order to assess the suitability of a financial product as an investment.
The institutional track-record shown in the present document (“the Institutional Track-Record”) is based on the unaudited performance of six different accounts shown over six consecutive time periods comprising the period covered by the track-record. Each account was managed in accordance with the US Core Growth equity management strategy of BNPP AM. For each time period, the account used was the segregated or institutional commingled account that, among those managed strictly in accordance with this strategy, was deemed at the time of inclusion to offer the most typical characteristics of an institutional account. By exception, in August 1999, the performance from a retail mutual fund using the same strategy was used due to the non-availability of a representative institutional account. While this retail mutual fund uses the same strategy, it cannot be considered fully representative since it is subject to daily changes in asset levels due to subscriptions and redemptions, and it is subject to a higher level of expenses (which do not include the advisory fee actually paid). From August 1999 till 25th September 2002, the accounts used were proprietary accounts of BNP Paribas and/or its subsidiaries. The Institutional Track-Record was re-calculated in June 2008 due to the discovery that certain performance, primarily in 2002, did not comport with that in our underlying documentation.
Performance figures are calculated according to time-weighted total returns with net dividend, interest and other earnings reinvested.
Unless indicated otherwise, performance figures are stated “gross of fees”, and do not reflect the deduction of advisory fees or other expenses that may be incurred in the management of an investment account. Returns will be reduced according to such deductions. For open-ended mutual funds, fee schedules and performance figures calculated net of fees may be obtained upon request. For institutional accounts, advisory fees will be set out in the management agreement between the client and investment adviser. Management fees compounded over a period of several years may affect the total value of an investor's portfolio (e.g. the impact of a 1.0% annual fee charged over 5 years would be in excess of 5%). Past performance is no guarantee of future results.
An index, such as the S&P 500, is a broad measure of the market performance of a specific group of securities in a particular market or sector. You cannot invest directly in an index. An index does not have an adviser and does not pay commissions or expenses. If an index had expenses, its performance would be lower.
Given the economic and market risks, there can be no assurance that the investment strategy mentioned herein will achieve its investment objectives. Returns are affected by, among other things, advisory or other expenses that may be incurred in the management of an investment account, the investment limitations and restrictions of the portfolio, applicable regulations and economic conditions. The value of an investment account may decline as well as rise. Investors may not get back the amount they originally invested.
* BNPP AM is an investment manager registered with the “Autorité des Marchés Financiers” in France, a simplified joint stock company with a capital of 62,845,552 euros with its registered office at 1 boulevard Haussmann 75009 Paris, France, RCS Paris 319 378 832. www.bnpparibas-am.com.
** “BNP Paribas Investment Partners” is the global brand name of the BNP Paribas group’s asset management services. The individual asset management entities within BNP Paribas Investment Partners if specified herein, are specified for information only and do not necessarily carry on business in your jurisdiction. For further information, please contact your locally licensed Investment Partner.