for customer relationship management - michigan · parameters relevant for “relationship...
TRANSCRIPT

FISHERIES DIVISION
STATE OF MICHIGANDEPARTMENT OF NATURAL RESOURCESMICHIGAN
DEPA
RTM
ENT O
F NATURAL RESOURCESDNR
www.michigan.gov/dnr/
RESEARCH REPORT 2088
Angler Participation, Recruitment, and Retention in Michigan, 1995–2004: Using Data-mining Techniques
for Customer Relationship Management
RR2088 March 2008
Shari L. Dann, Angelita Alvarado,Dain Palmer, Brandon Schroeder, and Mark Stephens

This page was intentionally left blank.
MICHIGAN DEPARTMENT OF NATURAL RESOURCES (DNR) MISSION STATEMENT“The Michigan Department of Natural Resources is committed to the conservation, protection, management, use and enjoyment of the State’s natural resources for current and future generations.”
NATURAL RESOURCES COMMISSION (NRC) STATEMENTThe Natural Resources Commission, as the governing body for the Michigan Department of Natural Resources, provides a strategic framework for the DNR to effectively manage your resources. The NRC holds monthly, public meetings throughout Michigan, working closely with its constituencies in establishing and improving natural resources management policy.
MICHIGAN DEPARTMENT OF NATURAL RESOURCES NON DISCRIMINATION STATEMENTThe Michigan Department of Natural Resources (MDNR) provides equal opportunities for employment and access to Michigan’s natural resources. Both State and Federal laws prohibit discrimination on the basis of race, color, national origin, religion, disability, age, sex, height, weight or marital status under the Civil Rights Acts of 1964 as amended (MI PA 453 and MI PA 220, Title V of the Rehabilitation Act of 1973 as amended, and the Americans with Disabilities Act). If you believe that you have been discriminated against in any program, activity, or facility, or if you desire additional information, please write:
HUMAN RESOURCES OrMICHIGAN DEPARTMENT OF NATURAL RESOURCESPO BOX 30028LANSING MI 48909-7528
MICHIGAN DEPARTMENT OF CIVIL RIGHTS OrCADILLAC PLACE3054 W. GRAND BLVD., SUITE 3-600DETROIT MI 48202
OFFICE FOR DIVERSITY AND CIVIL RIGHTSUS FISH AND WILDLIFE SERVICE4040 NORTH FAIRFAX DRIVEARLINGTON VA 22203
For information or assistance on this publication, contact the MICHIGAN DEPARTMENT OF NATURAL RESOURCES, Fisheries Division, PO BOX 30446, LANSING, MI 48909, or call 517-373-1280.
TTY/TDD: 711 (Michigan Relay Center)
This information is available in alternative formats.
MICHIGAN DEPARTMENT OF NATURAL RESOURCESFISHERIES DIVISION
Angler Participation, Recruitment, and Retention in Michigan, 1995–2004: Using Data-mining Techniques for Customer Relationship Management
Fisheries Research Report 2088 March 2008
Shari L. Dann, Angelita Alvarado,Dain Palmer, Brandon Schroeder, and Mark Stephens
Printed under authority of Michigan Department of Natural ResourcesTotal number of copies printed 70 — Total cost $360.27 — Cost per copy $5.147
MICHIGAN
DEPA
RTM
ENT O
F NATURAL RESOURCESDNR

Suggested Citation Format
Dann, S. L., A. Alvarado, D. Palmer, B. Schroeder, and M. Stephens. 2008. Angler participation, recruitment, and retention in Michigan, 1995–2004: using data-mining techniques for customer relationship management. Michigan Department of Natural Resources, Fisheries Research Report 2088, Ann Arbor.

1
Michigan Department of Natural Resources Fisheries Research Report 2088, 2008
Angler Participation, Recruitment, and Retention in Michigan, 1995–2004: Using Data-mining Techniques for Customer Relationship Management
Shari L. Dann
Michigan State University; Department of Community, Agriculture, Recreation and Resource Studies, 147B Natural Resources Building, East Lansing, Michigan 48824
Angelita Alvarado, Dain Palmer, and Brandon Schroeder
Michigan State University, Department of Fisheries and Wildlife, 16 Natural Resources Building, East Lansing Michigan 48824
Mark Stephens
Michigan State University, Department of Community, Agriculture, Recreation and Resource Studies, 131 Natural Resources Building, East Lansing, Michigan 48824
Abstract.–Angling has provided a significant customer base for fisheries and aquatic resource management, yet with concern over declines in angler numbers, there is a great need to use computerized point-of-sale data to track and analyze changes in angler demographics. The purposes of this study were to demonstrate data mining techniques, to examine angler population dynamics including recruitment and retention trends in the state of Michigan, and to make recommendations regarding customer relationship management (CRM). We compiled preexisting data from national and state sources, and developed detailed protocols for analysis of angler license data for license years 1995 through 2004. Complex preprocessing and deduping protocols allowed for an innovative analysis of data for distinct customers and for matching of customer records to track retention rates over time. The number of distinct Michigan angling customers declined 14.5% over only 10 license years. The total proportion of the Michigan population as distinct angling customers also declined, while the mean age of anglers has increased substantially. Two-year retention rates, particularly among male anglers, declined over the 10-year period, with some stabilization in the last two license years. This project demonstrates that data mining and CRM analysis approaches are feasible. Recommendations include: putting computerized point-of-sale data to greater use to identify CRM opportunities and investing in diverse CRM strategies to build relationships between agencies and customers. Through this work, fisheries agencies will achieve greater benefits for aquatic resources through long-term CRM.
Introduction
Angling provides a significant customer base for fisheries and aquatic resource management throughout the Great Lakes region and particularly in the state of Michigan. In 2001, more than 1.3 million state residents took part in fishing in Michigan; total fishing expenditures of state residents

2
exceeded $958 million (USFWS 2004a). Angling’s economic impact is substantial in retail and other business sectors, across the state and region, and within local communities. The contribution of fishing-related dollars through license sales revenues and the Federal Aid in Sport Fish Restoration Program is likewise substantial, covering more than 90% of Michigan’s state expenditures for fisheries management each year.
The recreational value of being active outdoors is increasingly recognized as important in our sedate society with ever-greater numbers of children and adults who lack contact with nature (Louv 2005). Recreation trends research indicates that fishing has held its place since 1994 as the fifth most commonly practiced outdoor activity in the U.S., behind only walking for fitness/recreation, driving for pleasure, swimming, and picnicking (American Sportfishing Association 2004). The family and heritage values of angling were noted by the 1995 Governor’s Hunting and Fishing Heritage Task Force in Michigan, as was the importance of these outdoor recreation activities as a means of connecting citizens directly with their natural resources (MDNR 1996).
In spite of the size of the angling customer base and the importance of angling for Michigan residents, visiting nonresidents, communities, and the economy; researchers and managers have done little to analyze long-term trends using their license sales data, to apply well-established concepts from the field of customer relationship management (CRM), or to present these data in peer-reviewed scholarly research outlets. Instead, agency “white papers” are common (i.e., MDNR Fisheries Division 2003). Michigan has one of the longest-standing computerized point-of-sale license databases, but even in other states with more recent work to systematize these data, agencies have yet to “mine” fully the information in the databases or to act upon the knowledge gleaned to forge more sustainable relationships with angling customers.
The purposes of this study were: • To demonstrate the utility of data mining analytical techniques and customer-relationship
management approaches for understanding and reaching angling populations; • To develop a baseline analysis and reporting system, using a computerized point-of-sale license
system and data mining techniques, to track long-term angler participation trends; • To describe (then monitor) demographic segments in the angling population; • To examine angler population dynamics, including recruitment rates, retention rates, and other
parameters relevant for “relationship management.”
Background
During the 1990s, like counterparts in several states, Michigan resource managers became concerned about perceived declines in participation and recruitment into angling. These concerns have been realized. Analysis of the regular National Survey of Hunting, Fishing and Wildlife-Associate Recreation noted that between 1991 and 2001, Michigan experienced a 23% decline in its number of state freshwater anglers, a 24% decrease in the number of fishing days annually statewide by resident anglers, and a 43% drop in total fishing expenditures made by residents within Michigan (USFWS 2004a). Meanwhile, national angling participation fell only 4%, number of annual fishing days rose 9%, and expenditures held steady (USFWS 2004a). One reason state trends differ from national patterns is due in large part to each state’s demographic changes because of the size and aging of its large “Baby Boomer” cohort. One model that uses National Survey data predicts that changes in age-structure and overall population in Michigan will result in a decline to 856,000 anglers by 2020, a 39% decrease from the 1996 Survey estimate of 1.4 million anglers (Fedler and Holdnak 2000; Fedler and Leahy 2000). This analysis is based on the assumption that the proportion of anglers in each age group will remain constant in future years (Fedler and Holdnak 2000). This assumption

3
may not be realistic, however, and thus the combination of demographic changes as well as angling participation changes may have significant impacts on some states’ overall angler trends.
The National Survey data provide only a limited glimpse of any particular state’s angling trends, since this survey does not specifically monitor license sales trends. The National Survey is a phone survey which collects household-level data about angling activity and behavior, not license purchase behavior. The statistic of actual license buying behavior is of great interest to resource agencies that depend on license revenues for their management budgets.
In order to directly monitor angling license sales for the Federal Aid in Sport Fish Restoration Program, until the 1990s, states tracked trends through manual data manipulation techniques. Periodically, states like Michigan would conduct more in-depth analyses of angling population parameters such as age, sex, and participation rates (Jamsen 1967a, 1967b, 1979). Yet, with the available techniques for storing and analyzing data, detailed analyses of angling recruitment and retention were not possible.
Michigan was one of the first states in the U.S. to implement a computerized point-of-sale licensing system (also known as the Automated RSS — Retail Sales System) beginning in 1995. One main purpose of this system was to be able to track changes in customer behaviors regarding license purchase. Now the state is unique in having more than 10 full license years of data archived through the RSS. During 2000, Michigan Department of Natural Resources (DNR) Wildlife Division undertook a study of its constituencies by analyzing long-term trends in hunting license sales, using the RSS for computerized point-of-sale license data (Frawley 2001). This study inspired Michigan DNR Fisheries Division and Michigan State University researchers to undertake a similar analysis using angler license data.
Today, the practice of discovering meaningful patterns in large data sets regarding customers and prospective customers is called “data mining” (Lamb 2000; Pai 2004). Data mining, simply put, is “learning from data” or “turning data into information” (Glymour 1997). Data mining techniques are used to foster CRM, to improve marketing efficiency, and to advance knowledge discovery in databases (Peacock 1998a; Pai 2004).
More specifically, data mining has many potential uses, including those of interest to fisheries managers: customer acquisition, customer retention, and customer abandonment (analyzing when customers become too costly to retain) (Peacock 1998a). The goal of data mining is not merely to understand customers, but to provide “actionable insights” – target and strategy insights to inform customer management activities (Peterson 2003). Examples of analyses with actionable implications include understanding customer data to track “patronage” (i.e., repeated or sequenced behaviors), identifying customer behaviors in relation to locations (i.e., geographically relevant analyses), and lifestage analysis for customer targeting (i.e., tracking age and other lifestyle-lifestage demographics of customers) (Peterson 2003). A wide array of applications for data mining and CRM already exist in retail, banking, law enforcement, internet marketing, and many other fields (Lamb 2000; McCue et al. 2003).
The practice of maintaining large customer data sets and mining these data for tactical marketing of programs or products is the subject of controversy today. Several national and more local newsworthy cases in which data have been stolen, lost or breached by hacking have heightened public concern about the security and use of these data (for example, see Bailey 2004). Yet, these data hold tremendous potential for state resource agencies striving to understand changing constituencies in light of large-scale demographic and outdoor participation trends.
Ohio represents one sound example of a state agency that drew from its angler license data to develop a comprehensive CRM strategy through data mining and other business intelligence analyses. Ohio DNR’s Wildlife Division built a Recreational User Data Warehouse integrating point-of-sale license data for anglers, hunters, and watercraft registrations, and integrated these data with GIS data, other recreational service data, and lifestyle and demographic data (SAS 2005). The division then

4
developed customer-driven communication strategies based on their analyses of relationships among recreation behavior patterns of its customers, resulting in the improvement of “sales of state fishing licenses for the first time in 14 years,” and this effort “garnered more than $500,000 in increased revenue for the agency” (RBFF 2005; SAS 2005). Furthermore, these analyses were used in target marketing toward lapsed anglers, resulting in a 23% increase in Caucasians’ license renewal rate and a 36% increase in African Americans’ license renewal rates after exposure to specifically designed direct-marketing materials during a 2001 campaign (RBFF 2005).
Clearly anglers are only one type of fisheries customer, and the concept of “customer” is debatable in relation to other concepts in fisheries management, such as “stakeholder,” “clientele,” or “constituency.” Yet, understanding the dynamics of angler populations, which constitute fisheries agencies’ largest financial base, is as critical to the future of aquatic resources management and stewardship as is quantitative understanding of fish populations and aquatic habitats. Applying the current techniques of CRM and data mining to human dimensions fisheries data is at the cutting edge of sound resource management and business planning practice. With the computerized point-of-sale data in hand about our angling customers, fisheries management agencies and their partners are now poised to analyze and monitor key trends in angler participation. This analysis will, in turn, provide a model for states with more recent acquisition of computerized systems that will allow for future data mining.
With this greater understanding of one type of constituency, state and federal agencies working with diverse partners from retail, nongovernmental/nonprofit, and corporate sectors may be better able to provide the recreational, management and stewardship education programs needed to enhance and sustain our resources into the future.
Methods
The first step in this project was to compile existing data summaries from state and federal sources (Figures 1 and 2). These data consist of National Surveys of angling participation rates and state-level records of total raw numbers of licenses sold. State-level long-term records were maintained with diverse record-keeping practices and reporting protocols, yet general patterns can be observed in the data. For detailed methods of data analysis, see Appendix A.
The primary focus of this project, however was to analyze RSS computerized point-of-sale data for Michigan license sales, allowing for more complete and innovative analyses of recruitment and retention of distinct customers (unique individuals who purchased any angling license). Information Technology specialists within Michigan DNR extracted fishing license data from the RSS for the license years 1995 through 2004, and placed these data into a separate Microsoft Access database (in CD format) for each license year. These files included the following data tables: • customer table (CT; which included customer identification key, customer address key, and
customer’s base demographic information such as age and gender); • customer address table (AT; which included mailing address, state and zip code); • license types table (which included license types and requirements for purchase of each license
type for each respective year); • license tables (LT) for each individual license type for each year.
License types from the 1995 and 1996 license years were equated with types from 1997 to present, to allow for comparable analyses (Table 1). At present, the following license types include: Restricted (age 17+), All Species (age 17+), Young Angler/Voluntary (12–16 yrs), Senior-Restricted, and Senior-All Species. The Michigan angler license year spans from April 1 of a given year, through March 30 of the following year.
5
The next step in this project was to conduct data quality control in data mining, paying careful attention to “preprocessing” of the data (Peacock 1998b; Kim et al. 2003). The knowledge discovery process through data mining requires the early, pre-analysis steps of data funneling (gathering data into usable formats, movement of data to central collection points for analysis, and evaluating data quality), and preprocessing (Peacock 1998b). One of the most important steps is “deduping” – removing duplicate instances of the same individual resulting from address changes, data entry errors, and other causes; these errors are common in large-scale databases (Peacock 1998b).
Before analysis, we organized and cleaned the data sets according to the literature defining data mining and CRM procedures. Using the customer identification numbers as a primary sorting key, we developed a series of Microsoft Access queries and used these to remove voided licenses, as well as duplicate licenses of any given license type which were sold to the same individual in the same year. Duplicate licenses sold to the same customers were most likely voided license sales transactions occurring at the point-of-sale terminal, or the duplicates were purchased after customers lost their licenses and replaced them throughout the year (i.e., to participate in a new season such as ice fishing). We compared cleaned data against original data to ensure that voided and duplicate licenses were removed without losing individual customers. In addition, we compared our cleaned dataset with values reported to the U.S. Fish and Wildlife Service by the Michigan DNR License Control office; these reported values are the official numbers provided by the state to “certify” numbers of anglers for the Federal Aid in Sport Fish Restoration Program (USFWS 1958–2002, 2003, 2004b). Prior to our process of data cleaning, the license database consisted of more than 22% of its records as duplicates or voided licenses in 1995–1997; for subsequent years (1998–2004) only 11% of the data were “messy” (Table 2). Once we completed our data cleaning procedure, our analysis of total angler numbers matched those from the License Control office within ±1300 cases, and after the year 2000, the difference was insignificant. Without this detailed protocol, we would not have been able to arrive at our analysis for “distinct angling customers.”
We used Microsoft Access as the primary software to organize data for analysis. For the basic analysis of demographic and license types purchased by individual year, it was necessary to establish relationships between the various data tables belonging to each database for each respective license year. Using the customer identification numbers or individual customers as a primary sorting key, we built relationships between the CT and the LTs of the databases established for each license year. Additionally, using the “address key” associated with each unique “customer key,” we built relationships between the CT and the AT, linking all tables within each database through the common, but unique customer keys assigned to each individual customer. We developed a Microsoft Access query and used it to build a new Access table including the following information for each individual and unique customer key (source table indicated in parentheses): Customer Key (CT), Birth Date (CT), Gender (CT), State or Province (AT), Zip Code (AT), and each license table occurring for each license year (LTs).
For the retention analysis portion of this project it was necessary to develop relationships between individuals across license years. For this analysis, we compiled the CTs from each different license year into a new Microsoft Access database allowing for the development of relationships that linked individual, distinct customer keys across license years. We then developed a series of queries to identify customers who had purchased any fishing license in all years of each two- and three-year period from 1995 through 2004. We analyzed angler retention by compiling data identifying: 1) those purchasing during two consecutive year periods (e.g., 1995-96 or 1996-97); and 2) those purchasing during three consecutive years. We analyzed all data by age and sex of licensees. Finally, we analyzed resident angler participation in relation to the Michigan population, using U.S. Census data for comparison (U.S. Census Bureau 2000, 2005).
Once we sorted and organized data for analysis, a series of steps allowed us to import the results of the Microsoft Access data queries into SPSS for statistical analysis. We then exported SPSS

6
analysis output data into Microsoft Excel for describing and presenting the data and analyses graphically.
In meetings during 2003 and 2004, we presented these data to members of Michigan DNR’s Fisheries Division staff, to the division’s Management Team, to a Think Tank set of participants from Michigan DNR and from Michigan State University, and to staff/stakeholders working with the Recreational Boating and Fishing Foundation. In addition, we have shared these data with citizens, organizational leaders, and Michigan DNR Fisheries Division staff associated with the Lake Huron Fisheries Advisory Committee. Peers shared perspectives regarding both the data analysis procedures as well as potential reasons for the observed data trends. This technical input helped to shape final analysis procedures as well as the Discussion section of this manuscript.
Results
An examination of U.S. Fish and Wildlife Service (USFWS) estimates of the age distribution data for Michigan anglers from 1975 to 2006 indicated that the strong young adult “year class” of anglers observed in 1975 had not been repeated in subsequent years (Figure 1). These data showed clearly the “Baby Boomer” cohort (or “population bulge”) as it had moved through the Michigan angler population over the past 30 years.
The total raw number of licenses sold had declined precipitously since the mid-1980s, but this total number was sensitive to significant changes in license types offered by the state (Figure 2). Although there were data gaps from 1990–94 due to changes in license record-keeping prior to the RSS system and due to retirements of division employees analyzing these data, clear trends do emerge.
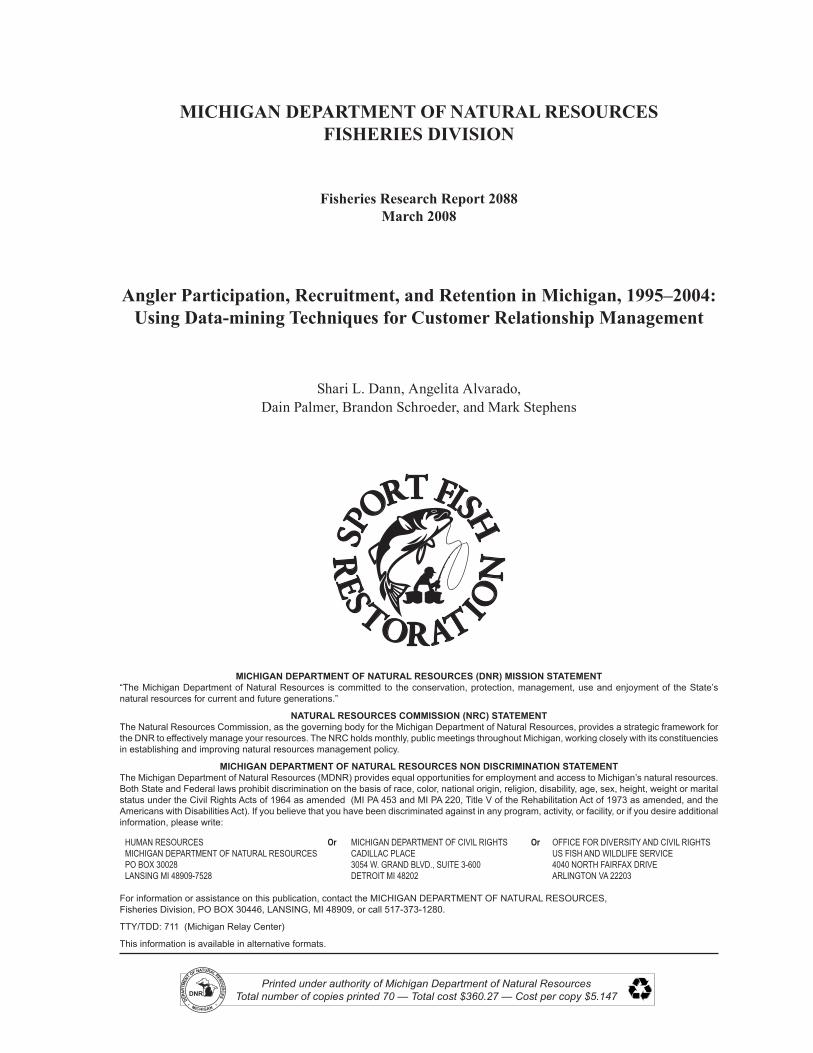
More detailed analysis of trends in “distinct angling customers” provided insight as to the overall status of recreational fishing in Michigan. The number of distinct customers in the angling population had declined notably from 1,370,104 in 1995 to 1,171,706 in 2004 (Table 3). This decline represented a 14.5% total decline in customers over 10 license years. Most of this decline had occurred in the male angler population (Figure 3).
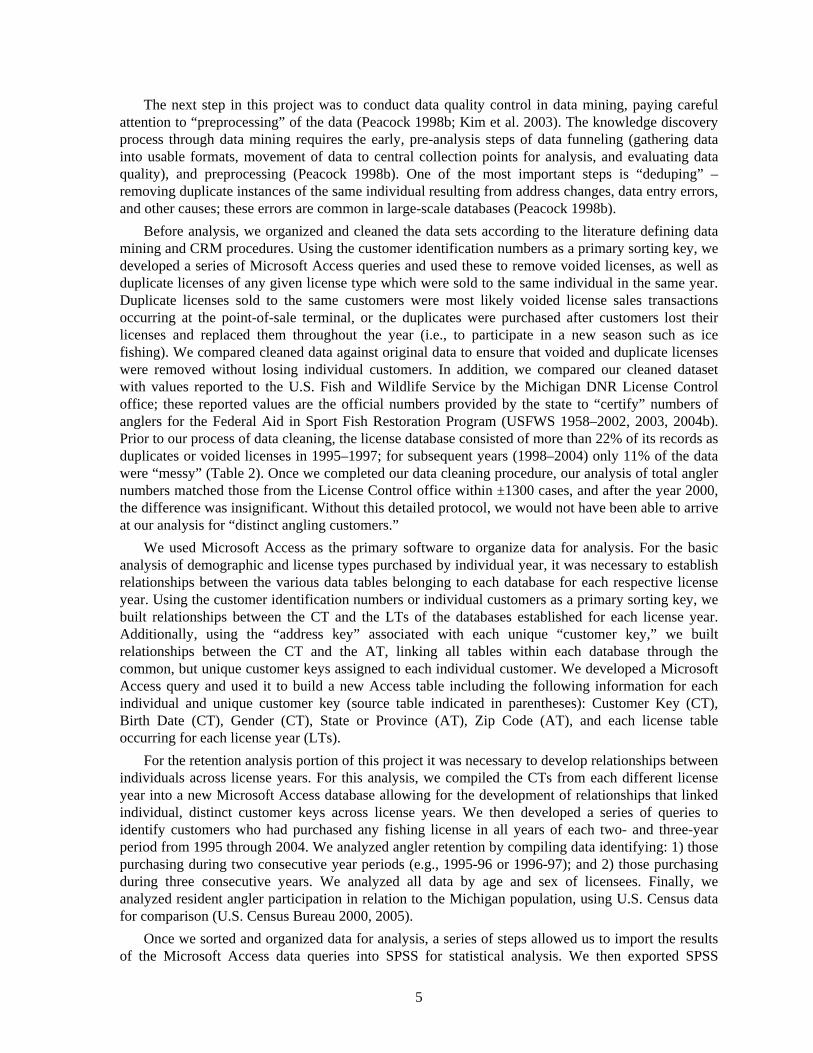
The total proportion of the Michigan population as distinct angling customers also had declined from 1995 to 2004. In 1995, 13.8% of Michigan’s residents were licensed anglers, whereas in 2004, 11.4% were anglers (Table 4). Much of this decline had occurred among male anglers, which constituted 23.4% of Michigan’s male population in 1995, and only 18.9% in 2004 (Figure 4). The proportion of Michigan’s female residents who purchase licenses had also declined somewhat over the past 10 years from 5.0% to 4.3% of the female population (Figure 4).
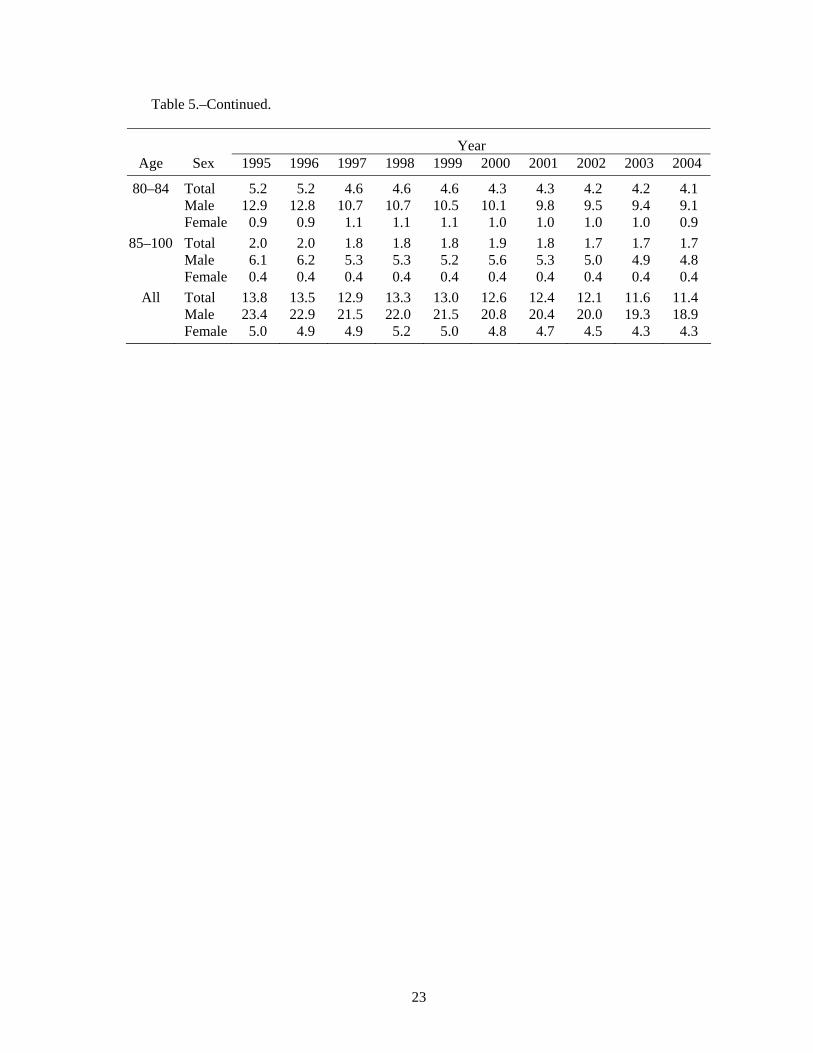
Recruitment of young adults was an important issue in Michigan; analysis showed that angling recruitment rates were eroding among young adult age cohorts (Table 5). In 1995, 14.2–18.3% of Michigan’s young adults ages 20–34 purchased fishing licenses, whereas by 2004, only 10.8–13.7% of these age groups did so (Table 5).
Likewise, there was some erosion of participation among the older age cohorts. Since 1996-97, the percentages of seniors (age 65 or older) purchasing licenses declined around 10% within each age and gender group; the decline was slightly higher (12–15%) for those in the age 50–64 group. The largest declines, however, were for males in the 20–34 age group. Yet, in 2004, the “population bulge” cohort of adults who had aged into the 35–44 year old category had sustained their participation rates with anglers still constituting 14.6–15.2% of all Michigan residents of that age (Table 5).
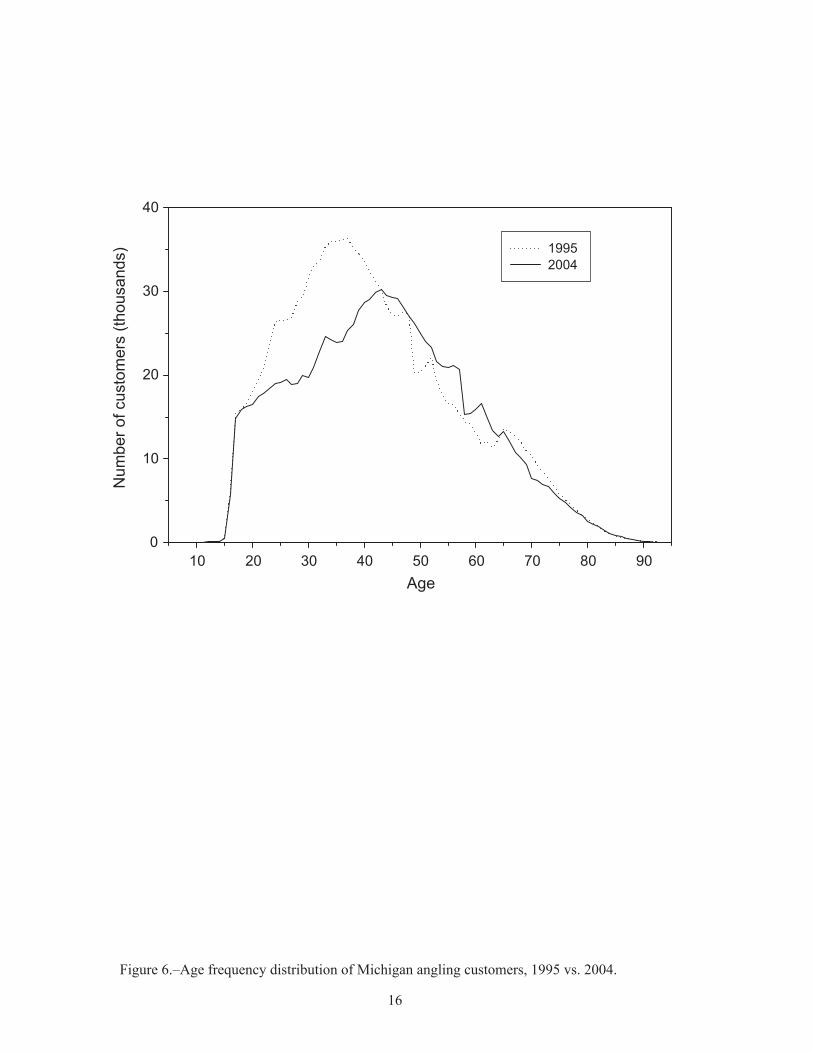
Michigan anglers were aging markedly. Mean age of Michigan anglers had increased from 42.1 in 1995, to 43.8 in 2004 (Figure 5). Anglers holding all-species licenses showed the largest increase in mean age over the period (Tables 6A and 6B). Mean age of all-species licensees increased from

7
42.9 years in 1997 to 45.4 years in 2004 (Tables 6A and 6B). The age-frequency distribution of Michigan anglers showed this aging trend, and showed little in the way of new recruitment of younger anglers, resulting in a lower total “standing biomass” of anglers, from 1995 to 2004 (Figure 6). This increasing age is likely due to the aging of the baby boom generation of existing participants.
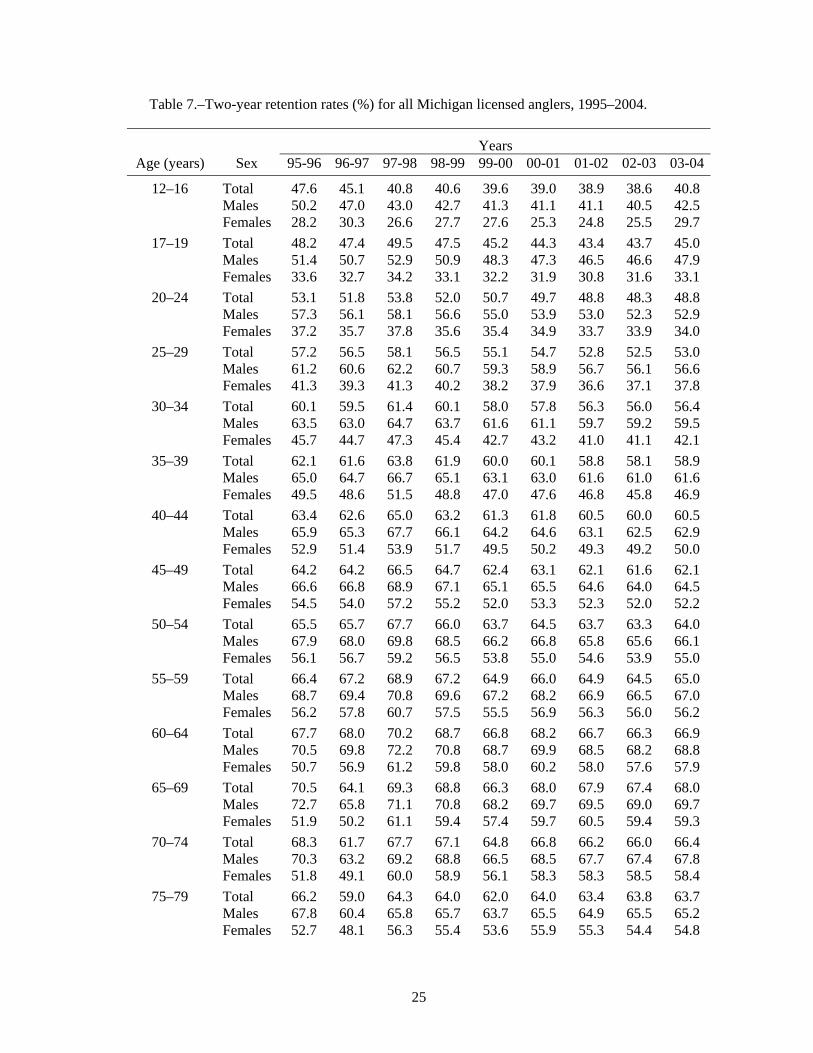
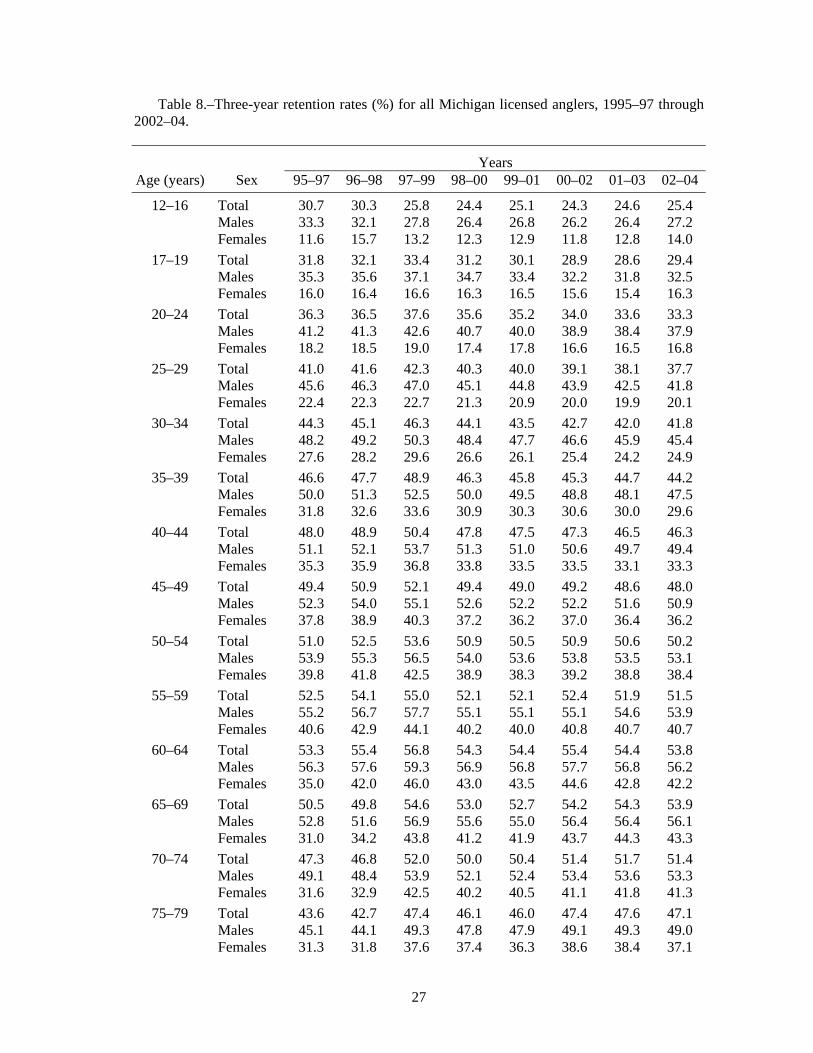
Numbers of anglers retained and angler retention rates showed some interesting patterns over the period from 1995 to 2004 (Table 7 and Figures 7A, 7B, 8A, 8B). Between 1995 and 1996, 808,800 distinct angler customers were retained, but by 2003-04, only 707,696 customers were retained. Overall angler two-year retention rates changed only slightly from 61.8% of anglers retained from 1995-96 to 59.9% of anglers retained from 2003-04. Male anglers had a greater two-year retention rate than females. Male retention rates from 1995-96 through 2003-04 ranged from 61.5% to 66.0%, whereas female two-year retention rates ranged from 47.3% to 51.5%. Changes in female two-year retention rates were especially small from 1995-96 through 2003-04. Interestingly, the two-year retention rates improved slightly between the 2002-03 and 2003-04 time frames, yet total customers declined (Figure 7B). Three-year retention rates declined only very slightly from 598,595 customers (45.7% of the population) in 1995–97 to 550,427 customers (44.9% of the population) in 2002–04 (Figure 8B). The general similarity of retention rates from 1995 through 2004 in the light of changes in numbers of customers and licenses sold seems to indicate that the aging “wave” of Baby Boomers is the primary demographic driver of angling demographic change in Michigan.
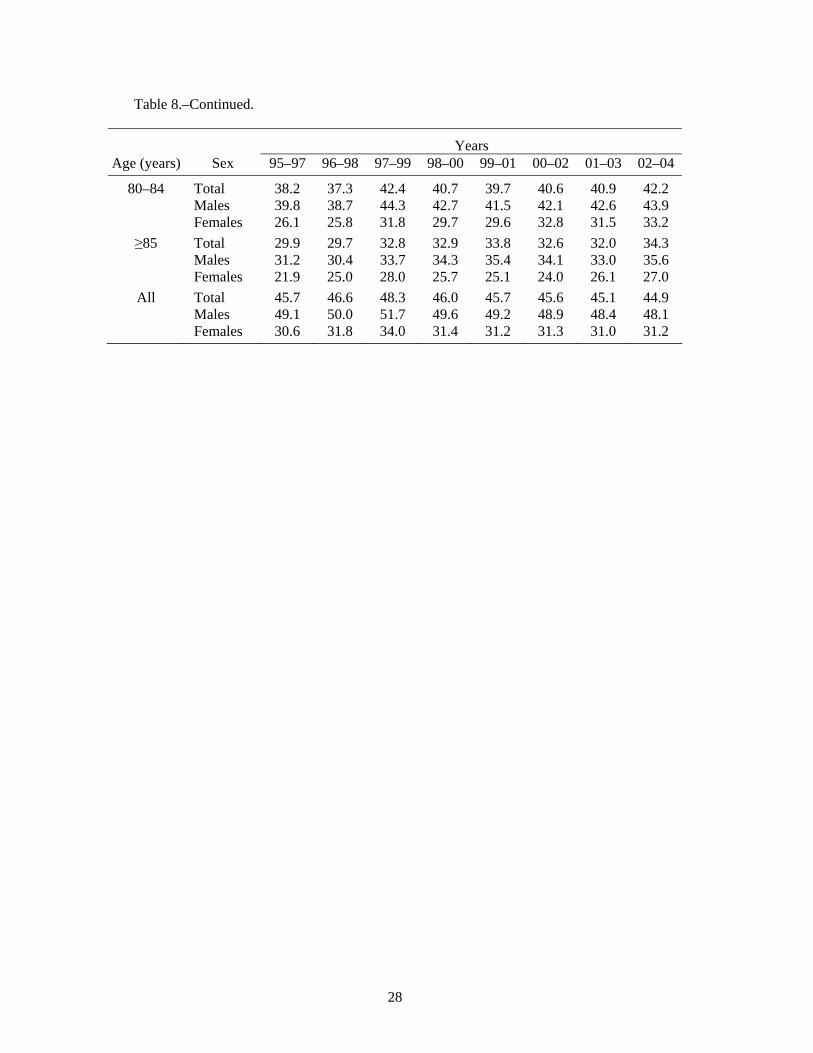
Retention rates (or “survivorship”) varied markedly among age cohorts, with the young adults having the lowest “survivorship” (Tables 7 and 8). Two-year retention of 17–19 year olds was as low as 48.2% in 1995-96, and declined to 45.0% in 2003-04 (Table 7). Likewise, two-year retention of 20–24 year olds was 53.1% in 1995-96, and declined to 48.8% in 2003-04 (Table 7). In contrast, the survivorship rates for adults in their late 50s and 60s had remained steady (about 67%) since 1995-96. Three-year retention rates show similar patterns of slow, steady erosion of survivorship rates among younger generations of anglers in early adulthood (Table 8).
Discussion
This project demonstrates that using the Michigan computerized point-of-sale license data system for aggregate analysis of angler trends is feasible, as expected. This sort of analysis, however, does require careful protocol development to ensure analysis of data for “distinct customers” (vs. the typical analysis of raw numbers of licenses sold). This analysis for behavior patterns of “distinct customers” is a novel approach unlike those customarily used by state agencies to examine license trends. The data set, however, does have analytical limitations, such as: difficulty of matching cases from year to year and across output tables, missing data (in fields such as those for county, age and gender), and sheer size. So, certain analyses, such as geographic patterns of angler recruitment and retention, may be challenging for future researchers. Future research may be able to identify additional parameters to monitor and analyze “recruitment” and long-term angling retention.
In spite of these few limitations, our analysis demonstrated that the annual declines in angling are generally small, with long-term gradual erosion in the number of distinct customers and in the proportions of the population who are anglers. Over only a decade, this decline may have serious impacts on agencies and their customer relationships. For example, analysis of Michigan RSS data showed that declines in customer loyalty (as measured by two-year retention rates) have resulted in approximately 100,000 fewer distinct customers retained over two years in 2004 than in 1995. With a modest estimate of $10.00 per license sold, this decline could easily represent more than $1 million lost in direct license revenues, thus having significant impacts on agency ability to manage resources and to sustain relationships with its customer base. In addition, managers must consider additional state economic losses of indirect revenues from the sale of equipment, travel expenditures, and other

8
fishing-associated costs. Thus, the impact of a 14.5% decline in distinct angling customers over 10 years becomes nearly catastrophic.
Possible reasons for these declines are many and varied. Robert Putnam, in his classic research published in 2000, noted that the U.S. has changed from a “doing” to a “watching” culture; in addition, nearly all forms of civic engagement are lower in young cohorts than in the early Baby Boom generation (Putnam 2000). Yet, this erosion in social capital (the connections and networks among individuals) began before today’s young adults were born (Putnam 2000). The social trend of decreased involvement in local social and leisure activities may be a strong influence on retention of older adult anglers.
The research by Louv (2005) on child development today, however, pointed to some alarming trends in land use, suburban “sprawl,” park management, public safety, and other diverse social facets and the resulting effects in causing “nature deficit-disorder” – a lack of willingness to go outdoors and lead an active lifestyle. These recent trends may affect mostly recruitment of younger generations into fishing, particularly in states, such as Michigan, that experienced rapid suburbanization and land use changes in the 1990s. Today’s youth might be considered the “Smorgasbord Generation” – with a wealth of activities available to them (such as organized youth soccer, other learning opportunities provided by private enterprise such as music, dance, etc.), so these youth are too busy for ongoing, family-based learning and socialization as well as local play (Fishman 1999).
So, what can be done to strengthen CRM for fisheries resources and their stewardship? Several strategies using data mining seem timely for resource agencies strapped by declining budgets.
Put Computerized Point-of-sale Data to Greater Use
This database could be used as a tool analogous to long-term fish habitat and population data sets; agencies could use these angler data to identify CRM opportunities for target segments of the angler population. In Michigan, for example, a pilot project with the Recreational Boating and Fishing Foundation used our analysis as a starting point to identify the potential for target marketing to retain male adult anglers. This target audience of lapsed anglers received a customized mailing with retailer discount incentives if they renewed their angling license. Analysis indicated some success in increasing two-year retention rates among male anglers. If agencies are to justify the maintenance of these data sets, customers increasingly will demand not only security, but accountability in use of these data in a manner to benefit the natural resources of the state or the customers served. Analyses of the type described in this report should be conducted at least every 5 years (coinciding with the release of each new set of National Hunting, Fishing, and Wildlife-Associated Recreation Survey results). The following represents specific recommendations for future data mining, analysis, and use of RSS license data.
Michigan DNR Fisheries Division could work with the state demographer to conduct analyses similar to Fedler and Holdnak (2000) where assumptions concerning the state’s age-structure and immigration/emigration rates are used to project future angling participation by age and sex. This is particularly important given the state’s focus on attracting young professionals to remain in the state, and given the aging of the Baby Boomer generation.
Once demographic projections of future angling participation are created, models which examine the relative contributions of changes in participation rates vs. changes in demographic composition can be tested to see what affects projected license sales.
Future analyses should concentrate on examining the “messiness” of the data sets. For example, an analysis of the rates at which anglers purchase duplicate licenses could shed light on the economic impact of this “duplicate purchasing” behavior, and on possible ways to manage customer relationships to minimize this phenomenon. In addition, further work between License Control and

9
Fisheries Division could result in a “cleaner” annual data set each year (as license sales figures are reported to the USFWS), and could result in less labor every 5 years for the detailed sort of “distinct customer” analysis reported here. The protocols established in this project can be used for consistency of analysis in future years.
Finally, in-depth analyses by license type, age-class/cohort, geographic region of the state (using GIS mapping technologies), and other variables within the data set will provide detailed information on angler license purchase behavior, trends, and insights for CRM. Through this sort of analysis, the Michigan DNR Fisheries Division can identify different segments of the angler population, and identify which segments may be changing most rapidly.
Invest in Diverse CRM Strategies
In order to build strong, beneficial relationships between agencies and their customers, state natural resource agencies need to invest in CRM strategies. These diverse strategies include not only data mining and complex analytical techniques, but also diverse communications, outreach and education tools. The growth in aquatic resource education programs nationally since their formalization in the 1980s (Richardson and Rushton 2000), has perhaps stemmed the decline in angling populations and stakeholders for fisheries management. Although no data exist to prove this relationship, aquatic resource education built on sound research and best practices does have impact on learners’ development of long-term aquatic stewardship perspectives and behaviors (Knuth and Siemer 2004). Additional CRM strategies will include moving beyond public relation strategies and toward building knowledge communities and consumer engagement. Traditional approaches to marketing focused on gross numbers of individual customers reached through advertisements or other means (Prahalad and Ramaswamy 2000). Size of audience alone is not the only measure that matters for marketing; new approaches emphasize consumer “engagement” – getting customers to develop long-term relationships with the brand, product, or experience (Howard 2006a, 2006b). These new strategies focus on creating lifetime bonds with customers and on viewing customers as “cocreators of value” – where individuals are working with agency managers in shaping expectations and cocreating acceptance for products and services (Prahalad and Ramaswamy 2000).
In current business practice, “knowledge management” is defined as “getting the right information to the right people at the right time” (Thomas et al. 2001). Knowledge management researchers argue for use of large data sets for more than ordinary advertising and marketing; they suggest that the future exists in fostering the development of social capital through establishing knowledge communities – places within which people can discover, use, and manage knowledge (information, contacts, data, resources, human/social/ physical and other assets) and can encounter as well as interact with others doing likewise (Thomas et al. 2001).
As an example, consider a CRM approach that fosters greater tiers of “engagement” over time. Agencies using this approach first envision customer scenarios rather than simple “target market profiles.” An agency uses a customer scenario first to view customers as existing in social networks, then to consider the goals these customers seek, then to envision entire situations as well as diverse activities/steps customers take in interacting with the service/product and agency; then, the agency meshes its information, service channels, and education with these customer scenarios (Seybold 2001).
Here is a practical example of a CRM scenario. At a car company’s web site, consumers sign up to get an email, then receive customized messages; later, they engage at the next level of interaction when they request information about the design details of a new car model. Finally, the consumer goes online to configure a sample car through an interactive web experience, then, if the engagement strategy is successful, the consumer requests information about local dealerships (Howard 2006a, 2006b).

10
Increasing consumer engagement in the realm of fisheries management might begin with the earliest fishing socialization experience within the realm of the family but then progress to more frequent and in-depth interactions with resource management agencies (perhaps through media and/or volunteers who deliver aquatic education programs based at local, community levels). Then, customers progress to their first purchase of a fishing license, continue through contact via web and other mass media, and sustain long term involvement in a suite of well-planned, community-based aquatic resource-related offerings. In this vision, resource managers would regularly consult, analyze, and interpret data on distinct customers (of many types), then would develop knowledge communities linking natural resource agencies, with partners, with learners, with local social assets to encourage more outdoor recreation participation, to promote conservation and science-based management of our natural resources, and to accomplish greater aquatic resource stewardship. Strategies from community engagement would form the basis for this relationship management (e.g., Green and Haines 2002; Kretzmann and McKnight 1993; Mattessich and Monsey 1997; Flora et al. 2004; Fear et al. 2006).
Some debate exists over the role of state agencies in meeting the needs of declining “traditional” clientele such as anglers, and even over the use of the term/concept of “customer.” Although some believe it is not the appropriate role of agencies to “sell” more licenses, no one can argue with the need for agencies to build stronger relationships with resource users. Furthermore, no agency can argue against the need for more research-based outreach efforts that make effective use of such large, longitudinal data sets (Rupert and Dann 1998). Such large-scale efforts are currently underway, sponsored by the Association of Fish and Wildlife Agencies under the auspices of its National Conservation Education Strategy, and building on the work of Louv (2005) and the new Children and Nature Network (http://www.cnaturenet.org/). By making use of data-mining and CRM research-based approaches, state agencies, such as the Michigan DNR, will be more prepared to establish and sustain innovative customer relationship strategies, and other states with computerized point-of-sale license databases can do likewise.
Acknowledgments
The authors gratefully recognize the essential role that Roger Parsons, Michigan Department of Information Technology, has played in this project. In addition, we acknowledge the advice and peer review of the following individuals: James Breck, Tammy Newcomb, Gary Towns, Management Team members, and other staff from the Michigan DNR, Fisheries Division; Kristen Pratt from Michigan State University; Chris Temple, Bruce McAlister, and others working with and attending the Southeast Michigan Mentoring and Social Support Summit sponsored by the Recreational Boating and Fishing Foundation; and Mike Costello, Statistical Analysis System Institute, Inc.. This project was supported by the Federal Aid in Sport Fish Restoration Program, F-81-R, Study 230697, Michigan DNR, Fisheries Division.

11
Figure 1.–Michigan anglers by age cohort, 1975 to 2006, from U.S. Fish and Wildlife Service survey data. Shaded bar represents strong adult “year class” from “Baby Boomer” cohort. (Data from USFWS and USBC 1998, 2002; USFWS 1976, 1982, 1989, 1992; 2006 data from R. Aiken, USFWS, personal communication.)
Age6 to 8
9 to 11
12 to 15
16 to 1718-24
25-3435-44
45-5455-64 65+
0
200
400
6000
200
400
6000
200
400
600
Num
ber o
f ang
lers
(tho
usan
ds)
0
200
400
6000
200
400
6000
200
400
6000
200
400
600
1975
1980
1985
1991
1996
2001
2006

12
Figure 2.–Total number of Michigan angling licenses sold, 1928-2004. (Data were from Michigan DNR History of Fishing License and Park Permit Sales: 1914-1982 [MDNR date unknown(a)]; Michigan DNR Comparative Statement of License Sales by Number 1980-1989 [MDNR date unknown(b)]; U.S. Fish and Wildlife Service, Division of Federal Assistance; and from Financial Administrative Reports: Fishing License Data History 1958-2002, 2003 and 2004; and RSS database for Michigan fishing license sales 1995–2004.)
Year1928
19321936
19401944
19481952
19561960
19641968
19721976
19801984
19881992
19962000
2004
Num
ber o
f lic
ense
s so
ld (t
hous
ands
)
0
500
1,000
1,500
2,000
2,500
Total Resident Total Day (24 hour) Total Non-resident Total licenses sold Total fishing licenses USFWS Certified paid fishing licenses USFWS
13
Figure 3.–Number of distinct customers purchasing any type of Michigan angling license, 1995–2004.
Year1995 1996 1997 1998 1999 2000 2001 2002 2003 2004
Num
ber o
f cus
tom
ers
(thou
sand
s)
200
400
600
800
1,000
1,200
1,400
Males Females Total
14
Figure 4.–Total proportion of Michigan residents who purchased any type of fishing license, 1995–2004.
Year
1995 1996 1997 1998 1999 2000 2001 2002 2003 2004
Per
cent
0
5
10
15
20
25
Male Female Total

15
Figure 5.–Mean age of licensed anglers in Michigan, 1995–2004.
Year
1995 1996 1997 1998 1999 2000 2001 2002 2003 2004
Mea
n ag
e (y
ears
old
)
40
41
42
43
44
45
Male Female Total
16
Figure 6.–Age frequency distribution of Michigan angling customers, 1995 vs. 2004.
Age10 20 30 40 50 60 70 80 90
Num
ber o
f cus
tom
ers
(thou
sand
s)
0
10
20
30
40
1995 2004

17
Figure 7b.–Two-year angling retention: percent two-year retention by sex of Michigan angling customers.
Two-year period
95-96 96-97 97-98 98-99 99-00 00-01 01-02 02-03 03-04
Num
ber o
f cus
tom
ers
(thou
sand
s)
0
200
400
600
800
1,000
Male Female Total
Two-year period
95-96 96-97 97-98 98-99 99-00 00-01 01-02 02-03 03-04
Per
cent
45
50
55
60
65
70
Male Female Total
Figure 7a.–Two-year angling retention: total number of distinct Michigan angling customers purchasing any type of fishing license in both years of each two-year period.

18
Figure 8b.–Three-year angling retention: percent three-year retention by sex of Michigan angling customers.
Three-year period
95-96-97
96-97-98
97-98-99
98-99-00
99-00-01
00-01-02
01-02-03
02-03-04
Num
ber o
f cus
tom
ers
(thou
sand
s)
0
100
200
300
400
500
600
Male Female Total
Three-year period
95-96-97
96-97-98
97-98-99
98-99-00
99-00-01
00-01-02
01-02-03
02-03-04
Per
cent
30
35
40
45
50
55
Male Female Total
Figure 8a.–Three-year angling retention: total number of distinct Michigan angling customers purchasing any type of fishing license in all years of each three-year period.

19
Table 1.–Listing and explanation of Michigan angling license types, 1995–2004.
Code License Requirements a 1995 1996 1997 1998–2004
010 resident l x x 011 trout and salmon stamp ^ x x 012 daily ∆ x x 013 senior ■ x x 014 senior spouse ■ x x 015 nonresident o x x 080 sportsperson ^^ x x 082 sportsperson replaced ^^ x x 410 b resident restricted l x 411 b senior restricted x 412 b nonresident restricted o x 415 b resident-all species upgrade l ^ x 416 b senior-all species upgrade ^ x 417 b nonresident-all species upgrade o ^ x 420 b resident-all species l ^ x 421 b senior-all species ^ x 422 b young angler (includes all species) ** x 423 b nonresident-all species o ^ x 110 resident restricted l x x 111 senior restricted ■ x x 112 nonresident restricted o x x 115 resident-all species upgrade l ^ x x 116 senior-all species upgrade ■ ^ x x 117 nonresident-all species upgrade o ^ x x 120 resident-all species l ^ x x 121 senior-all species ■ ^ x x 122 young angler (includes all species) ** x x 123 nonresident-all species o ^ x x 125 24 hr ∆ x x 126 24 hr senior ∆ x x 500 resident military-all species – x x
a Requirements key:
∆ Good for 24 hr period only; covers residents and nonresidents for all species including trout and salmon
^ Required for all persons in addition to annual fishing license to fish for trout and salmon; not required for holders of senior licenses, their spouses, holders of Daily or Sportsperson's licenses or persons under 17
^^ Covers resident annual fish, trout and salmon, and game ** Young Angler (good for all species), residents and nonresidents ages 12–16 (voluntary) – Military for residents and all species, good for only 2 weeks ■ Seniors must be 65 years or older to purchase l Must be a resident of Michigan, required for all persons 17 and older through age 64; does NOT
include trout and salmon fishing privileges o Required for nonresidents of Michigan
b 1997 licenses in the 400 license type series are the same as the corresponding license type in the 100 series (i.e., 410 = 110). The same regulations and assumptions apply to both 410 and 110, the only difference is that the 410 license was sold at a reduced cost. Therefore, 400 series licenses were combined and analyzed along with their 100 series equivalents (i.e., 410+110).

20
Table 2.–Results of data cleaning protocols, and extent of "messy" data in the Michigan angling license point-of-sale database.
Licenses sold Voids and duplicates Total distinct customers Year total voids minus voids duplicates (number) (% of total sold) (no voids or duplicates)
1995 1,759,820 27,400 1,732,420 362,316 389,716 22.1 1,370,104 1996 1,742,044 24,865 1,717,179 370,426 395,291 22.7 1,346,753 1997 1,466,945 26,507 1,440,438 145,911 172,418 11.8 1,294,527 1998 1,508,817 25,168 1,483,649 149,612 174,780 11.6 1,334,037 1999 1,486,148 26,614 1,459,534 148,156 174,770 11.8 1,311,378 2000 1,440,288 24,736 1,415,552 144,303 169,039 11.7 1,271,249 2001 1,410,457 26,664 1,383,793 132,646 159,310 11.3 1,251,147 2002 1,392,739 23,994 1,368,745 135,007 159,001 11.4 1,233,738 2003 1,346,898 29,286 1,317,612 127,802 157,088 11.7 1,189,810 2004 1,326,147 31,354 1,294,793 123,087 154,441 11.6 1,171,706

21
Table 3.–Number of distinct customers purchasing any type of Michigan angling license, 1995–2004.
Year Males Females Total
1995 1,069,873 241,230 1,370,104 1996 1,042,856 234,594 1,346,753 1997 990,675 235,469 1,294,527 1998 1,016,207 249,469 1,334,007 1999 1,012,673 245,268 1,311,378 2000 1,013,450 239,673 1,271,249 2001 1,004,567 235,443 1,251,147 2002 995,934 229,311 1,233,738 2003 968,434 221,189 1,189,810 2004 952,795 218,770 1,171,706
Table 4.–Proportion (%) of Michigan residents who purchased any type of fishing license, 1995–2004, by sex.
Year Total Males Females
1995 13.8 23.4 5.0 1996 13.5 22.9 4.9 1997 12.9 21.5 4.9 1998 13.3 22.0 5.2 1999 13.0 21.5 5.0 2000 12.6 20.8 4.8 2001 12.4 20.4 4.7 2002 12.1 20.0 4.5 2003 11.6 19.3 4.3 2004 11.4 18.9 4.3

22
Table 5.–Proportion (%) of Michigan residents by age and sex purchasing a Michigan fishing license (all types), 1995–2004.
Year Age Sex 1995 1996 1997 1998 1999 2000 2001 2002 2003 2004
12–16 Total 0.8 0.8 0.9 0.9 0.9 0.9 0.8 0.8 0.8 0.7 Male 1.3 1.4 1.6 1.5 1.6 1.5 1.4 1.4 1.3 1.2 Female 0.2 0.2 0.3 0.3 0.2 0.2 0.2 0.2 0.2 0.2
17–19 Total 10.3 10.1 9.4 9.7 9.5 9.6 9.4 9.2 8.9 9.2 Male 16.5 16.2 15.0 15.3 15.0 15.0 14.8 14.3 13.9 14.2 Female 3.8 3.8 3.5 3.8 3.8 3.9 3.8 3.7 3.6 3.9
20–24 Total 14.2 13.8 12.7 13.2 13.0 12.7 12.0 11.3 10.7 10.8 Male 22.5 21.8 20.0 20.7 20.4 19.6 18.4 17.5 16.5 16.5 Female 6.0 5.9 5.3 5.8 5.7 5.7 5.4 5.0 4.8 4.9
25–29 Total 17.3 16.8 15.7 16.2 15.8 14.8 14.6 14.0 13.2 12.7 Male 28.2 27.4 25.8 26.4 25.7 23.6 23.3 22.3 20.9 20.1 Female 6.8 6.5 6.1 6.5 6.3 6.0 5.9 5.5 5.3 5.1
30–34 Total 18.3 17.8 16.7 17.1 16.4 15.8 15.4 14.8 14.1 13.7 Male 30.1 29.1 27.5 28.0 27.1 25.5 24.9 24.0 23.0 22.4 Female 7.0 6.9 6.4 6.6 6.3 6.0 5.8 5.4 5.2 5.1
35–39 Total 17.9 17.7 16.9 17.6 17.2 16.9 16.5 15.9 15.1 14.6 Male 29.3 28.8 27.7 28.4 27.9 27.2 26.5 25.7 24.5 23.7 Female 6.9 6.8 6.5 7.0 6.8 6.7 6.5 6.2 5.7 5.5
40–44 Total 17.0 16.7 16.0 16.7 16.5 16.4 16.3 16.2 15.6 15.2 Male 27.6 27.1 25.8 26.9 26.5 26.5 26.3 26.2 25.3 24.6 Female 6.7 6.7 6.4 6.8 6.7 6.5 6.5 6.4 6.0 5.9
45–49 Total 16.3 15.9 15.3 15.8 15.5 15.1 15.1 14.9 14.6 14.4 Male 26.3 25.5 24.7 25.3 24.8 24.2 24.3 24.0 23.5 23.2 Female 6.7 6.5 6.3 6.6 6.4 6.1 6.2 6.0 5.8 5.7
50–54 Total 16.2 15.7 14.8 15.4 15.0 14.3 14.0 14.0 13.6 13.4 Male 26.3 25.5 24.0 24.8 24.3 23.1 22.7 22.7 22.0 21.7 Female 6.6 6.4 6.1 6.4 6.2 5.8 5.6 5.6 5.4 5.3
55–59 Total 15.5 15.2 14.9 15.4 15.1 14.4 14.0 13.7 13.4 13.0 Male 26.1 25.6 24.8 25.5 25.0 23.6 23.0 22.6 22.1 21.6 Female 5.7 5.5 5.8 6.1 5.9 5.6 5.4 5.2 5.0 4.9
60–64 Total 13.5 13.6 14.4 14.8 14.9 14.4 14.3 14.1 13.8 13.5 Male 24.5 24.6 24.3 25.0 25.2 24.6 24.3 24.0 23.4 23.0 Female 3.5 3.5 5.2 5.4 5.3 5.0 5.0 4.9 4.8 4.6
65–69 Total 14.7 14.6 13.9 14.0 13.8 13.3 13.6 13.9 13.6 13.7 Male 28.9 28.8 24.9 25.0 24.8 23.7 24.2 24.7 24.3 24.4 Female 2.6 2.6 4.7 4.8 4.6 4.4 4.5 4.5 4.4 4.4
70–74 Total 11.5 11.6 10.9 10.9 10.7 10.2 10.4 10.6 10.5 10.6 Male 23.9 24.0 20.6 20.4 20.0 19.1 19.7 20.2 20.4 20.5 Female 2.0 2.0 3.3 3.4 3.3 3.1 3.1 3.1 3.0 3.0
75–79 Total 8.2 8.1 7.4 7.3 7.1 7.0 6.9 6.9 6.8 6.8 Male 18.4 18.0 15.1 14.9 14.4 14.3 14.0 13.8 13.7 13.7 Female 1.4 1.4 2.0 2.1 2.0 1.9 1.9 1.8 1.8 1.7
23
Table 5.–Continued.
Year Age Sex 1995 1996 1997 1998 1999 2000 2001 2002 2003 2004
80–84 Total 5.2 5.2 4.6 4.6 4.6 4.3 4.3 4.2 4.2 4.1 Male 12.9 12.8 10.7 10.7 10.5 10.1 9.8 9.5 9.4 9.1 Female 0.9 0.9 1.1 1.1 1.1 1.0 1.0 1.0 1.0 0.9
85–100 Total 2.0 2.0 1.8 1.8 1.8 1.9 1.8 1.7 1.7 1.7 Male 6.1 6.2 5.3 5.3 5.2 5.6 5.3 5.0 4.9 4.8 Female 0.4 0.4 0.4 0.4 0.4 0.4 0.4 0.4 0.4 0.4
All Total 13.8 13.5 12.9 13.3 13.0 12.6 12.4 12.1 11.6 11.4 Male 23.4 22.9 21.5 22.0 21.5 20.8 20.4 20.0 19.3 18.9 Female 5.0 4.9 4.9 5.2 5.0 4.8 4.7 4.5 4.3 4.3

24
Table 6a.–Mean age of Michigan licensed anglers by sex and license types, 1995-96.
License type Year Sex Any type Resident/Nonresident Senior Trout/salmon Daily Sportsperson
1995 Males 42.5 38.6 71.4 39.1 39.4 39.1 Females 40.3 38.4 71.7 38.6 37.3 38.1 Total 42.1 38.6 71.4 39.1 39.0 39.1
1996 Males 42.7 38.8 71.5 39.2 39.7 39.4 Females 40.5 38.5 71.8 38.7 37.7 38.4 Total 42.3 38.7 71.5 39.1 39.3 39.4
Table 6b.–Mean age of Michigan licensed anglers by sex and license types, 1997–2004.
License type Year Sex Any 24 hr Young angler Restricted All species Military
1997 Males 42.5 40.0 13.7 42.2 43.0 28.4 Females 42.1 38.0 13.7 42.5 42.3 28.2 Total 42.4 39.6 13.7 42.3 42.9 28.4
1998 Males 42.6 40.1 13.8 42.3 43.8 27.8 Females 42.0 37.8 13.5 42.4 42.7 27.7 Total 42.5 39.6 13.8 42.3 43.7 27.8
1999 Males 42.8 40.2 13.9 42.4 43.9 28.5 Females 42.1 38.1 13.8 42.6 42.6 28.7 Total 42.6 39.8 13.9 42.5 43.8 28.5
2000 Males 42.9 40.3 14.0 42.5 44.1 28.8 Females 42.0 38.1 13.9 42.5 42.7 26.1 Total 42.7 39.9 14.0 42.5 43.9 28.7
2001 Males 43.2 40.6 14.1 42.8 44.4 29.4 Females 42.3 38.4 13.8 42.8 42.9 27.3 Total 43.0 40.2 14.1 42.8 44.2 29.3
2002 Males 43.5 40.8 14.0 43.1 44.8 28.8 Females 42.7 38.6 13.8 43.1 43.4 26.4 Total 43.3 40.4 14.0 43.1 44.7 28.7
2003 Males 43.8 41.0 14.0 43.3 45.2 29.7 Females 42.9 38.8 13.5 43.3 43.7 28.6 Total 43.6 40.6 14.0 43.3 45.1 29.6
2004 Males 44.0 41.2 14.2 43.4 45.6 28.7 Females 42.9 38.7 14.0 43.3 44.0 31.3 Total 43.8 40.7 14.2 43.4 45.4 28.7
25
Table 7.–Two-year retention rates (%) for all Michigan licensed anglers, 1995–2004.
Years Age (years) Sex 95-96 96-97 97-98 98-99 99-00 00-01 01-02 02-03 03-04
12–16 Total 47.6 45.1 40.8 40.6 39.6 39.0 38.9 38.6 40.8 Males 50.2 47.0 43.0 42.7 41.3 41.1 41.1 40.5 42.5 Females 28.2 30.3 26.6 27.7 27.6 25.3 24.8 25.5 29.7
17–19 Total 48.2 47.4 49.5 47.5 45.2 44.3 43.4 43.7 45.0 Males 51.4 50.7 52.9 50.9 48.3 47.3 46.5 46.6 47.9 Females 33.6 32.7 34.2 33.1 32.2 31.9 30.8 31.6 33.1
20–24 Total 53.1 51.8 53.8 52.0 50.7 49.7 48.8 48.3 48.8 Males 57.3 56.1 58.1 56.6 55.0 53.9 53.0 52.3 52.9 Females 37.2 35.7 37.8 35.6 35.4 34.9 33.7 33.9 34.0
25–29 Total 57.2 56.5 58.1 56.5 55.1 54.7 52.8 52.5 53.0 Males 61.2 60.6 62.2 60.7 59.3 58.9 56.7 56.1 56.6 Females 41.3 39.3 41.3 40.2 38.2 37.9 36.6 37.1 37.8
30–34 Total 60.1 59.5 61.4 60.1 58.0 57.8 56.3 56.0 56.4 Males 63.5 63.0 64.7 63.7 61.6 61.1 59.7 59.2 59.5 Females 45.7 44.7 47.3 45.4 42.7 43.2 41.0 41.1 42.1
35–39 Total 62.1 61.6 63.8 61.9 60.0 60.1 58.8 58.1 58.9 Males 65.0 64.7 66.7 65.1 63.1 63.0 61.6 61.0 61.6 Females 49.5 48.6 51.5 48.8 47.0 47.6 46.8 45.8 46.9
40–44 Total 63.4 62.6 65.0 63.2 61.3 61.8 60.5 60.0 60.5 Males 65.9 65.3 67.7 66.1 64.2 64.6 63.1 62.5 62.9 Females 52.9 51.4 53.9 51.7 49.5 50.2 49.3 49.2 50.0
45–49 Total 64.2 64.2 66.5 64.7 62.4 63.1 62.1 61.6 62.1 Males 66.6 66.8 68.9 67.1 65.1 65.5 64.6 64.0 64.5 Females 54.5 54.0 57.2 55.2 52.0 53.3 52.3 52.0 52.2
50–54 Total 65.5 65.7 67.7 66.0 63.7 64.5 63.7 63.3 64.0 Males 67.9 68.0 69.8 68.5 66.2 66.8 65.8 65.6 66.1 Females 56.1 56.7 59.2 56.5 53.8 55.0 54.6 53.9 55.0
55–59 Total 66.4 67.2 68.9 67.2 64.9 66.0 64.9 64.5 65.0 Males 68.7 69.4 70.8 69.6 67.2 68.2 66.9 66.5 67.0 Females 56.2 57.8 60.7 57.5 55.5 56.9 56.3 56.0 56.2
60–64 Total 67.7 68.0 70.2 68.7 66.8 68.2 66.7 66.3 66.9 Males 70.5 69.8 72.2 70.8 68.7 69.9 68.5 68.2 68.8 Females 50.7 56.9 61.2 59.8 58.0 60.2 58.0 57.6 57.9
65–69 Total 70.5 64.1 69.3 68.8 66.3 68.0 67.9 67.4 68.0 Males 72.7 65.8 71.1 70.8 68.2 69.7 69.5 69.0 69.7 Females 51.9 50.2 61.1 59.4 57.4 59.7 60.5 59.4 59.3
70–74 Total 68.3 61.7 67.7 67.1 64.8 66.8 66.2 66.0 66.4 Males 70.3 63.2 69.2 68.8 66.5 68.5 67.7 67.4 67.8 Females 51.8 49.1 60.0 58.9 56.1 58.3 58.3 58.5 58.4
75–79 Total 66.2 59.0 64.3 64.0 62.0 64.0 63.4 63.8 63.7 Males 67.8 60.4 65.8 65.7 63.7 65.5 64.9 65.5 65.2 Females 52.7 48.1 56.3 55.4 53.6 55.9 55.3 54.4 54.8

26
Table 7.–Continued.
Years Age (years) Sex 95-96 96-97 97-98 98-99 99-00 00-01 01-02 02-03 03-04
80–84 Total 62.1 54.8 60.9 60.7 57.6 59.5 58.3 59.3 60.2 Males 63.9 56.3 63.0 62.3 59.5 60.9 59.6 60.9 61.4 Females 48.6 42.8 49.1 51.7 47.3 51.6 51.2 50.7 53.4
≥85 Total 54.7 48.7 53.4 53.2 53.2 53.9 50.2 52.3 54.7 Males 56.4 49.9 54.1 55.1 55.0 55.7 51.7 53.5 56.5 Females 44.0 40.7 49.0 42.9 42.9 43.8 41.2 45.8 44.8
All Total 61.8 60.7 63.3 61.7 59.8 60.2 59.1 58.8 59.5 Males 64.8 63.7 66.0 64.7 62.8 63.0 61.9 61.5 62.1 Females 48.3 47.8 51.5 49.4 47.4 48.1 47.3 47.3 48.1
27
Table 8.–Three-year retention rates (%) for all Michigan licensed anglers, 1995–97 through 2002–04.
Years Age (years) Sex 95–97 96–98 97–99 98–00 99–01 00–02 01–03 02–04
12–16 Total 30.7 30.3 25.8 24.4 25.1 24.3 24.6 25.4 Males 33.3 32.1 27.8 26.4 26.8 26.2 26.4 27.2 Females 11.6 15.7 13.2 12.3 12.9 11.8 12.8 14.0
17–19 Total 31.8 32.1 33.4 31.2 30.1 28.9 28.6 29.4 Males 35.3 35.6 37.1 34.7 33.4 32.2 31.8 32.5 Females 16.0 16.4 16.6 16.3 16.5 15.6 15.4 16.3
20–24 Total 36.3 36.5 37.6 35.6 35.2 34.0 33.6 33.3 Males 41.2 41.3 42.6 40.7 40.0 38.9 38.4 37.9 Females 18.2 18.5 19.0 17.4 17.8 16.6 16.5 16.8
25–29 Total 41.0 41.6 42.3 40.3 40.0 39.1 38.1 37.7 Males 45.6 46.3 47.0 45.1 44.8 43.9 42.5 41.8 Females 22.4 22.3 22.7 21.3 20.9 20.0 19.9 20.1
30–34 Total 44.3 45.1 46.3 44.1 43.5 42.7 42.0 41.8 Males 48.2 49.2 50.3 48.4 47.7 46.6 45.9 45.4 Females 27.6 28.2 29.6 26.6 26.1 25.4 24.2 24.9
35–39 Total 46.6 47.7 48.9 46.3 45.8 45.3 44.7 44.2 Males 50.0 51.3 52.5 50.0 49.5 48.8 48.1 47.5 Females 31.8 32.6 33.6 30.9 30.3 30.6 30.0 29.6
40–44 Total 48.0 48.9 50.4 47.8 47.5 47.3 46.5 46.3 Males 51.1 52.1 53.7 51.3 51.0 50.6 49.7 49.4 Females 35.3 35.9 36.8 33.8 33.5 33.5 33.1 33.3
45–49 Total 49.4 50.9 52.1 49.4 49.0 49.2 48.6 48.0 Males 52.3 54.0 55.1 52.6 52.2 52.2 51.6 50.9 Females 37.8 38.9 40.3 37.2 36.2 37.0 36.4 36.2
50–54 Total 51.0 52.5 53.6 50.9 50.5 50.9 50.6 50.2 Males 53.9 55.3 56.5 54.0 53.6 53.8 53.5 53.1 Females 39.8 41.8 42.5 38.9 38.3 39.2 38.8 38.4
55–59 Total 52.5 54.1 55.0 52.1 52.1 52.4 51.9 51.5 Males 55.2 56.7 57.7 55.1 55.1 55.1 54.6 53.9 Females 40.6 42.9 44.1 40.2 40.0 40.8 40.7 40.7
60–64 Total 53.3 55.4 56.8 54.3 54.4 55.4 54.4 53.8 Males 56.3 57.6 59.3 56.9 56.8 57.7 56.8 56.2 Females 35.0 42.0 46.0 43.0 43.5 44.6 42.8 42.2
65–69 Total 50.5 49.8 54.6 53.0 52.7 54.2 54.3 53.9 Males 52.8 51.6 56.9 55.6 55.0 56.4 56.4 56.1 Females 31.0 34.2 43.8 41.2 41.9 43.7 44.3 43.3
70–74 Total 47.3 46.8 52.0 50.0 50.4 51.4 51.7 51.4 Males 49.1 48.4 53.9 52.1 52.4 53.4 53.6 53.3 Females 31.6 32.9 42.5 40.2 40.5 41.1 41.8 41.3
75–79 Total 43.6 42.7 47.4 46.1 46.0 47.4 47.6 47.1 Males 45.1 44.1 49.3 47.8 47.9 49.1 49.3 49.0 Females 31.3 31.8 37.6 37.4 36.3 38.6 38.4 37.1
28
Table 8.–Continued.
Years Age (years) Sex 95–97 96–98 97–99 98–00 99–01 00–02 01–03 02–04
80–84 Total 38.2 37.3 42.4 40.7 39.7 40.6 40.9 42.2 Males 39.8 38.7 44.3 42.7 41.5 42.1 42.6 43.9 Females 26.1 25.8 31.8 29.7 29.6 32.8 31.5 33.2
≥85 Total 29.9 29.7 32.8 32.9 33.8 32.6 32.0 34.3 Males 31.2 30.4 33.7 34.3 35.4 34.1 33.0 35.6 Females 21.9 25.0 28.0 25.7 25.1 24.0 26.1 27.0
All Total 45.7 46.6 48.3 46.0 45.7 45.6 45.1 44.9 Males 49.1 50.0 51.7 49.6 49.2 48.9 48.4 48.1 Females 30.6 31.8 34.0 31.4 31.2 31.3 31.0 31.2

29
References
American Sportfishing Association. 2004. Sportfishing outlook 2004. American Sportfishing 8(1):1–10.
Bailey, A. F. 2004. Audit: vulnerabilities found in state files on licensing, registration. Lansing State Journal, September 1, 2004.
Fear, F. A., C. L. Rosaen, R. J. Bawden, and P. G. Foster-Fishman. 2006. Coming to critical engagement: an autoethnographic exploration. University Press of America, Lanham, Maryland.
Fedler, A. J., and K. A. Leahy. 2000. A social and demographic examination of fishing participation. Department of Recreation, Parks and Tourism, University of Florida, Gainesville.
Fedler, A. J., and A. Holdnak. 2000. Implications of U.S. population growth for recreational fishing. Department of Recreation, Parks and Tourism, University of Florida, Gainesville.
Fishman, C. 1999. Smorgasbord generation. American Demographics, May 1999. Available: http://www.demographics.com/publications/ad/99_ad/9905_ad/ad990501.htm. (November 2000).
Flora, C. B., J. Flora, and S. Fey. 2004. Rural communities: legacy and change (2nd ed.). Westview Press, Boulder, Colorado.
Frawley, B. J. 2001. Demographics, recruitment and retention of Michigan hunters. Michigan Department of Natural Resources, Wildlife Division, Report 3332, Lansing.
Glymour, C., D. Madigan, D. Pregibon, and P. Smyth. 1997. Statistical themes and lessons for data mining. Data Mining and Knowledge Discovery 1:11–28.
Green, G. P., and A. Haines. 2002. Asset building and community development. Sage Publications, Thousand Oaks, California.
Howard, T. 2006a. Marketers aim for ‘engaged’ consumers. USA Today, (June 20, 2006):3B.
Howard, T. 2006b. As Cannes begins, execs wrestle with future of ads. USA Today, (June 19, 2006):3B.
Jamsen, G. C. 1967a. Sex and age structure of licensed hunters, trappers, and fishermen in Michigan. Michigan Department of Natural Resources, Research and Development Report 125, Lansing.
Jamsen, G. C. 1967b. Preliminary predictions of hunting and fishing licensees 1970 to 1980. Michigan Department of Natural Resources, Research and Development Report 124, Lansing.
Jamsen, G. C., and D. H. Burck. 1979. Residence of licensed fishermen in Michigan, 1978. Michigan Department of Natural Resources, Surveys and Statistical Services Report 178, Lansing.
Kim, W., B. Choi, E. Hong, S. Kim, and D. Lee. 2003. A taxonomy of dirty data. Data Mining and Knowledge Discovery 7:81–99.
Knuth, B. A., and W. R. Siemer. 2004. Fostering aquatic stewardship: a key for fisheries sustainability. American Fisheries Society Symposium 43:243–255.
Kretzmann, J. P., and J. L. McKnight. 1993. Building communities from the inside out: a path toward finding and mobilizing a community's assets. ACTA Publications, Chicago, Illinois.
30
Lamb, E. C. 2000. Data mining defined. Community Banker (June):22–26.
Louv, R. 2005. Last child in the woods: saving our children from nature-deficit disorder. Algonquin Books of Chapel Hill, Chapel Hill, North Carolina.
Mattessich, P., and B. Monsey. 1997. Community building: what makes it work? A review of factors influencing successful community building. Amherst H. Wilder Foundation, St. Paul, Minnesota.
McCue, C., E. S. Stone, and T. P. Gooch. 2003. Data mining and value-added analysis. FBI Law Enforcement Bulletin (November):1–6.
MDNR (Michigan Department of Natural Resources). Date unknown(a). History of fishing license and park permit sales: 1914–1982. Michigan Department of Natural Resources, Lansing.
MDNR (Michigan Department of Natural Resources). Date unknown(b). Comparative statement of license sales by number, 1980–1989. Michigan Department of Natural Resources, Lansing.
MDNR (Michigan Department of Natural Resources). 1996. Governor’s Hunting and Fishing Heritage Task Force final report. Department of Natural Resources, Lansing.
MDNR (Michigan Department of Natural Resources). 2003. Sales of fishing licenses: a review of trends from a nationwide perspective and in Michigan. Michigan Department of Natural Resources, Fisheries Division, Lansing.
Pai, W. C. 2004. Hierarchical analysis for discovering knowledge in large databases. Information Systems Management (Winter) 21(1):81–88.
Peacock, P. R. 1998a. Data mining in marketing: part 1. Marketing Management (Winter) 6(4):8–18.
Peacock, P. R. 1998b. Data mining in marketing: part 2. Marketing Management (Spring) 7(1):14–25.
Peterson, K. 2003. Mining the data at hand: retail analytics create actionable customer insights. Chain Store Age (June) 79(6):36.
Prahalad, C. K., and V. Ramaswamy. 2001. Co-opting customer competence. Pages 1–25 in Harvard business review on customer relationship management. Harvard Business School Publishing Corporation, Boston, Massachusetts.
Putnam, R. D. 2000. Bowling alone: the collapse and revival of American community. Simon and Schuster, New York.
RBFF (Recreational Boating and Fishing Foundation). 2005. Water Works Wonders (Take Me Fishing) national campaign & Ohio pilot effort results summary: phase I. Available: http://www.rbff.org/research/newsletter.pdf. (June 2005).
Richardson, C., and S. Rushton. 2000. Aquatic resource education and sport fish restoration. Special Supplement to Fisheries (July 2000) 25(7):S68–S70.
Rupert, J. D., and S. L. Dann. 1998. Fishing in the parks: a research-based outreach program. Fisheries 23(6):19–27.

31
SAS (Statistical Analysis System) Institute. 2005. Ohio Department of Natural Resources trawls for big CRM prize: SAS provides platform for long-term business intelligence goals. Statistical Analysis System Institute. Available: http://www.sas.com/success/odnr.html. (June 2005).
Seybold, P. B. 2001. Get inside the lives of your customers. 2001. Pages 27–48 in Harvard business review on customer relationship management. Harvard Business School Publishing Corporation, Boston, Massachusetts.
Thomas, J. C., W. A. Kellogg, and T. Erickson. 2001. The knowledge management puzzle: human and social factors in knowledge management. IBM Systems Journal 40(4):863–884.
U.S. Census Bureau. 2000. (ST-99-10) Population estimates for the U.S. and states by single year of age and sex: July 1, 1999. Population Estimates Program, Population Division, U.S. Census Bureau, Washington, D.C. Available: http://www.census.gov/popest/archives/1990s/stas/st-99-10.txt. (December 2007).
U.S. Census Bureau. 2000. (ST-99-11) Population estimates for the U.S. and states by single year of age and sex: July 1, 1998. Population Estimates Program, Population Division, U.S. Census Bureau, Washington, D.C. Available: http://www.census.gov/popest/archives/1990s/stas/st-99-11.txt. (December 2007).
U.S. Census Bureau. 2000. (ST-99-12) Population estimates for the U.S. and states by single year of age and sex: July 1, 1997. Population Estimates Program, Population Division, U.S. Census Bureau, Washington, D.C. Available: http://www.census.gov/popest/archives/1990s/stas/st-99-12.txt. (December 2007).
U.S. Census Bureau. 2000. (ST-99-13) Population estimates for the U.S. and states by single year of age and sex: July 1, 1996. Population Estimates Program, Population Division, U.S. Census Bureau, Washington, D.C. Available: http://www.census.gov/popest/archives/1990s/stas/st-99-13.txt. (December 2007).
U.S. Census Bureau. 2000. (ST-99-14) Population estimates for the U.S. and states by single year of age and sex: July 1, 1995. Population Estimates Program, Population Division, U.S. Census Bureau, Washington, D.C. Available: http://www.census.gov/popest/archives/1990s/stas/st-99-14.txt. (December 2007).
U.S. Census Bureau. 2005. SC-EST2005-AGESEX_RES: estimates of the resident population by single-year of age and sex for the United States and states: July 1, 2005. State Age-Sex Population Estimates File for Internet Display. Population Estimates Program, U.S. Census Bureau, Washington D.C. Available: http://www.census.gov/popest/states/asrh/files/SC_EST2005_AGESEX_RES.txt and http://www.census.gov/popest/states/asrh/files/SC_EST2005_AGESEX_RES.csv. (December 2007).
USFWS (Department of the Interior, Fish and Wildlife Service) and USBC (U.S. Dept. of Commerce, Bureau of Census). 1998. 1996 national survey of fishing, hunting and wildlife-associated recreation: Michigan. U.S. Government Printing Office, Washington, D.C.
USFWS (Department of the Interior, Fish and Wildlife Service) and USBC (U.S. Dept. of Commerce, Bureau of Census). 2002. 2001 national survey of hunting, fishing and wildlife-associated recreation: Michigan. U.S. Government Printing Office, Washington, D.C.
32
USFWS (U.S. Fish and Wildlife Service). 1976. 1975 national survey of hunting, fishing and wildlife-associated recreation: Michigan. Conducted for U.S. Department of the Interior, by National Analysts, Division of Booz, Allen & Hamilton, U.S. Fish and Wildlife Service, Washington, D.C.
USFWS (U.S. Fish and Wildlife Service). 1982. 1980 national survey of fishing, hunting and wildlife-associated recreation: Michigan. U.S. Department of the Interior, U.S. Fish and Wildlife Service, Washington, D.C.
USFWS (U.S. Fish and Wildlife Service). 1989. 1985 national survey of fishing, hunting and wildlife-associated recreation: Michigan. U.S. Department of the Interior, U.S. Fish and Wildlife Service, Washington, D.C.
USFWS (U.S. Fish and Wildlife Service). 1992. 1991 national survey of hunting, fishing and wildlife-associated recreation: Michigan. U.S. Department of the Interior, U.S. Fish and Wildlife Service, Washington, D.C.
USFWS (U.S. Fish and Wildlife Service). 2002. Financial administrative reports: fishing license data history 1958–2002. U.S. Fish and Wildlife Service, Division of Federal Assistance. Available: http://federalaid.fws.gov/license%20holders/Fishing%20License%20Data%20History.pdf. (June 2006).
USFWS (U.S. Fish and Wildlife Service). 2003. Financial administrative reports: 2003 fishing license certification data. U.S. Fish and Wildlife Service, Division of Federal Assistance. Available: http://federalaid.fws.gov/license%20holders/Fishing%20License%20Data.pdf. (June 2006).
USFWS (U.S. Fish and Wildlife Service). 2004a. Fishing and hunting 1991–2001: avid, casual, and intermediate participation trends, addendum to the 2001 national survey of fishing, hunting and wildlife-associated recreation. Report 2001-5, U.S. Fish and Wildlife Service, Division of Federal Aid, Arlington, Virginia.
USFWS (U.S. Fish and Wildlife Service). 2004b. 2004 fishing license data report. U.S. Fish and Wildlife Service, Division of Federal Assistance. Available: http://federalaid.fws.gov/Reports/2004FishLicenseData.pdf. (June 2006).
James E. Breck, Reviewer Lizhu Wang, Editor Alan D. Sutton, Graphics Ellen S. G. Johnston, Desktop Publisher Approved by Paul W. Seelbach

33
APPENDIX A: Detailed Methods of Analysis
Overview
The unique analytical approach used in this study was to devise detailed protocols for analysis of patterns in numbers of “distinct” angling customers, rather than cursory analysis of total licenses sold. Toward this end, we developed protocols which allow not only for data cleaning and elimination of duplicate data for individual customers, but also for arriving at data sets that closely approximate the data sent annually from Michigan’s License Control office to the U.S. Fish and Wildlife Service to “certify” the number of Michigan anglers for purposes of allocation of Federal Aid monies back to the state.
Data were organized and cleaned in Microsoft Access before beginning analyses. Data cleaning entailed removing voids and duplicates from the data sets. Voided licenses were purchases that were not valid (e.g., cancelled transactions, incomplete transactions, errors). Duplicate license sales on the other hand were the same license types that were sold to the same individuals in the same year (e.g., a customer lost his or her license and purchased a replacement license).
Using Microsoft Access to delete duplicate records and voided license sales, the structure of the license table to be cleaned was copied on the database and given a new name (e.g., license 010 clean). The customer key was then used as a primary key to run queries that would remove voids and duplicate records. After the customer key was assigned as the primary key that would determine and later remove duplicates and voids, the original (“unclean”) license table was appended to the new table created earlier (e.g., license 010 clean) and the query to remove voids and duplicates was run. This protocol was used to clean the license tables separately. For the queries, there were three specific scenarios used for any given year: • Void is null or <>’Y’ was used for 1995 through 1999 data analyses. This meant that if the value
in the Void Field is null (no value or empty), it was counted. However, if the value is ‘Y’, it was not included. ‘Y’ meant that the sale was voided.
• Void <>’Y’ was used for 2000 to 2002 data analyses. This query included all records where the value of the Void Field is NOT equal to Y (Yes for void). Consequently, if the value is ‘N’ or null (no value at all or empty) licenses were counted.
• Void = ‘N’ was used for 2003 to 2004 data analyses. This query included only those records where the value of the Void Field is equal to ‘N’. Consequently, if the value is ‘Y’ or null or anything other than ‘N’, the license was not counted. Controls are in place to populate the Void field with either the ‘Y’ or ‘N’. Sometimes, however,
one would find a third option which is the null (no value or empty). Until one has a number of year’s worth of data generated by the system to check if the controls are in fact working, it is good practice to consider that the null possibility exists when building queries to increase accuracy (R. Parsons, MDNR, personal communication). Until 2003 when the License Control felt confident that the controls to populate the Void field with a ‘Y’ or a ‘N’ were working and the quality of the data was getting better (less messy), the queries used to remove voids and duplicate records were more conservative, that is, null was counted.
How the Total Number of Licenses Sold was Derived
The steps that were used to compute the total number of licenses sold were followed as closely as possible from the protocol that the License Control used to derive its numbers. The numbers that are posted by the USFWS annually are provided by Michigan Department of Natural Resources (MDNR), License Control. Roger Parsons, IT Specialist, Michigan Department of Information

34
Technology provided tremendous assistance in calculating the numbers reported in this document. Roger worked with License Control and other MDNR and USFWS staff in ensuring that our protocols and our numbers match as closely as possible with what was originally reported to the USFWS by the state of Michigan’s License Control office.
In general, to calculate the total number of licenses sold for any given year, each license table was cleaned using the protocol described above. Next, all cleaned tables were combined into one table. The resulting table yields the total number of licenses sold for any given year. It should be noted here that it was extremely important to use the appropriate query scenario as described above because each query resulted in different total sales. In addition, specific assumptions and criteria were applied each license year. Below is a detailed description of these assumptions and criteria.
1995
• License Control did not include license 014 (Senior Spouse) because this was a free license. Federal aid reporting states “licenses which do not return net revenue to the State shall not be included. To qualify as a paid license, the fee must produce net revenue for the State” (MDNR Policies and Procedures document number 15.01-01—Annual Certification of Hunting and Fishing License Holders to US Fish and Wildlife Service). License 082 (Sportsperson Replaced) was not counted. All other replacement sales were excluded. The 24-h paper-based licenses sold were counted. These paper-based licenses were sold mostly by charter boat owners who did not have access to the computerized point of sales licensing system.
• Following the License Control’s protocol, we did not count licenses 014 and 082 in calculating the total number of licenses sold. We did not count the 24-h paper-based licenses sold either primarily because data were not directly available. However, our calculations do include replacement sales in other license types except 082. The data sets that we received from MDNR did not contain the replacement field; hence it is not possible for us to exclude replacement sales other than 082 (for 1995 and 1996). Hence, our total number of licenses sold does not match USFWS’. This inability to exclude replacement sales is true for all years.
1996 (Void = null or <>’Y’)
• License Control followed the same protocol as described above except that they may not have included the 24-h paper-based licenses sold because no data existed for these licenses sold for this year (R. Parsons, MDNR, personal communication). Replacement sales were not counted.
• As described above, we did not count licenses 014 and 082 but could not exclude replacements from other license types.
1997–99 (Void = null or <>’Y’)
• License Control did not include replacement sales but counted the 24-h paper-based sales. • We counted replacements (because replacement fields are not included in the available data sets)
but did not count the 24-h paper-based sales.
2000–02 (Void <>’Y’)
• License Control stopped considering replacements, i.e., they no longer checked the value of the replacement field in the queries. Consequently, they did not exclude replacement sales from the

35
total number of licenses sold. Additionally, License Control stopped adding the 24-h paper-based license sales to the total number of licenses sold.
• We counted replacements but did not count the 24-h paper-based license sales.
2003–04 (Void = ‘N’)
• License Control stopped considering replacements, i.e., they no longer checked the value of the replacement field in the queries. Consequently, they did not exclude replacement sales from their total number of licenses sold. Additionally, License Control stopped adding the 24-h paper-based license sales to the total number of licenses sold. Finally, License Control did not add customer records where the first name and last name are null.
• We counted replacements but did not count the 24-h paper-based license sales and did not count customer records where first name and last name were null. The result of applying these protocols was to arrive at numbers of total licenses sold (minus
voided sales) that matched as close as possible the totals reported by License Control to USFWS (Table A.1). It should be noted here that starting in 1999, our analysis of total angler numbers matched License Control’s numbers very closely (1300+ difference). From 2000 to 2004, the difference between our total numbers and those of License Control was insignificant—less than 100 in 2004, and 1 and 2 in 2001 and 2000 respectively.
How the Number of Distinct Customers was Calculated
To compute the number of distinct customers for any given year, a similar process as calculating the total number of licenses sold was followed. In general, all of the cleaned tables were combined and a distinct query (“SELECT DISTINCT”) was created to count only the distinct or unique customers. This means that customers who bought two or more licenses using the same ID were counted only once. Specific assumptions and/or criteria were the same for all the years as those used in calculating the total number of licenses sold (see above). However, some years had additional criteria or requirements in their queries (see below).
1995
• The distinct number for 1995 was calculated differently compared to all the other years—no query was actually used. Instead, the number of distinct customers was based on license sales (not including voids or replacements and excluding license type 014), minus trout and salmon stamps, plus the 24-h paper-based licenses sold by charter operators.
• Our analysis—same as in 1995 total number of licenses sold.
1996–99
• License Control—same as in 1996–99 total number of licenses sold. • Our analysis—same as in 1996–99 total number of licenses sold.

36
2000–02
• Same as in total number of licenses sold for both License Control and our analysis. There was discussion on how many of the 24-h paper-based license sales were distinct. License Control did not expect that the difference would be significant so they decided to stop adding the sales from the charter boat operators.
2003–04
• Same as in total number of licenses sold for both License Control and our analysis. • In addition, the License Control started NOT counting records where last name and first name
were null (no value or empty). After an audit was made, License Control determined that customer records without a first and last name could not be counted since it could not be proven that they have not already been counted. Consequently, the state must certify that duplication has been eliminated and that multiple counting of single individuals did not occur when providing the numbers to USFWS. Hence the License Control did not count records where last name and first name were null. Our analysis followed the exact protocol.
Basic Demographic Analyses and License Types
Creating relationships between tables in MS Access.–Basic analyses of demographic and license types purchased every year required that relationships be established among the individual license tables, the customer table, and the address table for any given year. Subsequently, using the “address key” associated with each unique “customer key,” the address table was joined to the customer table by choosing all records from the customer table and only those records from the address table where the joined fields were equal. This query developed an outer join between the address table and the customer table that selected all customers from the customer table including the ones whose addresses were not available in the Address table.
To combine individual license tables with the customer table, a multi-tier set of queries that built on each other was necessary to select customer records that match with the license records in all the license type tables. A multi-tiered set of queries was necessary because a simple outer join would not result in selecting only those customers that are found in both the customer table and the individual license tables. Consequently, the first query was a union query that created a table with the customer key and the license types from each of the license tables excluding the voided sales. The second and third queries built on the first query and created a table that contained only distinct customers. The first three queries resulted in a table that contained the customer key, birth date, gender, state/province code, and zip postal code. Finally the fourth query built on the first three queries by joining the table created after the third query (the distinct customers table) and the individual license tables through the customer key. Consequently, the fourth query selected only those records from the distinct customer table and those from the individual license table “where the joined fields were equal.” The final query added the license type information into the distinct customer table and the resulting table is the demographics and license type table for any given year, which contained information on customer key, birth date, gender, state/province code, zip postal code, and the individual license types.
Exporting MS Access files to SPSS, recoding variables, and generating graphs and tables in MS Excel.–Once the data were sorted and organized in MS Access using a series of queries, the demographic and license type tables were exported to SPSS (Statistical Package for Social Science software) for recoding and statistical analyses. For demographic and license type analyses, the variables that were recoded were age, age group, gender, birth month, birth date, birth year, state, and
37
license type. Once the variables were recoded, crosstabs and frequencies were calculated. Subsequently, all SPSS outputs were exported into Excel for describing and presenting the data and analyses graphically.
Crosstabs tables for basic analyses on demographic and license types included: • (year) age group, license type, and purchase or did not purchase a license; • (year) gender and age group; • (year) gender, age group, and license type; • (year) total number of individuals who purchased a license by gender.
Frequency tables for basic analyses on demographic and license types included: • (year) age distribution; • (year) gender frequency of distinct customers; • (year) individuals who purchased each license type.
Retention Analyses
Combine customer tables of all license years in MS Access.–Retention analyses required that relationships between individuals across various license years be developed. For these analyses, customer tables for all license years were compiled into a new database allowing for the development of relationships that linked individual, distinct customer keys across license years. Queries were then developed to identify customers who had purchased any fishing license in all years of each two- and three-year period from 1995 through 2004 (e.g., 1995-1996, 1996-1997, 1995-1996-1997, 1996-1997-1998). To identify retained customers for two or three year periods, customer tables were joined by using a query that uses the customer key as the primary sorting key to include only those records where the joined fields from the two or three customer tables were equal. After the query was run, the resulting table contained the customer key, age, gender, and birth date for every customer who purchased a license in two or three year periods. These steps were repeated for all the other two- and three-year retention periods. Finally, each new table for two- and three-year retention periods was exported into SPSS for recoding (age, gender, birth date, birth month, birth year, and age group) and statistical analyses (crosstabs). The crosstabs tables analyzed data by age and gender. Finally, all SPSS outputs were exported into Excel again for describing and presenting the data and analyses graphically.
Proportion Analyses
For proportion analyses, i.e., resident angler participation in relation to the Michigan population, the demographic and license type tables were used and variables were recoded in SPSS (age, age group, gender, birth date, state, license type, birth month, and birth year). After the variables were recoded, data were filtered to select cases (customers) that purchased different license types. The filter served to place customers in certain categories based on the license that they bought. Crosstabs were then run to analyze data by age group and gender. Subsequently, all SPSS outputs were exported into Excel.
To determine the proportion of licensed anglers in relation to the Michigan population, age by sex frequency tables were downloaded from the US Census website. In Excel, data from these tables were then compiled by age groups corresponding the age groups identified from the crosstabs above (e.g.,

38
12 to 16, 17 to 19, 20 to 24, etc.). Totals for each age group from the crosstabs (angler participation) were then divided by the total Michigan population for that age group and multiplied by 100 to determine the proportions of the Michigan population that were licensed anglers (Table A.2).
Mean Age Analyses
As with the proportion analyses, mean age analyses used the recoded demographic and license type tables to generate means. After all the variables were recoded (same variables as above), data were filtered to select cases (customers) who purchased different license types. After filtering the data, means for each age group and gender were calculated. All SPSS outputs were exported into Excel for further data manipulation and analyses.

39
Table A.1.–Total number of Michigan angling licenses sold by license type, 1995–2004 (excluding void licenses).
1995 1996 1997 1998 1999 2000 2001 2002 2003 2004
Resident Resident 010 875,859 855,552 110 (+ 410 for 1997) 611,822 640,382 617,149 582,941 566,023 550,978 523,811 514,928011 277,783 281,744 111 (+ 411 for 1997) 72,265 70,521 67,316 61,767 60,201 59,486 56,621 55,803013 132,216 129,997 115 (+ 415 for 1997) 42,836 42,127 33,786 29,745 27,337 27,951 25,377 23,609080 124,395 129,887 116 (+ 416 for 1997) 3,895 3,450 2,022 1,272 1,115 1,252 1,086 1,097
120 (+ 420 for 1997) 320,202 327,644 338,387 341,582 345,845 339,717 331,311 326,583 121 (+ 421 for 1997) 45,839 46,294 47,479 47,810 49,643 50,585 51,409 52,592 122 (+ 422 for 1997) 2,636 2,059 1,236 1,002 745 798 1,022 906
500 143 242 268 264 249 224 215 401Resident total 1,410,253 1,397,180 Resident total 1,099,638 1,132,719 1,107,643 1,066,383 1,051,158 1,030,991 990,852 975,919
Non-resident Non-resident 015 132,146 129,617 112 (+ 412 for 1997) 90,738 89,672 89,613 87,981 82,171 80,912 78,407 76,718
117 (+ 417 for 1997) 3,913 3,605 1,943 1,814 1,588 1,543 1,432 1,353 123 (+ 423 for 1997) 25,712 26,629 27,259 29,445 30,480 31,242 31,216 31,662 Non-resident total 120,363 119,906 118,815 119,240 114,239 113,697 111,055 109,733
Daily Daily 012 190,020 190,382 125 219,560 230,035 232,115 229,005 217,382 222,983 214,702 208,252
126 877 989 961 924 1,014 1,074 1,003 889 Daily total 220,437 231,024 233,076 229,929 218,396 224,057 215,705 209,141Grand Total 1,732,419 1,717,179 Grand Total 1,440,438 1,483,649 1,459,534 1,415,552 1,383,793 1,368,745 1,317,612 1,294,793

40
Table A.2.–Sex (by %) of Michigan licensed anglers by license type, 1995–2004.
License code and description Sex 1995 1996 1997 1998 1999 2000 2001 2002 2003 2004
010: resident Male 78.1 77.9 Female 21.9 22.1
011: trout and salmon stamp Male 87.6 87.6 Female 12.4 12.4
012: daily Male 81.7 81.8 Female 18.3 18.2
013: senior Male 90.0 90.1 Female 10.0 9.9
014: senior spouse Male 94.8 94.9 Female 5.2 5.1
015: non-resident Male 81.9 82.3 Female 18.1 17.7
080: sportsperson Male 97.8 97.7 Female 2.2 2.3
082: sportsperson replaced Male n/a 96.7 Female n/a 3.3
110 (+410 for 1997) Male 75.5 75.1 75.1 75.2 75.1 75.5 75.6 75.5 resident restricted Female 24.5 24.9 24.9 24.8 24.9 24.5 24.4 24.5
111: (+411 for 1997) Male 77.1 76.5 76.5 76.7 76.4 76.2 76.5 76.5 senior restricted Female 22.9 23.5 23.5 23.3 23.6 23.8 23.5 23.5
112: (+412 for 1997) Male 80.3 80.0 80.4 80.6 81.1 81.4 81.4 81.3 non-resident restricted Female 19.7 20.0 19.6 19.4 18.9 18.6 18.6 18.7
115: (+415 for 1997) Male 88.4 88.3 89.3 89.5 89.4 89.8 89.2 88.9 resident all species upgrade Female 11.6 11.7 10.7 10.5 10.6 10.2 10.8 11.1
116: (+416 for 1997) Male 89.1 89.4 91.8 91.2 92.3 92.4 92.5 91.3 senior all species upgrade Female 10.9 10.6 8.2 8.8 7.7 7.6 7.5 8.7
117: (+417 for 1997) non- Male 89.9 90.2 92.9 92.2 92.1 91.3 91.9 91.2 resident all species upgrade Female 10.1 9.8 7.1 7.8 7.9 8.7 8.1 8.8
120: (+420 for 1997) Male 89.6 88.9 88.8 88.8 88.9 89.0 88.9 88.9 resident all species Female 10.4 11.1 11.2 11.2 11.1 11.0 11.1 11.1
121: (+421 for 1997) Male 91.6 91.4 91.6 91.7 91.7 91.8 91.8 91.8 senior all species Female 8.4 8.6 8.4 8.3 8.3 8.2 8.2 8.2
122: (+422 for 1997) Male 84.9 83.9 86.5 86.7 87.9 87.5 84 83.6 young angler-all species Female 15.1 16.1 13.5 13.3 12.1 12.5 16 16.4
123: (+423 for 1997) Male 91.1 90.8 90.9 90.9 91.3 91.3 91.3 91 non-resident all species Female 8.9 9.2 9.1 9.1 8.7 8.7 8.7 9
125: 24-hr Male 81.2 80.9 81.3 81.6 81.8 81.9 81.8 81.4 Female 18.8 19.1 18.7 18.4 18.2 18.1 18.2 18.6

41
Table A.2.–Continued.
License code and description Gender 1995 1996 1997 1998 1999 2000 2001 2002 2003 2004
126: 24-h senior Male 76.4 78.3 77.9 79.0 81.1 83.5 81.3 79.8 Female 23.6 21.7 22.1 21.0 18.9 16.5 18.7 20.2
500: resident Male 96.1 94.9 96.3 95.4 94.3 96.1 97.4 98.4 military all species Female 3.9 5.1 3.7 4.6 5.7 3.9 2.6 1.6
TOTALS Male 81.6 81.6 80.8 80.3 80.5 80.9 81.0 81.3 81.4 81.3 (all licenses combined1) Female 18.4 18.4 19.2 19.7 19.5 19.1 19.0 18.7 18.6 18.7
1 Total percents calculated based on total combined license sales, and excluded cases that have missing data for the sex variable.
Notes:
1. Numbers exclude void licenses. 2. Numbers include duplicate license sales to same customer keys (repeat customer keys purchasing multiple
licenses). 3 Numbers exclude distinct customer cases that have missing data for the sex variable.

42
This page was intentionally left blank.

43
Appendix B.–Proportion of Michigan residents who purchased varying types of fishing licenses, 1995–96.
Age group12 to
16
17 to 19
20 to 24
25 to 29
30 to 34
35 to 39
40 to 44
45 to 49
50 to 54
55 to 59
60 to 64
65 to 69
70 to 74
75 to 79
80 to 84
85 to 100
% o
f Mic
higa
n re
side
nts
0
5
10
15
20
25
30
35Male Female Total
Age group12 to
16
17 to 19
20 to 24
25 to 29
30 to 34
35 to 39
40 to 44
45 to 49
50 to 54
55 to 59
60 to 64
65 to 69
70 to 74
75 to 79
80 to 84
85 to 100
% o
f Mic
higa
n re
side
nts
0
5
10
15
20
25
30
35
Male Female Total
Any type fishing license
Any type fishing license
1995
1996

44
Age group12 to
16
17 to 19
20 to 24
25 to 29
30 to 34
35 to 39
40 to 44
45 to 49
50 to 54
55 to 59
60 to 64
65 to 69
70 to 74
75 to 79
80 to 84
85 to 100
% o
f Mic
higa
n re
side
nts
0
5
10
15
20
25
Male Female Total
Age group12 to
16
17 to 19
20 to 24
25 to 29
30 to 34
35 to 39
40 to 44
45 to 49
50 to 54
55 to 59
60 to 64
65 to 69
70 to 74
75 to 79
80 to 84
85 to 100
% o
f Mic
higa
n re
side
nts
0
5
10
15
20
25Male Female Total
Restricted fishing license
1995
1996
Restricted fishing license

45
Age group12 to
16
17 to 19
20 to 24
25 to 29
30 to 34
35 to 39
40 to 44
45 to 49
50 to 54
55 to 59
60 to 64
65 to 69
70 to 74
75 to 79
80 to 84
85 to 100
% o
f Mic
higa
n re
side
nts
0
5
10
15
20
25
30
Male Female Total
Age group12 to
16
17 to 19
20 to 24
25 to 29
30 to 34
35 to 39
40 to 44
45 to 49
50 to 54
55 to 59
60 to 64
65 to 69
70 to 74
75 to 79
80 to 84
85 to 100
% o
f Mic
higa
n re
side
nts
0
5
10
15
20
25
30
Male Female Total
Senior fishing license
1995
1996
Senior fishing license
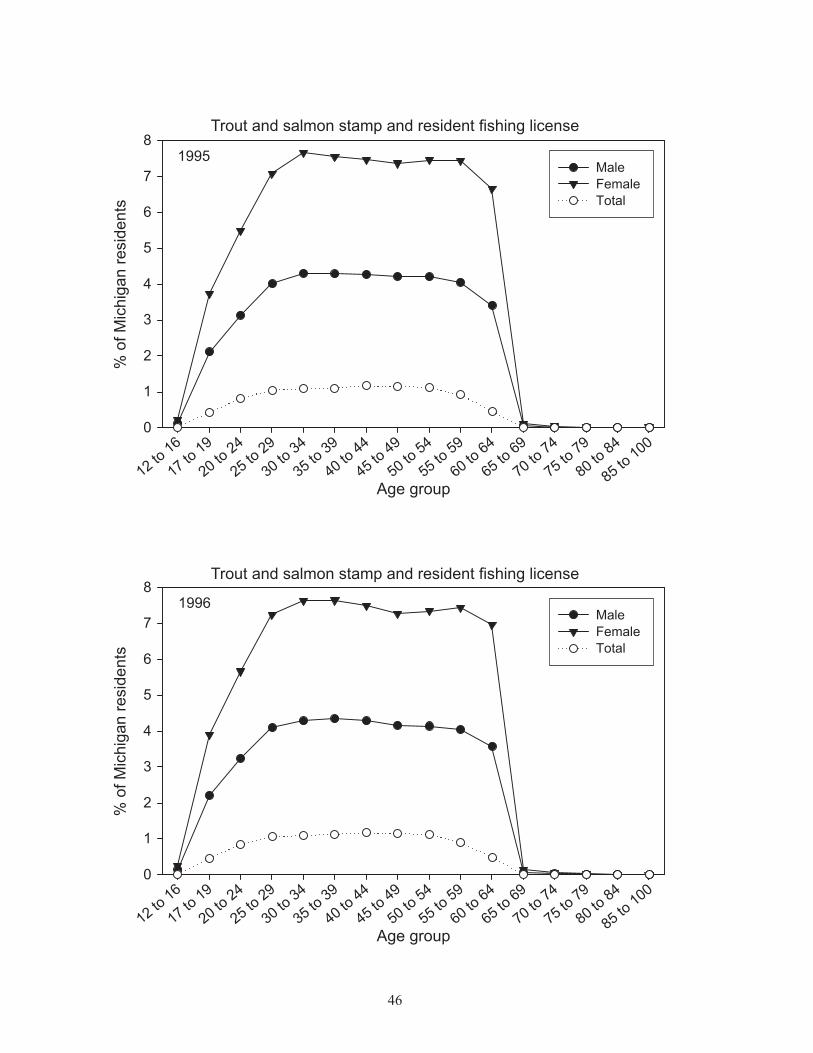
46
Age group12 to
16
17 to 19
20 to 24
25 to 29
30 to 34
35 to 39
40 to 44
45 to 49
50 to 54
55 to 59
60 to 64
65 to 69
70 to 74
75 to 79
80 to 84
85 to 100
% o
f Mic
higa
n re
side
nts
0
1
2
3
4
5
6
7
8
Male Female Total
Age group12 to
16
17 to 19
20 to 24
25 to 29
30 to 34
35 to 39
40 to 44
45 to 49
50 to 54
55 to 59
60 to 64
65 to 69
70 to 74
75 to 79
80 to 84
85 to 100
% o
f Mic
higa
n re
side
nts
0
1
2
3
4
5
6
7
8
Male Female Total
Trout and salmon stamp and resident fishing license
Trout and salmon stamp and resident fishing license
1995
1996

47
Daily fishing license
Age group12 to
16
17 to 19
20 to 24
25 to 29
30 to 34
35 to 39
40 to 44
45 to 49
50 to 54
55 to 59
60 to 64
65 to 69
70 to 74
75 to 79
80 to 84
85 to 100
% o
f Mic
higa
n re
side
nts
0.0
0.1
0.2
0.3
0.4
0.5
0.6
0.7
0.8
Male Female Total
Age group12 to
16
17 to 19
20 to 24
25 to 29
30 to 34
35 to 39
40 to 44
45 to 49
50 to 54
55 to 59
60 to 64
65 to 69
70 to 74
75 to 79
80 to 84
85 to 100
% o
f Mic
higa
n re
side
nts
0.0
0.1
0.2
0.3
0.4
0.5
0.6
0.7
0.8
Male Female Total
1995
1996
Daily fishing license

48
Age group12 to
16
17 to 19
20 to 24
25 to 29
30 to 34
35 to 39
40 to 44
45 to 49
50 to 54
55 to 59
60 to 64
65 to 69
70 to 74
75 to 79
80 to 84
85 to 100
% o
f Mic
higa
n re
side
nts
0
1
2
3
4
5
6
Male Female Total
Age group12 to
16
17 to 19
20 to 24
25 to 29
30 to 34
35 to 39
40 to 44
45 to 49
50 to 54
55 to 59
60 to 64
65 to 69
70 to 74
75 to 79
80 to 84
85 to 100
% o
f Mic
higa
n re
side
nts
0
1
2
3
4
5
6
Male Female Total
Sportsperson fishing license
1995
1996
Sportsperson fishing license

49
Appendix C.–Proportion of Michigan residents who purchased varying types of fishing licenses, 1997–2004.
05
1015202530
05
10152025
05
10152025
% o
f Mic
higa
n re
side
nts
05
10152025
05
10152025
05
10152025
05
10152025
Age group17 to
19
20 to 24
25 to 29
30 to 34
35 to 39
40 to 44
45 to 49
50 to 54
55 to 59
60 to 64
65 to 69
70 to 74
75 to 79
80 to 84
85 to 100
MalesFemalesBoth Sexes
05
10152025
1997
1998
1999
2000
2001
2002
2003
2004
Any type fishing license

50
0.5%
of M
ichi
gan
resi
dent
s
Age12 13 14 15 16
0.00.10.20.30.40.00.10.20.30.40.00.10.20.30.40.00.10.20.30.40.00.10.20.30.40.00.10.20.30.40.00.10.20.30.40.00.10.20.30.4
MalesFemalesBoth Sexes
1997
1998
1999
2000
2001
2002
2003
2004
Young angler fishing license
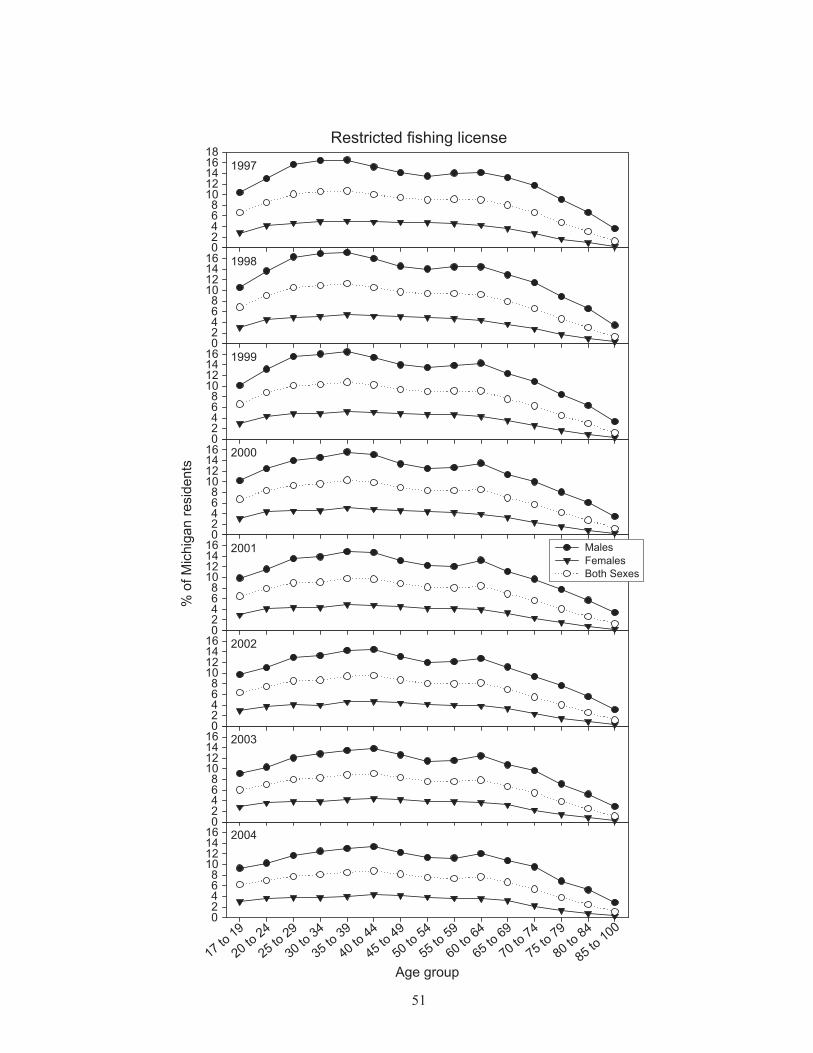
51
02468
1012141618
02468
10121416
02468
10121416
% o
f Mic
higa
n re
side
nts
02468
10121416
02468
10121416
02468
10121416
02468
10121416
Age group17 to
19
20 to 24
25 to 29
30 to 34
35 to 39
40 to 44
45 to 49
50 to 54
55 to 59
60 to 64
65 to 69
70 to 74
75 to 79
80 to 84
85 to 100 0
2468
10121416
MalesFemalesBoth Sexes
1997
1998
1999
2000
2001
2002
2003
2004
Restricted fishing license

52
02468
101214
02468
1012
02468
1012
% o
f Mic
higa
n re
side
nts
02468
1012
02468
1012
02468
1012
02468
1012
Age group17 to
19
20 to 24
25 to 29
30 to 34
35 to 39
40 to 44
45 to 49
50 to 54
55 to 59
60 to 64
65 to 69
70 to 74
75 to 79
80 to 84
85 to 100 0
2468
1012
MalesFemalesBoth Sexes
1997
1998
1999
2000
2001
2002
2003
2004
All species or all species upgrade fishing license

53
0.0
0.5
1.0
1.5
0.0
0.5
1.0
0.0
0.5
1.0
% o
f Mic
higa
n re
side
nts
0.0
0.5
1.0
0.0
0.5
1.0
0.0
0.5
1.0
0.0
0.5
1.0
Age group17 to
19
20 to 24
25 to 29
30 to 34
35 to 39
40 to 44
45 to 49
50 to 54
55 to 59
60 to 64
65 to 69
70 to 74
75 to 79
80 to 84
85 to 100 0.0
0.5
1.0
MalesFemalesBoth Sexes
1997
1998
1999
2000
2001
2002
2003
2004
24-hr fishing license
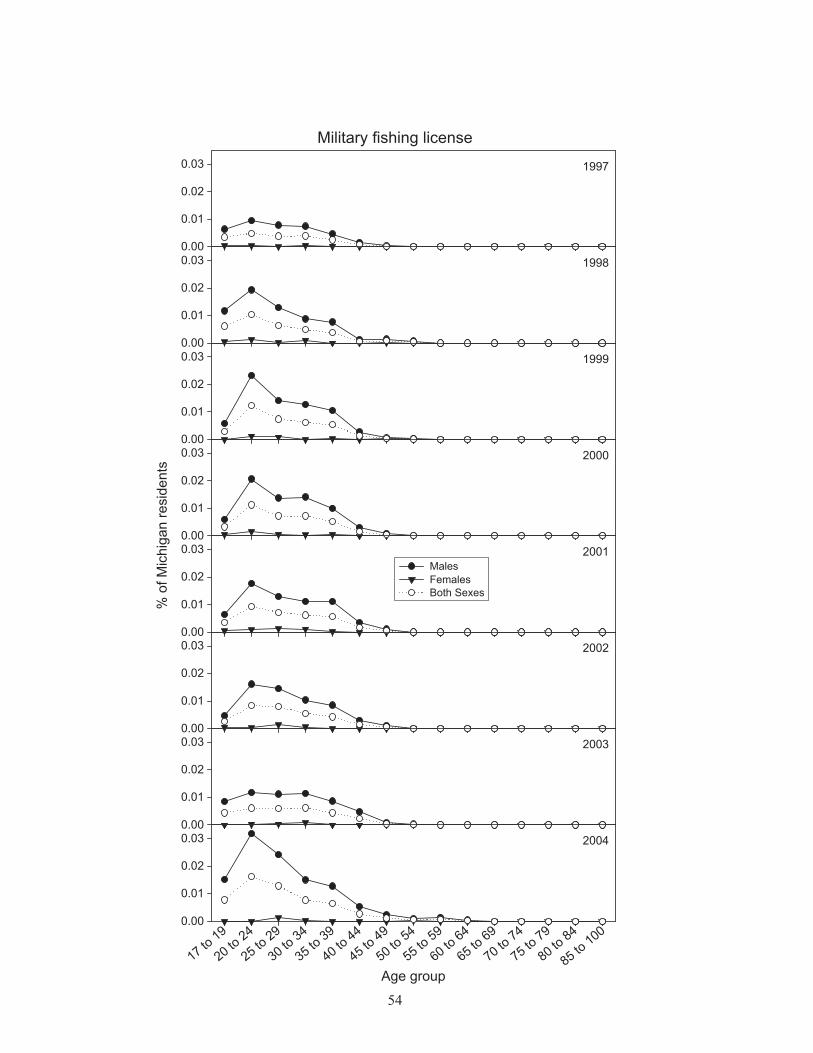
54
0.00
0.01
0.02
0.03
0.00
0.01
0.02
0.03
0.00
0.01
0.02
0.03
% o
f Mic
higa
n re
side
nts
0.00
0.01
0.02
0.03
0.00
0.01
0.02
0.03
0.00
0.01
0.02
0.03
0.00
0.01
0.02
0.03
Age group17 to
19
20 to 24
25 to 29
30 to 34
35 to 39
40 to 44
45 to 49
50 to 54
55 to 59
60 to 64
65 to 69
70 to 74
75 to 79
80 to 84
85 to 100 0.00
0.01
0.02
0.03
MalesFemalesBoth Sexes
1997
1998
1999
2000
2001
2002
2003
2004
Military fishing license