for 2015 exam and onwards - gill education - homesection1 inferential statistics (higher lc) 3...
TRANSCRIPT

LOUISE BOYLAN, BRENDAN GUILDEA & GEORGE HUMPHREY
FOR LEAVING CERT HIGHER LEVEL
CONCISE
NEW
SUPPLEMENT
Covering Statistics, Binomial Theorem,
Integration, Graphs & Transformations
FOR 2015 EXAMAND ONWARDS

Contents
1 Inferential Statistics 3
– Margin of error 3
– 95% confidence interval 5
– Hypothesis testing 10
– p-value 20
2 Binomial Theorem 25
3 Additional Integration 26
4 Transforming Graphs 29
5 Continuity of Functions 35
6 Graphs of Derivatives 37
7 Answers 43
Acknowledgement
The authors would like to thank Stacey Carter in Our Lady’s College
Greenhills, Drogheda and Mark Lynch in Monkstown CBC for all
their help.
NCPM_5_supplement_FM.qxd 8/29/14 9:35 AM Page 1

NCPM_5_supplement_FM.qxd 8/29/14 9:35 AM Page 2

1SECTION INFERENTIAL STATISTICS (HIGHER LC)
3
Inferential statistics is the branch of statistics that uses probability and statistics to draw conclusionsfrom data that are affected by random variation. To work on inferential statistics, we should be able to:
1. Estimate the value of a population proportion2. Calculate the margin of error for a sample3. Construct a confidence interval4. Test a hypothesis about a population proportion5. Apply sampling theory to hypothesis questions6. Use p-value as an alternative to hypothesis testing
Margin of error and confidence intervals for population proportionsMany statistical studies want to obtain the proportion (percentage) of a population that has a specifiedattribute. In most cases the population under consideration will be large and hence it would beimpractical, if not impossible, to obtain the population proportion by taking a census. Thus, wegenerally employ sampling and use the sample data to make inferences about the population.
The key to the validity of any survey is randomness. It is important that the sample be chosenrandomly so that the survey results can be generalised to the whole population.
The results of a survey are only an estimate of the quantity of interest. When results of surveys arereported in the media, they often include a statement like: ‘35% of respondents favour Mr Smith inthe upcoming election. However, there is a margin of error of 3 percentage points.’ What thismeans is that the people who carried out the survey are reasonably confident that in the real election,the percentage of votes for Mr Smith will be 35% 3%. In other words, they are confident that if theelection was held now, Mr Smith would receive somewhere between 32% and 38% of the vote. Suchintervals are called confidence intervals.
An estimate from a survey should be treated with caution. Sampling errors mean that the results inthe sample differ from the true results due to the ‘luck of the draw.’ However, it is important toremember that sampling errors do not make surveys useless.
±
This section of new material is to replace pages 186 to 196 in NCPM 5.
NCPM_5_supplement_SEC1.qxd 8/28/14 2:08 PM Page 3

NotationWe use the letter p to denote the population proportion. It is this value that is to be estimated. Weuse (pronounced ‘p hat’) to denote the sample proportion. is the statistic that will be used toestimate the unknown population proportion, p.
= sample proportion
The population proportion, p, although unknown, is a fixed number. On the other hand, the sampleproportion, , is a random variable and its value depends on chance.
Suppose we wanted to know the proportion (percentage) of people in Ireland who are left-handed. Werandomly selected 400 people and found that 64 of them are left-handed.
If 60 out of 400 people sampled were left-handed, then:
Notice that the value of , the sample proportion, changes depending on the sample chosen. If thesample chosen is a good representation of the population, then , the sample proportion, will be agood estimate of the true population proportion, p.
Confidence interval for population proportion using the standard normal tablesHow should we summarise the strength of the data in a sample survey? This is where the role of thestandard error (SE) of the proportion, written , comes in. The standard error is a number thatrepresents the accuracy of a sample survey. It is a statistic expressing the amount of random samplingerror in the results of a sample survey. The most commonly used level of confidence is 95%, butothers you may meet include 90%, 98% and 99%. On our course, the 95% confidence level for thestandard error (SE) is given by
(see the formulae and tables booklet)
where is called the standard error (SE),
n is the size of the samples where
and p is the true proportion of the population (or instead of p if p is unknown).pNn Ú 30
sNp
sNp = A
p(1 − p)n
sNp
pNpN
pN = 60
400= 0 #15 (15%)
pN = Number of people in the sample who are left-handed
The number of people sampled= 64
400= 0 #16 (16%)
pN
pNp = population proportion
pNpN
4
NEW CONCISE PROJECT MATHS 5
NCPM_5_supplement_SEC1.qxd 8/28/14 2:08 PM Page 4

INFERENTIAL STATISTICS
5
We can state with 95% confidence that the true population, p, lies inside this interval. What thismeans is that if the same population was surveyed on numerous occasions and the confidence intervalwas calculated, then about 95% of these confidence intervals would contain the true proportion andabout 5% of these confidence intervals would not contain the true proportion.
To calculate the margin of error (ME) at the 95% level of confidence, we need to know the associatedz-value from the normal curve.
From the standard normal tables,
Now z is the number of standard deviation that the margin of error is from the mean. Thus, the marginof error, E, is given by:
E = z
E = 1·96
Confidence intervalThe estimated proportion plus or minus its margin of error is called a confidence interval for the trueproportion. The 95% confidence for a proportion is given by:
sNp
sNp
z = 1 #96.
sample proportion - margin of error true proportion sample proportion + margin of error
Where n is the sample size, p is the population proportion and is the sample proportion.pN
pN − 1 #96ANp(1 − Np)
n… p … Np + 1 #96A
Np(1 − Np)n
pN − 1 #96sNp … p … Np + 1 #96spN
pN − zsNp … p … Np + zspN
……
95%
0–z +z
0·975
0 +z
2 %21 2 %2
1 0·025
NCPM_5_supplement_SEC1.qxd 8/28/14 2:08 PM Page 5

6
NEW CONCISE PROJECT MATHS 5
The end points of the 95% confidence are given by :Np ± 1 #96sNp
It is worth noting that when p (or instead of p if p is unknown) is close to , a good approximation
to the margin of error, at the 95% confidence level, is given by .E = zsp = 1
1n
1
2pN
11
A poll was taken of 2,020 workers in a city. The workers sampled were asked whether theytake a ‘duvet day’, that is, call in sick, at least once a year when they simply need time torelax. 404 workers responded yes. Use these data to obtain a 95% confidence interval forthe proportion, p, of all employees in the city who take a ‘duvet day’.
SolutionStep 1: Calculate the standard error.
SE where n = 2,020
and .
Then .
Step 2: The margin of error, E, at the 95% confidence interval is given by
.E = 1 #96sNp = 1 #96(0 #009) = 0 #0176
sNp = A
(0 #2)(1 − 0 #2)
2,020= 0 #008899 = 0 #009
Np = 404
2,020= 0 #2
= sNp = A
Np(1 − Np)n
p̂ + 1·96 sp̂
The 95% confidence interval
p̂ – 1·96 sp̂
NCPM_5_supplement_SEC1.qxd 8/28/14 2:08 PM Page 6

Step 3: The 95% confidence interval for the true proportion, p, is then:
We are 95% confident that the percentage of all the city’s employees who take a duvet dayis somewhere between 18·24% and 21·76%.
It is worth noting that the margin of error, E, is half the length of the confidence interval.
18 #24% … p … 21 #76%0 #1824 … p … 0 #2176
0 #2 − 0 #0176 … p … 0 #2 + 0 #0176
Np − E … p … Np + E
0·1824 0·2176
95% confidence interval
p
INFERENTIAL STATISTICS
7
22
In a by-election, a random sample of 900 voters suggests that 35% will vote for candidate A.
(i) Find the standard error at the 95% confidence level.
(ii) If a random sample of 400 voters was used, would the standard error (at the 95%confidence level) be greater than or less than 1·6%? Justify your answer.
(iii) Candidate A is a billionaire who wishes to determine his level of support to within %.What sample size should be taken at the 95% confidence level?
Solution
(i) Standard error
(ii) Since the sample size, , is less than the sample size from part (i), westate:
Method 1
Standard error
Hence, standard error is greater than 1·6%.
Method 2
Since in part (i) is greater than in part (ii), this means the answer inpart (i) is more accurate than the answer to part (ii).
has a standard error > 1·6%.‹ n = 400
n = 400n = 900
= sNp = A
Np(1 − Np)n
= A(0 #35)(0 #65)
400= 0 #024 = 2 #4%
n = 900n = 400
= sNp = A
Np(1 − Np)n
= A(0 #35)(1 − 0 #35)
900= 0 #016 = 1 #6%
±1
2
NCPM_5_supplement_SEC1.qxd 8/28/14 2:08 PM Page 7

(iii) Note: To within % means that the margin of error should be %.
Let n = size of the random sample
Then
becomes
(square both sides)
0·000025n = 0·873964n = 34,959
A sample size of 34,959 would be required to obtain a margin of error of %.1
2
0 #000025 = 3 #84160 #2275
n
0 #005 = 1 #96A(0 #35)(0 #65)
n
E = 1 #96 = ANp(1 − Np)
n
Np = 0 #35
E = 1
2% = 0 #005
1
2±
1
2
8
NEW CONCISE PROJECT MATHS 5
Exercise 1.1
1. Show on separate diagrams the following confidence intervals.
(i) In a survey, 52% of voters supported a certain candidate with a margin of error of 5%.
(ii)
(iii)
(iv)
(v) In a clinical study, 86% of patients reported relief after taking a new drug. The marginof error was calculated as 4·5%.
5
18… p …
1
2
62% … p … 67%
0 #18 … p … 0 #26
Some notes on margin of error• On our course, the margin of error is always at the 95% level of confidence.• As the sample size increases the margin of error decreases.• At the 95% level of confidence a sample of about
(i) 80 has a margin of error approximately 11%(ii) 1,000 has a margin of error approximately 3�2%.
• The size of the (original) population does not matter.• If the sample size, m, is doubled (say 500 to 1,000) the margin of error, E, is not halved.• The margin of error estimates how accurately the results of a poll reflect the true feelings of the
population.
±±
NCPM_5_supplement_SEC1.qxd 8/28/14 2:08 PM Page 8

2. In a study on UFOs (unidentified flying objects), 34% of those surveyed reported at leastone UFO sighting. The margin of error was plus or minus 2·6 percentage points (for a 95%confidence level). Use this information to obtain a 95% confidence interval for thepercentage of those surveyed who reported at least one UFO sighting.
3. The results of two polls on the government’s budget plan appeared in a national newspaper.Poll A stated that 79% supported the budget plan; the margin of error was plus or minus 5%.Poll B stated that 74% supported the budget plan; the margin of error was plus or minus 4%.Is it possible that both of these polls were correct in their conclusion?
4. A poll was taken of 825 self-employed workers. The workers sampled were asked if theycontribute to a pension scheme to provide for retirement. 462 workers responded yes. Usethese data to obtain a 95% confidence interval for the proportion, p, of all self-employedworkers who contribute to a pension scheme.
5. A survey on the drinking habits of Europeans, carried out by the EU, estimated thepercentage of adults across the EU who drink beer, wine or spirits at least occasionally. Ofthe 4,548 adults interviewed, 2,955 said they drank at least occasionally.
(i) Determine a 95% confidence interval for the proportion, p, of all EU citizens whodrink beer, wine or spirits at least occasionally.
(ii) Interpret your results from part (i).
6. A government department wants to estimate the proportion, p, of its employees who went onsick leave during the past year. A random sample of 64 employees was taken. 36 of thesample went on sick leave during the past year.
(i) Find the standard error at the 95% confidence level.
(ii) If a random sample of 100 employees was taken, how would the standard errorcompare to the answer for part (i)? Explain your answer.
(iii) The CEO of the department wants to determine the annual proportion of employeeswho went on sick leave to within 2%. What sample size should be taken at the 95%level of confidence?
7. High-visibility vests come in five different sizes: 1, 2, 3, 4 and 5. A road maintenancecompany issued vests to 40 randomly selected employees. The sizes issued to these 40 employees were as follows.
1 3 2 3 5 4 3 2 4 5 5 3 3 2 1 3 4 3 2 3
3 2 3 4 3 3 2 1 2 3 4 3 5 3 2 1 5 3 4 4
(i) Find , the proportion in the sample of employees that were issued with size 3.
(ii) Calculate the 95% confidence interval for the proportion of all employees in thecompany that require size 3.
(iii) How could the company find a more precise 95% confidence interval?
pN
INFERENTIAL STATISTICS
9
NCPM_5_supplement_SEC1.qxd 8/28/14 2:08 PM Page 9
(iv) The estimate of p is . How large a sample would be needed in order to obtain anapproximate 95% confidence interval of the form
8. (i) A catalogue sales company promises to deliver orders placed on the internet withinfive days. Follow-up calls to n randomly selected customers show that a 95%confidence interval for the proposition that all orders arrive on time (within five days)is Find the value of n.
(ii) Which, if any, of the following conclusions is correct? (In each case, justify your answer.)
(a) Between 82% and 94% of all orders arrive on time.
(b) 95% of all random samples of customers will show that 88% of all orders willarrive on time.
(c) On 95% of the days, between 82% and 94% of the orders will arrive on time.
9. Consider each situation described below.Identify the population and the sample, explain what p and represent and state whether wecan construct a 95% confidence interval for each situation and justify your statement.
(i) A university admits 1,916 students to first year, and three years later 1,798 of themgraduated on time. The university wants to estimate the percentage of all their firstyears who graduate on time.
(ii) A radio talk show asks listeners to register their opinions on prayer in schools bylogging on to a website. Of the 702 people who voted, 588 favoured prayer in schools.Can we estimate from this opinion poll the level of support among the general public?
(iii) In a poll of 11 secondary school students, four students expected to get maximum CAOpoints in their Leaving Certificate. Is it possible to estimate the percentage of all LeavingCertificate students who would expect to get maximum CAO points based on this poll?
(iv) The gardaí set up a motor vehicle checkpoint at which drivers are stopped and theirvehicles inspected for safety problems. They find that 12 of the 126 cars stopped haveat least one safety violation. They want to estimate the percentage of all motor vehiclesthat may be unsafe.
(v) A school is considering changing the type of school uniform. The Parents Associationsurveys parent opinion by sending a questionaire home with all 1,143 students. 299surveys are returned, with 201 surveys in favour of the change. What conclusions canthe Parents Association draw?
pN
88% ± 6%.
± 0 #1?pNpN
NEW CONCISE PROJECT MATHS 5
10
Hypothesis testingA hypothesis is a statement or conjecture whose truth has yet to be proven or disproven. Examples ofhypotheses:
• More than half the population is satisfied with EU membership
• Drinking fizzy drinks causes tooth decay
• The age at marriage has increased over the past 20 years.
NCPM_5_supplement_SEC1.qxd 8/28/14 2:08 PM Page 10

INFERENTIAL STATISTICS
11
Statistics help to make decisions
We can use statistics to accept or reject claims.
1. Is global temperature increasing?The null hypothesis, H0, is that global temperature is not increasing, i.e. there is no difference intemperature.The alternative hypothesis, HA, is that global temperature is increasing.
2. Is a new drug effective for treating HIV/AIDS?The null hypothesis, H0, is that the new drug is not effective.The alternative hypothesis, HA, is that the new drug is effective.
3. Is a survey on left-handed people biased if it indicates that 24% of people are left-handed?The null hypothesis, H0, is that 24% of people are left-handed, i.e. the survey is not biased.The alternative hypothesis, HA, is that the survey is biased.
Often the people investigating the data hope to reject H0. They hope:
• Their new drug is better than the old one
or
• The new ad campaign is better than the old one, etc.
However, in statistics, it is essential that our attitude is one of skepticism. Until we are convincedotherwise, we accept H0. In other words, we cling to the idea that there is no change, no improvement,no deterioration, no effect.
In a courtroom, the null hypothesis is that the defendant did not commit a crime.
A verdict of guilty means we reject the null hypothesis, that is to say, the defendant committed acrime.
However, a verdict of not guilty does not mean the defendant did not commit a crime, but simply thatthe case has not been proven.
Applying this logic to hypothesis testing, we either reject H0 or fail to reject H0.
The reasoning behind hypothesis testing is that we usually prefer to think about getting things rightrather than getting them wrong.
In testing a hypothesis, data may be given or collected.
Null hypothesisThe statement being tested in a test of significance is called the null hypothesis. The test ofsignificance is designed to assess the strength of the evidence against the null hypothesis.Usually the null hypothesis is a statement of ‘no effect’ or ‘no difference.’We abbreviate ‘null hypothesis’ as H0.
NCPM_5_supplement_SEC1.qxd 8/28/14 2:08 PM Page 11
12
With given data in this course, we accept the information at face value and proceed to analyse thedata and answer the question.
To collect data, a questionnaire could be used to carry out a survey. The key to the validity of anysurvey is randomness.
Procedure for carrying out a hypothesis testThe procedure for carrying out a hypothesis test will involve the following steps:
1. Write down H0, the null hypothesis, and HA, the alternative hypothesis.
2. Write down or calculate the sample proportion, .
3. Find the 95% margin of error.
4. Write down the 95% confidence interval for p, using
.
In addition, we can illustrate the confidence interval with a diagram.
5. (i) If the value of the population proportion stated is within the confidence interval, we fail toreject H0.
(ii) If the value of the population proportion is outside the confidence interval, reject the nullhypothesis, H0.
6. State your conclusion in words.
Np − 1 #96ANp(1 − Np)
n… p … Np + 1 #96A
Np(1 − Np)n
pN
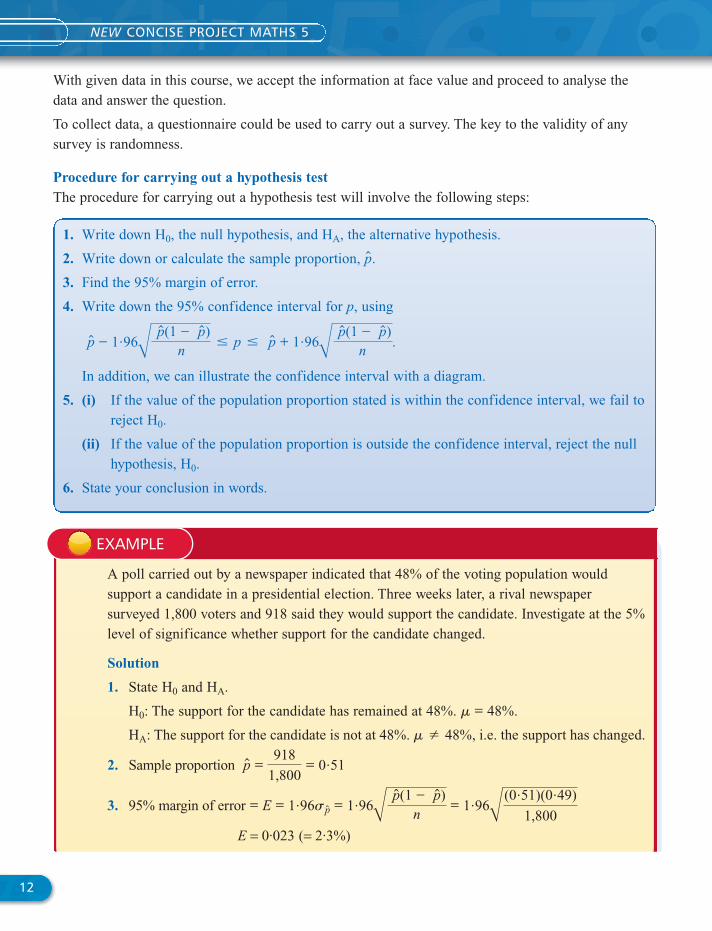
A poll carried out by a newspaper indicated that 48% of the voting population wouldsupport a candidate in a presidential election. Three weeks later, a rival newspapersurveyed 1,800 voters and 918 said they would support the candidate. Investigate at the 5%level of significance whether support for the candidate changed.
Solution
1. State H0 and HA.
H0: The support for the candidate has remained at 48%. .
HA: The support for the candidate is not at 48%. , i.e. the support has changed.
2. Sample proportion
3. 95% margin of error
E = 0·023 (= 2·3%)
= E = 1 #96sNp = 1 #96A
Np(1 − Np)n
= 1 #96A(0 #51)(0 #49)
1,800
Np = 918
1,800= 0 #51
m Z 48%
m = 48%
NEW CONCISE PROJECT MATHS 5
NCPM_5_supplement_SEC1.qxd 8/28/14 2:08 PM Page 12
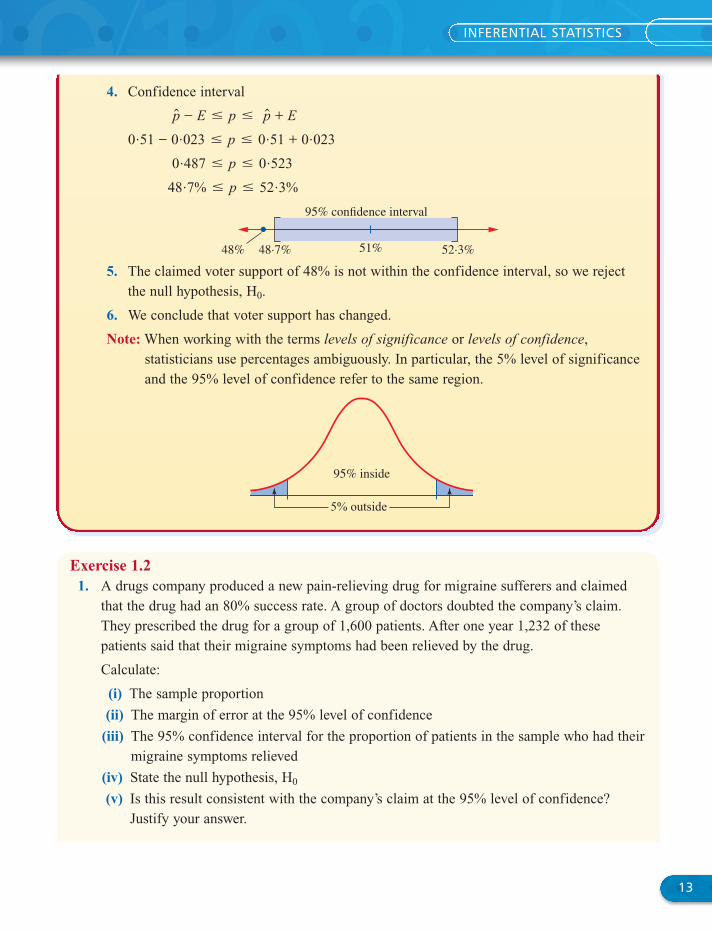
4. Confidence interval
5. The claimed voter support of 48% is not within the confidence interval, so we rejectthe null hypothesis, H0.
6. We conclude that voter support has changed.
Note: When working with the terms levels of significance or levels of confidence,statisticians use percentages ambiguously. In particular, the 5% level of significanceand the 95% level of confidence refer to the same region.
48 #7% … p … 52 #3%
0 #487 … p … 0 #523
0 #51 − 0 #023 … p … 0 #51 + 0 #023
Np − E … p … Np + E
48·7% 52·3%48%
95% confidence interval
51%
95% inside
5% outside
INFERENTIAL STATISTICS
13
Exercise 1.21. A drugs company produced a new pain-relieving drug for migraine sufferers and claimed
that the drug had an 80% success rate. A group of doctors doubted the company’s claim.They prescribed the drug for a group of 1,600 patients. After one year 1,232 of thesepatients said that their migraine symptoms had been relieved by the drug.
Calculate:
(i) The sample proportion
(ii) The margin of error at the 95% level of confidence
(iii) The 95% confidence interval for the proportion of patients in the sample who had theirmigraine symptoms relieved
(iv) State the null hypothesis, H0
(v) Is this result consistent with the company’s claim at the 95% level of confidence?Justify your answer.
NCPM_5_supplement_SEC1.qxd 8/28/14 2:08 PM Page 13
2. A national newspaper is investigating a claim made by the CEO of a large multinationalcompany. The CEO claims that 90% of the company’s one million customers are satisfiedwith the service they receive. Using simple random sampling, the newspaper surveyed 300customers. Among the sampled customers, 261 said they were satisfied with the company’sservice.
(i) Construct a 95% confidence interval for the proportion of satisfied customers.
(ii) Explain what the 95% confidence interval means in the context of the question.
(iii) State the null hypothesis, H0, and the alternative hypothesis, HA.
(iv) Based on these findings, can we reject the CEO’s claim?
(v) How could the investigation be made more accurate? Explain your reasoning.
3. An insurance company conducted a survey of 14,000 car crashes. It found that 8,330 of thecrashes occurred within 8 km of the driver’s home. The company claims that 60% of carcrashes occur within 8 km of home.
(i) State the null hypothesis, H0, and the alternative hypothesis, HA.
(ii) Use a hypothesis test at the 5% level of significance to decide whether there is
sufficient evidence to justify the company’s claim. State your conclusion clearly.4. Jack tosses his lucky coin 1,000 times and a head occurs 450 times. Jack claims his coin is
biased.
Use a hypothesis test at the 5% level of significance to decide whether there is sufficientevidence to justify Jack’s claim. State the null hypothesis and state your conclusion clearly.
5. A pharmaceutical company has developed and tested a new pain-killing drug. Thecompany’s records show that the old drug provided relief for 72% of all patients who wereadministered it. A random sample of 1,225 were administered the new drug and 900 ofthese claimed that the new drug provided relief.
(i) State the null hypothesis, H0, and the alternative hypothesis, HA.(ii) Use a hypothesis test at the 5% level of significance to decide if the new drug is
different from its old counterpart. State your conclusion clearly.6. A soccer manager has a hypothesis that young European soccer players born in the first
three months of the year have an advantage in being selected to represent their country atthe under-17 level over players born later in the same year.
(i) Estimate the expected percentage of players born in the first three months of the year.(ii) Find the margin of error, at the 95% confidence level, for a sample size of 400.
(iii) A survey of 400 players, selected at random, who played soccer at the under-17 levelfor their country showed that 35% of these players were born in the first three monthsof the year.
Use a hypothesis test at the 5% level of significance to decide whether there issufficient evidence to justify the manager’s claim. State the null hypothesis and stateyour conclusion clearly.
NEW CONCISE PROJECT MATHS 5
14
NCPM_5_supplement_SEC1.qxd 8/28/14 2:08 PM Page 14

INFERENTIAL STATISTICS
15
The three probability densities above all have the same mean and standard deviation. Despite theirdifferent shapes, when (or more), the sampling distributions of the mean, are nearlyidentical and in the shape of a normal curve.
x,n = 10
Sampling distribution of the mean (distributions of the sample means)Suppose a large number of different random samples, each of thesame size, n, are selected independently from a population withmean m and standard deviation s.Each of these samples will have its own mean, and standarddeviation, s. The set of these different sample means,
are called the sample means.
If these sample means are represented with a curve, they have adistribution with the following properties, called the central limittheorem.
Central limit theorem
{x1, x2, x3, Á}
x,
x5 x2
x1
x4 x3
Population
1. The distribution of the sample means is always normal.
2.Mean of the sample means = Means of the population
3.
Standard deviation of the sample means = (standard deviation of the population) ÷ 1n
sx = s1n
mx = m
What is remarkable about the central limit theorem is that regardless of the shape of the originaldistribution, taking averages of samples results in a normal curve. To find the distribution of thesample means, we need to know only the original population mean and standard deviation.
x,
X H A
X H A
NCPM_5_supplement_SEC1.qxd 8/28/14 2:08 PM Page 15
16
NEW CONCISE PROJECT MATHS 5
Standard error of the mean
standard error of the meansx = s1n=
The standard deviation of the sample means is called the standard error and is denoted by
The standard error is precisely that. It is the standard distance, or error, that a sample mean is from thepopulation mean. On our course, we want to know how good an estimate the sample mean is from thepopulation mean. The standard error gives us just that. The standard error is also a standard deviation.
Note: As the sample size, n, gets larger, the standard error gets smaller. In other words, theapproximation gets better and better with increasing sample size.
The distribution of the sample means is normal. Thus, we can use the Standard Normal Tables tocalculate the probability that the mean of a sample of a certain size differs from the mean of thepopulation by a given amount. Later on we will see how the distribution of the sample means isextremely useful to hypothesis testing when we consider a sample from a population rather than asingle value.
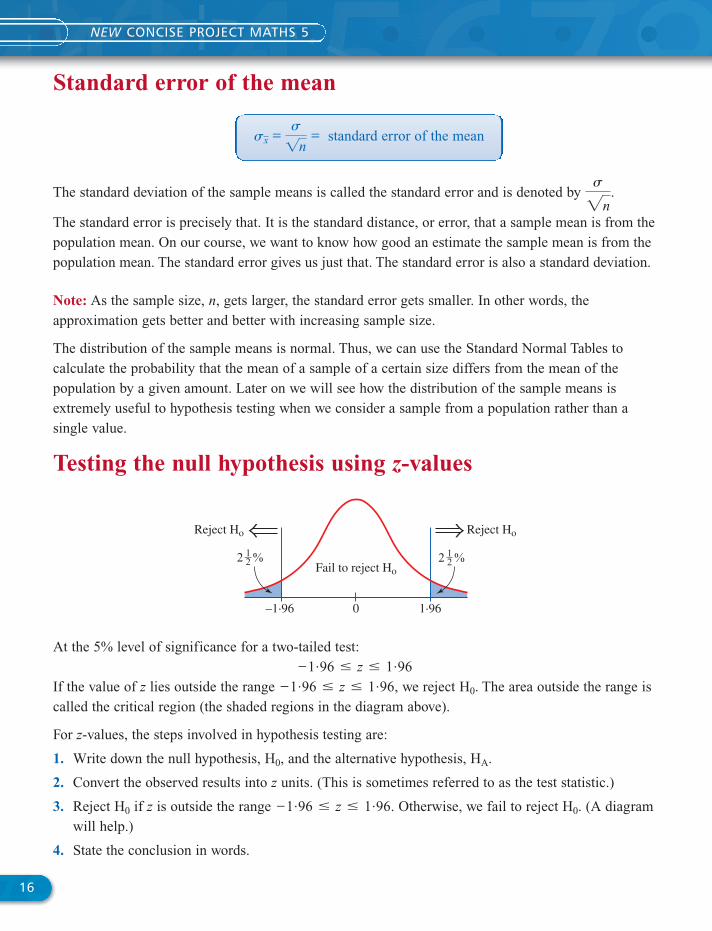
Testing the null hypothesis using z-values
s
2n.
Reject Ho
Fail to reject Ho
Reject Ho
0–1·96 1·96
2 %21
2 %21
At the 5% level of significance for a two-tailed test:
If the value of z lies outside the range , we reject H0. The area outside the range iscalled the critical region (the shaded regions in the diagram above).
For z-values, the steps involved in hypothesis testing are:
1. Write down the null hypothesis, H0, and the alternative hypothesis, HA.
2. Convert the observed results into z units. (This is sometimes referred to as the test statistic.)
3. Reject H0 if z is outside the range . Otherwise, we fail to reject H0. (A diagramwill help.)
4. State the conclusion in words.
−1 #96 … z … 1 #96
−1 #96 … z … 1 #96
−1 #96 … z … 1 #96
NCPM_5_supplement_SEC1.qxd 8/28/14 2:08 PM Page 16

INFERENTIAL STATISTICS
17
A tyre company claims that the mean life of tyres that it produces is 11,000 km with astandard deviation of 240 km. An independent supplier of tyres wants to investigate thecompany’s claim. A test on a random sample of 144 tyres from the company gave a meanlife of 10,963 km. Carry out a hypothesis test at the 5% level of significance to see if thereis evidence to support the company’s claim.
Solution1. State the null and alternative hypotheses.
Null hypothesis, H0: The company produces tyres with a mean life of 11,000 km. .
Alternative hypothesis, HA:
The company produces tyres whose mean life is not 11,000 km. .2. Convert the given results into z units (the test statistic):
3.
We fail to reject H0, as -1·85 is not in the critical regions.
4. Hence we fail to reject the company’s claim.
In the above example, we used:
In these situations, because we do not use no direction isstipulated. Therefore, this is a two-tailed test. (Only two-tailed tests are used on ourcourse.) Also, H0 always has an equal sign and uses population parameters.
m 7 11,000 or m 6 11,000,
HA: m Z 11,000
H0: m = 11,000
z =
x − ms
2n= 10,963 − 11,000
240
1144
= −1 #85
m Z 11,000
m = 11,000
Reject Ho
Fail to reject Ho
Reject Ho
0–1·96–1·85
1·96
NCPM_5_supplement_SEC1.qxd 8/28/14 2:08 PM Page 17

18
Exercise 1.3
1. A company manufactures pens with a mean writing life of 600 hours and a standarddeviation of 12 hours.
A retailer examines a sample of 98 pens from a supplier who claims to only sell pens fromthis company and finds their mean life is 597 hours.
(i) State the null and alternative hypotheses.(ii) Hence, decide whether these pens are genuine products from the company at the 5%
level of significance.
2. In an examination taken by a large number of students, the mean mark was 60·5 with astandard deviation of 9 marks. In a random sample of 43 students in a particular school, itwas found that the mean mark was 63.
At the 5% level of significance, investigate if there is evidence to conclude that the studentsof this school did as well as students in general.
3. The marks awarded in an examination are normally distributed with a mean mark of 60 anda standard deviation of 10.
A sample of 50 students has a mean mark of 63.
Test, at the 5% level of significance, the hypothesis that this is a random sample from thepopulation.
4. The distribution of the weights of muffins produced in the EU by all Bakewell automatedbaking systems is shown in the diagram. It can be seen that the distribution is slightly skewed.
Weight in grams
Freq
uenc
y
NEW CONCISE PROJECT MATHS 5
Hypothesis testing – A summaryIn the final analysis, testing the null hypothesis, H0 simply involves a confidence interval and a red dot
Either Or
If the red dot is inside the If the red dot is outside the confidence interval we confidence interval wefail to reject H0. reject H0.
Confidence intervalConfidence interval
NCPM_5_supplement_SEC1.qxd 8/28/14 2:08 PM Page 18

The mean is 80 grams.The standard deviation is 6 grams.In one bakery using the Bakewell automated baking system, random samples of 50 muffinsare selected for quality control purposes. The mean of each sample is recorded. 300 suchsample means are recorded.
(i) State which way the given diagram is skewed.(ii) Describe the expected distribution of these sample means. Your description should refer
to the shape of the distribution and to its mean and standard deviation.(iii) How many of the sample means would you expect to be greater than 81 grams?
5. (i) Assume that the duration of human pregnancies can be described by a normal modelwith a mean of 270 days and a standard deviation of 15 days.(a) What percentage of pregnancies should last between 270 and 290 days?(b) Using the empirical rule, write down the 95% confidence interval for the mean
pregnancy duration.(c) At least how many days should the upper quartile of all pregnancies last?(d) Suppose a certain doctor is currently providing prenatal care to 48 pregnant
women. Let represent the mean length of their pregnancies. According to thecentral limit theorem, what is the distribution of this sample mean? Specify themodel, mean and standard deviation.
(e) What is the probability that the mean duration of these patients’ pregnancies will bemore than 275 days?
(ii) The duration of human pregnancies may not actually follow a normal model asdescribed in part (i).(a) Explain why it may be somewhat skewed to the left.(b) If the correct model is in fact skewed, does that change your answers to parts (a),
(b), (c) and (d) of part (i)? Explain why or why not for each of the four parts.6. The distribution of the hourly earnings of all employees in Ireland in October 2009 is shown
in the diagram. It can be seen that the distribution is positively skewed.
h
0 10 20 30Hourly earnings (€)
40 50 60 70 800 10 20 30Hourly earnings (€)
40 50 60 70 80
INFERENTIAL STATISTICS
19
NCPM_5_supplement_SEC1.qxd 8/28/14 2:08 PM Page 19
The mean is €22·05.
The median is €17·82.
The standard deviation is €10·64.
The lower quartile is €12·80.
The upper quartile is €26·05.
(i) If six employees are selected at random from this population, what is the probabilitythat exactly four of them had hourly earnings of more than €12·80?
(ii) In a computer simulation, random samples of size 200 are repeatedly selected from thispopulation and the mean of each sample is recorded. 1,000 such sample means arerecorded. Describe the expected distribution of these sample means. Your descriptionshould refer to the shape of the distribution and to its mean and standard deviation.
(iii) How many of the sample means would you expect to be greater than €23?
NEW CONCISE PROJECT MATHS 5
20
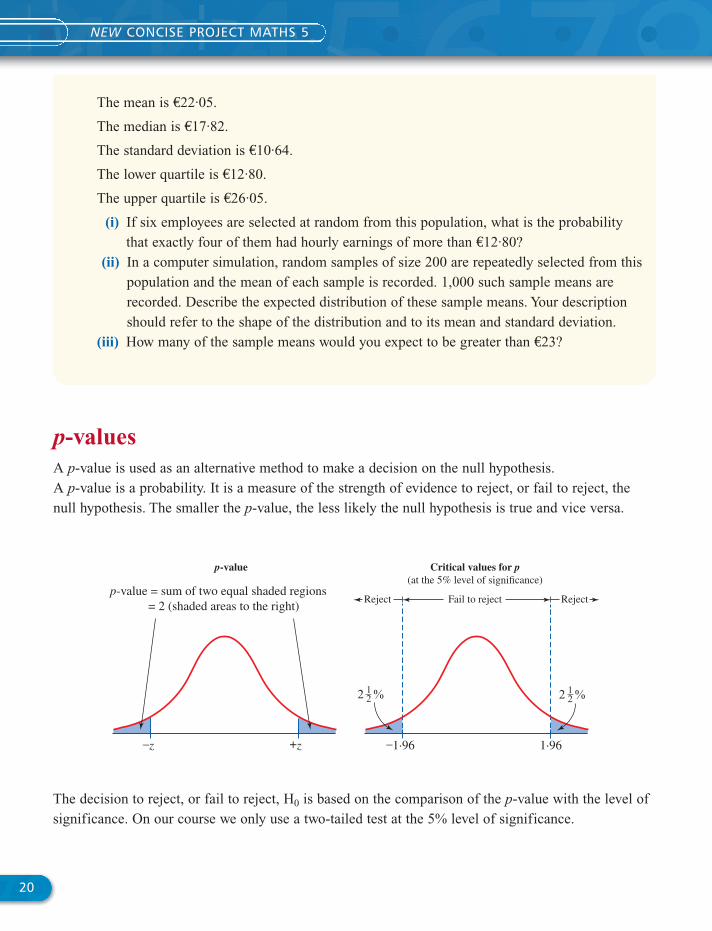
p-valuesA p-value is used as an alternative method to make a decision on the null hypothesis. A p-value is a probability. It is a measure of the strength of evidence to reject, or fail to reject, thenull hypothesis. The smaller the p-value, the less likely the null hypothesis is true and vice versa.
–z +z
p-value = sum of two equal shaded regions = 2 (shaded areas to the right)
Reject Fail to reject
Critical values for p(at the 5% level of significance)
p-value
–1·96 1·96
2 %21
2 %21
Reject
The decision to reject, or fail to reject, H0 is based on the comparison of the p-value with the level ofsignificance. On our course we only use a two-tailed test at the 5% level of significance.
NCPM_5_supplement_SEC1.qxd 8/28/14 2:08 PM Page 20
A coal merchant sells coal in bags marked ‘50 kg’. The merchant claims that the bags havea mean weight of 50 kg with a standard deviation of 1·2 kg. To test this claim, a randomselection of 72 of these bags was weighed and found to have a mean weight of 49·7 kg.
(i) Write down H0 and HA.
(ii) Calculate the test statistic for the sample mean.
(iii) Calculate a p-value for this sample mean.
(iv) At the 5% level of significance, is there evidence to show that the mean weight of thebags of coal is not 50 kg? Justify your answer.
Solution
(i) .
(ii) x = 49 #7, m = 50, s = 1 #2 and n = 72.
H0 : m = 50 and HA : m Z 50
INFERENTIAL STATISTICS
21
Memory aid: If p is low, H0 must go.
The lower the p-value, the stronger the evidence against H0. The larger the sample size, the moreprecise the estimates.
p-value approach to perform a hypothesis test
Critical p-value = 0·05 at the 5% significance level.
If there is strong evidence to reject H0.
If there is strong evidence to fail to reject H0.p 7 0 #05,
p … 0 #05,
1. State H0 and HA.2. Calculate the z score (this is often called the test statistic, T ).3. Determine the p-value (a diagram is useful).4. If reject H0. If do not reject H0.5. State the conclusion in words.
p 7 0 #05,p … 0 #05,
Type I and type II errors
Note: The strength of evidence using a p-value is enhanced by also including a 95% confidenceinterval for the population mean, .m
Type I error: Rejecting H0 when it is true.
Type II error: Failing to reject H0 when it is false.
NCPM_5_supplement_SEC1.qxd 8/28/14 2:08 PM Page 21

Exercise 1.4Copy and complete the following table.
H0 HA � �� x– n T p Reject, or fail toreject, H0
1. m = 500 m Z 500 500 15 504 64 2·13 0·0332 Reject H0
2. 120 3 120·85 36
3. 210 6 211·5 100
4. 80 18 77·3 144
5. 150 20 153·8 200
6. 70 6 68 40
7. 60 10 62 50
8. 90 14·3 87·6 110
The test statistic is given by:
(iii)
p-value
\ p-value = 2(0·017) = 0·034 = 3·4%
(iv)Thus, there is strong evidence to reject the null hypothesis, H0. Therefore, weconclude there is strong evidence to reject the claim by the coal merchant that theaverage weight of these bags of coal is 50 kg.
0 #034 6 0 #05 or 3 #4% 6 5%
= 1 − P(z … 2 #12) = 1 − 0 #9830 = 0 #017 (tables)
= 1 − P(z … −2 #12)
P(T 6 −2 #12)
T = x − ms
1n
= 49 #7 − 50
1 #2
172
= −2 #12
1 – 0·9830 = 0·017
–2·12 2·12
NEW CONCISE PROJECT MATHS 5
22
NCPM_5_supplement_SEC1.qxd 8/28/14 2:08 PM Page 22

9. A company claims that the average weight of the packets of porridge it produces is 400 gwith a standard deviation of 12 g. To test this claim, a random sample of 64 of these packetswas weighed and found to have a mean value of 403 g.
(i) Write down H0 and HA.
(ii) Calculate the test statistics for this sample mean.
(iii) Calculate a p-value for this sample mean.
(iv) At the 5% level of significance, is there evidence to show that the mean weight of thepackets of porridge is not 400 g? Justify your answer.
10. A machine produces metal rods which have a mean length of 600 cm with a standarddeviation of 4 cm. After a service to the machine, it is claimed that the machine nowproduces rods with lengths that are not equal to 600 cm. To test the claim, a random sampleof 100 rods from the serviced machine are measured and found to have a mean length of600·6 cm.
(i) Write down H0 and HA.
(ii) Calculate the test statistic for this sample mean.
(iii) Calculate a p-value for this sample mean.
(iv) At the 5% level of significance, is there evidence to show that the mean length of themetal rods from the serviced machine is not 600 cm? Justify your answer.
11. An internet provider claims that the mean speed of its internet connection is 50 MB/s, witha standard deviation of 5 MB/s. To test this claim, a random sample of 72 customers of thisinternet provider was found to have a mean speed of 49 MB/s.
(i) Write down H0 and HA.
(ii) Calculate the test statistic for this sample mean.
(iii) Calculate a p-value for this sample mean.
(iv) At the 5% level of significance, is there evidence to show that the internet provider’sclaim is true? Justify your answer.
12. A manufacturer of car batteries claims that the average life of the batteries they manufactureis 3·8 years with a standard deviation of 0·6 years. To test this claim, a random sample of 50 batteries was tested and their average life was found to be 3·6 years.
At the 5% level of significance, is there evidence to show that the claim made by thismanufacturer is true? Justify your answer.
13. The mean national hourly rate of pay of employees in an EU country is €32. A randomsample of 45 employees in the capital city of this country was found to have a mean hourlyrate of €34 with a standard deviation of €6.(i) Construct a 95% confidence interval for the mean hourly rate of pay in the capital city.
Interpret this result.
INFERENTIAL STATISTICS
23
NCPM_5_supplement_SEC1.qxd 8/28/14 2:08 PM Page 23
(ii) Is there evidence to suggest that the mean hourly rate of pay of employees in thecapital city is different from the mean national hourly rate of pay? Test this hypothesisat the 5% level of significance. Clearly state your null and alternative hypothesis.Calculate a p-value for this sample mean, interpret this p-value and give yourconclusion.
14. A machine filling bottles of water is set to deliver 750 ml with a standard deviation of 15 ml. A random sample of 120 of these bottles of water was checked and the mean volumeof water in these bottles was found to be 748 ml.
At the 5% level of significance, investigate if there is evidence to suggest that the mean ofthis sample is different from the expected mean of 750 ml. Clearly state your null andalternative hypothesis. Calculate a p-value for this sample mean, interpret this p-value andgive your conclusion.
15. The weights of newborn babies in Ireland is known to be normally distributed with a meanof 3·5 kg and a standard deviation of 0·8 kg. It is claimed that smoking during pregnancyhas an effect on the weight of babies. To test this claim, a random sample of 200 babieswhose mothers had smoked during pregnancy was taken. The mean weight of the babies inthis sample was found to be 3·35 kg.
(i) Write down H0 and HA.
(ii) Calculate the test statistic for this sample mean.
(iii) Calculate a p-value for this sample mean.
(iv) At the 5% level of significance, is there evidence to show that smoking duringpregnancy has an effect on the weight of babies? Justify your answer.
24
NEW CONCISE PROJECT MATHS 5
NCPM_5_supplement_SEC1.qxd 8/28/14 2:08 PM Page 24

SECTION2 BINOMIAL THEOREM
25
An expression with two terms, such as a + b, is called a binomial.
The binomial theorem is used to write down the expansion of a binomial to any power.
The expansion of (a + b)n is found as follows:
(a + b)n = an
0banb0 + an
1ban−1b1 + an
2ban−2b2 + Á + a n
n − 1ba1bn−1 + an
nba0bn
Use the binomial theorem to expand the following:
(i) (ii)
Solution
(i)
(ii)
= 81 − 108x + 54x2 − 12x3 + x4
= 1(81)(1) + 4(27)(−x) + 6(9)(x2) + 4(3)(−x3) + 1(1)(x4)
= a4
0b(3)4(−x)0 + a4
1b(3)3(−x)1 + a4
2b (3)2(−x)2 + a4
3b (3)1(−x)3 + a4
4b (3)0(−x)4
(3 − x)4
= x5 + 10x4y + 40x3y2 + 80x2y3 + 80xy4 + 32y5
= 1x5(1) + 5x4(2y) + 10x3(4y2) + 10x2(8y3) + 5x(16y4) + 1(1)(32y5)
= a5
0bx5(2y)0 + a5
1bx4(2y)1 + a5
2bx3(2y)2 + a5
3bx2(2y)3 + a5
4bx1(2y)4 + a5
5bx0(2y)5
(x + 2y)5
(3 − x)6(x + 2y)5
Exercise 2.1
Use the binomial theorem to expand each of the following.
1. 2. 3. 4.
5. 6. 7. 8. a2a − 1
bb4ax + 3
xb4a x
2+ 1b6
(2x − 3y)5
(1 − 2y)4(x − y)5(2 + p)4(x + y)3
NCPM_5_supplement_SEC2.qxd 8/28/14 2:10 PM Page 25

3SECTION ADDITIONAL INTEGRATION
26
Integrals leading to a logarithmic function
There are examples showing how to apply these formulae in New Concise Project Maths 5, page 13.
J1x
dx = ln x + c or J1
ax + b dx = 1
a ln(ax + b) + c
Exercise 3.1
Find each of the following.
1. 2. 3.
4. 5. 6.
Evaluate the following.
7. 8. 9. J4
1
4 − 21x
2x3 dxJ
7
2
3x2 − x
x2 dxJ5
1
x3 + 6
2x dx
J3
5x + 7 dxJ
5
4x − 5 dxJ
1
3x + 5 dx
Jx2 + 7
2x dxJ3x − 5
x dxJ2x dx
Applications of integrationRecall that displacement, velocity and acceleration are linked together by the process ofdifferentiation with respect to time. If s represents displacement, in terms of t:
In reverse order acceleration, velocity and displacement are linked together by integration.
dv
dt= acceleration : v = Jacceleration . dt
ds
dt= velocity : s = Jvelocity . dt
V = Velocity = ds
dt and Acceleration =
dv
dt
NCPM_5_supplement_SEC2.qxd 8/28/14 2:10 PM Page 26

ADDITIONAL INTEGRATION
27
The acceleration of a body is given by
(i) Find the velocity, v, in terms of t
(ii) Find the displacement, s, in terms of t
Solution
a = 6t − 12.
(i) (ii)
s = t3 − 6t2 + 4t + c
s = 3t3
3− 12t2
2+ 4t + c
s = J (3t2 − 12t + 4) dt
ds = (3t2 − 12t + 4) dt
v = ds
dt= 3t2 − 12t + 4
v = 3t2 − 12t + c
v = 6t2
2− 12t + c
v = J (6t − 12) dt
dv = (6t − 12) dt
a = dv
dt= 6t − 12
Exercise 3.2
1. An object is travelling with a velocity, .
(i) Find the acceleration when seconds.
(ii) If s is the distance travelled, express s in terms of t, given that when
(iii) Find the displacement when
2. represents the rate of growth of a culture of bacteria, where N is the number
of bacteria and t is measured in hours.
(i) Find N in terms of t.
(ii) If there were 35 bacteria in the initial culture, find the number of bacteria present after3 minutes, correct to the nearest whole number.
3. An object is shot upwards from ground level with an initial velocity of 100 m/s. It issubject only to the force of gravity (no air resistance). This results in the objectexperiencing a deceleration, due to gravity, of 9 8 m/s2. Find:
(i) The maximum altitude reached by the object
(ii) The time at which the object hits the ground
#
dN
dt= 6e3t − 5
t = 3.
t = 1.s = 4
t = 3
v = 3t2 + 4t − 5
NCPM_5_supplement_SEC2.qxd 8/28/14 2:10 PM Page 27
28
NEW CONCISE PROJECT MATHS 5
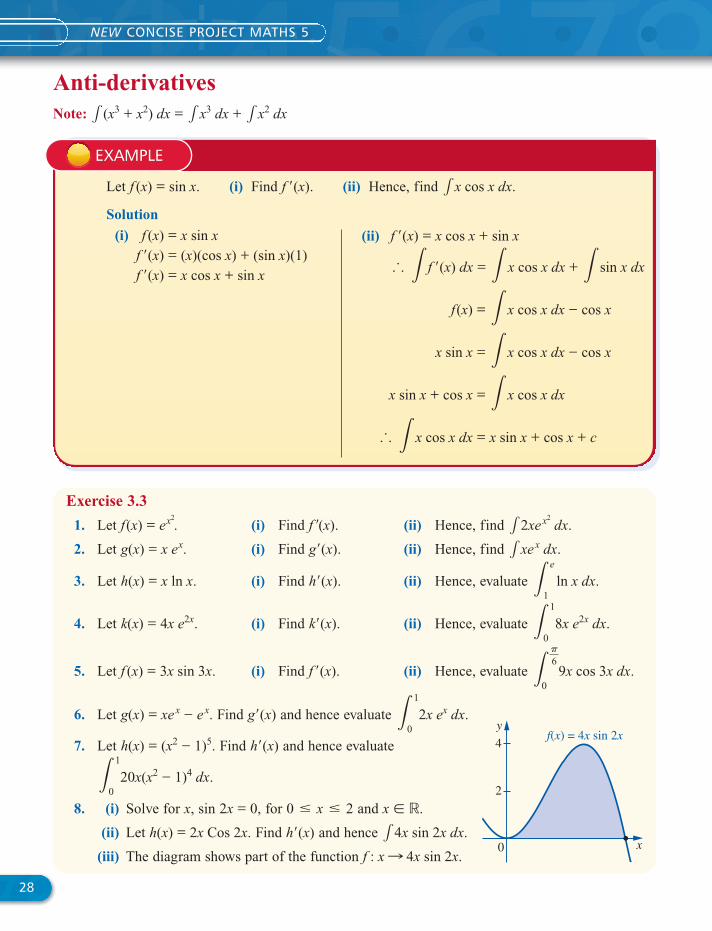
Let (i) Find . (ii) Hence, find .
Solution
1x cos x dxf ¿(x)f (x) = sin x.
(i)
f ¿(x) = x cos x + sin x f ¿(x) = (x)(cos x) + (sin x)(1) f (x) = x sin x (ii)
‹ Jx cos x dx = x sin x + cos x + c
x sin x + cos x = Jx cos x dx
x sin x = Jx cos x dx − cos x
f(x) = Jx cos x dx − cos x
‹ J f ¿(x) dx = Jx cos x dx + Jsin x dx
f ¿(x) = x cos x + sin x
Exercise 3.3
1. Let (i) Find . (ii) Hence, find .
2. Let (i) Find . (ii) Hence, find .
3. Let . (i) Find . (ii) Hence, evaluate .
4. Let . (i) Find . (ii) Hence, evaluate .
5. Let . (i) Find . (ii) Hence, evaluate .
6. Let Find and hence evaluate .
7. Let Find and hence evaluate
.
8. (i) Solve for x, sin for and x �.
(ii) Let Find and hence
(iii) The diagram shows part of the function f : x : 4x sin 2x.14x sin 2x dx.h¿(x)h(x) = 2x Cos 2x.
�0 … x … 22x = 0,
J1
020x(x2 − 1)4 dx
h¿(x)h(x) = (x2 − 1)5.
J1
02x ex dxg¿(x)g(x) = xex − ex.
Jp
6
09x cos 3x dxf ¿(x)f (x) = 3x sin 3x
J1
08x e2x dxk¿(x)k(x) = 4x e2x
Je
1ln x dxh¿(x)h(x) = x ln x
1xex dxg¿(x)g(x) = x ex.12xex2
dxf ¿(x)f(x) = ex2
.
y
x
f(x) = 4x sin 2x
0
2
4
Anti-derivativesNote: 1(x3 + x2) dx = 1x3 dx + 1x2 dx
NCPM_5_supplement_SEC2.qxd 8/28/14 2:10 PM Page 28

4SECTION TRANSFORMING GRAPHS
29
Changing the equation of a function affects the graph of thefunction.
1.
� c moves the graph in the positive y-direction.
� c moves the graph in the negative y-direction.
The function f (x) is shown.The function f (x) + 3 represents a translation verticallyupwards by 3 units.The function f (x) − 4 represents a translation verticallydownwards by 4 units.
2.f(x + c) moves the graph in the negative x-direction.
f(x − c) moves the graph in the positive x-direction.
The function f(x) is shown.The function f(x + 1) represents a translation horizontallyto the left by 1 unit.The function f(x − 2) represents a translation horizontallyto the right by 2 units.
3. andThe function f(x) is shown.
The graph of y = −f(x) is a reflection in the x-axis of thegraph of y = f(x).
The graph of y = f(−x) is a reflection in the y-axis of thegraph of y = f(x).
y = f (-x)y = -f (x)
y = f (x é c)
y = f (x) é c
y
2
4
6
8
1 2 x−3 −2 −10
0
1
3
5
7
109
11
−2−1
−4−5−6−7−8
−3
f(x) – 4
f(x) + 3
f(x)
y
2
4
6
8
1 2 x−3 −2 −101
3
5
7
3−4
109
−2−1
−4−5−6−7
−3
f(x + 1) f(x) f(x − 2)
y
2
4
2 4 x−4 −2 00
−2
−4
6
−6
f(−x)
f(x)
−f(x)
NCPM_5_supplement_SEC2.qxd 8/28/14 2:10 PM Page 29

30
NEW CONCISE PROJECT MATHS 5
4. where
Multiplying a function by a constant will not change thepoints where the function crosses the x-axis, the roots of thefunction.
However, if k > 1, the curve will appear to stretch. If k < 1,the curve will appear to compress.
k>0y = kf (x),
The diagram shows the graph of a function, f(x).On the same axis and scale, graph the following:
(i) f(x) + 3
(ii) f(x + 2) − 1
(iii) f(x)
(iv) −f(x)
1
2
y
1
2
3
1 2 x−1 00
3 4
−1
−2
−3
−4
f(x)
y
1
2
1 x−1 00
−1
4f(x)
f(x)
NCPM_5_supplement_SEC2.qxd 8/28/14 2:10 PM Page 30
Solution
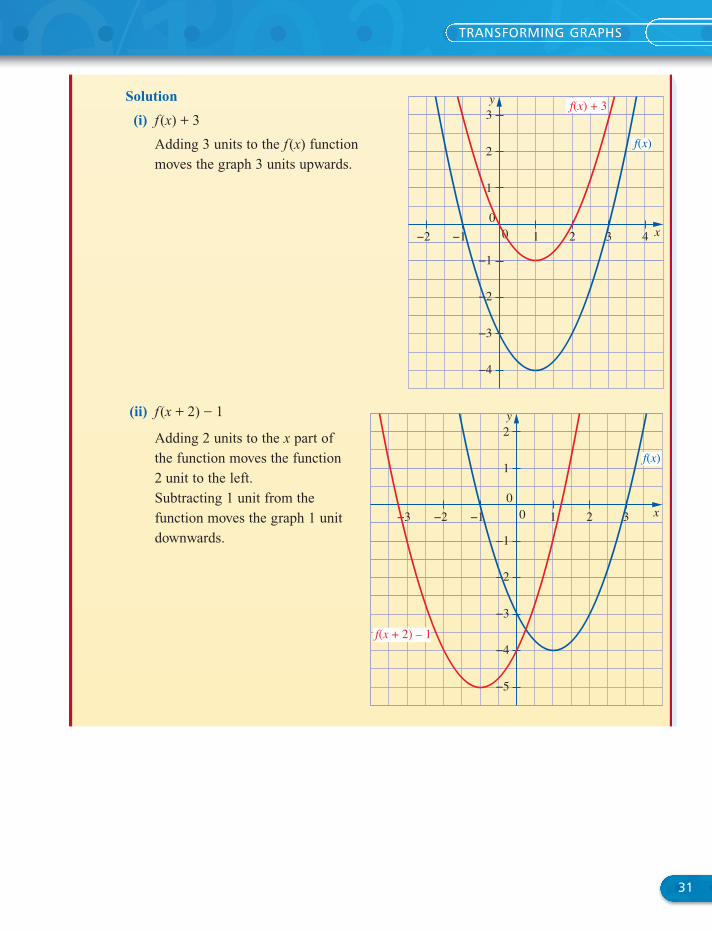
(i) f(x) + 3
Adding 3 units to the f(x) functionmoves the graph 3 units upwards.
(ii) f(x + 2) − 1
Adding 2 units to the x part ofthe function moves the function2 unit to the left.Subtracting 1 unit from thefunction moves the graph 1 unitdownwards.
y
1
2
3
1 2 x−2 −1 00
3 4
−1
−2
−3
−4
f(x) + 3
f(x)
y
1
2
1 2 x−2−3 −1 00
3
−1
−2
−3
−4
−5
f(x + 2) – 1
f(x)
TRANSFORMING GRAPHS
31
NCPM_5_supplement_SEC2.qxd 8/28/14 2:10 PM Page 31
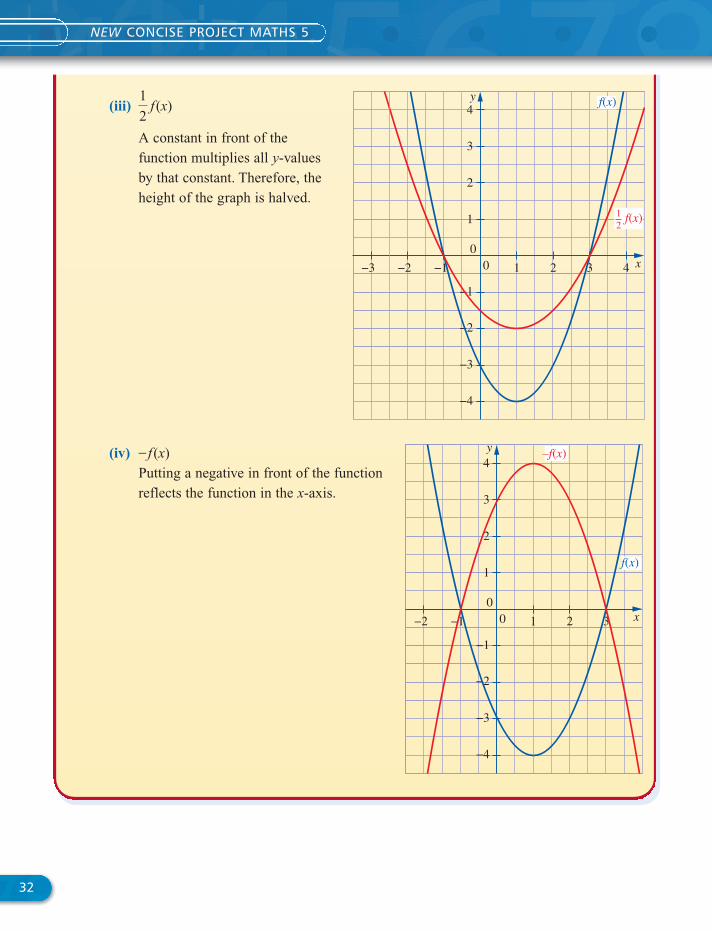
(iii) f(x)
A constant in front of thefunction multiplies all y-valuesby that constant. Therefore, theheight of the graph is halved.
(iv) − f(x)Putting a negative in front of the function reflects the function in the x-axis.
1
2
y
1
2
3
1 2 x−2 −1 00
4
3 4
−1
−2
−3
−4
−3
f(x)
f(x)12
y
1
2
1 2 x−2 −1 00
3
4
3
−1
−2
−3
−4
f(x)
–f(x)
32
NEW CONCISE PROJECT MATHS 5
NCPM_5_supplement_SEC2.qxd 8/28/14 2:10 PM Page 32
TRANSFORMING GRAPHS
33
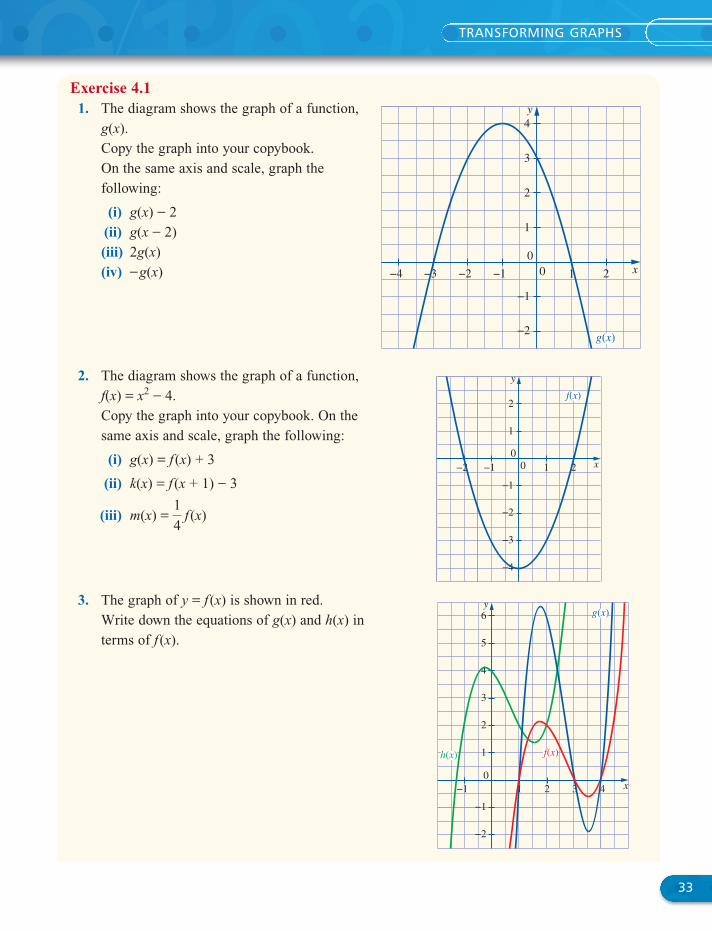
Exercise 4.11. The diagram shows the graph of a function,
g(x).Copy the graph into your copybook. On the same axis and scale, graph thefollowing:
(i) g(x) − 2(ii) g(x − 2)(iii) 2g(x)(iv) −g(x)
2. The diagram shows the graph of a function,f(x) = x2 − 4.Copy the graph into your copybook. On thesame axis and scale, graph the following:
(i) g(x) = f(x) + 3
(ii) k(x) = f(x + 1) − 3
(iii) m(x) = f(x)
3. The graph of y = f(x) is shown in red.Write down the equations of g(x) and h(x) in terms of f(x).
1
4
y
1
2
3
1 2 x−1 00
4
−2−3−4
−1
−2g(x)
y
1
2
1 2 x−1 00
−2
−1
−2
−3
−4
f(x)
y
1
2
3
4
1 2 x−10
3
5
6
−1
−2
4
h(x) f(x)
g(x)
NCPM_5_supplement_SEC2.qxd 8/28/14 2:10 PM Page 33
34
NEW CONCISE PROJECT MATHS 5
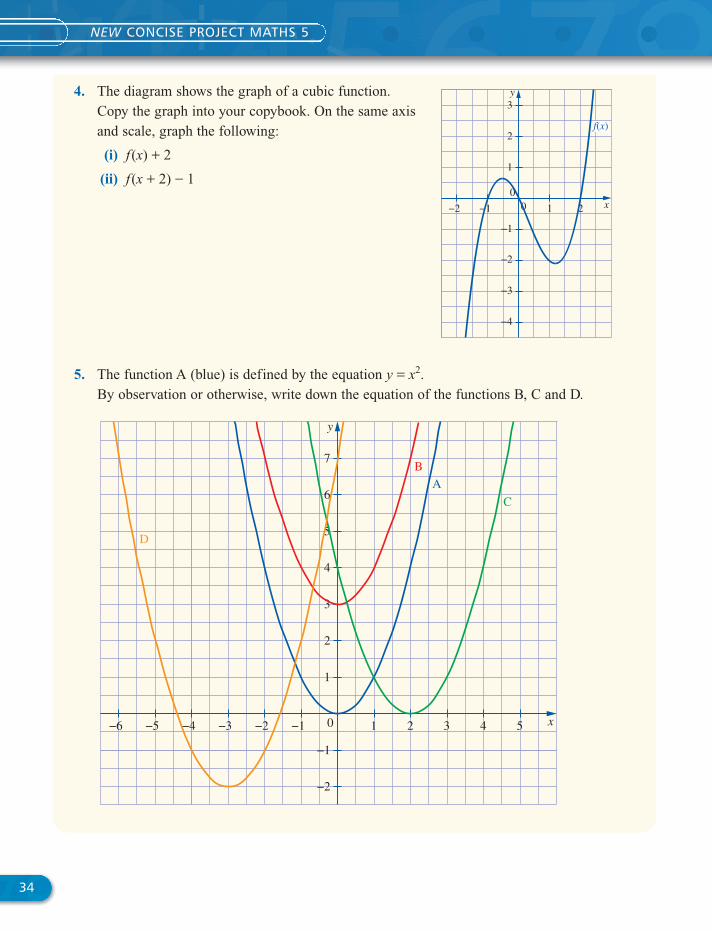
4. The diagram shows the graph of a cubic function.Copy the graph into your copybook. On the same axisand scale, graph the following:
(i) f(x) + 2
(ii) f(x + 2) − 1
5. The function A (blue) is defined by the equation y = x2. By observation or otherwise, write down the equation of the functions B, C and D.
y
1
2
3
1 2 x−1 00
−2
−1
−2
−3
−4
f(x)
y
1
2
3
4
1 2 3 x
C
AB
D
−3 −2 −1 0 4 5−4−5−6
5
6
7
−1
−2
NCPM_5_supplement_SEC2.qxd 8/28/14 2:10 PM Page 34

5SECTION CONTINUITY OF FUNCTIONS
35
A function is said to be continuous when x = a if the graphs of y = f(x) can be drawn through thepoint with coordinates (a, f(a)) without a break.
Otherwise, there is said to be a discontinuity at x = a.
Continuous graphThe graph can be traced with no jumps or breaks, that is, the pen does not have to leave the page.
Discontinuous graphThe graph has jumps or breaks.
Observe the graph on the right.
• As x approaches 2 from the left, the value of the
function decreases.
• As x approaches 2 from the right, the value of the
function increases.
• f(2) cannot be found as , which is
undefined.
Hence, the graph is not continuous at x = 2.The line x = 2 is said to be an asymptote to the curve. Discontinuity at x = 2
A function f is continuous at x = a if .limx:a f(x) = f(a)
f(2) = 3
2 − 2= 3
0
y1
1 2 x−1 0
0
−1
y
2
4
2 4 x−2 00
6−4
−2
−4
f(x) = 3x – 2
NCPM_5_supplement_SEC2.qxd 8/28/14 2:10 PM Page 35
36
NEW CONCISE PROJECT MATHS 5
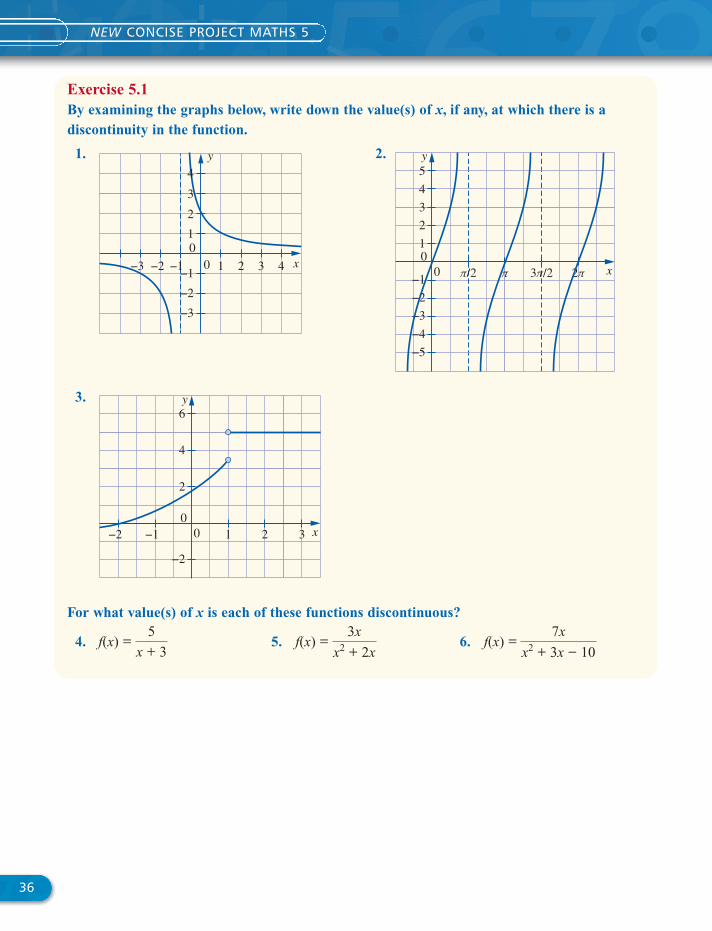
Exercise 5.1By examining the graphs below, write down the value(s) of x, if any, at which there is adiscontinuity in the function.
1. 2.
3.
For what value(s) of x is each of these functions discontinuous?
4. 5. 6. f(x) = 7x
x2 + 3x − 10f(x) = 3x
x2 + 2xf(x) = 5
x + 3
2
4
6
1 x00
2 3−1−2
−2
y
1
2
3
4
π/2 3π/2 2π x00
π−1
−2
−3
−5
y
−4
5
1
2
3
4
1 2 x00
3 4−2−3 −1−1
−2
−3
y
NCPM_5_supplement_SEC2.qxd 8/28/14 2:10 PM Page 36

6SECTION GRAPHS OF DERIVATIVES
37
We must be able to recognise and sketch the graph of the derivatives of functions.
Steps in graphing the derivative of a function• The turning points of graphs are very important. At a turning point, the graph of the derivative
will cross the x-axis. Plot these points first.• Then look for where the given graph is increasing or decreasing:
° When the graph is increasing, its derivative will be positive and so it will be above the x-axis.
° When the graph is decreasing, its derivative will be negative and so it will be below the x-axis.
Look at the next example for a step-by-step solution for graphing the derivative of a function.
When we differentiate a cubic function, we get a quadratic function.When we differentiate a quadratic function, we get a linear function.
When we differentiate a linear function, we get a horizontal line.
The diagram shows the graph of a cubic function, g (x).
On the same axis and scale, sketch the graph of:
(i) g�(x)
(ii) g�(x)
(iii) g��(x), where g ��(x) is the third derivative of g(x)
Solution(i) g�(x)
Since g(x) is a cubic function, its derivative, g�(x), is a quadratic function.• At turning points of g(x), g�(x) � 0.• Therefore, at the turning point of g(x), the graph of its derivative, g�(x), will cut the
x-axis.• Between the turning points, the graph of the cubic function is decreasing, therefore
the graph of g�(x) will be below the x-axis between these two points.
g(x)
x
y
NCPM_5_supplement_SEC6.qxd 8/28/14 2:11 PM Page 37
38
NEW CONCISE PROJECT MATHS 5
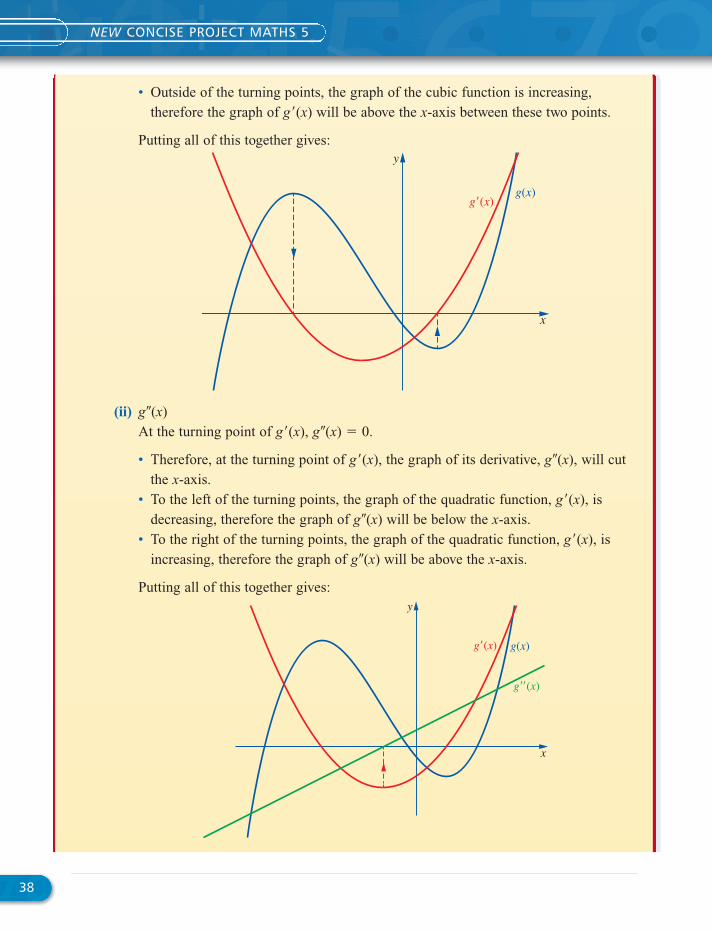
• Outside of the turning points, the graph of the cubic function is increasing,therefore the graph of g�(x) will be above the x-axis between these two points.
Putting all of this together gives:
(ii) g�(x)At the turning point of g�(x), g�(x) � 0.
• Therefore, at the turning point of g�(x), the graph of its derivative, g�(x), will cutthe x-axis.
• To the left of the turning points, the graph of the quadratic function, g�(x), isdecreasing, therefore the graph of g�(x) will be below the x-axis.
• To the right of the turning points, the graph of the quadratic function, g�(x), isincreasing, therefore the graph of g�(x) will be above the x-axis.
Putting all of this together gives:
g�(x)
g��(x)
g(x)
x
y
g�(x)g(x)
x
y
NCPM_5_supplement_SEC6.qxd 8/28/14 2:11 PM Page 38

(iii) g��(x)The graph of g�(x) is a straight line with a positive slope and therefore it does nothave any turning points. It is increasing at a constant rate for all values of x, thereforeits derivative will be a constant positive value.Hence, any horizontal line above the x-axis could represent g��(x).
g�(x)
g��(x)
g���(x)
g(x)
x
y
GRAPHS OF DERIVATIVES
39
Exercise 6.11. The diagrams show the graph of a quadratic function, g(x).
Copy the sketch of each graph into your copy book. On the same axis and scales sketch the graph of:
(a) g�(x), the first derivative of g(x) (b) g�(x), the second derivative of g(x)
(i) (ii)
g(x)
x
y
g(x)
x
y
NCPM_5_supplement_SEC6.qxd 8/28/14 2:11 PM Page 39

40
NEW CONCISE PROJECT MATHS 5
2. Give three reasons why the given line represents the slope function of the given curve.
(i) (ii)
3. The diagram shows the graph of a cubic function, g(x).Copy the sketch of the graph into yourcopybook. On the same axis and scale, sketch the graph of:
(i) g�(x)
(ii) g�(x)
(iii) g��(x)
4. The graphs of the slope functions of two curves are given below. Find:
(a) The x-coordinate of the stationary points of each curve
(b) The range of values of x for which each curve is increasing
(i) (ii) y
1 2 3 x−3 −2 −1 0−4−5
f 9(x) = x2 + 2x – 3y
1 2 3 x−3 −2 −1 0 4 5−4−5−6−7
f 9(x) = –x2 – 3x + 10
y
x
g(x)
y
2 x
y
2 x
NCPM_5_supplement_SEC6.qxd 8/28/14 2:11 PM Page 40

GRAPHS OF DERIVATIVES
41
5. The diagram shows the graph of a function, f(x).
(i) Identify the function f (x).
(ii) Find f �(x), the first derivative of f (x).
(iii) On the same axis and scale, graph f �(x), the first derivative of f (x).
(iv) Find f �(x), the second derivative of f (x).
(v) On the same axis and scale, graph f �(x), the second derivative of f (x).
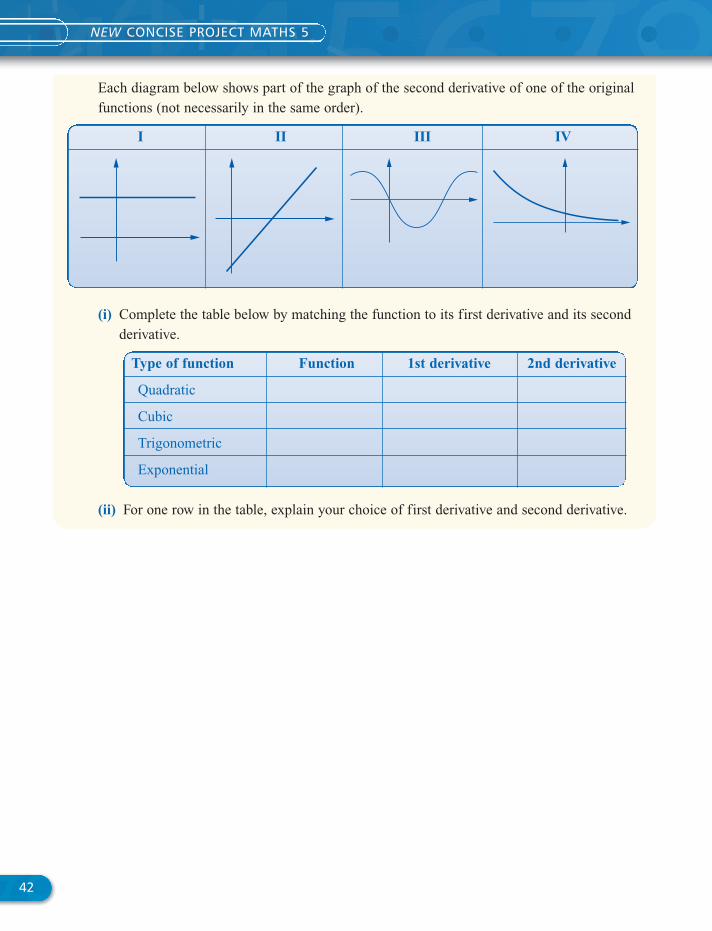
6. Each diagram below shows part of the graph of a function. Each of these functions is either
quadratic, cubic, trigonometric or exponential (not necessarily in that order).
Each diagram below shows part of the graph of the first derivative of one of the abovefunctions (not necessarily in the same order).
A B C D
f g h k
1
y
x0
0
−1
π 2π 3π 4π2π
23π
25π
27π
f(x)
NCPM_5_supplement_SEC6.qxd 8/28/14 2:11 PM Page 41
42
NEW CONCISE PROJECT MATHS 5
Each diagram below shows part of the graph of the second derivative of one of the originalfunctions (not necessarily in the same order).
(i) Complete the table below by matching the function to its first derivative and its secondderivative.
(ii) For one row in the table, explain your choice of first derivative and second derivative.
Type of function Function 1st derivative 2nd derivative
Quadratic
Cubic
Trigonometric
Exponential
I II III IV
NCPM_5_supplement_SEC6.qxd 8/28/14 2:11 PM Page 42

43
ANSWERS
Inferential statistics
Exercise 1.1 2. 3. Yes, because the confidence intervals overlap4. From 52·6% to 59·4%5. (i) From 63·58% to 66·36% (ii) We are 95% confident that between 63·58% and 66·36% of EU
citizens drink beer, wine or spirits at least occasionally.6. (i) 0·062 (ii) 0·05, smaller (iii) 2,3677. (i) 0·4 (ii) (iii) Increase the number of employees selected.
(iv) 8. (i) 113 (ii) (c) True
Exercise 1.2 1. (i) 0·77 (ii) 0·021 (iii) (iv) Reject H0
2. (i)(ii) We are 95% certain that the proportion of satisfied customers is between 83·2% and 90·8%.(iv) Fail to reject the null hypothesis (v) Increase the sample size
3. (ii) Claim is within the confidence interval, fail to reject H0
4. H0: coin is not biasedHA: coin is biasedSince 50% is not within the confidence interval, reject H0. Coin is biased.
5. (ii) 72% is inside the confidence interval, fail to reject H0
6. (i) 25% (ii) 4·2%(iii) Since 35% is outside the confidence interval, reject H0 and accept the manager’s claim
Exercise 1.3
1. (i) (ii)2.3. 4. (i) Positively skewed
(ii) Normal distribution, (iii) Expect 35 samples with means > 81 g5. (i) (a) 41% (b) 240–300 (c) 281 (d) Normal (270, 2·16) (e) 0·01
(ii) (a) There are more premature births than very long pregnancies(b) For (i) (a) and (b) and (c) yes, cannot use the normal model if it is very skewed
(i) (d) No, as CLT guarantees a normal model for this large sample size
6. (i) (ii) Normal (iii) 103(m = 22 #05, s = 0 #75)a6
4b a1
4b2a3
4b4
= 0 #29663
m = 80, and sx = 0 #85
Test statistic/z unit = 2#12 Q Reject H0
Test statistic/z unit = 1 #82 Q Fail to reject H0H0 = 60 #5; HA Z 60 #5Test statistic/z unit = −2 #47 Q Reject H0H0 = 600; HA Z 600
0 #832 … p … 0 #9080 #749 … p … 0 #791
n = 9324#8% … p … 55#2%
31 #4% … p … 36 #6%
NCPM_5_supplement_ANS copy.qxd 8/28/14 2:06 PM Page 43
44
NEW CONCISE PROJECT MATHS 5
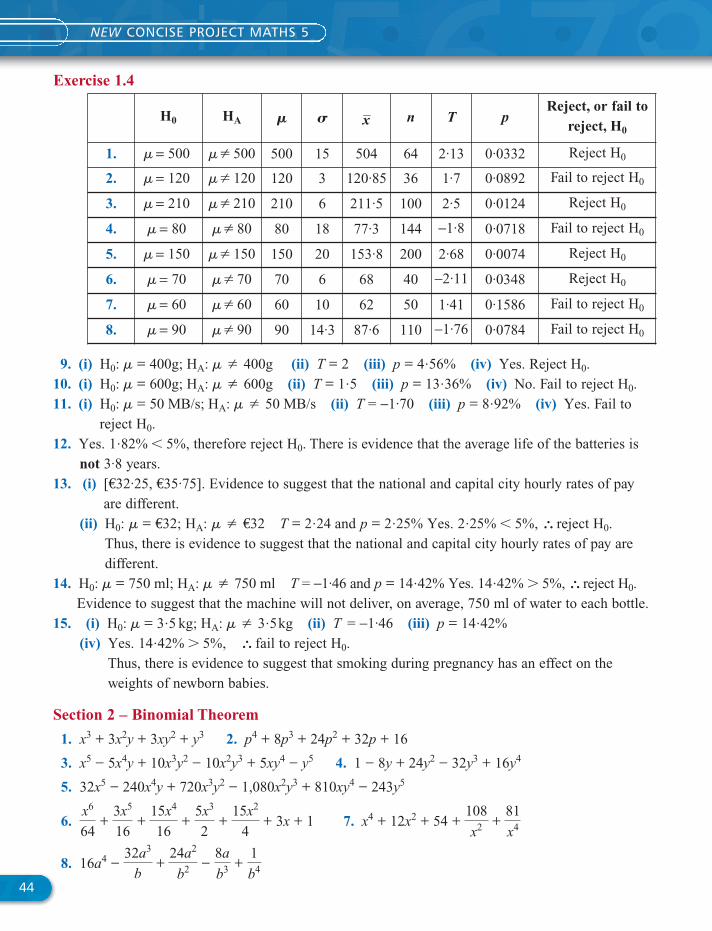
Exercise 1.4
H0 HA � � x– n T pReject, or fail to
reject, H0
1. m = 500 m Z 500 500 15 504 64 2·13 0·0332 Reject H0
2. m = 120 m Z 120 120 3 120·85 36 1·7 0·0892 Fail to reject H0
3. m = 210 m Z 210 210 6 211·5 100 2·5 0·0124 Reject H0
4. m = 80 m Z 80 80 18 77·3 144 −1·8 0·0718 Fail to reject H0
5. m = 150 m Z 150 150 20 153·8 200 2·68 0·0074 Reject H0
6. m = 70 m Z 70 70 6 68 40 −2·11 0·0348 Reject H0
7. m = 60 m Z 60 60 10 62 50 1·41 0·1586 Fail to reject H0
8. m = 90 m Z 90 90 14·3 87·6 110 −1·76 0·0784 Fail to reject H0
9. (i) (ii) (iii) (iv) Yes. Reject H0.10. (i) (ii) (iii) (iv) No. Fail to reject H0.11. (i) (ii) T = −1·70 (iii) (iv) Yes. Fail to
reject H0.12. Yes. , therefore reject H0. There is evidence that the average life of the batteries is
not 3·8 years.13. (i) [€32·25, €35·75]. Evidence to suggest that the national and capital city hourly rates of pay
are different.(ii) H0: €32; HA: €32 Yes. , \ reject H0.
Thus, there is evidence to suggest that the national and capital city hourly rates of pay aredifferent.
14. T = −1·46 and Yes. , \ reject H0. Evidence to suggest that the machine will not deliver, on average, 750 ml of water to each bottle.
15. (i) (ii) T = −1·46 (iii)(iv) Yes. , \ fail to reject H0.
Thus, there is evidence to suggest that smoking during pregnancy has an effect on theweights of newborn babies.
Section 2 – Binomial Theorem
1. 2.
3. 4.
5.
6. 7.
8. 16a4 − 32a3
b+ 24a2
b2 − 8a
b3 + 1
b4
x4 + 12x2 + 54 + 108
x2 + 81
x4
x6
64+ 3x5
16+ 15x4
16+ 5x3
2+ 15x2
4+ 3x + 1
32x5 − 240x4y + 720x3y2 − 1,080x2y3 + 810xy4 − 243y5
1 − 8y + 24y2 − 32y3 + 16y4x5 − 5x4y + 10x3y2 − 10x2y3 + 5xy4 − y5
p4 + 8p3 + 24p2 + 32p + 16x3 + 3x2y + 3xy2 + y3
14 #42% 7 5%p = 14 #42%H0: m = 3 #5 kg; HA: m Z 3 #5kg
14 #42% 7 5%p = 14 #42%H0: m = 750 ml; HA: m Z 750 ml
2 #25% 6 5%T = 2 #24 and p = 2 #25%m Zm =
1 #82% 6 5%
p = 8 #92%H0: m = 50 MB/s; HA: m Z 50 MB/sp = 13 #36%T = 1 #5H0: m = 600g; HA: m Z 600g
p = 4 #56%T = 2H0: m = 400g; HA: m Z 400g
NCPM_5_supplement_ANS copy.qxd 8/28/14 2:06 PM Page 44

45
ANSWERS
Section 3 – Additional Integration
Exercise 3.1
1. 2. 3. 4.
5. 6. 7. 8. 9.
Exercise 3.2
1. (i) 22 m/s2 (ii) (iii) 36 m 2. (i)
(ii) 16,224 bacteria 3. (i) (ii)
Exercise 3.3
1. (i) (ii) 2. (i) (ii) 3. (i) (ii) 1
4. (i) (ii) 5. (i) 9x cos 3x � 3 sin 3x (ii) 6. 2 7. 2
8. (i) 0 or (ii) �4x sin 2x + 2 cos 2x; sin 2x − 2x cos 2x + c (iii) square units
Section 4 – Transforming Graphs
1. 2. y
1
2
3
4
1 2 3 x−3 −2 −1 0 4−4
(i)
(ii)
(iii)
−1
−2
−3
−4
−5
−6
−7
y
1
2
3
4
1 2 3 x−3 −2 −1 0−4
(iv)
(i) (ii)
(iii)
5
6
7
8
−1
−2
−3
−4
pp
2
p − 2
22(e2 + 1)8xe2x + 4e2x
1 + ln xxex − ex + cxex + exex2 + c2xex2
1,000
49 sec
25,000
49 m
N = 2e3t − 5t + cs = t3 + 2t2 − 5t + 6
4 − 2 ln 415 + ln 2
7
62
3+ 3 ln 5
3
5 ln(5x + 7) + c
5
4 ln (4x − 2) + c
1
3 ln (3x + 5) + c
x3
3+ 7
2 ln x + c
3x2
2− 5 ln x + c2 ln x + c
NCPM_5_supplement_ANS copy.qxd 8/28/14 2:06 PM Page 45

3. g(x) � 3f(x)
h(x) � f(x + 2) + 2
4.
5. Graph B: y � x2 + 3
Graph C: y � (x − 2)2
Graph D: y � (x + 3)2 − 2
Section 5 – Continuity of Functions
1. x = −1 2. and 3. x = 1 4. x = −3 5. x = −2
6. x = −5 and x = 2
Section 6 – Graphs of Derivatives
1. (i) (ii) y
x
y
g(x)
g''(x)
g'(x)
y
x
g(x)
g��(x)
g�(x)
x = 3p
2x = p
2
y
1
2
3
1 2 x−3 −2 −1
0
−1
−2
−3
f(x) + 2f(x)
f(x + 2) – 1
46
NEW CONCISE PROJECT MATHS 5
NCPM_5_supplement_ANS copy.qxd 8/28/14 2:06 PM Page 46
47
ANSWERS
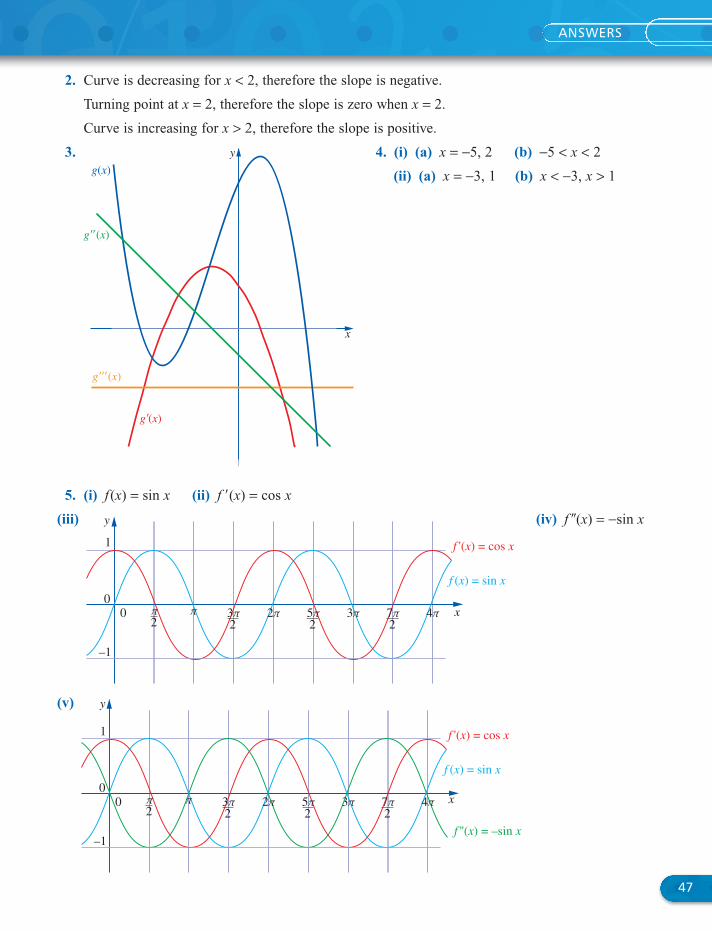
2. Curve is decreasing for x < 2, therefore the slope is negative.
Turning point at x = 2, therefore the slope is zero when x = 2.
Curve is increasing for x > 2, therefore the slope is positive.
3. 4. (i) (a) x = −5, 2 (b) −5 < x < 2
(ii) (a) x = −3, 1 (b) x < −3, x > 1
5. (i) f(x) = sin x (ii) f �(x) = cos x
(iii) (iv) f �(x) = −sin x
(v)
0
1
–1
02π π 2π 3π 4π
23π
25π
27π
f '(x) = cos x
f ''(x) = –sin x
f (x) = sin x
y
x
0
1
–1
02π π 2π 3π 4π
23π
25π
27π
f '(x) = cos x
f (x) = sin x
y
x
x
y
g(x)
g��(x)
g�(x)
g���(x)
NCPM_5_supplement_ANS copy.qxd 8/28/14 2:06 PM Page 47

6. (i)
(ii) For the quadratic function:
The first derivative will be a straight line.
The second derivative will be a horizontal line.
For the cubic function:
The first derivative will be a quadratic line.
The second derivative will be a straight line.
For the trigonometric function:
The given function is the sine function.
The first derivative will be the cosine function.
The second derivative will be −1(sine function), so it will be the original function upside-down.
For the exponential function:
The given function is an exponential function with a negative power, hence it is decreasing.
The first derivative will be the −1(the exponential function), so it will be similar to the original
function, but upside-down.
The second derivative will be the −1(the first derivative), so it will be back to the same
orientation as the original function.
Type of function Function 1st derivative 2nd derivative
Quadratic k B I
Cubic f D II
Trigonometric g A III
Exponential h C IV
48
NEW CONCISE PROJECT MATHS 5
NCPM_5_supplement_ANS copy.qxd 8/28/14 2:06 PM Page 48

GILL & MACMILLAN
Cover design: Aisli Madden www.designbos.ie
New Concise Project Maths 5 Supplement
• Thecontentcoveredinthissupplementaddressesrecentchangestothe LeavingCertificateHigherLevelProjectMathssyllabus.Thisincludesmaterial whichwasnotinthesyllabuswhentheNewConciseProjectMathstextbooks wenttoprintandalsomaterialwhichwasdeferredforexaminationuntilthe June2015exam.
• ThissupplementislaidoutinthesamestyleastheNewConciseProject Mathstextbooks.Itcontainsexplanatorymaterial,workedexamplesand exercisequestions,withanswersgivenattheendofthebook.
• Thisdeferredmaterialinvolveschangestocurrent,andadditional,Statistics material.TheStatisticssectionofthissupplementreplacesasectionfromthe NewConciseProjectMathsBook5Statisticschapter.Thisisexplainedfurther withinthesupplement.
• InordertocompletetheLeavingCertificateHigherLevelsyllabus,theentirety ofthissupplementmustbecovered,asanadditiontobothoftheNewConcise ProjectMaths4and5textbooks.
The Authors
Louise Boylan isamathsteacherinMountSackvilleSecondarySchool,Dublin20.SheisanexperiencedexamineratbothJuniorandLeavingCertificatelevelandholdsaMastersinICTinEducation.Sheregularlyleadsrevisionworkshopsforstateexaminationscandidates.
Brendan GuildeaisoneofIrelandsleadingmathsteachers.HepresentsrevisionseminarsforstudentsandinservicecoursesforteachersthroughoutIreland.Hefeaturesregularlyinthemedialeadingdiscussionsonmathsteaching,examsandsyllabus.HealsoteachesDEISJuniorandLeavingCertificatestudentsundertheTrinityCollegeAccessProgram.
George Humphrey istheauthorofseveralbestsellingtextbooksandrevisionbooksformaths.HeisalivelyandenthusiasticteacherwhoconductsworkshopsandseminarsthroughoutIrelandforteachersandstudents.