food web characterization using carbon and nitrogen
TRANSCRIPT

EMECS’11 – SEACOASTS XXVI JOINT CONFERENCE Managing risks to coastal regions and communities in a changing world
Jing ZHANG1,2, Osamu INAMURA3, Chihiro URASAWA1 Tomoki OTSUKA1, Natsumi YAMAZAKI1
1 Graduate School of Science & Engineering, Univ. Toyama 2 Northwest Pacific Region Environmental Cooperation Center 3 Uozu Aquarium
August 22-27, 2016, St Petersburg, Russia
Food web characterization using carbon and nitrogen isotope analysis in the Toyama Bay and the Sea of Japan

・ food web from coast to offshore in Toyama Bay, and Sea of Japan ・ Carbon and nitrogen input to coastal area of the Toyama Bay ・ Carbon-nitrogen cycles, and environmental management
Content

Higher recent ventilation than anywhere else in
the Pacific including
the Antarctic. Data source: WOCE and NODC of
Russia (Talley, 06’;
Talley et al., 04’)
A miniature ocean
Japan Sea
Background
t ~100 yrs
similar deep water subduction/ advection
Dissolved Oxygen in 1000 m

Motivation
Toyama Bay
Sea of Japan
World Ave. Hokkaido
Kyusyu・Okinawa area
Kanto Region
southern Japan
0.5
Remarkable seawater temperature rise ↓
1. Scientific questions; 2. social needs: e.g., fish catches
(Japanese Society of Fisheries Economics)
Fish catches decreases from 1985 to 2013 in the Sea of Japan
(Large purse seine)
sardine horse mackerel
mackerel
others ×kt
Sardine decreased sharply
Long term change of surface seawater temperature in Japan (℃/100 yr, JMA)

Toyama Bay is the Natural fish Reservoir ・Rich fisheries resources through the ages
・Fish species: 614 (Toyama Bay) /1396 (Sea of Japan)
Effect of global warming on the marine resources has been concerned in recent years
King of the fishes Yellowtail
1200m

Fish catches dramatically decreased (winter 2015)
Yellowtail
~10%

2014
100m Temp
2015
December January
Best live temperature for Yellowtail: 15~17℃ It existed in the central part of Sea of Japan in the winter, 2015; In January, yellowtail did not enter Toyama Bay due to low seawater temperature
December January
2015 2016

Image of the food web
Carnivorous fish
Primary producers
Herbivores
Secondary consumers
Food web and energy flow from primary producer to fish
→Food web
Other zooplankton
Detritus
Amphipoda Copepod
Phytoplankton
Euphausiacea
Sardine
Squid offshore
Ommastrephes bartramii
Pomfret
Shark in shallow water
Salmon
Cololabis saira Todarodes pacificus

Phytoplankton
Marine snow
Sediment
shallow water Fish
Zooplankton
deep water Fish
●:Fish of deep water
●:Fish of shallow water
●:Zooplankton in Toyama Bay (Deep & shallow)
Zooplankton δ1
5N(
‰)
δ13C(‰)
Chaetognatha
Mysidacea
Copepoda
Amphipoda
Euphausiacea
Buccinum tenuissimum
Lycodes tanakae Bothrocara hollandi
Stephanolepis cirrhifer
Etrumeus teres
Pasiphaea japonica
Berryteuthis magister
Seriola quinqueradiata
Ser. Quin. young
Offshore food web in the Toyama Bay By CN stable isotope ratio analysis

Sinking particle
(marine snow)
Sediment
14
12
10
8
6
4
2
Yellowtail
Metapenaeopsis lata
Yellowtail
Thread-sail filefish
Phytoplankton
-25 -23 -21 -19 -17 -15 -13
δ13C(‰)
Capitulum mitella Hemigrapsus
sanguineus
Shell
Bivalvia
Coast
Round herring
Benthic algae
δ1
5N(
‰)
Food web
TL :2
TL : 1
Offshore
Limpet
Food web in coastal area By CN stable isotope ratio analysis
14
12
10
8
6
4
2
-25 -23 -21 -19 -17 -15 -13
δ13C(‰)
カメノテ
Coast
Limpet
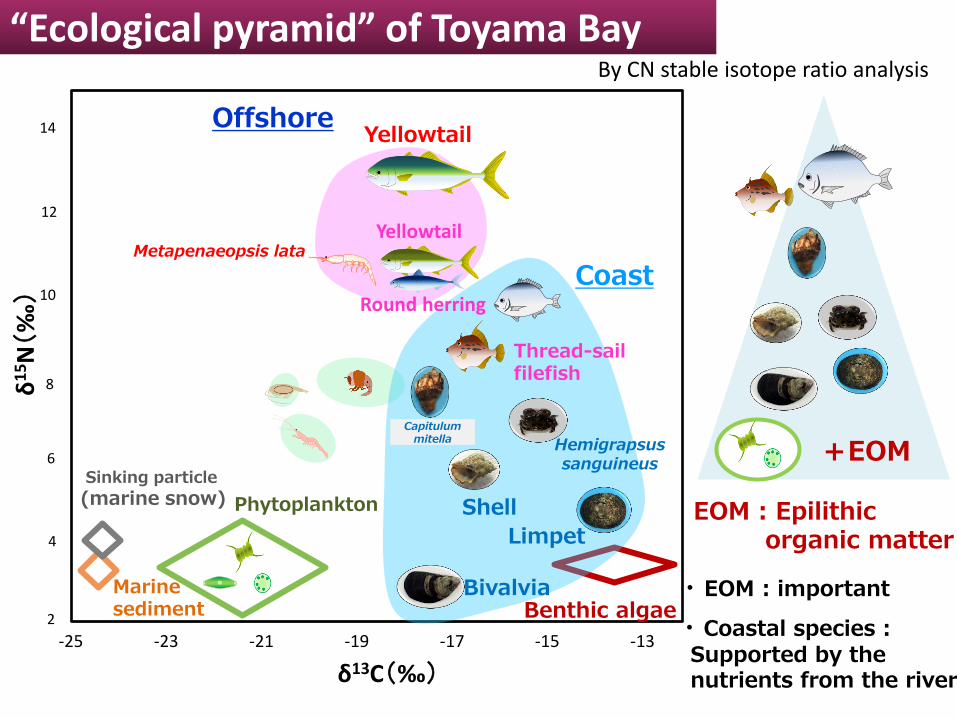
・ Coastal species : Supported by the nutrients from the river
+EOM EOM : Epilithic organic matter
・ EOM : important
δ1
5N(
‰)
Sinking particle
(marine snow)
Marine sediment
Phytoplankton
Yellowtail
Yellowtail Metapenaeopsis lata
Round herring
Thread-sail filefish
Hemigrapsus sanguineus
Bivalvia
Shell
Capitulum mitella
Benthic algae
“Ecological pyramid” of Toyama Bay By CN stable isotope ratio analysis
Offshore

-2
0
2
4
6
8
10
12
-28 -26 -24 -22 -20 -18 -16 -14 -12
δ1
5N(‰
)
Phytoplankton +
EOM (Epilithic organic matter)
δ13C of coastal species:
Comparison with
Phytoplankton
δ13C =High
Phytoplankton
EOM
C:N=1:3.4
Carbon source
δ13C(‰) B:Bivalvia(n=27)
G:Limpet(n=37)
F:Fish (n=27)
P:Polychaeta (n=1)
T:Shell(n=5)
C: Mitella(n=7)
H:Crab(n=3)
Carbon source of coastal species

Contribution ratio of EOM (Epilithic organic matter) (%) =100-(100×(S×CC-S×E2C-CN+E2N)/ (S×E1C-S×E2C-E1N+E2N))
S=15N fractionation / 13C fractionation
CC:δ13C in subject creature CN:δ15N in subject creature E1C δ13C in POM
E1N:δ15N in POM E2C:δ13C in EOM E2N:δ15N in EOM (Yokoyama and Ishii, 2007; Doi et al., 2011)
E1=POM E2=EOM Shell S=2(‰)/1(‰)others S=3.4(‰)/1(‰)
Subject Organism
Contribution ratio of EOM (%)
Bivalvia n=17
37±4(32~44)
Conch n=2
35
Polychaetan=1
49
Subject Organism
Contribution ratio of EOM (%)
Hemigrapsus
sanguineus n=3 47 (38~58)
Fish n=15 45±11(24~70)
Two carbon source contributions
Contribution ratio of EOM: 30~60%
→Important carbon source
Carbon source of coastal species and their contributions

:River :Human activity
terrestrial input
:Estuary
West East
0.2
-4.7
-0.7
-3.0 -3.1
-1.4
4.5
0.6
4.2
4.2
River water in Toyama
Estuary:-5~0‰
Other areas Downstream river δ15N NO3
-:4~6‰ (Nagata et al., 2010)
NO3- derived from a river:
δ15N is low
δ15N NO3- in terrestrial water and sea water

:River :Human activity :Estuary
West East Submarine Groundwater Discharge
・Important nutrient source ・It supplies 1.5-fold N compared with riverine contribution(Nakaguchi et al.,2005)
δ15N NO3-=-2.2‰(Zhang, 2014)
Land provides low δ15N
δ15N NO3- of terrestrial water
δ15N NO3- in terrestrial water and sea water

Contribution ratio of river water =(1-(1st consymaerδ15N- 15N fractionation ー Riverδ15N NO3
-)/ (Deep sea waterδ15N NO3 -riverδ15N NO3
- ))×100 ※Primary producers:δ15N= δ15N NO3
-
St3 RCR(%)
Bivalvia n=12 35±5(25~43)
Cellana mazatlandica
n=10
23±7(9~32)
St1 RCR(%)
Bivalvia n=5 36±4(33~41)
Cellana mazatlandica
n=5
23±6(14~28)
Contribution ratio of δ15N NO3- derived from the land to the coastal species
20~40%
Nitrate input from land and contribution

-10
0
10
20
30
40
50
60
70
-10 -5 0 5 10 15 20 25 30
δ1
8O
δ15N
片貝川
早月川
神通川
庄川
小矢部川
Precipitation
Nitrate fertilizer
Nitrification
Human waste, Livestock waste, and compost
Kendall, 1998
δ18O:-0.6~3.8‰ (Average:1.6‰)
Fertilizer of nitrate nitrogen : Lower than precipitation
δ15N of the river water ・NH4
+ in the fertilizer ・NH4
+in the soil ・Derived from nitrification of bacteria
NO3- of δ15N・δ18O
Measure δ15N and δ18O of NO3-
→ It can estimate
the origin of NO3-
Oyabe
Shogawa
Jinzu
Katakaigawa
Hayatsukigawa
Origin estimate of δ15N NO3- in the river water

Nitrification: NO3-
Future work ・seasonal changes, event → ecosystem model
→ → ・ global warming, human activities…
(precipitation, eutrophication, land use)
→ → ・ integrated management, adaptation
Phytoplankton
Food web δ13C=H δ15N=L δ15N NO3
- =Low
Epilithic organic matter
From land 20~40%
C-①
N
River & SGD Input
Land → Coast → Food web; Energy Flow
C-①
Summary

5
6
7
8
9
10
11
-23 -22 -21 -20 -19
δ1
5N
富山湾_深層_カイアシ小 (5)
富山湾_深層_カイアシ大 (5)
富山湾_深層_オキアミ (4)
富山湾_深層_端脚 (4)
富山湾_深層_アミ (3)
富山湾_深層_ヤムシ (4)
大和海盆_深層_カイアシ小(2)
大和海盆_深層_カイアシ大(2)
大和海盆_深層_オキアミ(2)
大和海盆_深層_端脚(2)
大和海盆_深層_アミ(2)
大和海盆_深層_ヤムシ(2)
Comparison with the same species
δ1
5N(
‰)
δ13C(‰)
Isotope ratio of zooplankton (Toyama Bay and Yamato basin)
Copepoda of Toyama Bay_small (5)
Copepoda of Toyama Bay_large (5)
Euphausiacea of Toyama Bay (4)
Amphipoda of Toyama Bay (4)
Mysidacea of Toyama Bay (3)
Chaetognatha of Toyama Bay (4)
Copepoda of Yamato Basin_small (2)
Copepoda of Yamato Basin_large (2)
Euphausiacea of Yamato Basin (2)
Amphipoda of Yamato Basin (2)
Mysidacea of Yamato Basin (2)
Chaetognatha of Yamato Basin (2)
May 2015
Carbon isotope ratio of the zooplankton: Toyama Bay>Yamato Basin
Zooplankton : Comparison between Toyama Bay and Sea of Japan

Carbon isotope ratio of the zooplankton:Toyama Bay>Yamato Basin →Reflecting the growth rate of phytoplankton Growth rate is fast : carbon isotope ratio → High (Takahashi et al, 1991)
●:Toyama Bay ●:Yamato Basin
Toyama Bay
Yamato Basin
Carbon:High
May 2015
Comparison of the shallow water and deep water
phytoplankton biomass
(chlorophyll concentration µ/l)
De
pth
(m
)
Toyama Bay has fast grow rate and enriched in biomass relative to Yamato Basin

Characteristic
Subdivision of
phyto/zoo plankton Expected outcome
Mechanism of
nutrient
environment impact
on lower-order
ecosystem
Characteristic
Simplification of
phyto/zoo plankton
Data assimilation
Expected outcome
High resolution
prediction of long-term
change
Characteristic transport of eggs and larvae
Reproduction of debris by
environment and baits
conditions
Lower-order ecosystem
linked with zooplankton
Expected outcome Efficient configurations of
Marine Protected Areas
Sakurai 2014
Konishi et
al. 2011
Particle tracking/ Growth/Survival model Ecosystem models
Integrated management of Japanese coastal areas Ecosystem response mechanism

22
Nutrients supplied from East China Sea,
Sea of Japan deep water, and the land.
Primary Producer
Primary Consumer
Secondary
Consumer
Tertiary
Consumer
d13C (‰)
Ecosystem structure in the Sea of Japan
Red snow Crab
Firefly squid
d1
5N
(‰
)