food security in south asia: strategies and...
TRANSCRIPT

1

2
Food Security in South Asia:Strategies and Programmes for
Regional Collaboration
Shunsuke BandoShunsuke BandoAsian Development BankAsian Development Bank
12 December 200912 December 200922ndnd South Asia Economic SummitSouth Asia Economic Summit

3
Food/Cereal Price MovementsFood/Cereal Price Movements
Source: FAO 2009
4
Causes of Sharp Increase and Fluctuating Food Prices
1.Not Just (Short-term Causes) (e.g. Poor Harvests)
2.But Reflect Structural Changes in Demand/Supply Patterns
Higher Cost due to higher input prices (especially oil)Increasing demand from PRC and IndiaDiversion of land from food production to production of bio-fuel and animal feed

5
Impact of Large Increases and Fluctuating Food Prices
1.Pushed Millions (74mn. In 2007) into Hunger and Poverty
2.High food prices → reduced real incomes of poor → decline in food consumption(no capacity to shift food patterns of low cost calories)
3.Price fluctuations → supply fluctuations →uncertainty → encourages speculation →increase fluctuations

6
South Asia Most Vulnerable Because:
1. South Asia accounts for 40% of world’s poor (living on less than on US$ 1.25 a day) – India constitutes 33% of world’s poor
2. Highest concentration of hunger and malnutrition in South Asia:
- 2/3 of world’s under nourished children- 56% of world’s low-birth weight babies

7
Food Security: Key Components
1.Availability of food
2.Accessibility to Food
3.Food Utilization (Nutritional Aspect)
4.Stable Supplies
South Asia faces major challenges and constraints on all 4 aspects

8
Economic Structure and Movements of Key Variables
(Bangladesh, India, Nepal, Pakistan & Sri Lanka)
Share of Agriculture in GDP (%)Availability
YearYear BangladeshBangladesh IndiaIndia NepalNepal PakistanPakistan Sri LankaSri Lanka19901990 30.2530.25 29.2829.28 51.6351.63 25.9825.98 26.3226.3220002000 25.5125.51 23.3523.35 40.8240.82 25.9325.93 17.6017.6020052005 20.1420.14 19.1019.10 36.3536.35 21.4721.47 13.5013.5020082008 19.0019.00 17.6017.60 33.1033.10 20.2020.20 15.2015.20
Source: ADB (2009) and other issues

9
YearYear BangladeshBangladesh IndiaIndia NepalNepal PakistanPakistan Sri LankaSri Lanka SAARCSAARC
19911991 100.00100.00 102.58102.58 91.3991.39 98.6198.61 92.9892.98 101.56101.56
19921992 98.5598.55 99.3999.39 74.4374.43 101.71101.71 90.0090.00 99.0199.01
19931993 95.5295.52 104.05104.05 89.8189.81 106.15106.15 97.7697.76 103.05103.05
19941994 87.3887.38 105.08105.08 80.8480.84 96.1796.17 101.04101.04 101.68101.68
19951995 90.1890.18 104.25104.25 91.3491.34 105.47105.47 104.79104.79 102.65102.65
19961996 94.5294.52 102.67102.67 94.2894.28 103.91103.91 76.2376.23 101.58101.58
19971997 92.9992.99 106.68106.68 92.4992.49 100.16100.16 82.1882.18 104.02104.02
19981998 97.5797.57 104.89104.89 89.2989.29 108.82108.82 98.1498.14 104.27104.27
19991999 110.01110.01 108.91108.91 91.7491.74 104.36104.36 103.51103.51 108.24108.24
20002000 116.74116.74 107.60107.60 98.3298.32 115.25115.25 103.05103.05 109.41109.41
20012001 109.90109.90 106.35106.35 94.7394.73 100.14100.14 96.6496.64 105.85105.85
20022002 111.14111.14 93.5793.57 94.8094.80 97.1797.17 102.08102.08 96.1696.16
20032003 110.66110.66 97.4597.45 95.0195.01 101.02101.02 109.20109.20 99.5399.53
20042004 101.84101.84 96.9496.94 98.8898.88 101.30101.30 93.0793.07 98.1698.16
20052005 108.10108.10 98.2398.23 95.8595.85 110.24110.24 114.47114.47 100.99100.99
20062006 114.70114.70 97.7697.76 91.6991.69 106.46106.46 117.32117.32 100.89100.89
20072007 112.84112.84 102.24102.24 85.6685.66 114.05114.05 106.18106.18 104.33104.33
20082008 124.07124.07 109.32109.32 90.7690.76 105.57105.57 124.29124.29 110.29110.29
Per Capita Production Index (1990=100) for Cereals (Wheat and Rice)
Availability (Contd.)
Based on FAO (2009)

10
Availability (Contd.)
175019502150235025502750295031503350
1990-92 1995-97 2003-05
W o rld De v e lo p e d Co u n trie s D ev e lo p in g C o u nt ries So u th A s ia
Graph: Average per Capita Intake of Calories

11
AccessibilityPopulation Living Below the National Poverty Line and Below $ 1.25 a day (2005 PPP)
(% of Population)
YearsYears BangladeshBangladesh IndiaIndia NepalNepal PakistanPakistan Sri LankaSri Lanka
19961996 51.0051.00 46.646.6 41.7641.76 48.148.1 25.0025.00
19971997 31.0031.00
19991999 32.6032.60
20002000 49.80/49.80/57.857.8 28.6028.60 35.935.9
20012001 34.3634.36
20022002 43.943.9 55.1 (2003)55.1 (2003) 22.70/22.70/14.014.0
20042004 30.9030.90 22.622.6
20052005 40.0/40.0/49.649.6 27.5/27.5/41.641.6 22.3(2006)22.3(2006) 15.2 (2007)15.2 (2007)
Source: ESCAP, 2008 and FAO, 2009

12
UtilizationHealth expenditure, public (% of GDP)
YearsYearsBangladeshBangladesh BhutanBhutan IndiaIndia MaldiveMaldive
ssNepalNepal PakistaPakista
nnSri LankaSri Lanka
20002000 1.01.0 4.04.0 0.70.7 4.14.1 0.80.8 0.70.7 1.61.6
20012001 0.90.9 5.05.0 0.80.8 3.93.9 0.80.8 0.70.7 1.31.3
20022002 0.90.9 4.24.2 0.70.7 3.93.9 0.90.9 0.70.7 1.51.5
20032003 0.80.8 2.92.9 0.60.6 4.14.1 0.70.7 0.70.7 1.51.5
20042004 0.90.9 2.62.6 0.60.6 4.34.3 0.70.7 0.60.6 1.61.6
20052005 0.80.8 2.62.6 0.60.6 5.55.5 0.80.8 0.60.6 1.81.8
20062006 0.80.8 2.62.6 0.60.6 5.95.9 0.90.9 0.50.5 2.02.0
20072007 0.80.8 3.33.3 0.70.7 5.85.8 1.01.0 0.60.6 1.91.9
20082008 0.80.8 0.70.7 7.87.8 1.21.2 0.60.6 1.71.7
Source: WDI 2007, WDI 2008, ADB 2009, Pakistan Economic Survey 2008-09

13
Utilization (Contd.)
Improved sanitation facilities (% of population with access)
YearsYears BangladeshBangladesh BhutanBhutan IndiaIndia MaldivesMaldives NepalNepal PakistanPakistan Sri LankaSri Lanka19901990 2020 .... 1414 .... 1111 3737 696920042004 3939 7070 3333 5959 3535 5959 9191
Source: WDI 2007, WDI 2008, ADB 2009, Pakistan Economic Survey 2008-09

14
Utilization (Contd.)
Prevalence of undernourishment (% of population)
YearsYearsBangladeshBangladesh IndiaIndia MaldivesMaldives NepalNepal PakistanPakistan Sri LankaSri Lanka
19921992 3535 2525 1717 2020 2424 282819971997 4040 2121 1515 2626 1919 262620032003 3030 2020 1111 1717 2323 222220042004 3030 2020 1010 1717 2424 2222
Source: WDI 2008

15
StabilityYearsYears BangladeshBangladesh IndiaIndia NepalNepal PakistanPakistan Sri LankaSri Lanka
19901990 100.00100.00 100.00100.00 100.00100.00 100.00100.00 100.00100.00
19911991 99.8299.82 102.39102.39 100.28100.28 100.17100.17 99.7199.71
19921992 99.4599.45 103.34103.34 103.12103.12 100.17100.17 100.20100.20
19931993 98.6098.60 102.73102.73 100.79100.79 102.05102.05 99.7499.74
19941994 98.2898.28 104.09104.09 100.83100.83 102.11102.11 100.13100.13
19951995 98.6798.67 105.47105.47 100.53100.53 105.26105.26 99.4099.40
19961996 98.6798.67 105.13105.13 101.30101.30 104.62104.62 102.20102.20
19971997 98.2998.29 103.81103.81 101.39101.39 104.72104.72 103.42103.42
19981998 99.9899.98 105.39105.39 100.87100.87 104.56104.56 104.89104.89
19991999 102.18102.18 102.30102.30 105.26105.26 104.72104.72 104.18104.18
20002000 102.01102.01 100.13100.13 102.28102.28 103.34103.34 102.50102.50
20012001 101.48101.48 98.6198.61 97.5697.56 102.50102.50 103.47103.47
20022002 100.26100.26 97.0297.02 98.3198.31 101.22101.22 104.49104.49
20032003 99.4099.40 96.6196.61 97.9797.97 101.02101.02 101.33101.33
20042004 100.46100.46 95.7295.72 97.3797.37 102.37102.37 101.41101.41
20052005 101.83101.83 94.8194.81 96.8696.86 105.37105.37 101.80101.80
20062006 102.34102.34 96.0296.02 96.7296.72 104.39104.39 100.78100.78
20072007 103.22103.22 98.7398.73 97.4397.43 106.78106.78 104.68104.68
20082008 105.48105.48 101.76101.76 99.6099.60 112.21112.21 111.43111.43
Real Price Ratio (Food Price Index/Consumer Price Index)
Source: FAO, 2009 and WDI, 2007

16
Monitoring and Tracking Progress and Identifying and
Quantifying Vulnerability• Food Security Index (FSI)
Per Capita Availability (50%)+ Per Capita Food Production (1/6)+ Self-sufficiency ratio (1/6) + inverse relative food prices (1/6)
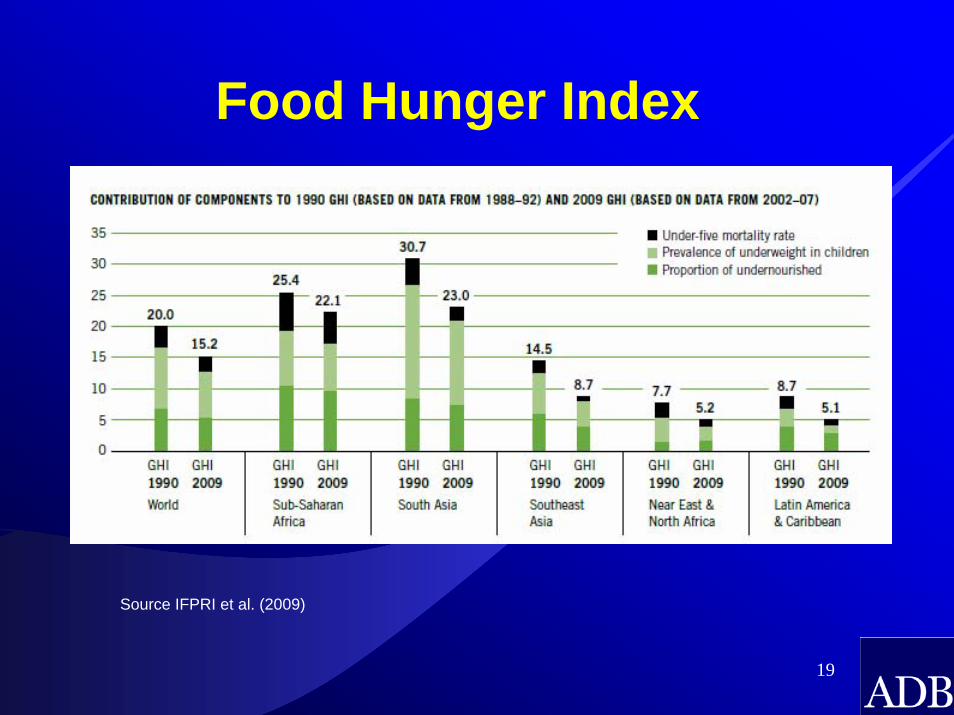
• Food Hunger Index (FHI)Proportion of undernourished as % population (1/3)Prevalence of underweight children below the age 5 (1/3)Mortality rate under age 5 (1/3)

17
Food Security IndexFood Security Index: SAARC
96
98
100
102
104
106
108
1990 1992 1994 1996 1998 2000 2002 2004 2006 2008
Figure 3: Foof Security Index: India
94
96
98
100
102
104
106
108
1990 1992 1994 1996 1998 2000 2002 2004 2006 2008

18
Food Security Index (Contd.)
Food Security Index: Pakistan
96
98
100
102
104
106
108
110
112
1990 1992 1994 1996 1998 2000 2002 2004 2006 2008
Food Security Index: Sri Lanka
828588919497
100103106109112115
1990 1992 1994 1996 1998 2000 2002 2004 2006 2008
19
Food Hunger Index
Source IFPRI et al. (2009)

20
Food Hunger Index (Contd.)
Global Hunger Index (1990 and 2009)
RankRankCountryCountry 19901990 20092009
3535 Sri LankaSri Lanka 21.121.1 13.713.75555 NepalNepal 27.627.6 19.819.85858 PakistanPakistan 24.724.7 21.021.06565 IndiaIndia 31.731.7 23.923.96767 BangladeshBangladesh 35.935.9 24.724.7
South AsiaSouth Asia 30.730.7 23.023.0
Source: IFPRI et al (2009)

21
Key Issues
South Asia's Performance in Food Security
• Price Incentives/Pricing Policies• Investment in Infrastructure: Social
and Physical• Safety Nets/Social Protection• Integration into global/regional
economy• Research and Development

22
Trade in Food Grains• Lack of surplus• Rice: Pakistan & India in surplus• Wheat: India in surplus but not consistently• SAARC Food Security Bank
Modalities being worked out
Data on Prices of Wheat Flour and Rice Basmati (Broken) in Islamabad, New Delhi, Dhaka and Colombo (August 2007-09)
Wheat Flour (Kg)Wheat Flour (Kg) Rice Basmati Broken (Kg)Rice Basmati Broken (Kg)
Aug. 07Aug. 07 Aug. 08Aug. 08 Aug. 09Aug. 09 Aug. 07Aug. 07 Aug. 08Aug. 08 Aug. 09Aug. 09
IslamabadIslamabad 14.6814.68 22.2122.21 28.6628.66 37.0037.00 63.1363.13 50.0050.00
New DelhiNew Delhi 21.1421.14 25.3525.35 25.5025.50 27.1827.18 59.1559.15 45.5045.50
DhakaDhaka -- 48.0048.00 34.8834.88 -- 130.00*130.00* 168.41*168.41*
ColomboColombo 29.1029.10 -- 61.4661.46 74.00*74.00* -- 144.60*144.60*
CountryCountry
Note: * Rice BasmatiSource: Courtesy Planning Commission, Government of Pakistan, Islamabad.

23
Fostering Regional Integration
• Regional Trade• Pricing Policies• Sharing Information
Extension servicesResearch (HH)New Technology/Seed
• Preparing for Climate ChangeMelting of Himalayan Glaciers

24
Thank you very much