food price hikes and household food security in bangladesh and
TRANSCRIPT
1
Food Price Hikes and Household Food Security in Bangladesh and
Ethiopia: Examining Children’s Vulnerability to Food Insecurity*
Zenebe Bashaw Uraguchi
†
Abstract: The purpose of this paper is to examine the impacts of recent food price hikes on the
level of children’s food security in households in five sub–districts of Bangladesh and Ethiopia.
Based on household food security surveys covering 750 households conducted in 2008 and 2009,
this study looks into the Aggregate Household Food Security Index (AHFSI) of households to
assess their food security levels. The study also relies on a mix of Household Dietary Diversity
Score (HDDS), Coping Strategy Index (CSI) as well as the existence of shocks. Logistic
regression is employed to understand the degree of the impacts from food price hikes. In addition,
the study introduces other variables under the socio–demographic, agricultural inputs, and
economic/income models to understand what factors better explain children’s vulnerability to
food insecurity in households. The findings suggested that 58.2% of households in Bangladesh
and 60.4% of households in Ethiopia were in chronic food insecurity. Stunting and wasting of
children were the highest during the peak of the food price hikes. Consumption of food was
correlated to the income level of households. This was evidenced by the statistically positive
significant Spearman rank correlation coefficient of 0.537 between the impacts of food price
hikes and levels of food security. Concentration curves also showed that cumulative distribution
of malnutrition was below the forty–five degree diagonal line indicating child malnutrition was
highly concentrated among low income households. The dietary diversity score was low, and
most households heavily relied on few food items, such as grain and oil/fats. At the height of the
food price hikes, households adopted coping strategies that included limiting meal portion size of
children. In conjunction with other variables, food price hikes were statistically significant
accounting children’s vulnerability to food insecurity in households.
* This paper is part of a longer version paper presented in an international conference organized by the Overseas
Development Institute (ODI) and UNICEF in London in November 2009. Many thanks indeed for the institutional
and financial support of UNICEF, GSID/Nagoya University, and the Governance Study Center/Japan Study Center,
University of Dhaka. Special thanks go to Professor N. Shinkai (GSID) and Professor A. Rahman (University of
Dhaka). All errors are mine alone. † Ph.D. student, Graduate School of International Development (GSID), Nagoya University
2
1. INTRODUCTION
The underlying purpose of this paper is to examine the impacts of the recent food price hikes
on the extent and direction of vulnerability of children to food insecurity in households in five
sub–districts of Bangladesh and Ethiopia. It estimates the role that food price hikes have played
in accounting/triggering or exacerbating the degree of children’s vulnerability to food insecurity
in households. It also statistically tests the role of food price hikes with other possible
determinants of vulnerability to food insecurity.
The Food and Agriculture Organization (FAO) considered Bangladesh and Ethiopia as one
of the thirty–seven countries in ‘crises’ due to the rise in food prices. Food price hikes in the two
countries were accompanied by increasing macro–economic inflation and reliance on food
aid/imports. Governments in the two countries faced foreign currency constraints due to soaring
prices of fuel imports, and they were unable to provide subsidies or higher wages. As a
consequence, there has been no homogeneity of degree zero in prices and income, which
assumes that if price and income increase by the same proportion or percentage, there is no
change in demand.
An average household in both countries spends close to two–third of its income on food.
Among the group defined as poor in Bangladesh and Ethiopia, only 8% were small net sellers in
2000 and 2001 (World Bank 2008). Food price inflation in Ethiopia was 81.1% in September
2008, one of the highest in the world. It has reduced reserves to US $ 900 million which is
equivalent to 1.2 months of imports (IMF 2009). This was further exacerbated by the 2007/2008
failure of the small rains (Belg) (World Bank 2008). The costs for children have not been limited
to direct nutritional impacts, but they have also extended to affect their future as 58% of rural
households in Bangladesh pulled their children from school due to food price hikes (Raihan
3
2009: iv).
Population growth has been very fast in both countries, and between 1990 and 2007, an
average 36% of the population in Bangladesh and 45% in Ethiopia was under the age of fourteen
(UNPF 2008; World Bank 2008). They faced large–scale famines, and the 1974 famines in both
countries marked widespread death with estimated combined figures of one million people and
huge loss of rural assets (Sobhan 1979; Sen 1982; Hussein 1976; Zewde 1976; Dessalegn 1985).
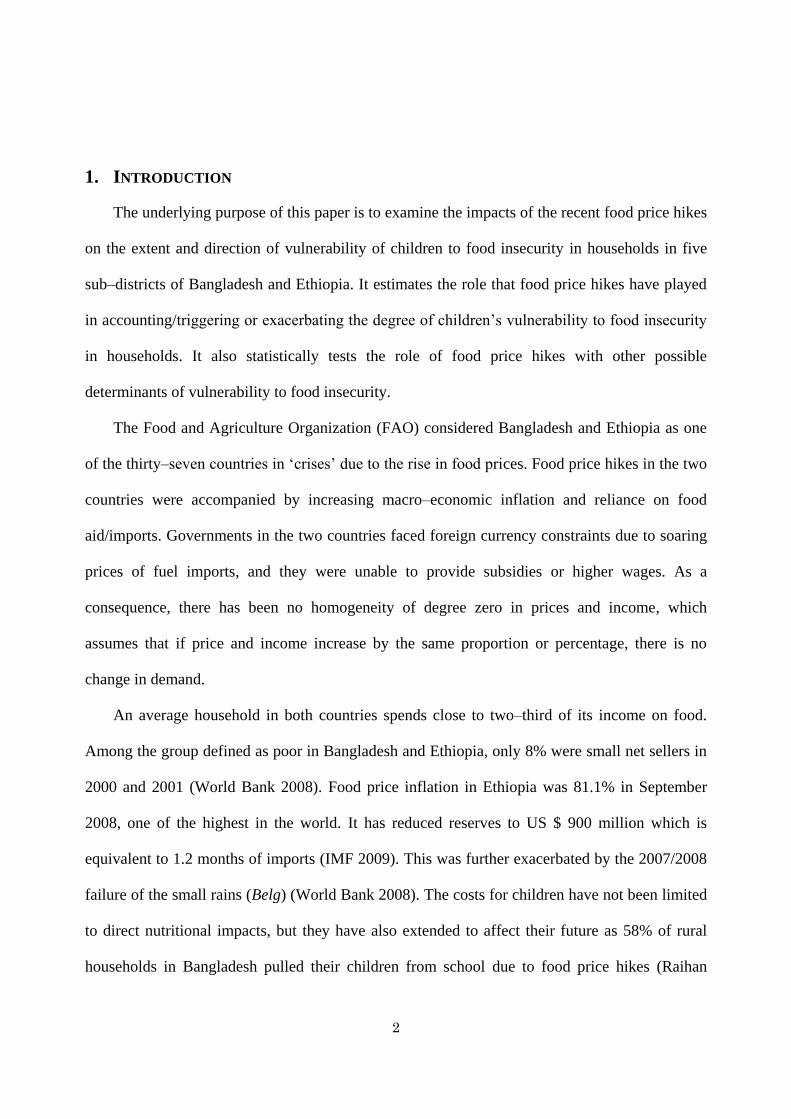
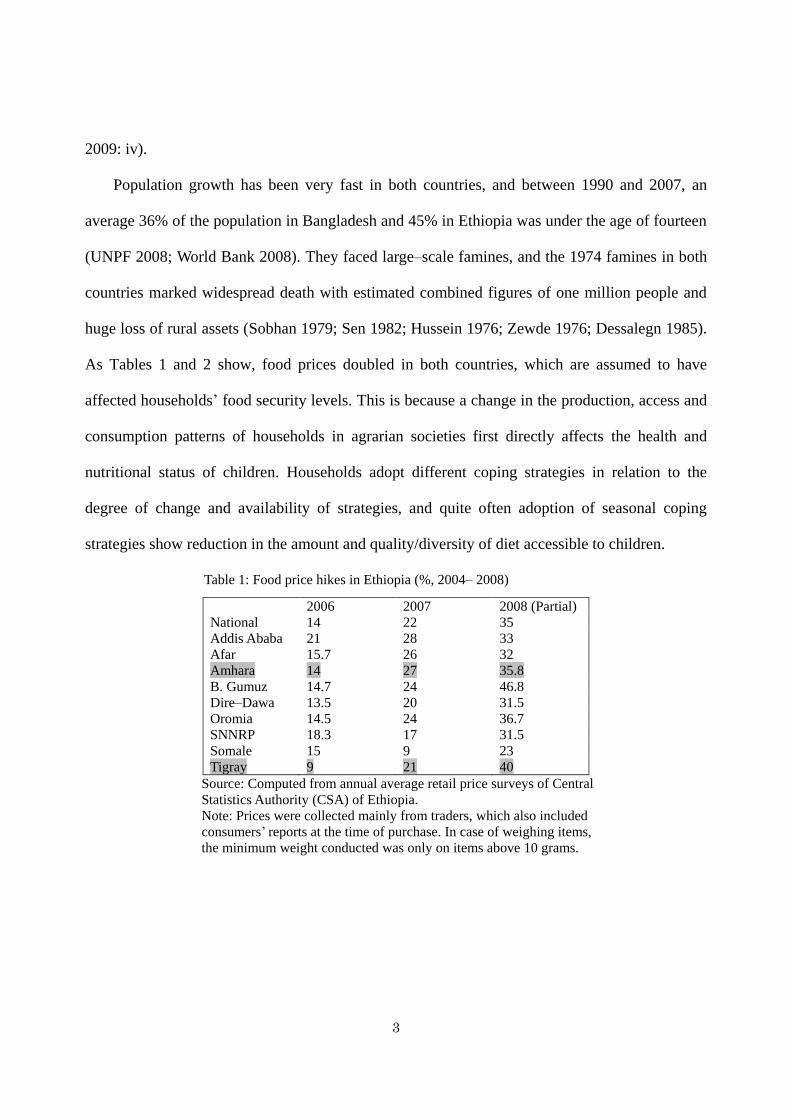
As Tables 1 and 2 show, food prices doubled in both countries, which are assumed to have
affected households’ food security levels. This is because a change in the production, access and
consumption patterns of households in agrarian societies first directly affects the health and
nutritional status of children. Households adopt different coping strategies in relation to the
degree of change and availability of strategies, and quite often adoption of seasonal coping
strategies show reduction in the amount and quality/diversity of diet accessible to children.
Table 1: Food price hikes in Ethiopia (%, 2004– 2008)
2006 2007 2008 (Partial)
National 14 22 35
Addis Ababa 21 28 33
Afar 15.7 26 32
Amhara 14 27 35.8
B. Gumuz 14.7 24 46.8
Dire–Dawa 13.5 20 31.5
Oromia 14.5 24 36.7
SNNRP 18.3 17 31.5
Somale 15 9 23
Tigray 9 21 40
Source: Computed from annual average retail price surveys of Central
Statistics Authority (CSA) of Ethiopia.
Note: Prices were collected mainly from traders, which also included
consumers’ reports at the time of purchase. In case of weighing items,
the minimum weight conducted was only on items above 10 grams.
4
Table 2: Average Price trends of rice and wheat in Bangladesh (2007–2009)
Retail Price Wholesale price
Rice Wheat Rice Wheat
July 0.45 0.43 0.44 0.42
August 0.45 0.30 0.43 0.41
September 0.43 0.43 0.42 0.40
October 0.42 0.40 0.41 0.38
November 0.39 0.37 0.37 0.33
December 0.37 0.30 0.35 0.27
January 0.35 0.25 0.32 0.25
February 0.33 0.26 0.31 0.25
March 0.30 0.2 0.28 0.21
April 0.27 0.21 0.25 0.19
May 0.27 0.21 0.25 0.20
June 0.27 0.21 0.25 0.21
Source: Computed from Bangladesh Bureau of Statistics (BBS),
Ministry of Agriculture, Government of Bangladesh
Note: Values are in UD dollar (1 USD = 70 Taka)
The economic foundations of Bangladesh and Ethiopia are predominantly dependent on
agriculture which supports close to 30% and 50% of GDP, respectively. As high as 80% to 85%
the population live in rural areas and agriculture constitutes 63% of the total labour force in
Bangladesh and 81% in Ethiopia. The two countries are probably better known for poverty, the
images of starving children and series of appeals for help from the international community than
other issues. This study does not set the goal of dispelling such pervasive and deep–ingrained
perceptions. It does not also intend to comparatively examine the impacts of food price hikes on
the food (in)security levels in the two countries. First, as can be seen in the coming sections, the
household dietary diversity score (HDDS), which measures the amount of food groups or items
that households consume, differs in the two countries. This leads to different scales and
outcomes. Second, the two countries have underlying historical, geographical, and
socio–economic differences; yet, there are some important similarities in the nature, trajectories
and scopes of the challenges that rural communities face.
5
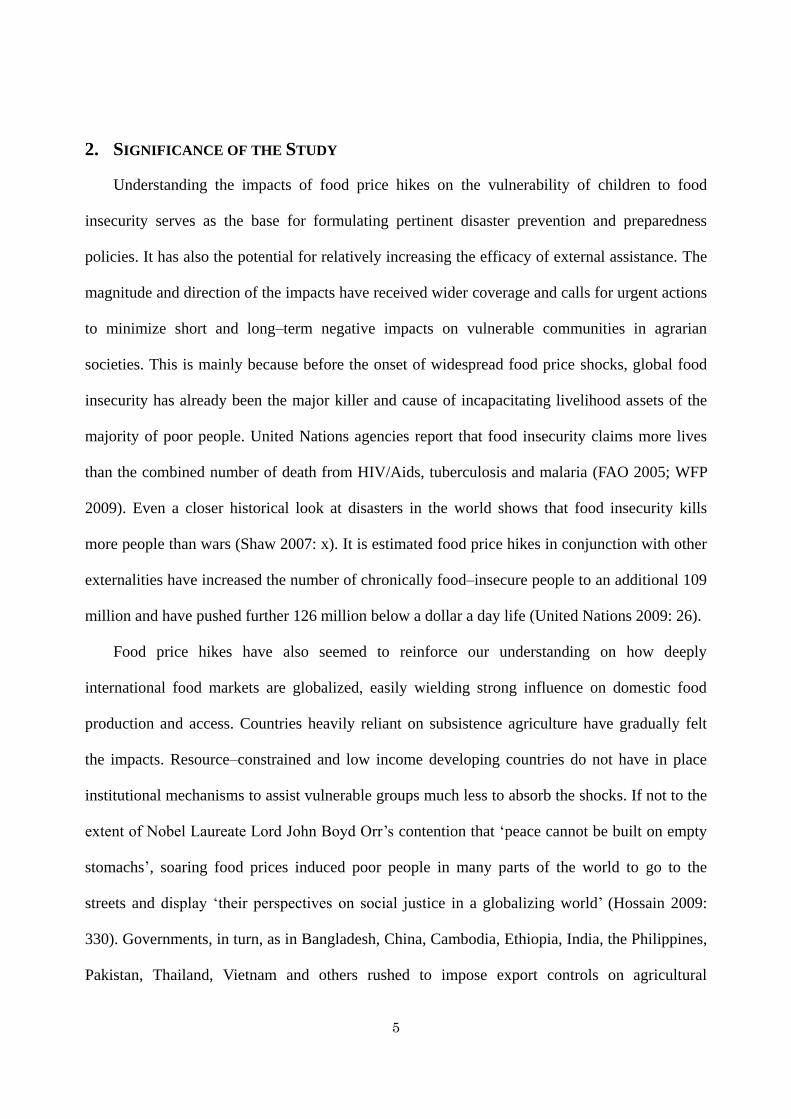
2. SIGNIFICANCE OF THE STUDY
Understanding the impacts of food price hikes on the vulnerability of children to food
insecurity serves as the base for formulating pertinent disaster prevention and preparedness
policies. It has also the potential for relatively increasing the efficacy of external assistance. The
magnitude and direction of the impacts have received wider coverage and calls for urgent actions
to minimize short and long–term negative impacts on vulnerable communities in agrarian
societies. This is mainly because before the onset of widespread food price shocks, global food
insecurity has already been the major killer and cause of incapacitating livelihood assets of the
majority of poor people. United Nations agencies report that food insecurity claims more lives
than the combined number of death from HIV/Aids, tuberculosis and malaria (FAO 2005; WFP
2009). Even a closer historical look at disasters in the world shows that food insecurity kills
more people than wars (Shaw 2007: x). It is estimated food price hikes in conjunction with other
externalities have increased the number of chronically food–insecure people to an additional 109
million and have pushed further 126 million below a dollar a day life (United Nations 2009: 26).
Food price hikes have also seemed to reinforce our understanding on how deeply
international food markets are globalized, easily wielding strong influence on domestic food
production and access. Countries heavily reliant on subsistence agriculture have gradually felt
the impacts. Resource–constrained and low income developing countries do not have in place
institutional mechanisms to assist vulnerable groups much less to absorb the shocks. If not to the
extent of Nobel Laureate Lord John Boyd Orr’s contention that ‘peace cannot be built on empty
stomachs’, soaring food prices induced poor people in many parts of the world to go to the
streets and display ‘their perspectives on social justice in a globalizing world’ (Hossain 2009:
330). Governments, in turn, as in Bangladesh, China, Cambodia, Ethiopia, India, the Philippines,
Pakistan, Thailand, Vietnam and others rushed to impose export controls on agricultural

6
commodities as well as other measures, which are evaluated by different stakeholders differently.
At the methodological level, food price instabilities have brought to the fore long–standing
debate on measurements of food security. The emphasis in most studies has been on household
food security measurement. This is derived mainly from neo–classical economics that takes the
household as a utility maximizing unit. The approach, however, blurs the degree of vulnerability
of individual members of a household. It is assumed that women and children, often taken as the
weakest members of households at least in traditional/patriarchal societies, are more vulnerable
and they seek and adopt higher and more frequent seasonal coping strategies.
The rest of this paper is organized as follows. Section three reviews the main causes
and stylized facts of the food price hikes. Section four presents the findings, and the last part is
the conclusion.
3. REVIEWING CAUSES OF FOOD PRICE HIKES
Described by the World Food Program (WFP) as the ‘silent tsunami’, the 2007/2008
food price hikes were precipitated and caused by a number of interdependent and mutually
reinforcing factors. In fact, soaring prices of food items had started quite well before their peak
during 2008. Global prices of rice, wheat, corn, coarse grains and oilseed doubled between 2005
and 2007. Current food price hikes were not fundamentally unique to some of the characteristics
of the food crisis in the 1970s. Financial and oil crises, drought, and population growth were part
of both periods. During the crisis in the 1970s the level of disaster prevention and recovery
among countries was not well developed, which was one reason for prolonging the instability.
The current food price hikes also challenged different countries to balance their trade, consumer
and producer–oriented policies in view of the problem. Any comparison between the two crises
in terms of price hikes should take into account deflation of the nominal prices and putting them

7
in constant terms of a base year. Yet, the food insecurity level, its inclusion of new factors, and
the complexity and speed of the impacts that transcend across most commodities make the
current crisis distinct. The underlying causes constitute falling food stocks and droughts,
speculation in forward and futures trade and devaluation of US dollar, increased use of grains for
feedstock and production of biofules, and consumption pattern changes in emerging economies.
Some of these factors are transitory while others are structural.
Fundamentally, the food entitlement decline (FED) approach contends that global food
problem is not essentially an issue of production, but the capability of enabling people to have
access to food (Sen 1981; Dreze and Sen 1989; Smith et al. 2000). Inefficient food distribution
systems have played a role in exacerbating food insecurity, even though there are indications that
regional imbalances in global food production have been at the center of the problem. During
late 1990s, food availability per capita increased and it contributed to an improvement in
aggregate food security. This was not steadfast and it was marked by volatilities and sharp price
falls due to the Asian financial crisis. In 2005 world grain reserves/stocks were at their lowest
fifty–four days (Holt-Giménez and Kenfield 2008: 3; also Headey and Fan 2008). In 2007/2008
the ratio of global cereal stocks to utilization was estimated to be the lowest at 19.4% (FAO
2008). Increasing world population, fragmentation of arable land, and water scarcity remain
arduous challenges to the capacity of global food production system (Rosegrant 2001; von Braun
2007). Major grain producers such as Australia, the US, the EU, Canada, Russia and Ukraine
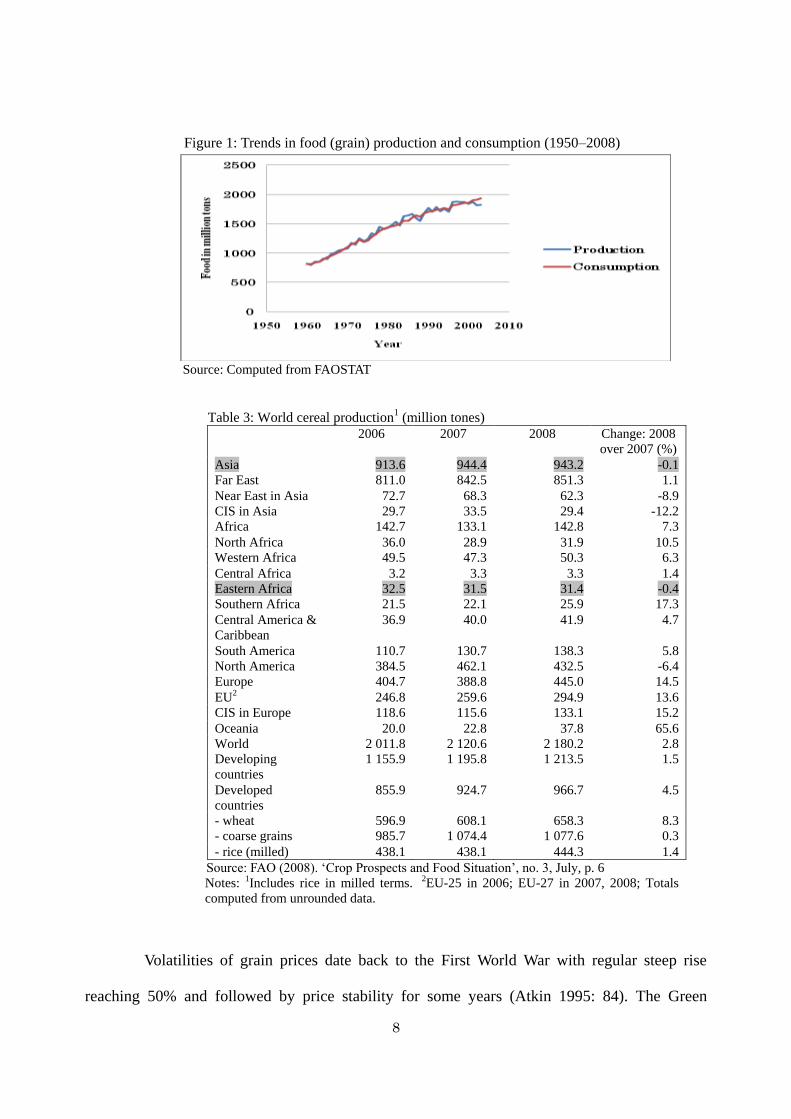
were hit by droughts, which led to stagnation of production and supply. As can been seen from
Table 3, cereal production both in Asia and East Africa (in particular) had negative percentage of
change in 2008 from 2007.
8
Figure 1: Trends in food (grain) production and consumption (1950–2008)
Source: Computed from FAOSTAT
Table 3: World cereal production1 (million tones)
2006 2007 2008
Change: 2008
over 2007 (%)
Asia 913.6 944.4 943.2 -0.1
Far East 811.0 842.5 851.3 1.1
Near East in Asia 72.7 68.3 62.3 -8.9
CIS in Asia 29.7 33.5 29.4 -12.2
Africa 142.7 133.1 142.8 7.3
North Africa 36.0 28.9 31.9 10.5
Western Africa 49.5 47.3 50.3 6.3
Central Africa 3.2 3.3 3.3 1.4
Eastern Africa 32.5 31.5 31.4 -0.4
Southern Africa 21.5 22.1 25.9 17.3
Central America &
Caribbean
36.9 40.0 41.9 4.7
South America 110.7 130.7 138.3 5.8
North America 384.5 462.1 432.5 -6.4
Europe 404.7 388.8 445.0 14.5
EU2 246.8 259.6 294.9 13.6
CIS in Europe 118.6 115.6 133.1 15.2
Oceania 20.0 22.8 37.8 65.6
World 2 011.8 2 120.6 2 180.2 2.8
Developing
countries
1 155.9 1 195.8 1 213.5 1.5
Developed
countries
855.9 924.7 966.7 4.5
- wheat 596.9 608.1 658.3 8.3
- coarse grains 985.7 1 074.4 1 077.6 0.3
- rice (milled) 438.1 438.1 444.3 1.4
Source: FAO (2008). ‘Crop Prospects and Food Situation’, no. 3, July, p. 6
Notes: 1Includes rice in milled terms. 2EU-25 in 2006; EU-27 in 2007, 2008; Totals
computed from unrounded data.
Volatilities of grain prices date back to the First World War with regular steep rise
reaching 50% and followed by price stability for some years (Atkin 1995: 84). The Green
9
Revolution contributed to price fall of grains despite unintended socio–economic consequences
and the failure to expand the results from Asia to Sub–Saharan Africa, a region where sixteen of
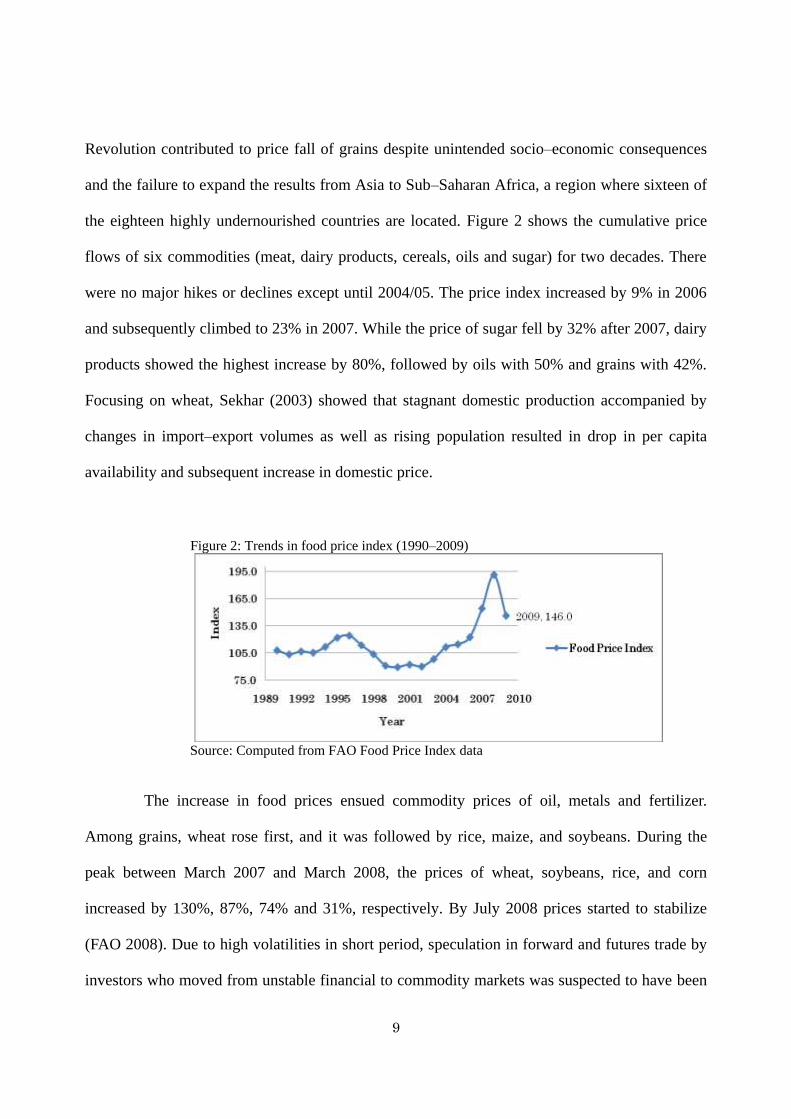
the eighteen highly undernourished countries are located. Figure 2 shows the cumulative price
flows of six commodities (meat, dairy products, cereals, oils and sugar) for two decades. There
were no major hikes or declines except until 2004/05. The price index increased by 9% in 2006
and subsequently climbed to 23% in 2007. While the price of sugar fell by 32% after 2007, dairy
products showed the highest increase by 80%, followed by oils with 50% and grains with 42%.
Focusing on wheat, Sekhar (2003) showed that stagnant domestic production accompanied by
changes in import–export volumes as well as rising population resulted in drop in per capita
availability and subsequent increase in domestic price.
Figure 2: Trends in food price index (1990–2009)
Source: Computed from FAO Food Price Index data
The increase in food prices ensued commodity prices of oil, metals and fertilizer.
Among grains, wheat rose first, and it was followed by rice, maize, and soybeans. During the
peak between March 2007 and March 2008, the prices of wheat, soybeans, rice, and corn
increased by 130%, 87%, 74% and 31%, respectively. By July 2008 prices started to stabilize
(FAO 2008). Due to high volatilities in short period, speculation in forward and futures trade by
investors who moved from unstable financial to commodity markets was suspected to have been
10
one cause. In the first quarter of 2008, it was estimated global grain futures and options rose by
32% from 2007 (UNCTAD 2008: 5; Mitchell 2008). The head of the U.N. Environment Program,
Achim Steiner, believed that markets and supplies were ‘influenced by perceptions of future
market [which was] distorting access to food’ (Associated Press 2008).
In addition, most central banks in developing countries pegged their currencies to the
US dollar. The spiral effects of food price hikes in these countries were therefore difficult to
avoid. Because of the increasing depreciation of the dollar for several months in real terms
before the peak of the food price hikes, the dollar values of global food grain rose more than the
price expressed in other currencies. These currencies lost their purchasing power more than the
dollar and they could accordingly buy less food items. It was estimated that the depreciation of
the US dollar from January 2002 to June 2008 increased food prices by about 20% with an
elasticity of 0.75 (Mitchell 2008).
Another factor raised as a cause for the food price hikes was using agricultural land to
produce biofuels and feedstock. Chiefly the US, Brazil and the EU encouraged biofuels from
food crops in a drive to lessen their dependency on oil from traditional petroleum exporting
countries. Whether decisions such as ‘turning the corn belt of America from the bread basket of
the world into an enormous fuel tank’ (Vidal 2007) were strongly connected to the food price
hikes has been the focus of the debate. The discussion took into account different regions with
varying degrees of resource and technological endowment (Rosegrant 2008; Koh and Ghazoul
2008; James et al. 2008). Economic models tested the trade–offs in terms of cost and efficiency
between using land to produce crops for fuel/feedstock and food (for calculations see Elobeid et
al. 2006; Schneider and McCarl 2003; Msangi et al. 2007; Elobeid and Tokgoz 2008). While oil
from crops is premised to possess potential sources of alternative energy, its caveats in terms of
displacing some crops for others, increased competition for water, and accelerating deforestation
11
are pointed out (Rosegrant et. al. 2008).
Concurrently, the changing consumption patterns of growing middle class population in
emerging economies from starchy foods to meat and dairy products was thought to have boosted
the demand for feed grains. Consumer purchases become less responsive to the prices of food
items. Economic growth in countries, such as China and India, as well as global population
growth shift from rural to urban areas, where in the next thirty years 61% of the world
population is estimated to live, have engendered demand (van Braun 2007: 1).
4. THE SURVEYS AND DISCUSSION OF FINDINGS
The study covered randomly selected 750 households. Household questionnaires suitable
to the nature and composition of rural households in the sub–districts were administered. Group
discussions with informants and meetings with a number of governmental and
non–governmental organization (NGOs) were held. A 24 hour observation for seven days was
made in selected households, and interviews were conducted with the chief executives and staff
of local governments. The survey in Bangladesh was conducted in the districts of Rangpur
(Gangachara), Manikganj (Saturia) and Bagerhat (Sharon Khola) while in Ethiopia it covered
South Wello (Kalu) and Eastern Tigray (Astbi Wonberta). The surveys were conducted at the
different peaks of the price hikes, and this helped in checking changes in the consumption
patterns of households. This study did not conduct clinical examinations of the health status of
households. Besides, longer time–framework is needed to understand the changes in a better
way for the post–food price hikes phases. This study did not also examine and compare
households’ food security levels before the food price hikes. The objective is to assess current
food security level based mainly on food price hikes and other determinants to estimate future
vulnerability to food insecurity.
12
The AHFSI was used to indicate current food security level of children in households in
the research sites based on assessing the impacts of the food price hikes. The AHFSI takes the
following form:
AHFSI= 100-[H {G + (1-G) IP} + 0.5 Ω {1-H [G-(1-G) IP]}] 100 (1)
H: head count of proportion of the total children undernourished
G: measure of extent of the food gap of the average undernourished households’ of
children shortfall in dietary energy supplies from national average requirements for
dietary energy
IP:
measure of inequality in the distribution of food gaps based on the Gini-coefficient.
Ω: the coefficient of variation in dietary energy supplies, which gives the probability of
facing temporary food shortage.
H was calculated based on the Body Mass Index (BMI) of children dividing the weight (W)
in kilograms by height (H) squared in meters (BMI = W/H2). From 150 households in each
district of Bangladesh, a total of 1,399 children participated in the study. Out of 495 children
40% (198) in Gangachara, out of 473 children 33.3% (157) in Saturia, and out of 431 children
37.3% (160) in Sharon Khola were found undernourished. A total sample of 225 households
each in Kalu (Southern Wello) and Atsbi Wenberta (Eastern Tigray) including 729 children
were part of the surveys. In Kalu, out of 390 children 40.44% (158) and out of 339 children in
Atsbi Wenberta 41.33% (139) were found undernourished. Both in Bangladesh and Ethiopia
the measurement excluded children who were breastfeeding. For pregnant or lactating women,
an allowance for extra calories needs was considered. Taking the total population to be equal to
one, then the undernourished population of children (the value of H) would be .40 in
Gangachara, .333 in Saturia, .373 in Sharon Khola, .4044 in Kalu and .4133 in Atsbi Wenberta.
Stunting and wasting of children were serious both within the undernourished and the
general sampled children. Stunting refers to proportion of children under five below minus 2
standard deviations (moderate) and minus 3 standard deviations (severe) from the median
13
height–for–age compared to a reference height for children of the same height. Wasting
indicates proportion of children under five below minus 2 standard deviations (moderate) and
minus 3 standard deviations (severe) from the median weight–for–height compared to a
reference weight for children of the same weight. The reference standards are developed by the
World Health Organization (WHO) and the US National Centre for Health Statistics (NCHS)
as well as data compiled by FAO. Figure 3 shows the variations in mean percentage stunting
(sever and moderate) as well as wasting (sever and moderate) in Bangladesh.
Food gap (value of G) was calculated based on the average of each household’s calories
intake. The average calorie intakes of 60 households in Gangachra, 50 households in Saturia
and 56 households in Sharon Khola was calculated, which were 1,400 Kcal, 1,464 Kcal and
1,443 Kcal, respectively. Rice was used for computing the calorie intakes since more than 80%
of the rural population consume rice. For example, husked or brown (only hulls removed) has
calorie value of 357, home–pounded under–milled, parboiled 359, and milled white rice 360
(measured in 100 grams edible portion). The average daily consumption is around 350. The gap
between the average requirement and the average availability was 34.02% in Gangachra, 31%
in Saturia and 32% in Sharon Khola. Taking the average requirement to be equal to one, the
gap would be 0.3402 (with 0.6598 availability), 0.31 (with 0.69 availability) and 0.32 (with
0.68 availability).
The calorie intakes of the undernourished sample of 91 households in Kalu and 93
households in Atsbi Wenberta were then calculated, which was 1,350 and 1,344 Kcal,
respectively, and these figures were well below the minimum which was between 1,660 and
1,680 Kcal from 1990 to 2005 (FAO 2008). Cereals were used for computing the calories. For
example, teff has the calorie value of 367 and gebs (barley) 361 (measured in 100 grams edible
portion). The gap between the average requirement and the average availability was computed
14
to be 750 for Kalu and 800 for Atsbi Wenberta, which was converted into percentage as
35.71% and 36%. Taking the average requirement to be equal to one, the gap would be 0.3571
(with availability of 0.6429) and 0.3809 (with availability of 6191), respectively.
The values of the Gini coefficient 0.40 for Gangachra, 0.43 for Saturia, 0.42 for Sharon
Khola, 0.41 for Kalu and 0.40 for Atsbi Wonberta were computed based on the average income
of the households from the surveys. The values of coefficient of variation (CV), which are
related to the probability of facing temporary food shortage, were 10 for Gangachra, 6 for
Saturia, 9 for Sharon Khola, 7 for Kalu and 8 for Atsbi Wonberta. These figures took into
account the dietary diversity score, asset ownership (land and cattle) and coping strategy index
so as to reflect the degree/probability that the villages in question would face transient food
shortage or stress.
Saturia had the highest level of food security (77.14%) followed by Sharon Khola
(69.96%) while Gangachara was the lowest (57.53%). Households in Saturia were hard hit
during the 1998 flood and the majority lost their land and assets. However, the strong social
network and income from remittance (from Saudi Arabia, Malaysia, and Singapore) helped
communities resuscitate their assets within a decade, and this has not been substantially
affected by the current financial crises (World Bank 2008: 6). The lower value in Sharon Khola
was also due to the 2007 cyclone Sidr that claimed more than 3,000 lives and washed away the
agricultural assets of many households. Recovery has been very slow with relief aid still
continuing for the third year while essential development interventions such as embankment
have been ignored or too expensive to implement. Gangachara, home to one of the largest
concentration of the ‘ultra–poor’ with landless households of the district’s 33,696 (35%), has
been prone to disaster from the Teesta river where as many as 5,000 landless households are
concentrated along the river shore. It is a place where greenery veils chronic food insecurity.
15
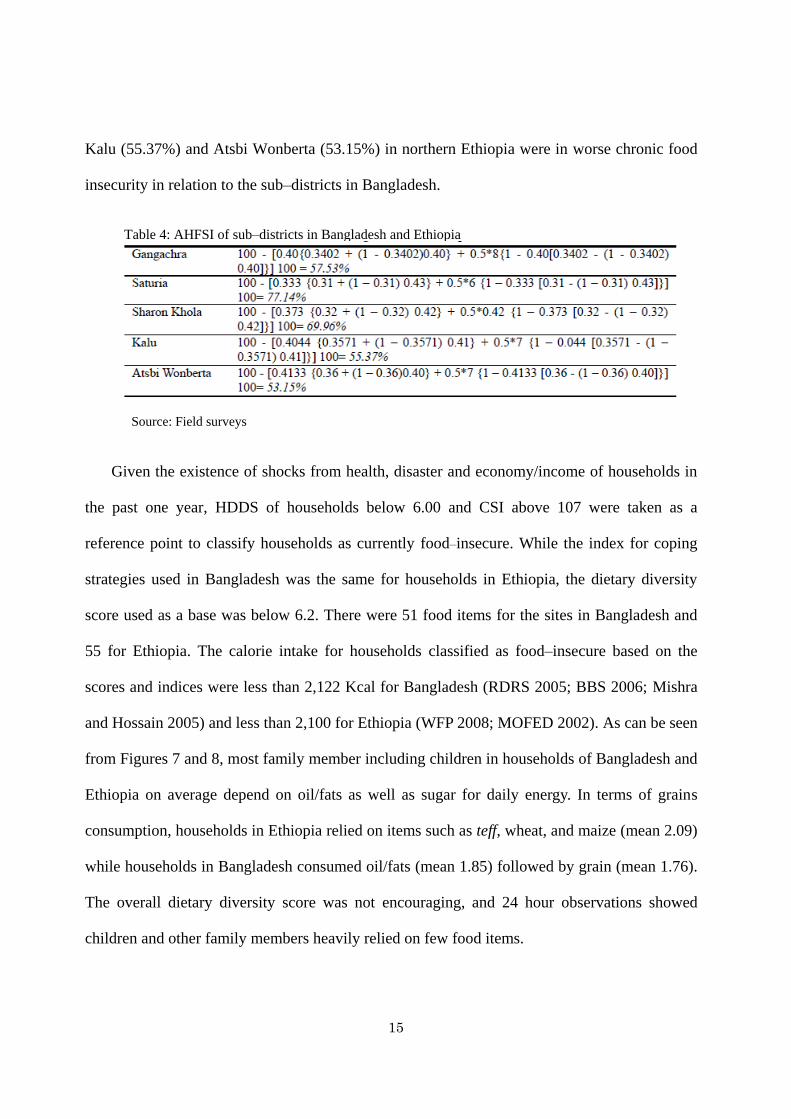
Kalu (55.37%) and Atsbi Wonberta (53.15%) in northern Ethiopia were in worse chronic food
insecurity in relation to the sub–districts in Bangladesh.
Table 4: AHFSI of sub–districts in Bangladesh and Ethiopia
Source: Field surveys
Given the existence of shocks from health, disaster and economy/income of households in
the past one year, HDDS of households below 6.00 and CSI above 107 were taken as a
reference point to classify households as currently food–insecure. While the index for coping
strategies used in Bangladesh was the same for households in Ethiopia, the dietary diversity
score used as a base was below 6.2. There were 51 food items for the sites in Bangladesh and
55 for Ethiopia. The calorie intake for households classified as food–insecure based on the
scores and indices were less than 2,122 Kcal for Bangladesh (RDRS 2005; BBS 2006; Mishra
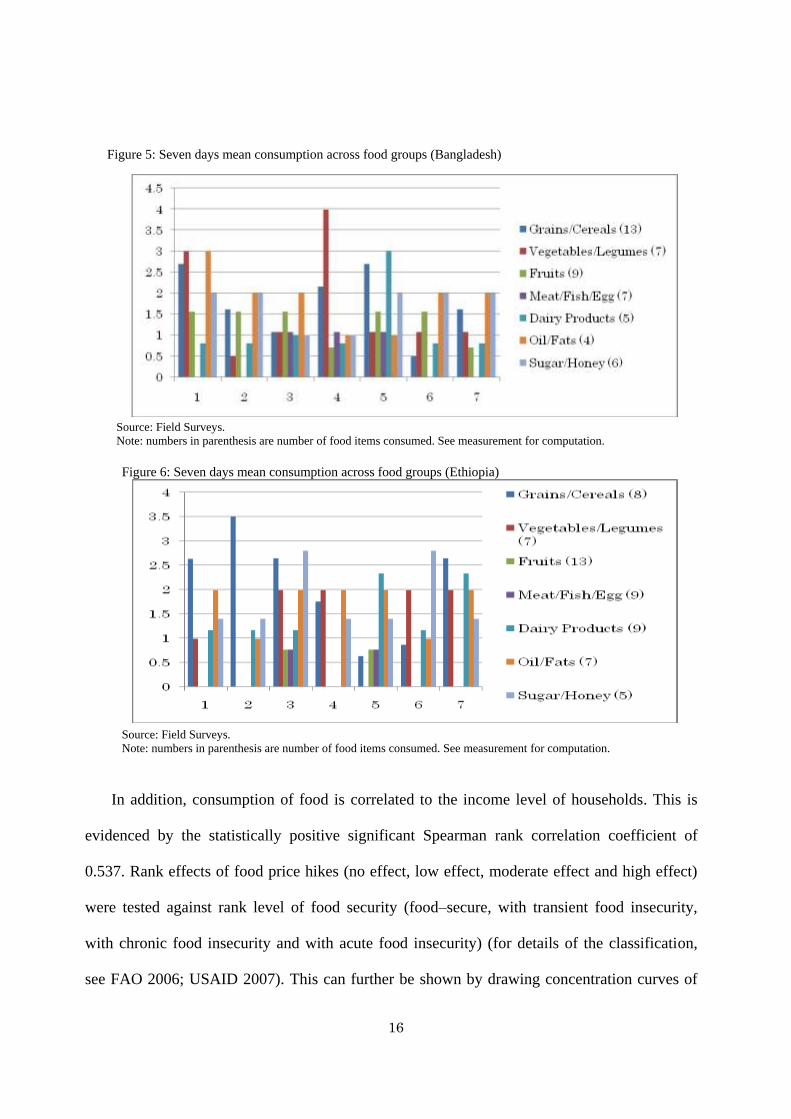
and Hossain 2005) and less than 2,100 for Ethiopia (WFP 2008; MOFED 2002). As can be seen
from Figures 7 and 8, most family member including children in households of Bangladesh and
Ethiopia on average depend on oil/fats as well as sugar for daily energy. In terms of grains
consumption, households in Ethiopia relied on items such as teff, wheat, and maize (mean 2.09)
while households in Bangladesh consumed oil/fats (mean 1.85) followed by grain (mean 1.76).
The overall dietary diversity score was not encouraging, and 24 hour observations showed
children and other family members heavily relied on few food items.
16
In addition, consumption of food is correlated to the income level of households. This is
evidenced by the statistically positive significant Spearman rank correlation coefficient of
0.537. Rank effects of food price hikes (no effect, low effect, moderate effect and high effect)
were tested against rank level of food security (food–secure, with transient food insecurity,
with chronic food insecurity and with acute food insecurity) (for details of the classification,
see FAO 2006; USAID 2007). This can further be shown by drawing concentration curves of
Source: Field Surveys.
Note: numbers in parenthesis are number of food items consumed. See measurement for computation.
Source: Field Surveys.
Note: numbers in parenthesis are number of food items consumed. See measurement for computation.
Figure 6: Seven days mean consumption across food groups (Ethiopia)
Figure 5: Seven days mean consumption across food groups (Bangladesh)
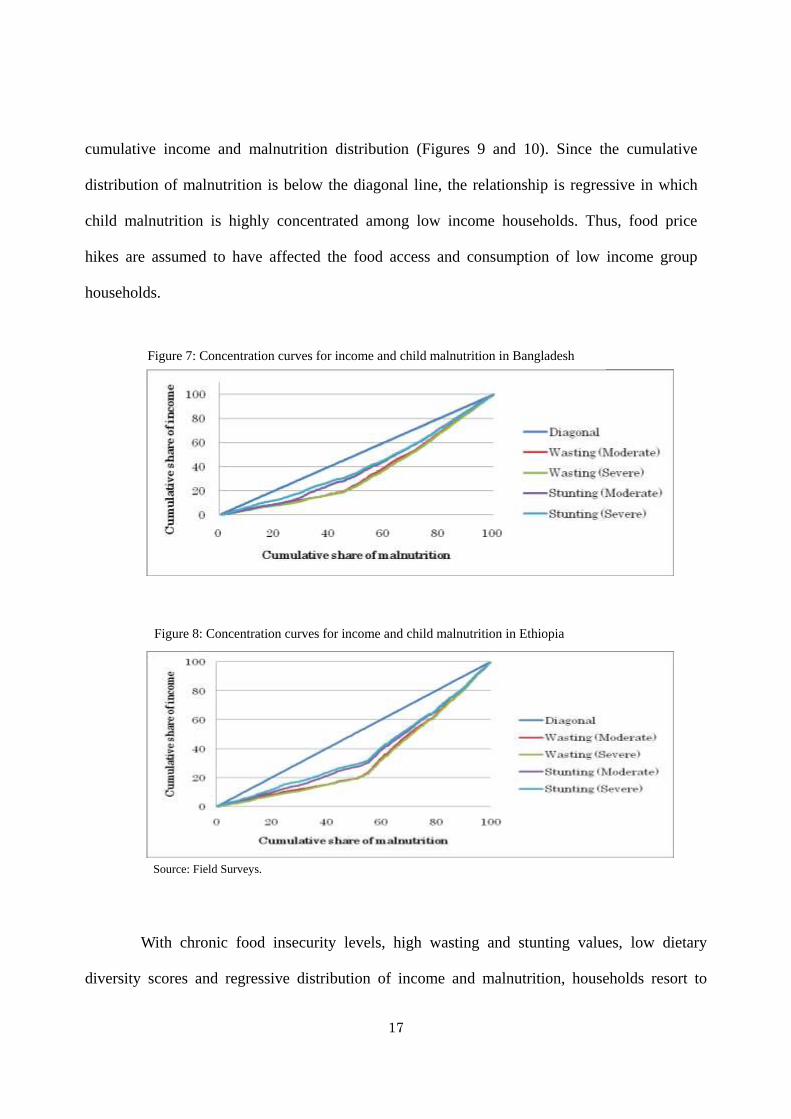
17
cumulative income and malnutrition distribution (Figures 9 and 10). Since the cumulative
distribution of malnutrition is below the diagonal line, the relationship is regressive in which
child malnutrition is highly concentrated among low income households. Thus, food price
hikes are assumed to have affected the food access and consumption of low income group
households.
Source: Field Surveys.
With chronic food insecurity levels, high wasting and stunting values, low dietary
diversity scores and regressive distribution of income and malnutrition, households resort to
Figure 7: Concentration curves for income and child malnutrition in Bangladesh
Figure 8: Concentration curves for income and child malnutrition in Ethiopia

18
different long–term and seasonal coping strategies. The mechanisms adopted enabled households
to offset stress, but they had negative impacts on nutritional status of vulnerable groups such as
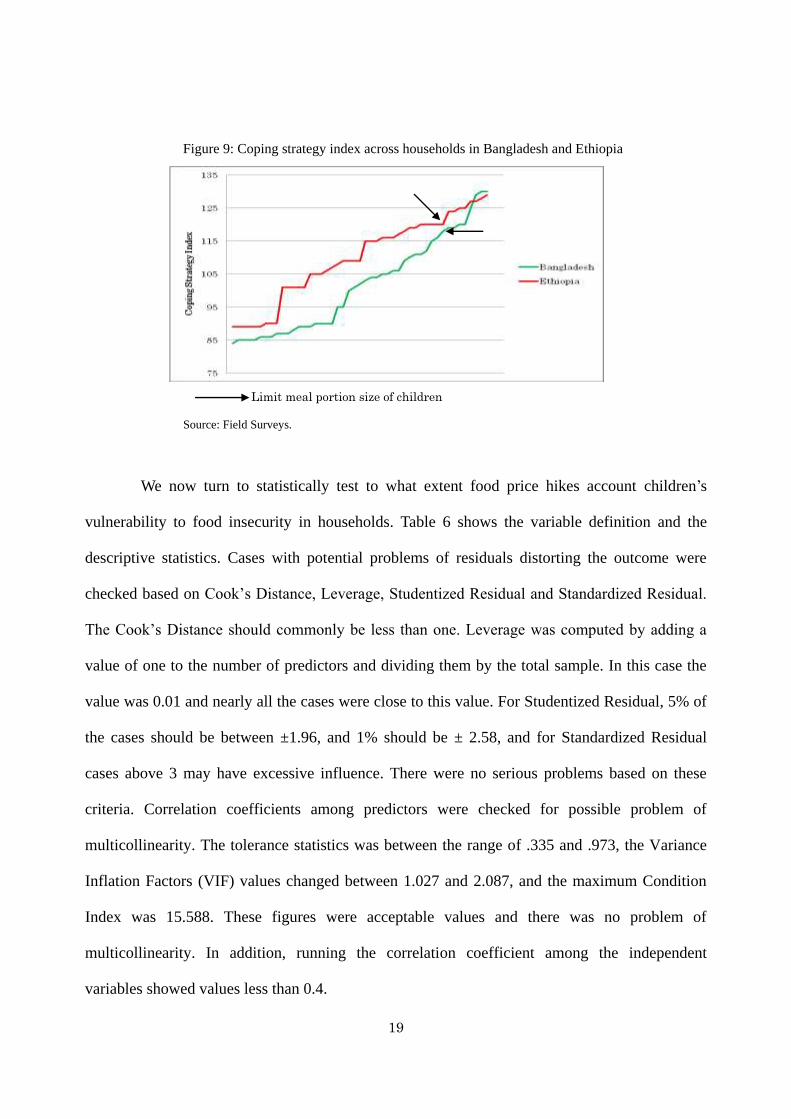
children. A list of eleven coping strategies was identified in the five sub–districts as shown in
Table 5. The CSI ranges from a minimum of 84 (indicting better food security level) to a
maximum of 130 (indicating a worse condition). At the peak of the food price hikes, the highest
seasonal coping strategies were adopted in all the research sites. Figure 9 points out the level at
which households adopt limiting meal portion size of their children.
Table 5: List of coping strategies and their rank by households
Rank Coping Strategy
1. Eat less preferred food
2. Reduce the number of meals per day
3. Borrow money from relatives to buy food and seek work in
urban or other rural areas (laborer, rickshaw puller)
4. Borrow food from relatives or neighbors
5. Gather or eat wild foods
6. Skip meal for the whole day by adult members of the household
7. Send children to eat with relatives or neighbors
8. Limit meal portion size of children
9. Consume seed stock kept for the next season
10. Skip meal by the entire family for the whole day
11. Begging
Source: Field surveys
19
Figure 9: Coping strategy index across households in Bangladesh and Ethiopia
Source: Field Surveys.
We now turn to statistically test to what extent food price hikes account children’s
vulnerability to food insecurity in households. Table 6 shows the variable definition and the
descriptive statistics. Cases with potential problems of residuals distorting the outcome were
checked based on Cook’s Distance, Leverage, Studentized Residual and Standardized Residual.
The Cook’s Distance should commonly be less than one. Leverage was computed by adding a
value of one to the number of predictors and dividing them by the total sample. In this case the
value was 0.01 and nearly all the cases were close to this value. For Studentized Residual, 5% of
the cases should be between ±1.96, and 1% should be ± 2.58, and for Standardized Residual
cases above 3 may have excessive influence. There were no serious problems based on these
criteria. Correlation coefficients among predictors were checked for possible problem of
multicollinearity. The tolerance statistics was between the range of .335 and .973, the Variance
Inflation Factors (VIF) values changed between 1.027 and 2.087, and the maximum Condition
Index was 15.588. These figures were acceptable values and there was no problem of
multicollinearity. In addition, running the correlation coefficient among the independent
variables showed values less than 0.4.
Limit meal portion size of children
20
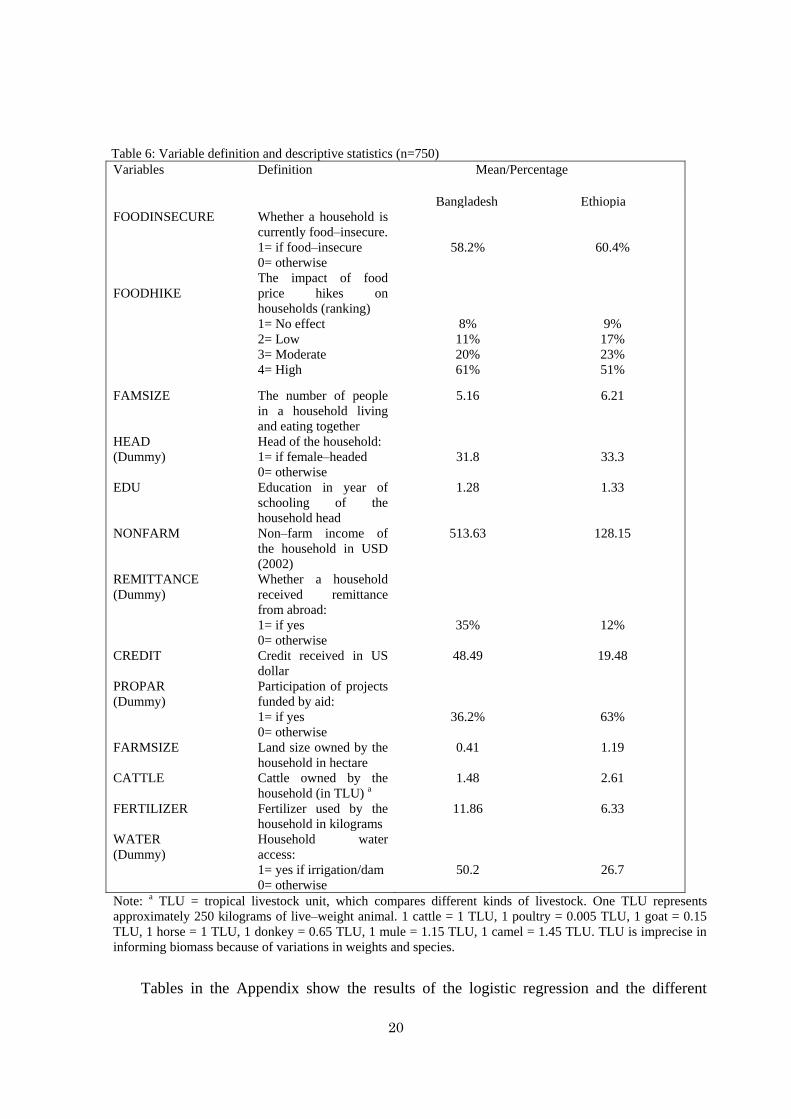
Table 6: Variable definition and descriptive statistics (n=750) Variables Definition Mean/Percentage
Bangladesh Ethiopia
FOODINSECURE
Whether a household is
currently food–insecure.
1= if food–insecure
0= otherwise
58.2%
60.4%
FOODHIKE
The impact of food
price hikes on
households (ranking)
1= No effect
2= Low
3= Moderate
4= High
8%
11%
20%
61%
9%
17%
23%
51%
FAMSIZE The number of people
in a household living
and eating together
5.16 6.21
HEAD
(Dummy)
Head of the household:
1= if female–headed
0= otherwise
31.8
33.3
EDU Education in year of
schooling of the
household head
1.28 1.33
NONFARM Non–farm income of
the household in USD
(2002)
513.63 128.15
REMITTANCE
(Dummy)
Whether a household
received remittance
from abroad:
1= if yes
0= otherwise
35%
12%
CREDIT Credit received in US
dollar
48.49 19.48
PROPAR
(Dummy)
Participation of projects
funded by aid:
1= if yes
0= otherwise
36.2%
63%
FARMSIZE Land size owned by the
household in hectare
0.41 1.19
CATTLE Cattle owned by the
household (in TLU) a
1.48 2.61
FERTILIZER Fertilizer used by the
household in kilograms
11.86 6.33
WATER
(Dummy)
Household water
access:
1= yes if irrigation/dam
0= otherwise
50.2
26.7
Note: a TLU = tropical livestock unit, which compares different kinds of livestock. One TLU represents
approximately 250 kilograms of live–weight animal. 1 cattle = 1 TLU, 1 poultry = 0.005 TLU, 1 goat = 0.15
TLU, 1 horse = 1 TLU, 1 donkey = 0.65 TLU, 1 mule = 1.15 TLU, 1 camel = 1.45 TLU. TLU is imprecise in
informing biomass because of variations in weights and species.
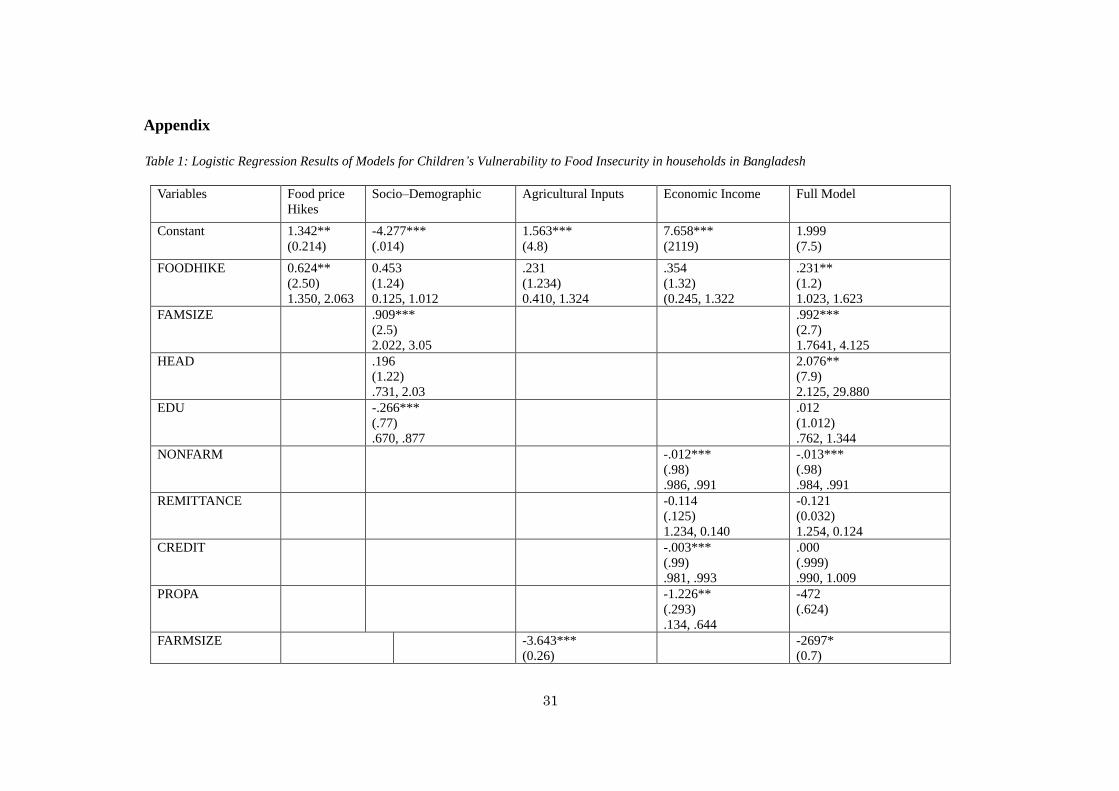
Tables in the Appendix show the results of the logistic regression and the different
21
models used to test the probability of children’ vulnerability to future food insecurity in
households. The estimates for the coefficients for the predictors in this model represented the
change in the logit of the outcome variable. An increase in the price of food was statistically
significant in accounting children’s vulnerability to food insecurity in households. The Wald
statistic (77.23) showed this predictor was significantly different from zero confirming it could
serve as a good estimator of the outcome. The value for Wald statistic, however, is not reported
because of the inaccuracy associated in inflating the standard error when the value of the
coefficients is large. Instead the exp b is reported, which is the change in odds due to the changes
in the independent variables. When the value of exp b is greater than one, it points out that with
an increase in the predictor the odds vulnerability to food insecurity increase. On the other hand,
a value less than one reveals when the predictor increases, the odds of vulnerability to food
insecurity decrease. Thus, an increase in food price by one US dollar would have the probability
of decreasing the HDDS and increasing the CIS of a household by 2.5 in Bangladesh and 1.28 in
Ethiopia. The value for the confidence interval for this predictor was greater one. This increased
the confidence that the values for the exp b in the population would fall within the ranges.
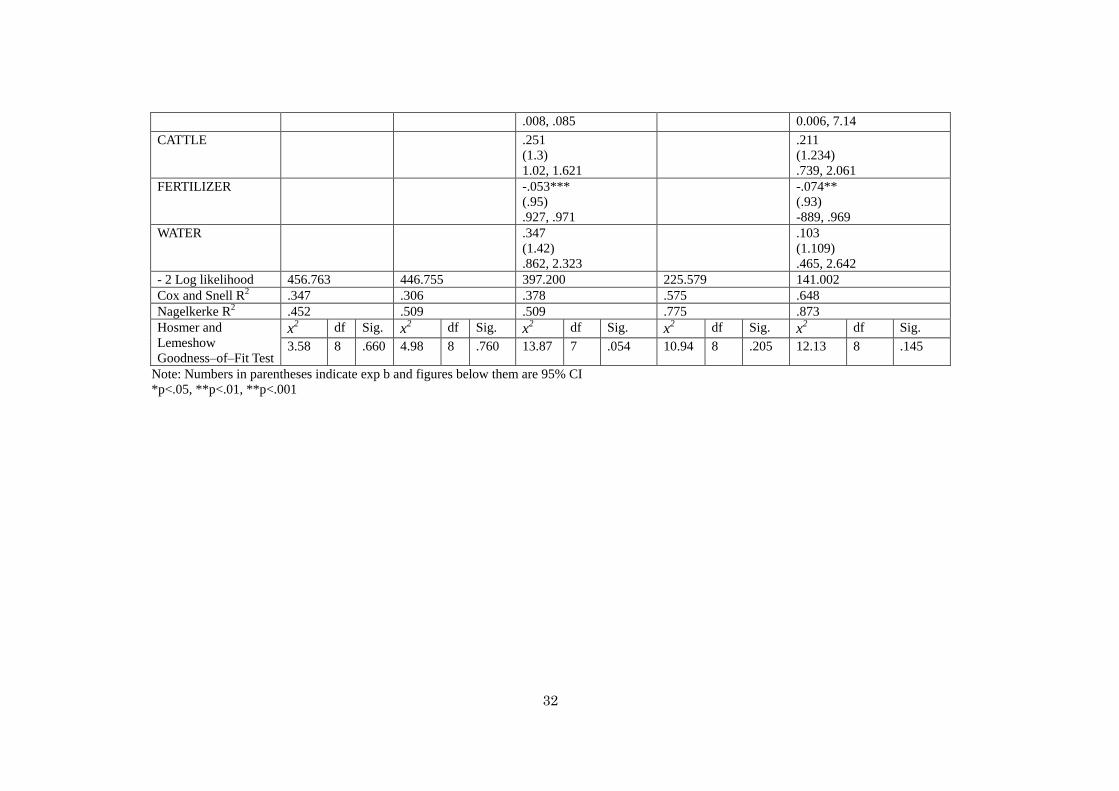
The -2 Log likelihood of using food price increase shows the strength or accuracy of the
variable in predicting outcome in vulnerability to food insecurity. In other words, its value
should be less than when only the constant is employed in the regression. The value in the
constant indicated 620.923 for Bangladesh and 615.032 for Ethiopia. It declined to 456.763 for
Bangladesh and 458.16 for Ethiopia, attesting this predictor was much better when the
significant variable of food price was included. The Hosmer and Lemeshow Goodness–of–Fit
Test is used to test the hypothesis that the observed data of children’s vulnerability to food
insecurity in households are significantly different from the predicted values. The
non–significance value of .660 in Bangladesh and .441 in Ethiopia suggested the model
22
predicted actual data well. The overall model accounted 21% in Bangladesh and 23% in Ethiopia
of the variances in children’s vulnerability to food insecurity in households, which indicated that
more than 79% in Bangladesh and 77% in Ethiopia of children’s vulnerability to food insecurity
in households were not explained by food price hikes.
In the socio–demographic model, family size, education and household head were used.
Only education and family size were found to be significant in accounting for changes in
children’s vulnerability to food insecurity in households both in Bangladesh and Ethiopia.
Controlling for other variables, an increase in the family size by one person would have the
probability of decreasing the HDDS and increasing the CIS of a household by 2.5 in Bangladesh
and 1.28 in Ethiopia. An increase in education by one year of schooling would have the
probability of increasing the HDDS and decreasing the CSI of a household by .77 in Bangladesh
and .488 in Ethiopia, when other variables were controlled. The non–significance value of .760
in Bangladesh and .537 in Ethiopia supported the model predicted actual data well. The overall
model accounted 27% in Bangladesh and 26% in Ethiopia of the variances in children’s
vulnerability to food insecurity in households, which suggested that more than 73% in
Bangladesh and 74% in Ethiopia of children’s vulnerability to food insecurity in households
were not explained.
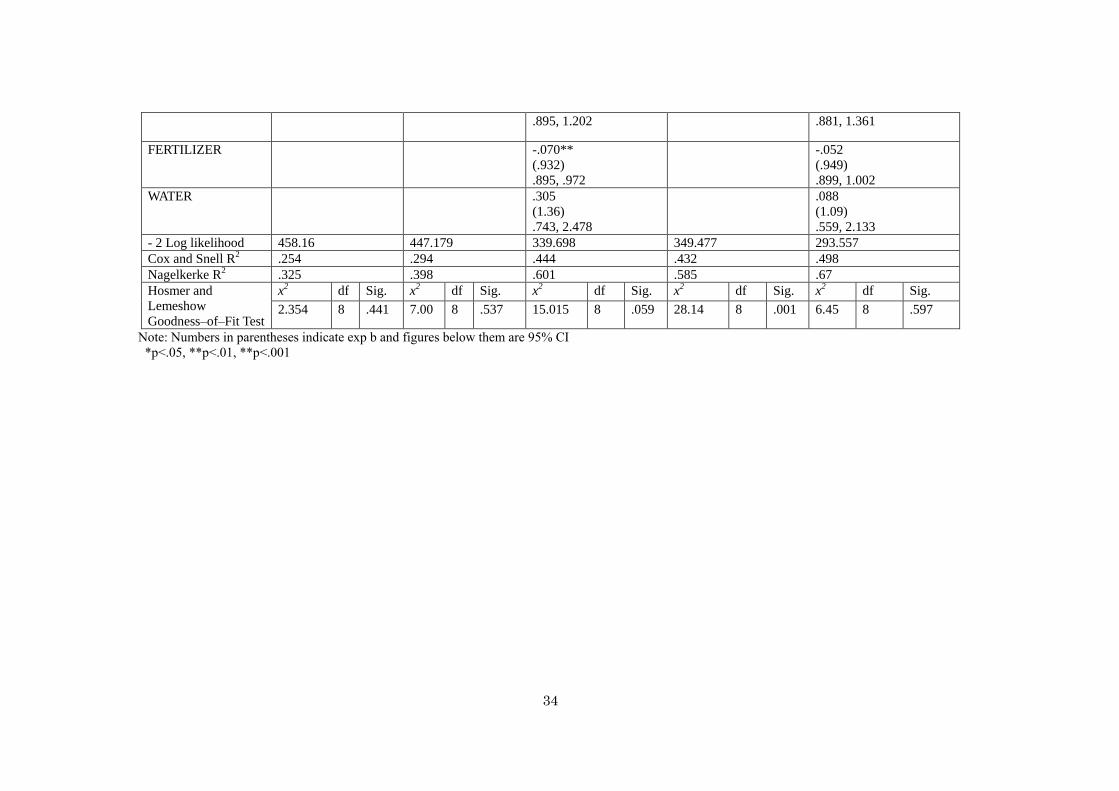
The third model included factors in agricultural inputs of farm size measured in hectares,
cattle (oxen and cows) measured in TLU, fertilizer use in kilograms and water availability
constituting irrigation/dam. Only farm size and fertilizer use were found to be statistically
significant in predicting the probability of children’s vulnerability to food insecurity in
households both in Bangladesh and Ethiopia. Controlling for other variables, an increase in one
hectare of land holding would have the likelihood of increasing the HDDS and decreasing the
CSI of a children’s vulnerability to food insecurity by .26 in households in Bangladesh and
23
by .11 in Ethiopia. Using one kilogram of fertilizer would have the probability of increasing the
HDDS and decreasing the CSI of children’s vulnerability to food insecurity by .95 in households
in Bangladesh and .932 in Ethiopia. The values for the confidence interval for the two predictors
were less than one, which increased the confidence that the values for the exp b in the population
would fall within these ranges. Cattle ownership and water access, contrary to the expectation of
this study, were not found to be statistically significant. When compared to the model with only
the constant which was 58.4% in Bangladesh and 60.4% in Ethiopia, the agricultural input model
improved the general accuracy of the model to 80.4% in Bangladesh and 84% in Ethiopia. This
was better than both food price hikes variable and the socio–demographic model. However, the
Hosmer and Lemeshow Goodness–of–Fit Test showed non–significance value of .054 in
Bangladesh and .59 in Ethiopia, which barely predict actual data well.
The fourth model consisted economic/income factors such as remittance, non–farm
income, credit and project participation or aid receipt. All these predictors except remittance
were found to be statistically significant in explaining children’s vulnerability to food insecurity
in households. Holding other variables constant, earning a dollar as non–farm income would
have the probability of increasing the HDDS and decreasing the CSI of children’s vulnerability
to food insecurity by .98 in households in Bangladesh and .97 in Ethiopia. Besides, earning a
dollar as credit would have the likelihood of increasing the HDDS and decreasing the CSI of
children’s vulnerability to food insecurity by .99 in households in Bangladesh and Ethiopia. If a
member of a household participated in a project or received aid, it would have the probability of
increasing the HDDS and decreasing the CSI of children’s vulnerability to food insecurity by .20
in households in Bangladesh and by .22 in Ethiopia. This model accounted for 63% of the
variance in children’s vulnerability to food insecurity in households. However, the Hosmer and
Lemeshow Goodness–of–Fit Test for Ethiopia was very significant (p<.05) and the model lacked
24
accuracy/stability in predicting actual data.
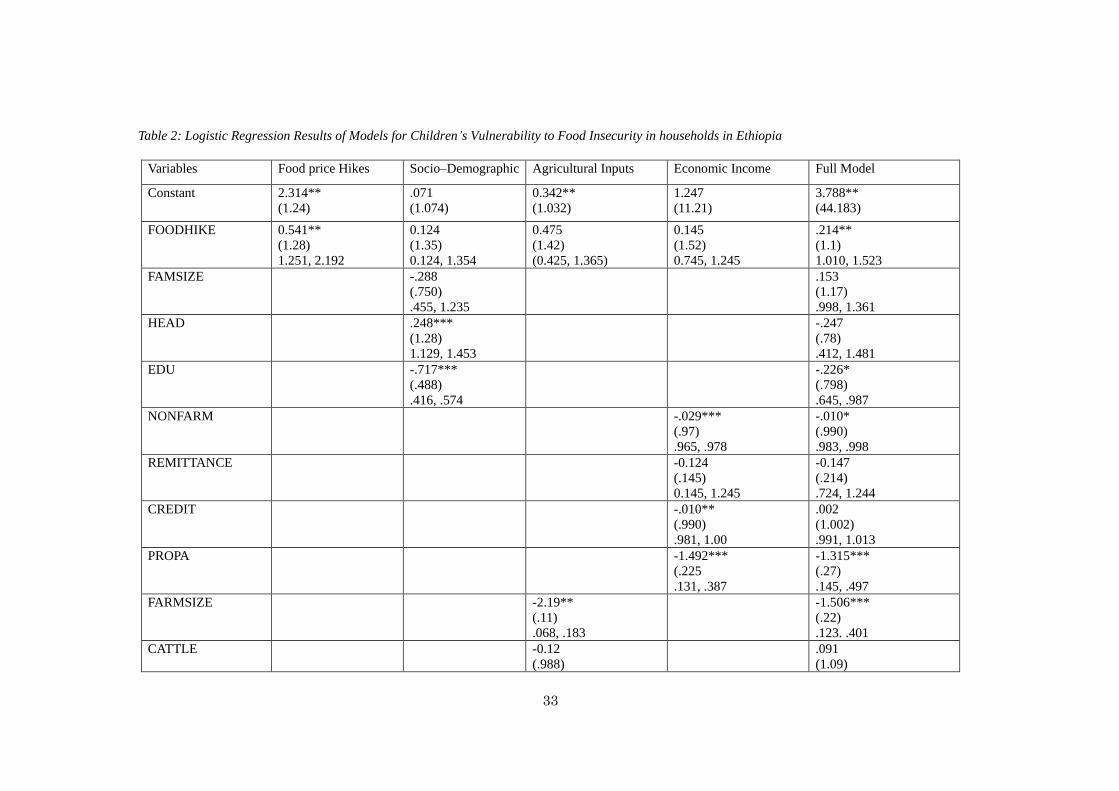
Finally the full model included all the variables that were statistically significant in
predicting vulnerability of children to food insecurity in households. The forward stepwise
(likelihood ratio) method was employed, which included the constant and it added predictors into
the model on the basis of the score statistics (cut–off .05). Seven predictors (food price hikes,
household head, family size, farm size, non–farm income and fertilizer) in Bangladesh and five
predictors (food price hikes, education, farm size, non–farm income and project participation/aid
receipt) in Ethiopia were statistically significant in accounting changes in the odds of children’s
vulnerability to food insecurity in households. Controlling other variables, female–headed
households in Bangladesh would experience the likelihood of losing in HDDS and increasing in
CSI by 8 compared to male–headed households, which is a very high figure. However, looking
at the 95% CI indicated that the ranges were very wide, and the mean of the sample might not be
a good representative of the ‘true’ mean in the population. To draw a conclusion that if a
female–headed household with HDDS of 5 would have zero score (a state of no eating any food
by the household) would be misleading. Thus, this predictor tends to be unreliable.
An increase in food price by dollar would have the probability of decreasing the HDDS
and increasing the CSI of households by 1.2 in Bangladesh and 1.1 in Ethiopia. An increase by
one person of family size would have the probability of decreasing the HDDS and increasing the
CSI of households by 2.7, while using an additional one kilogram of fertilizer would have the
likelihood of increasing the HDDS and decreasing the CSI of households by .93. Owning an
extra one hectare of land would have the probability of increasing the HDDS and decreasing the
CSI by .07 in Bangladesh and by .22 in Ethiopia. Earning an extra one dollar as a non–farm
income would have the likelihood of increasing the HDDS and decreasing the CSI of households
by .98 in Bangladesh and .99 in Ethiopia. An increase of schooling by one year would have the
25
probability of increasing the HDDS and decreasing the CSI of households’ vulnerability by .789
while a household’s participation in projects or receipt of aid would have the likelihood of
increasing the HDDS and decreasing the CSI by .269 in Ethiopia. This model was able to
account for 76% of the variation of children’s vulnerability to food insecurity in households with
Hosmer and Lemeshow Goodness–of–Fit Test value of .084. The model for Ethiopia accounted
for 50.6% of the variation of households’ vulnerability to food insecurity. The Hosmer and
Lemeshow Goodness–of–Fit Test value was non–significant (.410). The variables not in the
equation table for the models both in Bangladesh and Ethiopia showed that predictors not
included were all non–significant, which indicated their coefficients were significantly different
from zero. The model if term removed output also showed all the significant predictors would
have affected the accuracy and reliability of the models’ prediction had they been removed.
5. CONCLUSION
It was shown that food price hikes, alone or in combination with other variables,
accounted predicting the probability of children’s vulnerability to food insecurity in households.
It is perhaps plausible to take the food price hikes of 2007/2008 as one manifestation of the
greater and deeper problem of food insecurity. As von Braun (2009: 9) suggests, the issue is an
indication of ‘long–term failures in the functioning of the world food system’. Different actors
and policy makers have explored various ways of tackling the problem even though specific
measures are yet to be discussed and considered in earnest. This is especially true given the
scope and seriousness of the problem in low income agrarian societies such as Bangladesh and
Ethiopia, where malnutrition and child mortality are one of the highest. Addressing the problem,
thus, is linked to laying the ground for physically capable, healthy and mentally fit children for
the future of these countries.
Most family member including children in households of Bangladesh and Ethiopia on
26
average depended on oil/fats as well as sugar for daily energy. In terms of grains consumption,
households in Ethiopia relied on items such as teff, wheat, and maize (mean 2.09) while
households in Bangladesh consumed oil/fats (mean 1.85) followed by grain (mean 1.76). The
overall dietary diversity score was not encouraging, and 24 hour observations showed children
and other family members heavily relied on few food items.
In addition, consumption of food was correlated to the income level of households. This
was evidenced by the statistically positive significant Spearman rank correlation coefficient of
0.537. Rank effects of food price hikes (no effect, low effect, moderate effect and high effect)
were tested against rank level of food security (food–secure, with transient food insecurity, with
chronic food insecurity and with acute food insecurity). At the peak of the food price hikes, the
highest seasonal coping strategies were adopted in all the research sites. Statistically, it was
shown that controlling for other variables, an increase in food price by dollar would have the
probability of decreasing the HDDS and increasing the CSI of households by 1.2 in Bangladesh
and 1.1 in Ethiopia.
References
Ahmed, A., Zohir, Kumar, S. and Chowdhury, O. (1995). Bangladesh's Food-for-Work Program and Alternatives to
Improve Food Security. In J. von Braun (Ed.), Employment for Poverty Reduction and Food Security.
International Food Policy Research Institute, Washington, D.C.
Alemayehu, G., Shimlesse, A., Chanyalewu, D. and Arowolo, O. (2004). A Synthesis of Millennium Development
Goals (MDGs) Need Assessment for Ethiopia. Background paper for UNDP-MOFED.
Ali, A. and Niehof, A. (2007). Changing Gender Roles in Household Food Security and Rural Livelihoods in
Bangladesh. In R. Ruben, J. Pender, and A. Kuyvenhoven (Eds.), Sustainable Poverty Reduction in
Less–Favoured Areas. CAB International.
Ali, S. (1995). Population Pressure, Environmental Constraints and Agricultural Changes in Bangladesh: Examples
from three Agro Ecosystems. Agriculture, Ecosystems and Environment, 55, 95–109.
Arimond, M. and Ruel, M. (2004). Dietary Diversity is Associated with Child Nutritional Status: Evidence from 11
Demographic and Health Surveys. Journal of Nutrition, 134, 2579-2585.
Associated Press. (2008). U.N. officials blame market speculation for recent food price jump. Deseret News.
Associated Press. Retrieved from http://deseretnews.com/article/1,5143,695274565,00.html.
Atkin, M. (1995). The international Grain Trade. Woodhead Publishing.
Banerjee, L. (2007). Effect of Flood on Agricultural Wages in Bangladesh: An Empirical Analysis. World
Development, 35, 11, 1989-2009.
Barrett, B. and Maxwell, D.. (2006). Towards a Global Food Aid Compact. Food Policy, 31 (2), 105-118.
27
Bashaw, Z. (2004). Trajectories of Women, Environmental Degradation and Scarcity: Examining Access to and
Control over Resources in Ethiopia. In E. Annan-yao and Z. Bashaw (Eds.), Gender, Economies and
Entitlements in Africa. CODESRIA.
Behrman, Jere and Wolfe, B. (1984). Determinants of Dietary Quality: Evidence from Bangladesh. Journal of
Development Economics, 14, 1.
Bezu, S. and Holden, S. (2008). Can Food-for-Work Encourage Agricultural Production? Food Policy, 33 (6),
541-549.
Bhalla, S. and Roy, P. (1988). Misspecification in Farm Productivity Analysis: The Role of Land Quality. Oxford
Economic Papers, 40, 55-73.
Braun, J von. (2007). The World Food Situation: New Driving Forces and Required Actions. International Food
Policy Institute (IFPRI).
____________. (2009). Addressing the Food crisis: Governance, Market Functioning, and Investment in Public
Goods. Food Security, 1 (1), 9–5.
Chaudhury, R.H. (1984). Determinants of Dietary Intake and Dietary Adequacy for Pre-school Children in
Bangladesh. Food Nutrition Bulletin, 6 (4), 24-33.
Christiaensen, L. and Alderman, H. (2004). Child Malnutrition in Ethiopia: Can Maternal Knowledge Augment the
Role of Income? Economic Development and Cultural Change, 52 (2), 287-312.
Debdulal, M. and Mohammad, R. (2008). Are the Female Headed Households More Food Insecure? Evidence from
Bangladesh. Deakin University, Faculty of Business and Law, School of Accounting, Economics and Finance
/ Economics Series.
Desai, G. (1987). Policy Issues for Long Term Growth. (In Bruce Stone (Ed.), Fertilizer Pricing Policy in
Bangladesh. International Food Policy Research Institute, Bangladesh Institute of Development Studies.
Washington, D.C.
Deshingkar, P and Johnson, C. (2003). State Transfers and to the Poor and Back: the case of the food for work
program in Andhra Pradesh. Overseas Development Institute Working Paper, 222, ODI, London.
Elobeid, A., Tokgoz, S., Hayes, S., Babcock, B. and Hart, C. (2006). The Long-Run Impact of Corn-Based
Ethanol on the Grain, Oilseed, and Livestock Sectors: A Preliminary Assessment. Briefing Paper 06-BP 49,
Center for Agricultural and Rural Development, Iowa State University.
Food and Agriculture Organization. (2005). The State of Food Insecurity in the World, Rome.
____________(2008a). Food Outlook, available at http://www.fao.org/docrep/010/ai466e/ai466e00.HTM.
___________ (2008b). Crop Prospects and Food Situation, 3, 6.
___________.(2008c). Crop Prospects and Food Situation, available at
http://www.fao.org/docrep/010/ai465e/ai465e01.htm.
___________. (2008d). The State of Food Insecurity in the World 2008: Biofeuls: Prospects, Risks and
Opportunities. Rome.
Frongillo, E., Chowdhury, N. Ekström, E. and Naved, R. (2003). Understanding the Experience of Household Food
Insecurity in Rural Bangladesh Leads to a Measure Different from That Used in Other Countries. Journal of
Nutrition, 133, 4158–62.
Forsyth, B. Horwitz, S., Leventhal, S., Bruger, J., and Leaf, P. (1996). The Child Vulnerability Scale: An Instrument
to Measure Parental Perceptions of Child Vulnerability, Journal of Pediatric Psychology, 21(1), 89-101.
Guha-Khasnobis, B. and Hazarika, G. (2007). Household Access to Microcredit and Children’s Food Security in
Rural Malawi: A Gender Perspective. Working Papers UNU-WIDER Research Paper, World Institute for
Development Economic Research.
Gulati, A. (2001). The Future of Agriculture in South Asia: Whither the Small Farms? Proceedings of the
International Conference on Sustainable Food Security for all by 2020. German Technical Cooperation
(GTZ), Bone.
Hatloy, A., Torheim, L. and Oshaug, A. (1998). Food Variety - A Good Indicator of Nutritional Adequacy of the
Diet? A Case Study from an Urban Area in Mali, West Africa. European Journal of Nutrition, 52, 891–898.
Headey, D. and Fan, S. (2008). Anatomy of a Crisis: The Causes and Consequences of Surging Food Prices.
Agricultural Economics, 39, 375–391.
Hoddinott, J. and Yohannes, Y. (2002). Dietary Diversity as a Food Security Indicator. International Food Policy
Research Institute, Washington, DC., USA.
Holden, S., Shiferaw, B. and Pender, J. (2004). Non–farm Income, Household Welfare, and Sustainable Land
Management in a Less-Favoured Area in the Ethiopian Highlands. Food Policy, 29 (4), 369–92.
Holt-Giménez, E. and Kenfield, I. (2007). When ‘Renewable Isn’t Sustainable, Agrofuels and the Inconvenient
Truths Behind the 2007 U.S. Energy Independence and Security Act. Policy Brief, 13.
Holt, J. (1983). Ethiopia: Food-for-Work or Food–for–Relief. Food Policy, 8 (3),187–201.
28
Hossain, M. (1988). Nature and Impact of the Green Revolution in Bangladesh. International Food Policy Research
Institute, Bangladesh Institute of Development Studies. Washington, D.C.
Hossain, M., Naher, F. and Shahabuddin, Q. (2005). Food Security and Nutrition in Bangladesh: Progress and
Determinants. Journal of Agricultural and Development Economics, 2 (2),103–13.
Hossain, N. (2009). Reading Political Responses to Food, Fuel and Financial Crises: The return of the moral
economy? Development, 52, 3.
International Monetary Fund. (2009). Request for a 14-Month Arrangement under the Exogenous Shocks Facility.
IMF Country Report No. 09/296. http://www.imf.org/external/pubs/ft/scr/2009/cr09296.pdf.
Islam, M. (1993). Female-Headed Households in Rural Bangladesh: A Survey. In Joan P. Mencher and Anne
Okongwu (Eds.), Where Did All; the Men Go? Westview Press.
Islam, M. T. and Omori, K. (2004). Inequality, Poverty and Agriculture in Rural Bangladesh: Perspective from a
Village Study. Japanese Journal of Farm Management, 42 (3), 24–36.
Islam, M.A., Rahman, M. and Mahalanabis, D. (1994). Maternal and Socioeconomic Factors and the Risk of Severe
Malnutrition in a Child: A Case-control Study. European Journal of Clinical Nutrition, 48, 416-424.
James, W. E., Jha, S., Sumulong, L., Son, H.H., Hasan, R., Khan, M.E., Sugiyarto, G., Zhai, F. (2008). Food Prices
and Inflation in Developing Asia: Is Poverty Reduction Coming to an End? Asian Development Bank, Manila,
Philippines.
Kaluski, D., Ophir, E. and Amede, T. (2002). Food Security and Nutrition-The Ethiopian Case for Action. Public
Health Nutrition, 5, 373-381
Kidane, H., Alemu, Z. and Kundhlande, G. (2005). Causes of Household Food Insecurity in Koredegaga Peasant
Association, Oromiya Zone, Ethiopia. Agrekon Agricultural Economics Association of South Africa
(AEASA), 44, 4.
Kimhi, A. (2004). Gender and Intrahousehold Food Allocation in Southern Ethiopia. The Hebrew University of
Jerusalem, the Centre for Agricultural Economic Research Discussion Paper No. 9.04.
Kiros, G.-E., and Hogan, S. (2000). The Impact of Famine, War, and Environmental Degradation on Infant and Early
Child Mortality in Africa: The Case of Tigray, Ethiopia. Genus, 3–4, 145–178.
Koh, L. and Ghazoul, J. (2008). Biofuels, Biodiversity, and People: Understanding the Conflicts and Finding
Opportunities. Biological Conservation, 141 (10), 2450–2460.
Mahjabeen, R. (2008). Micro Financing in Bangladesh: Impact on Households, Consumption and Welfare. Journal
of Policy Modelling, 30 ( 6), 1083–092.
Mandleco, B. H.. (2003). Growth and Development Handbook: Newborn through Adolescence. Delmar Cengage
Learning.
Manos, B., Begum, M., Anjuman, A., Kamruzzaman, M. Nakou, I. and Papathanasiou, J. (2007). Fertilizer Price
Policy, the Environment and Farmers behaviour. Journal of Policy Modelling, 29 (1), 87–97.
Maxwell, S. and Frankenberger, T. (1992). Household Food Security Concepts, Indicators, and Measurements. New
York, USA: UNICEF.
McArthur, J. M., Ravenscroft, P. Safiulla, S. and Thirlwall, M. F. (2001). Arsenic in Groundwater: Testing Pollution
Mechanisms for Sedimentary Aquifers in Bangladesh. Water Resource Research 37 (1), 109–117.
Ministry of Finance and Economic Development (MFED), Federal Democratic Republic of Ethiopia/United Nations
Country Team (UNCT). (2002). Millennium Development Goals Report: Challenges and Prospects for
Ethiopia. Addis Ababa, Ethiopia.
Mitchell, D. (2008). A Note on Rising Food Prices, Policy Research Working Paper 4682, World Bank.
Mulat, D. (1999). The Challenge of Increasing Food Production in Ethiopia. In G. Alemayehu and N. Berhanu
(Eds.), The Ethiopian Economy: Performance and Evaluation, Proceedings of the Eighth Annual Conference
on the Ethiopian Economy Ethiopia.
Murphy, P. and Allen, H. (2003). Nutritional Importance of Animal Source Foods. Journal of Nutrition, 133,
3932S–3935S.
Nicholson, C., Thornton, P. and Muinga, R. (2004). Household–Level Impacts of Dairy Cow Ownership in Coastal
Kenya. Journal of Agricultural Economics, 55 (2), 175–195.
Ninno, C. del, Dorosh, P. Subbarao, K. (2007). Food Aid, Domestic Policy and Food Security: Contrasting
Experiences from South Asia and sub-Saharan Africa. Food Policy, 32 (4), 413–435.
Nyariki, D., Wiggins, S. and Imungi, J. (2002). Levels and Causes of Household Food and Nutrition Insecurity in
Dry Land Kenya. Ecology of Food and Nutrition, 41 (2), 155–176.
Ohno, K., Yanase, T. Matsuo, Y., Kimura, T., Rahman, M., Magara, Y. and Matsui, Y. (2007). Arsenic Intake via
Water and Food by a Population Living in an Arsenic-affected Area of Bangladesh. Science of the Total
Environment, 381, 1–3.
Organization for Economic Cooperation and Development (OECD). (2006). Development Cooperation, Paris:
29
OECD.
Otsuka, K. and Estudillo, J. (2008). Changing Sources of Household Income and Poverty Reduction in Rural Asia,
1985–2004. (In Nurul Islam (Ed.), Reducing Poverty and Hunger in Asia. International Food Policy Research
Institute. Washington, D.C.
Pagiola, S. (1995). Environmental and Natural Resource Degradation in Intensive Agriculture in Bangladesh.
Environmentally Sustainable Development, the World Bank.
Quasem, A. (1978). Factors Affecting the Use of Fertilizers in Bangladesh. The Bangladesh Development Studies,
VI, 3.
Quisumbing, A. R., Haddad, L. and Pena, C. (2001). Are Women Overrepresented Among the Poor? An Analysis of
Poverty in Ten Developing Countries. Journal of Development Economics, 66 (1), 225–269.
Rahman, O. (1999). Family Matters: The Impact of Kin on Elderly Mortality in Rural Bangladesh. Population
Studies, 53, 2.
Rahman, R., Hashan, S., Shahjahan, Md., Islam, Md. (2001). The Ownership of Livestock in Relation to Land
Holding at Semi Arid Area of Bangladesh. Journal of Biological Sciences, 1 (10), 960–962.
Ramakrishna, G. and Demeke, A. (2002). An Empirical Analysis of Food Insecurity in Ethiopia: The Case of North
Wollo. Africa Development, 27, 1and 2, 127–143.
Raihan, S. (2009). Impact of Food Price Rise on School Enrolment and Dropout in the Poor and Vulnerable
Households in Selected Areas of Bangladesh. BRAC Research and Evaluation Division, Report
commissioned by DFID, Dhaka.
Reardon, T., Berdegue, J. and Escobar, G. (2001). Rural Nonfarm Employment and Incomes in Latin America:
Overview and Policy Implications. World Development, 29 (3), 395–409.
Rosegrant, M.W. (2008). Biofuels and grain prices: impacts and policy responses. Testimony for the US Senate
Committee on Homeland Security and Governmental Affairs, May 7, 2008.
Ruel, T. (2003). Is Dietary Diversity an Indicator of Food Security or Dietary Quality? A Review of Measurement
Issues and Research Needs. International Food Policy Research Institute (IFPRI). Washington, D.C., USA.
Sachs, J., McArthur, J., Schmidt-Traub, G., Kruk, M. Bahadur, C., Faye, M., and McCord, G. (2004). ‘Ending
Africa’s Poverty Trap’, Brookings Papers on Economic Activity, 1, 117–240.
Saha, K., Frongillo, E. Alam, D., Shams, E., Arifeen, L., Persson, L. and Rasmussen, K. (2009). Household Food
Security is Associated with Growth of Infants and Young Children in Rural Bangladesh. Public Health
Nutrition, 12, 884–884.
Sekhar, C. (2003). Price Formation in World Wheat Markets – Implications for Policy. Journal of Policy Modeling,
25 (1), 85–106.
Semba, RD, Pee, S., Sun, K, Sari, M., Akhter, N. and Bloem, M.W. (2008). Effect of Parental Formal Education on
Risk of Child Stunting in Indonesia and Bangladesh: A Cross-Sectional Study. Lancet, 371, 9609, 322–8.
Sen, A. (1962). An Aspect of Indian Agriculture. Economic Weekly, Annual Number.
_________ (1986). The Causes of Famine: A Reply. Food Policy, 11.
Sen, B. (2003). Drivers of Escape and Descent: Changing Household Fortunes in Rural Bangladesh. World
Development. 31 (3), 513–534.
Sharma, M. and Zeller, M. (1999). Placement and Outreach of Group-Based Credit Organizations: The Cases of
ASA, BRAC, and PROSHIKA in Bangladesh. World Development, 27 (12), 2123–2136.
Shiklomanov, A. (2000). Appraisal and Assessment of World Water Resources. Water International 25 (1), 11–32.
Strasberg, J., Jayne, T., Yamano, T., Karanja, D and Nyoro, J. (1999). Effects of Agricultural Commercialization on
Food Crop Input Use and Productivity in Kenya. MSU International Development Working Paper, 71.
Subbarao, K. (1982). Technology Gap and the Emerging Size-Productivity Relationships Following the Adoption of
New Technology: An Analysis of Evidence from Northwest and Eastern India’ Unpublished paper, University
of California at Berkeley, Department of Agricultural and Resource Economics.
Tershakovec, A. and van Horn, L. (2003). Infants, Children and Adolescents. In Lisa Hark, Gail Morrison (Ed.),
Medical Nutrition and Disease: A Case-Based Approach, Wiley-Blackwell.
Thomasgard, M. (1998). Pparental Perceptions of Child Vulnerability, Overprotection, and Parental Psychological
Characteristics Child Psychiatry and Human Development, 28, 4.
UNCTAD. (2008). Addressing the global food crisis. Key trade, investment and commodity policies in ensuring
sustainable food security and alleviating poverty.
United Nations. (2009). World Economic Situation and Prospects 2009. United Nations Publications ICTY.
Vidal, J. (2007). The Looming Food Crisis, The Guardian. Wednesday August 29.
Wodon, Q. T. (1997). Food Energy Intake and Cost of Basic Needs: Measuring Poverty in Bangladesh. Journal of
Development Studies, 34, 66–101.
World Bank. (2001). World Development Report 2000/2001, Attacking Poverty. The International Bank for

30
Reconstruction and Development. New York: Oxford University Press.
________ (2004). Bangladesh Promoting the Rural Non–Farm Sector in Bangladesh, 1 and 2.
_________. (2008). Outlook for Remittance Flows 2008‐2010. Migration and Development, Brief 8, November 11.
_________ (n.d) Supports Ethiopia’s Efforts to Address Food Crisis, Series #:2008/ 142/AFR//
World Food Program (WFP) and the Government of Bangladesh. (2005). Food Security in Bangladesh. Papers
Presented in the National Workshop. Dhaka.
___________. (2009). WFP says hunger kills more than AIDS, Malaria, Tuberculosis Combined, June 4, 2009,
http://www.wfp.org/
31
Appendix
Table 1: Logistic Regression Results of Models for Children’s Vulnerability to Food Insecurity in households in Bangladesh
Variables Food price
Hikes
Socio–Demographic Agricultural Inputs Economic Income Full Model
Constant 1.342**
(0.214)
-4.277***
(.014)
1.563***
(4.8)
7.658***
(2119)
1.999
(7.5)
FOODHIKE 0.624**
(2.50)
1.350, 2.063
0.453
(1.24)
0.125, 1.012
.231
(1.234)
0.410, 1.324
.354
(1.32)
(0.245, 1.322
.231**
(1.2)
1.023, 1.623
FAMSIZE .909***
(2.5)
2.022, 3.05
.992***
(2.7)
1.7641, 4.125
HEAD .196
(1.22)
.731, 2.03
2.076**
(7.9)
2.125, 29.880
EDU -.266***
(.77)
.670, .877
.012
(1.012)
.762, 1.344
NONFARM -.012***
(.98)
.986, .991
-.013***
(.98)
.984, .991
REMITTANCE -0.114
(.125)
1.234, 0.140
-0.121
(0.032)
1.254, 0.124
CREDIT -.003***
(.99)
.981, .993
.000
(.999)
.990, 1.009
PROPA -1.226**
(.293)
.134, .644
-472
(.624)
FARMSIZE -3.643***
(0.26)
-2697*
(0.7)
32
.008, .085 0.006, 7.14
CATTLE .251
(1.3)
1.02, 1.621
.211
(1.234)
.739, 2.061
FERTILIZER -.053***
(.95)
.927, .971
-.074**
(.93)
-889, .969
WATER .347
(1.42)
.862, 2.323
.103
(1.109)
.465, 2.642
- 2 Log likelihood 456.763 446.755 397.200 225.579 141.002
Cox and Snell R2 .347 .306 .378 .575 .648
Nagelkerke R2 .452 .509 .509 .775 .873
Hosmer and
Lemeshow
Goodness–of–Fit Test
x2 df Sig. x2 df Sig. x2 df Sig. x2 df Sig. x2 df Sig.
3.58 8 .660 4.98 8 .760 13.87 7 .054 10.94 8 .205 12.13 8 .145
Note: Numbers in parentheses indicate exp b and figures below them are 95% CI
*p<.05, **p<.01, **p<.001
33
Table 2: Logistic Regression Results of Models for Children’s Vulnerability to Food Insecurity in households in Ethiopia
Variables Food price Hikes Socio–Demographic Agricultural Inputs Economic Income Full Model
Constant 2.314**
(1.24)
.071
(1.074)
0.342**
(1.032)
1.247
(11.21)
3.788**
(44.183)
FOODHIKE 0.541**
(1.28)
1.251, 2.192
0.124
(1.35)
0.124, 1.354
0.475
(1.42)
(0.425, 1.365)
0.145
(1.52)
0.745, 1.245
.214**
(1.1)
1.010, 1.523
FAMSIZE -.288
(.750)
.455, 1.235
.153
(1.17)
.998, 1.361
HEAD .248***
(1.28)
1.129, 1.453
-.247
(.78)
.412, 1.481
EDU -.717***
(.488)
.416, .574
-.226*
(.798)
.645, .987
NONFARM -.029***
(.97)
.965, .978
-.010*
(.990)
.983, .998
REMITTANCE -0.124
(.145)
0.145, 1.245
-0.147
(.214)
.724, 1.244
CREDIT -.010**
(.990)
.981, 1.00
.002
(1.002)
.991, 1.013
PROPA -1.492***
(.225
.131, .387
-1.315***
(.27)
.145, .497
FARMSIZE -2.19**
(.11)
.068, .183
-1.506***
(.22)
.123. .401
CATTLE -0.12
(.988)
.091
(1.09)
34
.895, 1.202 .881, 1.361
FERTILIZER -.070**
(.932)
.895, .972
-.052
(.949)
.899, 1.002
WATER .305
(1.36)
.743, 2.478
.088
(1.09)
.559, 2.133
- 2 Log likelihood 458.16 447.179 339.698 349.477 293.557
Cox and Snell R2 .254 .294 .444 .432 .498
Nagelkerke R2 .325 .398 .601 .585 .67
Hosmer and
Lemeshow
Goodness–of–Fit Test
x2 df Sig. x2 df Sig. x2 df Sig. x2 df Sig. x2 df Sig.
2.354 8 .441 7.00 8 .537 15.015 8 .059 28.14 8 .001 6.45 8 .597
Note: Numbers in parentheses indicate exp b and figures below them are 95% CI
*p<.05, **p<.01, **p<.001