food pocket book report 2013 - gov.uk
TRANSCRIPT
Food Statistics!Pocketbook 2013
in-year update

© Crown copyright 2014You may re-use this information (not including logos) free of charge in any format or medium, under the terms of the Open Government Licence. To view this licence, visit www.nationalarchives.gov.uk/doc/open-govern-ment-licence/ or write to the Information Policy Team, The National Ar-chives, Kew, London TW9 4DU, or e-mail: [email protected]
FoodStatistics Pocketbook2013 - in year update
Department for Environment, Food and Rural Affairs
3
Foreword 6 Summary 8
Chapter 1: Food Chain1.1: Economic summary of the UK food chain 101.2: Gross Value Added of the UK agri-food sector 121.3: UK consumer expenditure on food, drink and catering 131.4: Agri-food sector employees, GB basis 141.5: Trends in total factor productivity of the UK food sector 151.6: UK grocery market shares 161.7: UK food & drink manufacturing by product type 17
Chapter 2: Prices and Expenditure2.1: UK trend in food prices in real terms 18 2.2: Trend in share of spend going on food & drinks in low income & all UK households 19 2.3: Income decline after housing costs, low income decile (UK) 202.4: UK retail price changes by food group 212.5: Percentage change in food purchases, low income decile (UK) 222.6: Factors influencing consumer product choice 232.7: UK trend in sales of ethical produce 242.8: Food prices in the UK compared to France 25
Chapter 3: Global and UK Supply3.1: Origins of food consumed in the UK 26 3.2: UK Food production to supply ratio 273.3: Trends in UK food production 283.4: UK trade in different food groups 293.5: Trend in exports of food, feed and drink 303.6: Trends in world population, energy requirement, energy supply and the prevalence of under-nourishment 313.7: World agricultural commodity prices 323.8: World grains stocks to consumption ratio 333.9: Retailer warehouse stock levels - 5 year change 34
Contents
4
ContentsChapter 4: Environment4.1: Greenhouse gas (GHG) emissions from the UK agri-food sector 354.2: Energy use in UK agri-food sector 364.3: Trends in CO2 emissions from UK food and drink manufacturing 374.4: Indicators of the external impact of food transport 384.5: Food and drink sub-sectors represented within the FHC 39
Chapter 5: Waste5.1: UK food and drink waste through the food chain 405.2: UK percentage of edible food purchases that are wasted 415.3: UK hospitality sector food waste going to landfill 425.4: Understanding out of home consumer food waste 435.5: UK recycling of separately collected food waste 445.6: UK food & drink packaging waste in the supply tohouseholds 455.7: Consumer attitudes to food waste and food packaging 465.8: Public attitudes and behaviours 47
Chapter 6: Dietary Health6.1: The eatwell plate 486.2: Household purchases compared to the eatwell ideal 496.3: UK Trend in purchases of fruit & vegetables 506.4: Trend in the consumption of fruit & vegetables in men, women and children in England 516.5: UK Trends in intakes of fat, saturated fatty acids, non-milk extrinsic sugars & sodium 526.6: UK average micronutrient intakes 536.7: The UK household diet compared with the eating out diet 546.8: Trends in average energy intake from food & drink 556.9: UK dietary indicators by equivalised income 566.10: Levels of adult obesity in England 57

5
6.11: UK Regional household consumption of fruit and vegetables 586.12: UK Trend in average alcohol intake 59
Chapter 7: Safety and Confidence7.1: Trend in the estimated number of cases of foodborne illnesses 60 7.2: Inspections and enforcement actions of food businesses 61 7.3: Contamination incidents investigated in the UK by the FSA 627.4: Number of unsatisfactory analyses found in imported food 637.5: Factors influencing choice when buying food and non-alcoholic drink 647.6: Percentage of people concerned about certain food issues 657.7: Percentage of people concerned about where food is produced 667.8: Methods used to assess whether food is safe to eat 677.9: Extent of concern across EU whether food production meets population needs 68
Glossary 69
Contents
6
This publication provides a concise round-up of statistics on food covering the economic, social and environmental aspects of the food we eat (excluding agriculture). It contains statistics for different time periods, but always using latest available data at the time of release.
Data comes from surveys run by Defra and the Office for National Statistics and from a wide range of other sources including government departments, agencies and commercial organisations. Links to data sources are included on every page.
An associated dataset containing all charts and key data sources from this year’s publication is also available.
Data are a mixture of National Statistics, Official Statistics and unofficial statistics. Unofficial statistics are used where there are gaps in the evidence base. National Statistics (Official Statistics that comply with the national statistics code of practice) are indicated using the logo pictured here. Further information on National Statistics can be found on the UK Statistics Authority website.
An in-year update published on April 24th 2014 revised the following:Chapter 1: Food Chain1.1, 1.2, 1.3, 1.4, 1.5, 1.7Chapter 2: Prices and Expenditure2.2, 2.5, 2.7 Chapter 3: Global and UK Supply3.4, 3.5Chapter 6: Dietary Health6.2, 6.3, 6.5, 6.6, 6.7, 6.8, 6.9, 6.10, 6.11, 6.12
Foreword
7
Related Defra publications:
• Family Food 2012• Total Factor Productivity of the United Kingdom Food Chain• Agriculture in the United Kingdom Production team: Janet Carr, David Lee, Andrew Scaife, Isabella Hayes
email: [email protected]
Tel: 01904 455067
Food Statistics teamDepartment for Environment, Food and Rural AffairsFoss House, Kings Pool1-2 Peasholme GreenYork YO1 7PX
Foreword
8
SummaryEconomy
● The agri-food sector contributed £97.1 billion or 7.4% to national Gross Value Added in 2012, and 3.6 million or 13% of national employment in Q3 2013.
● Total Factor Productivity in the food sector (excluding agriculture) stabilised in 2012 having risen gradually since 2002.
● Beverages is the largest manufacturing group with a GVA of £5.3 billion in 2012; Alcoholic beverages contributed £4.1 billion (77%) of the total beverages GVA in 2012.
Food Supply & Prices
● Food prices have risen 12% in real terms since 2007 taking us back to the late nineties in terms of cost of food relative to other goods.
● Median income after housing costs fell 12% between 2002-03 and 2010-11 for low income decile households. In 2011-12, all other incomes groups saw decreases in median income of between 1% and 7%.
● Compared to the EU: Food prices rose 22% in the UK between 2007 and 2013 while rising only 12% in Germany and 13% in France.
● In 2012, 24 countries together accounted for 90% of UK food supply. Just over half of this (53%) was supplied domestically from within the UK.
● The total value of food and drink exports rose slightly in 2013 to £18.9 billion, £6.0 billion more than in 2005 measured in 2013 prices.

9
SummaryEnvironment and Waste
● Around 176 million tonnes of CO2e were emitted within the UK from domestic food sector activity in 2011.
● Food manufacturing accounted for 15% of total energy use across the agri-food sector in 2011.
● Estimated total UK food and drink waste is around 15 million tonnes per year, with households generating 7.2mt/year of which 4.4 is avoidable (i.e. fit to eat).
● Overall 15% of edible food and drink purchases are wasted at an estimated cost of £480 per year for an average household.
● In 2012, over 5 million UK households received a food waste collection service, up by around I million on 2011. This equates to nearly 20% of all households in the UK (in 2012).
Health & Food Safety
● Fruit and vegetable consumption is falling. The lowest 10% of households by income purchase the least fruit and vegetables at an average of 2.9 portions per person per day in 2012, 14% less than in 2007.
● In England in 2011 the obesity rate across all adults was 25%, with a further 37% overweight.
● Estimates suggest around a million cases of foodborne illness in the UK each year, resulting in 20,000 hospital admissions and 500 deaths.
● The FSA dealt with six high level incidents in 2012, including; outbreaks of listeria and E.coli in Northern Ireland, fraudulent export of fish by-products, an outbreak of botulism linked to olives from Italy and contamination of sorbitol with sodium nitrite.
● In May 2013 the main food issue of concern to respondents was food prices at 59%, decrease from 63% in May 2012.
10
Chapter 1: Food Chain
UK Consumers
64 million people
Exports (a)£18.9bn of which:
Highly processed – £11.1bnLightly processed – £6.4bn
Unprocessed – £1.4bn
Total Consumers’ Expenditure (b) on food, drink, and
catering services – £196bn
Consumers’ Expenditure (b)on catering services – £84bn
Household Expenditure (b)on food and drink – £112bn
Caterers (restaurants, cafes, canteens)
Gross value added – £26.7bn (c)Employees – 1,441,000 (d)
Enterprises – 113,623Catering Outlets – 437,581
Food and Drink RetailersGross value added – £27.7bn (c)
Employees – 1,128,000 (d)Enterprises – 52,774
Stores – 85,720
Food and Drink Wholesalers(includes agents)
Gross value added – £9.6bn (c)Employees – 213,000 (d)
Enterprises – 15,082
Food and Drink ManufacturingIncludes everything from primary processing (milling, malting,
slaughtering)to complex prepared foods. Many products will go through
several stages.Gross value added – £24.1bn (c)
Employees – 382,000 Enterprises – 7,766
Manufacturing sites/factories – 9,625
Imports (a)£40.2bn of which:
Highly processed – £14.4bnLightly processed – £17.8bn
Unprocessed – £8.0bn

11
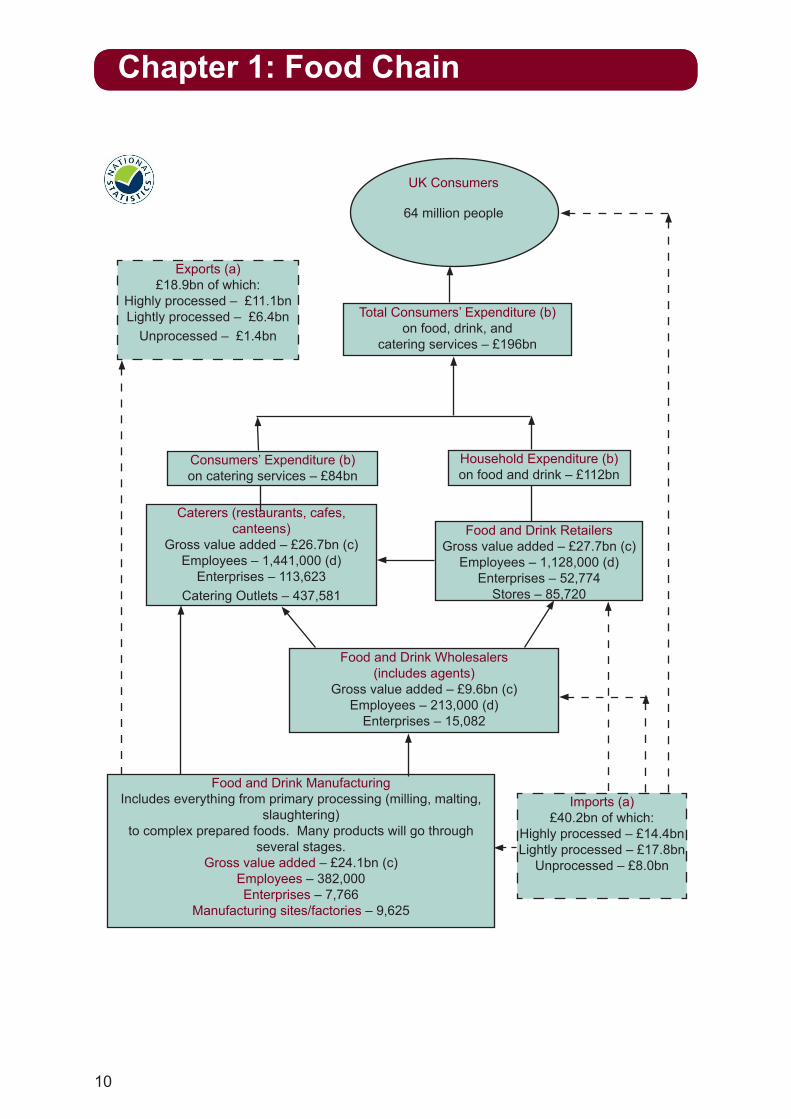
1 Excludes sectors downstream from food and drink manufacturing such as the food and drink supply industry (food processing machinery).
(a) Overseas trade data is provisional for full year 2013 from HM Revenue and Customs. (Data may not equal total due to rounding). Dashed lines indicate main trade flows.
(b) Consumers’ expenditure, properly known as household final consumption expenditure, is provisional from the Office for National Statistics for full year 2013 and is calculated at current prices. (Data may not equal total due to rounding).
(c) Gross Value Added (GVA) is the difference between the value of goods and services produced and the cost of raw materials and other inputs used up in production. GVA figures are from the Annual Business Survey and is provisional data for full year 2012, calculated at basic prices (market prices less taxes plus subsidies).
(d) Employee data for grocery retailers is for Great Britain only and is for Q3 2013 from the Office for National Statistics Labour Force Survey. Food and drink wholesaling, and agricultural wholesaling includes an estimate of employment by food and drink wholesaling agents, and wholesalers of agricultural machinery from the Annual Business Survey. (Employee data is rounded).
1.1: Economic summary of the UK food chain beyond agriculture1
Food Chain
12
Agriculture and Fishing, £9.0bn,
9%
Food and Drink Manufacturing, £24.1bn, 25%
Food and Drink Wholesaling, £9.6bn, 10%
Food and Drink Retailing,
£27.7bn, 28%
Non-Residential Catering, £26.7bn,
28%
2 2012 figures are provisional. 3 Business Demography, Enterprise Births, Deaths and Survivals, ONS 2013.
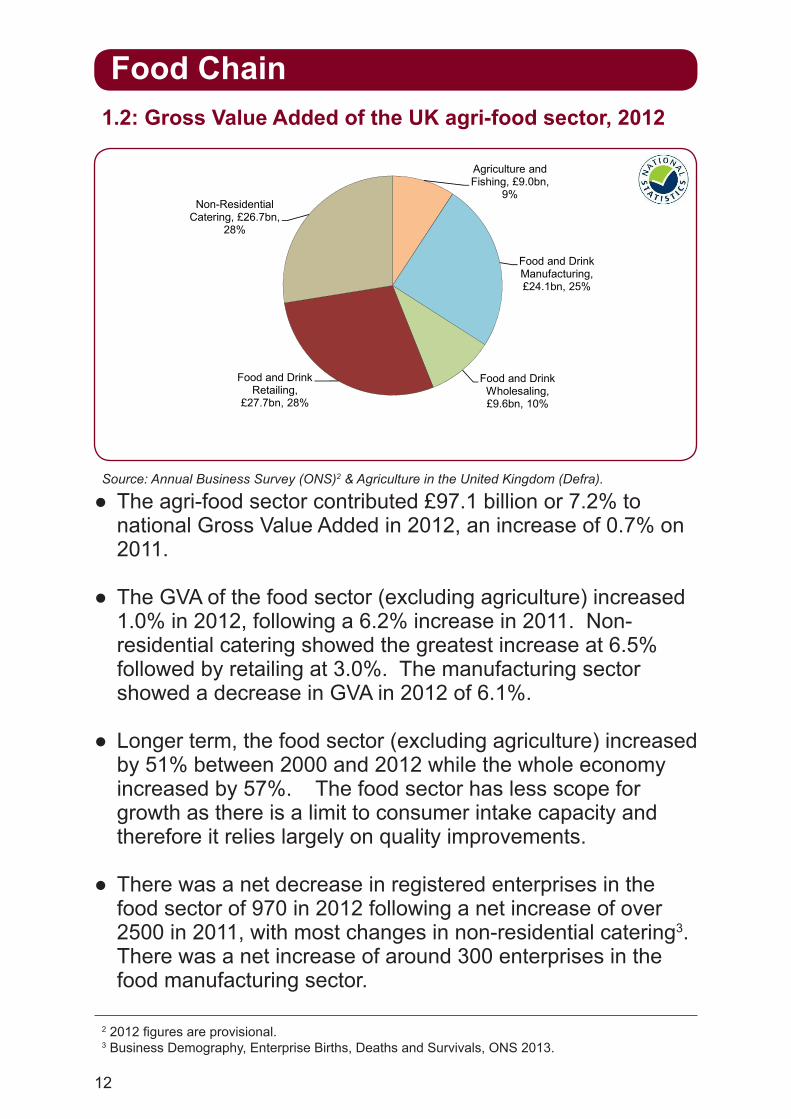
● The agri-food sector contributed £97.1 billion or 7.2% to national Gross Value Added in 2012, an increase of 0.7% on 2011.
● The GVA of the food sector (excluding agriculture) increased 1.0% in 2012, following a 6.2% increase in 2011. Non-residential catering showed the greatest increase at 6.5% followed by retailing at 3.0%. The manufacturing sector showed a decrease in GVA in 2012 of 6.1%.
● Longer term, the food sector (excluding agriculture) increased by 51% between 2000 and 2012 while the whole economy increased by 57%. The food sector has less scope for growth as there is a limit to consumer intake capacity and therefore it relies largely on quality improvements.
● There was a net decrease in registered enterprises in the food sector of 970 in 2012 following a net increase of over 2500 in 2011, with most changes in non-residential catering3. There was a net increase of around 300 enterprises in the food manufacturing sector.
Source: Annual Business Survey (ONS)2 & Agriculture in the United Kingdom (Defra).
1.2: Gross Value Added of the UK agri-food sector, 2012
Food Chain
13
£0
£10
£20
£30
£40
£50
£60
£70
£80
£90
£100
2005 2006 2007 2008 2009 2010 2011 2012 2013
£ bi
llion
catering alcoholic drinks (on and off licence) food and non-alcoholic drink shopping
4 ‘Food’ includes non-alcoholic drinks. ‘Drink’ is alcoholic drinks.
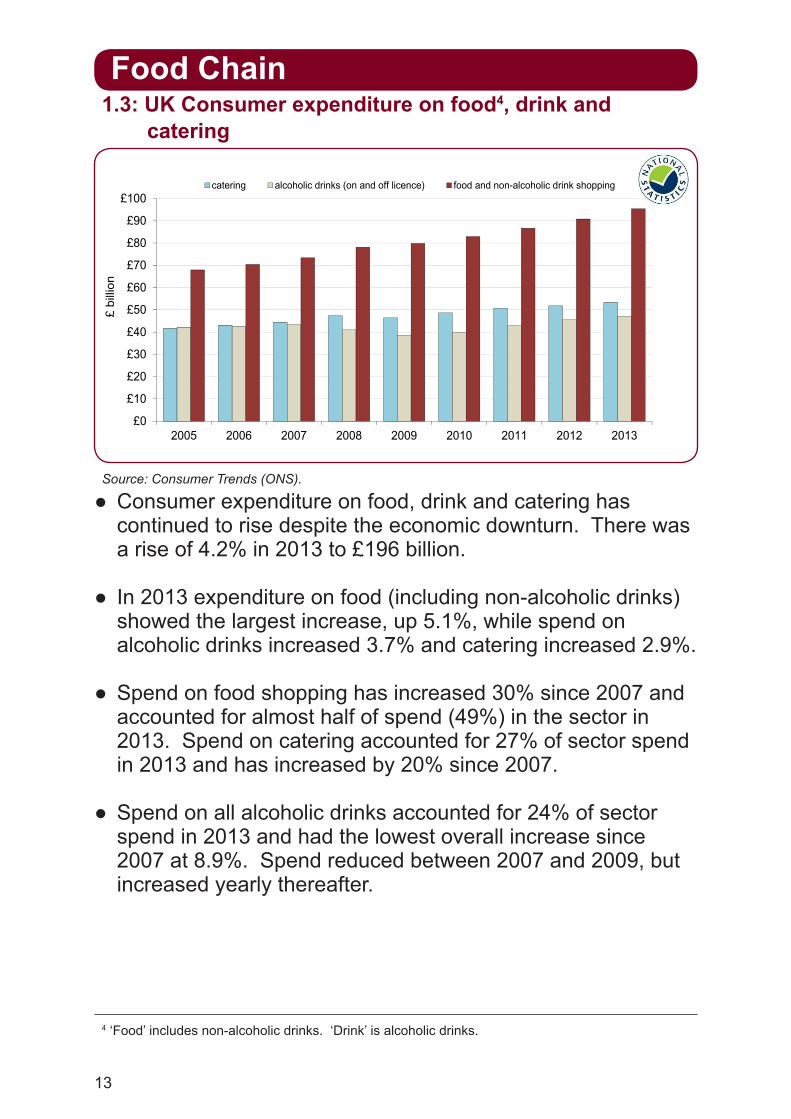
● Consumer expenditure on food, drink and catering has continued to rise despite the economic downturn. There was a rise of 4.2% in 2013 to £196 billion.
● In 2013 expenditure on food (including non-alcoholic drinks) showed the largest increase, up 5.1%, while spend on alcoholic drinks increased 3.7% and catering increased 2.9%.
● Spend on food shopping has increased 30% since 2007 and accounted for almost half of spend (49%) in the sector in 2013. Spend on catering accounted for 27% of sector spend in 2013 and has increased by 20% since 2007.
● Spend on all alcoholic drinks accounted for 24% of sector spend in 2013 and had the lowest overall increase since 2007 at 8.9%. Spend reduced between 2007 and 2009, but increased yearly thereafter.
Source: Consumer Trends (ONS).
1.3: UK Consumer expenditure on food4, drink and catering
Food Chain
14
Agriculture and Fishing
0.42 million12%
Food and Drink Manufacturing
0.37 million10%
Food and Drink Wholesaling0.23 million
6%Food and Drink Retailing
1.13 million32%
Non-Residential Catering
1.41 million40%
5 Data for the food sector is not available for Northern Ireland, but numbers are likely to be small. 6 Wholesaling, manufacturing and retailing include tobacco.
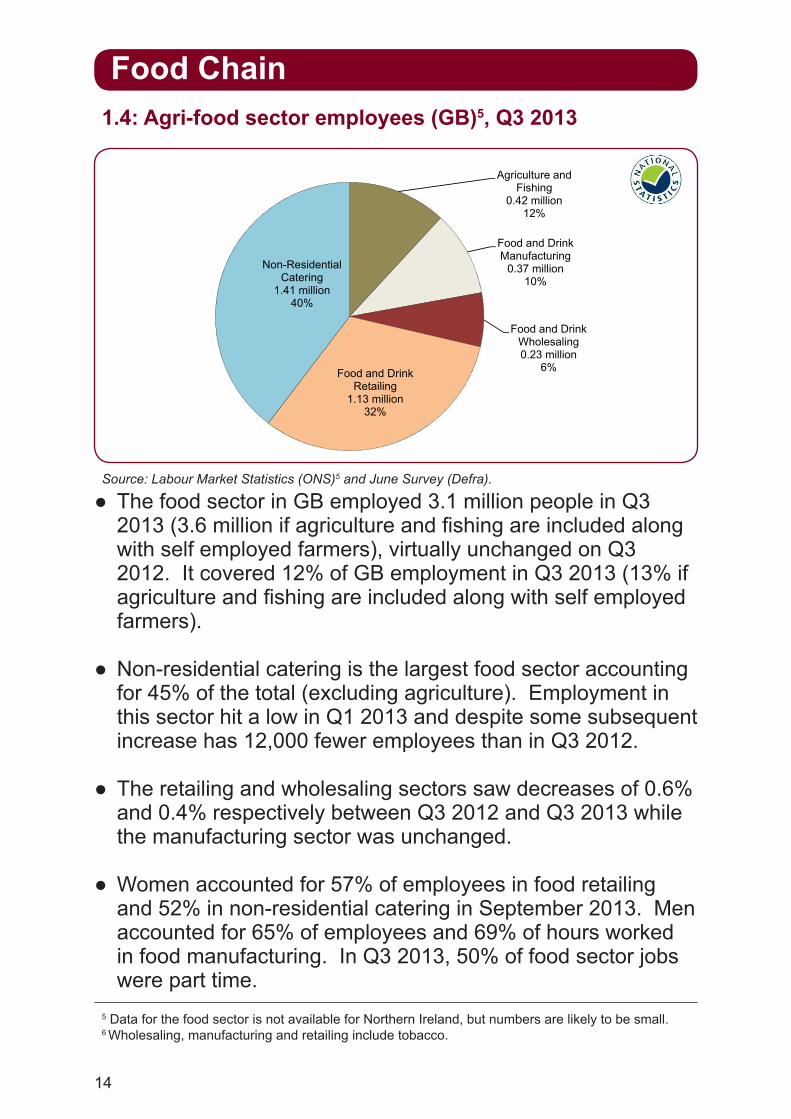
● The food sector in GB employed 3.1 million people in Q3 2013 (3.6 million if agriculture and fishing are included along with self employed farmers), virtually unchanged on Q3 2012. It covered 12% of GB employment in Q3 2013 (13% if agriculture and fishing are included along with self employed farmers).
● Non-residential catering is the largest food sector accounting for 45% of the total (excluding agriculture). Employment in this sector hit a low in Q1 2013 and despite some subsequent increase has 12,000 fewer employees than in Q3 2012.
● The retailing and wholesaling sectors saw decreases of 0.6% and 0.4% respectively between Q3 2012 and Q3 2013 while the manufacturing sector was unchanged.
● Women accounted for 57% of employees in food retailing and 52% in non-residential catering in September 2013. Men accounted for 65% of employees and 69% of hours worked in food manufacturing. In Q3 2013, 50% of food sector jobs were part time.
Source: Labour Market Statistics (ONS)5 and June Survey (Defra).
1.4: Agri-food sector employees (GB)5, Q3 2013
Food Chain

15
90
95
100
105
110
115
2000 2001 2002 2003 2004 2005 2006 2007 2008 2009 2010 2011 2012
Inde
x 20
00 =
100
.
FOOD CHAIN
Food and drink manufacturing
Food and drink wholesaling
Food and drink retailing
Non-residential catering
7 See Glossary for definition of Total Factor Productivity. 8 Wholesaling includes tobacco (SIC 46.35)
● Total factor productivity (TFP) of the food sector excluding agriculture stabilised in 2012, having risen gradually since 2002.
● The (TFP) of the UK food sector is an indicator of the efficiency and competitiveness of the food industry within the UK. An increase in TFP indicates the industry is improving its competitiveness.
● Since 2000, productivity of food manufacturing and food wholesale have risen overall; food retailing and non-residential catering have fluctuated but in 2012 have returned to around base levels.
● Benchmarking against a wider economy measure shows the average annual growth in the food sector between 2002 and 2012 was 0.7% compared to 0.2% in the wider economy.
● The calculation is based on reliable data on business sales and costs, employment by industry and on price indices all collected by the Office for National Statistics.
Source: Total Factor Productivity of the United Kingdom Food Chain 2000-2012, Defra, January 2014.
1.5: Trends in the total factor productivity7 of the UK food sector8
Food Chain
16
25%
15%14%
12%
5% 5% 4% 4% 5%7%
5%
10%
15%
20%
25%
30%
25%
15%14%
12%
5% 5% 4% 3% 3% 2%1%
4% 5%7%
0%
5%
10%
15%
20%
25%
30%
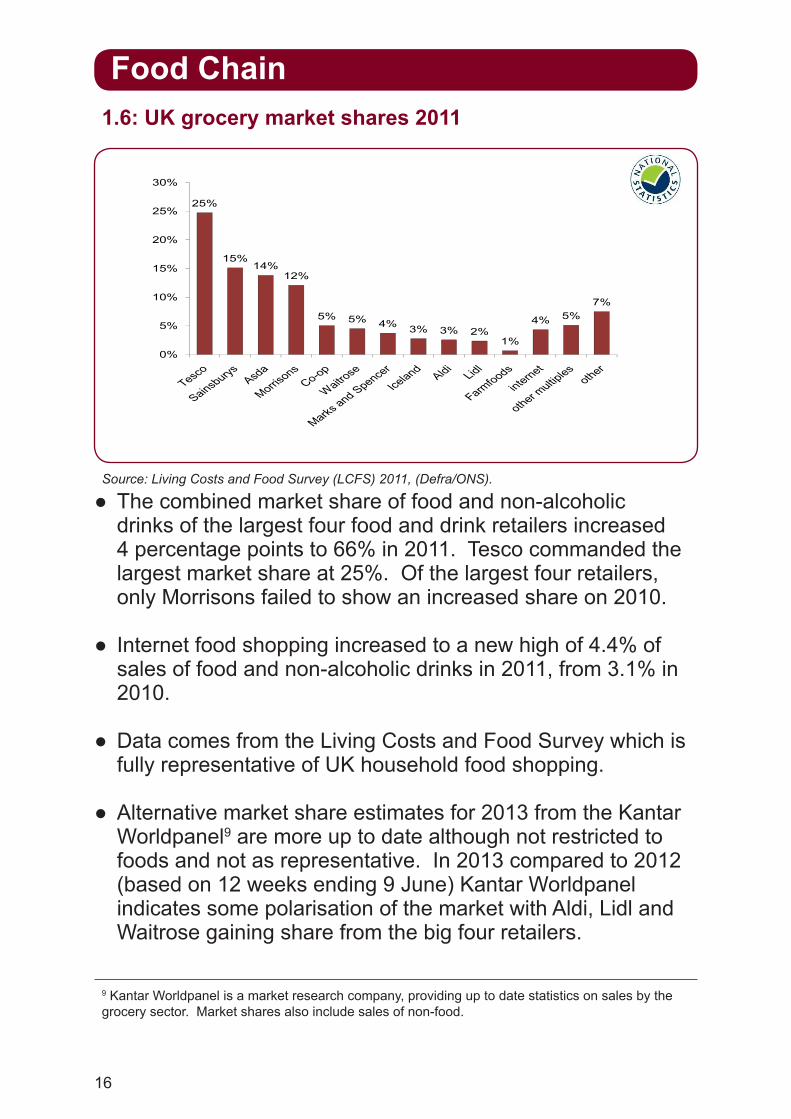
● The combined market share of food and non-alcoholic drinks of the largest four food and drink retailers increased 4 percentage points to 66% in 2011. Tesco commanded the largest market share at 25%. Of the largest four retailers, only Morrisons failed to show an increased share on 2010.
● Internet food shopping increased to a new high of 4.4% of sales of food and non-alcoholic drinks in 2011, from 3.1% in 2010.
● Data comes from the Living Costs and Food Survey which is fully representative of UK household food shopping.
● Alternative market share estimates for 2013 from the Kantar Worldpanel9 are more up to date although not restricted to foods and not as representative. In 2013 compared to 2012 (based on 12 weeks ending 9 June) Kantar Worldpanel indicates some polarisation of the market with Aldi, Lidl and Waitrose gaining share from the big four retailers.
Source: Living Costs and Food Survey (LCFS) 2011, (Defra/ONS).
1.6: UK grocery market shares 2011
Food Chain
9 Kantar Worldpanel is a market research company, providing up to date statistics on sales by the grocery sector. Market shares also include sales of non-food.
17
2,060
925
755
675
405
300
290
270
85
35
0 1,000 2,000 3,000 4,000 5,000 6,000 7,000
Bakery
Other food products
Meat and meat products
Beverages
Dairy products
Fruit and vegetables
Prepared animal feeds
Fish and crustaceans
Grain and starch products
Oils and fats
GVA of whole sector in 2012 (£m)
Number of SMEs
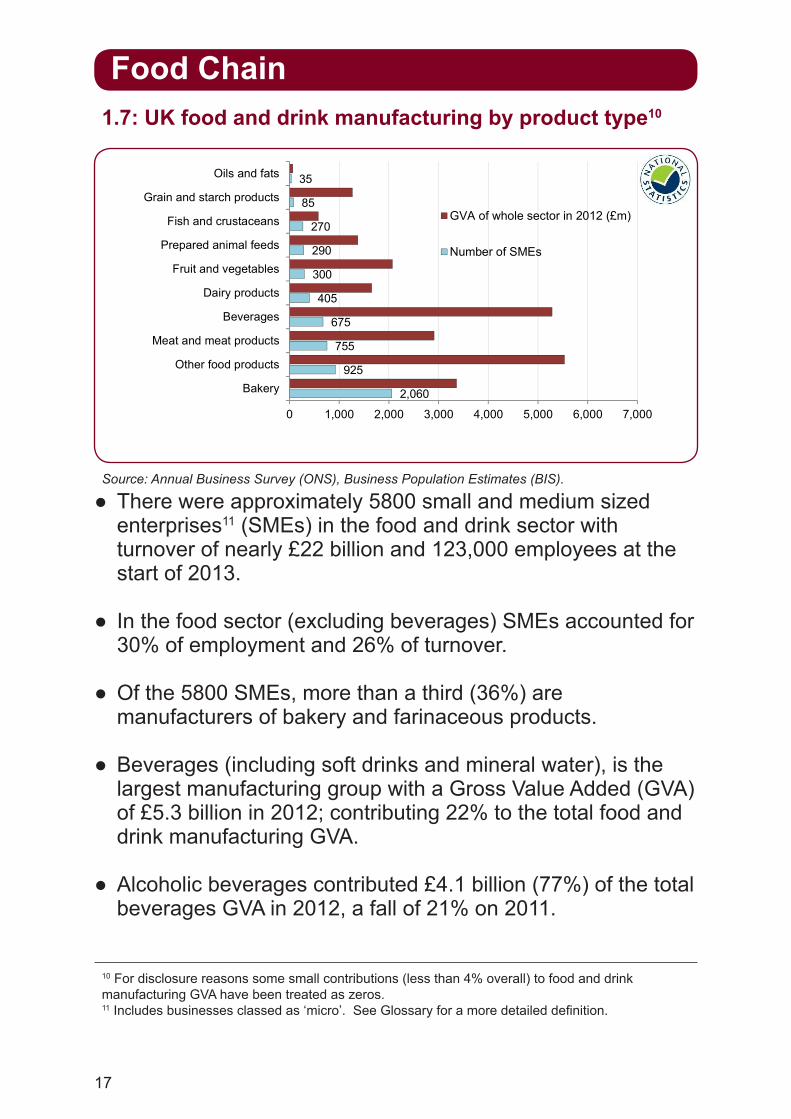
● There were approximately 5800 small and medium sized enterprises11 (SMEs) in the food and drink sector with turnover of nearly £22 billion and 123,000 employees at the start of 2013.
● In the food sector (excluding beverages) SMEs accounted for 30% of employment and 26% of turnover.
● Of the 5800 SMEs, more than a third (36%) are manufacturers of bakery and farinaceous products.
● Beverages (including soft drinks and mineral water), is the largest manufacturing group with a Gross Value Added (GVA) of £5.3 billion in 2012; contributing 22% to the total food and drink manufacturing GVA.
● Alcoholic beverages contributed £4.1 billion (77%) of the total beverages GVA in 2012, a fall of 21% on 2011.
Source: Annual Business Survey (ONS), Business Population Estimates (BIS).
1.7: UK food and drink manufacturing by product type10
Food Chain
10 For disclosure reasons some small contributions (less than 4% overall) to food and drink manufacturing GVA have been treated as zeros. 11 Includes businesses classed as ‘micro’. See Glossary for a more detailed definition.
18
40
50
60
70
80
90
100
11019
80
1982
1984
1986
1988
1990
1992
1994
1996
1998
2000
2002
2004
2006
2008
2010
2012
Inde
x Ja
n 19
80 =
100
Chapter 2: Prices & Expenditure
1 Excludes alcoholic drinks and catering.
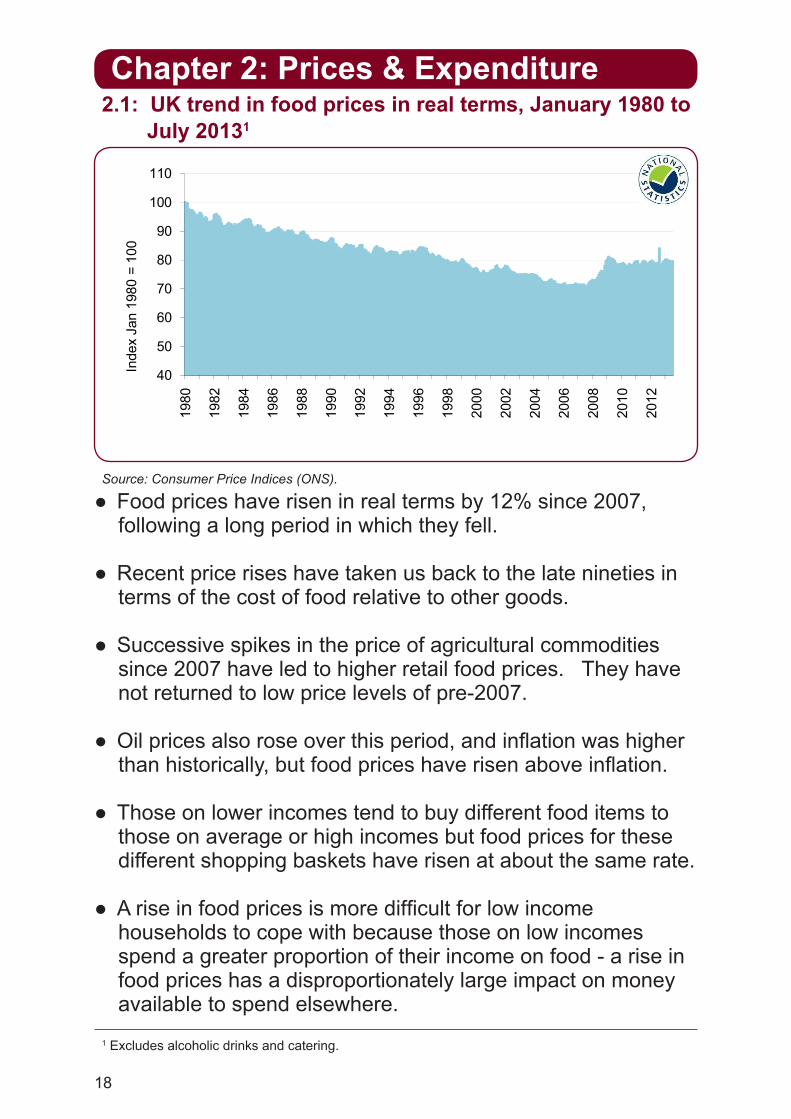
● Food prices have risen in real terms by 12% since 2007, following a long period in which they fell.
● Recent price rises have taken us back to the late nineties in terms of the cost of food relative to other goods.
● Successive spikes in the price of agricultural commodities since 2007 have led to higher retail food prices. They have not returned to low price levels of pre-2007.
● Oil prices also rose over this period, and inflation was higher than historically, but food prices have risen above inflation.
● Those on lower incomes tend to buy different food items to those on average or high incomes but food prices for these different shopping baskets have risen at about the same rate.
● A rise in food prices is more difficult for low income households to cope with because those on low incomes spend a greater proportion of their income on food - a rise in food prices has a disproportionately large impact on money available to spend elsewhere.
Source: Consumer Price Indices (ONS).
2.1: UK trend in food prices in real terms, January 1980 to July 20131
19
16.3 16.0 16.1 15.6 15.2
16.816.1 15.8
16.6 16.6
10.4 10.3 10.2 10.3 10.5 10.811.5 11.2 11.3 11.6
0
2
4
6
8
10
12
14
16
18
2003/04 2004/05 2005/06 2006 2007 2008 2009 2010 2011 2012
Perc
enta
ge o
f all s
pend
Lowest 20% by equivalised income All UK households
Prices & Expenditure
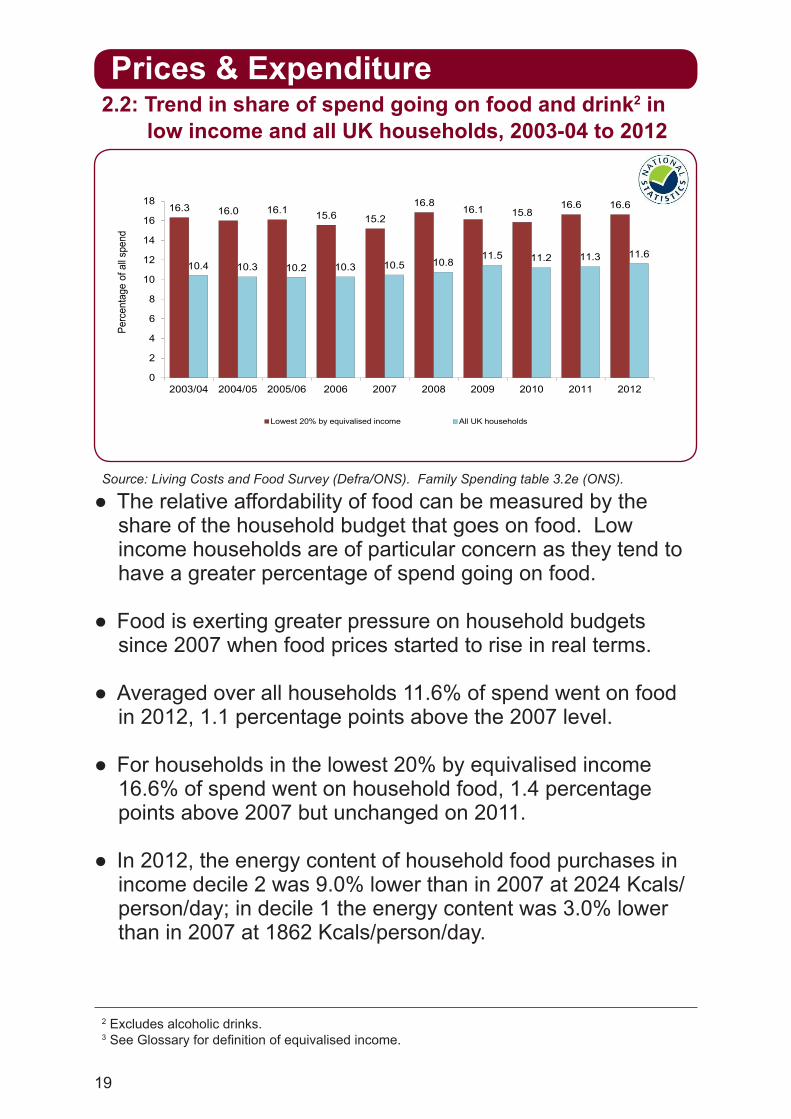
● The relative affordability of food can be measured by the share of the household budget that goes on food. Low income households are of particular concern as they tend to have a greater percentage of spend going on food.
● Food is exerting greater pressure on household budgets since 2007 when food prices started to rise in real terms.
● Averaged over all households 11.6% of spend went on food in 2012, 1.1 percentage points above the 2007 level.
● For households in the lowest 20% by equivalised income 16.6% of spend went on household food, 1.4 percentage points above 2007 but unchanged on 2011.
● In 2012, the energy content of household food purchases in income decile 2 was 9.0% lower than in 2007 at 2024 Kcals/person/day; in decile 1 the energy content was 3.0% lower than in 2007 at 1862 Kcals/person/day.
Source: Living Costs and Food Survey (Defra/ONS). Family Spending table 3.2e (ONS).
2.2: Trend in share of spend going on food and drink2 in low income and all UK households, 2003-04 to 2012
2 Excludes alcoholic drinks. 3 See Glossary for definition of equivalised income.

20
Prices & Expenditure
111
90
95
100
105
110
115
120
dex
2002
-03
=100
income after housing costs at 2011-12 pricesfood prices in real terms
88
111
80
85
90
95
100
105
110
115
120
2002
-03
2003
-04
2004
-05
2005
-06
2006
-07
2007
-08
2008
-09
2009
-10
2010
-11
2011
-12
Inde
x 20
02-0
3 =1
00
income after housing costs at 2011-12 pricesfood prices in real terms
● Median income after housing costs fell 12% between 2002-03 and 2010-11 for low income decile households. The lowest point was reached in 2008-09 followed by a small recovery in 2009-10. Since then, median income levels in this group have been virtually unchanged.
● In 2011-12, all other income groups saw decreases in median income of between 1% and 7%, with only the highest income group remaining above the 2002-03 level.
● Falling income (after housing costs) and rising food prices produced a double effect, reducing food affordability by over 20% for lowest income decile households.
● The most commonly used threshold of low income in the UK is having an income which is less than 60% of the median. In 2011-12 the percentage of individuals in relative low income (before housing costs) was 16%5. This level remains static as incomes near the bottom of the distribution fell by roughly the same as those at the median.
Source: Living Standards, Poverty and Inequality in the UK, 2013; Institute for Fiscal Studies.
2.3: Income decline after housing costs, low income4 decile (UK)
4 See Glossary for definition of Low income. 5 Households Below Average Income, ONS June 2013.

21
Prices & Expenditure
28%29%
31%33%33%34%34%34%
39%39%
55%
Processed foodMilk, cheese, eggs
Vegetables, potatoesFish
FOOD AND NON-ALCOHOLIC BEVERAGESBread, flour, cereals
FruitMeat
Coffee, tea, cocoaSugar, jam, confectionery
Butter, margarine, cooking oil
20%23%
24%28%28%29%
31%33%33%34%34%34%
39%39%
55%
0 10 20 30 40 50 60
ALL ITEMS CPICATERING
Alcoholic drinksSoft drinks
Processed foodMilk, cheese, eggs
Vegetables, potatoesFish
FOOD AND NON-ALCOHOLIC BEVERAGESBread, flour, cereals
FruitMeat
Coffee, tea, cocoaSugar, jam, confectionery
Butter, margarine, cooking oil
% increase in price June 2007 to June 2013
● All food groups have risen in price since 2007 (the start of the recession), with rises ranging from 24% to 55%. Food prices overall (including non-alcoholic drinks) rose 11% in real terms between 2007 and 2013.
● Butter, margarine and cooking oils increased the most since June 2007 and rose 5.2% in the year to June 2013.
● Prices for fish, fruit and vegetables, bread and meat have all risen by more than 30% since June 2007. In the year to June 2013, fruit and vegetable prices showed the greatest increases at 7.5% and 5.2% respectively.
● Food price rises had a strong effect on food shopping for low income households. Households in income decile 1 (lowest income group) bought less butter, fruit, vegetables and soft drinks, but bought more pork, bacon and cheese6.
Source: Consumer Price Indices (ONS).
2.4: UK retail price changes by food group, 2007 to 2013
6 Family Food in 2011, Defra, December 2012.
22
Prices & Expenditure
‐23%
‐19%
‐16%
‐7%
‐6%
‐6%
‐5%
‐4%
7.4%
89%
Carcase meat
Fish
Fresh and processed fruit
Confectionery
Fresh and processed vegetables, excluding potatoes
All Food (excludes drinks)
Cheese
Soft drinks
Non‐carcase meat and meat products
Flour
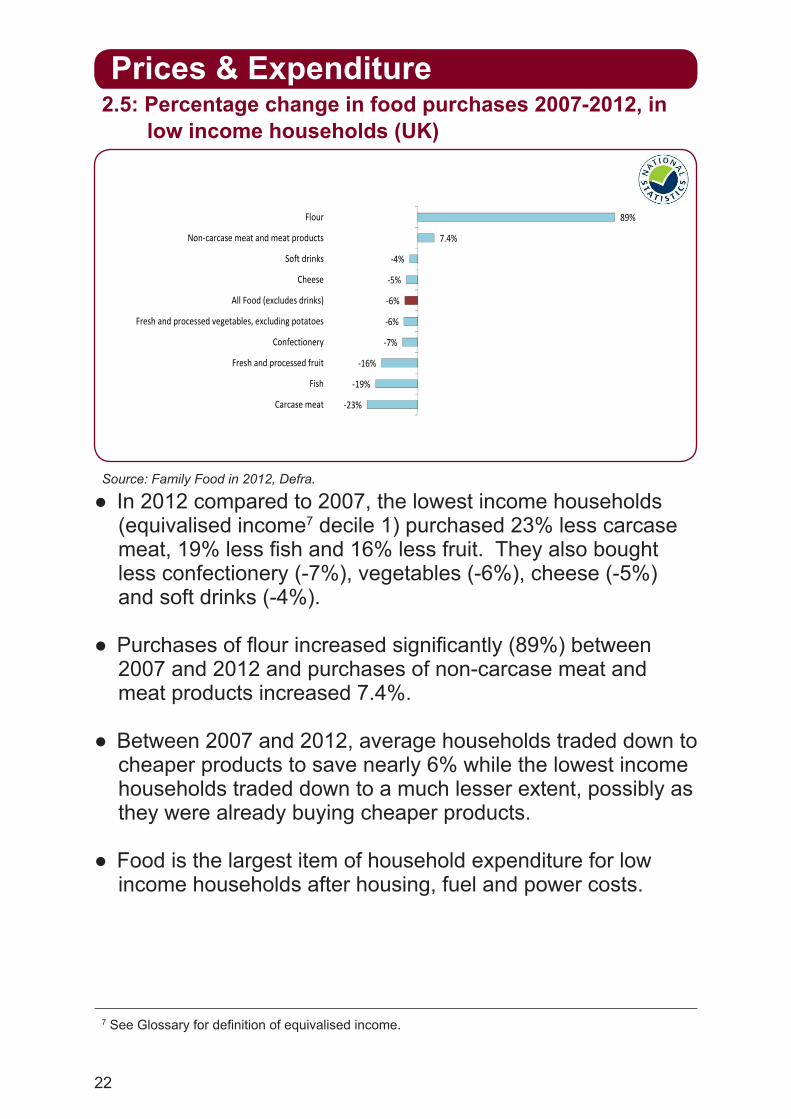
● In 2012 compared to 2007, the lowest income households (equivalised income7 decile 1) purchased 23% less carcase meat, 19% less fish and 16% less fruit. They also bought less confectionery (-7%), vegetables (-6%), cheese (-5%) and soft drinks (-4%).
● Purchases of flour increased significantly (89%) between 2007 and 2012 and purchases of non-carcase meat and meat products increased 7.4%.
● Between 2007 and 2012, average households traded down to cheaper products to save nearly 6% while the lowest income households traded down to a much lesser extent, possibly as they were already buying cheaper products.
● Food is the largest item of household expenditure for low income households after housing, fuel and power costs.
Source: Family Food in 2012, Defra.
2.5: Percentage change in food purchases 2007-2012, in low income households (UK)
7 See Glossary for definition of equivalised income.

23
39%
7%
16%
14%
9%
4%
24%
20%
13%
12%
9%
8%
28%
41%
34%
27%
31%
35%
Price
Promotions
Quality or performance
Taste or smell
Healthy option
Use by date
F ili
Rated 1st
Rated 2nd
Rated 3rd 4th or 5th
39%
7%
16%
14%
9%
4%
7%
24%
20%
13%
12%
9%
8%
5%
5%
28%
41%
34%
27%
31%
35%
34%
28%
17%
15%
Price
Promotions
Quality or performance
Taste or smell
Healthy option
Use by date
Familiar
Brand
Ease of using
Ethical or eco-friendly
Rated 1st
Rated 2nd
Rated 3rd 4th or 5th
Prices & Expenditure
● Price is increasingly important in driving product choice, with 39% of shoppers naming it as the most important factor and more than 90% listing it within their top five influences.
● Quality was rated as the highest influence by 16% of respondents, followed by taste or smell that was rated highest by 14%.
● Promotions are highly influential with 68% listing it in the top 5 factors, although just 7% rated it as the most important, the same proportion as familiarity.
● Less importance is placed on healthy options, with only 9% of shoppers naming it as the most important influence.
● Brand names still have a sway in many purchase decisions, with 38% of shoppers naming in their top 5 influences.
● Ethically produced products were considered least important with 18% of shoppers naming it in their top 5 influences.
Source: IGD ShopperVista 2013.
2.6: Factors influencing consumer product choice8
8 IGD ShopperVista 2013, base: all main shoppers, fieldwork July 2013. Sample is managed to be representative of main grocery shoppers but may contain unquantifiable biases.

24
● Sales in “ethical” food and drink, including organic, fair-trade, free range and freedom foods rose to £7.7 billion in 20129, 8.5% of all household food sales.
● Sales of ethical produce have increased year on year since 2007, despite the economic downturn.
● Rainforest Alliance made up the largest share in 2012, accounting for 19% of the total ethical food sector at £2.0 billion; an increase of 47% on 2011. Fairtrade and organic products are the next largest contributors at 15% (£1.6 bn) and 13% (£1.3 bn).
● Yearly decreases in sales of organic food and drink have led to an overall decrease of 33% since their peak in 2008.
● Sales of sustainable fish rose by 20% in 2012 to £0.4 billion.
● Figures are determined by the Ethical Consumer Market Report by The Ethical Consumer Research Association based on administrative data held by ethical labelling organisations, trade associations and market research data.
Source: Ethical Consumer Markets Report 2013. Ethical Consumer Research Association.
0
1000
2000
3000
4000
5000
6000
7000
8000
1999 2000 2001 2002 2003 2004 2005 2006 2007 2008 2009 2010 2011 2012
Spe
nd £
mill
ion
Others*
Vegetarian meatalternativesFairtrade
Rainforest Alliance
Organic
2.7: UK trend in sales of ethical produce
Prices & Expenditure
9 Excludes food and drink boycotts.
25
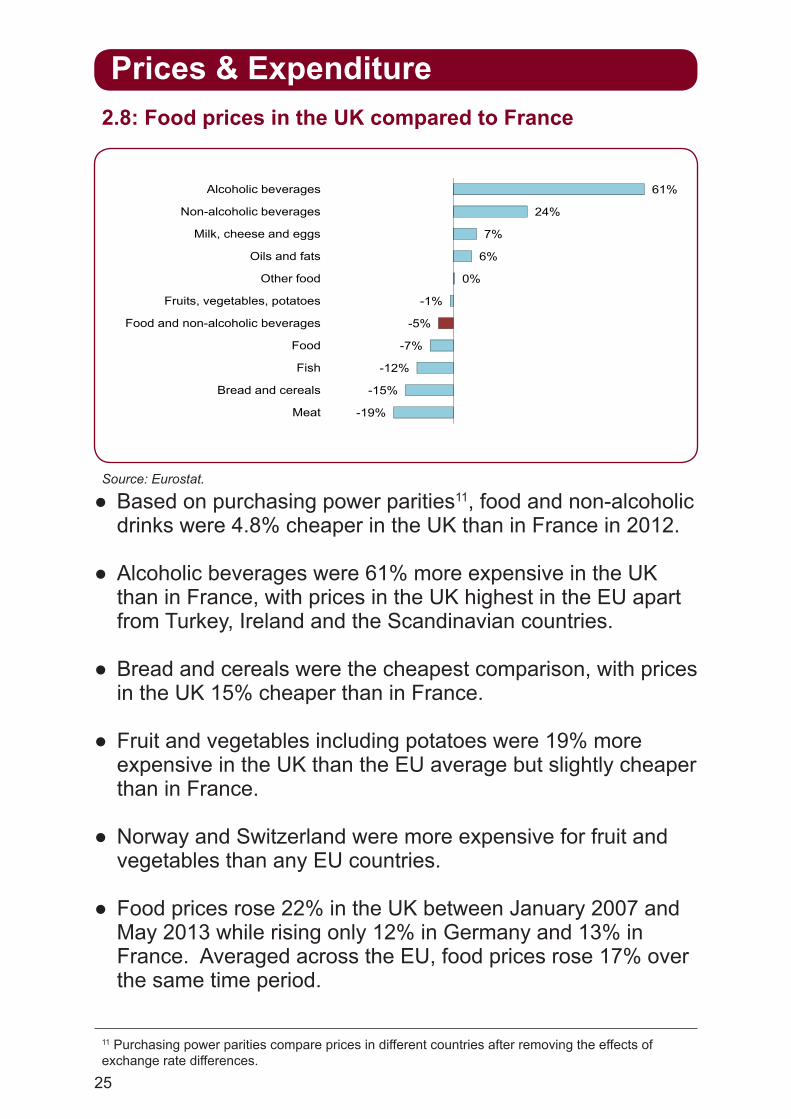
● Based on purchasing power parities11, food and non-alcoholic drinks were 4.8% cheaper in the UK than in France in 2012.
● Alcoholic beverages were 61% more expensive in the UK than in France, with prices in the UK highest in the EU apart from Turkey, Ireland and the Scandinavian countries.
● Bread and cereals were the cheapest comparison, with prices in the UK 15% cheaper than in France.
● Fruit and vegetables including potatoes were 19% more expensive in the UK than the EU average but slightly cheaper than in France.
● Norway and Switzerland were more expensive for fruit and vegetables than any EU countries.
● Food prices rose 22% in the UK between January 2007 and May 2013 while rising only 12% in Germany and 13% in France. Averaged across the EU, food prices rose 17% over the same time period.
Source: Eurostat.
24%
61%
Non-alcoholic beverages
Alcoholic beverages
6%
7%
24%
61%
Oils and fats
Milk, cheese and eggs
Non-alcoholic beverages
Alcoholic beverages
-5%
-1%
0%
6%
7%
24%
61%
Food and non-alcoholic beverages
Fruits, vegetables, potatoes
Other food
Oils and fats
Milk, cheese and eggs
Non-alcoholic beverages
Alcoholic beverages
-12%
-7%
-5%
-1%
0%
6%
7%
24%
61%
Fish
Food
Food and non-alcoholic beverages
Fruits, vegetables, potatoes
Other food
Oils and fats
Milk, cheese and eggs
Non-alcoholic beverages
Alcoholic beverages
-19%
-15%
-12%
-7%
-5%
-1%
0%
6%
7%
24%
61%
Meat
Bread and cereals
Fish
Food
Food and non-alcoholic beverages
Fruits, vegetables, potatoes
Other food
Oils and fats
Milk, cheese and eggs
Non-alcoholic beverages
Alcoholic beverages
-19%
-15%
-12%
-7%
-5%
-1%
0%
6%
7%
24%
61%
Meat
Bread and cereals
Fish
Food
Food and non-alcoholic beverages
Fruits, vegetables, potatoes
Other food
Oils and fats
Milk, cheese and eggs
Non-alcoholic beverages
Alcoholic beverages
-19%
-15%
-12%
-7%
-5%
-1%
0%
6%
7%
24%
61%
Meat
Bread and cereals
Fish
Food
Food and non-alcoholic beverages
Fruits, vegetables, potatoes
Other food
Oils and fats
Milk, cheese and eggs
Non-alcoholic beverages
Alcoholic beverages
2.8: Food prices in the UK compared to France
Prices & Expenditure
11 Purchasing power parities compare prices in different countries after removing the effects of exchange rate differences.
26
Chapter 3: Global & UK Supply
1 2012 figures are final.
2 UK Food Security Assessment, January 2010 (Defra).
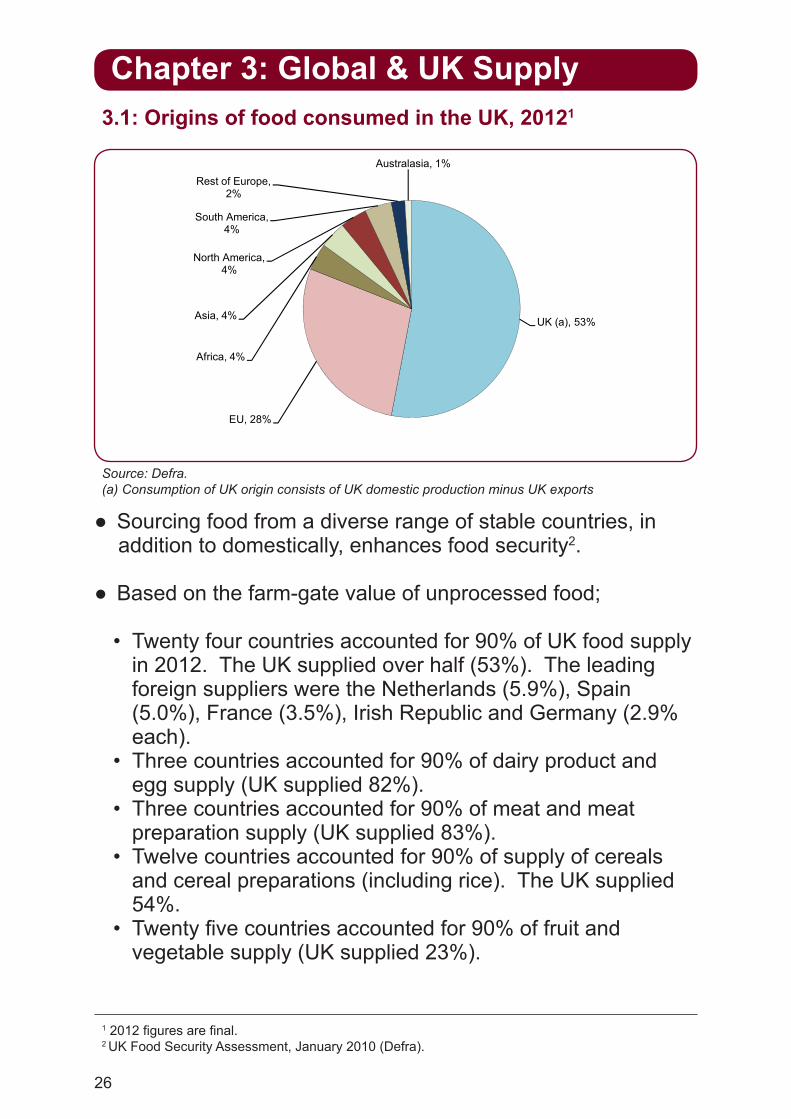
● Sourcing food from a diverse range of stable countries, in addition to domestically, enhances food security2.
● Based on the farm-gate value of unprocessed food;
• Twenty four countries accounted for 90% of UK food supply in 2012. The UK supplied over half (53%). The leading foreign suppliers were the Netherlands (5.9%), Spain (5.0%), France (3.5%), Irish Republic and Germany (2.9% each).
• Three countries accounted for 90% of dairy product and egg supply (UK supplied 82%).
• Three countries accounted for 90% of meat and meat preparation supply (UK supplied 83%).
• Twelve countries accounted for 90% of supply of cereals and cereal preparations (including rice). The UK supplied 54%.
• Twenty five countries accounted for 90% of fruit and vegetable supply (UK supplied 23%).
Source: Defra.(a) Consumption of UK origin consists of UK domestic production minus UK exports
3.1: Origins of food consumed in the UK, 20121
UK (a), 53%Asia, 4%
North America, 4%
South America, 4%
Rest of Europe, 2%
Australasia, 1%
UK (a), 53%
EU, 28%
Africa, 4%
Asia, 4%
North America, 4%
South America, 4%
Rest of Europe, 2%
Australasia, 1%
27
Global & UK Supply
30
40
50
60
70
80
90
100%
Indigenous Type Food
0
10
20
30
40
50
60
70
80
90
100%
Indigenous Type Food
All Food
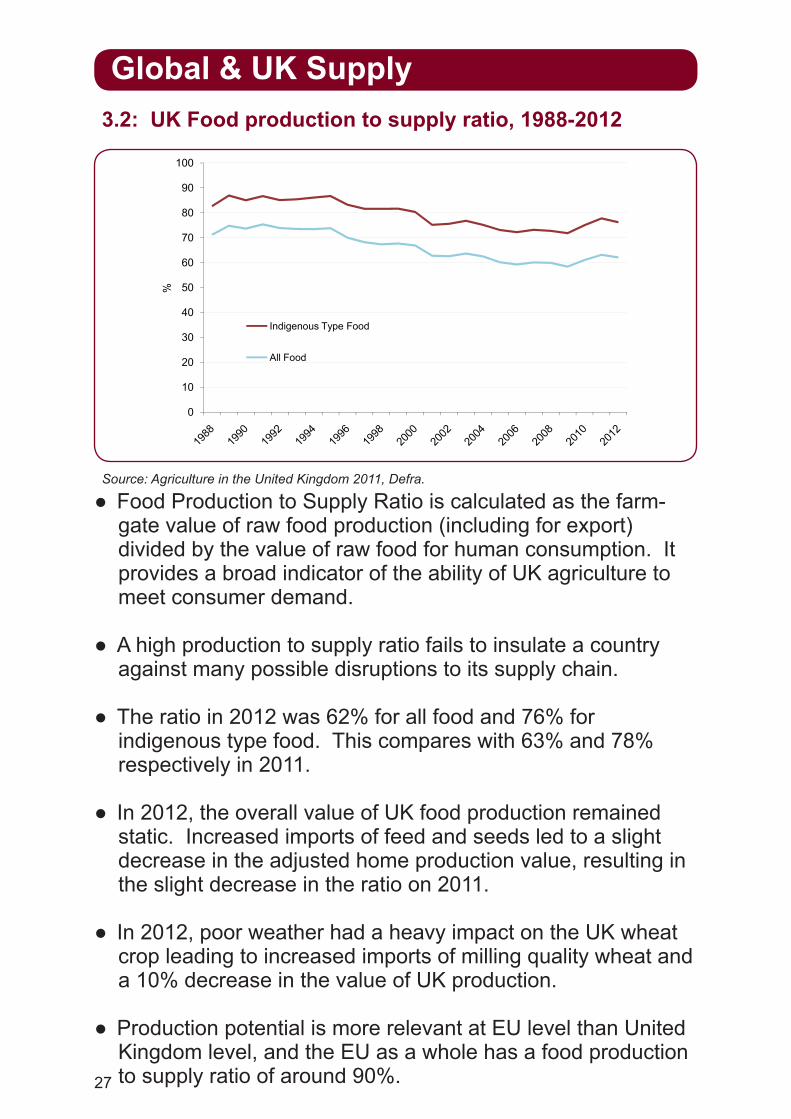
● Food Production to Supply Ratio is calculated as the farm-gate value of raw food production (including for export) divided by the value of raw food for human consumption. It provides a broad indicator of the ability of UK agriculture to meet consumer demand.
● A high production to supply ratio fails to insulate a country against many possible disruptions to its supply chain.
● The ratio in 2012 was 62% for all food and 76% for indigenous type food. This compares with 63% and 78% respectively in 2011.
● In 2012, the overall value of UK food production remained static. Increased imports of feed and seeds led to a slight decrease in the adjusted home production value, resulting in the slight decrease in the ratio on 2011.
● In 2012, poor weather had a heavy impact on the UK wheat crop leading to increased imports of milling quality wheat and a 10% decrease in the value of UK production.
● Production potential is more relevant at EU level than United Kingdom level, and the EU as a whole has a food production to supply ratio of around 90%.
Source: Agriculture in the United Kingdom 2011, Defra.
3.2: UK Food production to supply ratio, 1988-2012

28
Global & UK Supply
60
80
100
120
140
160
Inde
x 19
90 =
100
Trends in quantity of final output by UK agriculture Total cereals
Fresh fruit and vegetables
Potatoes
Meat
Poultry meat
Milk
20
40
60
80
100
120
140
160
1990 1992 1994 1996 1998 2000 2002 2004 2006 2008 2010 2012
Inde
x 19
90 =
100
Trends in quantity of final output by UK agriculture Total cereals
Fresh fruit and vegetables
Potatoes
Meat
Poultry meat
Milk
Final output at market prices (gross output less transactions within the industry)
Source: Agriculture in the United Kingdom 2011, Defra.
● Final output4 of UK agriculture is a proxy for UK food production. It fell by 3.7% in 2012 due to lower volumes of outputs as a result of the poor weather conditions. Longer term trends have shown little variation.
● Total UK cereal production has fluctuated, with significant dips in 2001, 2007 and 2012 linked to adverse weather conditions.
● Since 1990 there have been large increases in production levels of poultry meat, part of a longer term upward trend since the late 1970’s. Although production dipped during the 2000’s, it reached a record level in 2012 with steady growth in broiler, turkey and boiling fowl meat production.
● Red meat production showed a downward trend through much of the 1990’s, driven by a combination of factors including the beef export ban. Since 2002 there has been a slight upward movement but levels still remain lower than those in the early 1990’s.
3.3: Trends in UK food production3
3 2012 figures are provisional. 4 Gross output less transactions within the industry.

29
Global & UK Supply
0123456789
10Fr
uit a
nd ve
g
Mea
t
Beve
rage
s
Cere
als
Dairy
& e
ggs
Fish
Misc
.
Coffe
e, te
a,co
coa e
tc.
Anim
al fe
ed Oils
Suga
r
£ billi
on
.
Imports Exports
● The value of imports is greater than the value of exports in each of the broad categories of food, feed and drink except ‘Beverages’ which had a trade surplus of £1.71 bn in 2013, largely due to exports of Scotch Whisky.
● Beverages are the largest export category by far with an export value of £6.9 bn in 2013. Exports (at 2013 prices) rose 25% between 2009 and 2011, due largely to increases in the existing markets. Decreases between 2011 and 2013 have reduced the export value by 3.8% (£277 million).
● Cereals is the second largest export group with a value of £1.9 bn, followed by the meat and fish categories at £1.7 and £1.5 bn respectively.
● ‘Fruit and vegetables’ has the largest trade deficit. In 2013 imports cost £9.0 bn while exports were worth £1.0 bn, giving a trade gap of £8.0 bn.
● The second largest groups in terms of imports in 2013 were meat and beverages with imports of £5.9 and £5.2 bn respectively.
Source: HM Revenue and Customs.
3.4: UK trade in different food groups, 20135
5 2013 figures are provisional.
30
Global & UK Supply
13.013.313.815.4
16.417.7
19.318.718.9
0
5
10
15
20
2519
95
1996
1997
1998
1999
2000
2001
2002
2003
2004
2005
2006
2007
2008
2009
2010
2011
2012
2013
£ bi
llion
6 2013 figures are provisional.
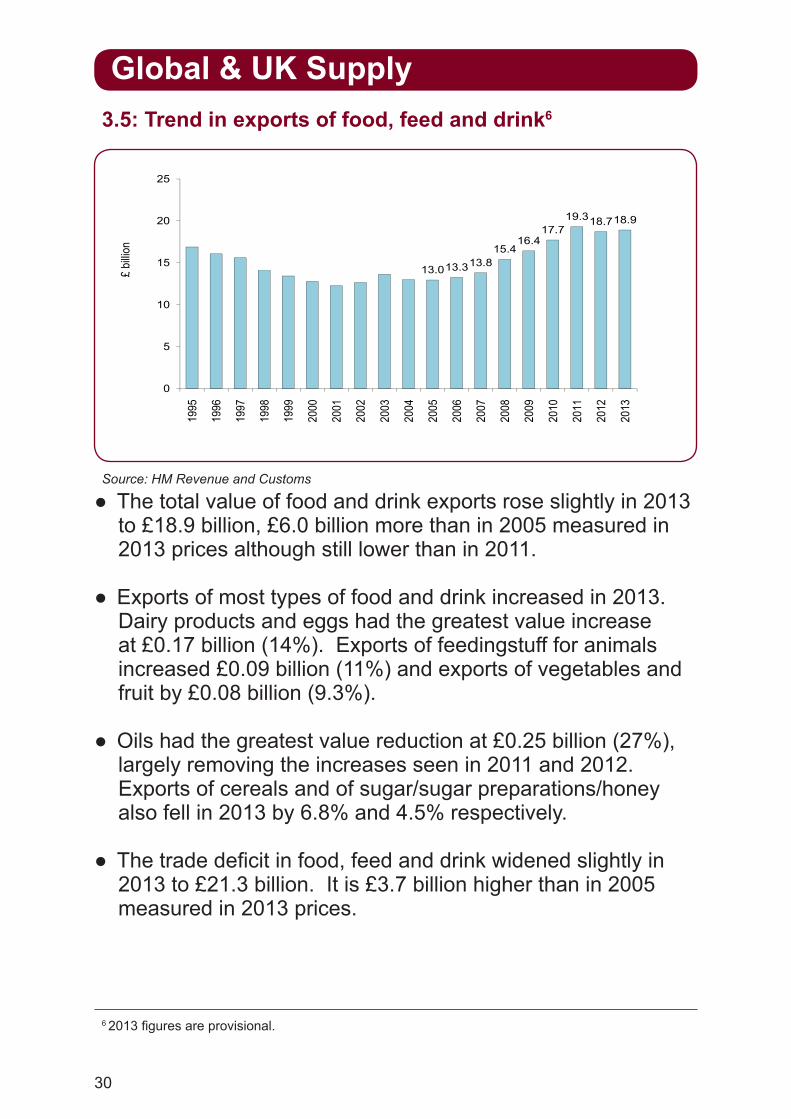
● The total value of food and drink exports rose slightly in 2013 to £18.9 billion, £6.0 billion more than in 2005 measured in 2013 prices although still lower than in 2011.
● Exports of most types of food and drink increased in 2013. Dairy products and eggs had the greatest value increase at £0.17 billion (14%). Exports of feedingstuff for animals increased £0.09 billion (11%) and exports of vegetables and fruit by £0.08 billion (9.3%).
● Oils had the greatest value reduction at £0.25 billion (27%), largely removing the increases seen in 2011 and 2012. Exports of cereals and of sugar/sugar preparations/honey also fell in 2013 by 6.8% and 4.5% respectively.
● The trade deficit in food, feed and drink widened slightly in 2013 to £21.3 billion. It is £3.7 billion higher than in 2005 measured in 2013 prices.
Source: HM Revenue and Customs
3.5: Trend in exports of food, feed and drink6
31
Global & UK Supply
100
120
140
ex 200
4‐20
06 = 100
Average Dietary Energy RequirementDietary Energy SupplyTotal PopulationPrevalence of undernourishment
60
80
100
120
140
1990-92 1992-94 1994-96 1996-98 1998-00 2000-02 2002-04 2004-06 2006-08 2008-10 2010-12
Inde
x 20
04‐200
6 = 10
0
Average Dietary Energy RequirementDietary Energy SupplyTotal PopulationPrevalence of undernourishment
7Calculated on three-year averages to reduce the impact of errors in recording annual stock variations. 8The amount of dietary energy that would be needed to ensure that, if properly distributed, hunger would be eliminated. 9Global monitoring report 2013, World Bank.
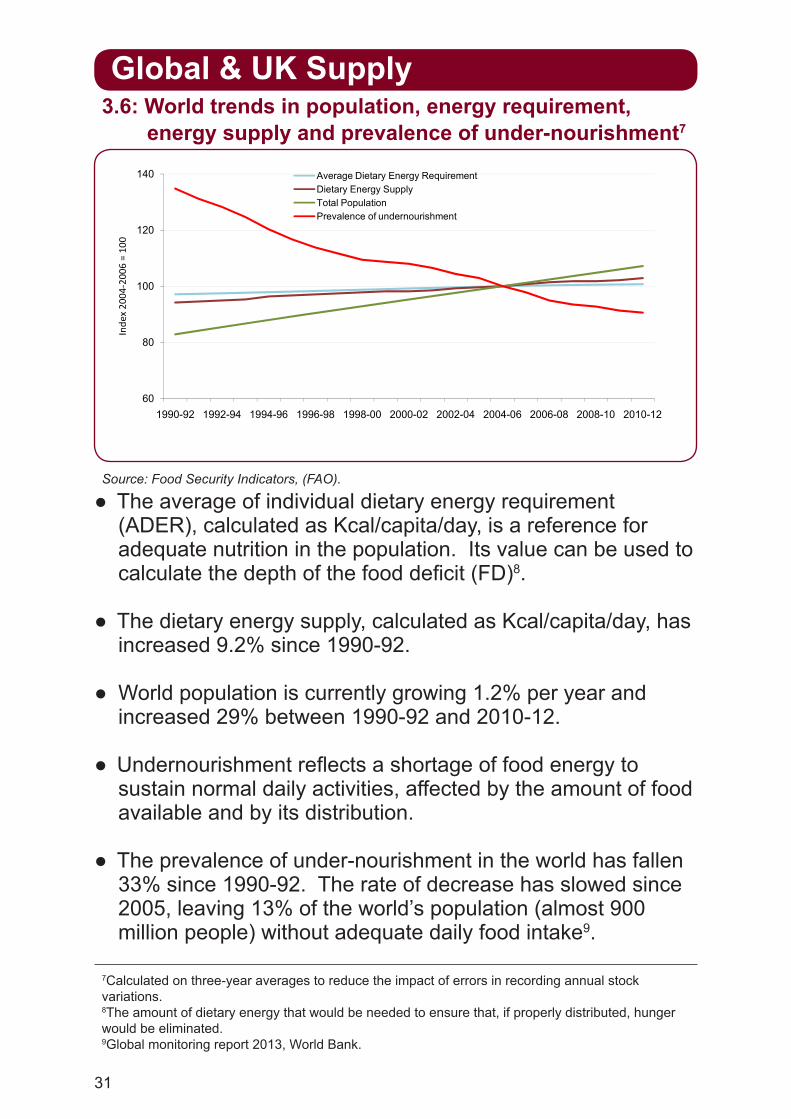
● The average of individual dietary energy requirement (ADER), calculated as Kcal/capita/day, is a reference for adequate nutrition in the population. Its value can be used to calculate the depth of the food deficit (FD)8.
● The dietary energy supply, calculated as Kcal/capita/day, has increased 9.2% since 1990-92.
● World population is currently growing 1.2% per year and increased 29% between 1990-92 and 2010-12.
● Undernourishment reflects a shortage of food energy to sustain normal daily activities, affected by the amount of food available and by its distribution.
● The prevalence of under-nourishment in the world has fallen 33% since 1990-92. The rate of decrease has slowed since 2005, leaving 13% of the world’s population (almost 900 million people) without adequate daily food intake9.
Source: Food Security Indicators, (FAO).
3.6: World trends in population, energy requirement, energy supply and prevalence of under-nourishment7
32
Global & UK Supply
100
150
200
250
Inde
x (2
009=
100)
Wheat Rice Sugar Beef Palm oil
0
50
100
150
200
250
Inde
x (2
009=
100)
Wheat Rice Sugar Beef Palm oil
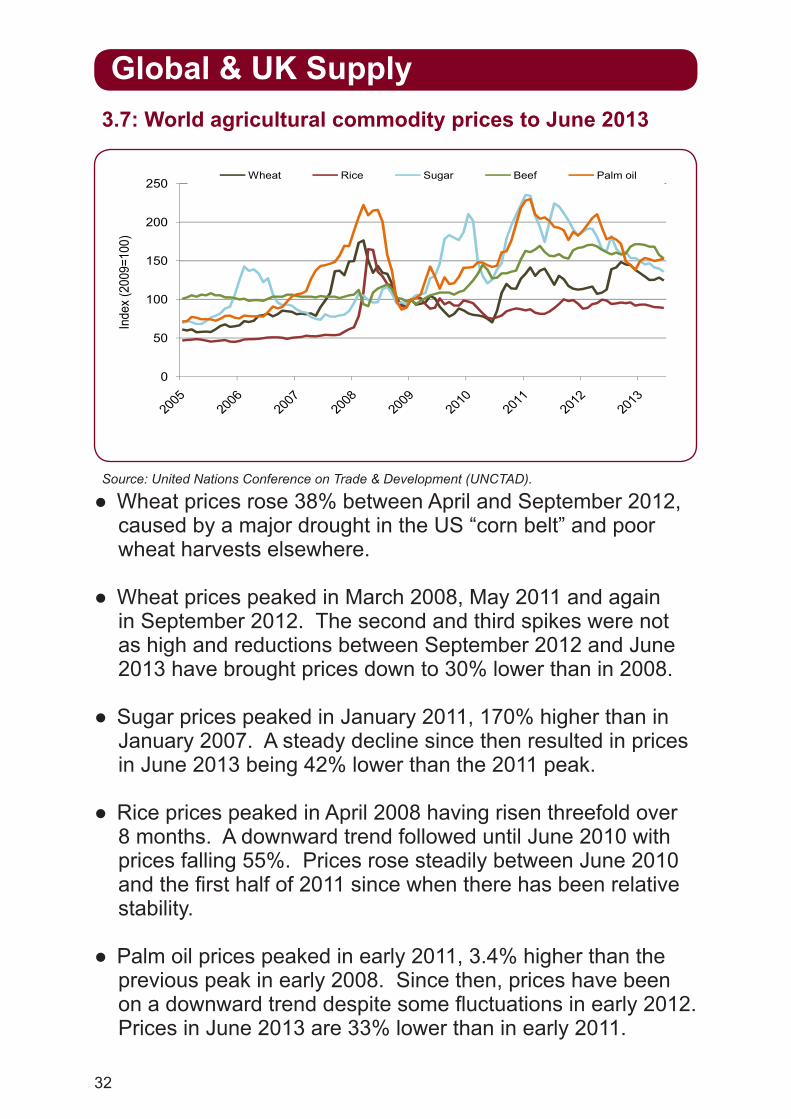
● Wheat prices rose 38% between April and September 2012, caused by a major drought in the US “corn belt” and poor wheat harvests elsewhere.
● Wheat prices peaked in March 2008, May 2011 and again in September 2012. The second and third spikes were not as high and reductions between September 2012 and June 2013 have brought prices down to 30% lower than in 2008.
● Sugar prices peaked in January 2011, 170% higher than in January 2007. A steady decline since then resulted in prices in June 2013 being 42% lower than the 2011 peak.
● Rice prices peaked in April 2008 having risen threefold over 8 months. A downward trend followed until June 2010 with prices falling 55%. Prices rose steadily between June 2010 and the first half of 2011 since when there has been relative stability.
● Palm oil prices peaked in early 2011, 3.4% higher than the previous peak in early 2008. Since then, prices have been on a downward trend despite some fluctuations in early 2012. Prices in June 2013 are 33% lower than in early 2011.
Source: United Nations Conference on Trade & Development (UNCTAD).
3.7: World agricultural commodity prices to June 2013

33
Global & UK Supply
20%
25%
30%
35%
40%
45%
50%
perc
enta
ge o
f con
sum
ption
Coarse Grains Wheat Rice
0%
5%
10%
15%
20%
25%
30%
35%
40%
45%
50%
89/90 91/92 93/94 95/96 97/98 99/00 01/02 03/04 05/06 07/08 09/10 11/12
Stoc
ks a
s a p
erce
ntag
e of
cons
umpt
ion
Coarse Grains Wheat Rice
10 USDA projections.
● Stocks to consumption ratios are an indicator of global resilience to food shortages and price stability. With low stocks, markets become sensitive to further supply shortfalls, which magnifies the price response.
● Wheat and rice stocks remain relatively high at the end of the 2012-13 crop year, although the downward trend in wheat stocks is projected to continue in 2013-1410. Rice stocks have been on an upward trend since 2004-05.
● Severe drought in the USA in 2012 significantly reduced global production of maize, so the coarse grain stocks-to-use ratio fell 2 percentage points to a new low of 13% in 2012-13. Stock levels are expected to be restored in 2013-14.
● Consumption (the denominator) is on a gradually rising trend, pushing the indicator onto a downward trend.
Source: International Grains Council (IGC), United States Department of Agriculture (USDA).
3.8: World grains stocks to consumption ratio to 2012-13

34
Global & UK Supply
Stayed the same
Increased by up to 9%
Increased by 10-49%
Increased by 50% or more
Manufacturers Retailers
0 10 20 30 40 50
Fallen by 50% or more
Fallen by 10-49%
Fallen by up to 9%
Stayed the same
Increased by up to 9%
Increased by 10-49%
Increased by 50% or more
Manufacturers Retailers
11 The time between an order being placed and delivery.
● In the last five years, the industry has largely reduced warehouse stock levels. 72% of manufacturers and 65% of retailers have made at least some reduction over this period.
● The majority of retail supply chains have between one and four weeks of stock, with suppliers tending to hold higher levels of stock than retailers. For fresh produce, stock levels can sometimes be only 24 hours or less.
● As retail supply chains become more responsive, lead times11 are reducing and order frequencies are increasing.
● Retailers are increasingly moving products into their stockless networks, managing products from across their ranges in the same way as the fresh and produce categories.
● The impact of the current economic climate on consumer spending has helped drive this change as retailers look at ways of funding price cuts; supply chain operating costs and working capital tied up in inventory has provided such an opportunity.
Source: IGD Research, 2012.
3.9: Retailer warehouse stock levels 5-year change

35
Chapter 4: Environment
3
55
13 12 116
18
61
0
10
20
30
40
50
60
70
es o
f CO 2
equiv
alent
(mt C
O 2e)
3
55
13 12 116
18
61
0
10
20
30
40
50
60
70
Fertil
iser
Farm
ing an
d fis
hing
Manu
factur
ing
Com
mer
cial
trans
porta
tion
Retai
l
Cater
ing
Hous
ehold
s
Net tr
ade
Millio
n ton
nes o
f CO 2
equiv
alent
(mt C
O 2e)
1 GHG emissions from food packaging, food waste and land use change are not included. Manufacturing includes emissions from electricity use and excludes emissions from road freight transport. Household does not include emissions from heating water for washing up or dishwashers. 2 Emissions from food imports less emissions from food exports.
● Around 176 million tonnes of CO2 equivalent GHGs (mt CO2e) were emitted within the UK from domestic food sector activity in 2011, excluding emissions from non-fertiliser pre-farm production, food packaging, food waste and land use change; the largest contributor being net trade2 in food and drink, estimated at 61 mt CO2e.
● TheUKfarmingandfishingsectorwasthesecondlargestcontributor, accounting for 55.1mt CO2e. It was the only sector to increase emissions in the last year, rising by 0.9 mt CO2e; a return to pre-recession levels. Enteric fermentation in ruminating animals and oxidisation of nitrogen in fertilisers is the source of most of these emissions.
● All other sectors had similar or decreased emissions, most noticeable being a 3% fall in household emissions.
Source: Environmental accounts (ONS), Food Transport Indicators (Defra), Energy Consumption in the UK (DECC), British Survey of Fertiliser Practice (Defra), Consumption Emissions (Defra).
4.1: Greenhouse gas (GHG) emissions from the UK agri-food sector, 20111
36
Environment
7.98 0
9.0
5 2
7.9
5.46.0
7.0
8.0
9.0
uiva
lent
2 4
5.24.3
4.9
2 7
7.9
5.4
4.0
5.0
6.0
7.0
8.0
9.0
nes o
il equ
ivale
nt
1.3
2.4
5.24.3
4.9
2.7
7.9
5.4
1.0
2.0
3.0
4.0
5.0
6.0
7.0
8.0
9.0
Milli
on to
nnes
oil e
quiva
lent
1.3
2.4
5.24.3
4.9
2.7
7.9
5.4
0.0
1.0
2.0
3.0
4.0
5.0
6.0
7.0
8.0
9.0er
tilise
r
ng a
nd
hing
ctur
ing
mer
cial
orta
tion
Reta
il
ater
ing
ehol
ds
et tr
ade
Milli
on to
nnes
oil e
quiva
lent
1.3
2.4
5.24.3
4.9
2.7
7.9
5.4
0.0
1.0
2.0
3.0
4.0
5.0
6.0
7.0
8.0
9.0Fe
rtilis
er
Farm
ing
and
fishi
ng
Man
ufac
turin
g
Com
mer
cial
trans
porta
tion
Reta
il
Cate
ring
Hous
ehol
ds
Net t
rade
Milli
on to
nnes
oil e
quiva
lent
1.3
2.4
5.24.3
4.9
2.7
7.9
5.4
0.0
1.0
2.0
3.0
4.0
5.0
6.0
7.0
8.0
9.0Fe
rtilis
er
Farm
ing
and
fishi
ng
Man
ufac
turin
g
Com
mer
cial
trans
porta
tion
Reta
il
Cate
ring
Hous
ehol
ds
Net t
rade
Milli
on to
nnes
oil e
quiva
lent
3 Household does not include emissions from heating water for washing up or dishwashers. Primary energy is the energy used in electricity production, not the amount of electricity used. 4 Digest of United Kingdom Energy Statistics (DECC). Data excludes energy used to generate heat for all fuels except manufactured solid fuels and electricity.
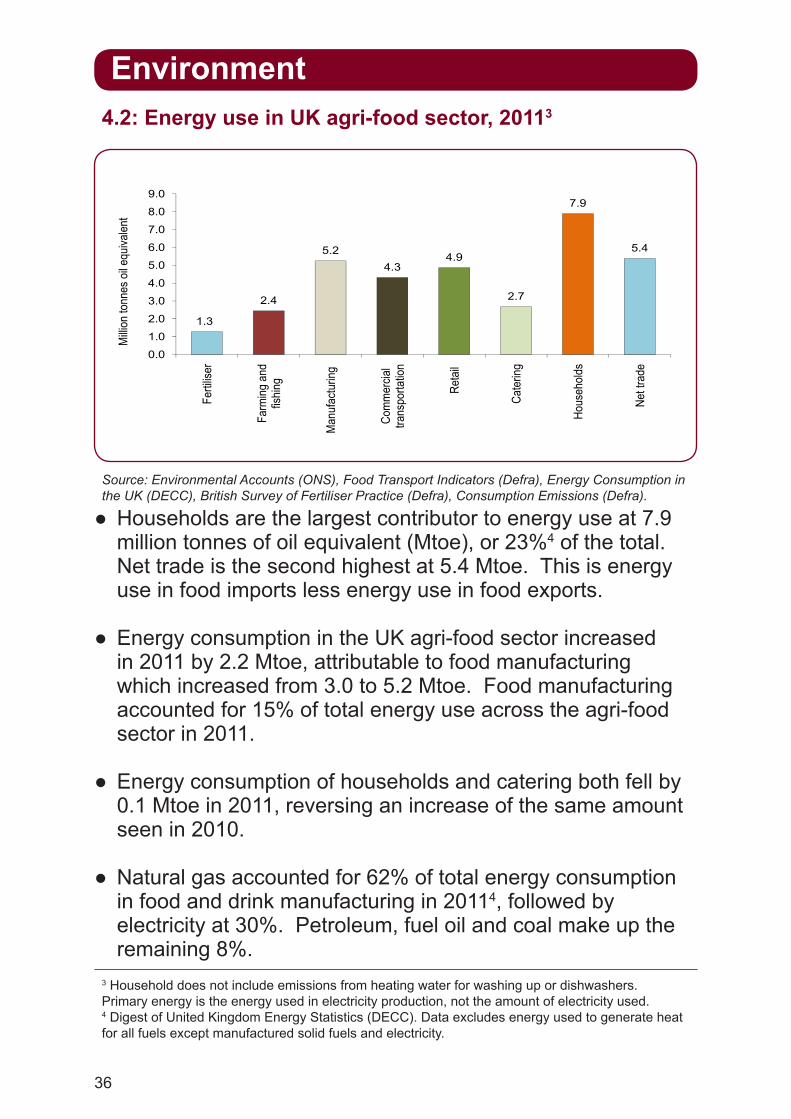
● Households are the largest contributor to energy use at 7.9 million tonnes of oil equivalent (Mtoe), or 23%4 of the total. Net trade is the second highest at 5.4 Mtoe. This is energy use in food imports less energy use in food exports.
● Energy consumption in the UK agri-food sector increased in 2011 by 2.2 Mtoe, attributable to food manufacturing which increased from 3.0 to 5.2 Mtoe. Food manufacturing accounted for 15% of total energy use across the agri-food sector in 2011.
● Energy consumption of households and catering both fell by 0.1 Mtoe in 2011, reversing an increase of the same amount seen in 2010.
● Natural gas accounted for 62% of total energy consumption in food and drink manufacturing in 20114, followed by electricity at 30%. Petroleum, fuel oil and coal make up the remaining 8%.
Source: Environmental Accounts (ONS), Food Transport Indicators (Defra), Energy Consumption in the UK (DECC), British Survey of Fertiliser Practice (Defra), Consumption Emissions (Defra).
4.2: Energy use in UK agri-food sector, 20113

37
Environment
70
80
90
100
110
Inde
x 19
90 =
100
Food and drink manufacturing
UK manufacturing
50
60
70
80
90
100
110
1990
1991
1992
1993
1994
1995
1996
1997
1998
1999
2000
2001
2002
2003
2004
2005
2006
2007
2008
2009
2010
2011
Inde
x 19
90 =
100
Food and drink manufacturing
UK manufacturing
Total domestic CO2 emissions
● CO2 emissions from UK manufacturing, including food and drink manufacturing have been on a downward trend since 1999, despite increases in 2010 and 2011.
● Since 1990, the downward trend in CO2 emissions from UK manufacturing sectors follows a similar pattern to the downward trend in total domestic emissions. In 2011, total domestic CO2 emissions fell 7.0% on 2010, 28% below 1990 levels.
● The volume of output from food and drink manufacturing fell between 2007 and 2009 during the economic downturn, leading to a reduction in the level of CO2 emissions.
● An increase in the volume of outputs along with a prolonged period of exceptionally cold weather produced an increase in emissions during 2010 and into 2011. 2011 saw a reduction in GHG emissions from combustion; in particular, from natural gas combustion.
Source: Environmental Accounts (ONS), Energy Consumption in the UK (DECC).
4.3: Trend in CO2 emissions from UK food and drink manufacturing, 1990-20115
5ManufacturingfiguresincludetheshareofCO2 emissions relating to electricity production using a constant emission factor. Total domestic CO2 emissions include net emissions/removals from land use and land use change but with no allowance for EU Emission Trading Scheme purchases.

38
Environment
120
130
140
150
ndex
199
2=10
0
Urban food kilometres
Carbon dioxide emissions (CO2)
HGV food kilometres
100
110
120
130
140
150
1992 1997 2002 2003 2004 2005 2006 2007 2008 2009 2010
inde
x 19
92=1
00
Urban food kilometres
Carbon dioxide emissions (CO2)
HGV food kilometres
Air food kilometres
6 Air, urban and HGV are measured in vehicle kilometres, CO2 emissions are measured in tonnes.
● The external impacts of food transport peaked in 2006-2007. Although 3 out of the 4 indicators showed an increase in 2010, the underlying trends may not have changed.
● UK urban food kilometres increased by 6.4% from 2009 to 2010 but there is little evidence of a clear trend in the data:
• CO2 emissions from food transport increased 4.1% in 2010 but remain 4.0% lower than in 2006, suggesting an underlying downward trend remains.
• HGV food kilometres increased by 6.9% in 2010, broadly in line with other national economic outputs measures. A downward trend in HGV food kilometres since 2004 is apparent despite the increase in 2010.
● Urban food kilometres is a proxy for urban road congestion; HGV food kilometres is a proxy for infrastructure costs.
● Air food kilometres have fallen after a period of rapid growth up to 2007, with some evidence that this is stabilising at around 2003 levels. Although air freight of food accounts for only 1% of food tonne kilometres, it produces 12% of the food transport CO2 emissions.
Source : Food Transport Indicators (Defra).
4.4: Indicators of the external impact of food transport6
150200250300350400
Air food Kilometres
050
100150200250300350400
19921997200220032004200520062007200820092010
Air food Kilometres
39
Environment
Dairy, 20%Dairy, 20%Other*, 38%
Dairy, 20%
Meat
Other*, 38%Dairy, 20%
Meatprocessing*, 18%
Other*, 38%Dairy, 20%
Meatprocessing*, 18%
Soft drinks , 10%Bakery, 1%
Other*, 38%Dairy, 20%
Meatprocessing*, 18%
Soft drinks , 10%
Snack foods, 4%ConfectioneryFruit and
Pre-preparedfoods, 3%
Bakery, 1%
Other*, 38%Dairy, 20%
Meatprocessing*, 18%
Soft drinks , 10%
Snack foods, 4%Confectionery,3%
Fruit and vegetables, 3%
Pre-preparedfoods, 3%
Bakery, 1%
Other*, 38%
* Meatprocessingincludesredmeatandpoultry.‘Other’includesfishprocessing,alcoholicbeverages, pet food and animal feed, milling, desserts, sauces and condiments. 7 The FHC is managed by WRAP in partnership with the Food and Drink Federation and Dairy UK and supported by the Environment Agency: More information at www.fhc2020.co.uk
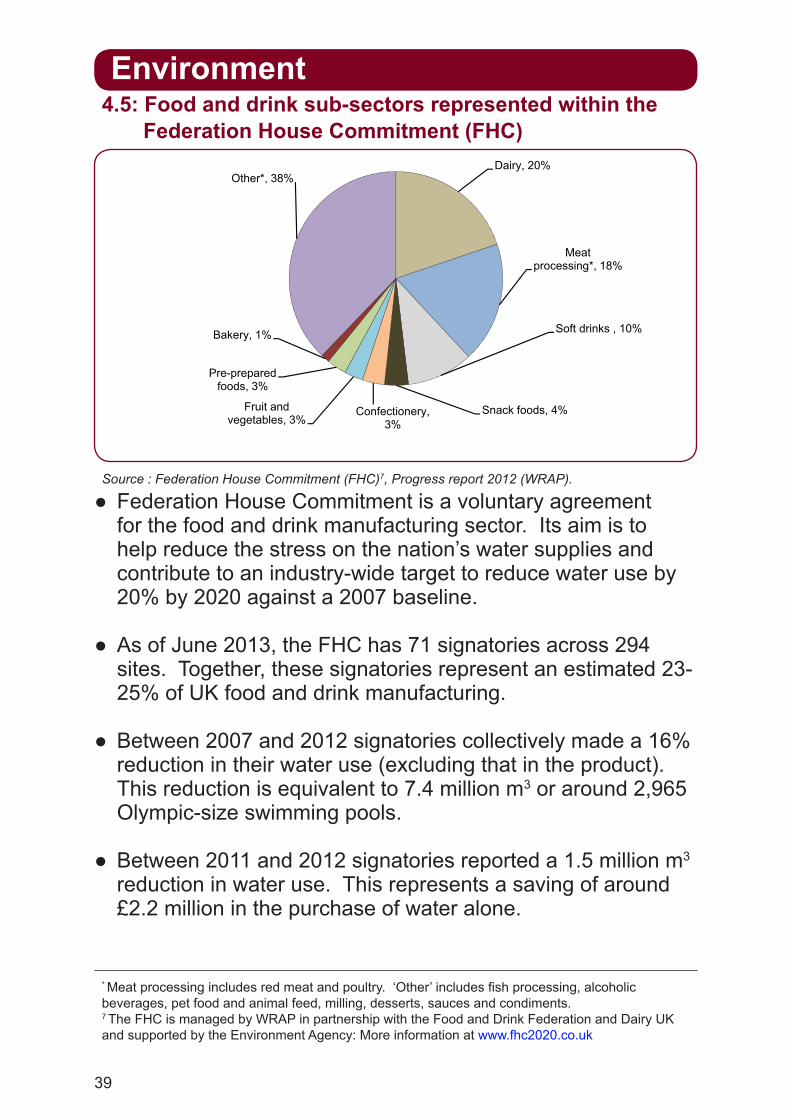
● Federation House Commitment is a voluntary agreement for the food and drink manufacturing sector. Its aim is to help reduce the stress on the nation’s water supplies and contribute to an industry-wide target to reduce water use by 20% by 2020 against a 2007 baseline.
● As of June 2013, the FHC has 71 signatories across 294 sites. Together, these signatories represent an estimated 23-25% of UK food and drink manufacturing.
● Between 2007 and 2012 signatories collectively made a 16% reduction in their water use (excluding that in the product). This reduction is equivalent to 7.4 million m3 or around 2,965 Olympic-size swimming pools.
● Between 2011 and 2012 signatories reported a 1.5 million m3 reduction in water use. This represents a saving of around £2.2 million in the purchase of water alone.
Source : Federation House Commitment (FHC)7, Progress report 2012 (WRAP).
4.5: Food and drink sub-sectors represented within the Federation House Commitment (FHC)
40
Chapter 5: Waste
7.2
3.2 3.3
2
3
4
5
6
7
8
lion t
onne
s per
year
An estimate for other sectors which
includes other parts of the hospitality and food service sectors
7.2
3.2
0.6 0.4 0.08 0.004
3.3
0
1
2
3
4
5
6
7
8
Hous
ehold
Manu
factur
ing
Hosp
itality
Retai
l
Scho
ols(E
nglan
d on
ly)
Distr
ibutio
n
Othe
r sec
tors
Millio
n ton
nes p
er ye
ar
An estimate for other sectors which
includes other parts of the hospitality and food service sectors
1 Excluding agriculture apart from the ‘other sectors’ data which includes an estimate for agriculture. 2 For the latest available data please go to: Handy facts and figures on waste in the UK. 3 This data covers landfill waste from hotels, pubs, restaurants and quick service restaurants. 4 See: Food waste in schools, WRAP 2011.
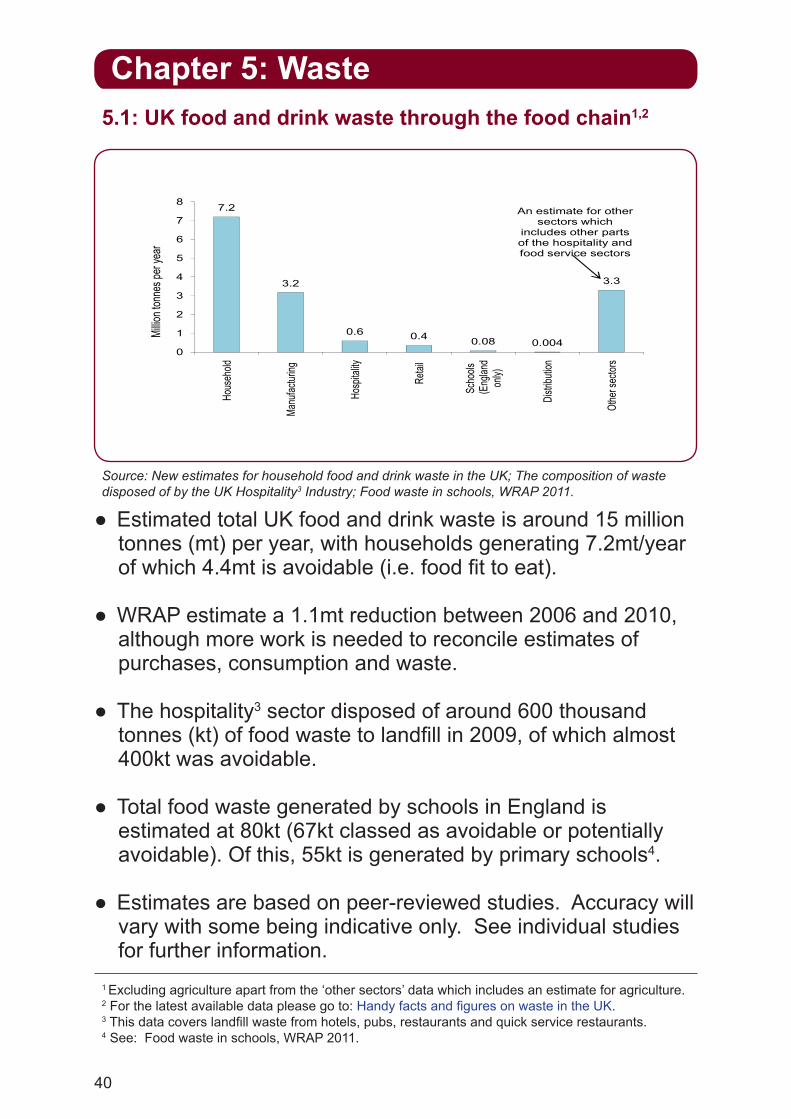
● Estimated total UK food and drink waste is around 15 million tonnes (mt) per year, with households generating 7.2mt/year of which 4.4mt is avoidable (i.e. food fit to eat).
● WRAP estimate a 1.1mt reduction between 2006 and 2010, although more work is needed to reconcile estimates of purchases, consumption and waste.
● The hospitality3 sector disposed of around 600 thousand tonnes (kt) of food waste to landfill in 2009, of which almost 400kt was avoidable.
● Total food waste generated by schools in England is estimated at 80kt (67kt classed as avoidable or potentially avoidable). Of this, 55kt is generated by primary schools4.
● Estimates are based on peer-reviewed studies. Accuracy will vary with some being indicative only. See individual studies for further information.
Source: New estimates for household food and drink waste in the UK; The composition of waste disposed of by the UK Hospitality3 Industry; Food waste in schools, WRAP 2011.
5.1: UK food and drink waste through the food chain1,2

41
Waste
15%17%
32%24%24%
20%17%
0% 5% 10% 15% 20% 25% 30% 35%
All food and drinkAll foodBread
VegetablesPotatoes
FruitCereal products
15%17%
32%24%24%
20%17%
14%13%
8.5%7.1%
6.3%
0% 5% 10% 15% 20% 25% 30% 35%
All food and drinkAll foodBread
VegetablesPotatoes
FruitCereal products
Desserts and other productsMeat and fish
Dairy and eggsSoft drinks
Alcoholic drinks
5 For the latest available data please go to: Handy facts and figures on waste in the UK.
6 Data was collected between 2006 and 2008.
7 Calculated as total purchases minus the difference between total waste and avoidable waste.
● Overall 15% of edible food and drink purchases are wasted each year. Different foods are wasted at different rates; 17% of overall food purchases, 7.1% of soft drinks and 6.3% of alcoholic drinks are wasted.
● Avoidable food and drink waste in the home is estimated by WRAP at £12 billion per year or £480 per household.
● ‘Not used in time’ is often cited as the reason for throwing away food. Bread is the most wasted food with 32% of edible purchases7 being wasted. Bread crusts are not classed as edible in this analysis.
● Vegetables and potatoes are wasted at a similar rate (24%), equivalent to 730 thousand tonnes of edible vegetables and 400 thousand tonnes of edible potatoes wasted per year.
● On a calorie basis, 16% of food and drink is wasted. Some nutrients have a higher level of waste e.g. carbohydrate at 20% and fibre at 23%. Some nutrients are wasted far less e.g. non-milk extrinsic sugars (found in confectionery, soft drinks, fruit juices and biscuits) at 9.3%.
5.2: UK percentage of edible household food purchases that are wasted5
Source: Household food and drink purchases linked to waste, Defra 20106.
42
Waste
167154
180 167154
140
160
180
Avoidable Unavoidable
167154
87100
120
140
160
180
Avoidable Unavoidable
nd to
nnes
167154
40 39
7387
60
80
100
120
140
160
180
Avoidable Unavoidable
hous
and t
onne
s
167154
40 39
7387
231520
40
60
80
100
120
140
160
180
Avoidable Unavoidable
Thou
sand
tonn
es
167154
40 39
7387
2315
0
20
40
60
80
100
120
140
160
180
Restaurants Pubs Hotels Quick Service
Avoidable Unavoidable
Thou
sand
tonn
es
167154
40 39
7387
2315
0
20
40
60
80
100
120
140
160
180
Restaurants Pubs Hotels Quick Service Restaurants
Avoidable Unavoidable
Thou
sand
tonn
es
167154
40 39
7387
2315
0
20
40
60
80
100
120
140
160
180
Restaurants Pubs Hotels Quick Service Restaurants
Avoidable Unavoidable
Thou
sand
tonn
es
8 For the latest available data please go to: Handy facts and figures on waste in the UK. 9 This data covers 4 areas of the hospitality sector: UK hotels, pubs, restaurants and quick service restaurants. It only covers waste disposed to landfill. 10 See: The composition of waste disposed of by the UK Hospitality Industry, WRAP 2011 for definitions.
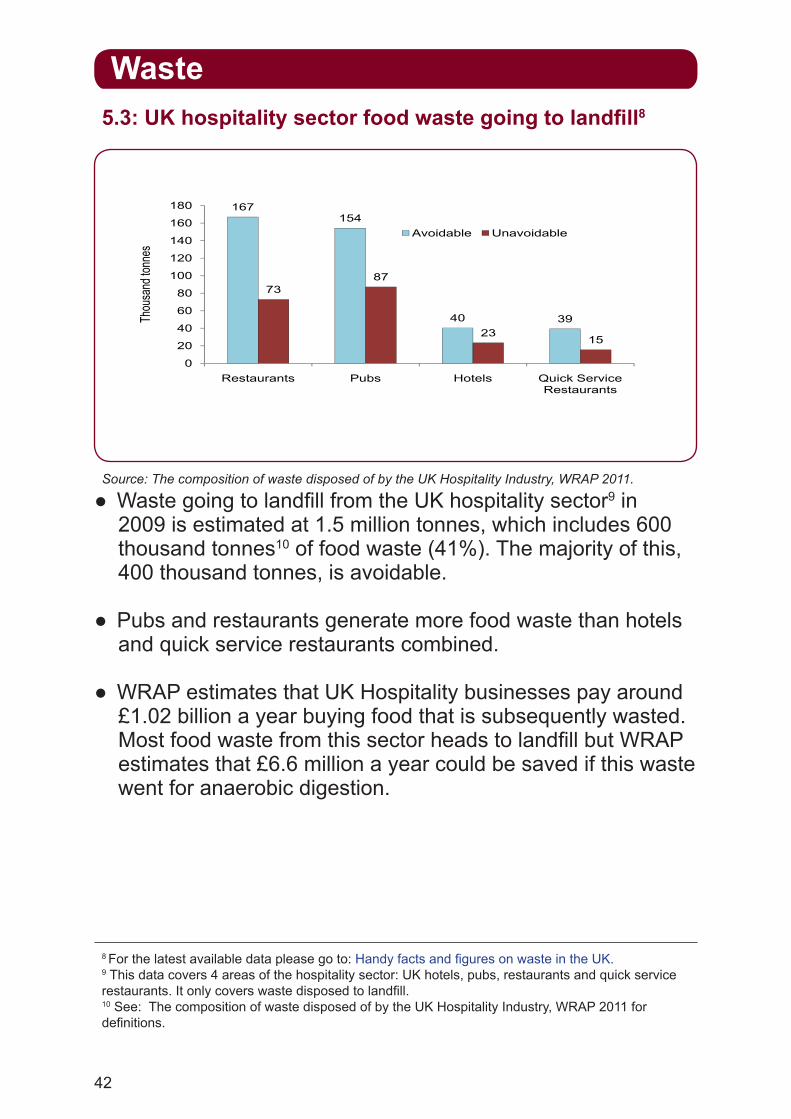
● Waste going to landfill from the UK hospitality sector9 in 2009 is estimated at 1.5 million tonnes, which includes 600 thousand tonnes10 of food waste (41%). The majority of this, 400 thousand tonnes, is avoidable.
● Pubs and restaurants generate more food waste than hotels and quick service restaurants combined.
● WRAP estimates that UK Hospitality businesses pay around £1.02 billion a year buying food that is subsequently wasted. Most food waste from this sector heads to landfill but WRAP estimates that £6.6 million a year could be saved if this waste went for anaerobic digestion.
Source: The composition of waste disposed of by the UK Hospitality Industry, WRAP 2011.
5.3: UK hospitality sector food waste going to landfill8
43
Waste
11%
41%
I ordered too much/served myself too much
The portion was too big
8%
11%
11%
41%
I am a fussy eater
The meal included things I don't like so I left them
I ordered too much/served myself too much
The portion was too big
8%
8%
11%
11%
41%
I am watching my weight
I am a fussy eater
The meal included things I don't like so I left them
I ordered too much/served myself too much
The portion was too big
5%
7%
8%
8%
11%
11%
41%
I didn't like the taste
It is normal to leave a bit of food
I am watching my weight
I am a fussy eater
The meal included things I don't like so I left them
I ordered too much/served myself too much
The portion was too big
5%
5%
7%
8%
8%
11%
11%
41%
0% 5% 10% 15% 20% 25% 30% 35% 40% 45%
Food was poor quality
I didn't like the taste
It is normal to leave a bit of food
I am watching my weight
I am a fussy eater
The meal included things I don't like so I left them
I ordered too much/served myself too much
The portion was too big
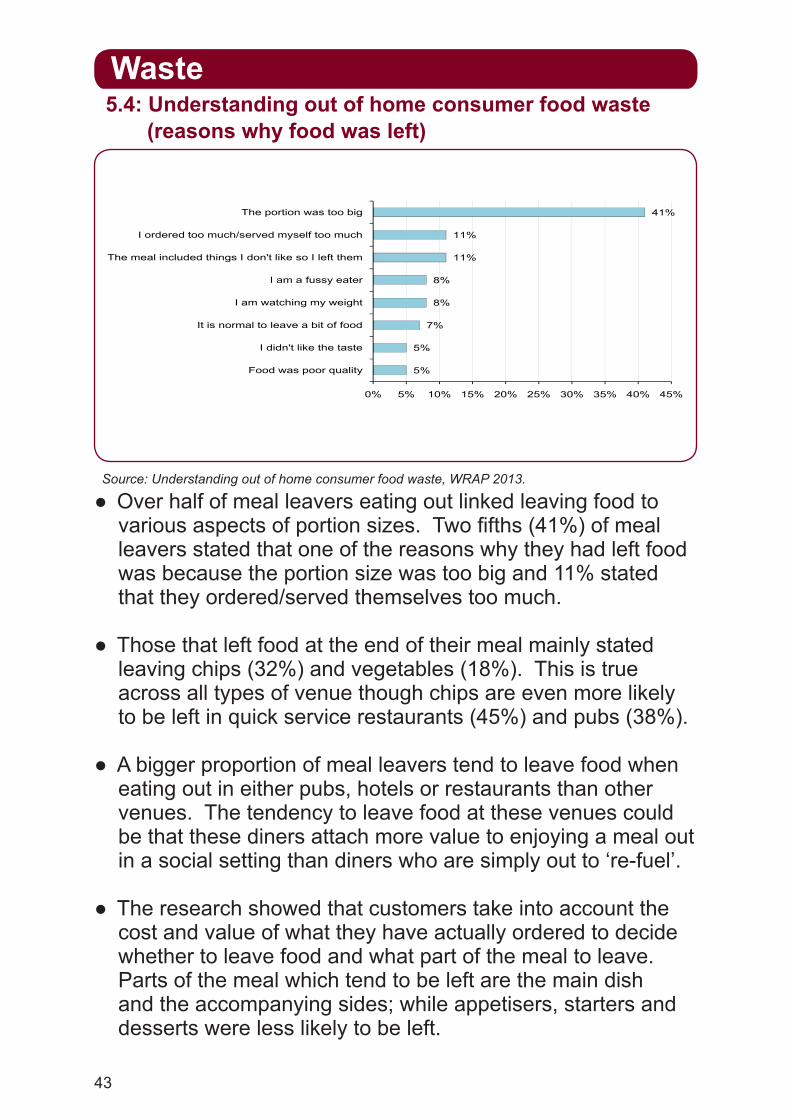
● Over half of meal leavers eating out linked leaving food to various aspects of portion sizes. Two fifths (41%) of meal leavers stated that one of the reasons why they had left food was because the portion size was too big and 11% stated that they ordered/served themselves too much.
● Those that left food at the end of their meal mainly stated leaving chips (32%) and vegetables (18%). This is true across all types of venue though chips are even more likely to be left in quick service restaurants (45%) and pubs (38%).
● A bigger proportion of meal leavers tend to leave food when eating out in either pubs, hotels or restaurants than other venues. The tendency to leave food at these venues could be that these diners attach more value to enjoying a meal out in a social setting than diners who are simply out to ‘re-fuel’.
● The research showed that customers take into account the cost and value of what they have actually ordered to decide whether to leave food and what part of the meal to leave. Parts of the meal which tend to be left are the main dish and the accompanying sides; while appetisers, starters and desserts were less likely to be left.
Source: Understanding out of home consumer food waste, WRAP 2013.
5.4: Understanding out of home consumer food waste (reasons why food was left)
44
Waste
71 74 76 78 8740
50
60
70
80
90
100
ousa
nd to
nnes
58 55 61 71 74 76 78 87
0
10
20
30
40
50
60
70
80
90
100
Jan 11 -Mar 11
Apr 11 -Jun 11
Jul 11 -Sep 11
Oct 11 -Dec 11
Jan 12 -Mar 12
Apr 12 -Jun 12
Jul 12 -Sep 12
Oct 12 -Dec 12
Thou
sand
tonn
es
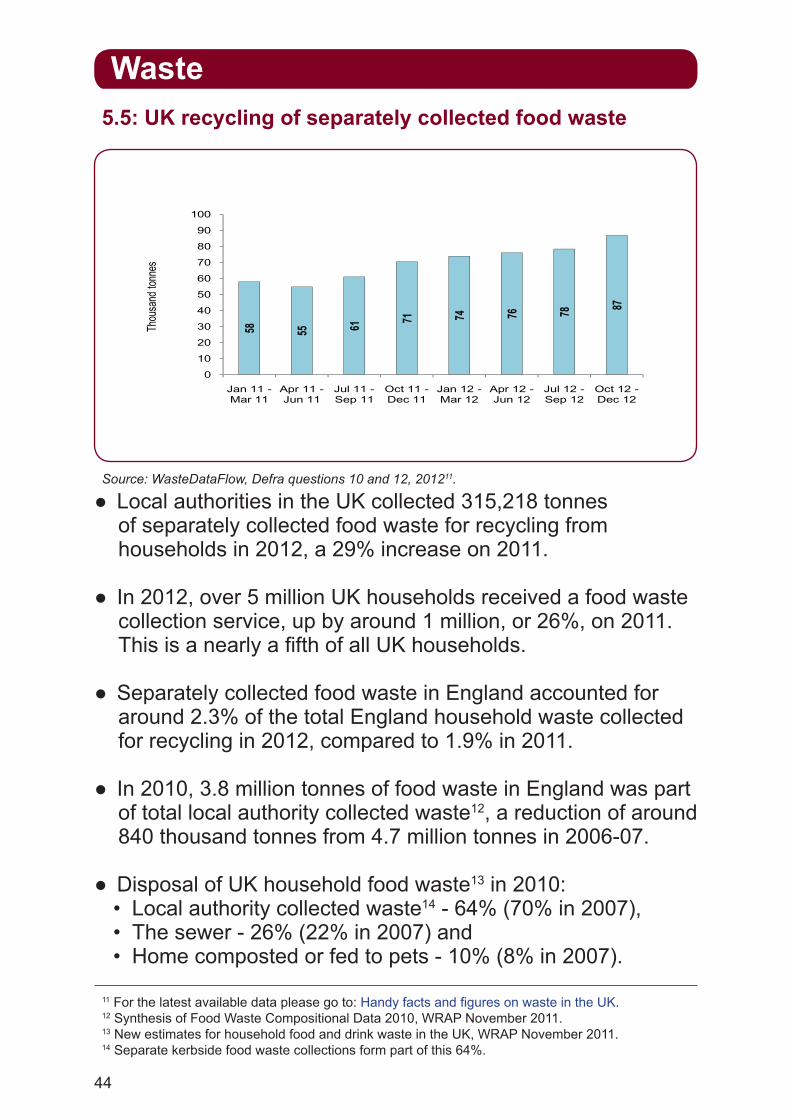
● Local authorities in the UK collected 315,218 tonnes of separately collected food waste for recycling from households in 2012, a 29% increase on 2011.
● In 2012, over 5 million UK households received a food waste collection service, up by around 1 million, or 26%, on 2011. This is a nearly a fifth of all UK households.
● Separately collected food waste in England accounted for around 2.3% of the total England household waste collected for recycling in 2012, compared to 1.9% in 2011.
● In 2010, 3.8 million tonnes of food waste in England was part of total local authority collected waste12, a reduction of around 840 thousand tonnes from 4.7 million tonnes in 2006-07.
● Disposal of UK household food waste13 in 2010:• Local authority collected waste14 - 64% (70% in 2007),• The sewer - 26% (22% in 2007) and • Home composted or fed to pets - 10% (8% in 2007).
Source: WasteDataFlow, Defra questions 10 and 12, 201211.
5.5: UK recycling of separately collected food waste
11 For the latest available data please go to: Handy facts and figures on waste in the UK. 12 Synthesis of Food Waste Compositional Data 2010, WRAP November 2011. 13 New estimates for household food and drink waste in the UK, WRAP November 2011. 14 Separate kerbside food waste collections form part of this 64%.
45
Waste
Manufacturing 0.4 million
tonnes8%
Distribution0.1 million
tonnes2%
Retail 1 million tonnes
Manufacturing 0.4 million
tonnes8%
Distribution0.1 million
tonnes2%
Retail 1 million tonnes20%
Household3.6 million
tonnes70%
15 Including packaging from non-food and drink products sold in grocery shops.
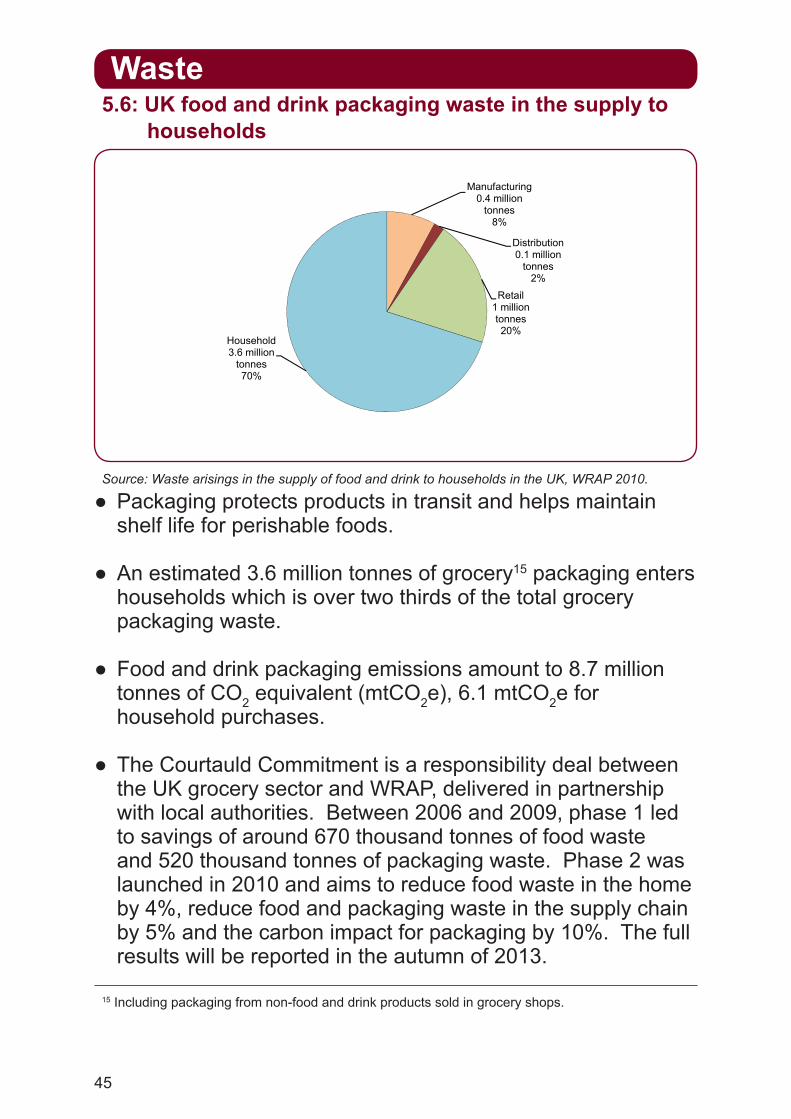
● Packaging protects products in transit and helps maintain shelf life for perishable foods.
● An estimated 3.6 million tonnes of grocery15 packaging enters households which is over two thirds of the total grocery packaging waste.
● Food and drink packaging emissions amount to 8.7 million tonnes of CO2 equivalent (mtCO2e), 6.1 mtCO2e for household purchases.
● The Courtauld Commitment is a responsibility deal between the UK grocery sector and WRAP, delivered in partnership with local authorities. Between 2006 and 2009, phase 1 led to savings of around 670 thousand tonnes of food waste and 520 thousand tonnes of packaging waste. Phase 2 was launched in 2010 and aims to reduce food waste in the home by 4%, reduce food and packaging waste in the supply chain by 5% and the carbon impact for packaging by 10%. The full results will be reported in the autumn of 2013.
Source: Waste arisings in the supply of food and drink to households in the UK, WRAP 2010.
5.6: UK food and drink packaging waste in the supply to households
46
Waste
37%
42%
Gives important information on labels (e.g ingredients, storage guidance)
Keeps product safe and hygenic
14%
26%
33%
36%
37%
42%
Makes it easy to store at home
Makes it easy/convenient to transport home
Helps keep the product fresh/at its best quality
Protects the food (from factory to the shop and on the way home)
Gives important information on labels (e.g ingredients, storage guidance)
Keeps product safe and hygenic
10%
13%
13%
14%
26%
33%
36%
37%
42%
I don't think packaging offers any benefits to the consumer
Protects the food (in the home)
Allows seasonal food to be purchased all year in the UK
Makes it easy to store at home
Makes it easy/convenient to transport home
Helps keep the product fresh/at its best quality
Protects the food (from factory to the shop and on the way home)
Gives important information on labels (e.g ingredients, storage guidance)
Keeps product safe and hygenic
8%
9%
10%
13%
13%
14%
26%
33%
36%
37%
42%
0% 5% 10% 15% 20% 25% 30% 35% 40% 45%
Makes it easy to use at home
Supports the economy by reducing waste, keeping costs down and providing jobs
I don't think packaging offers any benefits to the consumer
Protects the food (in the home)
Allows seasonal food to be purchased all year in the UK
Makes it easy to store at home
Makes it easy/convenient to transport home
Helps keep the product fresh/at its best quality
Protects the food (from factory to the shop and on the way home)
Gives important information on labels (e.g ingredients, storage guidance)
Keeps product safe and hygenic
% of people mentioning in their top 3
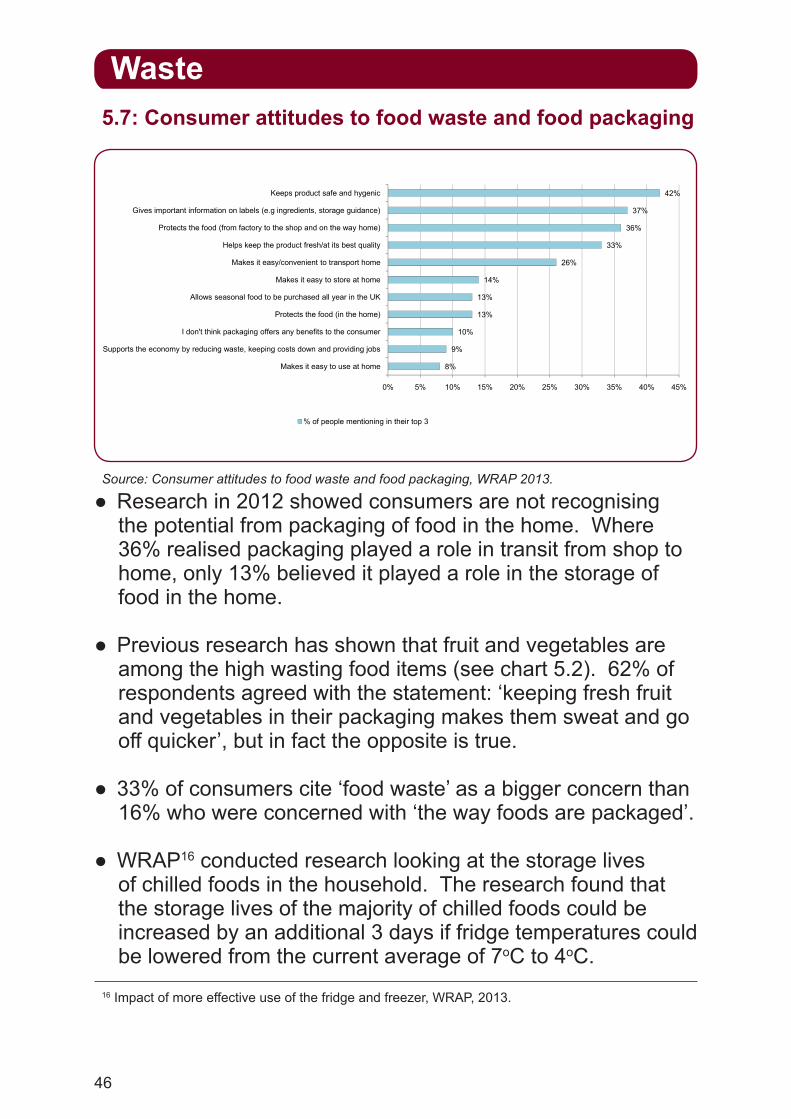
● Research in 2012 showed consumers are not recognising the potential from packaging of food in the home. Where 36% realised packaging played a role in transit from shop to home, only 13% believed it played a role in the storage of food in the home.
● Previous research has shown that fruit and vegetables are among the high wasting food items (see chart 5.2). 62% of respondents agreed with the statement: ‘keeping fresh fruit and vegetables in their packaging makes them sweat and go off quicker’, but in fact the opposite is true.
● 33% of consumers cite ‘food waste’ as a bigger concern than 16% who were concerned with ‘the way foods are packaged’.
● WRAP16 conducted research looking at the storage lives of chilled foods in the household. The research found that the storage lives of the majority of chilled foods could be increased by an additional 3 days if fridge temperatures could be lowered from the current average of 7oC to 4oC.
Source: Consumer attitudes to food waste and food packaging, WRAP 2013.
5.7: Consumer attitudes to food waste and food packaging
16 Impact of more effective use of the fridge and freezer, WRAP, 2013.
47
Waste
A d i t d i t th i t
Food should not be eaten after the end of the use-by date
I check what I already have at home for frozen foods
I check what I already have at home for fresh meat
How much uneaten food would you say yougenerally end up throwing away
A desire to reduce my impact on the environmentwould encourage me to try and minimise food waste
Food should not be eaten after the end of the use-by date
I check what I already have at home for fruit
The possibility of saving money encouragesme to try and minimise food waste
I check what I already have at home for frozen foods
I check what I already have at home for fresh meat
How much uneaten food would you say yougenerally end up throwing away
A desire to reduce my impact on the environmentwould encourage me to try and minimise food waste
Food should not be eaten after the end of the use-by date
0% 10% 20% 30% 40% 50% 60% 70% 80% 90% 100%
I check what I already have at home for veg
I check what I already have at home for bread
I check what I already have at home for milk
I check what I already have at home for fruit
The possibility of saving money encouragesme to try and minimise food waste
I check what I already have at home for frozen foods
I check what I already have at home for fresh meat
How much uneaten food would you say yougenerally end up throwing away
A desire to reduce my impact on the environmentwould encourage me to try and minimise food waste
Food should not be eaten after the end of the use-by date
Spring 2013 Spring 2011
● These statistics provide response levels on awareness of issues because people, on average, give responses that indicate the behaviour they aspire to rather than actual behaviour. This survey was conducted online across GB.
● The Spring 2013 Tracker Survey conducted by WRAP shows that consumers are still misinterpreting food date labelling, with 38% understanding the ‘use-by date’ message.
● Most response levels have not changed between the tracker survey conducted in Spring 2011 and the more recent Spring 2013 survey. However when consumers were asked ‘the possibility of saving money encourages me to try and minimise food waste’; this response level increased significantly from 75% in Spring 2011 to 78% in Spring 2013.
Source: Household Food Waste Tracker Spring 2013, WRAP (unpublished).
5.8: Public attitudes and behaviours
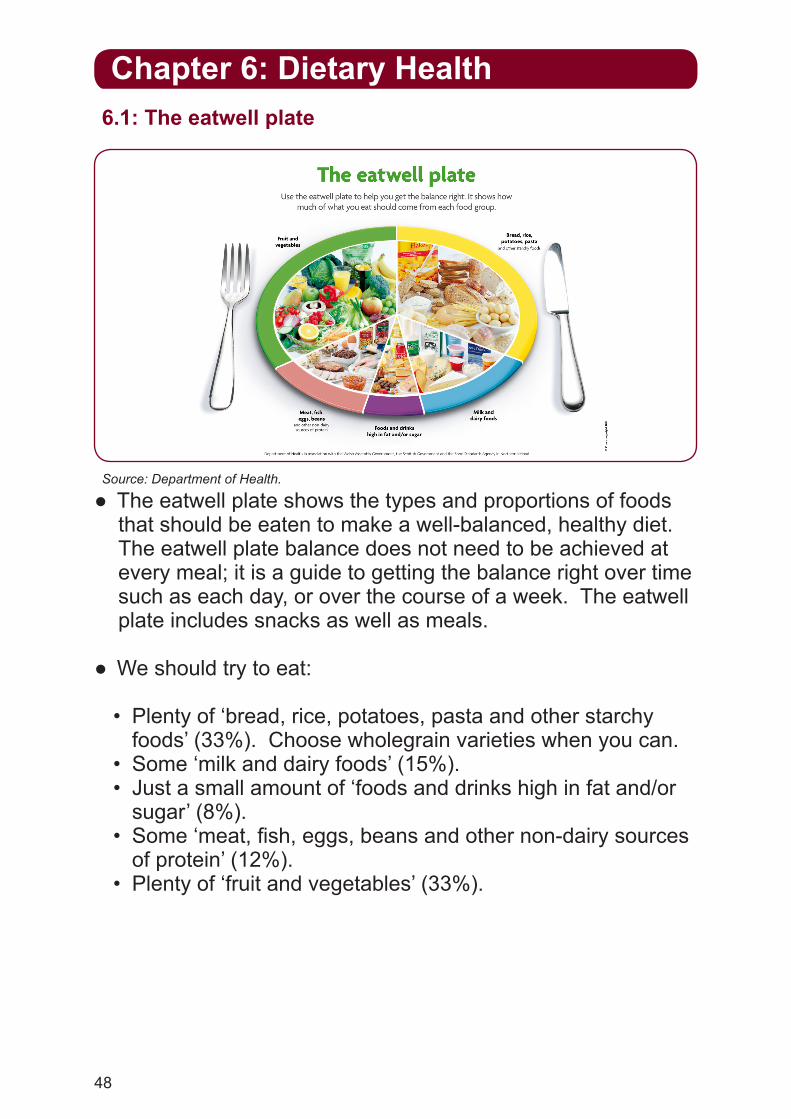
48
Chapter 6: Dietary Health
● The eatwell plate shows the types and proportions of foods that should be eaten to make a well-balanced, healthy diet. The eatwell plate balance does not need to be achieved at every meal; it is a guide to getting the balance right over time such as each day, or over the course of a week. The eatwell plate includes snacks as well as meals.
● We should try to eat:
• Plenty of ‘bread, rice, potatoes, pasta and other starchy foods’ (33%). Choose wholegrain varieties when you can.
• Some ‘milk and dairy foods’ (15%).• Just a small amount of ‘foods and drinks high in fat and/or
sugar’ (8%).• Some ‘meat, fish, eggs, beans and other non-dairy sources
of protein’ (12%).• Plenty of ‘fruit and vegetables’ (33%).
6.1: The eatwell plate
Source: Department of Health.

49
Dietary Health
33%
15%
8%
12%
33%
20%22% 21%
14%
24%
0%
5%
10%
15%
20%
25%
30%
35%
Bread, rice,potatoes, pasta &
other starchyfoods
Milk & dairy foods Foods & drinkshigh in fat and/or
sugar
Meat, fish, eggs,beans & other
non-dairy sourcesof protein
Fruit & vegetables
Eatwell plate ideal 2012 Actual
1 Alcohol, low calorie drinks, tea, coffee and mineral water were excluded from ‘beverages’ and ‘soft drinks’. Slimming & sports foods & infant cereal foods were excluded from ‘other cereals and other cereals products’. Only jelly, ice cream and soya foods were included from ‘other food and drink’.
● Food and drink purchases for household supplies were allocated into the five eatwell plate groups1. This shows that in 2012 household purchases included:
• too much ‘food and drink high in fat and/or sugar’; nearly three times the eatwell percentage,
• more than the suggested proportion of ‘milk and dairy foods’; 7 percentage points higher than the eatwell percentage,
• a little too much ‘meat, fish, eggs, beans and other non-dairy sources of protein’,
• too little ‘bread, rice, potatoes, pasta and other starchy foods’; less than 60% of the eatwell percentage,
• too little ‘fruit and vegetables’; around 28% less than the eatwell percentage.
Source: Family Food in 2012, Defra, December 2013.
6.2: Household purchases compared to the eatwell ideal

50
Dietary Health
0
1
2
3
4
5
6
2001/2 2002/3 2003/4 2004/5 2005/6 2006 2007 2008 2009 2010 2011 2012
App
roxi
mat
e po
rtion
s pe
r per
son
per
day
All households second decile lowest ten per cent
● UK household purchases of fruit and vegetables were 2.1% lower in 2012 than in 2011, a reduction of 11% since their peak in 2006.
● Purchases of 5 A DAY2 across all households remained unchanged between 2009 and 2011 at 4.0 portions; the reduction in 2012 to an average of 3.9 portions takes the level back to that of the early 1990s.
● The lowest income households3 purchase the least fruit and vegetables at an average of 2.9 portions per person of 5 A DAY in 2012, unchanged on 2011.
● Households in the second decile have seen the greatest reduction in purchases of fruit and vegetables since 2007 at 19%, but showed a small increase (1.7%) in 2012.
● Defra estimates that 22% of edible fruit and vegetables are wasted4.
6.3: UK trend in purchases of fruit and vegetables (excluding potatoes) to 2012
Source: Family Food in 2012, Defra, December 2013.
2 5 A DAY calculated as all purchases of fresh and processed fruit and vegetables including fruit juice divided by the adult portion size of 80 grams. 3 Lowest income households are those with incomes in the lowest ten percent of all households. Data on low income households is available from 2001. 4 Household Food and Drink Waste linked to Food and Drink Purchases, Defra July 2010.
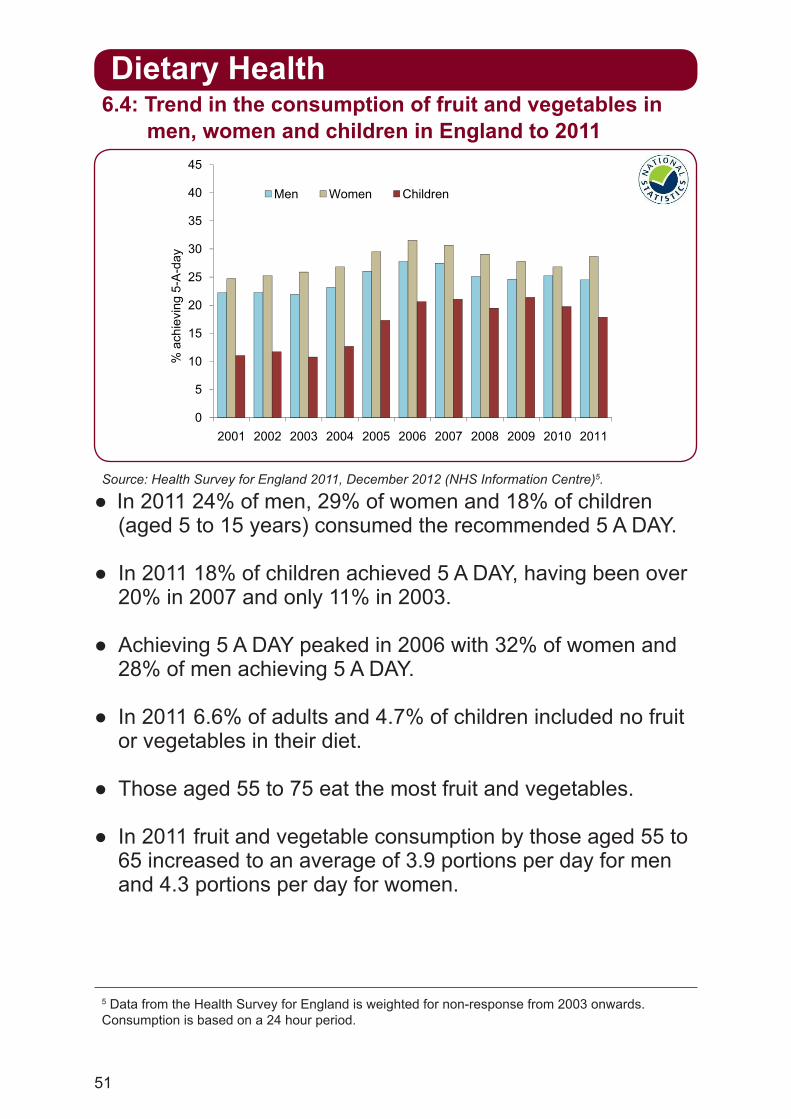
51
40
45
Men Women Children
35
40
45
Men Women Children
25
30
35
40
455-
A-d
ayMen Women Children
15
20
25
30
35
40
45ch
ievi
ng 5
-A-d
ayMen Women Children
5
10
15
20
25
30
35
40
45%
ach
ievi
ng 5
-A-d
ayMen Women Children
0
5
10
15
20
25
30
35
40
45
2001 2002 2003 2004 2005 2006 2007 2008 2009 2010 2011
% a
chie
ving
5-A
-day
Men Women Children
0
5
10
15
20
25
30
35
40
45
2001 2002 2003 2004 2005 2006 2007 2008 2009 2010 2011
% a
chie
ving
5-A
-day
Men Women Children
6.4: Trend in the consumption of fruit and vegetables in men, women and children in England to 2011
Source: Health Survey for England 2011, December 2012 (NHS Information Centre)5.
● In 2011 24% of men, 29% of women and 18% of children (aged 5 to 15 years) consumed the recommended 5 A DAY.
● In 2011 18% of children achieved 5 A DAY, having been over 20% in 2007 and only 11% in 2003.
● Achieving 5 A DAY peaked in 2006 with 32% of women and 28% of men achieving 5 A DAY.
● In 2011 6.6% of adults and 4.7% of children included no fruit or vegetables in their diet.
● Those aged 55 to 75 eat the most fruit and vegetables.
● In 2011 fruit and vegetable consumption by those aged 55 to 65 increased to an average of 3.9 portions per day for men and 4.3 portions per day for women.
5 Data from the Health Survey for England is weighted for non-response from 2003 onwards. Consumption is based on a 24 hour period.
Dietary Health
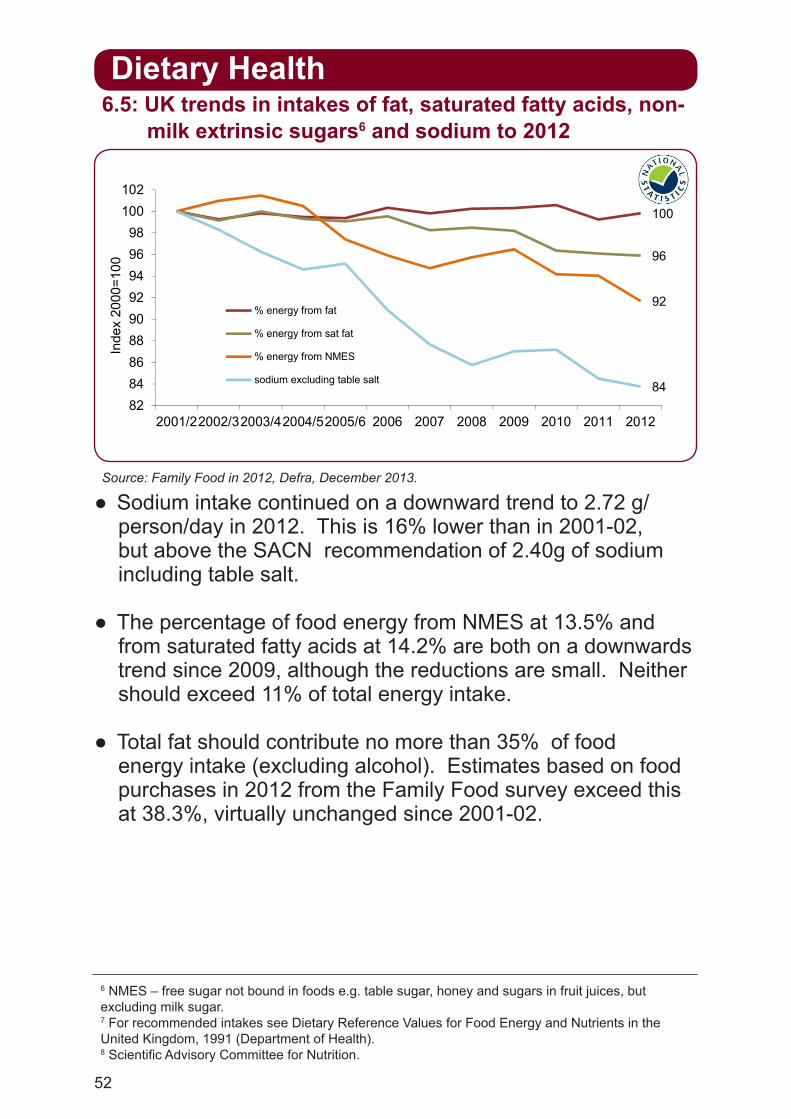
52
100
96
92
84828486889092949698
100102
2001/22002/32003/42004/52005/6 2006 2007 2008 2009 2010 2011 2012
Inde
x 20
00=1
00
% energy from fat
% energy from sat fat
% energy from NMES
sodium excluding table salt
6.5: UK trends in intakes of fat, saturated fatty acids, non-milk extrinsic sugars6 and sodium to 2012
Source: Family Food in 2012, Defra, December 2013.
● Sodium intake continued on a downward trend to 2.72 g/person/day in 2012. This is 16% lower than in 2001-02, but above the SACN recommendation of 2.40g of sodium including table salt.
● The percentage of food energy from NMES at 13.5% and from saturated fatty acids at 14.2% are both on a downwards trend since 2009, although the reductions are small. Neither should exceed 11% of total energy intake.
● Total fat should contribute no more than 35% of food energy intake (excluding alcohol). Estimates based on food purchases in 2012 from the Family Food survey exceed this at 38.3%, virtually unchanged since 2001-02.
6 NMES – free sugar not bound in foods e.g. table sugar, honey and sugars in fruit juices, but excluding milk sugar. 7 For recommended intakes see Dietary Reference Values for Food Energy and Nutrients in the United Kingdom, 1991 (Department of Health). 8 Scientific Advisory Committee for Nutrition.
Dietary Health

53
0%
20%
40%
60%
80%
100%
120%
140%
160%
180%
200%
Riboflavin Iron Magnesium Calcium Potassium
% o
f RNI
2001-02 2006 2008 2009 2010 2011 2012
9 Reference Nutrient Intake: the intake which is considered sufficient to meet the requirements of 97.5% of the population. 10 Guidance levels for sodium are a maximum daily amount. See Chart 6.5 for the trend in intakes of Sodium. 11 These trends are partly explained by changes in food composition data over time, due to new analytical data becoming available or changes in the formulation of food products.
6.6: UK average micronutrient intakes, 2001-02 to 20129
Source: Family Food in 2012, Defra, December 2012.
● Based on food and drink purchases average micronutrient intakes except sodium10 and potassium reached at least 100% of their reference nutrient intake value, where one is set, in 2012.
● Intake of vitamin B12 has been consistently high since 2001-02 and remains at around four times the recommended level.
● Over the four years 2009 to 2012, intakes of most vitamins and minerals showed downward trends, notably Vitamin B6 and folate, with decreases of 13% and 5.7% respectively. Over the same period, thiamin and vitamin C showed upward trends11.
Dietary Health

54
Dietary Health
48
14
38
14 157
14
41
16
43
1318
9 11
0
10
20
30
40
50
60
% o
f ene
rgy i
ntak
e
Household food and drink Eating out
11 For recommended intakes see Dietary Reference Values (DRVs) for Food Energy and Nutrients in the United Kingdom, 1991 (Department of Health).
● Eating out food and drink are products that are consumed before entering the household.
● In 2012 eating out contributed 9.5% of energy intake excluding energy from alcohol.
● The percentage of energy intake from eating out has fallen steadily from 12% to 9.5% since 2002-03.
● The eating out diet is higher in fat and protein but lower in carbohydrate and non-milk extrinsic sugars.
● Mono-unsaturated and poly-unsaturated fatty acids are higher in the eating out diet. They are found in olive oils, rapeseed oil, vegetable oils, fish oils, nuts, milk and some meat and meat products.
● Saturated fatty acids are slightly lower in the eating out diet. They are found in milk and dairy products, meat and meat products, biscuits, cakes and pastries.
Source: Family Food in 2012, Defra, December 2013.
6.7: The UK household diet compared with the eating out diet in 201211
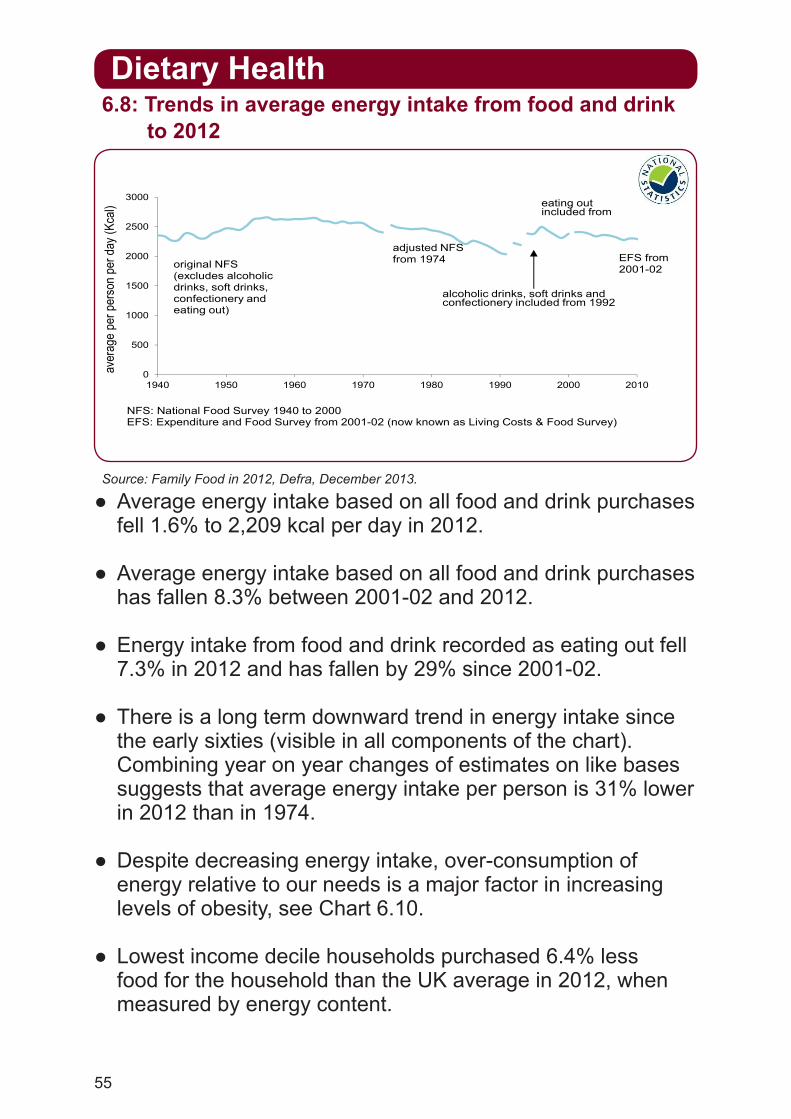
55
Dietary Health
0
500
1000
1500
2000
2500
3000
1940 1950 1960 1970 1980 1990 2000 2010
aver
age
per p
erso
n pe
r day
(Kca
l)
original NFS (excludes alcoholic drinks, soft drinks, confectionery and eating out)
adjusted NFS from 1974
alcoholic drinks, soft drinks and confectionery included from 1992
eating out included from
NFS: National Food Survey 1940 to 2000EFS: Expenditure and Food Survey from 2001-02 (now known as Living Costs & Food Survey)
EFS from 2001-02
● Average energy intake based on all food and drink purchases fell 1.6% to 2,209 kcal per day in 2012.
● Average energy intake based on all food and drink purchases has fallen 8.3% between 2001-02 and 2012.
● Energy intake from food and drink recorded as eating out fell 7.3% in 2012 and has fallen by 29% since 2001-02.
● There is a long term downward trend in energy intake since the early sixties (visible in all components of the chart). Combining year on year changes of estimates on like bases suggests that average energy intake per person is 31% lower in 2012 than in 1974.
● Despite decreasing energy intake, over-consumption of energy relative to our needs is a major factor in increasing levels of obesity, see Chart 6.10.
● Lowest income decile households purchased 6.4% less food for the household than the UK average in 2012, when measured by energy content.
Source: Family Food in 2012, Defra, December 2013.
6.8: Trends in average energy intake from food and drink to 2012
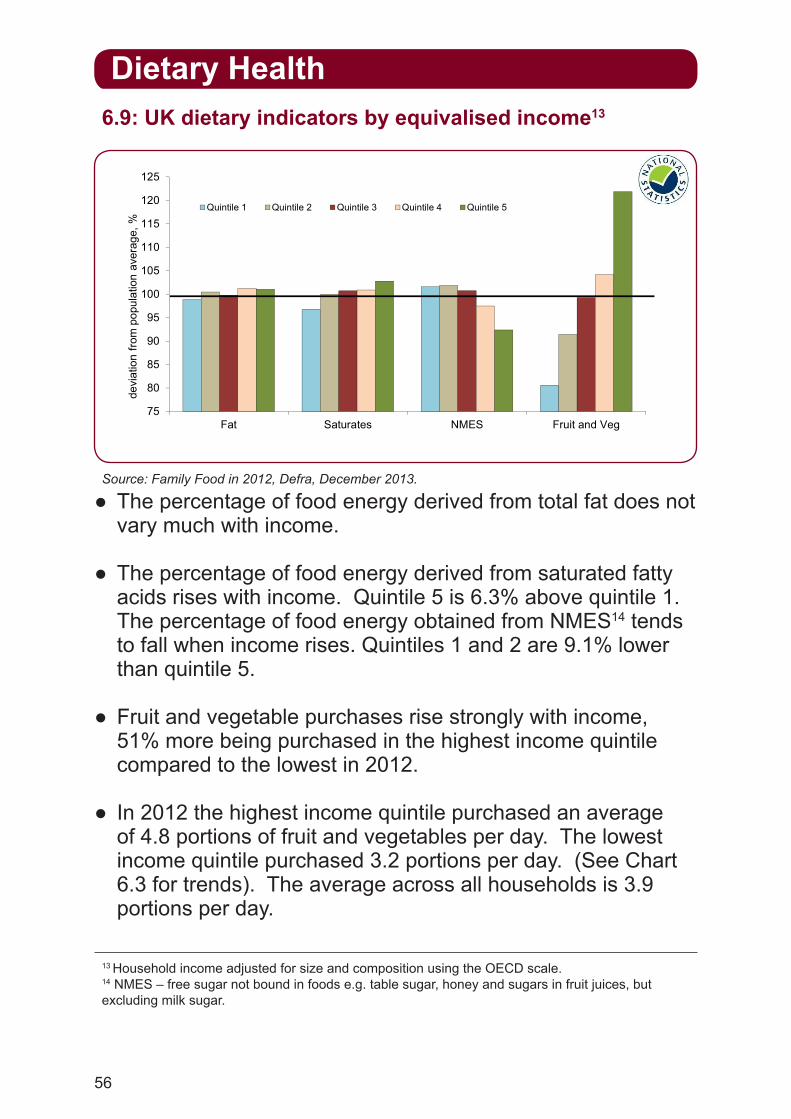
56
Dietary Health
75
80
85
90
95
100
105
110
115
120
125
Fat Saturates NMES Fruit and Veg
devi
atio
n fro
m p
opul
atio
n av
erag
e, %
Quintile 1 Quintile 2 Quintile 3 Quintile 4 Quintile 5
13 Household income adjusted for size and composition using the OECD scale.
14 NMES – free sugar not bound in foods e.g. table sugar, honey and sugars in fruit juices, but excluding milk sugar.
● The percentage of food energy derived from total fat does not vary much with income.
● The percentage of food energy derived from saturated fatty acids rises with income. Quintile 5 is 6.3% above quintile 1. The percentage of food energy obtained from NMES14 tends to fall when income rises. Quintiles 1 and 2 are 9.1% lower than quintile 5.
● Fruit and vegetable purchases rise strongly with income, 51% more being purchased in the highest income quintile compared to the lowest in 2012.
● In 2012 the highest income quintile purchased an average of 4.8 portions of fruit and vegetables per day. The lowest income quintile purchased 3.2 portions per day. (See Chart 6.3 for trends). The average across all households is 3.9 portions per day.
Source: Family Food in 2012, Defra, December 2013.
6.9: UK dietary indicators by equivalised income13
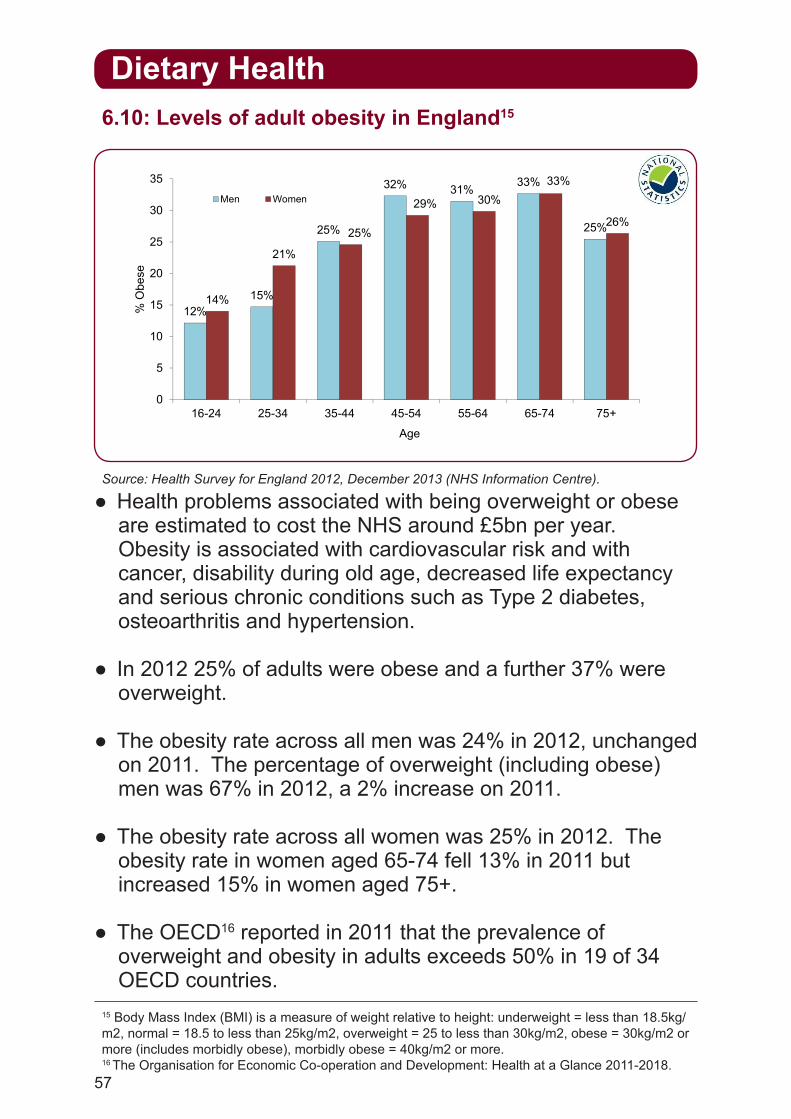
57
Dietary Health
12%15%
25%
32% 31% 33%
25%
14%
21%
25%
29% 30%33%
26%
0
5
10
15
20
25
30
35
16-24 25-34 35-44 45-54 55-64 65-74 75+
% O
bese
Age
Men Women
15 Body Mass Index (BMI) is a measure of weight relative to height: underweight = less than 18.5kg/m2, normal = 18.5 to less than 25kg/m2, overweight = 25 to less than 30kg/m2, obese = 30kg/m2 or more (includes morbidly obese), morbidly obese = 40kg/m2 or more. 16 The Organisation for Economic Co-operation and Development: Health at a Glance 2011-2018.
● Health problems associated with being overweight or obese are estimated to cost the NHS around £5bn per year. Obesity is associated with cardiovascular risk and with cancer, disability during old age, decreased life expectancy and serious chronic conditions such as Type 2 diabetes, osteoarthritis and hypertension.
● In 2012 25% of adults were obese and a further 37% were overweight.
● The obesity rate across all men was 24% in 2012, unchanged on 2011. The percentage of overweight (including obese) men was 67% in 2012, a 2% increase on 2011.
● The obesity rate across all women was 25% in 2012. The obesity rate in women aged 65-74 fell 13% in 2011 but increased 15% in women aged 75+.
● The OECD16 reported in 2011 that the prevalence of overweight and obesity in adults exceeds 50% in 19 of 34 OECD countries.
Source: Health Survey for England 2012, December 2013 (NHS Information Centre).
6.10: Levels of adult obesity in England15

58
Dietary Health
4.3
4.3
4.3
4.3
4.1
3.9
3.7
3.6
3.6
3.5
3.5
3.5
Eastern
South East
South West
London
East Midlands
Wales
West Midlands
North West
Scotland
Yorkshire and The Humber
North East
Northern Ireland
Average portions of fruit and veg a day
17 5 A DAY calculated as all purchases of fresh and processed fruit and vegetables including fruit juice divided by the adult portion size of 80 grams.
● Combined purchases of fruit and vegetables (excluding potatoes) were consistent across London, South East, South West and Eastern regions, at an equivalent of 4.3 portions per person per day.
● Within England, household purchases of fruit were lowest in the North East, and household purchases of vegetables were lowest in the North West.
● Within the UK, Northern Ireland had the lowest combined total purchases of fruit and vegetables (excluding potatoes) at 3.5 portions per person per day. Purchases of fruit were lowest in Wales.
● Much of the regional variation may be explained by differences in income. In general, purchases of fruit and vegetables increase with income (see Chart 6.9).
● Waste and inedible content are not taken into account here. See Chart 6.3 for trends over time and Chart 5.2 for estimates of edible household waste.
6.11: UK Regional household consumption of fruit and vegetables, 2010-201217
Source: Family Food in 2012, Defra, December 2013.

59
Dietary Health
8.9
10.7
9.810.1
8.0
8.5
9.0
9.5
10.0
10.5
11.0
11.5
12.0
12.5
2011201020092008200720062005200420032002
Gra
ms
of a
lcoh
ol -
aver
age
per
pers
on
per
day
Three year moving average 2001 to 2012
Wales Scotland England N Ireland
17 Three year moving average, 2001 to 2012.
● Averaged across 2010 to 2012, alcohol intake per person fell in three of the four UK countries, with Wales showing the greatest reduction at 12% to 8.9 grams/person/day.
● Over the last 10 years alcohol intake has been on a downward trend in England and Wales. In Scotland intake has fluctuated but is little changed, whilst in Northern Ireland intake has increased by 22% over the same period.
● Within England in 2012, average alcohol intake was highest in Yorkshire and the Humber, one and a half times higher than London which was the lowest.
● In Scotland in 2012, over 80% of alcohol intake was from household purchases. In London 33% of alcohol intake is from eating out.
● The Department of Health is responsible for Government health policy on alcohol misuse. Regularly drinking above the recommended daily limits significantly increases the risk of ill health.
Source: Family Food in 2012, Defra, December 2013.
6.12: UK Trend18 in average alcohol intake (including eating out)
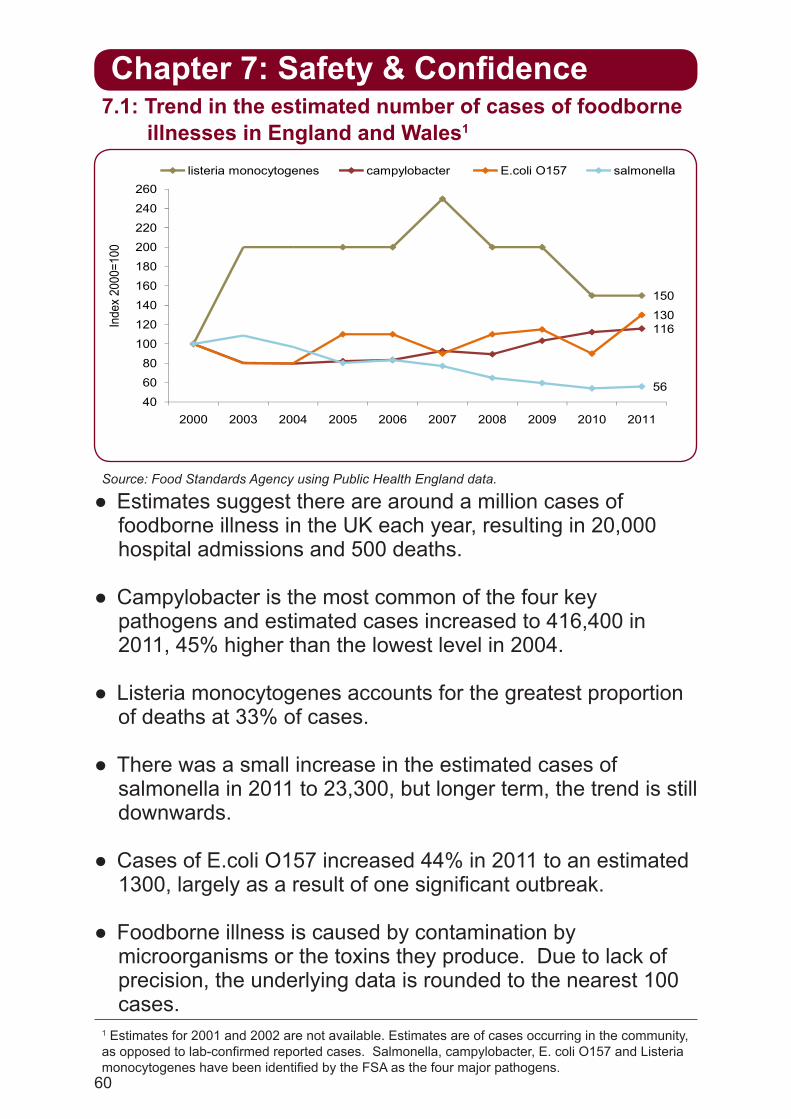
60
Chapter 7: Safety & Confidence
150
116130
120
140
160
180
200
220
240
260
Inde
x 20
00=1
00
listeria monocytogenes campylobacter E.coli O157 salmonella
150
116130
5640
60
80
100
120
140
160
180
200
220
240
260
2000 2003 2004 2005 2006 2007 2008 2009 2010 2011
Inde
x 20
00=1
00
listeria monocytogenes campylobacter E.coli O157 salmonella
1 Estimates for 2001 and 2002 are not available. Estimates are of cases occurring in the community, as opposed to lab-confirmed reported cases. Salmonella, campylobacter, E. coli O157 and Listeria monocytogenes have been identified by the FSA as the four major pathogens.
● Estimates suggest there are around a million cases of foodborne illness in the UK each year, resulting in 20,000 hospital admissions and 500 deaths.
● Campylobacter is the most common of the four key pathogens and estimated cases increased to 416,400 in 2011, 45% higher than the lowest level in 2004.
● Listeria monocytogenes accounts for the greatest proportion of deaths at 33% of cases.
● There was a small increase in the estimated cases of salmonella in 2011 to 23,300, but longer term, the trend is still downwards.
● Cases of E.coli O157 increased 44% in 2011 to an estimated 1300, largely as a result of one significant outbreak.
● Foodborne illness is caused by contamination by microorganisms or the toxins they produce. Due to lack of precision, the underlying data is rounded to the nearest 100 cases.
Source: Food Standards Agency using Public Health England data.
7.1: Trend in the estimated number of cases of foodborne illnesses in England and Wales1
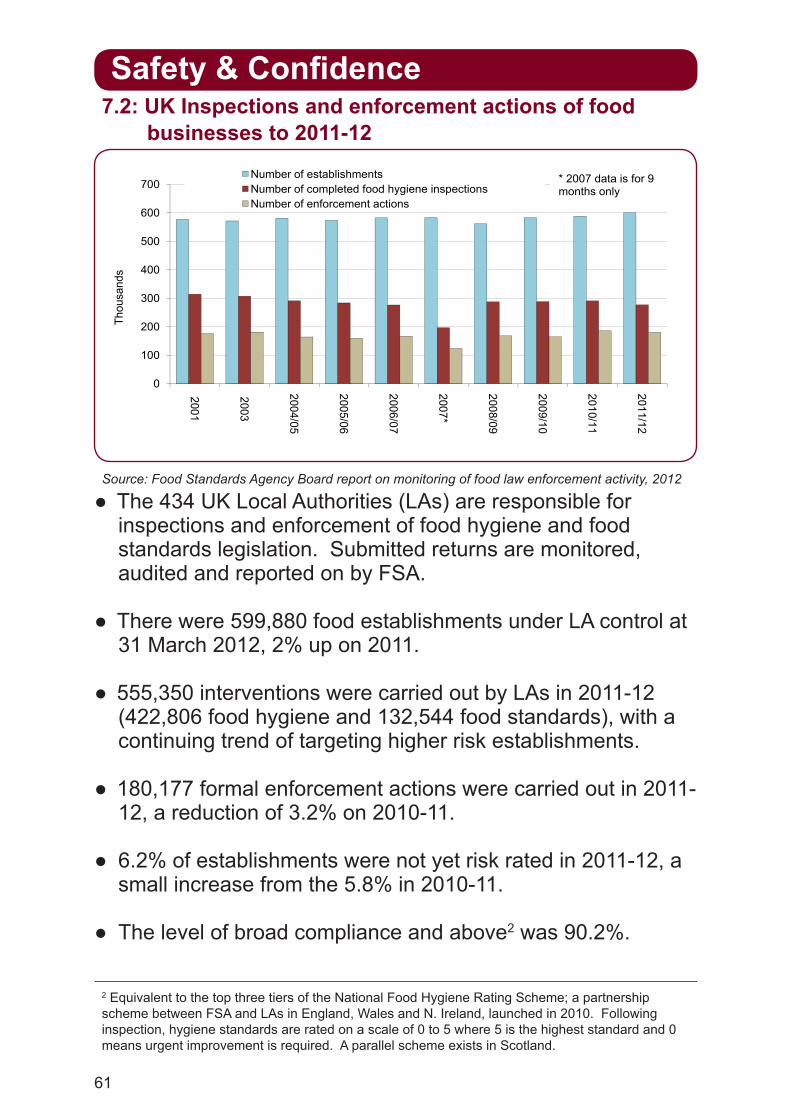
61
Safety & Confidence
Number of establishments * 2007 data is for 9
500
600
700Number of establishmentsNumber of completed food hygiene inspectionsNumber of enforcement actions
* 2007 data is for 9 months only
400
500
600
700
nds
Number of establishmentsNumber of completed food hygiene inspectionsNumber of enforcement actions
* 2007 data is for 9 months only
200
300
400
500
600
700
Thou
sand
s
Number of establishmentsNumber of completed food hygiene inspectionsNumber of enforcement actions
* 2007 data is for 9 months only
0
100
200
300
400
500
600
700
Thou
sand
s
Number of establishmentsNumber of completed food hygiene inspectionsNumber of enforcement actions
* 2007 data is for 9 months only
0
100
200
300
400
500
600
700
2001
2003
2004/05
2005/06
2006/07
2007*
2008/09
2009/10
2010/11
2011/12
Thou
sand
s
Number of establishmentsNumber of completed food hygiene inspectionsNumber of enforcement actions
* 2007 data is for 9 months only
0
100
200
300
400
500
600
700
2001
2003
2004/05
2005/06
2006/07
2007*
2008/09
2009/10
2010/11
2011/12
Thou
sand
s
Number of establishmentsNumber of completed food hygiene inspectionsNumber of enforcement actions
* 2007 data is for 9 months only
● The 434 UK Local Authorities (LAs) are responsible for inspections and enforcement of food hygiene and food standards legislation. Submitted returns are monitored, audited and reported on by FSA.
● There were 599,880 food establishments under LA control at 31 March 2012, 2% up on 2011.
● 555,350 interventions were carried out by LAs in 2011-12 (422,806 food hygiene and 132,544 food standards), with a continuing trend of targeting higher risk establishments.
● 180,177 formal enforcement actions were carried out in 2011-12, a reduction of 3.2% on 2010-11.
● 6.2% of establishments were not yet risk rated in 2011-12, a small increase from the 5.8% in 2010-11.
● The level of broad compliance and above2 was 90.2%.
Source: Food Standards Agency Board report on monitoring of food law enforcement activity, 2012
7.2: UK Inspections and enforcement actions of food businesses to 2011-12
2 Equivalent to the top three tiers of the National Food Hygiene Rating Scheme; a partnership scheme between FSA and LAs in England, Wales and N. Ireland, launched in 2010. Following inspection, hygiene standards are rated on a scale of 0 to 5 where 5 is the highest standard and 0 means urgent improvement is required. A parallel scheme exists in Scotland.
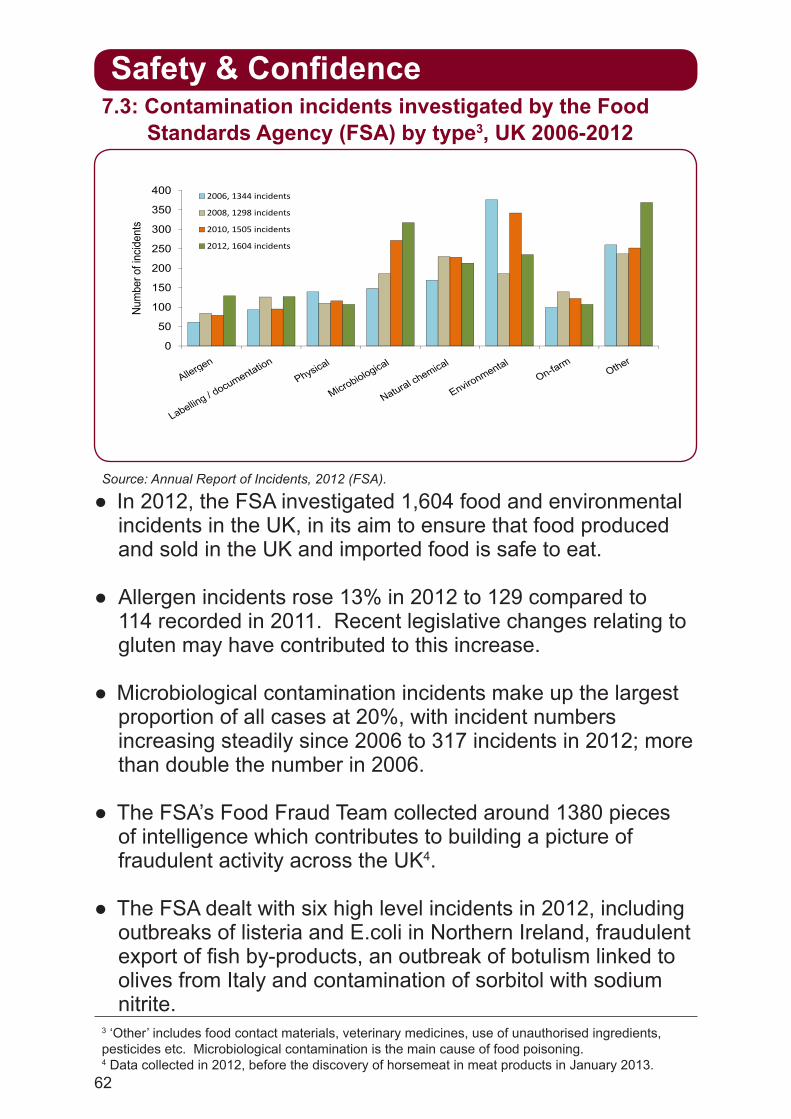
62
Safety & Confidence
400 2006, 1344 incidents
250
300
350
400
iden
ts
2006, 1344 incidents
2008, 1298 incidents
2010, 1505 incidents
2012, 1604 incidents
150
200
250
300
350
400
ber o
f inc
iden
ts
2006, 1344 incidents
2008, 1298 incidents
2010, 1505 incidents
2012, 1604 incidents
0
50
100
150
200
250
300
350
400
Num
ber o
f inc
iden
ts
2006, 1344 incidents
2008, 1298 incidents
2010, 1505 incidents
2012, 1604 incidents
0
50
100
150
200
250
300
350
400
Num
ber o
f inc
iden
ts
2006, 1344 incidents
2008, 1298 incidents
2010, 1505 incidents
2012, 1604 incidents
0
50
100
150
200
250
300
350
400
Num
ber o
f inc
iden
ts
2006, 1344 incidents
2008, 1298 incidents
2010, 1505 incidents
2012, 1604 incidents
0
50
100
150
200
250
300
350
400
Num
ber o
f inc
iden
ts
2006, 1344 incidents
2008, 1298 incidents
2010, 1505 incidents
2012, 1604 incidents
3 ‘Other’ includes food contact materials, veterinary medicines, use of unauthorised ingredients, pesticides etc. Microbiological contamination is the main cause of food poisoning. 4 Data collected in 2012, before the discovery of horsemeat in meat products in January 2013.
● In 2012, the FSA investigated 1,604 food and environmental incidents in the UK, in its aim to ensure that food produced and sold in the UK and imported food is safe to eat.
● Allergen incidents rose 13% in 2012 to 129 compared to 114 recorded in 2011. Recent legislative changes relating to gluten may have contributed to this increase.
● Microbiological contamination incidents make up the largest proportion of all cases at 20%, with incident numbers increasing steadily since 2006 to 317 incidents in 2012; more than double the number in 2006.
● The FSA’s Food Fraud Team collected around 1380 pieces of intelligence which contributes to building a picture of fraudulent activity across the UK4.
● The FSA dealt with six high level incidents in 2012, including outbreaks of listeria and E.coli in Northern Ireland, fraudulent export of fish by-products, an outbreak of botulism linked to olives from Italy and contamination of sorbitol with sodium nitrite.
Source: Annual Report of Incidents, 2012 (FSA).
7.3: Contamination incidents investigated by the Food Standards Agency (FSA) by type3, UK 2006-2012
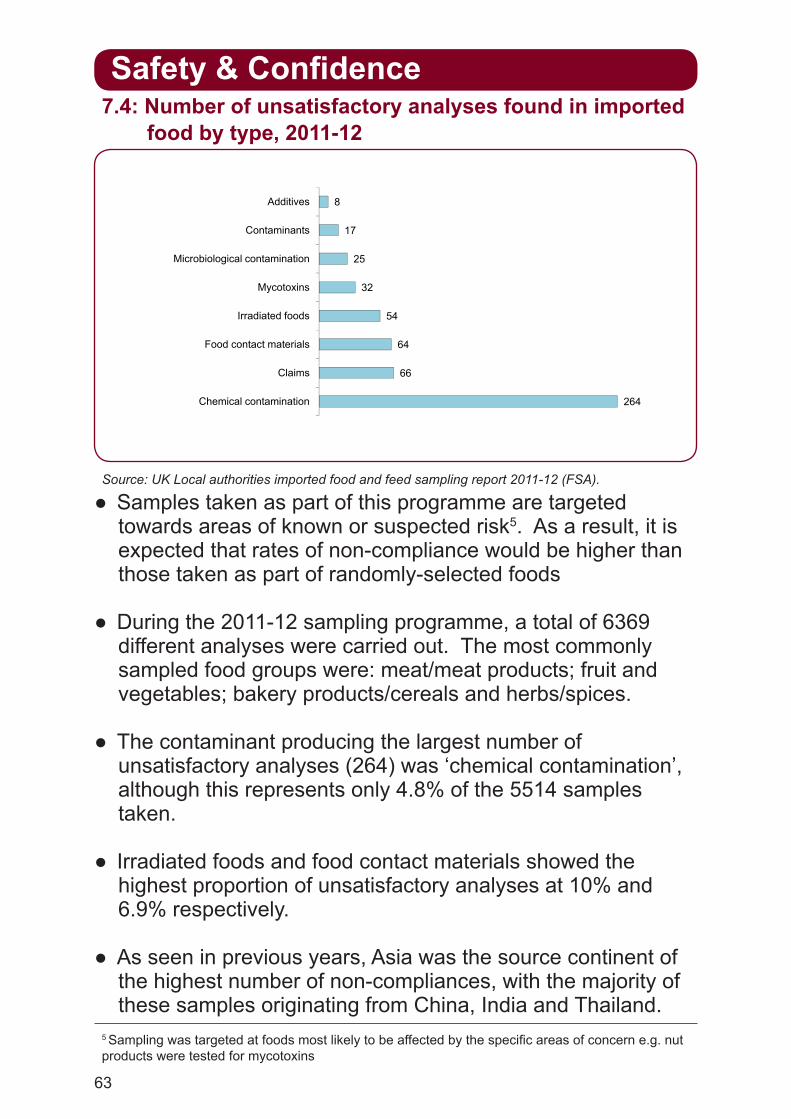
63
Safety & Confidence
8
17
Additives
Contaminants
8
17
25
Additives
Contaminants
Microbiological contamination
8
17
25
32
54
Additives
Contaminants
Microbiological contamination
Mycotoxins
Irradiated foods
8
17
25
32
54
64
66
Additives
Contaminants
Microbiological contamination
Mycotoxins
Irradiated foods
Food contact materials
Claims
8
17
25
32
54
64
66
264
Additives
Contaminants
Microbiological contamination
Mycotoxins
Irradiated foods
Food contact materials
Claims
Chemical contamination
8
17
25
32
54
64
66
264
Additives
Contaminants
Microbiological contamination
Mycotoxins
Irradiated foods
Food contact materials
Claims
Chemical contamination
5 Sampling was targeted at foods most likely to be affected by the specific areas of concern e.g. nut products were tested for mycotoxins
● Samples taken as part of this programme are targeted towards areas of known or suspected risk5. As a result, it is expected that rates of non-compliance would be higher than those taken as part of randomly-selected foods
● During the 2011-12 sampling programme, a total of 6369 different analyses were carried out. The most commonly sampled food groups were: meat/meat products; fruit and vegetables; bakery products/cereals and herbs/spices.
● The contaminant producing the largest number of unsatisfactory analyses (264) was ‘chemical contamination’, although this represents only 4.8% of the 5514 samples taken.
● Irradiated foods and food contact materials showed the highest proportion of unsatisfactory analyses at 10% and 6.9% respectively.
● As seen in previous years, Asia was the source continent of the highest number of non-compliances, with the majority of these samples originating from China, India and Thailand.
Source: UK Local authorities imported food and feed sampling report 2011-12 (FSA).
7.4: Number of unsatisfactory analyses found in imported food by type, 2011-12
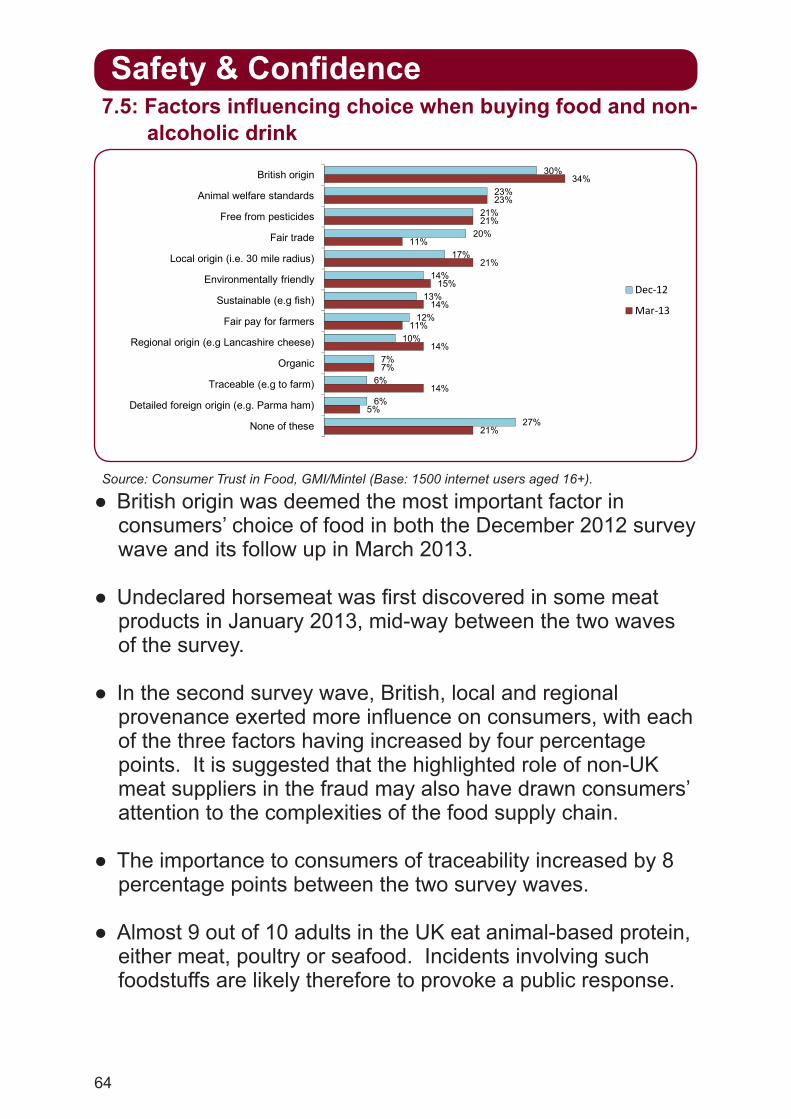
64
Safety & Confidence
30%
23%
21%
20%
17%
14%
13%
12%
10%
34%
23%
21%
11%
21%
15%
14%
11%
British origin
Animal welfare standards
Free from pesticides
Fair trade
Local origin (i.e. 30 mile radius)
Environmentally friendly
Sustainable (e.g fish)
Fair pay for farmers
R i l i i ( L hi h )
Dec‐12
Mar‐13
30%
23%
21%
20%
17%
14%
13%
12%
10%
7%
6%
6%
27%
34%
23%
21%
11%
21%
15%
14%
11%
14%
7%
14%
5%
21%
British origin
Animal welfare standards
Free from pesticides
Fair trade
Local origin (i.e. 30 mile radius)
Environmentally friendly
Sustainable (e.g fish)
Fair pay for farmers
Regional origin (e.g Lancashire cheese)
Organic
Traceable (e.g to farm)
Detailed foreign origin (e.g. Parma ham)
None of these
Dec‐12
Mar‐13
● British origin was deemed the most important factor in consumers’ choice of food in both the December 2012 survey wave and its follow up in March 2013.
● Undeclared horsemeat was first discovered in some meat products in January 2013, mid-way between the two waves of the survey.
● In the second survey wave, British, local and regional provenance exerted more influence on consumers, with each of the three factors having increased by four percentage points. It is suggested that the highlighted role of non-UK meat suppliers in the fraud may also have drawn consumers’ attention to the complexities of the food supply chain.
● The importance to consumers of traceability increased by 8 percentage points between the two survey waves.
● Almost 9 out of 10 adults in the UK eat animal-based protein, either meat, poultry or seafood. Incidents involving such foodstuffs are likely therefore to provoke a public response.
Source: Consumer Trust in Food, GMI/Mintel (Base: 1500 internet users aged 16+).
7.5: Factors influencing choice when buying food and non-alcoholic drink

65
Safety & Confidence
0% 10% 20% 30% 40% 50% 60% 70%0% 10% 20% 30% 40% 50% 60% 70%
Food pricesAmount of salt in food
Food wasteAmount of fat in food
0% 10% 20% 30% 40% 50% 60% 70%
Food pricesAmount of salt in food
Food wasteAmount of fat in food
Amount of saturated fat in foodAmount of sugar in food
Animal welfareFood hygiene when eating out
0% 10% 20% 30% 40% 50% 60% 70%
Food pricesAmount of salt in food
Food wasteAmount of fat in food
Amount of saturated fat in foodAmount of sugar in food
Animal welfareFood hygiene when eating out
Food poisoning Use of additives
Food aimed at children (in school meals)Date labels
May 2012
May 2013
0% 10% 20% 30% 40% 50% 60% 70%
Food pricesAmount of salt in food
Food wasteAmount of fat in food
Amount of saturated fat in foodAmount of sugar in food
Animal welfareFood hygiene when eating out
Food poisoning Use of additives
Food aimed at children (in school meals)Date labels
Use of pesticidesFood milesGM foods
Hormones/steroids/antibiotics in food
May 2012
May 2013
0% 10% 20% 30% 40% 50% 60% 70%
Food pricesAmount of salt in food
Food wasteAmount of fat in food
Amount of saturated fat in foodAmount of sugar in food
Animal welfareFood hygiene when eating out
Food poisoning Use of additives
Food aimed at children (in school meals)Date labels
Use of pesticidesFood milesGM foods
Hormones/steroids/antibiotics in foodFood hygiene at home
BSEFeed given to livestock*
May 2012
May 2013
● The main food issue of concern to people is food prices, with 59% concerned in May 2013. This is a decrease from 63% in May 2012 despite food prices still outpacing general inflation.
● Most food issues show a lower level of concern in 2013 than a year earlier. Those showing an increased concern include food hygiene, both at home and when eating out, the amount of sugar in food and date labels.
● Whilst this survey did not specifically ask about horsemeat, a small proportion of respondents (5%) spontaneously reported horsemeat as a food issue of concern in the May 2013 wave.
● Food prices, salt, waste, fat, saturated fat, sugar and food hygiene when eating out are the food issues where more than 40% of people are concerned. In May 2013 21% of respondents reported no food safety issues of concern.
Source: Biannual Public Attitudes Tracker9, (FSA) July 2013.* Statistically significant change from previous wave reported at the 95% confidence level.
7.6: Percentage of people concerned about certain food issues7, 2012-2013
7 Based on ‘Total’ responses (spontaneous plus prompted responses). 8 Uses a random location sample (UK).
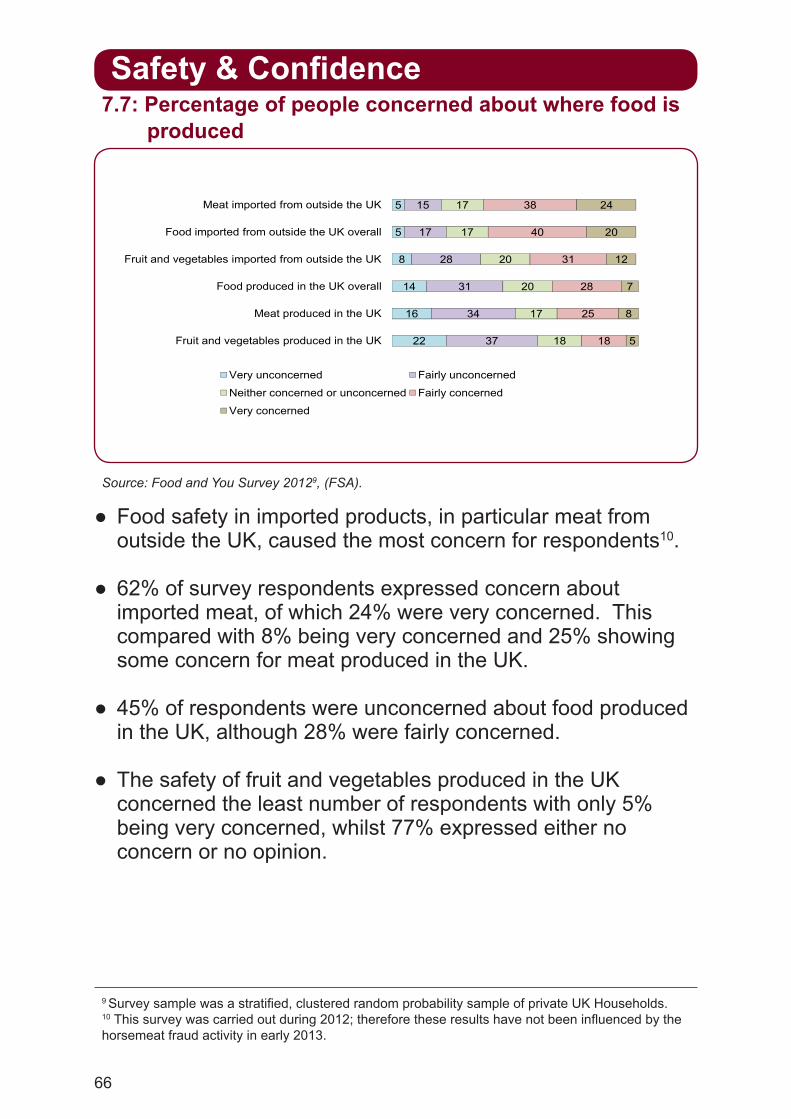
66
Source: Food and You Survey 20129, (FSA).
● Food safety in imported products, in particular meat from outside the UK, caused the most concern for respondents10.
● 62% of survey respondents expressed concern about imported meat, of which 24% were very concerned. This compared with 8% being very concerned and 25% showing some concern for meat produced in the UK.
● 45% of respondents were unconcerned about food produced in the UK, although 28% were fairly concerned.
● The safety of fruit and vegetables produced in the UK concerned the least number of respondents with only 5% being very concerned, whilst 77% expressed either no concern or no opinion.
5
5
8
14
16
15
17
28
31
34
17
17
20
20
17
38
40
31
28
25
24
20
12
7
8
Meat imported from outside the UK
Food imported from outside the UK overall
Fruit and vegetables imported from outside the UK
Food produced in the UK overall
Meat produced in the UK
5
5
8
14
16
22
15
17
28
31
34
37
17
17
20
20
17
18
38
40
31
28
25
18
24
20
12
7
8
5
Meat imported from outside the UK
Food imported from outside the UK overall
Fruit and vegetables imported from outside the UK
Food produced in the UK overall
Meat produced in the UK
Fruit and vegetables produced in the UK
Very unconcerned Fairly unconcerned
Neither concerned or unconcerned Fairly concerned
Very concerned
7.7: Percentage of people concerned about where food is produced
Safety & Confidence
9 Survey sample was a stratified, clustered random probability sample of private UK Households. 10 This survey was carried out during 2012; therefore these results have not been influenced by the horsemeat fraud activity in early 2013.

67
0 10 20 30 40 50 60 70 80
Smell
Colour
Look (e.g. mould)
Use by date
Best before date
Sell by/display until date
Feel (e.g. texture)
Whether stored correctly
Taste
Other*
Beef, lamb, pork, poultry
Fish (excluding shellfish)Milk and yogurt
CheeseEggs
● FSA guidance is that even if a food looks and smells fine, the use by date is the best indicator of whether it is safe to eat. In 2012, use by dates tended to be the third or fourth most commonly reported method of indicating food safety.
● How food smelled was the method used by between 69% and 76% of respondents to indicate whether meat, fish, milk and yogurt were safe to eat.
● How food looks e.g the appearance of mould, was the most common practice for assessing whether cheese is safe to eat.
● Smell and use by dates were the two most common methods used for assessing the safety of eggs, but 16% of respondents said that their preferred method was whether the eggs floated in water.
*Other includes: unspecified dates, buy fresh, damaged packaging and those that don’t know/don’t eat/buy a product.Source: Food and You Survey 201211, FSA
7.8: Methods used to assess whether food is safe to eat
Safety & Confidence
11 Survey sample was a stratified, clustered random probability sample of private UK Households.

68
9485
74 71 69 68 64 61 56 5548 46 46 43 42 42 40
614
26 29 30 30 35 37 43 42 51 52 52 56 58 56 6065 66 68
70 76 74 7886 87 89 89
0 1 0 0 1 2 1 2 1 3 1 2 2 1 0 2 0 2 1 03
03
0 0 0 0 0
20
40
60
80
100
120
Perce
ntage
Concerned Not concerned Don't know
9485
74 71 69 68 64 61 56 5548 46 46 43 42 42 40
33 33 32 27 24 23 2214 13 11 11
614
26 29 30 30 35 37 43 42 51 52 52 56 58 56 6065 66 68
70 76 74 7886 87 89 89
0 1 0 0 1 2 1 2 1 3 1 2 2 1 0 2 0 2 1 03
03
0 0 0 0 0
0
20
40
60
80
100
120Gr
eece
Portu
gal
Slov
enia
Spain
Czec
h Rep
ublic
Hung
ary
Slov
akia
Bulga
riaFr
ance
Roam
niaLa
tvia
Unite
d King
dom
Italy
EU27
Cypr
usIre
land
Belgi
umMa
ltaLit
huan
iaEs
tonia
Luxe
mbou
rgFin
land
Polan
dAu
stria
Germ
any
Swed
enDe
nmar
kNe
therla
nds
Perce
ntage
Concerned Not concerned Don't know
● People in Greece and Portugal are very concerned about their national food security. 94% of those polled in Greece and 85% of those polled in Portugal expressed concern.
● People in Netherlands, Denmark, Sweden and Germany are less concerned about national food security.
● Across the EU (most Member States) 76% expressed concern that sufficient food is produced to meet the needs of the world’s population.
● Across the EU (most Member States) 43% expressed some degree of concern that sufficient food is produced to meet the needs of their country.
● In 17 out of the 27 Member States the proportion of respondents who are not concerned about food production in their own country is greater than the proportion of those who are concerned.
Source: Europeans’ attitudes towards food security, food quality and the countryside; European Commission, 201212.
7.9: Extent of concern across EU whether food production meets population need in ‘their own country’
Safety & Confidence
12 A survey of 26,593 respondents across the 27 Member States of the European Union between 10th and 25th March 2012.
69
GlossaryEconomic Definition of food and agri-food sector
The UK food sector is defined as food manufacturing, food wholesaling, food retailing and non-residential catering. In terms of the standard industrial classification (SIC 2007) it is defined as:
Food Manufacturing: 10 & 11Food Wholesaling: 46.17 & 46.3 less 46.35Food Retailing: 47.11 & 47.2 less 47.26 & 47.81Non-residential Catering: 56
The deductions are to remove non-food items as far as possible.
The agri-food sector is the food sector plus agriculture and fishing. Agriculture and fishing are shown in several charts for comparison.
Net capital expenditureThis is calculated by adding to the value of new building work, acquisitions less disposals of land and existing buildings, vehicles and plant and machinery.
Gross Value Added (GVA)GVA is the difference between output and intermediate consumption for any given sector / industry. This is the difference between the value of goods and services produced and the cost of raw materials and other inputs which are used up in production.
Total Factor Productivity (TFP)Productivity measures the efficiency at which inputs are converted into outputs. Total Factor Productivity provides a comprehensive picture of growth.
70
Glossary
Low incomeThe most commonly used threshold to determine relative low income is having an income which is less than 60% of the median in that year.Absolute low income is considered to be having an income which is less than 60% of the median in that year, adjusted by the inflation level of (currently) 2010-11.
Equivalised incomeThe income a household needs to attain a given standard of living will depend on its size and composition. Equivalisation is a means of adjusting a household’s income for size and composition so that the incomes of all households are on a comparable basis.
Small and Medium Enterprises (SMEs)Outside of these statistics, the definition of a SME can depend upon several factors, including turnover. For these statistics, a ‘small’ business is a private sector business with fewer than 50 employees. A ‘medium’ business is a private sector business with between 50 and 249 employees.
A ‘micro’ business is a private sector business with between 1 and 10 employees, which, for the purpose of these statistics is incorporated within the ‘small’ category.