food o utlook - home | food and agriculture organization ... · food o utlook biannual report on...
TRANSCRIPT
May 2014
Food Outlook B IANNUAL REPORT ON GLOBAL FOOD MARKETS
ISSN 0251-1959
The Food Outlook report is a product of the FAO Trade and Markets Division. This report is prepared under the overall guidance of David Hallam, Director; Concepcion
Calpe, Senior Economist; and Abdolreza Abbassian, Senior Economist and Food Outlook Team Leader. It is written by a team of economists, whose names and email contacts appear under their respective market summary contributions. The report benefited from research support by many staff, namely, David Bedford, Claudio Cerquiglini, Julie Claro, Berardina Forzinetti, Grace Karumathy, David Mancini, Emanuele Marocco, Patrizia Mascianá, Marco Milo and the fisheries statistical team.
Special thanks go to Rita Ashton for compiling the report and overall administrative support, as well as to Claudio Cerquiglini, for preparing the charts and statistical tables. Additionally, the team is grateful to Nancy Hart for her editorial assistance.
ACKNOWLEDGEMENTS
The designations employed and the presentation of material in this information product do not imply the expression of any opinion whatsoever on the part of the Food and Agriculture Organization of the United Nations (FAO) concerning the legal or development status of any country, territory, city or area or of its authorities, or concerning the delimitation of its frontiers or boundaries. The mention of specific companies or products of manufacturers, whether or not these have been patented, does not imply that these have been endorsed or recommended by FAO in preference to others of a similar nature that are not mentioned.
ISSN: 0251-1959 (print)ISSN 1560-8182 (Online)
© FAO 2014
FAO encourages the use, reproduction and dissemination of material in this information product. Except where otherwise indicated, material may be copied, downloaded and printed for private study, research and teaching purposes, or for use in non-commercial products or services, provided that appropriate acknowledgement of FAO as the source and copyright holder is given and that FAO’s endorsement of users’ views, products or services is not implied in any way.
All requests for translation and adaptation rights, and for resale and other commercial use rights should be made via www.fao.org/contact-us/licencerequest
or addressed to [email protected].
FAO information products are available on the FAO website (www.fao.org/publications) and can be purchased through [email protected]

International trade in rice may reach
a new record in 2014, as lower world
prices induce traditional importers to
return to the market to buy more.
This, along with the potential of an
El Niño event in the second part of
2014, may help reverse the slide of
Indica prices witnessed in the past
twelve months.
RICE
With world production of coarse grains
headed towards a modest decline,
inventories will have to be drawn down
to meet the projected demand in the
2014/15 season. This tightening will not
be a cause for concern if the current
production forecasts materialize and
trade flows are not negatively affected by
tensions in the Black Sea region.
COARSE GRAINS
World sugar production is forecast to
decline marginally in 2013/14, but will
still be enough to cover projected global
consumption and enable a build-up in
global stocks. On the other hand, world
sugar trade is anticipated to increase
significantly in 2013/14, reflecting
greater demand from the traditional
importing countries.
SUGAROil and meal market fundamentals
are set to improve in 2013/14, thanks
to record-high oilcrop production.
Nonetheless, prices trended upward,
reacting to a tight balance in the
United States, to a slow production
growth in palm oil, and to successive
cuts in soybean production estimates.
OILCROPS
International dairy product prices
declined in March and experienced a
further, sharper fall in April, returning
to a level similar to a year ago. Milk
production continues to increase
steadily in many countries.
DAIRY
In recent months, weather and
geopolitical tensions pushed up wheat
prices in international markets. However,
the early supply and demand outlook for
wheat in the 2014/15 marketing season
points to a generally balanced situation,
with world stocks remaining at relatively
comfortable levels in spite of a forecast
decline in world wheat production.
WHEAT
World meat production is anticipated
to grow moderately in 2014.
International prices have remained
at historically high levels since the
beginning of 2011 and, while the price
situation varies among the different
types of meat, there is no sign of an
overall decrease.
MEAT
“An important milestone occurred recently that will likely have lasting
effects on the global market for pulses. In December 2013, the UN
General Assembly declared that 2016 will be the “International
Year of Pulses”. This will likely draw much needed attention to a
commodity group which has, despite its many appreciable qualities,
proven quite undervalued up until now.“
“At the request of AMIS partners the GEOGLAM Crop Monitor
developed a series of customized condition map and chart products.
These include synthesis maps that provide information on all four
crops within a single map, as well as crop specific condition maps
and pie charts.”
A combination of renewed demand in
traditional markets and supply shortages
for a number of farmed species has
boosted overall price levels. The likely
arrival of the El Niño phenomenon in
2014 could reduce South American
catches of small pelagic species and lead
to higher fishmeal and feed prices.
FISHERIES
ood markets have been
affected by weather
concerns and political
tensions in the Black
Sea region, which
have boosted the FAO Food Price
Index since February. While the
2014 global food import bill could
stabilize at USD 1.29 trillion, animal
product bills are set to increase,
sustained by rising volumes and
prices.
F
HIGHLIGHTS
SPECIAL FEATURE
GEOGLAM Crop Monitor
SPECIAL FEATURE
Pulses


170
200
230
260
290
AMFJDNOSAJJMA
2013 2014
2002-2004=100
Dairy
Vegetableoils Cereals
Sugar
Meat
CONTENTS1-9
90-125
126-135
76-89
62-75
10-60
Wheat 11Coarse grains 17Rice 23Oilcrops, oils and meals 31Sugar 40Meat and meat products 45Milk and milk products 50Fish and fishery products 55
Grains 77Rice 79Oilcrops 83Sugar 86Meat 87Dairy 89
Investment flows 127Ocean freight rates 130Food import bills 131The FAO price index 132
Pulses 62The Geoglam crop monitor 68
62
133
International Year of Pulses
2016
MARKET SUMMARIES
MARKET ASSESSMENTS
SPECIAL FEATURES
MAJOR POLICY DEVELOPMENTS
STATISTICAL TABLES
MARKET INDICATORS
FAO Food Commodity Price Indices
(April 2013 - April 2014)

MAR
KET
SUM
MAR
IES
MAR
KET
SUM
MAR
IES

Ma
rke
t sum
ma
ries
1FOOD OUTLOOKMAY 2014
Early prospects for 2014 cereal crops point to a decline from the previous year’s record level, but output is nevertheless expected to be the second largest ever. Based on conditions of crops already in the ground and planting intentions for those to be sown later this year and assuming normal weather for the remainder of the season, FAO’s first forecast puts world cereal production in 2014 at around 2 458 million tonnes (including rice in milled terms), some 2.4 percent down from 2013. Wheat and coarse grains would account for the reduction. Total cereal utilization in the new season (2014/15) is forecast to increase by 1.9 percent, which compares with a 4.0 percent rise in 2013/14. The slowdown reflects a subdued expansion in the industrial use of cereals and only a modest rise in the use of coarse grains for feed. World cereal stocks at the close of crop seasons ending in 2015 are forecast to fall to 566 million tonnes, 1.4 percent lower than their relatively high opening levels. The decline involves coarse grains, as wheat stocks may increase slightly and rice will remain steady. The small anticipated decline in world reserves will not make much of a change to the stocks-to-use ratio in 2014/15 compared with 2013/14. FAO’s first forecast of world trade in cereals in 2014/15 indicates a contraction of about 1.5 percent from the estimated record in 2013/14. Maize accounts for most of the decline, followed by barley and wheat. In spite of a generally favourable supply and demand situation, international prices of wheat and maize have increased significantly in recent weeks on weather concerns and tensions in the Black Sea region. The same factors are likely to be the main determinant of price movements over the second half of 2014. On the other hand, rice prices, especially Indica, have been sliding, amid large supplies and accrued competition among exporters.
CEREALS
Contact:[email protected]@fao.org
CEREAL PRODUCTION, UTILIZATION AND STOCKS
WORLD CEREAL MARKET AT A GLANCE 1
2012/13 2013/14 estim.
2014/15 f’cast
Change: 2014/15
over 2013/14
million tonnes %
WORLD BALANCE
Production 2 307.3 2 518.8 2 458.2 -2.4
Trade2 310.2 335.7 330.8 -1.5
Total utilization 2 327.3 2 420.6 2 465.7 1.9
Food 1 075.2 1 092.0 1 108.2 1.5
Feed 802.1 858.2 882.8 2.9
Other uses 449.9 470.3 474.8 1.0
Ending stocks 502.7 573.9 565.8 -1.4
SUPPLY AND DEMAND INDICATORS
Per caput food consumption:
World (kg/yr) 152.1 152.7 153.4 0.5
LIFDC3 (kg/yr) 149.0 149.9 151.1 0.8
World stock-to-use ratio (%) 20.8 23.3 22.7
Major exporters stock-to-disappearance ratio (%)
16.9 18.4 17.7
FAO CEREAL PRICE INDEX (2002-2004=100)
2012 2013 2014 Jan-Apr
Change: Jan-Apr 2014
over Jan-Apr 2013
%
236 219 199 -16.6
1 Rice in milled equivalent.2 Trade refers to exports based on a July/June marketing season for wheat and
coarse grains and on a January/December marketing season for rice.3 Low-income Food-Deficit countries.
200
400
600
800
1700
2000
2300
2600
14/1512/1310/1108/0906/0704/05
Million tonnes Million tonnes
f’cast
Stocks (right axis)
Production (left axis) Utilization (left axis)

Ma
rke
t su
mm
ari
es
2 FOOD OUTLOOKMAY 2014
Global wheat production in 2014 is forecast at some 702 million tonnes, 1.9 percent below last year’s record, but still the second largest ever. Much of the reduction is anticipated to be concentrated in Canada, but smaller harvests are also expected in Australia, Morocco, the Syrian Arab Republic, the Russian Federation, Ukraine and the United States, which would more than offset larger outputs in Argentina, Brazil, India, Mexico and Pakistan.
Following a surge to a record level in 2013/14, international trade in the new marketing season (2014/15) is forecast to decline, but only by 1 million tonnes, to 149.5 million tonnes. Continued strong demand in several countries in Asia is seen as the primary factor sustaining the high trade volume in 2014/15, even though, overall, imports in the region are forecast to decline slightly. By contrast, purchases by the EU are likely to increase. Although falling, export availabilities in major exporting countries are expected to be adequate to meet the projected import demand. An export recovery in Argentina is likely to compensate for a decline in shipments by the EU. Sparing any unpredictable turn of events in the Black Sea region, wheat exports from Ukraine are forecast to remain steady around the 2013/14 level.
World wheat utilization in 2014/15 is foreseen to grow by 1.7 percent to 699 million tonnes, underpinned by rising food and feed uses. Global wheat stocks are anticipated to reach almost 180 million tonnes by the close of the seasons in 2015, only slightly above their opening levels. As a result, the world stocks-to-use ratio is estimated to fall slightly, although staying at a relatively high level of 25.2 percent. Stocks held by the major exporters are also likely to decline, pointing to some tightening of supplies in the new season. To a large extent, this explains why concerns over weather conditions and political tensions have boosted international wheat prices in recent months.
WHEAT
Contact:[email protected]@fao.org
WHEAT PRODUCTION, UTILIZATION AND STOCKS
WORLD WHEAT MARKET AT A GLANCE
1 Trade refers to exports based on a common July/June marketing season.2 Major exporters include Argentina, Australia, Canada, EU, Kazakhstan,
Russian Fed., Ukraine and the United States.3 Derived from the International Grains Council (IGC) wheat index.
2012/13 2013/14 estim.
2014/15 f’cast
Change: 2014/15
over 2013/14
million tonnes %
WORLD BALANCE
Production 659.7 715.1 701.7 -1.9
Trade1 140.8 150.5 149.5 -0.7
Total utilization 685.6 687.9 699.2 1.6
Food 474.4 480.1 485.4 1.1
Feed 132.1 128.6 133.4 3.7
Other uses 79.0 79.1 80.5 1.8
Ending stocks 156.9 177.5 179.5 1.1
SUPPLY AND DEMAND INDICATORS
Per caput food consumption:
World (kg/yr) 67.1 67.2 67.2 0.0
LIFDC (kg/yr) 46.1 46.1 46.1 0.0
World stock-to-use ratio (%) 22.8 25.4 25.2
Major exporters stock-to-disappearance ratio2 (%)
14.1 15.3 14.2
FAO WHEAT PRICE INDEX3 (2002-2004=100)
2012 2013 2014 Jan-Apr
Change: Jan-Apr 2014
over Jan-Apr 2013
%
204 194 183 -11.7
100
140
180
220
260
520
570
620
670
720
14/1512/1310/1108/0906/0704/05
Million tonnes Million tonnes
f’cast
Stocks (right axis)
Production (left axis) Utilization (left axis)
Ma
rke
t sum
ma
ries
3FOOD OUTLOOKMAY 2014
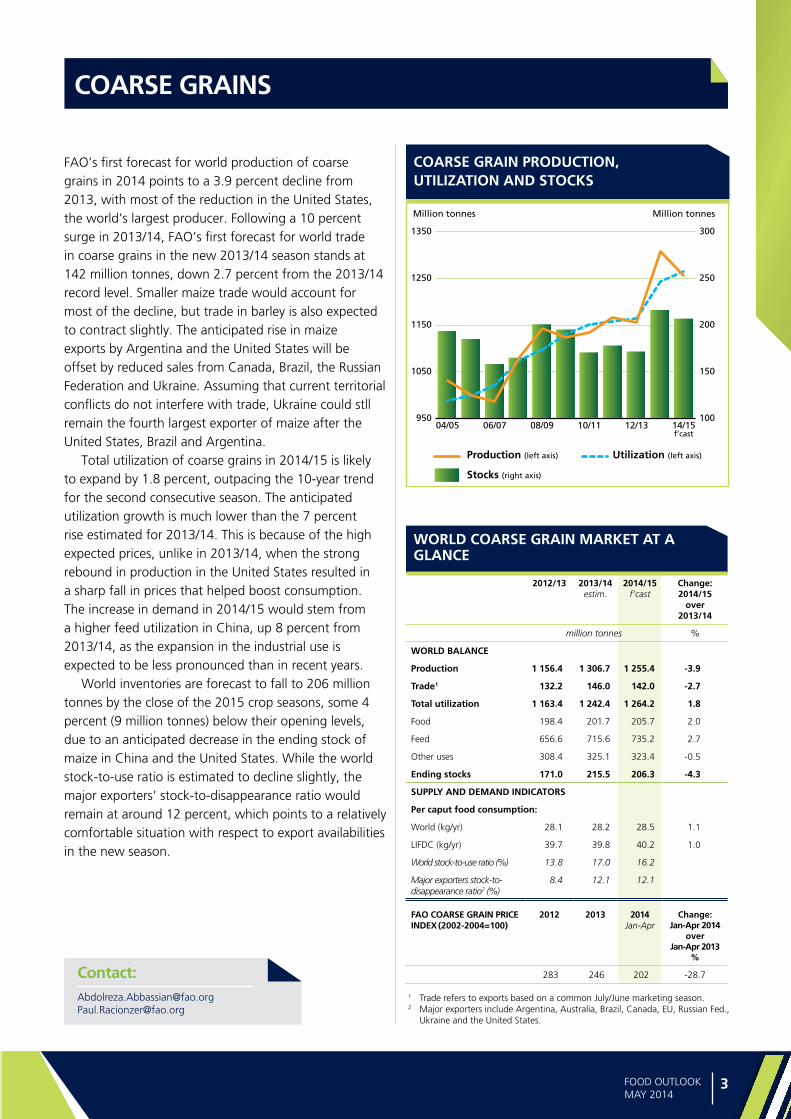
FAO’s first forecast for world production of coarse grains in 2014 points to a 3.9 percent decline from 2013, with most of the reduction in the United States, the world’s largest producer. Following a 10 percent surge in 2013/14, FAO’s first forecast for world trade in coarse grains in the new 2013/14 season stands at 142 million tonnes, down 2.7 percent from the 2013/14 record level. Smaller maize trade would account for most of the decline, but trade in barley is also expected to contract slightly. The anticipated rise in maize exports by Argentina and the United States will be offset by reduced sales from Canada, Brazil, the Russian Federation and Ukraine. Assuming that current territorial conflicts do not interfere with trade, Ukraine could stll remain the fourth largest exporter of maize after the United States, Brazil and Argentina.
Total utilization of coarse grains in 2014/15 is likely to expand by 1.8 percent, outpacing the 10-year trend for the second consecutive season. The anticipated utilization growth is much lower than the 7 percent rise estimated for 2013/14. This is because of the high expected prices, unlike in 2013/14, when the strong rebound in production in the United States resulted in a sharp fall in prices that helped boost consumption. The increase in demand in 2014/15 would stem from a higher feed utilization in China, up 8 percent from 2013/14, as the expansion in the industrial use is expected to be less pronounced than in recent years.
World inventories are forecast to fall to 206 million tonnes by the close of the 2015 crop seasons, some 4 percent (9 million tonnes) below their opening levels, due to an anticipated decrease in the ending stock of maize in China and the United States. While the world stock-to-use ratio is estimated to decline slightly, the major exporters’ stock-to-disappearance ratio would remain at around 12 percent, which points to a relatively comfortable situation with respect to export availabilities in the new season.
COARSE GRAINS
Contact:[email protected]@fao.org
COARSE GRAIN PRODUCTION, UTILIZATION AND STOCKS
1 Trade refers to exports based on a common July/June marketing season.2 Major exporters include Argentina, Australia, Brazil, Canada, EU, Russian Fed.,
Ukraine and the United States.
WORLD COARSE GRAIN MARKET AT A GLANCE
2012/13 2013/14 estim.
2014/15 f’cast
Change: 2014/15
over 2013/14
million tonnes %
WORLD BALANCE
Production 1 156.4 1 306.7 1 255.4 -3.9
Trade1 132.2 146.0 142.0 -2.7
Total utilization 1 163.4 1 242.4 1 264.2 1.8
Food 198.4 201.7 205.7 2.0
Feed 656.6 715.6 735.2 2.7
Other uses 308.4 325.1 323.4 -0.5
Ending stocks 171.0 215.5 206.3 -4.3
SUPPLY AND DEMAND INDICATORS
Per caput food consumption:
World (kg/yr) 28.1 28.2 28.5 1.1
LIFDC (kg/yr) 39.7 39.8 40.2 1.0
World stock-to-use ratio (%) 13.8 17.0 16.2
Major exporters stock-to-disappearance ratio2 (%)
8.4 12.1 12.1
FAO COARSE GRAIN PRICE INDEX (2002-2004=100)
2012 2013 2014 Jan-Apr
Change: Jan-Apr 2014
over Jan-Apr 2013
%
283 246 202 -28.7
100
150
200
250
300
950
1050
1150
1250
1350
14/1512/1310/1108/0906/0704/05
Million tonnes Million tonnes
f’cast
Stocks (right axis)
Production (left axis) Utilization (left axis)

Ma
rke
t su
mm
ari
es
4 FOOD OUTLOOKMAY 2014
Less attractive prices and a possible recurrence of an El Niño weather anomaly may keep world rice production growth subdued again in 2014. The expansion should be particularly modest in Asia, a region particularly exposed to the climatic event. In addition, lower producer prices in Thailand are likely to prompt a sizeable contraction in rice planting and production. Prospects for the season are more buoyant in Africa and the Americas, which may witness faster production growth. Under current forecasts, international trade in rice will expand briskly in calendar 2014 to a new record, sustained by ample supplies in exporting countries and increasing purchases by traditional importers, such as Bangladesh, Indonesia or the Philippines. Among exporters, Thailand is expected to benefit the most from the trade expansion, as quotations from the country have fallen closer to those of its direct competitors. Rising domestic requirements and high local prices may, in turn, curb shipments from India, although not enough for the country to lose its prime position among exporters. The expected sluggish performance of the sector in 2014 may mean that, for the first time in ten years, world production could fall short of utilization, triggering a small contraction of world rice inventories carried over in 2015, the first in a decade. International rice prices have followed divergent trends in the past four months, rising in the case of Japonica rice, but remaining on a downward trend in the case of Indica. Prospects for the next few months remain highly uncertain, especially under a looming El Niño.
RICE
Contact:[email protected]@fao.org
RICE PRODUCTION, UTILIZATION AND STOCKS
WORLD RICE MARKET AT A GLANCE
2012/13 2013/14 estim.
2014/15 f’cast
Change: 2014/15
over 2013/14
million tonnes, milled equivalent %
WORLD BALANCE
Production 491.2 496.9 501.1 0.8
Trade 1 37.2 39.3 39.2 -0.2
Total utilization 478.3 490.3 502.3 2.4
Food 402.4 410.1 417.1 1.7
Ending stocks 174.8 180.9 180.1 -0.4
SUPPLY AND DEMAND INDICATORS
Per caput food consumption:
World (kg/yr) 56.9 57.4 57.7 0.5
LIFDC (kg/yr) 63.2 64.0 64.7 1.1
World stock-to-use ratio (%) 35.7 36.0 35.1
Major exporters stock-to-disappearance ratio2 (%)
28.1 27.8 27.0
FAO RICE PRICE INDEX (2002-2004=100)
2012 2013 2014 Jan-Apr
Change: Jan-Apr 2014
over Jan-Apr 2013
%
231 233 235 -1.0
1 Calendar year exports (second year shown).2 Major exporters include India, Pakistan, Thailand, the United States and
Viet Nam.
50
100
150
200
370
420
470
520
14/1512/1310/1108/0906/0704/05
Million tonnes, milled eq. Million tonnes, milled eq.
f’cast
Stocks (right axis)
Production (left axis) Utilization (left axis)
Ma
rke
t sum
ma
ries
5FOOD OUTLOOKMAY 2014
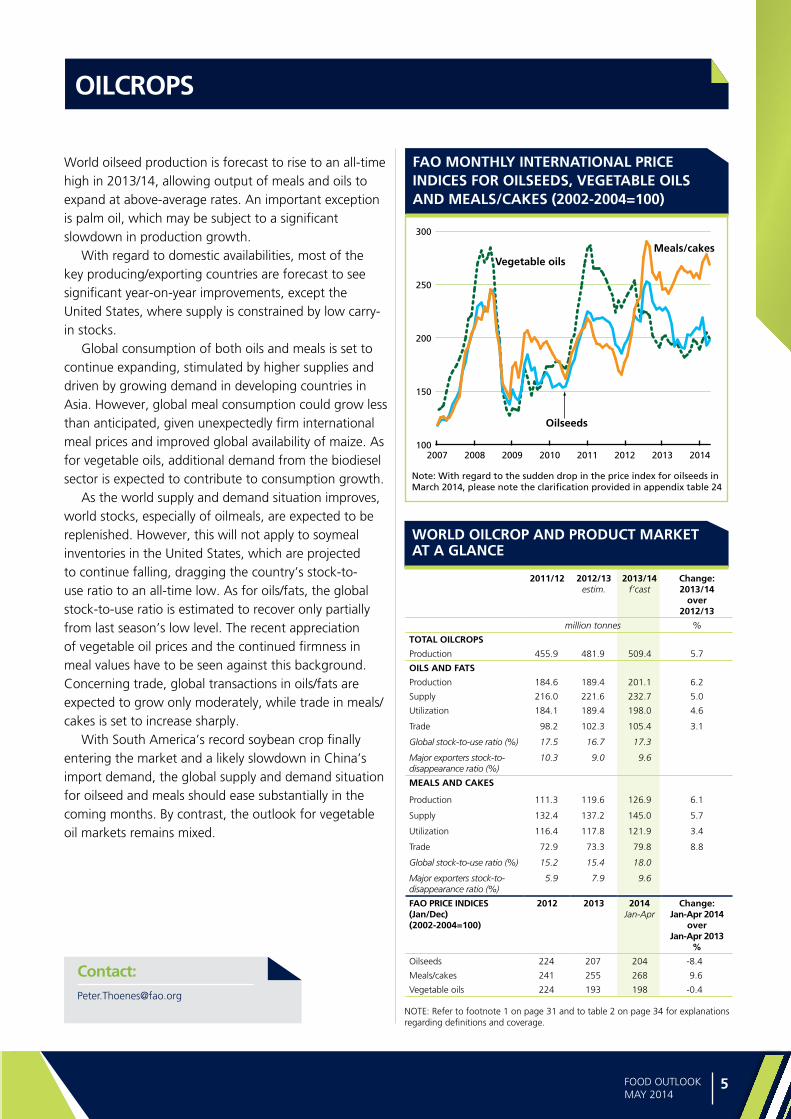
World oilseed production is forecast to rise to an all-time high in 2013/14, allowing output of meals and oils to expand at above-average rates. An important exception is palm oil, which may be subject to a significant slowdown in production growth.
With regard to domestic availabilities, most of the key producing/exporting countries are forecast to see significant year-on-year improvements, except the United States, where supply is constrained by low carry-in stocks.
Global consumption of both oils and meals is set to continue expanding, stimulated by higher supplies and driven by growing demand in developing countries in Asia. However, global meal consumption could grow less than anticipated, given unexpectedly firm international meal prices and improved global availability of maize. As for vegetable oils, additional demand from the biodiesel sector is expected to contribute to consumption growth.
As the world supply and demand situation improves, world stocks, especially of oilmeals, are expected to be replenished. However, this will not apply to soymeal inventories in the United States, which are projected to continue falling, dragging the country’s stock-to-use ratio to an all-time low. As for oils/fats, the global stock-to-use ratio is estimated to recover only partially from last season’s low level. The recent appreciation of vegetable oil prices and the continued firmness in meal values have to be seen against this background. Concerning trade, global transactions in oils/fats are expected to grow only moderately, while trade in meals/cakes is set to increase sharply.
With South America’s record soybean crop finally entering the market and a likely slowdown in China’s import demand, the global supply and demand situation for oilseed and meals should ease substantially in the coming months. By contrast, the outlook for vegetable oil markets remains mixed.
OILCROPS
Contact:[email protected]
FAO MONTHLY INTERNATIONAL PRICE INDICES FOR OILSEEDS, VEGETABLE OILS AND MEALS/CAKES (2002-2004=100)
WORLD OILCROP AND PRODUCT MARKET AT A GLANCE
2011/12 2012/13 estim.
2013/14 f’cast
Change: 2013/14
over 2012/13
million tonnes %
TOTAL OILCROPS
Production 455.9 481.9 509.4 5.7
OILS AND FATS
Production 184.6 189.4 201.1 6.2
Supply 216.0 221.6 232.7 5.0
Utilization 184.1 189.4 198.0 4.6
Trade 98.2 102.3 105.4 3.1
Global stock-to-use ratio (%) 17.5 16.7 17.3
Major exporters stock-to-disappearance ratio (%)
10.3 9.0 9.6
MEALS AND CAKES
Production 111.3 119.6 126.9 6.1
Supply 132.4 137.2 145.0 5.7
Utilization 116.4 117.8 121.9 3.4
Trade 72.9 73.3 79.8 8.8
Global stock-to-use ratio (%) 15.2 15.4 18.0
Major exporters stock-to-disappearance ratio (%)
5.9 7.9 9.6
FAO PRICE INDICES (Jan/Dec) (2002-2004=100)
2012 2013 2014 Jan-Apr
Change: Jan-Apr 2014
overJan-Apr 2013
%
Oilseeds 224 207 204 -8.4
Meals/cakes 241 255 268 9.6
Vegetable oils 224 193 198 -0.4
NOTE: Refer to footnote 1 on page 31 and to table 2 on page 34 for explanations regarding definitions and coverage.
100
150
200
250
300
20142013201220112010200920082007
Meals/cakesVegetable oils
Oilseeds
Note: With regard to the sudden drop in the price index for oilseeds inMarch 2014, please note the clarification provided in appendix table 24

Ma
rke
t su
mm
ari
es
6 FOOD OUTLOOKMAY 2014
International sugar prices, on a downward trend for most of 2013, recovered modestly by the beginning of 2014, underpinned by drought conditions in Brazil, the world’s largest sugar producer and exporter. The 2013 price decline reflected large export availabilities in the main sugar producing countries, following expansion in sugar crops area. In 2013/14, and for the fourth consecutive season, FAO estimates world sugar production to surpass consumption, but the expected surplus is likely to be smaller than in previous years. Although sugar production is set to decline marginally in 2013/14, for the first time since 2008/2009, it would still be sufficient to cover projected global consumption and allow some build-up in global stocks. Falling sugar outputs in India, the EU, the United States and the Russian Federation are anticipated to be offset mainly by expansion in Thailand, Pakistan and South Africa. Production in Brazil is expected to decline, as unfavourable weather reduced sugarcane yields, but only slightly. World sugar consumption is set to grow by about 2.3 percent in 2013/14, reflecting increases in several developing countries that should benefit from falling domestic sugar prices. Strong purchases by traditional importers, as a result of more affordable international sugar prices, are expected to lead to an expansion in trade in 2013/14. Early indications for the 2014/15 season indicate that the world sugar market is likely to be more balanced, or even display a small deficit, as producers adjust to lower international sugar prices by reducing production.
SUGAR
Contact:[email protected]
INTERNATIONAL SUGAR PRICES*
WORLD SUGAR MARKET AT A GLANCE
2011/12 2012/13 estim.
2013/14 f’cast
Change: 2013/14
over 2012/13
million tonnes %
WORLD BALANCE
Production 175.2 182.4 182.0 -0.2
Trade 52.5 53.5 56.8 6.2
Total utilization 169.8 173.9 178.0 2.3
Ending stocks 66.1 72.7 74.4 2.3
SUPPLY AND DEMAND INDICATORS
Per caput food consumption:
World (kg/yr) 24.3 24.8 25.1 1.1
LIFDC (kg/yr) 12.6 13.2 13.4 1.7
World stock-to-use ratio (%) 38.9 41.8 41.8
ISA DAILY PRICE AVERAGE (US cents/lb)
2012 2013 2014 Jan-Apr
Change: Jan-Apr 2014
over Jan-Apr 2013
%
21.5 17.7 16.9 -7.7
12
17
22
27
32
2013
2014
2012
2011
US cents per lb.
DNOSAJJMAMFJ
* As measured by the International Sugar Agreement (ISA)
Ma
rke
t sum
ma
ries
7FOOD OUTLOOKMAY 2014
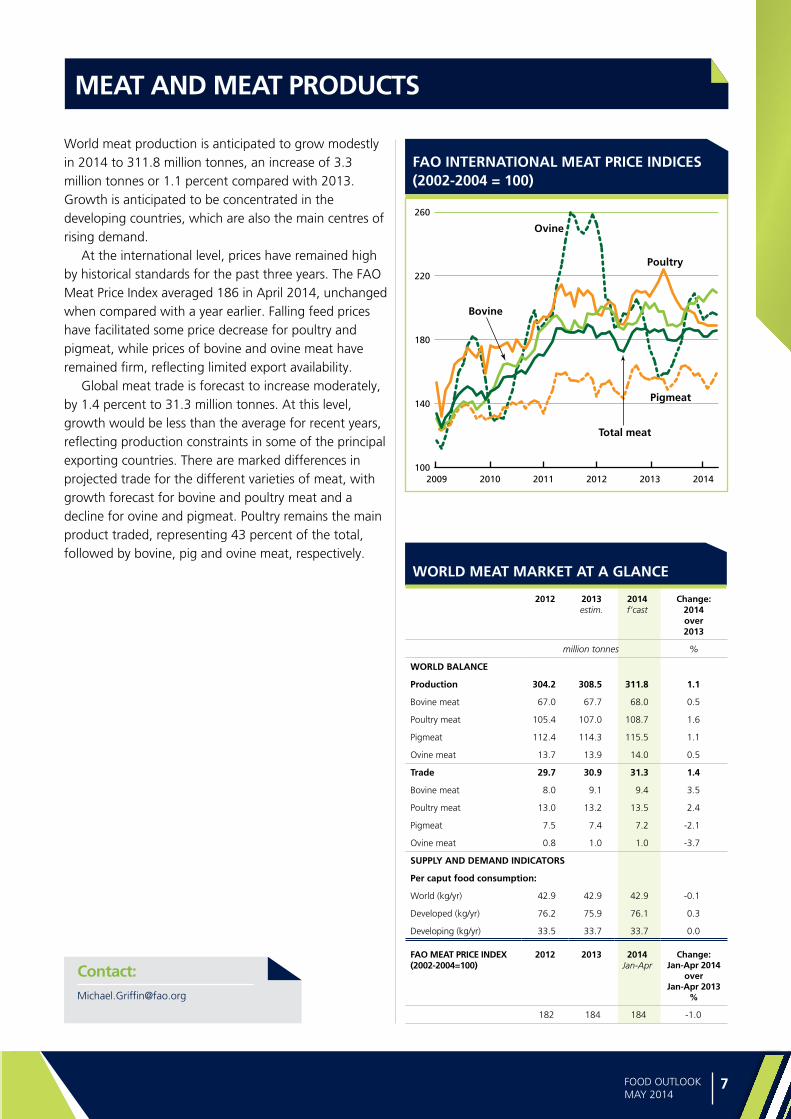
World meat production is anticipated to grow modestly in 2014 to 311.8 million tonnes, an increase of 3.3 million tonnes or 1.1 percent compared with 2013. Growth is anticipated to be concentrated in the developing countries, which are also the main centres of rising demand.
At the international level, prices have remained high by historical standards for the past three years. The FAO Meat Price Index averaged 186 in April 2014, unchanged when compared with a year earlier. Falling feed prices have facilitated some price decrease for poultry and pigmeat, while prices of bovine and ovine meat have remained firm, reflecting limited export availability.
Global meat trade is forecast to increase moderately, by 1.4 percent to 31.3 million tonnes. At this level, growth would be less than the average for recent years, reflecting production constraints in some of the principal exporting countries. There are marked differences in projected trade for the different varieties of meat, with growth forecast for bovine and poultry meat and a decline for ovine and pigmeat. Poultry remains the main product traded, representing 43 percent of the total, followed by bovine, pig and ovine meat, respectively.
MEAT AND MEAT PRODUCTS
Contact:[email protected]
FAO INTERNATIONAL MEAT PRICE INDICES (2002-2004 = 100)
WORLD MEAT MARKET AT A GLANCE
2012 2013estim.
2014f’cast
Change: 2014 over 2013
million tonnes %
WORLD BALANCE
Production 304.2 308.5 311.8 1.1
Bovine meat 67.0 67.7 68.0 0.5
Poultry meat 105.4 107.0 108.7 1.6
Pigmeat 112.4 114.3 115.5 1.1
Ovine meat 13.7 13.9 14.0 0.5
Trade 29.7 30.9 31.3 1.4
Bovine meat 8.0 9.1 9.4 3.5
Poultry meat 13.0 13.2 13.5 2.4
Pigmeat 7.5 7.4 7.2 -2.1
Ovine meat 0.8 1.0 1.0 -3.7
SUPPLY AND DEMAND INDICATORS
Per caput food consumption:
World (kg/yr) 42.9 42.9 42.9 -0.1
Developed (kg/yr) 76.2 75.9 76.1 0.3
Developing (kg/yr) 33.5 33.7 33.7 0.0
FAO MEAT PRICE INDEX(2002-2004=100)
2012 2013 2014 Jan-Apr
Change: Jan-Apr 2014
over Jan-Apr 2013
%
182 184 184 -1.0
100
140
180
220
260
201420132012201120102009
Bovine
Poultry
Ovine
Total meat
Pigmeat
Ma
rke
t su
mm
ari
es
8 FOOD OUTLOOKMAY 2014
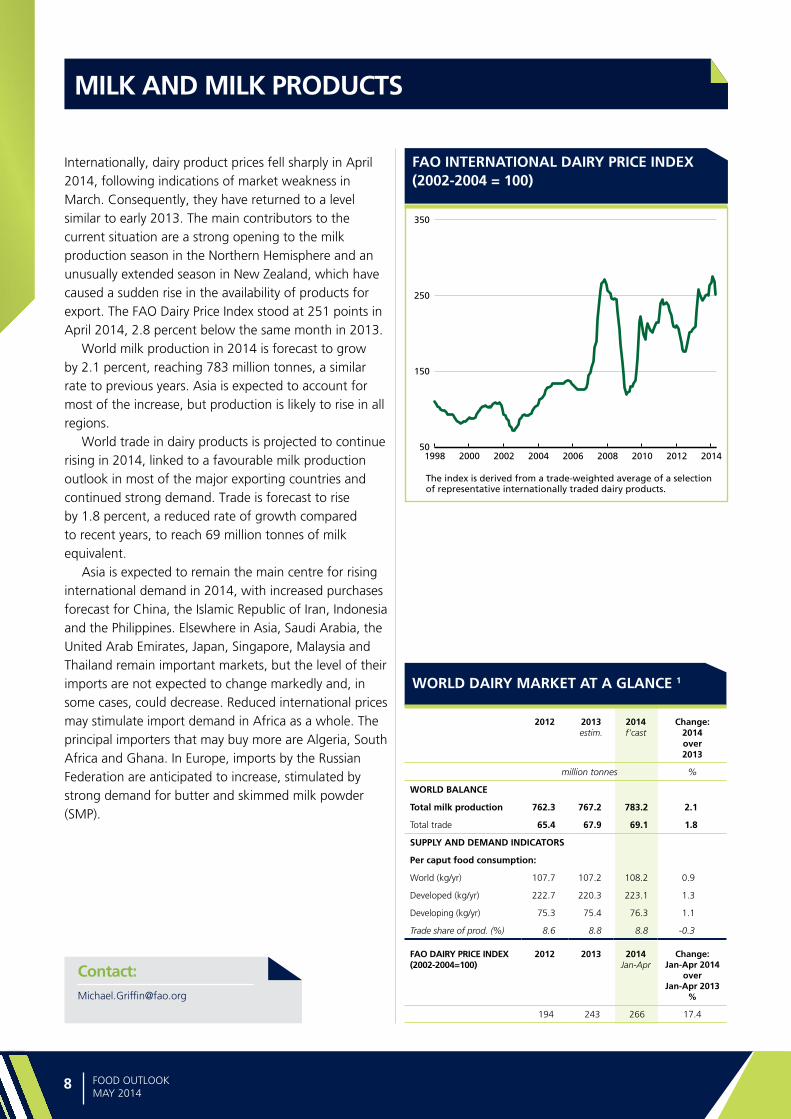
Internationally, dairy product prices fell sharply in April 2014, following indications of market weakness in March. Consequently, they have returned to a level similar to early 2013. The main contributors to the current situation are a strong opening to the milk production season in the Northern Hemisphere and an unusually extended season in New Zealand, which have caused a sudden rise in the availability of products for export. The FAO Dairy Price Index stood at 251 points in April 2014, 2.8 percent below the same month in 2013.
World milk production in 2014 is forecast to grow by 2.1 percent, reaching 783 million tonnes, a similar rate to previous years. Asia is expected to account for most of the increase, but production is likely to rise in all regions.
World trade in dairy products is projected to continue rising in 2014, linked to a favourable milk production outlook in most of the major exporting countries and continued strong demand. Trade is forecast to rise by 1.8 percent, a reduced rate of growth compared to recent years, to reach 69 million tonnes of milk equivalent.
Asia is expected to remain the main centre for rising international demand in 2014, with increased purchases forecast for China, the Islamic Republic of Iran, Indonesia and the Philippines. Elsewhere in Asia, Saudi Arabia, the United Arab Emirates, Japan, Singapore, Malaysia and Thailand remain important markets, but the level of their imports are not expected to change markedly and, in some cases, could decrease. Reduced international prices may stimulate import demand in Africa as a whole. The principal importers that may buy more are Algeria, South Africa and Ghana. In Europe, imports by the Russian Federation are anticipated to increase, stimulated by strong demand for butter and skimmed milk powder (SMP).
MILK AND MILK PRODUCTS
Contact:[email protected]
FAO INTERNATIONAL DAIRY PRICE INDEX (2002-2004 = 100)
WORLD DAIRY MARKET AT A GLANCE 1
2012 2013estim.
2014f’cast
Change: 2014 over 2013
million tonnes %
WORLD BALANCE
Total milk production 762.3 767.2 783.2 2.1
Total trade 65.4 67.9 69.1 1.8
SUPPLY AND DEMAND INDICATORS
Per caput food consumption:
World (kg/yr) 107.7 107.2 108.2 0.9
Developed (kg/yr) 222.7 220.3 223.1 1.3
Developing (kg/yr) 75.3 75.4 76.3 1.1
Trade share of prod. (%) 8.6 8.8 8.8 -0.3
FAO DAIRY PRICE INDEX(2002-2004=100)
2012 2013 2014 Jan-Apr
Change: Jan-Apr 2014
over Jan-Apr 2013
%
194 243 266 17.4
50
150
250
350
201420122010200820062004200220001998
The index is derived from a trade-weighted average of a selectionof representative internationally traded dairy products.

Ma
rke
t sum
ma
ries
9FOOD OUTLOOKMAY 2014
The economic recovery of traditional markets, such as the United States and the EU, is boosting overall demand for fish and fishery products adding to the already firm buying interest of many emerging economies, such as Mexico and Brazil. However, demand is weakening in other traditional destinations, such as the Russian Federation and Japan, where depreciating currencies and a higher VAT have made food and imports more expensive.
International prices overall have been rising, boosted by demand and, more importantly, by supply shortages for a number of both farmed and wild species. These include salmon, shrimp, pangasius and tilapia from aquaculture, and shrimp, squid, octopus and herring from capture fisheries. At the same time, however, prices have been softening for tuna, mackerel and cod. Shrimp remains the most valuable seafood category although, at the moment, importers seem reluctant to buy at current levels, indicating that some weakening of shrimp prices can be expected over the next few months.
Overall supply continues to expand thanks to a growing aquaculture sector. With most wild stocks now regulated by annual quotas, overall catches are fairly stable from year to year. However, the expected arrival of El Niño during 2014 will reduce quotas for small pelagic species in South America and overall catches. As a result, prices of fishmeal and feed could rise, leading to higher input prices for the aquaculture, livestock and poultry sectors.
World per capita consumption of seafood continues to rise by around 2 percent annually and is fast approaching annual consumption of 20 kg per capita. However, there remain large regional differences in consumption levels which, in turn, provide important opportunities for local aquaculture producers who increasingly target domestic consumers rather than international markets. In particular, it is the freshwater aquaculture sectors in Asia, South and Central America and sub-Saharan Africa that are boosting overall output and consumption.
FISH AND FISHERY PRODUCTS
Contact:[email protected]
FAO FISH PRICE INDEX (2002-2004 = 100)
WORLD FISH MARKET AT A GLANCE
2012 2013estim.
2014f’cast
Change: 2014 over 2013
million tonnes %
WORLD BALANCE
Production 158.0 161.0 165.2 2.6
Capture fisheries 91.3 90.5 90.8 0.3
Aquaculture 66.6 70.5 74.4 5.6
Trade value (exports USD billion)
129.2 136.0 141.8 4.2
Trade volume (live weight) 58.1 59.0 59.9 0.3
Total utilization 158.0 161.0 165.2 2.6
Food 136.2 140.9 144.6 2.6
Feed 16.3 16.4 16.6 1.2
Other uses 5.4 3.7 4.0 9.6
SUPPLY AND DEMAND INDICATORS
Per caput food consumption:
Food fish (kg/yr) 19.2 19.7 20.0 1.4
From capture fisheries (kg/year) 9.8 9.8 9.7 -1.5
From aquaculture (kg/year) 9.4 9.8 10.3 4.4
FAO FISH PRICE INDEX 1
(2002-2004=100)2012 2013 2014
Jan-AprChange:
Jan-Apr 2014 over
Jan-Apr 2013 %
144 148 162 13.2
1 Data source: Norwegian Seafood Council
80
105
130
155
180
201320112009200720052003200119991997
FAO total fish price index
Capture totalAquaculture Total
Source: Norwegian Seafood Council (NSC)

MAR
KET
ASSE
SSM
ENTS
MAR
KET
ASSE
SSM
ENTS

11FOOD OUTLOOKMAY 2014
WH
EA
T
Figure 1. Wheat export price (US No. 2 H.W. Gulf) Figure 2. CBOT wheat futures for September
Major Wheat Exporters and Importers
Major ExportersMajor Importers
WHEAT
200
250
300
350
400
2010/11
2013/14
2012/13
2011/12
USD per tonne
JMAMFJDNOSAJ
200
250
300
350
USD per tonne
S O N D J F M A
2013 values 2014 values
PRICES
Wheat prices firmer on weather and political tensions A record wheat crop in 2013 boosted much needed world
supplies and helped push international prices of wheat
sharply below their previous year’s levels. However, by the
third week in February, export prices started to surge on
worries about the impact of prolonged drought in major
growing areas in the United States and escalating tensions
in the Black Sea region. I However, the strong rally in
international prices lost momentum in April as rain brought
some relief and it also became increasingly evident that
shipments from the Black Sea were not being disrupted
by the territorial issues between Ukraine and the Russian
Federation.
Similarly, wheat futures at the Chicago Board of Trade (CBOT) for nearby delivery strengthened in recent
months, reflecting weather and geopolitical concerns.
However, in April, a generally good prospect for global
wheat production in 2014 started to weigh on the
quotations for September delivery and prices averaged

Ma
rke
t a
sse
ssm
en
ts
12 FOOD OUTLOOKMAY 2014
Table 1. World wheat market at a glance
Table 2. Wheat production: leading producers*
2012 2013 estim.
2014f”cast
Change:2014 over
2013
million tonnes %
European Union 132.3 143.2 143.7 0.3
China (Mainland) 120.8 122.2 122.0 -0.2
India 94.9 93.5 96.0 2.7
United States 61.7 58.0 57.0 -1.7
Russian Federation 37.7 52.1 51.0 -2.1
Canada 27.2 37.5 29.3 -21.9
Australia 22.5 27.0 24.8 -8.1
Pakistan 23.5 24.2 25.4 5.0
Turkey 20.1 22.0 19.7 -10.5
Ukraine 15.8 21.5 19.0 -11.6
Iran Islamic Rep. of 13.8 14.0 13.5 -3.6
Kazakhstan 9.8 14.5 14.8 2.1
Argentina 8.2 9.2 10.5 14.1
Egypt 8.8 8.8 9.0 2.3
Uzbekistan 6.7 6.9 6.7 -2.9
Other countries 55.9 60.5 59.3 -2.0
World 659.7 715.1 701.7 -1.9
* Countries listed according to their position in global production (average 2012-2014)
1 Trade refers to exports based on a common July/June marketing season.
2 Major exporters include Argentina, Australia, Canada, EU, Kazakhstan, Russian Fed., Ukraine and the United States.
3 Derived from the International Grains Council (IGC) wheat index.
slightly below last year’s values. Given a good supply
outlook for coarse grains, the prospect for further gains
in prices of lower quality wheat, which can also be used
for animal feed, may be limited. In comparison, the price
of higher quality (protein) wheat, traded at Kansas City Board of Trade (KCBT), is likely to remain firm in view
of tighter supplies (more detailed analysis of the futures
markets can be found in the Market Indicators section of
this report).
PRODUCTION
Global wheat output to decline only slightly in 2014FAO’s latest forecast for 2014 world wheat production
stands at 702 million tonnes, down 13.4 million tonnes
(1.9 percent) from last year’s record harvest, but still
the second largest crop ever. The bulk of the reduction
is expected in Canada, where plantings are forecast to
decrease due to lower domestic prices and yields to return
to average after the record highs achieved in the previous
season.
In the United States, although serious drought persists
in the southern and central major wheat producing
areas, crops are still in early stages of development and
good rains in the growing season could still prevent a
significant reduction in yield. FAO’s latest forecast of
total 2014 wheat output stands at 57 million tonnes. In
the EU, the world’s largest wheat producing area, the
winter wheat crop generally benefitted from unseasonably
warm weather throughout the winter. However, with the
onset of spring, below average rains over most European
countries have stressed vegetation conditions in some
important growing areas, including the Benelux countries,
the northern Balkans, most of Germany and the main
agricultural regions of Central Europe. Good rainfall will
be needed in the affected areas during the remainder of
the growing season to avoid yield loss. Meanwhile, winter
wheat conditions are reported to be good in Spain, Italy
and the southern Balkans, as a result of favourable rainfall.
An aggregate 2014 wheat crop of 143.7 million tonnes is
forecast, similar to last’s year record harvest.
Similarly, in the major producing European CIS states,
higher than normal temperatures and dry weather continue
to reduce soil moisture, resulting in faster than normal
development. In the Russian Federation, the total wheat
area in 2014 is forecast to increase as the spring wheat
plantings are expected to compensate for the shortfall in
winter sowing, following wetter than normal conditions in
September. The country’s wheat output in 2014 is currently
forecast at 51 million tonnes, nearly 2 percent less than
2012/13 2013/14 estim.
2014/15 f’cast
Change: 2014/15
over 2013/14
million tonnes %
WORLD BALANCE
Production 659.7 715.1 701.7 -1.9
Trade1 140.8 150.5 149.5 -0.7
Total utilization 685.6 687.9 699.2 1.6
Food 474.4 480.1 485.4 1.1
Feed 132.1 128.6 133.4 3.7
Other uses 79.0 79.1 80.5 1.8
Ending stocks 156.9 177.5 179.5 1.1
SUPPLY AND DEMAND INDICATORS
Per caput food consumption:
World (kg/yr) 67.1 67.2 67.2 0.0
LIFDC (kg/yr) 46.1 46.1 46.1 0.0
World stock-to-use ratio (%) 22.8 25.4 25.2
Major exporters stock-to-disappearance ratio2 (%)
14.1 15.3 14.2
FAO WHEAT PRICE INDEX3 (2002-2004=100)
2012 2013 2014 Jan-Apr
Change: Jan-Apr 2014
over Jan-Apr 2013
%
204 194 183 -11.7
13FOOD OUTLOOKMAY 2014
WH
EA
T
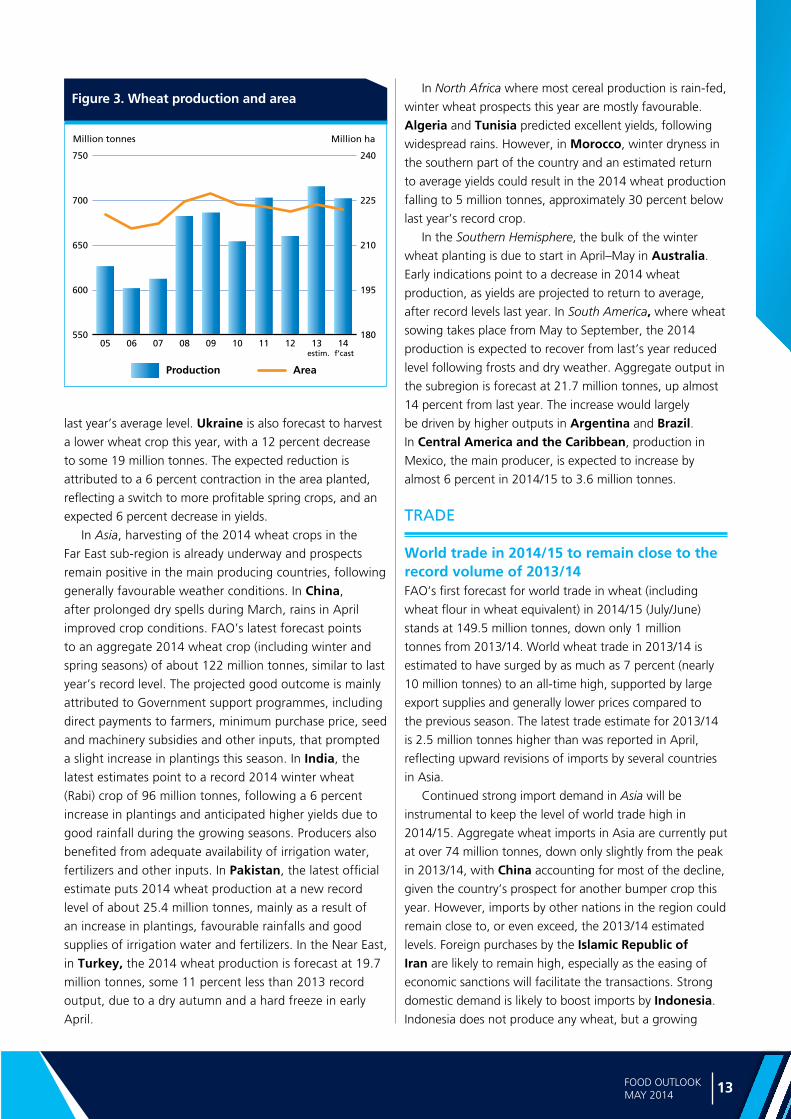
Figure 3. Wheat production and area
550
600
650
700
750
14131211100908070605180
195
210
225
240
Million tonnes Million ha
Production Area
estim. f’cast
last year’s average level. Ukraine is also forecast to harvest
a lower wheat crop this year, with a 12 percent decrease
to some 19 million tonnes. The expected reduction is
attributed to a 6 percent contraction in the area planted,
reflecting a switch to more profitable spring crops, and an
expected 6 percent decrease in yields.
In Asia, harvesting of the 2014 wheat crops in the
Far East sub-region is already underway and prospects
remain positive in the main producing countries, following
generally favourable weather conditions. In China,
after prolonged dry spells during March, rains in April
improved crop conditions. FAO’s latest forecast points
to an aggregate 2014 wheat crop (including winter and
spring seasons) of about 122 million tonnes, similar to last
year’s record level. The projected good outcome is mainly
attributed to Government support programmes, including
direct payments to farmers, minimum purchase price, seed
and machinery subsidies and other inputs, that prompted
a slight increase in plantings this season. In India, the
latest estimates point to a record 2014 winter wheat
(Rabi) crop of 96 million tonnes, following a 6 percent
increase in plantings and anticipated higher yields due to
good rainfall during the growing seasons. Producers also
benefited from adequate availability of irrigation water,
fertilizers and other inputs. In Pakistan, the latest official
estimate puts 2014 wheat production at a new record
level of about 25.4 million tonnes, mainly as a result of
an increase in plantings, favourable rainfalls and good
supplies of irrigation water and fertilizers. In the Near East,
in Turkey, the 2014 wheat production is forecast at 19.7
million tonnes, some 11 percent less than 2013 record
output, due to a dry autumn and a hard freeze in early
April.
In North Africa where most cereal production is rain-fed,
winter wheat prospects this year are mostly favourable.
Algeria and Tunisia predicted excellent yields, following
widespread rains. However, in Morocco, winter dryness in
the southern part of the country and an estimated return
to average yields could result in the 2014 wheat production
falling to 5 million tonnes, approximately 30 percent below
last year’s record crop.
In the Southern Hemisphere, the bulk of the winter
wheat planting is due to start in April–May in Australia.
Early indications point to a decrease in 2014 wheat
production, as yields are projected to return to average,
after record levels last year. In South America, where wheat
sowing takes place from May to September, the 2014
production is expected to recover from last’s year reduced
level following frosts and dry weather. Aggregate output in
the subregion is forecast at 21.7 million tonnes, up almost
14 percent from last year. The increase would largely
be driven by higher outputs in Argentina and Brazil. In Central America and the Caribbean, production in
Mexico, the main producer, is expected to increase by
almost 6 percent in 2014/15 to 3.6 million tonnes.
TRADE
World trade in 2014/15 to remain close to the record volume of 2013/14 FAO’s first forecast for world trade in wheat (including
wheat flour in wheat equivalent) in 2014/15 (July/June)
stands at 149.5 million tonnes, down only 1 million
tonnes from 2013/14. World wheat trade in 2013/14 is
estimated to have surged by as much as 7 percent (nearly
10 million tonnes) to an all-time high, supported by large
export supplies and generally lower prices compared to
the previous season. The latest trade estimate for 2013/14
is 2.5 million tonnes higher than was reported in April,
reflecting upward revisions of imports by several countries
in Asia.
Continued strong import demand in Asia will be
instrumental to keep the level of world trade high in
2014/15. Aggregate wheat imports in Asia are currently put
at over 74 million tonnes, down only slightly from the peak
in 2013/14, with China accounting for most of the decline,
given the country’s prospect for another bumper crop this
year. However, imports by other nations in the region could
remain close to, or even exceed, the 2013/14 estimated
levels. Foreign purchases by the Islamic Republic of Iran are likely to remain high, especially as the easing of
economic sanctions will facilitate the transactions. Strong
domestic demand is likely to boost imports by Indonesia.
Indonesia does not produce any wheat, but a growing
Ma
rke
t a
sse
ssm
en
ts
14 FOOD OUTLOOKMAY 2014
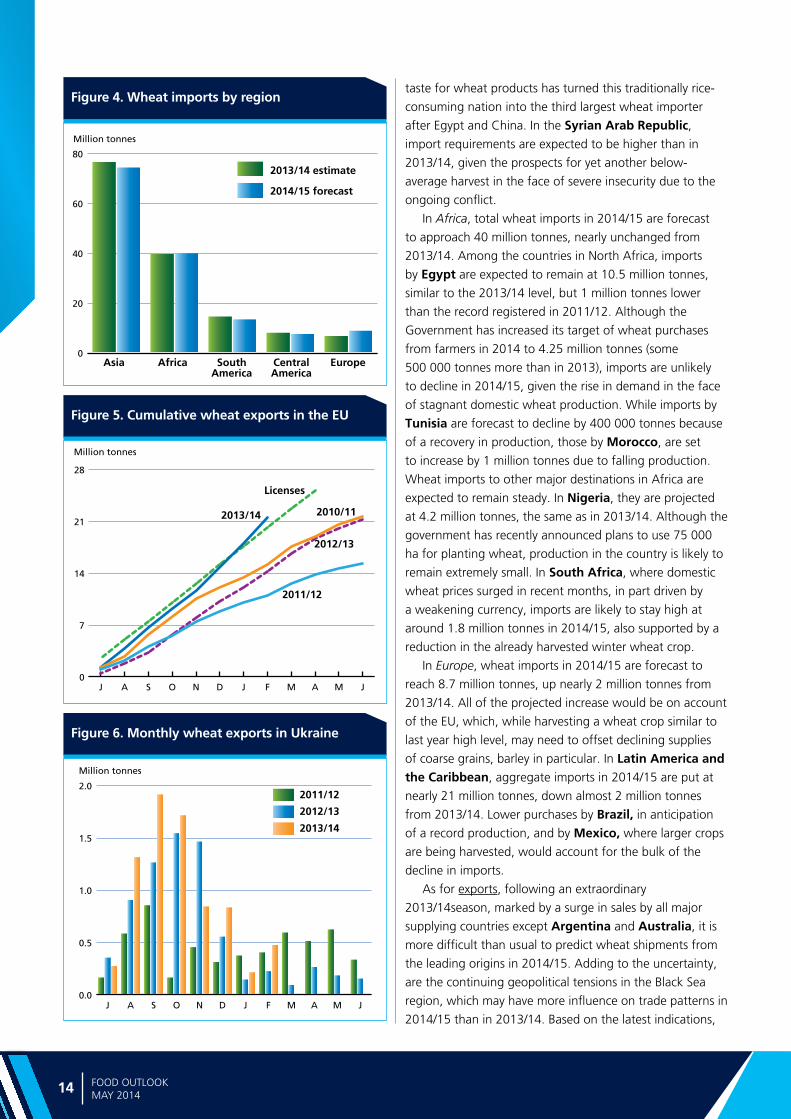
Figure 4. Wheat imports by region
Figure 5. Cumulative wheat exports in the EU
0
20
40
60
80
2013/14 estimate
2014/15 forecast
Million tonnes
Asia Africa EuropeSouthAmerica
CentralAmerica
Figure 6. Monthly wheat exports in Ukraine
0
7
14
21
28
JMAMFJDNOSAJ
2010/112013/14
Licenses
2012/13
2011/12
Million tonnes
0.0
0.5
1.0
1.5
2.0
JMAMFJDNOSAJ
2011/12
2012/13
2013/14
Million tonnes
taste for wheat products has turned this traditionally rice-
consuming nation into the third largest wheat importer
after Egypt and China. In the Syrian Arab Republic,
import requirements are expected to be higher than in
2013/14, given the prospects for yet another below-
average harvest in the face of severe insecurity due to the
ongoing conflict.
In Africa, total wheat imports in 2014/15 are forecast
to approach 40 million tonnes, nearly unchanged from
2013/14. Among the countries in North Africa, imports
by Egypt are expected to remain at 10.5 million tonnes,
similar to the 2013/14 level, but 1 million tonnes lower
than the record registered in 2011/12. Although the
Government has increased its target of wheat purchases
from farmers in 2014 to 4.25 million tonnes (some
500 000 tonnes more than in 2013), imports are unlikely
to decline in 2014/15, given the rise in demand in the face
of stagnant domestic wheat production. While imports by
Tunisia are forecast to decline by 400 000 tonnes because
of a recovery in production, those by Morocco, are set
to increase by 1 million tonnes due to falling production.
Wheat imports to other major destinations in Africa are
expected to remain steady. In Nigeria, they are projected
at 4.2 million tonnes, the same as in 2013/14. Although the
government has recently announced plans to use 75 000
ha for planting wheat, production in the country is likely to
remain extremely small. In South Africa, where domestic
wheat prices surged in recent months, in part driven by
a weakening currency, imports are likely to stay high at
around 1.8 million tonnes in 2014/15, also supported by a
reduction in the already harvested winter wheat crop.
In Europe, wheat imports in 2014/15 are forecast to
reach 8.7 million tonnes, up nearly 2 million tonnes from
2013/14. All of the projected increase would be on account
of the EU, which, while harvesting a wheat crop similar to
last year high level, may need to offset declining supplies
of coarse grains, barley in particular. In Latin America and the Caribbean, aggregate imports in 2014/15 are put at
nearly 21 million tonnes, down almost 2 million tonnes
from 2013/14. Lower purchases by Brazil, in anticipation
of a record production, and by Mexico, where larger crops
are being harvested, would account for the bulk of the
decline in imports.
As for exports, following an extraordinary
2013/14season, marked by a surge in sales by all major
supplying countries except Argentina and Australia, it is
more difficult than usual to predict wheat shipments from
the leading origins in 2014/15. Adding to the uncertainty,
are the continuing geopolitical tensions in the Black Sea
region, which may have more influence on trade patterns in
2014/15 than in 2013/14. Based on the latest indications,
15FOOD OUTLOOKMAY 2014
WH
EA
T
Figure 7. Wheat stocks and ratios
0
100
200
300
2014/152013/142012/132011/122010/110
10
20
30
Million tonnes Percent
Major Exporters Rest of the World
World Stock-to-use ratioStock-to-disappearance ratio of Major Exporters
estim. f’cast
wheat shipments in 2014/15 from the EU could fall by
3.5 million tonnes compared to 2013/14, offsetting larger
projected sales from Argentina and Australia. Wheat
exports by the EU are estimated at a record high level of 29
million tonnes in 2013/14, some 34 percent higher than in
the previous season. In Canada, despite an anticipated fall
in production this year, exports are likely to remain at the
same level as in 2013/14, as supplies would still be ample
because of large carryover stocks. Favourable production
outlook in Kazakhstan is likely to keep wheat exports from
this CIS country at around the same level as in 2013/14.
Wheat shipments from Ukraine could also remain close to
the current season’s levels, especially if imports by the EU
were to increase in 2014/15, as currently projected. A small
reduction in exports is possible in the Russian Federation, but shipments from the United States are foreseen similar
to the 2013/14 level, supported by large sales to Brazil.
Wheat shipments from the United States to Brazil soared
to a 30-year high in 2013, following a collapse of exports
by Argentina, Brazil’s traditional supplier. Elsewhere, India
is likely to have large supplies for exports, given this year’s
expectation of a record wheat crop, but sales from Turkey
could decline on sharply reduced domestic production.
UTILIZATION
Wheat utilization to increase for the first time since 2011/12World wheat utilization in 2014/15 is forecast to reach
699 million tonnes, 1.6 percent larger than in 2013/14.
This would represent the first significant growth since
2011/12, as wheat utilization contracted sharply in 2012/13
and is estimated to have remained steady in 2013/14.
Total wheat use for direct human consumption is
forecast to reach 485 million tonnes, up 1 percent from
2013/14. At this level, world wheat consumption, on a
per capita basis, would remain steady, at just over 67 kg
per annum. Developing countries account for the bulk of
the wheat used for food, consuming 350 million tonnes,
up 1.3 percent from 2013/14, which would result in a
stable annual per capita consumption level of 60 kg. Food
use of wheat in the developed countries, as a group, is
expected to reach 135 million tonnes, marginally above
the estimated level for 2013/14, but again sufficient to
maintain a steady per capita consumption of around 96
kg. Among the world’s most populated countries, China
is projected to keep food per capita consumption stable at
nearly 64 kg, while in India it could increase slightly to 61.5
kg, reflecting larger domestic supplies.
Total feed use of wheat in 2014/15 is forecast to reach
133.5 million tonnes, some 3.7 percent higher than in
2013/14, when it contracted by 2.6 percent because of the
recovery in supplies of coarse grains. The projected increase
in wheat feed use in 2014/15 mainly reflects the outlook
in the EU, traditionally the largest market for feed wheat.
Total feed use of wheat in the EU is forecast at 50 million
tonnes, 8 percent higher than in 2013/14. In China, wheat
feed use is forecast to reach 19 million tonnes in 2014/15,
up 6 percent from 2013/14, but well below the 28 million
tonnes peaks achieved in 2011/12. In the United States,
feed use of wheat is expected to remain steady at around
6 million tonnes, given a generally favourable outlook for
maize supplies.
STOCKS
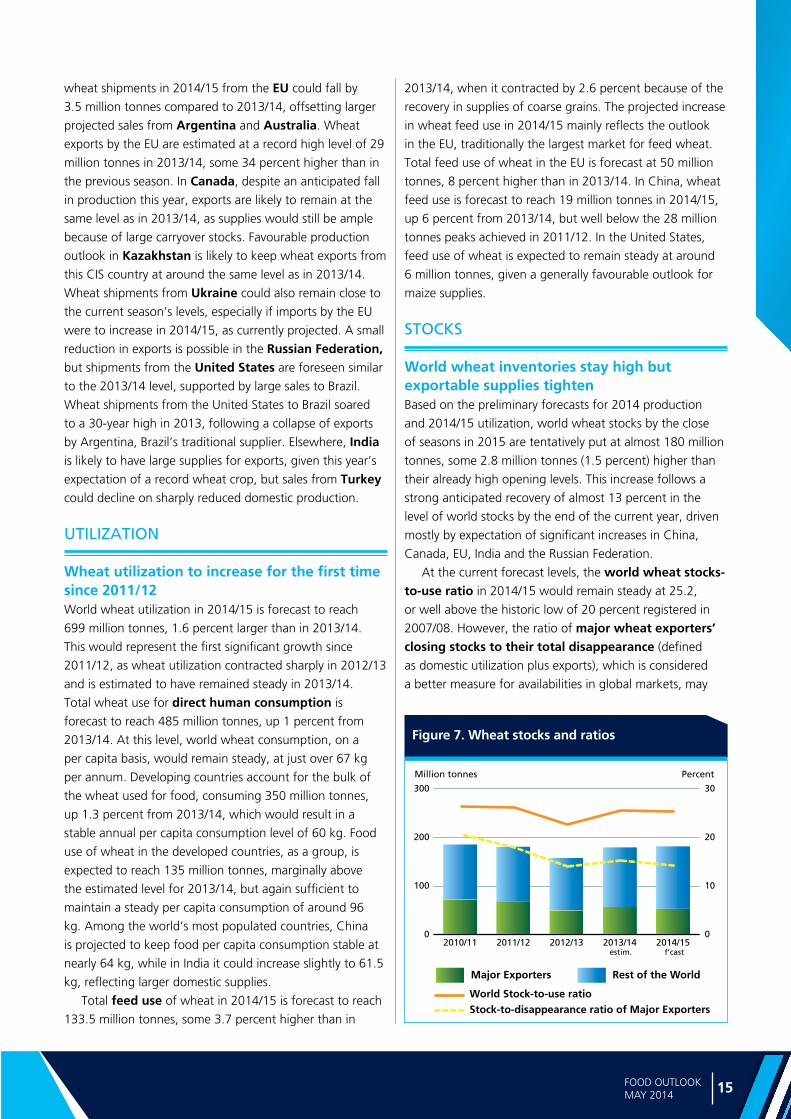
World wheat inventories stay high but exportable supplies tighten Based on the preliminary forecasts for 2014 production
and 2014/15 utilization, world wheat stocks by the close
of seasons in 2015 are tentatively put at almost 180 million
tonnes, some 2.8 million tonnes (1.5 percent) higher than
their already high opening levels. This increase follows a
strong anticipated recovery of almost 13 percent in the
level of world stocks by the end of the current year, driven
mostly by expectation of significant increases in China,
Canada, EU, India and the Russian Federation.
At the current forecast levels, the world wheat stocks-to-use ratio in 2014/15 would remain steady at 25.2,
or well above the historic low of 20 percent registered in
2007/08. However, the ratio of major wheat exporters’ closing stocks to their total disappearance (defined
as domestic utilization plus exports), which is considered
a better measure for availabilities in global markets, may

Ma
rke
t a
sse
ssm
en
ts
16 FOOD OUTLOOKMAY 2014
decline from 15.3 percent in 2013/14 to 14.2 percent in
2014/15. The projected lower ratio for 2014/15, which is
close to the 14.1 percent registered in 2012/13, points to
a tightening of wheat supplies. This may become an issue
if world demand proves higher than currently projected.
Among the major exporters, the biggest declines in
inventories are forecast for Canada and Ukraine, while
Argentina and the Russian Federation are likely to end the
new season with increases. Elsewhere, wheat stocks are set
to accumulate in India, boosted by the anticipated record
crop this year, and China, given the expectation of another
above-average wheat harvest in 2014.
17FOOD OUTLOOKMAY 2014
CO
AR
SE G
RA
INS
Figure 2. CBOT maize futures for DecemberFigure 1. Maize export price (US No. 2 yellow, Gulf)
Major Coarse Grain Exporters and Importers
Major ExportersMajor Importers
150
200
250
300
350
2010/11
2013/14
2012/13
2011/12
USD per tonne
JMAMFJDNOSAJ
150
175
200
225
250
USD per tonne
D J F M A
2013 values 2014 values
2014 nearby values
COARSE GRAINS
largely driven by the rebound in maize output in the United
States, the world’s largest maize producer and exporter,
has been the main factor behind the easing of the market.
Export prices of other coarse grains also remained below
last year’s levels, including feed barley and sorghum, which,
as of April, were at least 10 percent below April 2013. In
recent weeks, spill over from rising wheat quotations and
geopolitical tensions in the Black Sea provided support.
However, the increase in international prices of maize has
not been as significant as that of wheat, partly due to
China’s series of import cancelations, following the finding
PRICES
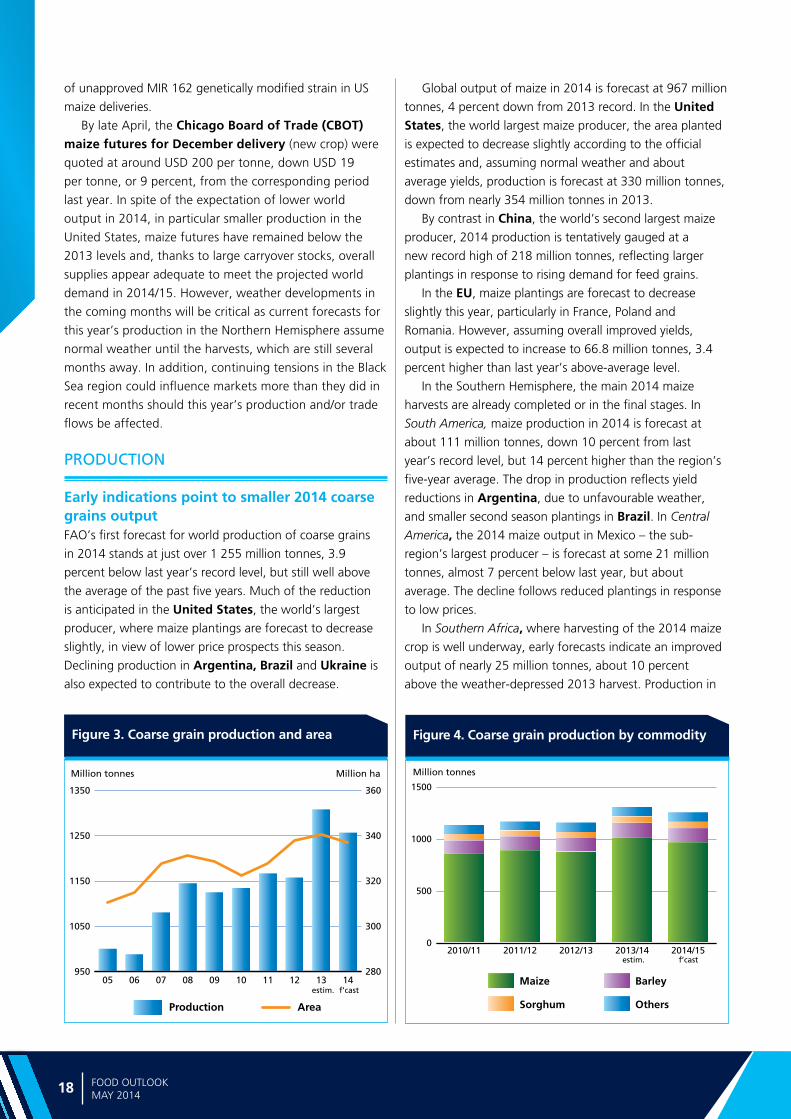
Large maize supplies drive down international pricesIn spite of recent strong gains in international prices
of major coarse grains, generally large supplies have
kept prices well below the previous season’s levels. The
benchmark US maize price (yellow, No. 2, f.o.b.) averaged USD 224 per tonne in April, down 21 percent
from April 2013 but up 13 percent since the start of this
year. A strong recovery in global production in 2013,
Ma
rke
t a
sse
ssm
en
ts
18 FOOD OUTLOOKMAY 2014
Figure 3. Coarse grain production and area Figure 4. Coarse grain production by commodity
950
1050
1150
1250
1350
14131211100908070605280
300
320
340
360
Million tonnes Million ha
Production Area
estim. f’cast
0
500
1000
1500
2014/152013/142012/132011/122010/11
Million tonnes
Maize
Sorghum
Barley
Others
estim. f’cast
of unapproved MIR 162 genetically modified strain in US
maize deliveries.
By late April, the Chicago Board of Trade (CBOT) maize futures for December delivery (new crop) were
quoted at around USD 200 per tonne, down USD 19
per tonne, or 9 percent, from the corresponding period
last year. In spite of the expectation of lower world
output in 2014, in particular smaller production in the
United States, maize futures have remained below the
2013 levels and, thanks to large carryover stocks, overall
supplies appear adequate to meet the projected world
demand in 2014/15. However, weather developments in
the coming months will be critical as current forecasts for
this year’s production in the Northern Hemisphere assume
normal weather until the harvests, which are still several
months away. In addition, continuing tensions in the Black
Sea region could influence markets more than they did in
recent months should this year’s production and/or trade
flows be affected.
PRODUCTION
Early indications point to smaller 2014 coarse grains outputFAO’s first forecast for world production of coarse grains
in 2014 stands at just over 1 255 million tonnes, 3.9
percent below last year’s record level, but still well above
the average of the past five years. Much of the reduction
is anticipated in the United States, the world’s largest
producer, where maize plantings are forecast to decrease
slightly, in view of lower price prospects this season.
Declining production in Argentina, Brazil and Ukraine is
also expected to contribute to the overall decrease.
Global output of maize in 2014 is forecast at 967 million
tonnes, 4 percent down from 2013 record. In the United States, the world largest maize producer, the area planted
is expected to decrease slightly according to the official
estimates and, assuming normal weather and about
average yields, production is forecast at 330 million tonnes,
down from nearly 354 million tonnes in 2013.
By contrast in China, the world’s second largest maize
producer, 2014 production is tentatively gauged at a
new record high of 218 million tonnes, reflecting larger
plantings in response to rising demand for feed grains.
In the EU, maize plantings are forecast to decrease
slightly this year, particularly in France, Poland and
Romania. However, assuming overall improved yields,
output is expected to increase to 66.8 million tonnes, 3.4
percent higher than last year’s above-average level.
In the Southern Hemisphere, the main 2014 maize
harvests are already completed or in the final stages. In
South America, maize production in 2014 is forecast at
about 111 million tonnes, down 10 percent from last
year’s record level, but 14 percent higher than the region’s
five-year average. The drop in production reflects yield
reductions in Argentina, due to unfavourable weather,
and smaller second season plantings in Brazil. In Central
America, the 2014 maize output in Mexico – the sub-
region’s largest producer – is forecast at some 21 million
tonnes, almost 7 percent below last year, but about
average. The decline follows reduced plantings in response
to low prices.
In Southern Africa, where harvesting of the 2014 maize
crop is well underway, early forecasts indicate an improved
output of nearly 25 million tonnes, about 10 percent
above the weather-depressed 2013 harvest. Production in

19FOOD OUTLOOKMAY 2014
CO
AR
SE G
RA
INS
Table 1. World coarse grain market at a glance
Table 2. Coarse grain production: leading producers*
* Countries listed according to their position in global production (average 2012-2014)
1 Trade refers to exports based on a common July/June marketing season.
2 Major exporters include Argentina, Australia, Brazil, Canada, EU, Russian Fed., Ukraine and the United States.
South Africa, the sub-region major producer and exporter.
Current forecasts indicate an aggregate maize crop of 13.6
million tonnes, nearly 10 percent higher than in 2013.
Planting of the 2014 spring season maize crop is
underway in Ukraine. Prospects are uncertain due to
increased production costs, following the depreciation of
the national currency and current political crisis, coupled
with below average precipitation in recent months. More
rains are needed to avoid reductions in the area and yields
of early planted crops.
World output of barley in 2014 is forecast at about
136 million tonnes, 6.4 percent lower than the 2013
record level. Smaller crops are expected in almost all the
major barley producing countries, particularly in European
countries, Canada, Turkey and Australia.
World sorghum output in 2014 is expected to remain
virtually unchanged from last year’s good level, at
60.5 million tonnes. Production is forecast to decrease
in the United States and Mexico, but to increase
significantly in India.
TRADE
World trade in coarse grains could decline in 2014/15Following a 10 percent surge in 2013/14, FAO’s first
forecast for world trade in coarse grains in 2014/15 (July/
June) stands at 142 million tonnes, down 3 percent (4
million tonnes) from the 2013/14 record level. While trade
in maize and barley could decline slightly, world trade
in sorghum and other coarse grains (including oats, rye
and millet) in 2014/15 is anticipated to remain similar to
2013/14.
The anticipated decrease would be mainly on account
of lower volume of maize trade, which is forecast to
reach 110 million tonnes, 3 million tonnes below the
record in 2013/14. The contraction is mostly caused
by a fall in maize imports in Europe, from 12 million
tonnes in 2013/14 to 7 million tonnes in 2014/15. The
reduction is consistent with EU’s prospects for higher
maize production and large supplies of wheat from
the new season. On the other hand, maize imports to
other destinations are likely to remain close to the peaks
estimated for 2013/14, given the expectation of strong
feed demand in major markets. In Asia, total maize
imports are forecast to reach nearly 57 million tonnes,
slightly higher than in 2013/14. Maize purchases by China
(Mainland) are put at about the same high level as in
2013/14 in spite of the anticipated record production this
year. Indeed, high domestic prices are likely to encourage
large imports of nearly 6 million tonnes again in 2014/15.
2012/13 2013/14 estim.
2014/15 f’cast
Change: 2014/15
over 2013/14
million tonnes %
WORLD BALANCE
Production 1 156.4 1 306.7 1 255.4 -3.9
Trade1 132.2 146.0 142.0 -2.7
Total utilization 1 163.4 1 242.4 1 264.2 1.8
Food 198.4 201.7 205.7 2.0
Feed 656.6 715.6 735.2 2.7
Other uses 308.4 325.1 323.4 -0.5
Ending stocks 171.0 215.5 206.3 -4.3
SUPPLY AND DEMAND INDICATORS
Per caput food consumption:
World (kg/yr) 28.1 28.2 28.5 1.1
LIFDC (kg/yr) 39.7 39.8 40.2 1.0
World stock-to-use ratio (%) 13.8 17.0 16.2
Major exporters stock-to-disappearance ratio2 (%)
8.4 12.1 12.0
FAO COARSE GRAIN PRICE INDEX (2002-2004=100)
2012 2013 2014 Jan-Apr
Change: Jan-Apr 2014
over Jan-Apr 2013
%
283 246 202 -28.7
2012 2013 estim.
2014f”cast
Change:2014 over
2013
million tonnes %
United States 286.3 369.8 344.1 -6.9
China (Mainland) 214.6 227.2 227.2 0.0
European Union 143.9 159.2 157.5 -1.1
Brazil 74.1 83.5 76.7 -8.1
India 41.6 41.1 40.4 -1.7
Ukraine 29.9 40.2 36.0 -10.4
Argentina 31.2 37.8 33.6 -11.1
Russian Federation 29.6 35.8 34.2 -4.5
Mexico 30.2 30.8 29.1 -5.5
Canada 24.5 28.8 24.9 -13.5
Indonesia 19.4 18.5 19.1 3.2
Ethiopia 17.4 19.5 19.5 0.0
Nigeria 14.8 18.5 18.4 -0.5
South Africa 13.3 12.9 14.1 9.3
Turkey 12.4 14.5 12.0 -17.2
Other countries 173.2 168.6 168.6 0.0
World 1 156.4 1 306.7 1 255.4 -3.9
Ma
rke
t a
sse
ssm
en
ts
20 FOOD OUTLOOKMAY 2014
Figure 5. Coarse grain imports by region
0
20
40
60
80
2013/14 estimate
2014/15 forecast
Million tonnes
Asia Africa EuropeSouthAmerica
CentralAmerica
Figure 6. Major coarse grain exporters
0 10 20 30 40
2013/14 estimate 2014/15 forecast
Million tonnes
UnitedStates
EU
Canada
Brazil
Ukraine
Argentina
Australia
RussianFederation
Figure 7. Monthly maize exports in Ukraine
0
1
2
3
4
5
JMAMFJDNOSAJ
2011/12 2012/13 2013/14
Million tonnes
As a result of increasing domestic demand from the
animal feed and industrial sectors, China, which was a net
maize exporter until the start of this decade, has become
a major net maize importer since 2010/11 Maize imports
by Japan – which does not produce any maize of its own
and is the world’s largest maize importer – are forecast to
remain steady at 15.6 million tonnes. However, purchases
by the Republic of Korea may increase by 500 000
tonnes to 9.5 million tonnes, underpinned by lower
expected world prices in the new season.
Total maize imports in Africa could reach 17 million
tonnes in 2014/15, around 300 000 tonnes more than in
2013/14, with most of the anticipated increase in Egypt and Morocco, more than offsetting some declines in
imports by Kenya and Zimbabwe. In Latin America and
the Caribbean, maize imports by Mexico, the world’s
largest importer after Japan, could reach 11 million tonnes,
500 000 tonnes more than the estimated in 2013/14 on
expectation of a slight decline in this year’s production after
last year’s record harvest.
World barley trade (excluding malt) in 2014/15 is
put at 20 million tonnes, down 1 million tonnes from
the estimated trade in 2013/14. Most of the anticipated
decline is expected in Asia, where total imports could
fall by 700 000 tonnes to 16 million tonnes. Imports by
Saudi Arabia, the world’s largest barley importer, may
decline by 500 000 tonnes to 8.5 million tonnes in 2014/15
on large carryover stocks from this season. Also in Africa,
barley imports could decline slightly, to 1.6 tonnes, as lower
deliveries to Algeria and Tunisia more than offset larger
imports by Morocco, where production is expected to
plunge by 37 percent.
Global trade in sorghum is forecast at 7.5 million
tonnes in 2014/15, unchanged from 2013/14. Total
imports into Asia are predicted to reach 4 million tonnes,
up 150 000 tonnes from 2013/14, with China (Mainland)
accounting for most of the increase, purchasing as much
as 2.2 million tonnes of sorghum from world markets, a
record. In addition to lower prices of sorghum compared
with maize in international markets, China’s increased
import demand for sorghum in recent years is also due
to the fact that unlike wheat and maize, sorghum is
not subject to limits under tariff-rate quotas (TRQs). At
the current forecast level, China will surpass Mexico,
traditionally the largest sorghum importer. Purchases by
Mexico are forecast to reach 1 million tonnes in 2014/15,
300 000 tonnes higher than in 2013/14, but well below the
2 million to 3 million tonnes imported annually in the past.
The increase in domestic sorghum production and higher
imports of maize are among the main reasons for the
declining trend in sorghum imports by Mexico.
21FOOD OUTLOOKMAY 2014
CO
AR
SE G
RA
INS
2006/07 2007/08 2008/09 2009/10 2010/11 2011/12 2012/13
estim.
2013/14*
(f’cast)
Thousand tonnes
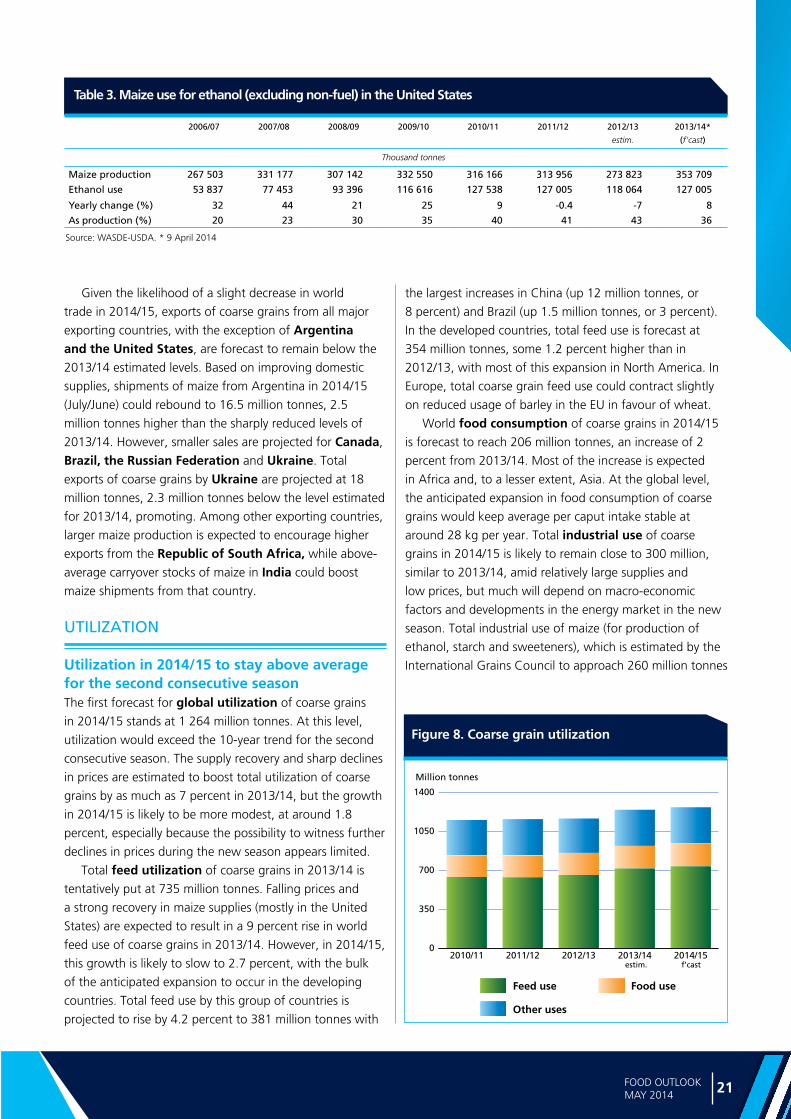
Maize production 267 503 331 177 307 142 332 550 316 166 313 956 273 823 353 709
Ethanol use 53 837 77 453 93 396 116 616 127 538 127 005 118 064 127 005
Yearly change (%) 32 44 21 25 9 -0.4 -7 8
As production (%) 20 23 30 35 40 41 43 36
Table 3. Maize use for ethanol (excluding non-fuel) in the United States
Source: WASDE-USDA. * 9 April 2014
Given the likelihood of a slight decrease in world
trade in 2014/15, exports of coarse grains from all major
exporting countries, with the exception of Argentina and the United States, are forecast to remain below the
2013/14 estimated levels. Based on improving domestic
supplies, shipments of maize from Argentina in 2014/15
(July/June) could rebound to 16.5 million tonnes, 2.5
million tonnes higher than the sharply reduced levels of
2013/14. However, smaller sales are projected for Canada,
Brazil, the Russian Federation and Ukraine. Total
exports of coarse grains by Ukraine are projected at 18
million tonnes, 2.3 million tonnes below the level estimated
for 2013/14, promoting. Among other exporting countries,
larger maize production is expected to encourage higher
exports from the Republic of South Africa, while above-
average carryover stocks of maize in India could boost
maize shipments from that country.
UTILIZATION
Utilization in 2014/15 to stay above average for the second consecutive season The first forecast for global utilization of coarse grains
in 2014/15 stands at 1 264 million tonnes. At this level,
utilization would exceed the 10-year trend for the second
consecutive season. The supply recovery and sharp declines
in prices are estimated to boost total utilization of coarse
grains by as much as 7 percent in 2013/14, but the growth
in 2014/15 is likely to be more modest, at around 1.8
percent, especially because the possibility to witness further
declines in prices during the new season appears limited.
Total feed utilization of coarse grains in 2013/14 is
tentatively put at 735 million tonnes. Falling prices and
a strong recovery in maize supplies (mostly in the United
States) are expected to result in a 9 percent rise in world
feed use of coarse grains in 2013/14. However, in 2014/15,
this growth is likely to slow to 2.7 percent, with the bulk
of the anticipated expansion to occur in the developing
countries. Total feed use by this group of countries is
projected to rise by 4.2 percent to 381 million tonnes with
the largest increases in China (up 12 million tonnes, or
8 percent) and Brazil (up 1.5 million tonnes, or 3 percent).
In the developed countries, total feed use is forecast at
354 million tonnes, some 1.2 percent higher than in
2012/13, with most of this expansion in North America. In
Europe, total coarse grain feed use could contract slightly
on reduced usage of barley in the EU in favour of wheat.
World food consumption of coarse grains in 2014/15
is forecast to reach 206 million tonnes, an increase of 2
percent from 2013/14. Most of the increase is expected
in Africa and, to a lesser extent, Asia. At the global level,
the anticipated expansion in food consumption of coarse
grains would keep average per caput intake stable at
around 28 kg per year. Total industrial use of coarse
grains in 2014/15 is likely to remain close to 300 million,
similar to 2013/14, amid relatively large supplies and
low prices, but much will depend on macro-economic
factors and developments in the energy market in the new
season. Total industrial use of maize (for production of
ethanol, starch and sweeteners), which is estimated by the
International Grains Council to approach 260 million tonnes
Figure 8. Coarse grain utilization
0
350
700
1050
1400
2014/152013/142012/132011/122010/11
Million tonnes
Feed use
Other uses
Food use
estim. f’cast

Ma
rke
t a
sse
ssm
en
ts
22 FOOD OUTLOOKMAY 2014
Figure 9. Coarse grain stocks and ratios
0
100
200
300
2014/152013/142012/132011/122010/115
10
15
20
Million tonnes Percent
Major Exporters Rest of the World
World Stock-to-use ratioStock-to-disappearance ratio of Major Exporters
estim. f’cast
in 2013/14, could increase slightly in 2014/15, underpinned
by increased starch production in China. However, the
use of maize for production of fuel ethanol (mostly in the
United States) is likely to remain steady.
STOCKS
World stocks to decline but export supplies remain adequateBased on the preliminary forecast for world production in
2014 and utilization in 2014/15, world inventories of coarse
grains by the close of crop seasons in 2015 are projected
at 206 million tonnes, some 4 percent (9 million tonnes)
below their opening levels. Among the major coarse grains,
maize stocks could decline to 162 million tonnes, down 4
percent from 2014, while barley inventories are expected to
approach 28 million tonnes, down 1.4 percent.
Most of the decrease in world reserves in 2015 is
likely to occur in China and the United States. In China,
coarse grains inventories could fall to 62 million tonnes,
down 6 million tonnes from their relatively high opening
levels. Strong growth in domestic utilization would be the
primary reason for this anticipated decline, as production
is expected to reach an all-time high, up slightly from last
year’s record. In the United States, a likely reduction in
domestic maize production and higher utilization could trim
stocks by about 3 million tonnes, to 33 million tonnes.
Given the projected decline in world inventories, the
world stock-to-use ratio is estimated to fall to 16.2
percent in 2014/15, down 1 percent from 2013/14 but
still above the historical low of 13.8 percent registered
in 2012/13. However, the major exporters’ stock-to-disappearance ratio (i.e. domestic consumption
plus exports) is foreseen to remain steady at around 12
percent.
23FOOD OUTLOOKMAY 2014
RIC
E
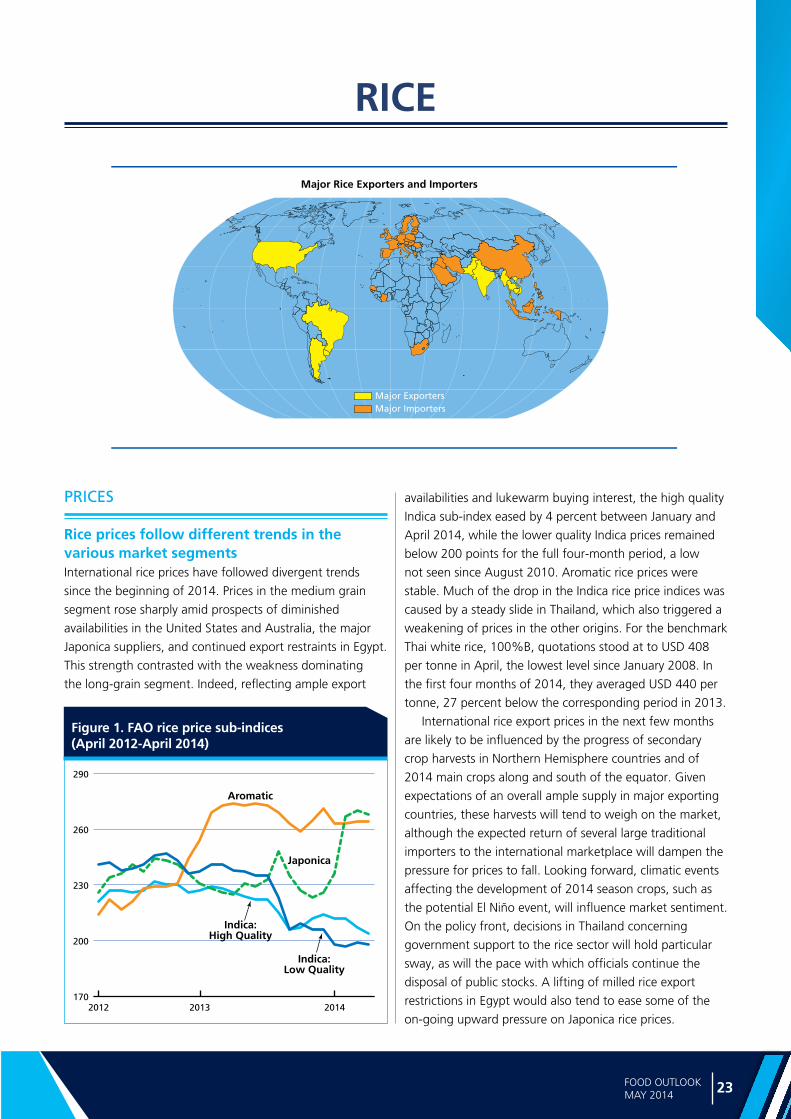
Figure 1. FAO rice price sub-indices (April 2012-April 2014)
170
200
230
260
290
201420132012
Indica:Low Quality
Indica:High Quality
Japonica
Aromatic
Major Rice Exporters and Importers
Major ExportersMajor Importers
RICE
PRICES
Rice prices follow different trends in the various market segmentsInternational rice prices have followed divergent trends
since the beginning of 2014. Prices in the medium grain
segment rose sharply amid prospects of diminished
availabilities in the United States and Australia, the major
Japonica suppliers, and continued export restraints in Egypt.
This strength contrasted with the weakness dominating
the long-grain segment. Indeed, reflecting ample export
availabilities and lukewarm buying interest, the high quality
Indica sub-index eased by 4 percent between January and
April 2014, while the lower quality Indica prices remained
below 200 points for the full four-month period, a low
not seen since August 2010. Aromatic rice prices were
stable. Much of the drop in the Indica rice price indices was
caused by a steady slide in Thailand, which also triggered a
weakening of prices in the other origins. For the benchmark
Thai white rice, 100%B, quotations stood at to USD 408
per tonne in April, the lowest level since January 2008. In
the first four months of 2014, they averaged USD 440 per
tonne, 27 percent below the corresponding period in 2013.
International rice export prices in the next few months
are likely to be influenced by the progress of secondary
crop harvests in Northern Hemisphere countries and of
2014 main crops along and south of the equator. Given
expectations of an overall ample supply in major exporting
countries, these harvests will tend to weigh on the market,
although the expected return of several large traditional
importers to the international marketplace will dampen the
pressure for prices to fall. Looking forward, climatic events
affecting the development of 2014 season crops, such as
the potential El Niño event, will influence market sentiment.
On the policy front, decisions in Thailand concerning
government support to the rice sector will hold particular
sway, as will the pace with which officials continue the
disposal of public stocks. A lifting of milled rice export
restrictions in Egypt would also tend to ease some of the
on-going upward pressure on Japonica rice prices.

Ma
rke
t a
sse
ssm
en
ts
24 FOOD OUTLOOKMAY 2014
Figure 2. Global rice paddy production and area
550
600
650
700
750
800
14131211100908070605145
150
155
160
165
170
Million tonnes Million ha
Production Area
estim. f’cast
PRODUCTION1
Rice production growth to remain subdued in 2014 under a looming El NiñoAt this time of the year, the 2014 rice season is already
quite advanced south and along the equator, where
several countries have already harvested their main crops.
In the Northern Hemisphere, where some 87 percent of
world rice is produced, the season is just beginning with
crops still at the planting stage. Based on the current FAO
forecast, world rice production in 2014 could reach 501.1
million tonnes, only 4 million tonnes, or 0.8 percent, above
the 2013 level and about 500 000 tonnes more than
predicted last month. If confirmed, this would be the third
consecutive season of subdued growth, with part of the
expected slowdown resting on expectations of a mild El
Niño recurring as of mid-2014, a critical period for world
rice crop development. In Asia, the rice hub, El Niño is
normally associated with drought, which may have negative
impacts on yields and also foster a shift of dry season rice
cultivation towards less water demanding crops.
Production in Asia is now forecast at 453.2 million
tonnes in 2014, only 0.5 percent more than last season.
The slow pace of growth anticipated for the region not
only reflects the possible effects of climatic setbacks, but
also of less favourable price incentives. The increase for
the region would be mostly led by a recovery in China
which, in 2013, was affected by dry conditions and
then by storms. This year, the government reiterated its
strong assistance to the food grain sector, in particular
1 All figures quoted correspond to rice expressed on a milled weight basis
wheat and rice. Accordingly, paddy support prices for
the 2014 season were again raised, but far less than
in the previous years. Nonetheless, at an equivalent of
USD 440–504 per tonne, China’s support prices for
paddy rice in 2014 remain very high under international
standards. Production in India is anticipated to rise by
1 percent this year, to a new record, although the final
outcome of the season will depend on the pattern of
monsoon rains, which normally reach the country on 1
June, when planting of the first paddy crop starts. Early
predictions by India’s meteorological centre point to
a 35 percent probability of a normal monsoon and 33
percent probability of a below-normal monsoon in 2014,
indicating that the threat of a recurring EI Niño cannot
be ignored. In 2009, the last year of a strong El Niño
event, rice production in the country dropped 10 percent.
Indonesia, the world’s third largest producer, is also
particularly exposed to an El Niño anomaly. However,
the 2014 season is well advanced in the country, which
is already harvesting its main crop, so an El Niño event
would more likely affect the first 2015 crop, which will
be planted in the last quarter of 2014. After more than
300 000 ha were damaged by widespread floods early this
year and recurring pest infestations, the government has
lowered its 2014 paddy production target to 73.0 million
tonnes, equivalent to 46 million tonnes, milled rice basis,
still relatively high. However, the current FAO forecast
is lower, at 45.4 million tonnes, but would represent a
1 percent increase from the good 2013 outturn. Within
the region, Bangladesh, Cambodia, Myanmar, the Philippines and Pakistan are also forecast to harvest
larger crops. In Viet Nam, production is only expected
to rise marginally, especially under current efforts by the
government to encourage a shift of land from rice to
maize and soybeans. By contrast, the 2014 production
outlook is negative in Sri Lanka, which already garnered
its main crop, the coverage of which was constrained to
half the area of last year by dry conditions. Production
is predicted to fall in Japan, amid less favourable prices,
but also in Laos and Thailand. In Thailand, the second
round of the 2013/14 rice pledging scheme guaranteeing
producer prices well above the market was suspended in
February. Although it is unclear whether the programme
will be reactivated later this year, falling producer prices
are now expected to result in a 2 percent contraction of
plantings and production in 2014.
Production prospects in Africa are positive overall, with
FAO forecasting a 3 percent growth, to 18.4 million tonnes in
2014. Part of the increase would be credited to Madagascar, where more favourable climatic conditions and reduced
locust incidence are anticipated to foster a 19 percent output

25FOOD OUTLOOKMAY 2014
RIC
E
recovery. After an 8 percent overall gain in 2013, production
in western Africa is now forecast to increase by a further
2 percent in 2014, assuming normal weather conditions.
Increases are currently anticipated for Burkina Faso, Cote d’Ivoire, Ghana, Guinea, Mali and Sierra Leone, where
most governments are running supportive rice policies.
By contrast, production in Nigeria could fall somewhat,
based on the Nigerian Meteorological Agency prediction
of a delayed and short-lived 2014 rainy season. In the rest
of the region, Tanzania has already had to cope with late
and poorly distributed rainfall, which may curb output by
5 percent. Mozambique is also anticipated to incur losses
from excess precipitation and floods. In Egypt, efforts by the
government to re-establish limits on rice plantings may result
in a 1 percent drop of output in 2014.
In Latin America and the Caribbean, the main paddy
crops already have been harvested in the southern part
of the continent with positive results. Production in the
region is now anticipated to increase by over 3 percent
to 19.5 million tonnes. Much of that growth reflects
an 8 percent expected gain in Brazil, where the sector
benefited from attractive prices and favourable weather
conditions. Prospects also point to sizeable expansions in
Argentina, Colombia, Ecuador, Guyana and Paraguay,
while production is expected to decline in Bolivia, Peru and Uruguay, marred by adverse weather conditions
and rising production costs. In Central America and
the Caribbean, where the 2014 season is just starting,
continued support from the government may sustain
further increases in production in Costa Rica, Cuba, Mexico and Nicaragua.
In North America, output is officially projected to
rebound by 12 percent in the United States under positive
return prospects. All of the increase is likely to arise in
the southern producing states, as drought in California is
constraining plantings.
In Europe, a partial 3 percent recovery from inclement
weather last season is anticipated for the European Union.
Although the 2013 reform of the Common Agricultural
Policy enters into effect on 1 January 2014, EU eligible
rice producers will still receive the Euro 177 per hectare
decoupled payment in 2014, as a transition measure and
for the last time. In the Russian Federation, production
is also forecast to recover from several setbacks, including
untimely rains and pest outbreaks that resulted in some 11
percent contraction in 2013.
In Oceania, Australia already garnered its 2014 crop,
with production officially assessed to have fallen by 22
percent, reflecting lingering drought conditions and
excessively cool temperatures in the main producing state
of New South Wales.
Table 1. World rice market at a glance
1 Calendar year exports (second year shown).2 Major exporters include India, Pakistan, Thailand, the United States
and Viet Nam.
Table 2. Rice Production: leading producers *
2012 2013 estim.
2014f.cast
Change:2014 over
2013
million tonnes, milled equivalent %
China 141.1 140.5 141.4 0.6
India 105.2 106.2 107.0 0.8
Indonesia 43.5 44.9 45.4 1.0
Bangladesh 33.8 34.3 34.7 1.0
Vietnam 29.2 29.4 29.5 0.3
Thailand 25.2 25.3 24.8 -2.0
Myanmar 17.7 17.6 18.3 3.4
Philippines 11.9 12.4 12.6 2.2
Brazil 7.8 7.9 8.6 7.4
Japan 7.7 7.8 7.7 -1.5
United States 6.3 6.1 6.9 11.1
Pakistan 5.5 6.4 6.5 1.8
Cambodia 5.9 6.0 6.1 1.2
Korea Rep. of 4.0 4.2 4.3 0.3
Egypt 4.1 4.2 4.2 -1.0
World 491.2 496.9 501.1 0.8
* Countries listed according to their position in global production (average 2012-2014).
2012/13 2013/14 estim.
2014/15 f’cast
Change: 2014/15
over 2013/14
million tonnes, milled equivalent %
WORLD BALANCE
Production 491.2 496.9 501.1 0.8
Trade 1 37.2 39.3 39.2 -0.2
Total utilization 478.3 490.3 502.3 2.4
Food 402.4 410.1 417.1 1.7
Ending stocks 174.8 180.9 180.1 -0.4
SUPPLY AND DEMAND INDICATORS
Per caput food consumption:
World (kg/yr) 56.9 57.4 57.7 0.5
LIFDC (kg/yr) 63.2 64.0 64.7 1.1
World stock-to-use ratio (%) 35.7 36.0 35.1
Major exporters stock-to-disappearance ratio2 (%)
28.1 27.8 27.0
FAO RICE PRICE INDEX (2002-2004=100)
2012 2013 2014 Jan-Apr
Change: Jan-Apr 2014
over Jan-Apr 2013
%
231 233 235 -1.0

Ma
rke
t a
sse
ssm
en
ts
26 FOOD OUTLOOKMAY 2014
TRADE
Revived import demand to boost international rice trade in 2014 International trade in rice in 2014 is anticipated to increase
by 5.5 percent, to 39.3 million tonnes, same as forecast
last month and a new record. Ample supplies in exporters’
hands have intensified competition for markets, resulting
in falling export quotations. Against this backdrop, several
traditional importers facing rising domestic prices and/or
thinning reserves are returning to the international market
to buy more. This especially concerns traditional importing
countries in Asia, such as Bangladesh, China, Indonesia, Malaysia, Nepal, the Philippines and Sri Lanka, which
are expected to be responsible for much of the 2.0 million
tonne increase expected in world imports. On the other
hand, shipments to the Islamic Republic of Iran, officially
reported to have reached 1.9 million tonnes in 2013, may
drop by some 20 percent, after two years of abnormally
large inflows. Good crops may also prompt Afghanistan
to cut imports. Rice imports by African countries are
currently anticipated to edge higher, mainly on larger
purchases by Nigeria, Mali, Senegal and Tanzania, while Madagascar and Mozambique are foreseen to curb
deliveries. Imports by countries in Latin America and the
Caribbean may also rise, supported by larger inflows to
Bolivia, Colombia, Costa Rica, Haiti and Peru. On the
other hand, improved supplies should allow Brazil and
Cuba to reduce their imports. In the other regions, the EU
is officially projected to buy 1.3 million tonnes in calendar
2014, up 5.5 percent from last year. In 2013, the EU
sourced increasing volumes from countries benefiting from
unlimited and tariff-free access to the EU market under
the Everything-But-Arms programme (EBA), in particular
Cambodia, a matter of increasing concern to the EU rice
industry. The Russian Federation and the United States
are also expected to step up imports in 2014.
On the supply side, ample availabilities in exporting
countries, amid large harvests and opening inventories,
have translated into steady declines in export quotations.
The price falls were particularly pronounced in Thailand, reflecting the suspension of the pledging programme in
February 2014 and the heavy downloads of supplies from
public stocks, a trend that has brought export quotations
from the country heavily down, helping it to regain its
competitive edge. As a result, Thailand may be able to
capture much of the expansion in world import demand,
with exports forecast to rise from 6.6 million tonnes in
2013 to 8.7 million tonnes this year. Most of the other
exporters may be in a position to increase their sales too,
in particular Viet Nam, which, as one of the traditional
Figure 3. World rice trade and FAO rice export price index
0
15
30
45
141312111009080706050
100
200
300
*
* January-April average for prices
Million tonnes, milled eq. 2002-2004=100
Exports FAO Rice ExportPrice Index
estim. f’cast
Figure 4. Rice imports by region
0
5
10
15
14131211100908070605
Near East
Far East Africa
Lat. Am.
Million tonnes, milled eq.
Others
Europe
estim. f’cast
Figure 5. Rice exports by the major exporters
0
4
8
12
2013 estimate
2014 forecast
Million tonnes, milled eq.
India Pakistan Thailand USA Viet Nam Others

27FOOD OUTLOOKMAY 2014
RIC
E
Figure 7. Rice production, utilization and stocks
50
100
150
200
370
420
470
520
14/1512/1310/1108/0906/0704/05
Million tonnes, milled eq. Million tonnes, milled eq.
f’cast
Stocks (right axis)
Production (left axis) Utilization (left axis)
Figure 6. Stocks held by the five major rice exporters and stock-to-disappearance ratio
0
20
40
60
14/1512/1310/1108/0906/0704/050
10
20
30
Million tonnes, milled eq. Percent
f’cast
Closing Stocks
Stock-to-disappearance ratio
suppliers of rice to Indonesia and the Philippines, should
benefit from the expected surge in purchases by the
two countries. Exports by Pakistan are also predicted to
end higher in 2014, on the back of the good 2013 crop,
continued strong demand in East Africa and the lifting of
import restrictions by the Russian Federation in February.
As one of the five major rice exporters, the United States
is officially forecast to keep rice shipments steady at about
3.3 million tonnes, reflecting limited domestic supplies
and relatively high prices. Accrued competition and higher
domestic requirements may, in turn, depress shipments
from India, the number one exporter since 2012, from
10.5 million tonnes in 2013 to 9.8 million tonnes this year,
a level that would preserve the country leading position
among exporters. As for the other rice exporting countries,
most may benefit from the expansion of trade and step up
deliveries, including Cambodia and Myanmar, both of
which will benefit from the EBA preferential access to the
EU market, but also Argentina and Brazil. By contrast,
limited supplies will likely constrain sales by Australia and
Uruguay.
Although very preliminary and largely drawing on
current expectations on supply and demand, rice trade
in calendar 2015 is forecast to stay close to the record
anticipated for 2014. Rice flows from the major sources
may, however, differ from those currently predicted for the
current year. Shipments from Thailand, in particular, may
increase further in 2015, enough for the country to recover
its leadership among exporters. With the exception of the
United States, which may also sell more in 2015, all the
other major exporters may cut deliveries, especially India,
but also Pakistan and Viet Nam. As for imports, these
are anticipated to fall in China, Malaysia and Sri Lanka,
compensating for increases in Brazil, Cote d’Ivoire, the Republic of Korea, the Islamic Republic of Iran, Iraq,
Nepal and Nigeria.
UTILIZATION
Food drives rice utilization Still tentative and based on early expectations of 2014
production, FAO sees global rice utilization in 2014/15
expanding by about 12 million tonnes, or 2.4 percent, to
502.2 million tonnes. Much of the season’s consumption
growth would be sustained by a continuing rise in direct
human consumption, as food intake is estimated to absorb
417 million tonnes in 2014/15, 1.7 percent, or 7 million
tonnes more than in 2013/14. However, amounts destined
to animal feed and other uses – including seeds, non-
food processed products and waste – are also anticipated
to increase. Taking into account a projected 1.4 percent
growth in world population, the average rice food intake
would rise to 57.7 kilos per capita, which is somewhat
above the 2013/14 estimate of 57.4 kilos. Indeed, rice
remains expensive in domestic markets, with many
countries reporting lingering high local prices.
GLOBAL RICE INVENTORIES
Forecast to rise for the ninth consecutive yearBased on the latest estimates, global rice stocks carried
over in 2014 are set to rise for the ninth consecutive year,
reaching 180.9 million tonnes (milled basis), 3.4 percent,
or 6 million tonnes, above their opening level. All of the
increase will be concentrated in the developing countries,

Ma
rke
t a
sse
ssm
en
ts
28 FOOD OUTLOOKMAY 2014
where inventories would rise by 4 percent, largely sustained
by a further increase in China. By contrast, poor production
results may entail a 5 percent contraction of carryovers
in developed nations. As a group, the five major rice
exporters are expected to build up their reserves, owing
to larger inventories in Pakistan, Thailand and Viet Nam,
which would compensate for a drawdown in India and the
United States. As a result, the world stock-to-use ratio, a
key indicator of food security, is predicted to rise from 35.7
percent in 2012-13 to 36.0 percent in 2013-14. As for the
five major exporters’ stock-to-disappearance ratio, which
is a better indicator of the international market tightness,
current forecasts point to a decline from 28.0 percent to
27.8 percent over the same period.
Although still very preliminary and based on early
prospects for production, trade and utilization in 2014/15,
global rice stocks carried over in 2015 are forecast to
be trimmed for the first time in ten years, albeit by only
0.4 percent. If confirmed, the reduction of world rice
stocks would be the first, after 9 years of uninterrupted
stockpiling. Whether the projected decline is a sign that
world supplies are finally adjusting to better match demand
remains to be seen.
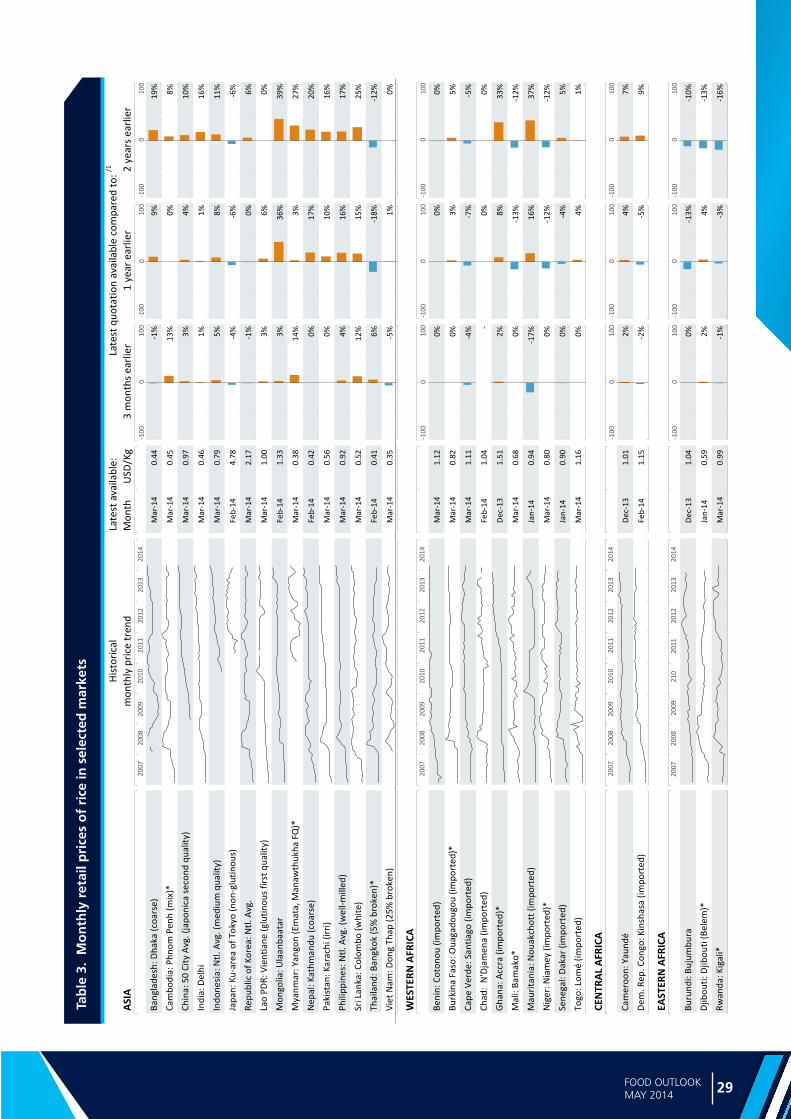
29FOOD OUTLOOKMAY 2014
RIC
E
ASI
AM
onth
USD
/Kg
3 m
onth
s ea
rlie
r1
year
ear
lier
2 ye
ars
earl
ier
Bang
lade
sh: D
haka
(coa
rse)
Mar
-14
0.44
-1%
9%19
%
Cam
bodi
a: P
hnom
Pen
h (m
ix)*
Mar
-14
0.45
13%
0%8%
Chin
a: 5
0 Ci
ty A
vg. (
japo
nica
sec
ond
qual
ity)
Mar
-14
0.97
3%4%
10%
Indi
a: D
elhi
M
ar-1
40.
46
1%
1%16
%
Indo
nesi
a: N
tl. A
vg. (
med
ium
qua
lity)
Mar
-14
0.79
5%8%
11%
Japa
n: K
u-ar
ea o
f Tok
yo (n
on-g
lutin
ous)
Fe
b-14
4.78
-4%
-6%
-6%
Repu
blic
of K
orea
: Ntl.
Avg
. M
ar-1
42.
17
-1
%0%
6%
Lao
PDR:
Vie
ntia
ne (g
lutin
ous
first
qua
lity)
Mar
-14
1.00
3%6%
0%
Mon
golia
: Ula
anba
atar
Fe
b-14
1.33
3%36
%39
%
Mya
nmar
: Yan
gon
(Em
ata,
Man
awth
ukha
FQ
)*M
ar-1
40.
38
14
%3%
27%
Nep
al: K
athm
andu
(coa
rse)
Feb-
140.
42
0%
17%
20%
Paki
stan
: Kar
achi
(irr
i) M
ar-1
40.
56
0%
10%
16%
Phili
ppin
es: N
tl. A
vg. (
wel
l-mill
ed)
Mar
-14
0.92
4%16
%17
%
Sri L
anka
: Col
ombo
(whi
te)
Mar
-14
0.52
12%
15%
25%
Thai
land
: Ban
gkok
(5%
bro
ken)
*Fe
b-14
0.41
6%-1
8%-1
2%
Viet
Nam
: Don
g Th
ap (2
5% b
roke
n)M
ar-1
40.
35
-5
%1%
0%
WES
TER
N A
FRIC
A
Beni
n: C
oton
ou (i
mpo
rted
)M
ar-1
41.
12
0%
0%0%
Burk
ina
Faso
: Oua
gado
ugou
(im
port
ed)*
Mar
-14
0.82
0%3%
5%
Cape
Ver
de: S
antia
go (i
mpo
rted
)M
ar-1
41.
11
-4
%-7
%-5
%
Chad
: N
'Dja
men
a (im
port
ed)
Feb-
141.
04
-
0%0%
Gha
na: A
ccra
(im
port
ed)*
Dec
-13
1.51
2%8%
33%
Mal
i: Ba
mak
o*
Mar
-14
0.68
0%-1
3%-1
2%
Mau
rita
nia:
Nou
akch
ott (
impo
rted
)Ja
n-14
0.94
-17%
16%
37%
Nig
er: N
iam
ey (i
mpo
rted
)*M
ar-1
40.
80
0%
-12%
-12%
Sene
gal:
Dak
ar (i
mpo
rted
)Ja
n-14
0.90
0%-4
%5%
Togo
: Lom
é (im
port
ed)
Mar
-14
1.16
0%4%
1%
CEN
TRA
L A
FRIC
A
Cam
eroo
n: Y
aund
é D
ec-1
31.
01
2%
4%7%
Dem
. Rep
. Con
go: K
insh
asa
(impo
rted
)Fe
b-14
1.15
-2%
-5%
9%
EAST
ERN
AFR
ICA
Buru
ndi:
Buju
mbu
ra
Dec
-13
1.04
0%-1
3%-1
0%
Djib
outi:
Djib
outi
(Bel
em)*
Jan-
140.
59
2%
4%-1
3%
Rwan
da: K
igal
i*
Mar
-14
0.99
-1%
-3%
-16%
His
tori
cal
Late
st a
vaila
ble:
Late
st q
uota
tion
avai
labl
e co
mpa
red
to: /1
mon
thly
pri
ce tr
end
2014
20
13
0 -1
00
100
-100
10
0 0
0 10
0 -1
00
2008
20
12
2010
20
07
2011
20
09
2014
20
13
0 -1
00
100
-100
10
0 0
0 10
0 -1
00
2008
20
12
210
2007
20
11
2009
2014
20
13
0 -1
00
100
-100
10
0 0
0 10
0 -1
00
2008
20
12
2010
20
07
2011
20
09
2014
20
13
0 -1
00
100
-100
10
0 0
0 10
0 -1
00
2008
20
12
2010
20
07
2011
20
09
Tab
le 3
. M
on
thly
ret
ail p
rice
s o
f ri
ce in
sel
ecte
d m
arke
ts

Ma
rke
t a
sse
ssm
en
ts
30 FOOD OUTLOOKMAY 2014
EAST
ERN
AFR
ICA
(con
tinu
ed)
Mon
thU
SD/K
g3
mon
ths
earl
ier
1 ye
ar e
arlie
r2
year
s ea
rlie
r
Som
alia
: Mog
adis
hu (i
mpo
rted
) M
ar-1
40.
66
0%
8%-3
2%
Uga
nda:
Kam
pala
* M
ar-1
41.
14
3%
7%-1
5%
Uni
ted
Rep.
of T
anza
nia:
Dar
es
Sala
am*
Mar
-14
0.94
-1%
-11%
-27%
SOU
THER
N A
FRIC
A
Ang
ola:
Lua
nda
Feb-
143.
30
0%
3%10
%
Mad
agas
car:
Ntl.
Avg
. (lo
cal)
Mar
-14
0.56
-7%
0%4%
Mal
awi:
Lilo
ngw
e Ja
n-14
1.03
9%18
%50
%
Moz
ambi
que:
Map
uto
Mar
-14
0.79
0%0%
6%
CEN
TRA
L A
MER
ICA
AN
D T
HE
CAR
IBBE
AN
Cost
a Ri
ca: N
tl. A
vg. (
first
qua
lity)
M
ar-1
41.
33
-1
2%-1
4%-1
4%
Dom
inic
an R
ep: S
anto
Dom
ingo
(fir
st q
ualit
y)
Feb-
141.
07
1%
0%-4
%
El S
alva
dor:
San
Sal
vado
r M
ar-1
41.
09
7%
9%0%
Gua
tem
ala:
Ntl.
Avg
. (se
cond
qua
lity)
Fe
b-14
1.20
-1%
1%3%
Hai
ti: P
ort-
au-P
rinc
e (im
port
ed)
Mar
-14
1.04
-2%
0%4%
Mex
ico:
Mex
ico
City
(sin
aloa
)*M
ar-1
40.
83
-4
%3%
6%
Nic
arag
ua: N
tl. A
vg. (
seco
nd q
ualit
y)M
ar-1
40.
96
5%
10%
14%
Pana
ma:
Pan
ama
City
(fir
st q
ualit
y)
Mar
-14
1.30
2%9%
18%
SOU
TH A
MER
ICA
Boliv
ia: L
a Pa
z (g
rano
de
oro)
*M
ar-1
41.
19
0%
30%
41%
Braz
il: S
ão P
aulo
M
ar-1
41.
04
2%
-1%
26%
Colo
mbi
a: B
ogot
á (f
irst
qua
lity)
*M
ar-1
40.
97
-1
%-1
0%-
Ecua
dor:
Qui
to (l
ong
grai
n)*
Mar
-14
1.05
0%0%
9%
Peru
: Lim
a (c
orri
ente
) *M
ar-1
40.
74
8%
32%
19%
Uru
guay
: Ntl.
Avg
. (gr
ade
1)*
Mar
-14
0.95
0%17
%48
%
NO
RTH
AM
ERIC
A
Uni
ted
Stat
es: C
ity A
vg. (
long
gra
in, u
ncoo
ked)
M
ar-1
41.
62
0%
3%5%
EURO
PE
Ital
y: M
ilan
(arb
orio
vol
ano)
*M
ar-1
42.
11
28
%10
2%61
%
Russ
ian
Fede
ratio
n: N
tl. A
vg.
Mar
-14
1.16
4%11
%-2
%
mon
thly
pri
ce tr
end
His
tori
cal
/1 Q
uota
tions
in th
e m
onth
spe
cifie
d in
the
third
col
umn
wer
e co
mpa
red
to th
eir
leve
ls in
the
prec
edin
g th
ree,
twel
ve a
nd tw
enty
-fou
r m
onth
s. P
rice
com
pari
sons
wer
e m
ade
in n
omin
al lo
cal c
urre
ncy
units
.*
Who
lesa
le p
rice
s.
Sour
ces:
FA
O/G
IEW
S G
IEW
S Fo
od P
rice
Dat
a an
d A
naly
sis
Tool
; Ko
rea
Agr
icul
tura
l Mar
ketin
g In
form
atio
n Se
rvic
e (K
AM
IS);
Japa
n M
inis
try
of A
gric
ultu
re, F
ores
try
and
Fish
erie
s; U
.S. B
urea
u of
Lab
or S
tatis
tics
(BLS
); A
ssoc
iazi
one
Indu
stri
e Ri
sier
e It
alia
ne (A
IRI).
Pl
ease
not
e th
at p
rice
s sh
own
are
com
para
ble
over
tim
e, b
ut n
ot a
cros
s co
untr
ies,
as
they
may
ref
er to
diff
eren
t sta
ges
of th
e m
arke
ting
chai
n (e
.g. r
etai
l ver
sus
who
lesa
le p
rice
s), d
iffer
ent r
ice
type
s (e
.g. a
rom
atic
ver
sus
non-
arom
atic
) or
diff
eren
t qua
litie
s of
rice
(e.g
fully
bro
ken
vers
us 5
% b
roke
ns).
Late
st a
vaila
ble:
Late
st q
uota
tion
avai
labl
e co
mpa
red
to: /1
2014
20
13
0 -1
00
100
-100
10
0 0
0 10
0 -1
00
2008
20
12
2010
20
07
2011
20
09
2014
20
13
0 -1
00
100
-100
10
0 0
0 10
0 -1
00
2008
20
12
2010
20
07
2011
20
09
2014
20
13
0 -1
00
100
-100
10
0 0
0 10
0 -1
00
2008
20
12
2010
20
07
2011
20
09
2014
20
13
0 -1
00
100
-100
10
0 0
0 10
0 -1
00
2008
20
12
2010
20
07
2011
20
09
2014
20
13
0 -1
00
100
-100
10
0 0
0 10
0 -1
00
2008
20
12
2010
20
07
2011
20
09
2014
20
13
0 -1
00
100
-100
10
0 0
0 10
0 -1
00
2008
20
12
2010
20
07
2011
20
09
Tab
le 3
. Mo
nth
ly r
etai
l pri
ces
of
rice
in s
elec
ted
mar
kets
(C
on
t’d
)
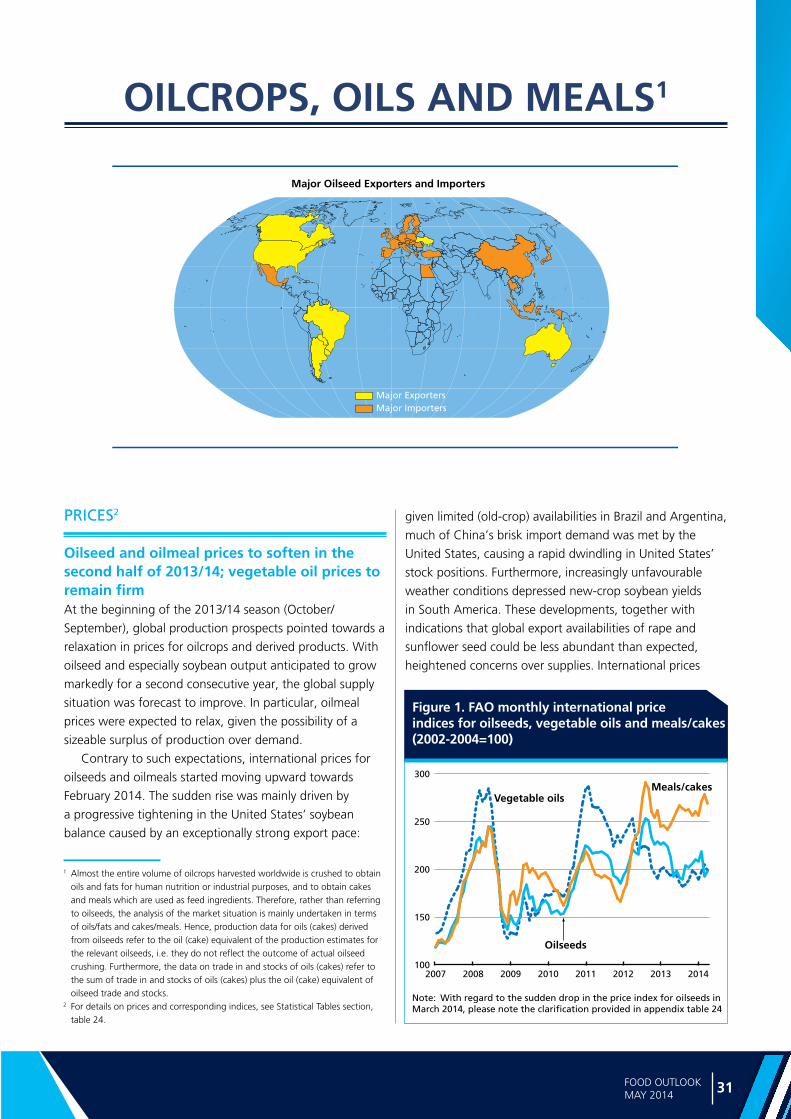
31FOOD OUTLOOKMAY 2014
OILC
RO
PS, O
ILS AN
D M
EA
LS
1 Almost the entire volume of oilcrops harvested worldwide is crushed to obtain oils and fats for human nutrition or industrial purposes, and to obtain cakes and meals which are used as feed ingredients. Therefore, rather than referring to oilseeds, the analysis of the market situation is mainly undertaken in terms of oils/fats and cakes/meals. Hence, production data for oils (cakes) derived from oilseeds refer to the oil (cake) equivalent of the production estimates for the relevant oilseeds, i.e. they do not reflect the outcome of actual oilseed crushing. Furthermore, the data on trade in and stocks of oils (cakes) refer to the sum of trade in and stocks of oils (cakes) plus the oil (cake) equivalent of oilseed trade and stocks.
2 For details on prices and corresponding indices, see Statistical Tables section, table 24.
Major Oilseed Exporters and Importers
Major ExportersMajor Importers
Figure 1. FAO monthly international price indices for oilseeds, vegetable oils and meals/cakes (2002-2004=100)
100
150
200
250
300
20142013201220112010200920082007
Meals/cakesVegetable oils
Oilseeds
Note: With regard to the sudden drop in the price index for oilseeds inMarch 2014, please note the clarification provided in appendix table 24
OILCROPS, OILS AND MEALS1
PRICES2
Oilseed and oilmeal prices to soften in the second half of 2013/14; vegetable oil prices to remain firmAt the beginning of the 2013/14 season (October/
September), global production prospects pointed towards a
relaxation in prices for oilcrops and derived products. With
oilseed and especially soybean output anticipated to grow
markedly for a second consecutive year, the global supply
situation was forecast to improve. In particular, oilmeal
prices were expected to relax, given the possibility of a
sizeable surplus of production over demand.
Contrary to such expectations, international prices for
oilseeds and oilmeals started moving upward towards
February 2014. The sudden rise was mainly driven by
a progressive tightening in the United States’ soybean
balance caused by an exceptionally strong export pace:
given limited (old-crop) availabilities in Brazil and Argentina,
much of China’s brisk import demand was met by the
United States, causing a rapid dwindling in United States’
stock positions. Furthermore, increasingly unfavourable
weather conditions depressed new-crop soybean yields
in South America. These developments, together with
indications that global export availabilities of rape and
sunflower seed could be less abundant than expected,
heightened concerns over supplies. International prices
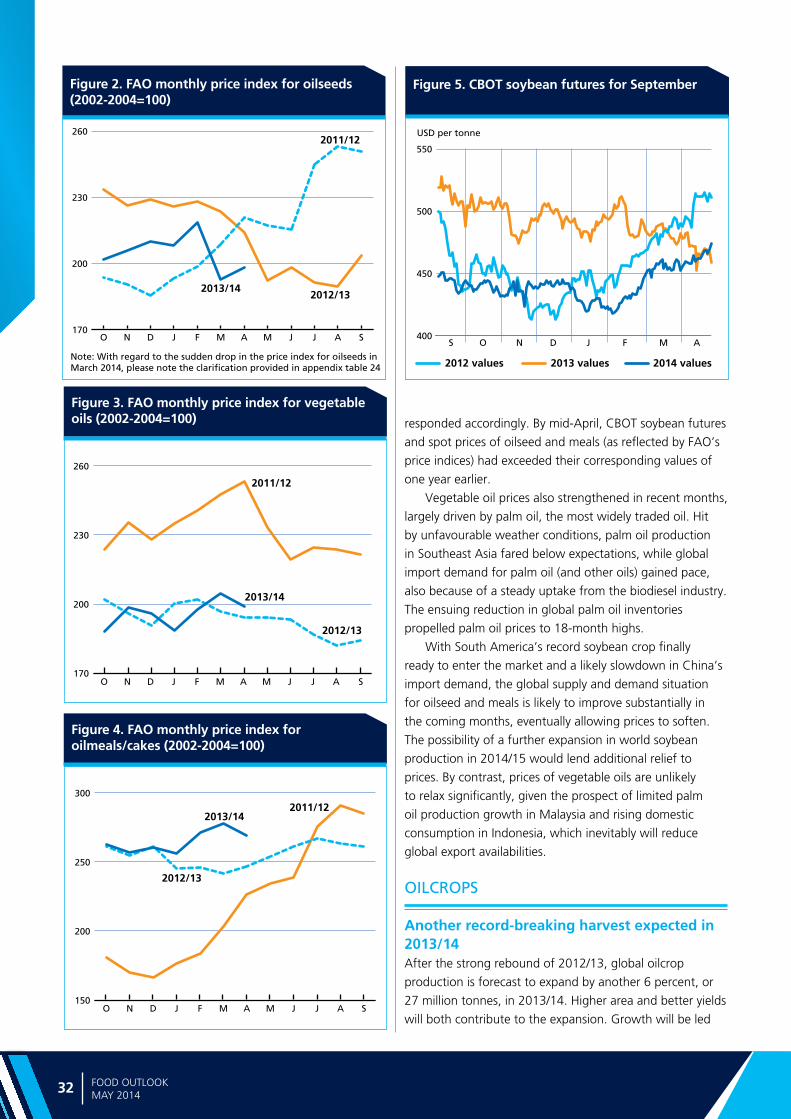
Ma
rke
t a
sse
ssm
en
ts
32 FOOD OUTLOOKMAY 2014
Figure 5. CBOT soybean futures for SeptemberFigure 2. FAO monthly price index for oilseeds (2002-2004=100)
Figure 3. FAO monthly price index for vegetable oils (2002-2004=100)
Figure 4. FAO monthly price index for oilmeals/cakes (2002-2004=100)
170
200
230
2602011/12
2012/132013/14
Note: With regard to the sudden drop in the price index for oilseeds inMarch 2014, please note the clarification provided in appendix table 24
SAJJMAMFJDNO
170
200
230
260
2012/13
2011/12
2013/14
SAJJMAMFJDNO
150
200
250
300
2011/12
2012/13
2013/14
SAJJMAMFJDNO
400
450
500
550
USD per tonne
S O N D J F M A
2012 values 2013 values 2014 values
responded accordingly. By mid-April, CBOT soybean futures
and spot prices of oilseed and meals (as reflected by FAO’s
price indices) had exceeded their corresponding values of
one year earlier.
Vegetable oil prices also strengthened in recent months,
largely driven by palm oil, the most widely traded oil. Hit
by unfavourable weather conditions, palm oil production
in Southeast Asia fared below expectations, while global
import demand for palm oil (and other oils) gained pace,
also because of a steady uptake from the biodiesel industry.
The ensuing reduction in global palm oil inventories
propelled palm oil prices to 18-month highs.
With South America’s record soybean crop finally
ready to enter the market and a likely slowdown in China’s
import demand, the global supply and demand situation
for oilseed and meals is likely to improve substantially in
the coming months, eventually allowing prices to soften.
The possibility of a further expansion in world soybean
production in 2014/15 would lend additional relief to
prices. By contrast, prices of vegetable oils are unlikely
to relax significantly, given the prospect of limited palm
oil production growth in Malaysia and rising domestic
consumption in Indonesia, which inevitably will reduce
global export availabilities.
OILCROPS
Another record-breaking harvest expected in 2013/14After the strong rebound of 2012/13, global oilcrop
production is forecast to expand by another 6 percent, or
27 million tonnes, in 2013/14. Higher area and better yields
will both contribute to the expansion. Growth will be led
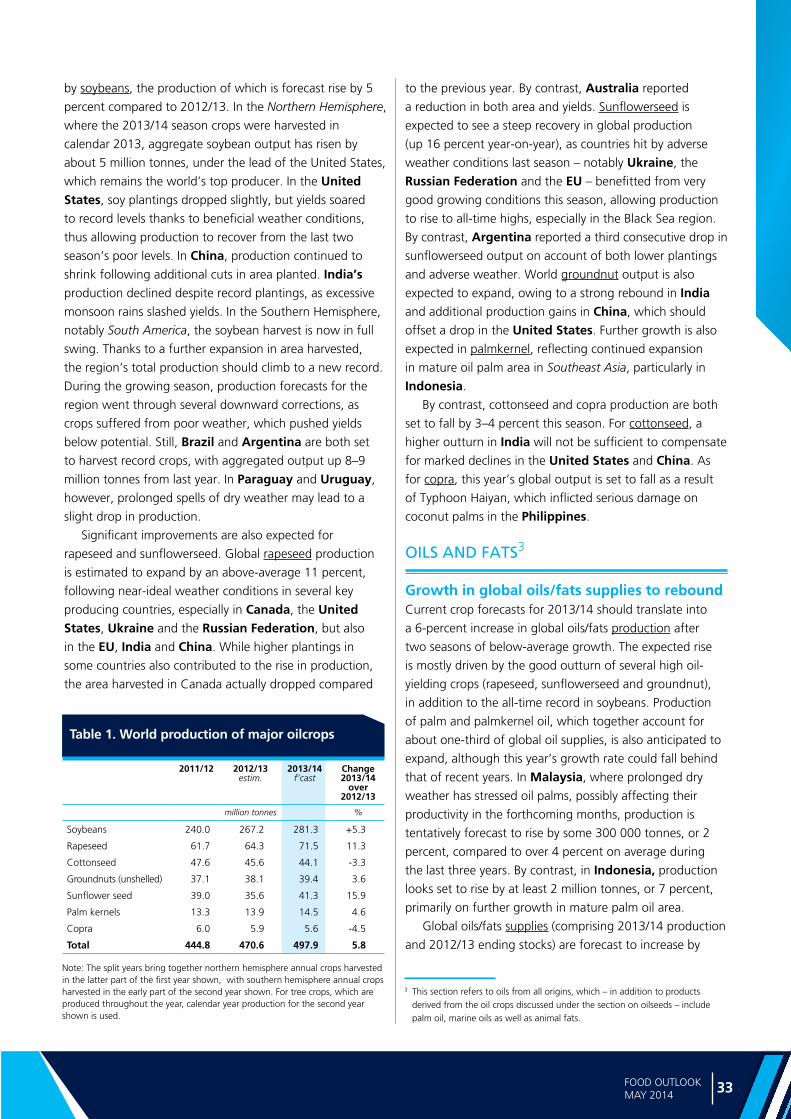
33FOOD OUTLOOKMAY 2014
OILC
RO
PS, O
ILS AN
D M
EA
LS
Note: The split years bring together northern hemisphere annual crops harvested in the latter part of the first year shown, with southern hemisphere annual crops harvested in the early part of the second year shown. For tree crops, which are produced throughout the year, calendar year production for the second year shown is used.
2011/12 2012/13estim.
2013/14 f’cast
Change 2013/14
over 2012/13
million tonnes %
Soybeans 240.0 267.2 281.3 +5.3
Rapeseed 61.7 64.3 71.5 11.3
Cottonseed 47.6 45.6 44.1 -3.3
Groundnuts (unshelled) 37.1 38.1 39.4 3.6
Sunflower seed 39.0 35.6 41.3 15.9
Palm kernels 13.3 13.9 14.5 4.6
Copra 6.0 5.9 5.6 -4.5
Total 444.8 470.6 497.9 5.8
Table 1. World production of major oilcrops
by soybeans, the production of which is forecast rise by 5
percent compared to 2012/13. In the Northern Hemisphere,
where the 2013/14 season crops were harvested in
calendar 2013, aggregate soybean output has risen by
about 5 million tonnes, under the lead of the United States,
which remains the world’s top producer. In the United States, soy plantings dropped slightly, but yields soared
to record levels thanks to beneficial weather conditions,
thus allowing production to recover from the last two
season’s poor levels. In China, production continued to
shrink following additional cuts in area planted. India’s production declined despite record plantings, as excessive
monsoon rains slashed yields. In the Southern Hemisphere,
notably South America, the soybean harvest is now in full
swing. Thanks to a further expansion in area harvested,
the region’s total production should climb to a new record.
During the growing season, production forecasts for the
region went through several downward corrections, as
crops suffered from poor weather, which pushed yields
below potential. Still, Brazil and Argentina are both set
to harvest record crops, with aggregated output up 8–9
million tonnes from last year. In Paraguay and Uruguay,
however, prolonged spells of dry weather may lead to a
slight drop in production.
Significant improvements are also expected for
rapeseed and sunflowerseed. Global rapeseed production
is estimated to expand by an above-average 11 percent,
following near-ideal weather conditions in several key
producing countries, especially in Canada, the United States, Ukraine and the Russian Federation, but also
in the EU, India and China. While higher plantings in
some countries also contributed to the rise in production,
the area harvested in Canada actually dropped compared
to the previous year. By contrast, Australia reported
a reduction in both area and yields. Sunflowerseed is
expected to see a steep recovery in global production
(up 16 percent year-on-year), as countries hit by adverse
weather conditions last season – notably Ukraine, the
Russian Federation and the EU – benefitted from very
good growing conditions this season, allowing production
to rise to all-time highs, especially in the Black Sea region.
By contrast, Argentina reported a third consecutive drop in
sunflowerseed output on account of both lower plantings
and adverse weather. World groundnut output is also
expected to expand, owing to a strong rebound in India and additional production gains in China, which should
offset a drop in the United States. Further growth is also
expected in palmkernel, reflecting continued expansion
in mature oil palm area in Southeast Asia, particularly in
Indonesia.
By contrast, cottonseed and copra production are both
set to fall by 3–4 percent this season. For cottonseed, a
higher outturn in India will not be sufficient to compensate
for marked declines in the United States and China. As
for copra, this year’s global output is set to fall as a result
of Typhoon Haiyan, which inflicted serious damage on
coconut palms in the Philippines.
OILS AND FATS3
Growth in global oils/fats supplies to rebound Current crop forecasts for 2013/14 should translate into
a 6-percent increase in global oils/fats production after
two seasons of below-average growth. The expected rise
is mostly driven by the good outturn of several high oil-
yielding crops (rapeseed, sunflowerseed and groundnut),
in addition to the all-time record in soybeans. Production
of palm and palmkernel oil, which together account for
about one-third of global oil supplies, is also anticipated to
expand, although this year’s growth rate could fall behind
that of recent years. In Malaysia, where prolonged dry
weather has stressed oil palms, possibly affecting their
productivity in the forthcoming months, production is
tentatively forecast to rise by some 300 000 tonnes, or 2
percent, compared to over 4 percent on average during
the last three years. By contrast, in Indonesia, production
looks set to rise by at least 2 million tonnes, or 7 percent,
primarily on further growth in mature palm oil area.
Global oils/fats supplies (comprising 2013/14 production
and 2012/13 ending stocks) are forecast to increase by
3 This section refers to oils from all origins, which – in addition to products derived from the oil crops discussed under the section on oilseeds – include palm oil, marine oils as well as animal fats.

Ma
rke
t a
sse
ssm
en
ts
34 FOOD OUTLOOKMAY 2014
1 Refer to footnote 1 on page 31 for overall definitions and methodology.2 Includes oils and fats of vegetable, animal and marine origin.3 Production plus opening stocks.4 Residual of the balance.5 Trade data refer to exports based on a common October/September
marketing season.6 Major exporters include Argentina, Brazil, Canada, Indonesia,
Malaysia,Ukraine and the United States.7 All meal figures are expressed in protein equivalent; meals include all meals
and cakes derived from oilcrops as well as meals of marine and animal origin.8 Major exporters include Argentina, Brazil, Canada, India, Indonesia, Malaysia,
Paraguay, Ukraine and the United States.
Table 2. World oilcrops and product market ata glance1
2011/12 2012/13 estim.
2013/14 f’cast
Change: 2013/14
over 2012/13
million tonnes %
TOTAL OILCROPS
Production 455.9 481.9 509.4 5.7
OILS AND FATS 2
Production 184.6 189.4 201.1 6.2
Supply 3 216.0 221.6 232.7 5.0
Utilization 4 184.1 189.4 198.0 4.6
Trade 5 98.2 102.3 105.4 3.1
Global stock-to-use ratio (%) 17.5 16.7 17.3
Major exporters stock-to-disappearance ratio (%) 6
10.3 9.0 9.6
MEALS AND CAKES 7
Production 111.3 119.6 126.9 6.1
Supply 3 132.4 137.2 145.0 5.7
Utilization 4 116.4 117.8 121.9 3.4
Trade 5 72.9 73.3 79.8 8.8
Global stock-to-use ratio (%) 15.2 15.4 18.0
Major exporters stock-to-disappearance ratio (%) 8
5.9 7.9 9.6
FAO PRICE INDICES (Oct/Sept) (2002-2004=100)
2011/12 2012/13 2013/14 Oct-Apr
Change: Oct-Apr 2013/14
overOct-Apr 2012/13
%
Oilseeds 214 213 205 -9.2
Oilmeals/cakes 219 255 265 5.5
Vegetable oils 232 193 196 -0.6
5 percent year-on-year – about double the rate achieved
last season. Thanks to record crops, domestic availability
of oils/fats is expected to improve strongly in several major
producing countries, notably Canada, Ukraine and the
Russian Federation, but also in Argentina, Brazil, China, the EU, India and Indonesia. By contrast, domestic
supplies may shrink in Malaysia and the Philippines. In
the United States, due to extremely low opening stocks,
total supplies are estimated to increase by merely 2 percent,
recovering only partially from the exceptional drop of the
last two seasons.
Biodiesel industry to contribute to growth in global oils/fats consumptionAfter last season’s poor growth, a rebound in global oils/fats
consumption is forecast for 2013/14. Relatively low prices,
continued economic growth in several countries in Asia and
rising use of oils/fats as biodiesel feedstock are expected to
stimulate demand. Total consumption is currently estimated
to expand by nearly 9 million tonnes, or 5 percent.
With regard to individual oils/fats, palm oil should
contribute less than usual to total expansion in utilization,
mirroring the modest growth in supplies, which has led to a
lower than usual price discount of palm oil relative to other
vegetable oils. Conversely, soy, rape and sunflowerseed oil
are expected to play a more important role in this year’s
consumption rise.
Country-wise, developing nations in Asia are again set
to drive global consumption growth, in particular, China,
India and Indonesia. While in China, oils/fats consumption
growth could slow down compared to past years, in
Indonesia, it is forecast to surge by 2.3 million tonnes,
as more palm oil is absorbed by the country’s biodiesel
industry following the introduction of ambitious mandatory
consumption targets. Demand in Malaysia is also likely
to strengthen, following a nationwide implementation
of higher biodiesel blending rates starting in July 2014.
In the EU, the world’s second largest consumer after
China, a rebound in oils/fats consumption seems likely,
underpinned by higher demand from biofuel producers,
as overseas biodiesel purchases remain constrained by
anti-dumping duties. By contrast, in the United States,
continued tightness in domestic soybean supplies and a
possible stagnation in demand from the biodiesel sector
are expected to limit year-on-year growth in oils/fats
consumption to 1 percent. Demand from the United States
biodiesel producers will depend on the final decision on
this year’s mandatory blending volumes and on whether
or not the blender’s tax credit is going to be renewed.
In Argentina, biodiesel production – and thus demand
for soyoil as fuel feedstock – could shrink for the second
consecutive year as the country’s biodiesel exports continue
to be hindered by the EU’s import restrictions. The impact
of the recently raised domestic blending mandates on
Argentina’s consumption might also be limited because,
at the prevailing government-set prices, production of
biodiesel for the domestic market is said to be unprofitable.
Similarly, in Brazil, demand from the biodiesel sector is not
expected to expand significantly this season, given that the
government again postponed the shift to higher mandatory
blending rates.

35FOOD OUTLOOKMAY 2014
OILC
RO
PS, O
ILS AN
D M
EA
LS
Figure 7. World stocks and ratios of oils/fats (including the oil contained in seeds stored)
0
10
20
30
40
2013/142012/132011/122010/112009/106
9
12
15
18
Million tonnes Percent
Major Exporters Rest of the World
World Stock-to-use ratioStock-to-disappearance ratio of Major Exporters
estim. f’cast
Figure 6. Global production and utilizationof oils/fats
-6
-3
0
3
6
165
175
185
195
205
2013/142012/132011/122010/112009/10
Million tonnes Million tonnes
estim. f’cast
Balance (production minus utilization, right axis)
Production (left axis) Utilization (left axis)
Stock-to-use ratio to recover in 2013/14 Based on the above supply and demand forecasts,
global 2013/14 closing stocks (which comprise oils/fats
inventories plus the oil contained in stored oilseeds) are
forecast to grow by about 9 percent – making up for last
season’s decrease. Larger global inventories of soybean,
rape and sunflowerseed (and their respective oils) should
more than offset a likely reduction in palm oil stocks.
Rapeseed oil inventories are expected to swell to an all-time
high, with Canada and China recording the strongest
rises. In Canada, the pile-up is related to bottlenecks in
the country’s rail transportation, which have seriously
hampered export flows. Regarding soy, the projected rise
in global inventories concerns principally China, Argentina
and Brazil. In the United States, where efforts have
Figure 8. Oil/fat imports by region or major country (including the oil contained in seed imports)
0
10
20
30
40
2013/142011/122009/102007/082005/06
Latin America
Asia excl. China (total) Europe
China (total)
Million tonnes
United States & Canada Africa
f’cast
concentrated on meeting exports demand, inventories
should remain close to last season’s depressed level. In the
case of palm oil, the anticipated shortfall in production is
likely to result in a drawdown in stocks in Indonesia and
Malaysia.
Despite the projected sizeable increase in global
inventories, the world stock-to-use ratio for oils/fats may
recover only partially from the low level recorded last
season. An even more modest recovery is expected in
the stock-to-disappearance ratio of the major exporting
countries4, which helps explain why international prices for
oils/fats trended upward in recent months.
Trade in oils/fats to expand moderatelyExpansion in global oils/fats trade (including the oil
contained in traded oilseeds) should be limited to 3 percent
this season. Sluggish consumption growth in a number
of key importing countries and the possibility of firming
international oil and oilseed prices foreshadow a slow
expansion in trade. Falling import requirements in the EU
and slower expansion of imports by China and India –
the world’s three leading importers – are mostly behind
the anticipated deceleration in world trade. In all three
destinations, abundant domestic supplies are foreseen to
weaken import demand.
With respect to exports, large availabilities of soy,
sunflower and rapeseed oil should make up for a
reduction in global shipments of coconut, palmkernel
4 Argentina, Brazil, Canada, Indonesia, Malaysia, Ukraine and the United States.
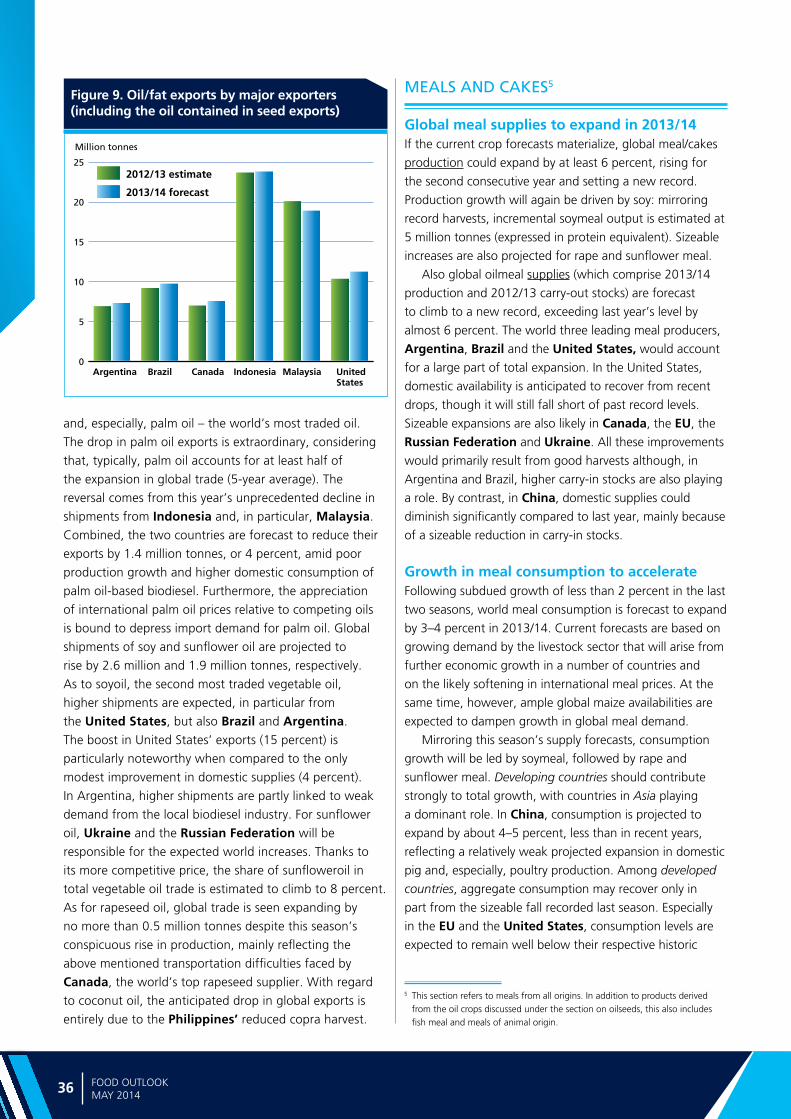
Ma
rke
t a
sse
ssm
en
ts
36 FOOD OUTLOOKMAY 2014
Figure 9. Oil/fat exports by major exporters (including the oil contained in seed exports)
0
5
10
15
20
252012/13 estimate
2013/14 forecast
Million tonnes
UnitedStates
IndonesiaCanada MalaysiaArgentina Brazil
and, especially, palm oil – the world’s most traded oil.
The drop in palm oil exports is extraordinary, considering
that, typically, palm oil accounts for at least half of
the expansion in global trade (5-year average). The
reversal comes from this year’s unprecedented decline in
shipments from Indonesia and, in particular, Malaysia.
Combined, the two countries are forecast to reduce their
exports by 1.4 million tonnes, or 4 percent, amid poor
production growth and higher domestic consumption of
palm oil-based biodiesel. Furthermore, the appreciation
of international palm oil prices relative to competing oils
is bound to depress import demand for palm oil. Global
shipments of soy and sunflower oil are projected to
rise by 2.6 million and 1.9 million tonnes, respectively.
As to soyoil, the second most traded vegetable oil,
higher shipments are expected, in particular from
the United States, but also Brazil and Argentina.
The boost in United States’ exports (15 percent) is
particularly noteworthy when compared to the only
modest improvement in domestic supplies (4 percent).
In Argentina, higher shipments are partly linked to weak
demand from the local biodiesel industry. For sunflower
oil, Ukraine and the Russian Federation will be
responsible for the expected world increases. Thanks to
its more competitive price, the share of sunfloweroil in
total vegetable oil trade is estimated to climb to 8 percent.
As for rapeseed oil, global trade is seen expanding by
no more than 0.5 million tonnes despite this season’s
conspicuous rise in production, mainly reflecting the
above mentioned transportation difficulties faced by
Canada, the world’s top rapeseed supplier. With regard
to coconut oil, the anticipated drop in global exports is
entirely due to the Philippines’ reduced copra harvest.
MEALS AND CAKES5
Global meal supplies to expand in 2013/14If the current crop forecasts materialize, global meal/cakes
production could expand by at least 6 percent, rising for
the second consecutive year and setting a new record.
Production growth will again be driven by soy: mirroring
record harvests, incremental soymeal output is estimated at
5 million tonnes (expressed in protein equivalent). Sizeable
increases are also projected for rape and sunflower meal.
Also global oilmeal supplies (which comprise 2013/14
production and 2012/13 carry-out stocks) are forecast
to climb to a new record, exceeding last year’s level by
almost 6 percent. The world three leading meal producers,
Argentina, Brazil and the United States, would account
for a large part of total expansion. In the United States,
domestic availability is anticipated to recover from recent
drops, though it will still fall short of past record levels.
Sizeable expansions are also likely in Canada, the EU, the
Russian Federation and Ukraine. All these improvements
would primarily result from good harvests although, in
Argentina and Brazil, higher carry-in stocks are also playing
a role. By contrast, in China, domestic supplies could
diminish significantly compared to last year, mainly because
of a sizeable reduction in carry-in stocks.
Growth in meal consumption to accelerateFollowing subdued growth of less than 2 percent in the last
two seasons, world meal consumption is forecast to expand
by 3–4 percent in 2013/14. Current forecasts are based on
growing demand by the livestock sector that will arise from
further economic growth in a number of countries and
on the likely softening in international meal prices. At the
same time, however, ample global maize availabilities are
expected to dampen growth in global meal demand.
Mirroring this season’s supply forecasts, consumption
growth will be led by soymeal, followed by rape and
sunflower meal. Developing countries should contribute
strongly to total growth, with countries in Asia playing
a dominant role. In China, consumption is projected to
expand by about 4–5 percent, less than in recent years,
reflecting a relatively weak projected expansion in domestic
pig and, especially, poultry production. Among developed
countries, aggregate consumption may recover only in
part from the sizeable fall recorded last season. Especially
in the EU and the United States, consumption levels are
expected to remain well below their respective historic
5 This section refers to meals from all origins. In addition to products derived from the oil crops discussed under the section on oilseeds, this also includes fish meal and meals of animal origin.

37FOOD OUTLOOKMAY 2014
OILC
RO
PS, O
ILS AN
D M
EA
LS
Figure 11. World stocks and ratios of meals/cakes (in protein equivalent and including the meal contained in seeds stored)
0
7
14
21
28
2013/142012/132011/122010/112009/100
5
10
15
20
Million tonnes Percent
Major Exporters Rest of the World
World Stock-to-use ratioStock-to-disappearance ratio of Major Exporters
estim. f’cast
Figure 10. Global production and utilization of meals/cakes (in protein equivalent)
-8
-4
0
4
8
90
100
110
120
130
2013/142012/132011/122010/112009/10
Million tonnes Million tonnes
estim. f’cast
Balance (production minus utilization, right axis)
Production (left axis) Utilization (left axis)
peaks. Given record high export commitments, a further
fall in the United States domestic consumption seems likely.
Strong recovery in meal inventories possibleGlobal meal production is forecast to surpass consumption
by 5 million tonnes (in protein equivalents), or 4 percent,
as opposed to only 1 percent last season. Such production
surplus would facilitate a pronounced replenishment of
inventories, with global meal stocks (including the meal
contained in stored oilseeds) increasing by a whopping
21 percent. The build-up in inventories is to be attributed
partly to the large availability of maize, which competes
with oilmeals in the international market. The stock build-
Figure 12. Meals/cake imports by region or major country (in protein equivalent and including the meal contained in seed imports)
0
7
14
21
28
2013/142011/122009/102007/082005/06
Latin America Asia excl. China (total) Europe
China (total)
Million tonnes
United States & Canada Africa
f’cast
up will be concentrated in selected exporting countries,
especially Argentina and Brazil, but also Canada and
the Russian Federation. In Argentina, the surge in
stocks is partly related to the farmers’ tendencies to store
a significant portion of their crop on-farm as a hedge
against rising inflation and currency instability. Conversely,
in the United States, the world’s second most important
supplier of meals, inventories could shrink despite improved
domestic production, given the country’s record export
commitments.
Based on the current estimates, both the global stock-
to-use ratio and the major exporters stock-to-disappearance
ratio would improve significantly in 2013/14. In fact, the
global stock-to-use ratio is to rise to a 3-year high, which
should provide scope for international meal prices to
soften. However, prices will likely begin relaxing only after
the South American soybean crops become available in the
market, i.e. from April/May onward. Until then, the United
States’ tight supply situation is likely to keep prices under
upward pressure.
Global meal trade expected to resume growthAfter last season’s dismal growth, world trade in meals/
cakes – including the meal contained in traded oilseeds – is
projected to rise to an all-time high in 2013/14, exceeding
last season’s level by about 9 percent.
Similar to past years, much of the expansion in
world imports of meals will originate in China and other
developing countries in Asia. After last season’s exceptional
slowdown, China’s imports are estimated to rise by a
stunning 16 percent, underpinned by a further expansion

Ma
rke
t a
sse
ssm
en
ts
38 FOOD OUTLOOKMAY 2014
Figure 13. Meal/cake exports by major exporters (in protein equivalent and including the meal contained in seed exports)
0
5
10
15
20
252012/13 estimate
2013/14 forecast
Million tonnes
UnitedStates
Canada India ParaguayArgentina Brazil
in local crushing capacity. With soybean imports tentatively
estimated at a record 69 million tonnes (the equivalent of
54 million tonnes of soymeal), China remains the world’s
top meal buyer. In the rest of Asia, aggregate imports are
seen expanding by 5–6 percent. EU meal imports could
resume growth after two successive years of decline,
although ample supplies of attractively priced feed grains
are likely to dampen the increase in import demand for
oilmeals.
Export growth will be concentrated in the United
States and South America and primarily concern soybean
meal. In the United States, where shipments have
advanced at a record pace, total exports could exceed
last season’s level by 5.8 million tonnes (including the
meal contained in oilseed sales). In order to meet internal
demand, the United States may even have to resort to
importing an unprecedented level of 1.7–1.8 million
tonnes of soybeans. Exports by Argentina and Brazil are
projected to expand by about 2.9 million tonnes each.
In Brazil, record shipments – made possible by improved
port logistics – may confirm the country as the leading
supplier in global trade, whereas, in Argentina, exports
could fall short of past records, given farmers’ slower than
usual release of soybeans into the market. In Paraguay,
an only modest expansion in shipments is expected due
to recent downward adjustments in harvest estimates.
Global exports of sunflower meal are set to climb to a new
record, boosted by increased availabilities in Ukraine and
the Russian Federation. By contrast, global shipments of
rapeseed meal should expand less than originally forecast
because of the logistical difficulties encountered in Canada
and because of Australia’s poor crop outturn.
2014/15 PRODUCTION OUTLOOK
With the 2013/14 season still on-going, it is too early to
draw world supply and demand projections for 2014/15.
The only preliminary, incomplete information that can
be provided concerns planting intentions in the Northern
Hemisphere, where preparations for the next campaign are
about to start.
In general, relatively firm oilseed prices should underpin
plantings of crops for collection in 2014/15. In particular,
continued tightness in the United States’ soybean balance
is likely to stimulate global soybean sowings. First estimates
for the United States point to a further expansion in
soybean cultivation, mostly at the expense of maize. With
the soybean/maize price ratio (CBOT September contract)
ranging between 2.3 and 2.5 since the end of last year,
farmers expect better returns from soybeans than maize.
A tentative 6.5 percent increase in area planted, together
with on-trend yield levels, would lift the United States’
soybean production to almost 97 million tonnes, 8 percent
above the current season’s estimate. Elsewhere, a recovery
in production seems likely in India, assuming normal
weather conditions, whereas China’s gradual production
decline is expected to continue. Later this year, a further
increase in plantings appears probable in South America,
although rising expenses for plant protection could lower
the rate of expansion below last year’s. Overall, another
sizeable increase in global soybean output of about 5
percent could be achieved.
With regard to rapeseed, a contraction in production
appears inevitable in both Canada and India, unless last
year’s optimal weather conditions recur. In Australia,
the latest reported planting and yield estimates point to
Figure 14. Soybean/maize price ratio (CBOT September 2014 futures contract)
2.1
2.2
2.3
2.4
2.5
2.6
2.1
2.2
2.3
2.4
2.5
2.6
J A OS N D J F M A2013 2014
From a historical perspective, in the USA, whenever the ratioenters the 2.3–2.5 range, the general bias favours soybean overmaize, resulting in a shift of planted area from maize to soybeans.

39FOOD OUTLOOKMAY 2014
OILC
RO
PS, O
ILS AN
D M
EA
LS
a further slide in rapeseed production. Global production
may still turn out close to this season’s record level, thanks
to above-average plantings and mostly favourable weather
conditions prevailing in the EU, China and Eastern Europe.
For sunflowerseed, production could increase again this
year, with a further expansion in plantings boosting
production in Ukraine and the Russian Federation,
provided weather conditions remain favourable and barring
further escalation in the ongoing geopolitical conflicts. Also
in the United States and Argentina, prospective yield
recoveries could lead to higher production. By contrast in
the EU, production may fall. The global production outlook
for palm oil remains uncertain, given the possible prolonged
effects of unfavourable weather conditions earlier this year
on the performance of palm trees in Southeast Asia. The
possibility of an El Niño weather event developing during
the second half of this year creates additional uncertainty.
Together, the above forecasts point to a further, albeit
more moderate, rise in total production of oilseeds and
oilcrop products in 2014/15, which could pave the way for
an increasingly comfortable supply and demand situation –
including in the United States.

Ma
rke
t a
sse
ssm
en
ts
40 FOOD OUTLOOKMAY 2014
Major Sugar Exporters and Importers
Major ExportersMajor Importers
Figure 1. International sugar prices*
12
17
22
27
32
2012
2013
2014
2011
US cents per lb.
DNOSAJJMAMFJ
* As measured by the International Sugar Agreement (ISA)
Figure 2. Ethanol vs. sugar prices in Brazil in raw sugar equivalent
10
20
30
40
50
20142013201220112010
US cents per lb.
Anhydrous ethanol price
World raw sugar price
SUGAR
PRICES
Sugar prices strengthen on lower than expected production surplus for 2013/14 seasonInternational sugar prices, as measured by the ISA daily
prices for raw sugar, followed a declining trend at the
beginning of 2013, continuing the steady fall that had
characterized the market since 2011. The slide is attributed
to a large expansion of production between 2008/09
and 2010/11. Prices averaged US 18.02 cents per pound
between January and June 2013, a decrease of 20 percent
from the same period in 2012. However, by September
2013, prices had moved upward, following reports that
unfavourable weather constrained sugarcane harvesting
operations in the Centre-South region of Brazil, the world’s
largest sugar producer. Prices reached an average of US
18.66 cents per pound in October, before commencing a
downward trend to reach an average US 15.62 cents per
pound in January 2014. Since then, prices have recovered

41FOOD OUTLOOKMAY 2014
SUG
AR
Figure 4. Sugar production in India
0
10
20
30
2013/142012/132011/122010/112009/10
Million tonnes
f’castestim.
Figure 3. Sugar production by major producing countries
0
15
30
45
2012/13 estimate
2013/14 forecast
Million tonnes
USAMexicoIndia BrazilChina Thailand EU
slightly, as a severe drought affected sugarcane crop
development in Brazil. Between January and March 2014,
international sugar prices averaged US 16.70 cents per
pound, about 10 percent less than in the same period
in 2013. Early indications of a smaller global production
surplus for the 2014/2015 season could limit further
price declines, although the plentiful global inventories
accumulated over the past few years will reduce the scope
for large gains in world sugar quotations.
PRODUCTION1
World sugar production to decline marginally in 2013/14With most of the 2013/14 sugarcane and sugar beet crops
already harvested in the main producing areas, FAO’s
current estimate for world sugar production in 2013/14
stands at 182 million tonnes, relatively unchanged from
the November 2013 forecast, and 0.2 percent below the
2012/13 season. Downward revisions in output, mainly
for Brazil, India and the EU, were largely offset by
upward revisions for Thailand and Pakistan. Developing
countries are forecast to harvest 141.4 million tonnes,
1.2 percent more than in 2012/13, led by large increases
in Thailand and Pakistan, while output in developed
countries is anticipated to contract by 5.0 percent to 41
million tonnes, led by the Russian Federation and the EU.
Despite the expected fall, the first one since 2008, global
sugar production is anticipated to surpass consumption
by 4.1 million tonnes. As a result, world sugar stocks are
likely to benefit and stand above their 10-year average.
Preliminary forecasts for the 2014/15 season indicate the
possibility of a reduction in the production surplus, as sugar
crop areas contract on the back of relatively low sugar
returns.
In South America, production is expected to remain
close to last year, amid generally unfavourable weather
conditions, notably in Brazil. In fact, Brazil’s sugar output
will decline as a result of extreme drought conditions in
early 2014, which are expected to affect sugarcane yields.
The country’s production is now estimated at 39.7 million
tonnes, 300 000 tonnes below the volumes reached
in 2012/13. However, it is uncertain how much of the
sugarcane harvested will be diverted to ethanol production.
Brazil’s sugar output is influenced by changes in the
ethanol/sugar price ratio, which eventually determines
how much of the two products will be produced out
of sugarcane. The higher the price ratio, the larger the
amount of cane converted into ethanol at the expense
of sugar. Given that the ethanol returns to sugar have
recently strengthened and that Brazil’s mandatory amount
of ethanol to be blended into gasoline has been raised
back to 25 percent, after it had been cut to 20 percent in
October 2011, it is now expected that sugarcane harvest
will be split about equally between the two products. On
the other hand, sugar production is expected to increase in
Colombia, the second largest producer in the region, and
in Argentina, despite unfavourable growing conditions in
the main producing region of Tucuman.
In Central America and the Caribbean, estimates for
2013/14 indicate that sugar production in Mexico will
decline, due to the large supply availabilities in 2012/13
1 Sugar production figures refer to centrifugal sugar derived from sugar cane or beet, expressed in raw equivalents. Data relate to the October/September season.
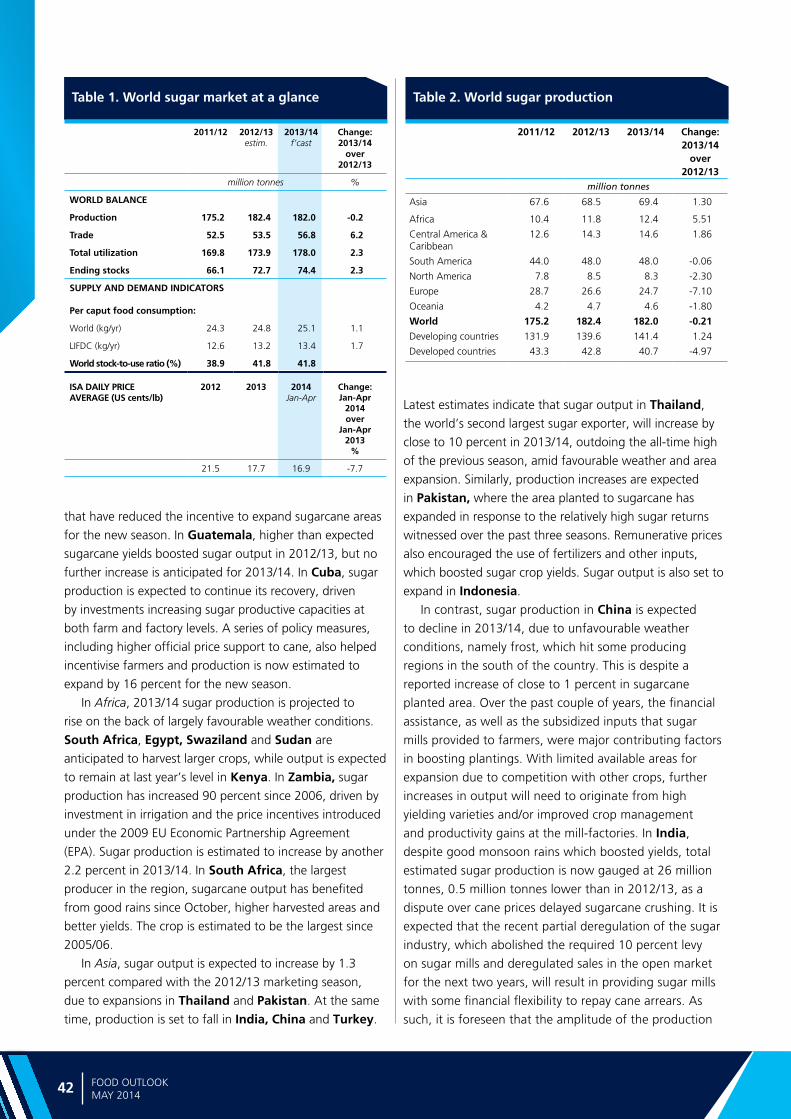
Ma
rke
t a
sse
ssm
en
ts
42 FOOD OUTLOOKMAY 2014
Table 1. World sugar market at a glance Table 2. World sugar production
2011/12 2012/13 2013/14 Change: 2013/14
over 2012/13
million tonnes
Asia 67.6 68.5 69.4 1.30
Africa 10.4 11.8 12.4 5.51
Central America & Caribbean
12.6 14.3 14.6 1.86
South America 44.0 48.0 48.0 -0.06
North America 7.8 8.5 8.3 -2.30
Europe 28.7 26.6 24.7 -7.10
Oceania 4.2 4.7 4.6 -1.80
World 175.2 182.4 182.0 -0.21
Developing countries 131.9 139.6 141.4 1.24
Developed countries 43.3 42.8 40.7 -4.97
that have reduced the incentive to expand sugarcane areas
for the new season. In Guatemala, higher than expected
sugarcane yields boosted sugar output in 2012/13, but no
further increase is anticipated for 2013/14. In Cuba, sugar
production is expected to continue its recovery, driven
by investments increasing sugar productive capacities at
both farm and factory levels. A series of policy measures,
including higher official price support to cane, also helped
incentivise farmers and production is now estimated to
expand by 16 percent for the new season.
In Africa, 2013/14 sugar production is projected to
rise on the back of largely favourable weather conditions.
South Africa, Egypt, Swaziland and Sudan are
anticipated to harvest larger crops, while output is expected
to remain at last year’s level in Kenya. In Zambia, sugar
production has increased 90 percent since 2006, driven by
investment in irrigation and the price incentives introduced
under the 2009 EU Economic Partnership Agreement
(EPA). Sugar production is estimated to increase by another
2.2 percent in 2013/14. In South Africa, the largest
producer in the region, sugarcane output has benefited
from good rains since October, higher harvested areas and
better yields. The crop is estimated to be the largest since
2005/06.
In Asia, sugar output is expected to increase by 1.3
percent compared with the 2012/13 marketing season,
due to expansions in Thailand and Pakistan. At the same
time, production is set to fall in India, China and Turkey.
Latest estimates indicate that sugar output in Thailand,
the world’s second largest sugar exporter, will increase by
close to 10 percent in 2013/14, outdoing the all-time high
of the previous season, amid favourable weather and area
expansion. Similarly, production increases are expected
in Pakistan, where the area planted to sugarcane has
expanded in response to the relatively high sugar returns
witnessed over the past three seasons. Remunerative prices
also encouraged the use of fertilizers and other inputs,
which boosted sugar crop yields. Sugar output is also set to
expand in Indonesia.
In contrast, sugar production in China is expected
to decline in 2013/14, due to unfavourable weather
conditions, namely frost, which hit some producing
regions in the south of the country. This is despite a
reported increase of close to 1 percent in sugarcane
planted area. Over the past couple of years, the financial
assistance, as well as the subsidized inputs that sugar
mills provided to farmers, were major contributing factors
in boosting plantings. With limited available areas for
expansion due to competition with other crops, further
increases in output will need to originate from high
yielding varieties and/or improved crop management
and productivity gains at the mill-factories. In India,
despite good monsoon rains which boosted yields, total
estimated sugar production is now gauged at 26 million
tonnes, 0.5 million tonnes lower than in 2012/13, as a
dispute over cane prices delayed sugarcane crushing. It is
expected that the recent partial deregulation of the sugar
industry, which abolished the required 10 percent levy
on sugar mills and deregulated sales in the open market
for the next two years, will result in providing sugar mills
with some financial flexibility to repay cane arrears. As
such, it is foreseen that the amplitude of the production
2011/12 2012/13 estim.
2013/14 f’cast
Change: 2013/14
over 2012/13
million tonnes %
WORLD BALANCE
Production 175.2 182.4 182.0 -0.2
Trade 52.5 53.5 56.8 6.2
Total utilization 169.8 173.9 178.0 2.3
Ending stocks 66.1 72.7 74.4 2.3
SUPPLY AND DEMAND INDICATORS
Per caput food consumption:
World (kg/yr) 24.3 24.8 25.1 1.1
LIFDC (kg/yr) 12.6 13.2 13.4 1.7
World stock-to-use ratio (%) 38.9 41.8 41.8
ISA DAILY PRICE AVERAGE (US cents/lb)
2012 2013 2014 Jan-Apr
Change: Jan-Apr
2014 over
Jan-Apr 2013
%
21.5 17.7 16.9 -7.7

43FOOD OUTLOOKMAY 2014
SUG
AR
cycles which characterize the sugar subsector in India
will diminish over the coming years. Output in 2013/14 is
also likely to fall in Turkey, mainly due to a reduction in
planted beet areas following a cut in quota allocations for
the new season.
In Europe, the latest estimates for the EU point to a
decrease in sugar production, as unfavourable weather
conditions hampered beet yields, notably in France, Germany and Poland. Total beet area also is reportedly
down, with significant decreases in Germany and Italy.
As expected, the EU Commission, Parliament and Council
came up with a compromise solution in June for the
2014–2020 Common Agriculture Policy. This included
the elimination of sugar production quotas and of the
minimum sugar beet prices as of September 2017. With the
removal of the production quotas, the EU is projected to
become more self-sufficient in sugar in the medium-term.
The impact of the abolition of sugar quotas on the EPAs
and EBA countries is still uncertain and further analysis is
warranted.
Production in 2013/14 is expected to fall significantly
in the Russian Federation, as a result of the decision
by farmers not to expand area, given the scarcity of
storage facilities and limited processing capacity – this
caused problems to the Federation in 2011/12, when it
harvested a record-level crop. Also, an increase in the
area planted to grains at the expense of beet explains
the reported fall of 21 percent in beet planted area.
Sugar production is also expected to contract sharply in
Ukraine, where cultivated area is reportedly significantly
lower than last year. Ample supplies in 2012/13 against
limited processing capacity led farmers to substitute grains
for beet, which is less profitable than alternative crops
such as maize, sunflower and wheat. In Australia, sugar
output is projected to decline by 2.2 percent following
floods and the spread of canopy disease which impacted
plantings. Nonetheless, the weakening of the Australian
dollar against the US dollar has so far helped boost sugar
producer returns in local currency.
In the rest of the world, production in the United States is forecast to fall from its 2012/13 level, as ample
supplies have put pressure on domestic sugar prices.
The United States stock-to-use ratio is projected at 22.6
percent in 2013/14, well above the historical level of 14.5
percent. In order to sustain prices to the loan-level price
guaranteed to sugar producers, the USDA purchased
sugar and re-sold it at a loss to bioenergy producers
as part of the Feedstock Flexible Program (FFP). The
oversupply condition that prevailed in 2012/2013 season
led processors to forfeit sugar, a situation that had not
occurred in a decade.
UTILIZATION
Falling domestic sugar prices to support growth in consumption Global sugar consumption is anticipated to reach 178
million tonnes in 2013/14, 4 million tonnes, or 2.3 percent,
more than in 2012/13, in line with the 10-year trend.
Large supply availabilities, notably in Thailand, and
lower international and domestic prices are expected to
support increases in per capita sugar intake in 2013/14.
Falling domestic sugar prices were recorded in major
markets, including Brazil, India, China and the NAFTA
region. Under current prospects, world per capita sugar
consumption is to rise slightly, from 24.8 kg in 2012/13
to 25.1 kg in 2013/14. In developing countries, aggregate
sugar utilization is estimated to expand by 3.7 million
tonnes, to 127 million tonnes, equivalent to 71 percent of
global consumption. In the generally more mature markets
of the developed countries, consumption is to increase by
0.6 percent to 51 million tonnes, underpinned by higher
consumption in the United States, prompted by greater
use of sugar for ethanol production under the Feedstock
Flexible Program.
Improved 2013/14 global economic prospects, especially
in developing countries, could boost further demand,
as manufacturing and food preparation sectors, which
account for the bulk of aggregate sugar consumption, are
highly influenced by the economic environment. However,
the depreciation of the currency of several major sugar
importers against the US dollar – which makes imports in
domestic currency more expensive – could lead to weaker
intake of sugar in net importing countries, which include
Indonesia, the Russian Federation, Egypt, Syrian Arab
Republic and Japan.
TRADE
Trade to expand significantly in 2013/14 The forecast for world sugar trade in 2013/14 (October/
September) stands at 56.8 million tonnes, a 6.2 percent
increase over the previous season. The main feature of
sugar trade in the 2013/14 season is the greater availability
of supplies in the main traditional origins, including
Thailand, Australia and India. Although exporting less
than in 2012/13, Brazil is expected to supply 45 percent
of world trade in 2013/14. However, the final volume
it sells abroad will depend on the quantity of sugarcane
production processed into ethanol, especially considering
the recent increase in the country mandated blend ratio
and gasoline prices. Demand for ethanol will also be driven
by the need of the United States to meet its advanced

Ma
rke
t a
sse
ssm
en
ts
44 FOOD OUTLOOKMAY 2014
Figure 5. Sugar stocks and ratios
0
30
60
90
2013/142012/132011/122010/112009/1015
25
35
45
Million tonnes Percent
Major Exporters Rest of the World
World Stock-to-use ratioStock-to-disappearance ratio of Major Exporters
estim. f’cast
mandate requirements through imported ethanol-based
sugarcane from Brazil. Also, a further depreciation of the
Brazilian real against the US dollar could stimulate the
country exports beyond the current forecasts.
The second largest world exporter, Thailand, is expected
to expand sugar deliveries by as much as 0.7 million tonnes
amid ample domestic supplies and competitive export pricing.
The bulk of the country’s export is forecast to be shipped
in raw form (about 60 percent) to neighbouring countries,
including Indonesia, Malaysia and the Republic of Korea.
Exports to China are expected to increase, to compensate the
fall in Chinese production. Thailand is also projected to fill its
2014 tariff rate quota (TRQ) of 15 027 metric tonnes (raw
value) with imports into the United States.
Despite an estimated decline in sugar output, shipments
from India are estimated to reach 2 million tonnes, up
1.3 million tonnes from last season, amid large inventories
and the newly introduced export subsidy programme.
India’s competitiveness on the international market is being
constrained by rising production costs and falling world
prices, which may limit further gains in world markets.
Deliveries from Australia, the world’s third largest supplier
in 2012/13, are set to rise to just below the country’s
historic high of 3.61 million tonnes, supported by greater
exportable surplus. The weakness of the Australian dollar
with respect to the US dollar is also likely to benefit exports.
South Africa is likewise expected to sell more, following a
larger harvest, with the bulk of shipments directed to the
Southern Africa Customs Union (SACU) market, and to the
United States to fill its 2014 TRQ allocation.
Exports by Guatemala are foreseen to be larger than last
year by close to 6 percent, given ample supply availabilities
and competitive pricing. Sugar has become a key source
of foreign exchange earnings for the country, with large
investments targeting refined sugar export markets, especially
in the United States, the Republic of Korea and Canada,
the main destinations of Guatemala’s sugar outflow. The
country is now the fifth largest global sugar exporter. Sales by
Mexico are anticipated to increase in 2013/14, despite lower
production, owing to ample inventories. The Government of
Mexico recently established a trust fund to facilitate exports
of sugar surplus to NAFTA and international markets, in an
attempt to lift internal prices. Aside from the United States
market, other destinations for sugar export from Mexico
include Canada, Burkina Faso, Columbia, Chile and the
Netherlands. However, the final amount of shipped sugar
will depend on the realized production for 2013/14 and the
extent to which high fructose corn syrup (HFCS) substitutes
for domestic sugar use. Production gains are also anticipated
to enable Cuba to boost exports by 8 percent, with about
0.4 million tonnes directed to China, as part of an export
agreement between the two countries.
Imports by Asian countries are forecast to expand
in 2013/14 by 2.2 million tonnes, as a result of falling
international prices and steady growth in domestic demand.
Much of the increase would stem from higher purchases
by Indonesia and China, underpinned by a steady
demand from the food and beverages industry and lower
international prices. In 2013/14, Indonesia is expected to
become the world largest sugar importer, with volumes
reaching 5.4 million tonnes, closely followed by China.
Similarly, in Europe, shipments to the EU are forecast
to rise due to a contraction in domestic sugar production.
EU’s imports might need to be revised upwards following
the conclusion in 2013 of a free trade agreement between
the EU, Colombia, Peru and six central American countries,
namely Costa Rica, El Salvador, Guatemala, Honduras,
Nicaragua and Panama. These free trade agreements will
allow an additional volume of 264 000 tonnes of sugar to
enter the EU duty-free under TRQs and to increase at an
annual rate of 3 percent. As a result of falling domestic
production, imports by the Russian Federation, once
the world’s largest sugar market, are expected to rise
from 900 000 tonnes in 2012/13 to 1.6 million tonnes
in 2013/14, still below the 2.8 million tonnes taken in
2010/11. Likewise, shipments into Turkey are estimated
to increase, while those to Japan, Malaysia and Morocco are projected to fall, given the anticipated improvement in
domestic availabilities.
Imports by African countries are expected to remain
relatively unchanged, in general, given the strong gains
in their sugar output estimated for the 2013/14 season.
In the rest of the world, purchases by the United States, about half of which are managed through a TRQ system of
1.4 million tonnes, may drop somewhat in light of falling
domestic prices and comfortable stock levels.
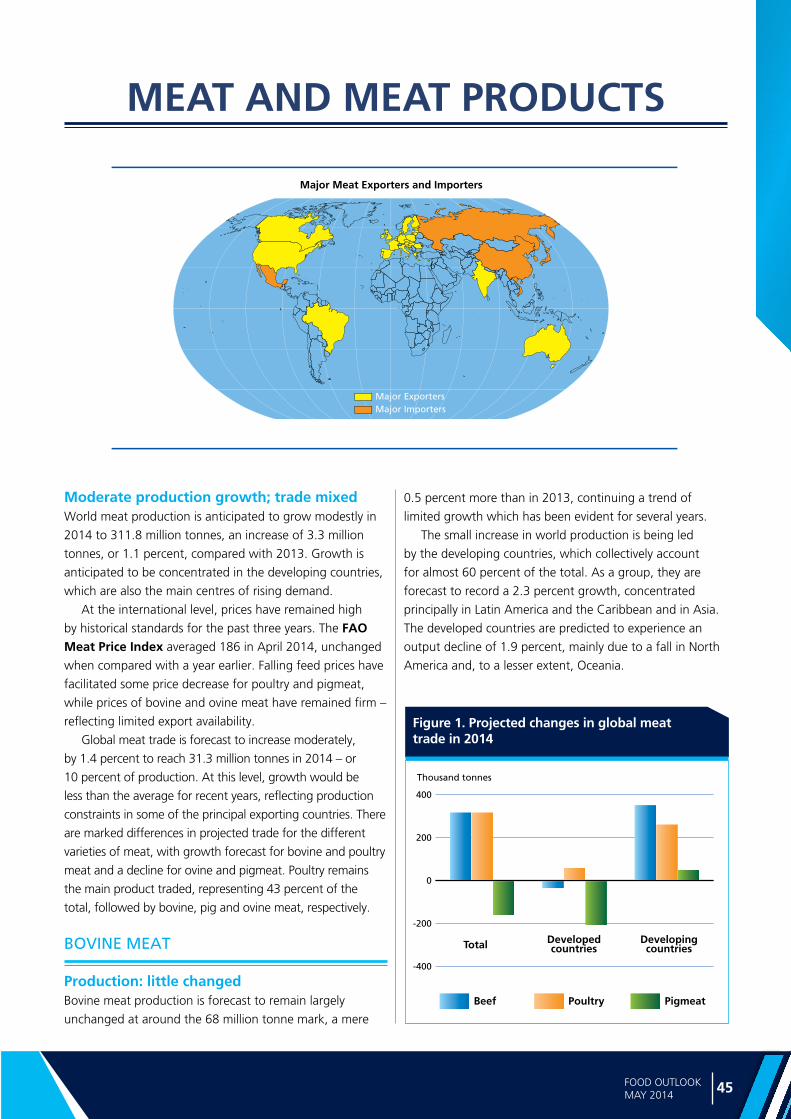
45FOOD OUTLOOKMAY 2014
ME
AT
AN
D M
EA
T P
RO
DU
CT
S
Figure 1. Projected changes in global meat trade in 2014
Major Meat Exporters and Importers
Major ExportersMajor Importers
-400
-200
0
200
400
Thousand tonnes
Beef Poultry Pigmeat
Total Developedcountries
Developingcountries
MEAT AND MEAT PRODUCTS
Moderate production growth; trade mixed World meat production is anticipated to grow modestly in
2014 to 311.8 million tonnes, an increase of 3.3 million
tonnes, or 1.1 percent, compared with 2013. Growth is
anticipated to be concentrated in the developing countries,
which are also the main centres of rising demand.
At the international level, prices have remained high
by historical standards for the past three years. The FAO Meat Price Index averaged 186 in April 2014, unchanged
when compared with a year earlier. Falling feed prices have
facilitated some price decrease for poultry and pigmeat,
while prices of bovine and ovine meat have remained firm –
reflecting limited export availability.
Global meat trade is forecast to increase moderately,
by 1.4 percent to reach 31.3 million tonnes in 2014 – or
10 percent of production. At this level, growth would be
less than the average for recent years, reflecting production
constraints in some of the principal exporting countries. There
are marked differences in projected trade for the different
varieties of meat, with growth forecast for bovine and poultry
meat and a decline for ovine and pigmeat. Poultry remains
the main product traded, representing 43 percent of the
total, followed by bovine, pig and ovine meat, respectively.
BOVINE MEAT
Production: little changedBovine meat production is forecast to remain largely
unchanged at around the 68 million tonne mark, a mere
0.5 percent more than in 2013, continuing a trend of
limited growth which has been evident for several years.
The small increase in world production is being led
by the developing countries, which collectively account
for almost 60 percent of the total. As a group, they are
forecast to record a 2.3 percent growth, concentrated
principally in Latin America and the Caribbean and in Asia.
The developed countries are predicted to experience an
output decline of 1.9 percent, mainly due to a fall in North
America and, to a lesser extent, Oceania.
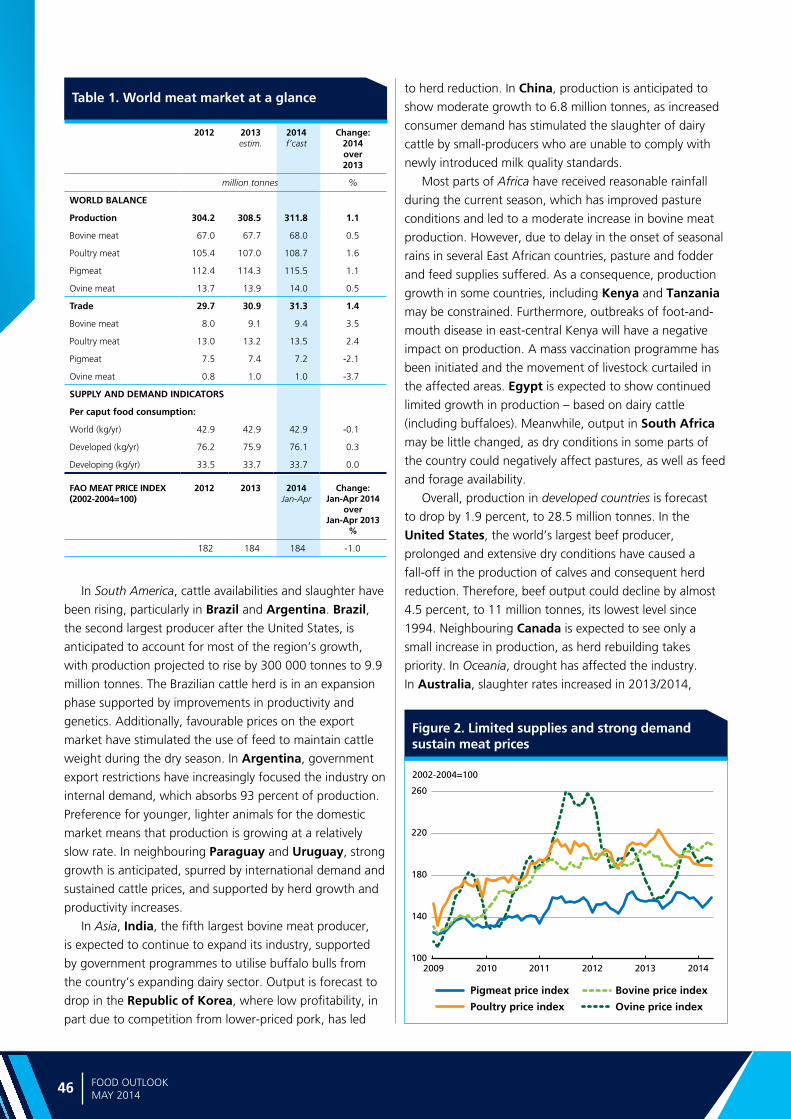
Ma
rke
t a
sse
ssm
en
ts
46 FOOD OUTLOOKMAY 2014
Table 1. World meat market at a glance
Figure 2. Limited supplies and strong demand sustain meat prices
100
140
180
220
260
201420132012201120102009
2002-2004=100
Poultry price index
Pigmeat price index
Ovine price index
Bovine price index
In South America, cattle availabilities and slaughter have
been rising, particularly in Brazil and Argentina. Brazil, the second largest producer after the United States, is
anticipated to account for most of the region’s growth,
with production projected to rise by 300 000 tonnes to 9.9
million tonnes. The Brazilian cattle herd is in an expansion
phase supported by improvements in productivity and
genetics. Additionally, favourable prices on the export
market have stimulated the use of feed to maintain cattle
weight during the dry season. In Argentina, government
export restrictions have increasingly focused the industry on
internal demand, which absorbs 93 percent of production.
Preference for younger, lighter animals for the domestic
market means that production is growing at a relatively
slow rate. In neighbouring Paraguay and Uruguay, strong
growth is anticipated, spurred by international demand and
sustained cattle prices, and supported by herd growth and
productivity increases.
In Asia, India, the fifth largest bovine meat producer,
is expected to continue to expand its industry, supported
by government programmes to utilise buffalo bulls from
the country’s expanding dairy sector. Output is forecast to
drop in the Republic of Korea, where low profitability, in
part due to competition from lower-priced pork, has led
to herd reduction. In China, production is anticipated to
show moderate growth to 6.8 million tonnes, as increased
consumer demand has stimulated the slaughter of dairy
cattle by small-producers who are unable to comply with
newly introduced milk quality standards.
Most parts of Africa have received reasonable rainfall
during the current season, which has improved pasture
conditions and led to a moderate increase in bovine meat
production. However, due to delay in the onset of seasonal
rains in several East African countries, pasture and fodder
and feed supplies suffered. As a consequence, production
growth in some countries, including Kenya and Tanzania may be constrained. Furthermore, outbreaks of foot-and-
mouth disease in east-central Kenya will have a negative
impact on production. A mass vaccination programme has
been initiated and the movement of livestock curtailed in
the affected areas. Egypt is expected to show continued
limited growth in production – based on dairy cattle
(including buffaloes). Meanwhile, output in South Africa may be little changed, as dry conditions in some parts of
the country could negatively affect pastures, as well as feed
and forage availability.
Overall, production in developed countries is forecast
to drop by 1.9 percent, to 28.5 million tonnes. In the
United States, the world’s largest beef producer,
prolonged and extensive dry conditions have caused a
fall-off in the production of calves and consequent herd
reduction. Therefore, beef output could decline by almost
4.5 percent, to 11 million tonnes, its lowest level since
1994. Neighbouring Canada is expected to see only a
small increase in production, as herd rebuilding takes
priority. In Oceania, drought has affected the industry.
In Australia, slaughter rates increased in 2013/2014,
2012 2013estim.
2014f’cast
Change: 2014 over 2013
million tonnes %
WORLD BALANCE
Production 304.2 308.5 311.8 1.1
Bovine meat 67.0 67.7 68.0 0.5
Poultry meat 105.4 107.0 108.7 1.6
Pigmeat 112.4 114.3 115.5 1.1
Ovine meat 13.7 13.9 14.0 0.5
Trade 29.7 30.9 31.3 1.4
Bovine meat 8.0 9.1 9.4 3.5
Poultry meat 13.0 13.2 13.5 2.4
Pigmeat 7.5 7.4 7.2 -2.1
Ovine meat 0.8 1.0 1.0 -3.7
SUPPLY AND DEMAND INDICATORS
Per caput food consumption:
World (kg/yr) 42.9 42.9 42.9 -0.1
Developed (kg/yr) 76.2 75.9 76.1 0.3
Developing (kg/yr) 33.5 33.7 33.7 0.0
FAO MEAT PRICE INDEX(2002-2004=100)
2012 2013 2014 Jan-Apr
Change: Jan-Apr 2014
over Jan-Apr 2013
%
182 184 184 -1.0

47FOOD OUTLOOKMAY 2014
ME
AT
AN
D M
EA
T P
RO
DU
CT
S
as availability of pasture and fodder were reduced. In
2013/14, output is expect to fall by 4 percent, as drought
conditions have persisted in some parts of the country. In
New Zealand, the effects of drought were limited to the
first part of 2013, but still resulted in an increased slaughter
rate and an associated rise in production for the 2012/13
season. Output is expected to contract in 2013/14, as the
sector recovers and herds are rebuilt. The beef industry
in New Zealand is highly dependent on the dairy sector
for slaughter cattle and male calves for fattening. In the
Russian Federation, continued herd reduction is expected
to counterbalance some improvement in productivity, and
output is anticipated to be little changed at 1.6 million
tonnes. In the EU, the world’s third largest beef producer
at 7.4 million tonnes, the long-term reduction in the cattle
herd is slowing which is expected to result in a small rise
in production, with dairy cattle set to increase, while beef
cattle may decline slightly.
Trade: China’s imports expected to grow; Brazil retains premier export positionWorld trade in bovine meat is anticipated to grow by 3.5
percent, to 9.4 million tonnes, despite international prices
being at exceptionally high levels. Consumer demand and
a shortage of domestic supplies in some countries are
important contributors to the expansion in trade.
China, in particular, is expected to record a strong rise
in imports, although not to the same degree as in 2013,
when the doubled. China could buy 1.2 million tonnes
in 2014, 18 percent more than last year, confirming
the country as the main world market for bovine
meat. In China, demand continues to be stimulated by
rising incomes and growth in meals outside the home.
Additionally, some consumers have switched from poultry
to other meats following an outbreak of avian influenza last
year. Elsewhere in Asia, imports by Japan, the Republic of Korea and Malaysia could increase, as domestic
production is forecast to be either stable or, in the case of
Japan and the Republic of Korea, lower. Purchases by the
EU may also rise, as a result of a focus on herd rebuilding.
Imports by the second major market, the United States, are expected to increase by 3.3 percent, to compensate
for reduced domestic production; while those of third-
placed Russian Federation are forecast to change little,
as exceptionally high international prices limit demand. A
number of other important importers, such as Vietnam,
Egypt, Canada and Venezuela may see purchases fall or
stagnate in response to high prices and limited supplies.
Much of the expansion in bovine meat trade is expected
to be met by growing exports from both Brazil and India, by 8 percent and 6 percent, respectively, in response to
strong demand and elevated prices. The same factors may
boost exports by Argentina, Paraguay and Uruguay. On
the other hand, the effects of drought and herd rebuilding
are anticipated to lead to a fall in exports by Australia and
New Zealand, which together account for 20 percent
of world trade. Elsewhere, little change is forecast for
shipments by Canada, the EU, Mexico and the United States.
PIGMEAT
Growth in Asia to sustain production Continuing several years of expansion, production of
pigmeat is expected to grow by 1.1 percent to a record
level of 115.5 million tonnes in 2014, assisted by lower
feed costs. Most of the increase is forecast to come from
developing countries, where over 60 percent of production
originates, but output is also expected to expand in the
developed countries. Asia is the leading pigmeat producing
region, accounting for more than half of the total. Strong
consumer demand and government support policies are
anticipated to boost China’s output by 1.6 percent to
55.7 million tonnes, representing 48 percent of world
output. Elsewhere in Asia, slight to moderate growth is
forecast in Vietnam, the Philippines, Japan, Thailand and Indonesia. In the Republic of Korea, reduced output
is anticipated as a result of a smaller breeding herd and
the introduction of a new grading system that provides
incentives for lowering slaughter weights.
In the Americas, Brazil, the world’s fourth largest
producer, is set to increase output to a record 3.6 million
tonnes, stimulated by improved prices and reduced feed
costs. Steady growth is also anticipated for Mexico, with
output underpinned by improved genetics and productivity,
which are translating into more piglets per litter and higher
animal weights.
Production in the EU, the second most important
producer after China, at 22.8 million tonnes, is expected to
grow only slightly due to limitations imposed by compliance
with animal welfare regulations relating to the housing of
sows. In the United States, which ranks third in world
output, the spread of porcine epidemic diarrhoea (PED),
which causes increased piglet mortality, is projected
to bring about a 1.9 percent fall in output. Canada’s production is forecast to increase only slightly due to some
smaller producers ceasing operations. In the Russian Federation, reduced feed prices and government policies
favouring large-scale farms are expected to prompt a 2.9
percent expansion, building on more than a decade of
growth. Investment in new farms and improved profitability
should also boost production in the Ukraine.
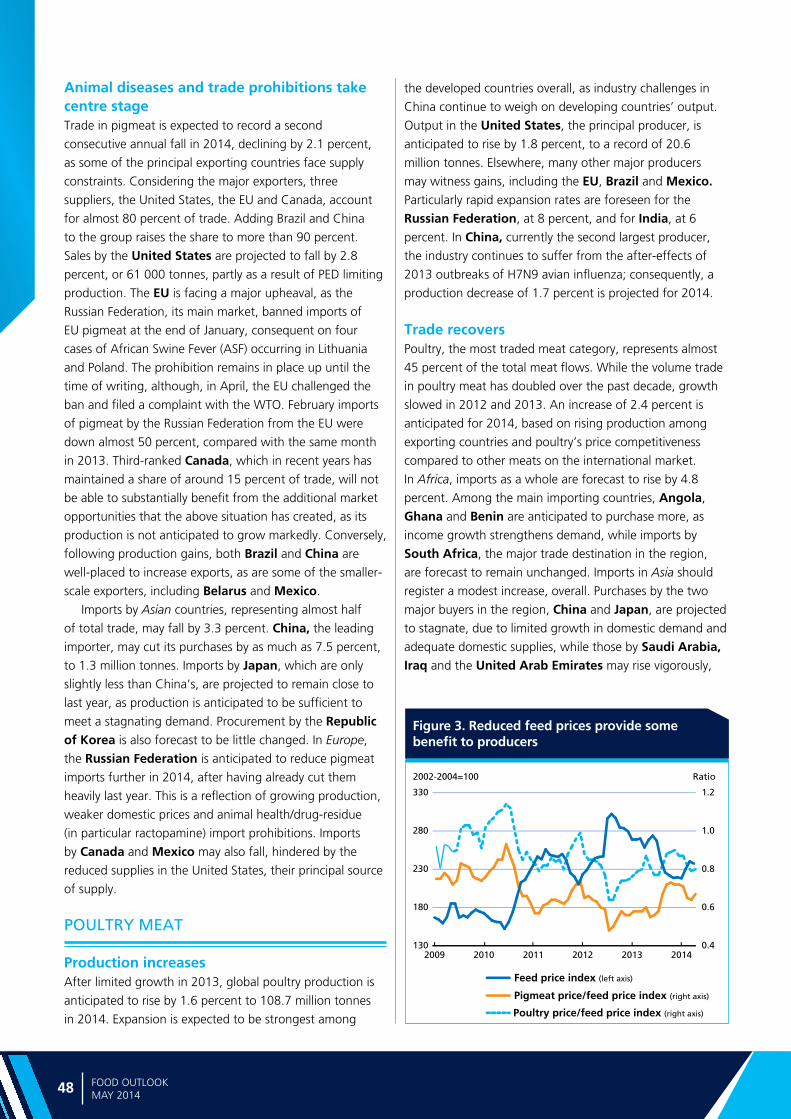
Ma
rke
t a
sse
ssm
en
ts
48 FOOD OUTLOOKMAY 2014
Figure 3. Reduced feed prices provide some benefit to producers
0.4
0.6
0.8
1.0
1.2
130
180
230
280
330
201420132012201120102009
2002-2004=100 Ratio
Feed price index (left axis)
Pigmeat price/feed price index (right axis)
Poultry price/feed price index (right axis)
Animal diseases and trade prohibitions take centre stage Trade in pigmeat is expected to record a second
consecutive annual fall in 2014, declining by 2.1 percent,
as some of the principal exporting countries face supply
constraints. Considering the major exporters, three
suppliers, the United States, the EU and Canada, account
for almost 80 percent of trade. Adding Brazil and China
to the group raises the share to more than 90 percent.
Sales by the United States are projected to fall by 2.8
percent, or 61 000 tonnes, partly as a result of PED limiting
production. The EU is facing a major upheaval, as the
Russian Federation, its main market, banned imports of
EU pigmeat at the end of January, consequent on four
cases of African Swine Fever (ASF) occurring in Lithuania
and Poland. The prohibition remains in place up until the
time of writing, although, in April, the EU challenged the
ban and filed a complaint with the WTO. February imports
of pigmeat by the Russian Federation from the EU were
down almost 50 percent, compared with the same month
in 2013. Third-ranked Canada, which in recent years has
maintained a share of around 15 percent of trade, will not
be able to substantially benefit from the additional market
opportunities that the above situation has created, as its
production is not anticipated to grow markedly. Conversely,
following production gains, both Brazil and China are
well-placed to increase exports, as are some of the smaller-
scale exporters, including Belarus and Mexico.
Imports by Asian countries, representing almost half
of total trade, may fall by 3.3 percent. China, the leading
importer, may cut its purchases by as much as 7.5 percent,
to 1.3 million tonnes. Imports by Japan, which are only
slightly less than China’s, are projected to remain close to
last year, as production is anticipated to be sufficient to
meet a stagnating demand. Procurement by the Republic of Korea is also forecast to be little changed. In Europe,
the Russian Federation is anticipated to reduce pigmeat
imports further in 2014, after having already cut them
heavily last year. This is a reflection of growing production,
weaker domestic prices and animal health/drug-residue
(in particular ractopamine) import prohibitions. Imports
by Canada and Mexico may also fall, hindered by the
reduced supplies in the United States, their principal source
of supply.
POULTRY MEAT
Production increasesAfter limited growth in 2013, global poultry production is
anticipated to rise by 1.6 percent to 108.7 million tonnes
in 2014. Expansion is expected to be strongest among
the developed countries overall, as industry challenges in
China continue to weigh on developing countries’ output.
Output in the United States, the principal producer, is
anticipated to rise by 1.8 percent, to a record of 20.6
million tonnes. Elsewhere, many other major producers
may witness gains, including the EU, Brazil and Mexico. Particularly rapid expansion rates are foreseen for the Russian Federation, at 8 percent, and for India, at 6
percent. In China, currently the second largest producer,
the industry continues to suffer from the after-effects of
2013 outbreaks of H7N9 avian influenza; consequently, a
production decrease of 1.7 percent is projected for 2014.
Trade recoversPoultry, the most traded meat category, represents almost
45 percent of the total meat flows. While the volume trade
in poultry meat has doubled over the past decade, growth
slowed in 2012 and 2013. An increase of 2.4 percent is
anticipated for 2014, based on rising production among
exporting countries and poultry’s price competitiveness
compared to other meats on the international market.
In Africa, imports as a whole are forecast to rise by 4.8
percent. Among the main importing countries, Angola,
Ghana and Benin are anticipated to purchase more, as
income growth strengthens demand, while imports by
South Africa, the major trade destination in the region, are forecast to remain unchanged. Imports in Asia should
register a modest increase, overall. Purchases by the two
major buyers in the region, China and Japan, are projected
to stagnate, due to limited growth in domestic demand and
adequate domestic supplies, while those by Saudi Arabia, Iraq and the United Arab Emirates may rise vigorously,
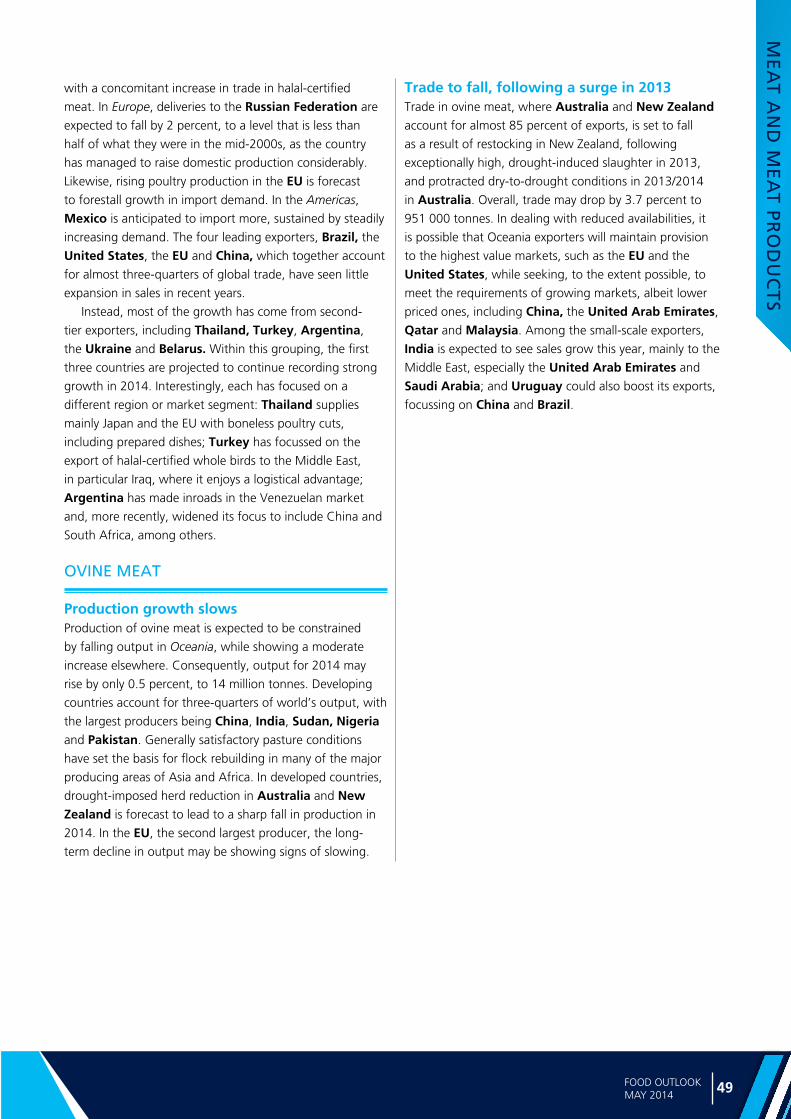
49FOOD OUTLOOKMAY 2014
ME
AT
AN
D M
EA
T P
RO
DU
CT
S
with a concomitant increase in trade in halal-certified
meat. In Europe, deliveries to the Russian Federation are
expected to fall by 2 percent, to a level that is less than
half of what they were in the mid-2000s, as the country
has managed to raise domestic production considerably.
Likewise, rising poultry production in the EU is forecast
to forestall growth in import demand. In the Americas,
Mexico is anticipated to import more, sustained by steadily
increasing demand. The four leading exporters, Brazil, the United States, the EU and China, which together account
for almost three-quarters of global trade, have seen little
expansion in sales in recent years.
Instead, most of the growth has come from second-
tier exporters, including Thailand, Turkey, Argentina,
the Ukraine and Belarus. Within this grouping, the first
three countries are projected to continue recording strong
growth in 2014. Interestingly, each has focused on a
different region or market segment: Thailand supplies
mainly Japan and the EU with boneless poultry cuts,
including prepared dishes; Turkey has focussed on the
export of halal-certified whole birds to the Middle East,
in particular Iraq, where it enjoys a logistical advantage;
Argentina has made inroads in the Venezuelan market
and, more recently, widened its focus to include China and
South Africa, among others.
OVINE MEAT
Production growth slowsProduction of ovine meat is expected to be constrained
by falling output in Oceania, while showing a moderate
increase elsewhere. Consequently, output for 2014 may
rise by only 0.5 percent, to 14 million tonnes. Developing
countries account for three-quarters of world’s output, with
the largest producers being China, India, Sudan, Nigeria and Pakistan. Generally satisfactory pasture conditions
have set the basis for flock rebuilding in many of the major
producing areas of Asia and Africa. In developed countries,
drought-imposed herd reduction in Australia and New Zealand is forecast to lead to a sharp fall in production in
2014. In the EU, the second largest producer, the long-
term decline in output may be showing signs of slowing.
Trade to fall, following a surge in 2013 Trade in ovine meat, where Australia and New Zealand account for almost 85 percent of exports, is set to fall
as a result of restocking in New Zealand, following
exceptionally high, drought-induced slaughter in 2013,
and protracted dry-to-drought conditions in 2013/2014
in Australia. Overall, trade may drop by 3.7 percent to
951 000 tonnes. In dealing with reduced availabilities, it
is possible that Oceania exporters will maintain provision
to the highest value markets, such as the EU and the
United States, while seeking, to the extent possible, to
meet the requirements of growing markets, albeit lower
priced ones, including China, the United Arab Emirates,
Qatar and Malaysia. Among the small-scale exporters,
India is expected to see sales grow this year, mainly to the
Middle East, especially the United Arab Emirates and
Saudi Arabia; and Uruguay could also boost its exports,
focussing on China and Brazil.
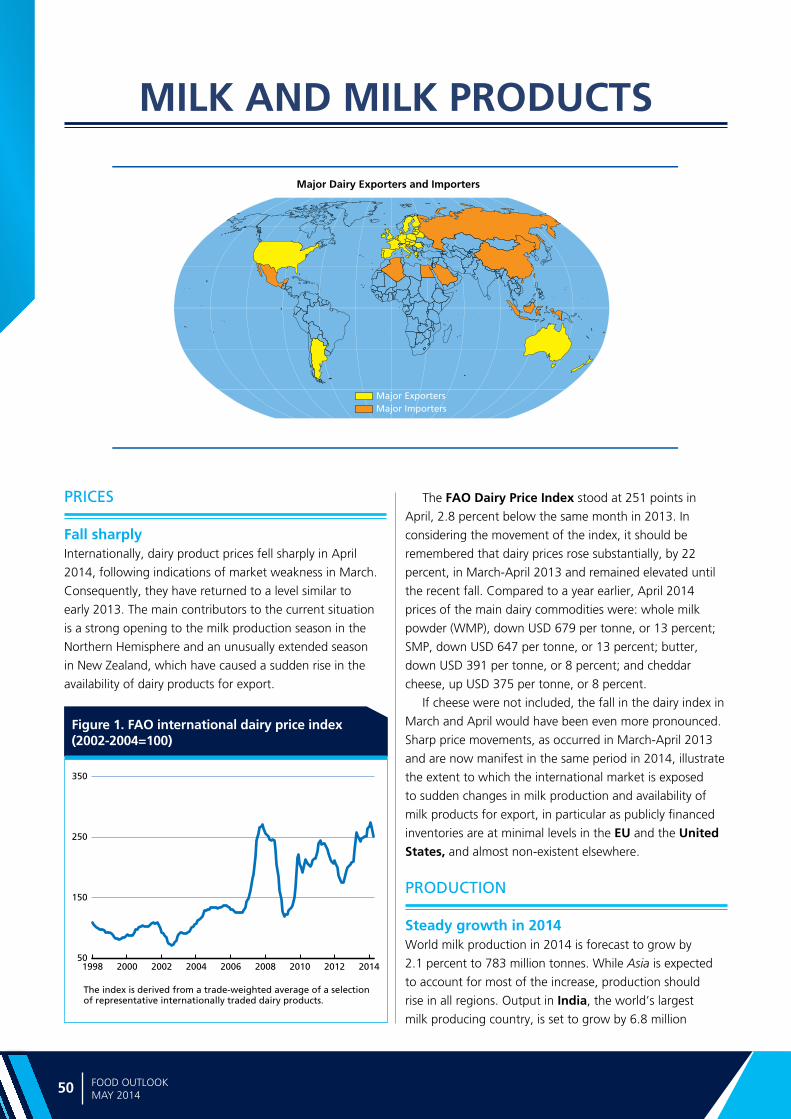
Ma
rke
t a
sse
ssm
en
ts
50 FOOD OUTLOOKMAY 2014
Figure 1. FAO international dairy price index(2002-2004=100)
Major Dairy Exporters and Importers
Major ExportersMajor Importers
50
150
250
350
201420122010200820062004200220001998
The index is derived from a trade-weighted average of a selectionof representative internationally traded dairy products.
MILK AND MILK PRODUCTS
PRICES
Fall sharply Internationally, dairy product prices fell sharply in April
2014, following indications of market weakness in March.
Consequently, they have returned to a level similar to
early 2013. The main contributors to the current situation
is a strong opening to the milk production season in the
Northern Hemisphere and an unusually extended season
in New Zealand, which have caused a sudden rise in the
availability of dairy products for export.
The FAO Dairy Price Index stood at 251 points in
April, 2.8 percent below the same month in 2013. In
considering the movement of the index, it should be
remembered that dairy prices rose substantially, by 22
percent, in March-April 2013 and remained elevated until
the recent fall. Compared to a year earlier, April 2014
prices of the main dairy commodities were: whole milk
powder (WMP), down USD 679 per tonne, or 13 percent;
SMP, down USD 647 per tonne, or 13 percent; butter,
down USD 391 per tonne, or 8 percent; and cheddar
cheese, up USD 375 per tonne, or 8 percent.
If cheese were not included, the fall in the dairy index in
March and April would have been even more pronounced.
Sharp price movements, as occurred in March-April 2013
and are now manifest in the same period in 2014, illustrate
the extent to which the international market is exposed
to sudden changes in milk production and availability of
milk products for export, in particular as publicly financed
inventories are at minimal levels in the EU and the United States, and almost non-existent elsewhere.
PRODUCTION
Steady growth in 2014World milk production in 2014 is forecast to grow by
2.1 percent to 783 million tonnes. While Asia is expected
to account for most of the increase, production should
rise in all regions. Output in India, the world’s largest
milk producing country, is set to grow by 6.8 million

51FOOD OUTLOOKMAY 2014
MILK
AN
D M
ILK P
RO
DU
CT
S
Table 1. World dairy market at a glance
Figure 2. EU intervention prices, price and export refund for butter and skim milk powder
0
1500
3000
4500
1413121110090807060504
SMP (interv. price)
SMP Refund
SMP (export price) Butter (export price)Butter (interv. price)
Butter Refund
Euro per tonne
tonnes to 145 million tonnes. Rising disposable incomes
and population are the two main dynamics behind the
increase in India’s production. Expansion in herd size
as well as improved productivity are important engines
in the expansion. Increased output is also anticipated
in Pakistan and Turkey, spurred by steady growth in
consumer demand while, in the Republic of Korea, output is slowly recovering from the 2011 foot-and-
mouth disease outbreak. Output in China is forecast to
show a modest increase, following a fall of 5.7 percent
in 2013, when a shortage of forage and high beef prices
caused cattle slaughter rates to rise. In Africa, a moderate
increase in milk output is anticipated for 2014, assisted
by generally favourable weather conditions. Expansion
in output is foreseen for Egypt and Morocco. Several
countries in East Africa experienced a delay in the onset of
seasonal rains and pasture and fodder and feed supplies
suffered. As a consequence, production growth in some
countries, including Kenya, Uganda and Tanzania, may
be constrained. Furthermore, outbreaks of foot-and-mouth
disease in east-central Kenya have had a negative impact
on yields. A mass vaccination programme has been initiated
and the movement of livestock curtailed in the affected
areas.
Rising incomes and firm regional and international
demand have favoured dairy production growth in several
countries in Latin America and the Caribbean. Hot and dry
conditions experienced by some southern-cone countries
at the end of 2013 ran over into 2014, stressing pastures.
However, this was followed by abundant rainfall in March
and April. Overall, it is anticipated that pasture condition
2012 2013estim.
2014f’cast
Change: 2014 over 2013
million tonnes %
WORLD BALANCE
Total milk production 762.3 767.2 783.2 2.1
Total trade 65.4 67.9 69.1 1.8
SUPPLY AND DEMAND INDICATORS
Per caput food consumption:
World (kg/yr) 107.7 107.2 108.2 0.9
Developed (kg/yr) 222.7 220.3 223.1 1.3
Developing (kg/yr) 75.3 75.4 76.3 1.1
Trade share of prod. (%) 8.6 8.8 8.8 -0.3
FAO DAIRY PRICE INDEX(2002-2004=100)
2012 2013 2014 Jan-Apr
Change: Jan-Apr 2014
over Jan-Apr 2013
%
194 243 266 17.4
will recover during the year, which could underpin a 1.7
percent rise in subregional milk production, to 68 million
tonnes. Gains are forecast for Brazil, Chile, Colombia, Ecuador, Paraguay and Uruguay, where the overall
positive consumption outlook has stimulated investment
in new technology and improved animal genetics. In
Argentina, production is expected to decrease by 2
percent to 11 million tonnes, in the face of falling domestic
demand and limitations on exports. In Central America,
milk output in Mexico, the largest producer in the
subregion, has been constrained by dry conditions in many
parts of the country, leading to herd reduction and the
withdrawal of a number of small-scale producers from the
industry. Production in Costa Rica is expected to show a
moderate increase.
In North America, milk production in the United States
is forecast to increase by 2.4 percent to 93.6 million tonnes.
Output is recovering from the chronically dry conditions
of the previous two years. Production in Canada is set to
remain stable at 8.4 million tonnes, within the limits set by
the milk quota system.
In Europe, EU milk production on hold is forecast to
grow by 1.5 percent to 158.9 million tonnes, stimulated by
record milk prices, and facilitated by mild weather during
the first months of the year, which favoured pasture. Some
major producing countries within the EU, including France
and the UK, could increase output substantially, as they
are well below their national milk quota. Conversely, a
number of countries, mainly in the northwest of the EU,
are fully utilising quota allowances and can be expected to
increase output further when the quota system is abolished
in 2015. The expansion in 2014 is being facilitated by a
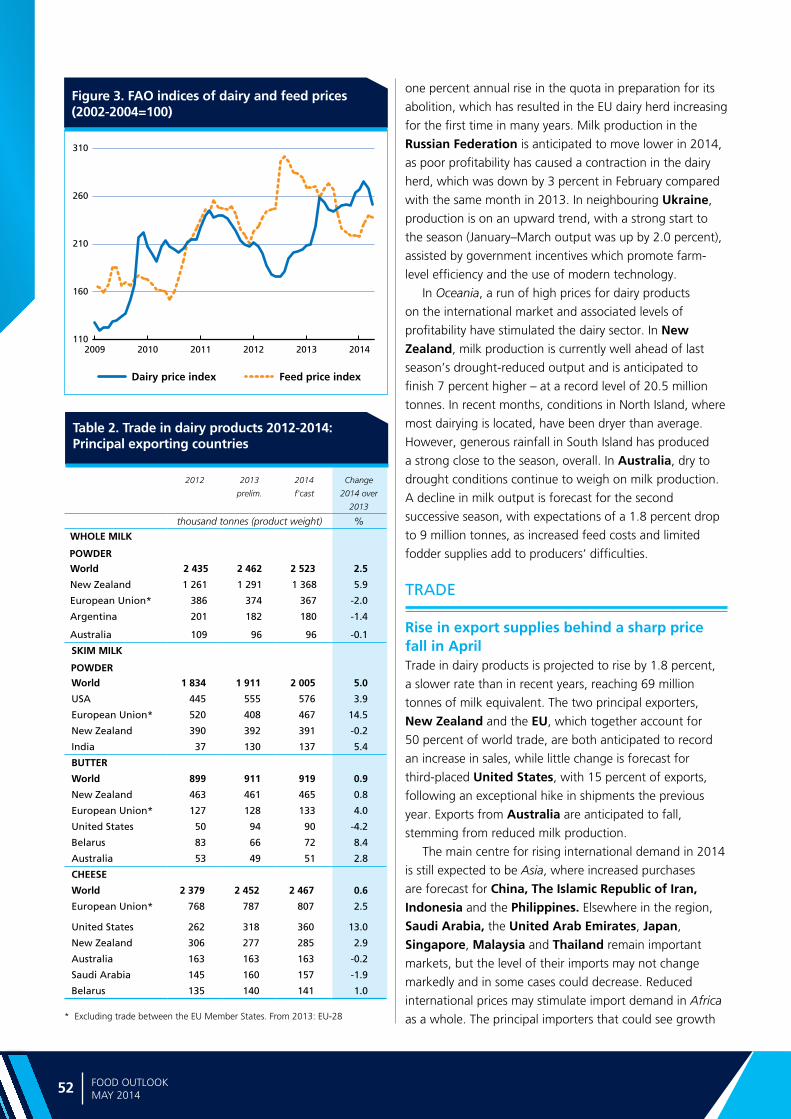
Ma
rke
t a
sse
ssm
en
ts
52 FOOD OUTLOOKMAY 2014
Figure 3. FAO indices of dairy and feed prices (2002-2004=100)
2012 2013
prelim.
2014
f'cast
Change
2014 over
2013
thousand tonnes (product weight) %
WHOLE MILK
POWDER
World 2 435 2 462 2 523 2.5
New Zealand 1 261 1 291 1 368 5.9
European Union* 386 374 367 -2.0
Argentina 201 182 180 -1.4
Australia 109 96 96 -0.1
SKIM MILK
POWDER
World 1 834 1 911 2 005 5.0
USA 445 555 576 3.9
European Union* 520 408 467 14.5
New Zealand 390 392 391 -0.2
India 37 130 137 5.4
BUTTER
World 899 911 919 0.9
New Zealand 463 461 465 0.8
European Union* 127 128 133 4.0
United States 50 94 90 -4.2
Belarus 83 66 72 8.4
Australia 53 49 51 2.8
CHEESE
World 2 379 2 452 2 467 0.6
European Union* 768 787 807 2.5
United States 262 318 360 13.0
New Zealand 306 277 285 2.9
Australia 163 163 163 -0.2
Saudi Arabia 145 160 157 -1.9
Belarus 135 140 141 1.0
Table 2. Trade in dairy products 2012-2014: Principal exporting countries
* Excluding trade between the EU Member States. From 2013: EU-28
110
160
210
260
310
201420132012201120102009
Dairy price index Feed price index
one percent annual rise in the quota in preparation for its
abolition, which has resulted in the EU dairy herd increasing
for the first time in many years. Milk production in the
Russian Federation is anticipated to move lower in 2014,
as poor profitability has caused a contraction in the dairy
herd, which was down by 3 percent in February compared
with the same month in 2013. In neighbouring Ukraine,
production is on an upward trend, with a strong start to
the season (January–March output was up by 2.0 percent),
assisted by government incentives which promote farm-
level efficiency and the use of modern technology.
In Oceania, a run of high prices for dairy products
on the international market and associated levels of
profitability have stimulated the dairy sector. In New Zealand, milk production is currently well ahead of last
season’s drought-reduced output and is anticipated to
finish 7 percent higher – at a record level of 20.5 million
tonnes. In recent months, conditions in North Island, where
most dairying is located, have been dryer than average.
However, generous rainfall in South Island has produced
a strong close to the season, overall. In Australia, dry to
drought conditions continue to weigh on milk production.
A decline in milk output is forecast for the second
successive season, with expectations of a 1.8 percent drop
to 9 million tonnes, as increased feed costs and limited
fodder supplies add to producers’ difficulties.
TRADE
Rise in export supplies behind a sharp price fall in AprilTrade in dairy products is projected to rise by 1.8 percent,
a slower rate than in recent years, reaching 69 million
tonnes of milk equivalent. The two principal exporters,
New Zealand and the EU, which together account for
50 percent of world trade, are both anticipated to record
an increase in sales, while little change is forecast for
third-placed United States, with 15 percent of exports,
following an exceptional hike in shipments the previous
year. Exports from Australia are anticipated to fall,
stemming from reduced milk production. The main centre for rising international demand in 2014
is still expected to be Asia, where increased purchases
are forecast for China, The Islamic Republic of Iran, Indonesia and the Philippines. Elsewhere in the region,
Saudi Arabia, the United Arab Emirates, Japan,
Singapore, Malaysia and Thailand remain important
markets, but the level of their imports may not change
markedly and in some cases could decrease. Reduced
international prices may stimulate import demand in Africa as a whole. The principal importers that could see growth

53FOOD OUTLOOKMAY 2014
MILK
AN
D M
ILK P
RO
DU
CT
S
are Algeria, South Africa and Ghana. Finally, imports
by the Russian Federation are anticipated to increase,
stimulated by strong demand for butter and SMP.
Whole milk powder (WMP) – Prices dive World exports of WMP are projected to rise by 2.5 percent
in 2014 to 2.5 million tonnes. This compares with limited
growth of 1.1 percent in 2013, when a milk production
shortfall constrained trade. Rising world export availabilities
and adequate stocks in China, the main market, caused
WMP prices to fall steeply, reaching USD 4 565 tonnes
in April, 12 percent below their level in January. In 2014,
China is expected to retain its position as the principal
importer of WMP and witness a 7.8 percent expansion in
purchases to 796 000 tonnes – or one-third of total trade.
Elsewhere in Asia, lower prices may stimulate demand
in several major markets, including the United Arab Emirates, Singapore, Oman, Sri Lanka, Indonesia and the Philippines. Additionally, importers in North Africa and
Latin America and the Caribbean, including Algeria and Nigeria, may return more fully to the market. In Brazil, rising domestic production is expected to displace imports.
The market for WMP is very geographically diverse,
stemming from its wide use in both the processing industry
and for direct retail sale. Only New Zealand, among the
principal exporters, with 45 percent of trade, is expected to
increase the level of its sales – by 6 percent to 1.4 million
tonnes. Other members of this group, which comprises
the EU, Argentina and Australia, may reduce deliveries
either because manufacturers find it more profitable to
concentrate on other products, as in the case of the EU,
or due to reduced milk production, for Argentina and
Australia. Some of the smaller-scale exporting countries,
such as Uruguay, Belarus and Costa Rica, may increase
sales.
Skim milk powder (SMP) – Prices declineTrade in SMP is predicted to grow by 5.0 percent to 2
million tonnes, a rate of increase similar to the previous
two years. Along with those of WMP, SMP prices dropped
sharply in April, to USD 4 260 per tonne down 11 percent
from January. SMP is central to the milk processing
industry in many countries and, as such, market demand
is widespread. The principal markets are (in order of
volume) China, Mexico, Indonesia, the Russian Federation, Algeria, the Philippines and Malaysia,
followed by Vietnam, Saudi Arabia, Egypt, Thailand and Singapore. While China is anticipated to remain the
main market, a rise in purchases is also anticipated for
some other major importers, including (in order of volume)
Mexico, Indonesia, the Russian Federation and Algeria.
Over 70 percent of world SMP exports are supplied by
the United States, EU and New Zealand. In 2014, the
first two countries are predicted to increase sales, with the
EU recording the strongest growth, as high butter prices
in domestic markets make it more profitable to produce
SMP/butter than WMP. This tendency is reflected in the EU
export data, which up to February showed a 50 percent
increase over the same period last year. In 2013, India entered the world market for SMP in a significant way,
and its sales leapt 250 percent, to 130 000 tonnes, placing
it fourth by volume among exporters. Trade data for the
first two months show that strong growth has continued
into 2014. India’s SMP exports in 2014 are projected to
expand by 5.7 percent to 137 000 tonnes. Last year, India’s
principal markets were Bangladesh, Egypt, Algeria and Saudi Arabia, with many other countries making
purchases, indicating that India’s exporters are exploring
wide-ranging markets throughout North Africa, the Middle
East and Southeast Asia. Elsewhere, exports by fifth-place
Australia are forecast to be unchanged in the face of
limited milk supplies.
Butter – Prices fall along with powdersTrade in butter is forecast to increase by 0.9 percent to 919
000 tonnes, a rate similar to last year. In April, international
butter prices also moved down sharply, affected by the
fall in milk powders and uncertainty of future sales to the
Russian Federation, the main market. Consequently,
prices for April at USD 4 405 per tonne were 6 percent
less than at the start of the year. Demand for butter comes
mainly from Southeast Asia, the Middle East and the
Russian Federation, although, as with many other milk
products, China has substantially increased purchases in
recent years. Additionally, as a result of trading agreements
and duty-free access for inward processing (where
products are imported duty free for additional processing
and export), the EU is both an important butter importer
(ranking fourth) and exporter (ranking second). Overall,
many of the principal markets, in particular the Russian Federation, China, Saudi Arabia, the EU and the Islamic Republic of Iran, are expected to increase imports in
2014.
Four of the five principal exporters – New Zealand,
the EU, Belarus and Australia – are anticipated to see
a moderate increase in sales in 2014, while those of the
United States could decline. In the case of New Zealand,
trends in WMP prices will influence availability during the
second part of the year, as processors seek to maximise
returns from the new season’s milk production. Price trends
will also determine the extent of United States’ participation
in the international marketplace, as it has the possibility of

Ma
rke
t a
sse
ssm
en
ts
54 FOOD OUTLOOKMAY 2014
either exporting or supplying its domestic market, which
absorbs over 90 percent of production. The same factors
would also apply in the case of the EU, where internal
prices have remained substantially above international
ones, limiting trade potential.
Cheese – Less volatile than other dairy productsWhile affected by the overall decline in dairy commodity
prices, cheese prices in April, at USD 4 875 per tonne,
were 8 percent higher than a year earlier and substantially
above the average for the previous 12 months. This is a
reflection of the fact that, even in the case of a generic
cheese, differences in taste, consumer preference and the
use of branding mean that prices are not as volatile as for
milk powder and butter fat, which are destined mainly
for reconstitution and other processing and, thus, are not
generally visible to the individual consumer. Trade in cheese
is forecast to register limited growth, increasing by 0.6
percent to 2.5 million tonnes.
The international cheese market is the most difficult
dairy market to classify. One apparent anomaly is that
a number of major cheese producing and exporting
countries are also important importers, including (in order
of volume) the United States, Saudi Arabia, the EU, Australia and Switzerland. Most often, purchases by
this group of countries reflect import quotas under trade
agreements and also the highly specific nature of some
cheeses, including those with restrictions on the use of
their names and areas of origin. Another group of the
most significant importing countries, which includes the
Russian Federation, Japan, Mexico, the Republic of Korea, Iraq and, now, China, focuses more on industrial
cheese, both for direct consumption and for use by the
processing industry, although each market has its specific
requirements and preferences. Overall, four importers, the
Russian Federation, Japan, the United States and Saudi Arabia, account for 42 percent of purchases. The EU
remains the major cheese exporter, supplying 33 percent of
world trade, not including the substantial amount of cheese
that is traded among the EU countries themselves. Other
important exporters are the United States, New Zealand, Australia, Saudi Arabia, Belarus, Egypt, Switzerland, Argentina, Turkey and Uruguay. Most of this group
of countries are expected to maintain trade levels slightly
above those of 2013. One exception could be the United States, where limited competition from other countries is
expected to stimulate further growth in exports.
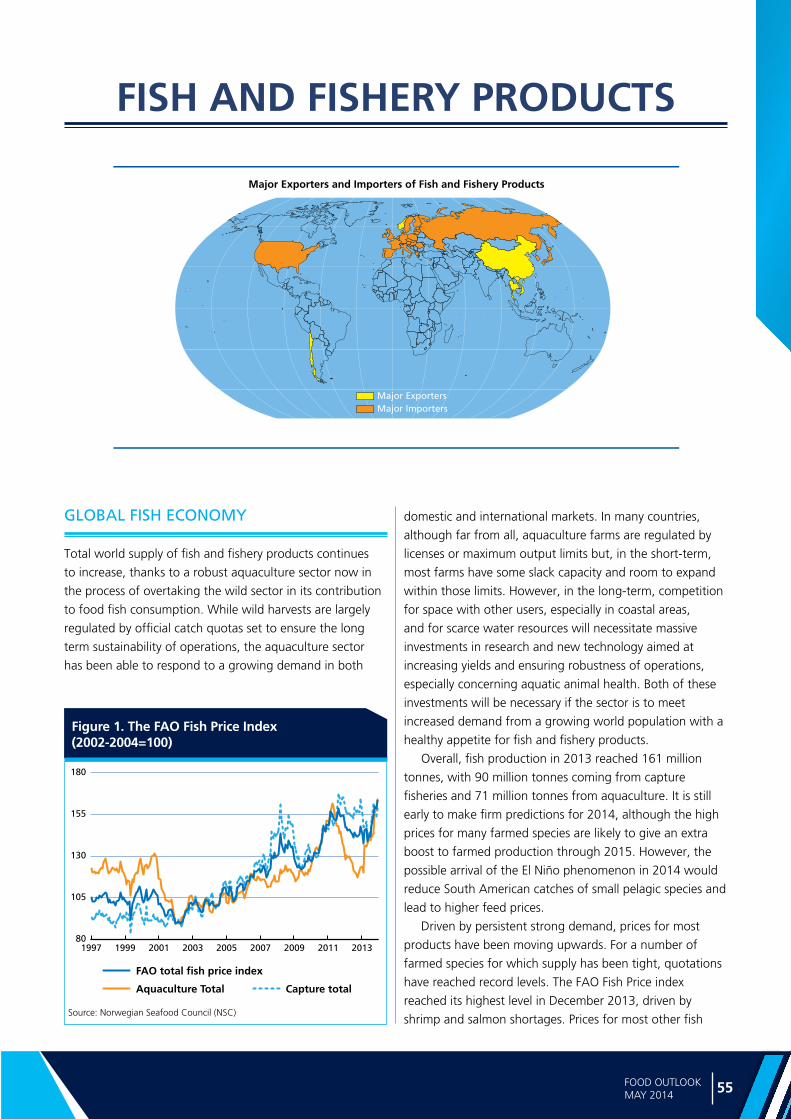
55FOOD OUTLOOKMAY 2014
FISH A
ND
FISHE
RY
PR
OD
UC
TS
Major Exporters and Importers of Fish and Fishery Products
Major ExportersMajor Importers
Figure 1. The FAO Fish Price Index(2002-2004=100)
80
105
130
155
180
201320112009200720052003200119991997
FAO total fish price index
Capture totalAquaculture Total
FISH AND FISHERY PRODUCTS
GLOBAL FISH ECONOMY
Total world supply of fish and fishery products continues
to increase, thanks to a robust aquaculture sector now in
the process of overtaking the wild sector in its contribution
to food fish consumption. While wild harvests are largely
regulated by official catch quotas set to ensure the long
term sustainability of operations, the aquaculture sector
has been able to respond to a growing demand in both
domestic and international markets. In many countries,
although far from all, aquaculture farms are regulated by
licenses or maximum output limits but, in the short-term,
most farms have some slack capacity and room to expand
within those limits. However, in the long-term, competition
for space with other users, especially in coastal areas,
and for scarce water resources will necessitate massive
investments in research and new technology aimed at
increasing yields and ensuring robustness of operations,
especially concerning aquatic animal health. Both of these
investments will be necessary if the sector is to meet
increased demand from a growing world population with a
healthy appetite for fish and fishery products.
Overall, fish production in 2013 reached 161 million
tonnes, with 90 million tonnes coming from capture
fisheries and 71 million tonnes from aquaculture. It is still
early to make firm predictions for 2014, although the high
prices for many farmed species are likely to give an extra
boost to farmed production through 2015. However, the
possible arrival of the El Niño phenomenon in 2014 would
reduce South American catches of small pelagic species and
lead to higher feed prices.
Driven by persistent strong demand, prices for most
products have been moving upwards. For a number of
farmed species for which supply has been tight, quotations
have reached record levels. The FAO Fish Price index
reached its highest level in December 2013, driven by
shrimp and salmon shortages. Prices for most other fish Source: Norwegian Seafood Council (NSC)

Ma
rke
t a
sse
ssm
en
ts
56 FOOD OUTLOOKMAY 2014
Table 1. World fish market at a glance
commodities have also been rising, including many small
pelagic and whitefish species.
Whereas aquaculture producers have benefited from
higher prices, processors and consumers have been less
content. In many developed markets, retailers are able to
move large quantities of product only through discounting,
meaning additional pressure on processors to cut costs
and margins. On the positive side, lower fish meal prices
reduced costs for feed during 2013 and early 2014, which
could translate into lower prices for some products in the
short term. However, the main driver of price rises is supply
shortages linked either to disease (shrimp) or government-
set production limits (salmon), as processors as well as
retailers encounter difficulties in substituting product in the
short-run.
Following a moderately positive 2013, 2014 looks set to
be a year of new growth in world trade. Traditional markets
such as the United States and the EU are showing firm
signs of recovery, which will boost their imports, given their
limited capability of increasing production. Japan has seen
its currency fall, making imports more expensive. Emerging
markets continue to show strong growth, providing
opportunities for domestic, regional and international
producers, particularly of aquaculture products.
REVIEW BY FISH PRODUCT
TunaWorldwide demand for canned and non-canned tuna
remained low during the first quarter of 2014 and prices
were under pressure. Frozen skipjack prices were nearly
50 percent lower in April 2014 compared with April 2013,
with demand from Asian canners remaining weak due to
high inventories. As of March 2014, catches in the Western
and Central Pacific were adequate to meet demand, but
decreased in the Indian Ocean and have yet to improve on
the African side of the Atlantic. For farmed bluefin tuna,
supplies are currently good. Japan’s imports of fresh and
frozen tuna totalled 225 873 tonnes in 2013, a record
low for both. A long-term decline in demand for sashimi
in Japan is continuing. Although 2013 imports of fresh
tuna by the United States dropped 15 percent, consumer
preference for fresh red meat tuna has remained high.
Exports of frozen tuna from China, mainly skipjack, grew
by nearly 41 percent in 2013. The United States’ market
for canned tuna continued to be difficult with 2013 import
volumes 25 percent below 2010 levels, despite early
optimism that the market would revive. The demand for
traditional canned tuna in brine from the United States
remained flat while demand for pouched tuna increased.
The European canned tuna market improved in 2013 as a
result of growing demand.
BivalesMussel imports into the EU-27 from non-EU origins reached
45 300 tonnes in 2013, reflecting a small increase over
2012 2013estim.
2014f’cast
Change: 2014 over 2013
million tonnes %
WORLD BALANCE
Production 158.0 161.0 165.2 2.6
Capture fisheries 91.3 90.5 90.8 0.3
Aquaculture 66.6 70.5 74.4 5.6
Trade value (exports USD billion)
129.2 136.0 141.8 4.2
Trade volume (live weight) 58.1 59.0 59.9 0.3
Total utilization 158.0 161.0 165.2 2.6
Food 136.2 140.9 144.6 2.6
Feed 16.3 16.4 16.6 1.2
Other uses 5.4 3.7 4.0 9.6
SUPPLY AND DEMAND INDICATORS
Per caput food consumption:
Food fish (kg/yr) 19.2 19.7 20.0 1.4
From capture fisheries (kg/year) 9.8 9.8 9.7 -1.5
From aquaculture (kg/year) 9.4 9.8 10.3 4.4
FAO FISH PRICE INDEX 1
(2002-2004=100)2012 2013 2014
Jan-AprChange:
Jan-Apr 2014 over
Jan-Apr 2013 %
144 148 162 13.2
Figure 2. CFR prices canned tuna (USA and Europe)
10
20
30
40
50
201420132012201120102009200820072006
USD per carton
Europe United States

57FOOD OUTLOOKMAY 2014
FISH A
ND
FISHE
RY
PR
OD
UC
TS
2012. However, when including intra-EU trade, EU-27
imports of mussels declined in 2013. As a consequence
of the drastic decline in production of French oysters
due to disease, in February 2014, oyster prices in France
rose above EUR 10 per kg for the first time in history.
The future price development of oysters will depend on
production performances. Total imports of scallops in the
EU-27 reached 54 300 tonnes in 2013, a 5 percent increase
compared with 2012. France, which is the EU’s largest
importer of scallops, bought over 21 500 tonnes in 2013,
or nearly 40 percent of all EU purchases. Although this
was 7.5 percent more than the previous year, the amount
reflects a severe decline compared to the 2008–2011
period. In Japan, scallop production hit a five-year high
in 2013 in the important Hokkaido fishery, with the total
harvest in 2014 expected to reach around 310 000 to
315 000 tonnes.
Small pelagics A five-year mackerel agreement between Norway, the
EU and the Faroe Islands, reached in March 2014, has
set the 2014 North Atlantic mackerel quota at 1.24 million
tonnes. In 2013, Norwegian exports of frozen whole
mackerel dropped by 7 percent to 245 100 tonnes, but
export volume increased during the first quarter of 2014.
Mackerel prices are strengthening but the higher quota
may reverse this trend. In the South Pacific, fishing nations
have recommended limiting the jack mackerel quota to 440
000 tonnes in 2014. The North Atlantic herring agreement
reached between the EU, Norway, Iceland and Russia has
set a lower 2014 quota of 418 487 tonnes. Tighter supplies
should see slight price increases for herring this year.
Norway experienced a slight increase in frozen herring
exports in 2013, rising 4 percent to 212 400 tonnes, but
exports fell again in the first quarter of 2014. In Japan,
herring sold well in 2013, with imports growing by 29
percent. After a slow start, the capelin season in Norway
and Iceland is now taking off, although the quota for 2014
is only 38 980 tonnes. In the South Pacific, a strong El Niño
predicted in 2014 is expected to have a major effect on
fisheries off the west coast of South America.
Tilapia Production of farmed tilapia increased to 5.15 million
tonnes in the major producing countries in 2013, which
supported rising domestic demand and national food
security programmes. Tilapia is farmed successfully in
most warmer-climate regions of the world with China,
Egypt, Indonesia, Philippines, Brazil, Thailand,
Bangladesh being the principal producers but it is also
important in Central America and increasingly so in Sub-
Saharan Africa. International tilapia trade also grew due
to demand from the United States and many emerging
markets. Demand for frozen fillets also improved in the
EU. Meanwhile, domestic demand for tilapia remains firm
in most of the producing counties. Despite a decline in
Chinese production in 2013, Chinese exports of frozen
tilapia increased by about 10 percent in 2013 compared
with 2012. The popularity of tilapia, including the high
value, air-flown fresh fillet, continues to grow among US
consumers, and predictions for Central American tilapia
exports are promising.
CephalopodsOutlook for octopus is bright for 2014, with improved
supplies and signs of recovering demand, which could
lead to firmer prices in the long term. Demand for octopus
is growing in the US and Japan, while the Spanish and
Italian markets are also showing positive signs. For squid,
lower catches in Peruvian waters have negatively affected
Peru’s exports to China, but Argentina’s squid exports
increased by 92 percent to 133 082 tonnes in 2013.
Japanese squid imports grew significantly in 2013, while
Italian squid imports were also up. The squid market seems
to be improving, trade is increasing and prices are expected
to climb modestly. The cuttlefish market has remained
stagnant for some time, however, and there are no real
signs of improvement. Cuttlefish supplies are tight, but
demand is low.
Fishmeal and fish oil Declines in global production, combined with growing
demand, pushed prices for both fishmeal and fish oil
to record highs in the first half of 2013 but they have
Figure 3. Oyster prices, origin: Ireland/France
1.5
2.5
3.5
4.5
5.5
201420132012201120102009
Euro per kg.

Ma
rke
t a
sse
ssm
en
ts
58 FOOD OUTLOOKMAY 2014
since eased. Peru and Chile saw the biggest declines in
fishmeal production, dropping 26 percent to 855 000
tonnes combined, while production from Denmark,
Norway and Iceland was slightly higher than in 2012.
Fish oil production faced the same situation as fishmeal,
with production from Peru and Chile down 39 percent
to 181 000 tonnes partly offset by production increases
from Denmark, Norway and Iceland. China remains
the largest consumer of fishmeal, although the country
is increasingly sourcing supplies from Southeast Asia
while growing its domestic production. Feed producers
are increasingly substituting plant-based material to
reduce their dependence on fishmeal and oil, and this is
expected to continue. It is anticipated that the strong El
Niño effect in 2014 will impact fishmeal production in
South America, but a healthy menhaden fishery stock and
the EU’s introduction of a ban on discards in 2014 will
likely compensate for the supply shortfall to some extent.
However, prices for fishmeal and oil are expected to remain
high in the long-term.
Nile perchIn 2013, the EU imported 26 100 tonnes of Nile perch
fillets, mainly from Tanzania, Kenya and Uganda. This
figure, 12 percent less than 2012, is part of a longer-term
and more significant decline and is, in fact, 38 percent less
than in 2008. On the production side, overfishing is one of
the major contributors to the long-term decline in total Nile
perch volume harvested. Experts have warned that if urgent
measures are not taken, Nile perch may become virtually
extinct in the next three to five years. In the long-term,
farmed production of Nile perch may fill the gap in capture
supplies.
GroundfishIn the EU, notable trends in the 2013 groundfish market
included a healthy increase in UK imports of frozen cod
and a significant decrease in German imports of frozen
Alaska pollock fillets. In the United States, imports of
cod-like groundfish increased slightly in 2013. Meanwhile,
demand on the Japanese and European surimi markets
has been weak. In 2014, Norwegian cod landings in the
first quarter exceeded previous years and Norwegian
cod exports have increased significantly. In the Russian Federation, sufficient volumes of domestically caught cod
and downward trending prices have been reported for the
first quarter, while catches of Alaska pollock amounted
to over 120 000 tonnes in the same period. Supplies of
haddock have been slowing and, as a result, prices have
risen sharply, benefitting Norwegian operators. Overall,
supplies of groundfish in 2014 will be marginally higher
than in 2013, although with major differences from species
to species. Cod is expected to have a surplus of supplies
with prices predicted to decline but prices for other major
species, including pollock, hake and saithe, should increase.
PangasiusIn 2013, global production of pangasius reached over
1.6 million tonnes, with nearly 75 percent supplied by
Vietnam. Vietnamese pangasius exports in 2013 were worth USD 1.76 billion. The United States imported 108
676 tonnes of frozen catfish fillets, an 8 percent increase
compared with 2012. The EU imported a total of 179 734
tonnes of frozen freshwater fillets in 2013, with pangasius
maintaining the largest share at 79 percent. Based on
official statistical data from reporting countries, imports of
frozen freshwater fish fillets into Asia (mostly tilapia and
pangasius) totalled more than 50 000 tonnes in 2013, up
by nearly 45 percent from 2012. Of this, nearly 80 percent
was pangasius, mostly from Vietnam. The growth in global
production confirms the strong demand for pangasius, and
official figures indicate that supply is increasing steadily
from other sources in Asia. This trend is expected to
continue.
Seabass and seabream In terms of volumes, Greece finished 2013 exporting a
total of 84 400 tonnes of bass and bream worth EUR
Source: IFFO*These figures refer only to IFFO member countries
Table 2. Production fishmeal: Selected countries
2008 2009 2010 2011 2012 2013
(thousand tonnes)
Jan-Dec
Peru/Chile 2 063 2 039 1 274 2 160 1 161 855
Denmark/Norway 302 274 345 256 140 190
Iceland 251 198 146 134 169 176
Total 2 616 2 511 1 855 2 607 1 801 1 477
Source: IFFO*These figures refer only to IFFO member countries
Table 3. Production fish oil: Selected countries
2008 2009 2010 2011 2012 2013
(thousand tonnes)
Jan-Dec
Peru/Chile 459 410 279 450 295 181
Denmark/Norway 93 79 116 92 50 57
Iceland 81 44 69 67 67 69
Total 633 532 471 612 479 441
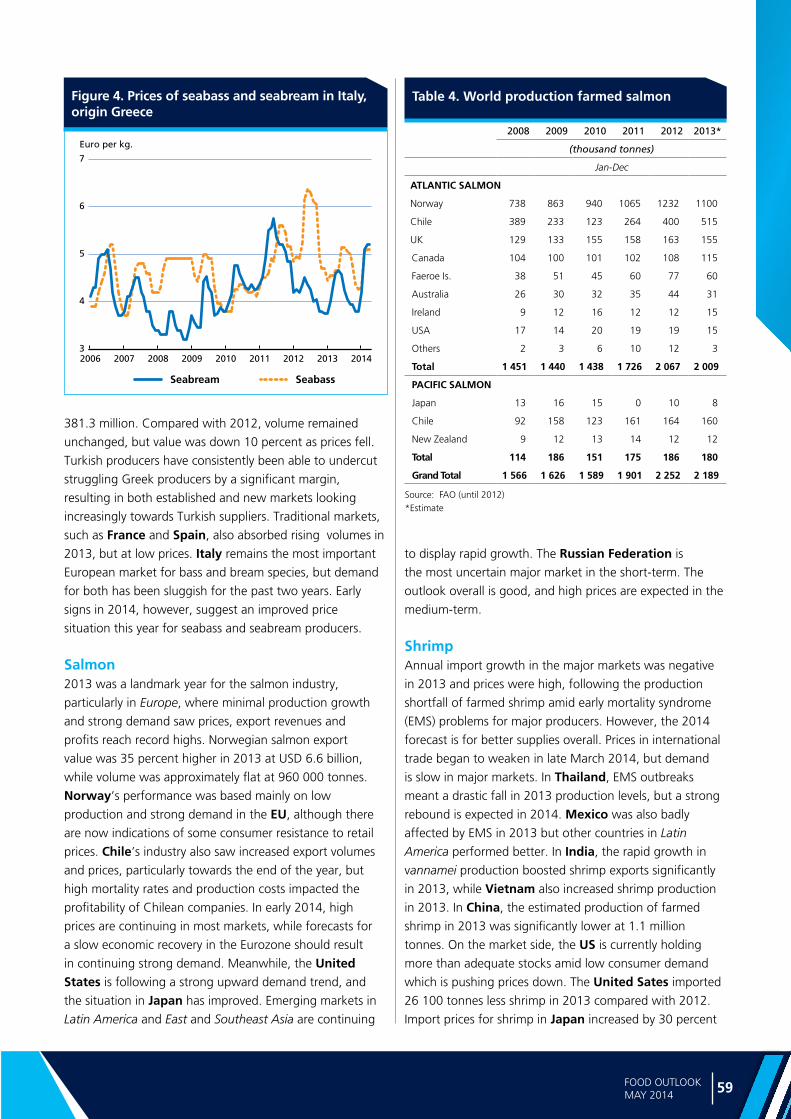
59FOOD OUTLOOKMAY 2014
FISH A
ND
FISHE
RY
PR
OD
UC
TS
381.3 million. Compared with 2012, volume remained
unchanged, but value was down 10 percent as prices fell.
Turkish producers have consistently been able to undercut
struggling Greek producers by a significant margin,
resulting in both established and new markets looking
increasingly towards Turkish suppliers. Traditional markets,
such as France and Spain, also absorbed rising volumes in
2013, but at low prices. Italy remains the most important
European market for bass and bream species, but demand
for both has been sluggish for the past two years. Early
signs in 2014, however, suggest an improved price
situation this year for seabass and seabream producers.
Salmon2013 was a landmark year for the salmon industry,
particularly in Europe, where minimal production growth
and strong demand saw prices, export revenues and
profits reach record highs. Norwegian salmon export
value was 35 percent higher in 2013 at USD 6.6 billion,
while volume was approximately flat at 960 000 tonnes.
Norway’s performance was based mainly on low
production and strong demand in the EU, although there
are now indications of some consumer resistance to retail
prices. Chile’s industry also saw increased export volumes
and prices, particularly towards the end of the year, but
high mortality rates and production costs impacted the
profitability of Chilean companies. In early 2014, high
prices are continuing in most markets, while forecasts for
a slow economic recovery in the Eurozone should result
in continuing strong demand. Meanwhile, the United States is following a strong upward demand trend, and
the situation in Japan has improved. Emerging markets in
Latin America and East and Southeast Asia are continuing
Figure 4. Prices of seabass and seabream in Italy, origin Greece
3
4
5
6
7
201420132012201120102009200820072006
Euro per kg.
Seabream Seabass
to display rapid growth. The Russian Federation is
the most uncertain major market in the short-term. The
outlook overall is good, and high prices are expected in the
medium-term.
Shrimp Annual import growth in the major markets was negative
in 2013 and prices were high, following the production
shortfall of farmed shrimp amid early mortality syndrome
(EMS) problems for major producers. However, the 2014
forecast is for better supplies overall. Prices in international
trade began to weaken in late March 2014, but demand
is slow in major markets. In Thailand, EMS outbreaks
meant a drastic fall in 2013 production levels, but a strong
rebound is expected in 2014. Mexico was also badly
affected by EMS in 2013 but other countries in Latin
America performed better. In India, the rapid growth in
vannamei production boosted shrimp exports significantly
in 2013, while Vietnam also increased shrimp production
in 2013. In China, the estimated production of farmed
shrimp in 2013 was significantly lower at 1.1 million
tonnes. On the market side, the US is currently holding
more than adequate stocks amid low consumer demand
which is pushing prices down. The United Sates imported
26 100 tonnes less shrimp in 2013 compared with 2012.
Import prices for shrimp in Japan increased by 30 percent
Source: FAO (until 2012)*Estimate
Table 4. World production farmed salmon
2008 2009 2010 2011 2012 2013*
(thousand tonnes)
Jan-Dec
ATLANTIC SALMON
Norway 738 863 940 1065 1232 1100
Chile 389 233 123 264 400 515
UK 129 133 155 158 163 155
Canada 104 100 101 102 108 115
Faeroe Is. 38 51 45 60 77 60
Australia 26 30 32 35 44 31
Ireland 9 12 16 12 12 15
USA 17 14 20 19 19 15
Others 2 3 6 10 12 3
Total 1 451 1 440 1 438 1 726 2 067 2 009
PACIFIC SALMON
Japan 13 16 15 0 10 8
Chile 92 158 123 161 164 160
New Zealand 9 12 13 14 12 12
Total 114 186 151 175 186 180
Grand Total 1 566 1 626 1 589 1 901 2 252 2 189

Ma
rke
t a
sse
ssm
en
ts
60 FOOD OUTLOOKMAY 2014
in 2013 compared with 2012, contributing to a large
decline in import volume terms, but demand is expected
to increase during April or May. In 2013, short supply
and high prices dampened EU demand for shrimp, but
softening of prices in the first half of 2014 may improve the
situation in the second half of the year.
2008 2009 2010 2011 2012 2013
Jan-Dec (thousand tonnes)
India 15.6 20.0 30.3 48.2 66.0 94.4
Thailand 183.5 192.8 203.4 185.8 136.1 84.2
Indonesia 84.1 69.3 61.1 70.3 74.1 81.1
Ecuador 56.3 61.6 65.0 73.8 81.5 74.5
Viet Nam 48.5 42.3 48.5 45.4 41.2 59.9
China 48.7 44.2 48.2 43.0 35.7 32.5
Mexico 34.5 41.1 23.5 30.9 26.3 18.5
Malaysia 30.1 18.4 24.3 29.3 23.5 10.3
Peru 7.5 8.5 7.0 8.3 8.4 9.0
Guyana 9.1 8.9 7.8 6.5 9.0 8.7
Honduras 5.7 8.7 10.3 10.4 9.1 8.5
Others 43.9 36.7 32.0 25.1 24.1 26.9
Total 567.454 552.6 561.5 577.1 534.9 508.5
Source: NMFS
Table 5. USA shrimp imports, by origin
Figure 5. Shrimp prices (16-20 count) in main wholesale markets
2
4
6
8
10
201420132012201120102009200820072006
Japan (Indian white, Tokyo)
USA (Gulf brown, New York)
USD per lb.
Figure 6. Prices of white shrimp on the Japanese market
5
10
15
20
25
30
201420132012201120102009200820072006
USD per kg.
16/20 pc/lb 31/40 pc/lb
2008 2009 2010 2011 2012 2013
Jan-Dec (thousand tonnes)
IMPORTS
Ecuador 83.1 74.6 80.6 97.2 92.1 82.8
India 61.3 65.2 59.8 59.4 60.4 66.2
Greenland 80.3 74.3 72.6 68.3 61.2 60.1
Argentina 38.6 47.1 55.5 62.1 55.0 59.8
Denmark 50.1 46.3 49.4 44.8 43.4 47.6
Bangladesh 32.5 39.0 41.2 43.4 42.1 42.1
Viet Nam 31.8 38.1 43.2 45.5 35.7 37.7
China 39.2 40.0 40.6 38.6 35.8 37.0
Netherlands 36.7 37.0 41.1 44.1 40.9 34.6
Thailand 39.9 52.8 68.2 63.1 53.7 31.4
Canada 33.5 31.4 30.5 27.8 30.1 31.2
Spain 19.9 21.8 25.9 24.8 28.3 23.0
Belgium 24.5 24.2 23.4 27.7 21.6 22.6
Others 243.3 231.2 215.4 202.7 181.7 176.0
Grand Total 814.8 822.9 847.6 849.4 781.8 752.2
Total Intra Imports 187.0 187.6 202.5 202.0 188.6 182.5
Total Extra Imports 627.8 635.3 645.1 647.4 593.2 569.7
EXPORTS
Grand Total 365.8 362.3 373.8 370.2 335.3 322.9
Total Intra Exports 262.0 261.5 274.9 284.4 258.1 249.3
Total Extra Exports 103.8 100.8 98.9 85.8 77.2 73.6
Source: EUROSTAT
Table 6. EU-27 shrimp imports, by origin


SPEC
IAL
FEAT
URES
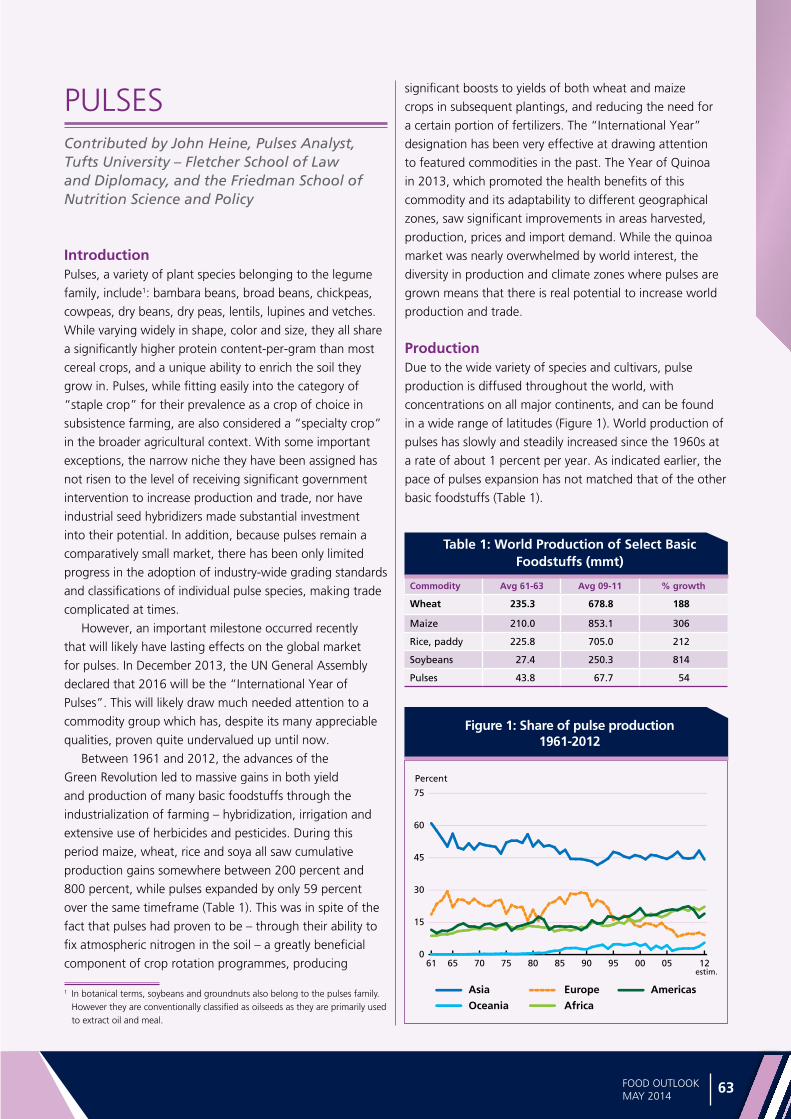
Spe
cial fe
atu
res
63FOOD OUTLOOKMAY 2014
PULSESContributed by John Heine, Pulses Analyst, Tufts University – Fletcher School of Law and Diplomacy, and the Friedman School of Nutrition Science and Policy
IntroductionPulses, a variety of plant species belonging to the legume
family, include1: bambara beans, broad beans, chickpeas,
cowpeas, dry beans, dry peas, lentils, lupines and vetches.
While varying widely in shape, color and size, they all share
a significantly higher protein content-per-gram than most
cereal crops, and a unique ability to enrich the soil they
grow in. Pulses, while fitting easily into the category of
“staple crop” for their prevalence as a crop of choice in
subsistence farming, are also considered a “specialty crop”
in the broader agricultural context. With some important
exceptions, the narrow niche they have been assigned has
not risen to the level of receiving significant government
intervention to increase production and trade, nor have
industrial seed hybridizers made substantial investment
into their potential. In addition, because pulses remain a
comparatively small market, there has been only limited
progress in the adoption of industry-wide grading standards
and classifications of individual pulse species, making trade
complicated at times.
However, an important milestone occurred recently
that will likely have lasting effects on the global market
for pulses. In December 2013, the UN General Assembly
declared that 2016 will be the “International Year of
Pulses”. This will likely draw much needed attention to a
commodity group which has, despite its many appreciable
qualities, proven quite undervalued up until now.
Between 1961 and 2012, the advances of the
Green Revolution led to massive gains in both yield
and production of many basic foodstuffs through the
industrialization of farming – hybridization, irrigation and
extensive use of herbicides and pesticides. During this
period maize, wheat, rice and soya all saw cumulative
production gains somewhere between 200 percent and
800 percent, while pulses expanded by only 59 percent
over the same timeframe (Table 1). This was in spite of the
fact that pulses had proven to be – through their ability to
fix atmospheric nitrogen in the soil – a greatly beneficial
component of crop rotation programmes, producing
1 In botanical terms, soybeans and groundnuts also belong to the pulses family. However they are conventionally classified as oilseeds as they are primarily used to extract oil and meal.
significant boosts to yields of both wheat and maize
crops in subsequent plantings, and reducing the need for
a certain portion of fertilizers. The “International Year”
designation has been very effective at drawing attention
to featured commodities in the past. The Year of Quinoa
in 2013, which promoted the health benefits of this
commodity and its adaptability to different geographical
zones, saw significant improvements in areas harvested,
production, prices and import demand. While the quinoa
market was nearly overwhelmed by world interest, the
diversity in production and climate zones where pulses are
grown means that there is real potential to increase world
production and trade.
Production Due to the wide variety of species and cultivars, pulse
production is diffused throughout the world, with
concentrations on all major continents, and can be found
in a wide range of latitudes (Figure 1). World production of
pulses has slowly and steadily increased since the 1960s at
a rate of about 1 percent per year. As indicated earlier, the
pace of pulses expansion has not matched that of the other
basic foodstuffs (Table 1).
Commodity Avg 61-63 Avg 09-11 % growth
Wheat 235.3 678.8 188
Maize 210.0 853.1 306
Rice, paddy 225.8 705.0 212
Soybeans 27.4 250.3 814
Pulses 43.8 67.7 54
Table 1: World Production of Select Basic Foodstuffs (mmt)
Figure 1: Share of pulse production 1961-2012
0
15
30
45
60
75
1205009590858075706561
Americas Asia Europe
Africa
Percent
Oceania
estim.
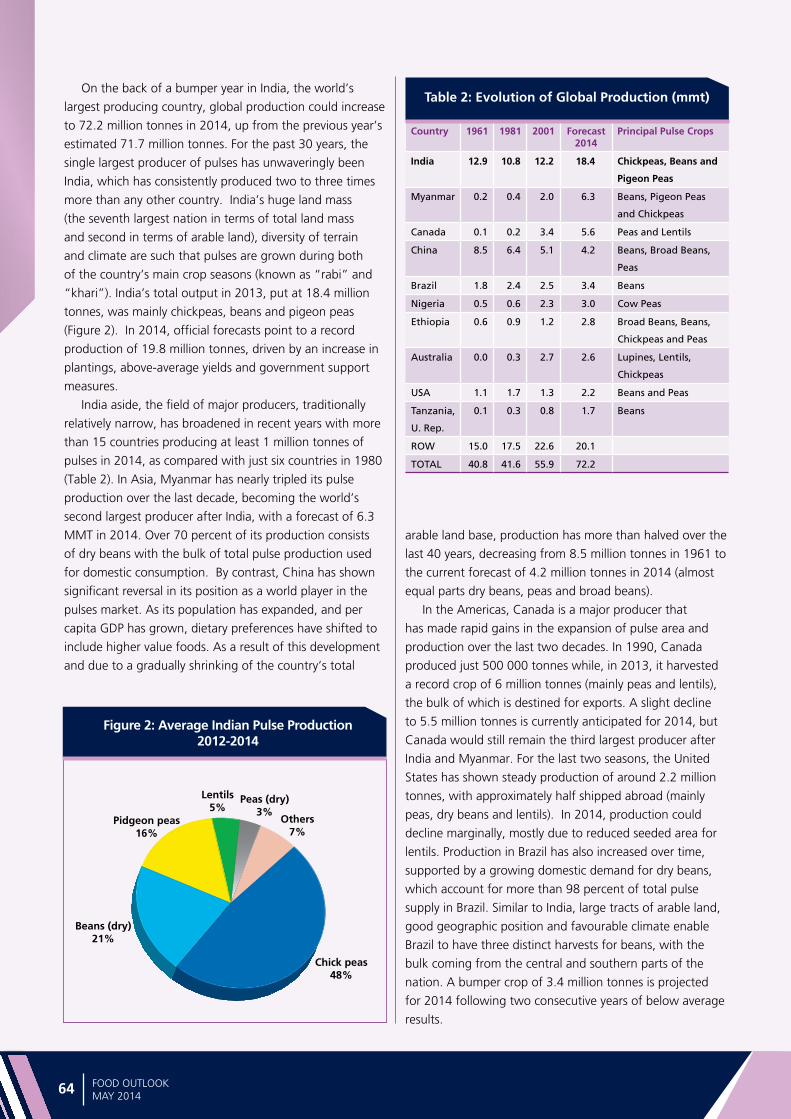
Spe
cia
l fe
atu
res
64 FOOD OUTLOOKMAY 2014
On the back of a bumper year in India, the world’s
largest producing country, global production could increase
to 72.2 million tonnes in 2014, up from the previous year’s
estimated 71.7 million tonnes. For the past 30 years, the
single largest producer of pulses has unwaveringly been
India, which has consistently produced two to three times
more than any other country. India’s huge land mass
(the seventh largest nation in terms of total land mass
and second in terms of arable land), diversity of terrain
and climate are such that pulses are grown during both
of the country’s main crop seasons (known as “rabi” and
“khari”). India’s total output in 2013, put at 18.4 million
tonnes, was mainly chickpeas, beans and pigeon peas
(Figure 2). In 2014, official forecasts point to a record
production of 19.8 million tonnes, driven by an increase in
plantings, above-average yields and government support
measures.
India aside, the field of major producers, traditionally
relatively narrow, has broadened in recent years with more
than 15 countries producing at least 1 million tonnes of
pulses in 2014, as compared with just six countries in 1980
(Table 2). In Asia, Myanmar has nearly tripled its pulse
production over the last decade, becoming the world’s
second largest producer after India, with a forecast of 6.3
MMT in 2014. Over 70 percent of its production consists
of dry beans with the bulk of total pulse production used
for domestic consumption. By contrast, China has shown
significant reversal in its position as a world player in the
pulses market. As its population has expanded, and per
capita GDP has grown, dietary preferences have shifted to
include higher value foods. As a result of this development
and due to a gradually shrinking of the country’s total
arable land base, production has more than halved over the
last 40 years, decreasing from 8.5 million tonnes in 1961 to
the current forecast of 4.2 million tonnes in 2014 (almost
equal parts dry beans, peas and broad beans).
In the Americas, Canada is a major producer that
has made rapid gains in the expansion of pulse area and
production over the last two decades. In 1990, Canada
produced just 500 000 tonnes while, in 2013, it harvested
a record crop of 6 million tonnes (mainly peas and lentils),
the bulk of which is destined for exports. A slight decline
to 5.5 million tonnes is currently anticipated for 2014, but
Canada would still remain the third largest producer after
India and Myanmar. For the last two seasons, the United
States has shown steady production of around 2.2 million
tonnes, with approximately half shipped abroad (mainly
peas, dry beans and lentils). In 2014, production could
decline marginally, mostly due to reduced seeded area for
lentils. Production in Brazil has also increased over time,
supported by a growing domestic demand for dry beans,
which account for more than 98 percent of total pulse
supply in Brazil. Similar to India, large tracts of arable land,
good geographic position and favourable climate enable
Brazil to have three distinct harvests for beans, with the
bulk coming from the central and southern parts of the
nation. A bumper crop of 3.4 million tonnes is projected
for 2014 following two consecutive years of below average
results.
Country 1961 1981 2001 Forecast 2014
Principal Pulse Crops
India 12.9 10.8 12.2 18.4 Chickpeas, Beans and
Pigeon Peas
Myanmar 0.2 0.4 2.0 6.3 Beans, Pigeon Peas
and Chickpeas
Canada 0.1 0.2 3.4 5.6 Peas and Lentils
China 8.5 6.4 5.1 4.2 Beans, Broad Beans,
Peas
Brazil 1.8 2.4 2.5 3.4 Beans
Nigeria 0.5 0.6 2.3 3.0 Cow Peas
Ethiopia 0.6 0.9 1.2 2.8 Broad Beans, Beans,
Chickpeas and Peas
Australia 0.0 0.3 2.7 2.6 Lupines, Lentils,
Chickpeas
USA 1.1 1.7 1.3 2.2 Beans and Peas
Tanzania,
U. Rep.
0.1 0.3 0.8 1.7 Beans
ROW 15.0 17.5 22.6 20.1
TOTAL 40.8 41.6 55.9 72.2
Table 2: Evolution of Global Production (mmt)
Figure 2: Average Indian Pulse Production 2012-2014
Chick peas48%
Beans (dry)21%
Pidgeon peas16%
Lentils5%
Peas (dry)3%
Others7%

Spe
cial fe
atu
res
65FOOD OUTLOOKMAY 2014
In Oceania, Australia has been a major producer
(primarily chickpeas, lentils, lupines and broad beans)
since the mid-1980s in spite of cyclical weather-related
fluctuations in output (between 1.5 and 3 million tonnes),
with 50 to 65 percent of domestic production exported.
Early estimates would indicate that the 2014 crop will be
relatively stable, at 2.5 million tonnes, on slightly higher
seeded area but marginally lower yields.
In Africa, the main producers of pulses are Ethiopia,
the United Republic of Tanzania, Nigeria and Niger. All
have boosted production significantly over recent years,
but none more effectively than Ethiopia. Through a
mixture of government support measures, partnership with
members of the CGIAR consortium and others, Ethiopia
has successfully doubled yields (chickpea) and production,
with only limited additions to area seeded. Ethiopia is
now one of the top ten chickpea exporters. Nigeria and
Niger have doubled output since 1990, with average
production now close to 3 million tonnes and 1.5 million
tonnes respectively, largely composed of cowpeas. While
flooding severely hampered production in 2012 in both
countries, output appears to have been above average in
2013. Tentative early forecasts for 2014 would suggest that
weather woes could again negatively influence production
in Niger, but leave Nigeria unaffected.
ConsumptionA documented shortcoming of the Green Revolution
was an overemphasis on ending hunger through the
provision of calories alone. While adequate caloric intake
is of undeniable importance, the macro/sub-macro/micro-
nutrient profiles of diets consumed have been proven
essential for human health. For example, pulses and cereals
offer distinct protein profiles, which by themselves are
considered “incomplete”. However, when consumed in
tandem, their complementary supply of essential amino
acids represents a nutritionally balanced substitute for the
“complete” proteins found in meat and dairy products.
Further, due to a significant price differential between
pulses and livestock products, pulses qualify as staple
source of protein for low-income consumers around the
world.
As the world’s single largest consumer of pulses (by
a factor of 3), India’s domestic market exerts significant
influence over the world pulse situation and outlook. World
Bank data indicate that during the period 2002–2012
India’s GDP grew more than 250 percent, from USD 500
billion to USD 1.8 trillion, which has resulted in a shift in
average diets. According to FAOSTAT, during the period
1969–2009, India’s portion of per capita calorie intake
from animal products rose from 5 percent to 10 percent,
while for pulses it fell from 5 percent to 3 percent. Similar
tendencies to include more animal-sourced protein
also prevailed, under similar circumstances, in China.
Together, these two countries host about 37 percent of
the world population, and despite the above-mentioned
changes in diets, still account for 40 percent of the world
consumption of pulses for food and for 30 percent of the
world consumption of pulses for feed. In the near-term,
the rise of population and the decline of per capita pulse
intake tend to cancel each other out, leaving apparent
consumption fairly level. Elsewhere, consumption is forecast
to remain relatively stable, as most of the major producers
are also major consumers.
Pulses are also used as a supplement for animal
feed. While the majority of world feed requirements
are satisfied with soyabean meal/cake and coarse
grains, pulses (peas in particular) can serve as a low-
cost alternative. Typically about 15–20 percent of
world pulse production ends up as feed. However, one
emerging trend in the consumption of pulses relates to
its utilization in processed foods. As food manufacturers
are becoming more concerned about the macro/micro
nutrient composition of the products they offer, pulses
have become a commodity of interest due to their unique
protein composition profile. This profile complements the
protein composition of cereals, making pulse flours an
excellent companion ingredient for traditionally wheat-
and maize-based processed foods.
TradeInternational trade in pulses has expanded an average 5.5
percent per annum since 1961. However, when trade is
observed as a percentage of total production, an interesting
pattern emerges (Table 3). While production itself has not
increased at the same pace as other commodities such as
cereals, the percentage of total production which has been
traded on the market has risen significantly since 1961,
indicating a progressively integration of pulses in world
commerce. In the past, international trade was relatively
evenly distributed among the various types of pulses but,
in the last decade, has evolved into mainly dry beans and
peas, with lentils, chick peas and broad beans taking a
lesser role (Figure 3).
World pulse trade in 2014 is forecast at 12.5 million
tonnes, down slightly from the previous year’s estimate of
12.9 million tonnes. Imports by India, which represent more
than one-fourth of the world total, are forecast to fall to
2.8 million tonnes in 2014, down from 3.1 million tonnes
in 2013, as the country is expected to harvest a bumper
crop this year. At the same time, India also exports small
quantities of chickpeas to Pakistan, Algeria and Turkey.
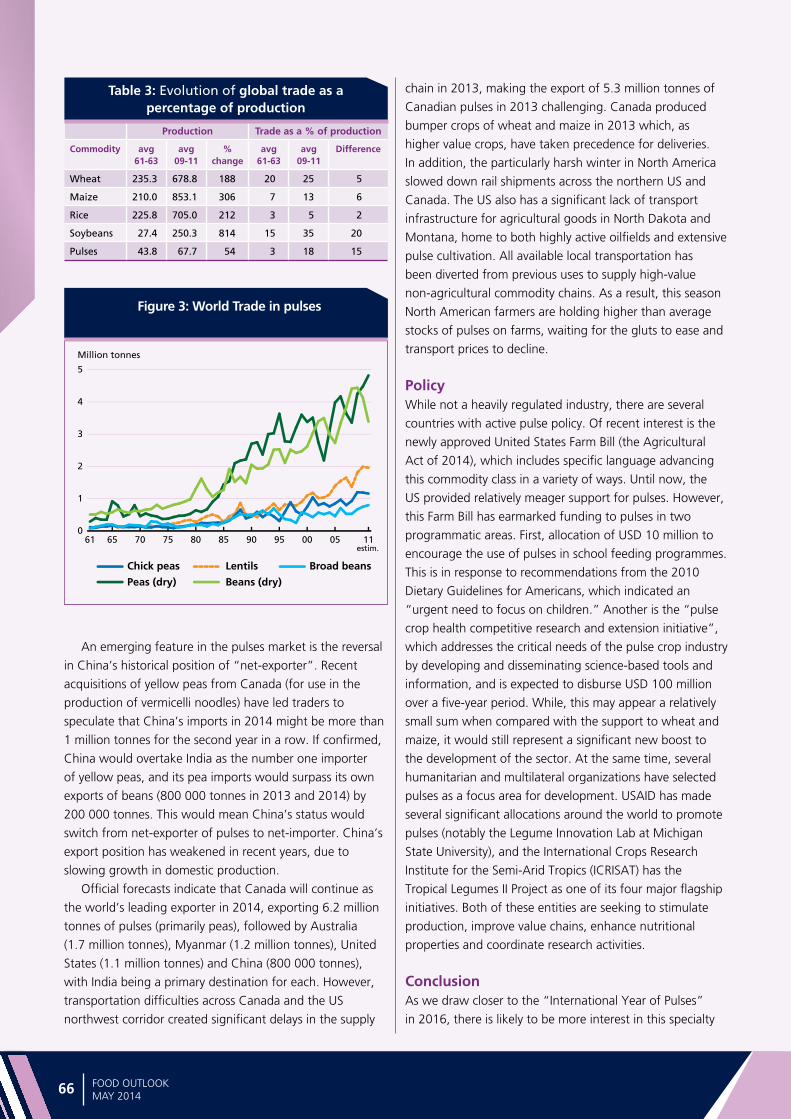
Spe
cia
l fe
atu
res
66 FOOD OUTLOOKMAY 2014
An emerging feature in the pulses market is the reversal
in China’s historical position of “net-exporter”. Recent
acquisitions of yellow peas from Canada (for use in the
production of vermicelli noodles) have led traders to
speculate that China’s imports in 2014 might be more than
1 million tonnes for the second year in a row. If confirmed,
China would overtake India as the number one importer
of yellow peas, and its pea imports would surpass its own
exports of beans (800 000 tonnes in 2013 and 2014) by
200 000 tonnes. This would mean China’s status would
switch from net-exporter of pulses to net-importer. China’s
export position has weakened in recent years, due to
slowing growth in domestic production.
Official forecasts indicate that Canada will continue as
the world’s leading exporter in 2014, exporting 6.2 million
tonnes of pulses (primarily peas), followed by Australia
(1.7 million tonnes), Myanmar (1.2 million tonnes), United
States (1.1 million tonnes) and China (800 000 tonnes),
with India being a primary destination for each. However,
transportation difficulties across Canada and the US
northwest corridor created significant delays in the supply
chain in 2013, making the export of 5.3 million tonnes of
Canadian pulses in 2013 challenging. Canada produced
bumper crops of wheat and maize in 2013 which, as
higher value crops, have taken precedence for deliveries.
In addition, the particularly harsh winter in North America
slowed down rail shipments across the northern US and
Canada. The US also has a significant lack of transport
infrastructure for agricultural goods in North Dakota and
Montana, home to both highly active oilfields and extensive
pulse cultivation. All available local transportation has
been diverted from previous uses to supply high-value
non-agricultural commodity chains. As a result, this season
North American farmers are holding higher than average
stocks of pulses on farms, waiting for the gluts to ease and
transport prices to decline.
Policy While not a heavily regulated industry, there are several
countries with active pulse policy. Of recent interest is the
newly approved United States Farm Bill (the Agricultural
Act of 2014), which includes specific language advancing
this commodity class in a variety of ways. Until now, the
US provided relatively meager support for pulses. However,
this Farm Bill has earmarked funding to pulses in two
programmatic areas. First, allocation of USD 10 million to
encourage the use of pulses in school feeding programmes.
This is in response to recommendations from the 2010
Dietary Guidelines for Americans, which indicated an
“urgent need to focus on children.” Another is the “pulse
crop health competitive research and extension initiative”,
which addresses the critical needs of the pulse crop industry
by developing and disseminating science-based tools and
information, and is expected to disburse USD 100 million
over a five-year period. While, this may appear a relatively
small sum when compared with the support to wheat and
maize, it would still represent a significant new boost to
the development of the sector. At the same time, several
humanitarian and multilateral organizations have selected
pulses as a focus area for development. USAID has made
several significant allocations around the world to promote
pulses (notably the Legume Innovation Lab at Michigan
State University), and the International Crops Research
Institute for the Semi-Arid Tropics (ICRISAT) has the
Tropical Legumes II Project as one of its four major flagship
initiatives. Both of these entities are seeking to stimulate
production, improve value chains, enhance nutritional
properties and coordinate research activities.
ConclusionAs we draw closer to the “International Year of Pulses”
in 2016, there is likely to be more interest in this specialty
Production Trade as a % of production
Commodity avg 61-63
avg 09-11
% change
avg 61-63
avg 09-11
Difference
Wheat 235.3 678.8 188 20 25 5
Maize 210.0 853.1 306 7 13 6
Rice 225.8 705.0 212 3 5 2
Soybeans 27.4 250.3 814 15 35 20
Pulses 43.8 67.7 54 3 18 15
Table 3: Evolution of global trade as a percentage of production
Figure 3: World Trade in pulses
0
1
2
3
4
5
1105009590858075706561
Broad beans Chick peas Lentils
Beans (dry)
Million tonnes
Peas (dry)
estim.

Spe
cial fe
atu
res
67FOOD OUTLOOKMAY 2014
crop. There is much to be considered – from their versatile
growing ranges, including varieties with proven drought
tolerance, to the mounting body of scientific literature
reinforcing not only the demonstrated horticultural benefits
of crop rotations with pulses, but the health and nutrition
benefits of a human diet containing a weekly ration of
pulses as well. Best practices from success stories such
as Ethiopia should be studied and scaled-up to whatever
extent possible. Given the long term trends evident in this
research, it is likely that production, consumption and trade
will all continue to rise in the coming years, indicating that
the sector deserves more robust support and attention from
the international community and national governments
than it has received so far.
Sources: FAOSTAT, StatPub, International Food Trader, National Statistical
Agencies, Commodity Marketing Boards, and personal interviews.

Spe
cia
l fe
atu
res
68 FOOD OUTLOOKMAY 2014
The Group on Earth Observations developed the Global
Agricultural Monitoring (GEOGLAM) initiative in response
to the growing calls for improved agricultural information.
GEOGLAM and the Agricultural Market Information
System (AMIS) were endorsed by the G20 Heads of
States’ Declaration (Cannes, November, 2011) as part of
the Action Plan on Food Price Volatility and Agriculture.
The goal of GEOGLAM is to strengthen the international
community’s capacity to produce and disseminate relevant,
timely and accurate forecasts of agricultural production
at national, regional and global scales through the use
of Earth observations. Within this framework, GEOGLAM
developed the Crop Monitor reports. The objective of the
Crop Monitor is to provide AMIS with an international and
transparent multi-source, consensus assessment of crop
growing conditions, status, and agro-climatic conditions,
likely to impact global production. This activity covers
the four primary crop types (wheat, maize, rice, and soy)
within the main agricultural producing regions of the
AMIS countries. These are monthly assessments that have
been produced operationally since September 2013 and
are published in the AMIS Market Monitor Bulletin. The
Crop Monitor reports provide cartographic and textual
summaries of crop, according to crop type.
THE GEOGLAM CROP MONITOR(Contributed by GEOGLAM)
The GEOGLAM approach is to bring together
international experts from national, regional, and
global monitoring systems, space agencies, agriculture
organizations and universities, that can share and
discuss information from a variety of independent
yet complementary sources, enabling them to reach
a consensus on global crop conditions. In order to
facilitate this process, monthly crop assessment telecons
are held and an online crop assessment interface was
developed, where the crop analysts log-in on a monthly
basis to fill out crop condition information for their
regions. Representatives from 30 different agencies
and organizations are participating in the Crop Monitor
assessments, which are coordinated by the Global
Agricultural Monitoring Center, in the Department of
Geographical Sciences at the University of Maryland (UMD).
The current Crop Monitor contributors are listed in the
table below (in alphabetical order by country).
Crop Condition MapsAt the request of AMIS partners the GEOGLAM Crop
Monitor developed a series of customized crop condition
maps and chart products. These include synthesis maps
that provide information on all four crops within a single
map, as well as crop specific condition maps and pie charts.
These new GEOGLAM products are being released starting
in the May 2014 issue of the Market Monitor.
The synthesis maps were developed to provide a
simplified overview of current global crop conditions for
the four AMIS crops. Three versions of these maps were
developed providing varying levels of information including
COUNTRY ORGANIZATION/AGENCY COUNTRY ORGANIZATION/AGENCY
Argentina INTA Japan JAXA
Asian Rice Countries AFSIS ASEAN +3 Mexico SIAP
Asian Rice Countries Asia RiCE Russia IKI
Australia ABARES South Africa ARC
Australia CSIRO South Africa GeoTerraImage
Brazil CONAB South Africa SANSA
Brazil INPE Thailand GISTDA
Canada AAFC Thailand OAE
China CAS Ukraine NASU-NSAU
EU EC JRC MARS Ukraine UHMC
India ISRO USA NASA
Indonesia LAPAN USA UMD
Indonesia MOA USA USDA (FAS, NASS, ARS)
International CIMMYT Vietnam VAST
International FAO Vietnam VIMHE-MARD
International IRRI

Spe
cial fe
atu
res
69FOOD OUTLOOKMAY 2014
crop conditions, crop type affected, and the climatic drivers
affecting crop conditions.
The cropped areas in the synthesis maps are displayed
as the total area for all four crops and are based on
an aggregation of crop type maps depicting the major
growing regions. (Crop type map sources: IFPRI/IIASA
SPAM 2005 beta version in combination with national level
products where available, including USDA/NASS CDL 2013,
AAFC Annual Crop Inventory Map 2013, SIAP (Mexico)
Crop Type Maps, GLAM & GLAD UMD wheat and soy
masks, Australian and Use and Management Classification
(Version 7), and EC JRC MARS crop type masks). Crop
calendar information is also provided as context and is
based on GEOGLAM partner inputs as well as FAO and
USDA calendars. (Both of these layers are continuously
being updated with national level information as it
becomes available). Crop conditions are depicted in the
maps according to categories in the box below.
Crops classified as having other than Favorable
conditions are displayed using crop symbols to identify
the specific crop type affected. Areas that are out-of-
season are in very dark gray. Non-AMIS countries are
identified in light gray and are not covered by the Crop
Monitor.
Exceptional: Conditions are much better than average* at time of reporting. This label is only used during the grain-filling
through harvest stages.
Favorable: Conditions range from slightly lower to slightly better than average* at reporting time.
Watch: Conditions are not far from average* but there is a potential risk to production.
Poor: Crop conditions are well below average*. Crop yields are likely to be more than 20% below average. This is
only used when conditions are not likely to be able to recover, and impact on production is likely.
*”Average” refers to the average conditions over the past 5 years.
Crop condition categories

Spe
cia
l fe
atu
res
70 FOOD OUTLOOKMAY 2014
Crop Condition and Climatic Drivers
Synthesis Map V2:Crop conditions over the main growing areas for wheat, maize, rice, and soybean are based on a
combination of national and regional crop analyst inputs along with earth observation data. Conditions are based on
information as of April 28th. Areas with crops that are in other than favourable conditions are displayed on the
map with the climatic drivers producing those other than favourable conditions.
Crop Conditions for AMIS Countries (As of April 28th)
Synthesis Map V1: Crop conditions over the main growing areas for wheat, maize, rice, and soybean are based on a
combination of national and regional crop analyst inputs along with earth observation data. Conditions are based on
information as of April 28th. Crops that are in other than favourable conditions are displayed on the map with
their crop symbol.

Spe
cial fe
atu
res
71FOOD OUTLOOKMAY 2014
Crop Conditions, Climatic Drivers, and Crop Types
Synthesis Map V3: Crop conditions over the main growing areas for wheat, maize, rice, and soybean are based on a
combination of national and regional crop analyst inputs along with earth observation data. Conditions are based on
information as of April 28th. Areas with crops that are in other than favourable conditions are displayed on
the map with the specific crops affected and the key climatic drivers affecting crop conditions.
Crop-specific Maps and ChartsCrop-specific pie charts were designed to accompany
the synthesis maps and to provide additional crop-
specific information. A country’s slice of the pie chart
is representative of the country’s portion of the 5 year
average of the total AMIS countries’ production for
each crop. The Producers responsible for 90% of AMIS
country production are individually shown with the
remaining 10% of producers grouped into the “Other
AMIS Countries” category. The area within each pie slice
is divided between crops in season (color) and out of
season (gray). The in-season portion is colored according
to the various crop conditions within that country.
When conditions are labeled as ‘poor’ or ‘watch’, icons
are added that provide information on the key climatic
drivers affecting conditions. The crop calendar, crop
condition and climatic driver information are based
on inputs provided by the crop monitor analysts on
a sub-national division basis and therefore reflect
crop conditions by area rather than overall national
production.
In addition to the pie charts, crop specific maps are
available on the Crop Monitor website (www.geoglam-crop-monitor.org). Growing areas within these maps are
specific to the main growing regions of each crop. In
addition to the crop conditions and drivers, these maps
also include a crop calendar insert map. This insert
map provides important context for interpreting crop
conditions (i.e. potential impacts of various climatic drivers
on final production can be better evaluated in the context
of the crop development stage).

Spe
cia
l fe
atu
res
72 FOOD OUTLOOKMAY 2014
Top wheat producers within AMIS participating countries and their current crop conditions
(as of April 28th).
Wheat Conditions for AMIS Countries
Wheat crop conditions over main growing areas are based on a combination of national and regional crop analyst inputs
along with earth observation data. Condition information is based on information as of April 28th. Where crops are in
other than favourable conditions the climatic drivers responsible for those conditions are displayed. An inset
crop calendar map is provided as context.
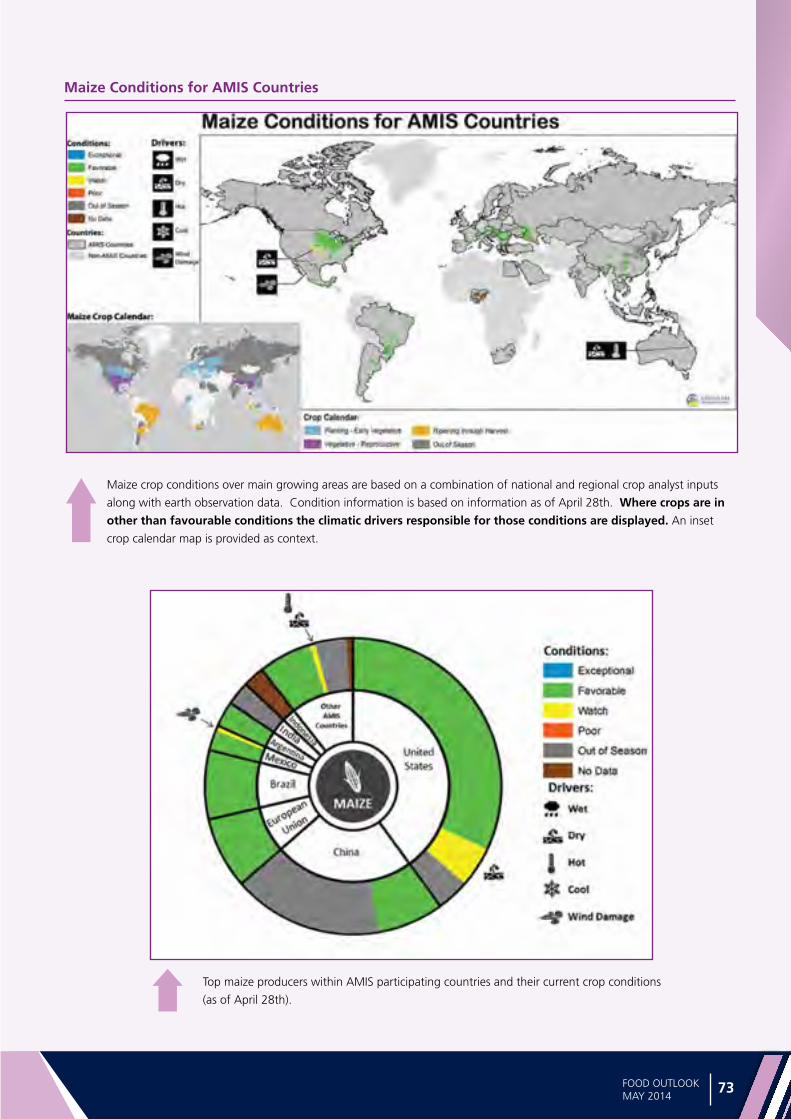
Spe
cial fe
atu
res
73FOOD OUTLOOKMAY 2014
Maize Conditions for AMIS Countries
Maize crop conditions over main growing areas are based on a combination of national and regional crop analyst inputs
along with earth observation data. Condition information is based on information as of April 28th. Where crops are in
other than favourable conditions the climatic drivers responsible for those conditions are displayed. An inset
crop calendar map is provided as context.
Top maize producers within AMIS participating countries and their current crop conditions
(as of April 28th).
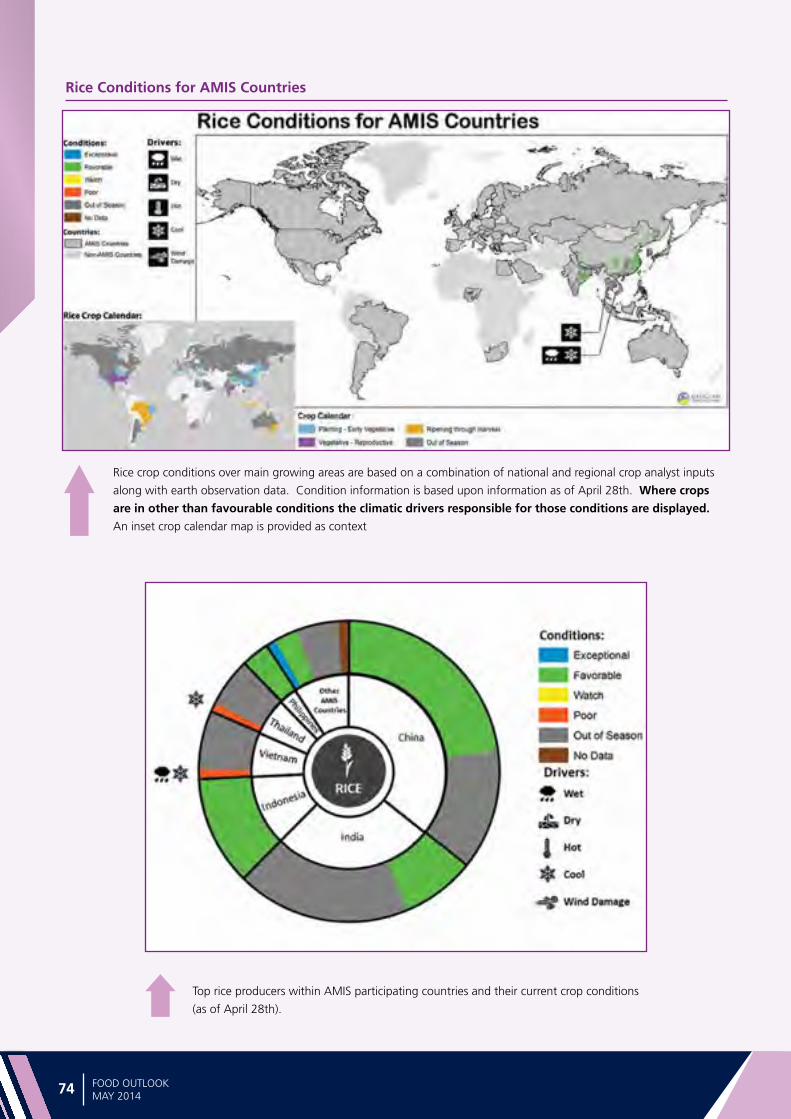
Spe
cia
l fe
atu
res
74 FOOD OUTLOOKMAY 2014
Rice Conditions for AMIS Countries
Rice crop conditions over main growing areas are based on a combination of national and regional crop analyst inputs
along with earth observation data. Condition information is based upon information as of April 28th. Where crops
are in other than favourable conditions the climatic drivers responsible for those conditions are displayed.
An inset crop calendar map is provided as context
Top rice producers within AMIS participating countries and their current crop conditions
(as of April 28th).

Spe
cial fe
atu
res
75FOOD OUTLOOKMAY 2014
Soybeans Conditions for AMIS Countries
Soybean crop conditions over main growing areas are based on a combination of national and regional crop analyst
inputs along with earth observation data. Condition information is based upon information as of April 28th.
Where crops are in other than favourable conditions the climatic drivers responsible for those conditions
are displayed. An inset crop calendar map is provided as context.
Top soy producers
within AMIS
participating
countries and
their current crop
conditions
(as of April 28th)
Further information on the Crop Monitor can be found on: www.geoglam-crop-monitor.org

76 77
MA
JOR
POLI
CY
DEV
ELO
PMEN
TS
MAR
KET
POLIC
Y
DEVE
LOPM
ENTS

Ma
jor p
olicy d
eve
lop
me
nts
76 77FOOD OUTLOOKMAY 2014
GRA
INS:
M
AJO
R PO
LICY
DEV
ELO
PMEN
TS:
NO
VEM
BER
201
3 - M
ID-A
PRIL
201
4*
CO
UN
TRY
PRO
DU
CT
DA
TEPO
LIC
Y C
ATE
GO
RY
/INST
RU
MEN
TD
ESC
RIP
TIO
N
Arg
enti
na
Wh
eat
Jan
-14
Exp
ort
Qu
ota
Au
tho
rize
d e
xpo
rts
of
1.5
mill
ion
to
nn
es o
f w
hea
t fr
om
th
e 20
13/1
4 cr
op
, sta
rtin
g w
ith
500
000
-to
nn
e sh
ipm
ents
.
Feb
-14
Exp
ort
Qu
ota
Au
tho
rize
d a
n a
dd
itio
nal
exp
ort
qu
ota
of
500
000
ton
nes
fro
m t
he
2013
/14
cro
p.
Bila
tera
l/Mu
ltila
tera
lM
aize
Dec
-13
Imp
ort
Tar
iff
An
no
un
ced
th
at R
epu
blic
of
Sou
th K
ore
a el
imin
ated
its
wh
eat
imp
ort
du
ty o
n s
hip
men
ts f
rom
A
ust
ralia
n w
hea
t.
Mai
ze a
nd
wh
eat
Ap
r-14
Trad
eSt
art
of
a fr
ee t
rad
e zo
ne
bet
wee
n U
krai
ne
and
th
e EU
an
no
un
ced
to
sta
rt in
No
vem
ber
201
4.
Bra
zil
Wh
eat
Oct
-13
Imp
ort
Tar
iff
Incr
ease
d q
uo
ta f
or
tari
ff-f
ree
wh
eat
imp
ort
s fr
om
no
n-M
erco
sur
stat
es b
y 60
0 00
0 to
nn
es t
o 3
.3 m
illio
n
ton
nes
an
no
un
ced
by
Trad
e M
inis
try.
Ch
ina
(Mai
nla
nd
)
Mai
ze
No
v-13
Trad
eA
gre
ed, b
y C
hin
a, t
o a
llow
imp
ort
s o
f B
razi
lian
mai
ze.
Ap
r-14
GM
O p
olic
ies
and
reg
ula
tio
ns
Rej
ecte
d n
earl
y 1.
45 m
illio
n t
on
nes
of
US
mai
ze s
hip
men
ts s
ince
late
201
3 af
ter
the
det
ecti
on
of
an
un
app
rove
d G
MO
str
ain
in t
he
mai
ze c
arg
oes
.
Feb
-14
Pro
du
ctio
n s
up
po
rt, s
ecto
r p
olic
y fr
amew
ork
An
no
un
ced
th
at a
rou
nd
130
000
ha
of
rice
are
a w
ou
ld b
e sh
ifte
d t
ow
ard
s th
e cu
ltiv
atio
n o
f m
aize
an
d
soyb
ean
s.
Mai
ze a
nd
wh
eat
Sep
-13
Imp
ort
Tar
iff
Mai
nta
ined
th
e 20
14 lo
w-t
arif
f im
po
rt q
uo
tas
at 2
013
leve
ls. A
cco
rdin
g t
o t
he
Nat
ion
al D
evel
op
men
t an
d R
efo
rm C
om
mis
sio
n (
ND
RC
), in
clu
din
g w
hea
t at
9.6
mill
ion
to
nn
es, m
aize
at
7.2
mill
ion
to
nn
es a
nd
ri
ce a
t 5.
3 m
illio
n t
on
nes
. Th
e ta
riff
is s
et a
t 1%
, wh
ile im
po
rts
in e
xces
s o
f th
e q
uo
ta a
re s
ub
ject
to
a
du
ty o
f 65
%.
Jan
-14
Pro
du
ctio
n s
up
po
rt, s
ecto
r p
olic
y fr
amew
ork
Issu
ed t
he
"Nu
mb
er o
ne
do
cum
ent"
wh
ich
set
s th
e co
un
try'
s p
olic
y p
rio
riti
es f
or
the
year
. An
no
un
ced
th
at it
inte
nd
ed t
o r
emai
n s
elf-
suffi
cien
t in
th
e p
rod
uct
ion
of
wh
eat
and
ric
e, b
ut
gre
ater
vo
lum
es o
f m
aize
an
d s
oyb
ean
s w
ere
likel
y to
be
imp
ort
ed in
th
e fu
ture
. A
lloca
ted
CN
Y 1
22.2
bill
ion
(U
SD 2
0 b
illio
n)
for
gra
in s
ub
sid
ies,
wh
ich
incl
ud
es C
NY
15.
1 b
illio
n (
USD
2.5
bill
ion
) fo
r th
e d
irec
t p
aym
ent
to
gra
in p
rod
uce
rs a
nd
CN
Y 1
07.1
bill
ion
(U
SD 1
7.7
bill
ion
) fo
r th
e “c
om
pre
hen
sive
inp
ut
sub
sid
y”.
Wh
eat
Oct
-13
Go
vern
men
t p
rocu
rem
ent
and
p
rocu
rem
ent
pri
ceSe
t th
e w
hea
t su
pp
ort
pri
ce a
t C
NY
236
0 p
er t
on
ne
(USD
386
), a
5%
incr
ease
fro
m t
he
pre
vio
us
year
ac
cord
ing
to
ND
RC
.
Egyp
tW
hea
tN
ov-
13G
ove
rnm
ent
pro
cure
men
t Pr
ovi
ded
det
ails
on
go
vern
men
t’s
pla
n t
o a
chie
ve s
elf-
suffi
cien
cy b
y 20
19, w
hic
h in
clu
des
incr
ease
s in
si
lo s
tora
ge
cap
acit
y.
Euro
pea
n U
nio
nB
iofu
els
Sep
-13
Pro
du
cer
sub
sid
ies
Pass
ed a
n a
men
dm
ent
in E
uro
pea
n P
arlia
men
t to
cap
th
e p
rop
ort
ion
of
firs
t-g
ener
atio
n b
iofu
els
der
ived
fro
m t
rad
itio
nal
so
urc
es (
foo
d c
rop
s) in
tra
nsp
ort
fu
els
at 6
% b
y 20
20 (
curr
ent
10%
).
Ap
r-14
Imp
ort
du
ty
Set
du
ty-f
ree
imp
ort
qu
ota
s fo
r U
krai
nia
n g
rain
s. U
nti
l 31
Oct
ob
er 2
014,
Ukr
ain
e w
ill s
up
ply
950
000
to
nn
es o
f w
hea
t an
d fl
ou
r, 40
0 00
0 o
f m
aize
an
d 2
50 0
00 o
f b
arle
y o
n d
uty
-fre
e b
asis
.
Kaz
akh
stan
Wh
eat
Feb
-14
Go
vern
men
t p
rocu
rem
ent
An
no
un
ced
th
at 5
09 0
00 t
on
nes
of
gra
in w
ou
ld b
e so
ld t
o t
he
do
mes
tic
mar
ket
at a
fixe
d p
rice
of
KZT
30
000
per
to
nn
e (U
SD 1
63)
bet
wee
n F
ebru
ary
and
Au
gu
st, s
eeki
ng
to
sta
bili
ze b
read
pri
ces
follo
win
g
the
dev
alu
atio
n o
f it
s d
om
esti
c cu
rren
cy.
Mex
ico
Mai
ze a
nd
so
rgh
um
Dec
-13
Imp
ort
Tar
iff
An
no
un
ced
th
e re
intr
od
uct
ion
of
a 20
%, i
mp
ort
tar
iff
on
wh
ite
mai
ze, w
hic
h w
as a
bo
lish
ed in
200
8.
Ho
wev
er, y
ello
w m
aize
will
rem
ain
exe
mp
t. A
15%
imp
ort
du
ty w
ill a
lso
be
app
lied
to
so
rgh
um
, fo
r w
hic
h t
arif
fs h
ad b
een
rem
ove
d in
201
2.
Mo
rocc
oW
hea
tD
ec-1
3Im
po
rt T
arif
f/Im
po
rt S
ub
sid
ySu
spen
ded
th
e im
po
rt d
uty
fo
r co
mm
on
wh
eat
(45%
) fr
om
1 J
anu
ary
un
til 3
0 A
pri
l 201
4. In
tro
du
ced
an
imp
ort
su
bsi
dy
syst
em t
hat
will
be
in p
lace
fro
m 1
Jan
uar
y u
nti
l 30
Ap
ril 2
014.
Un
der
th
e sc
hem
e,
imp
ort
ers
will
be
reim
bu
rsed
85%
of
any
cost
s o
ver
Dir
ham
2 8
00 (
USD
337
) p
er m
etri
c to
nn
e.

Ma
jor
po
licy
de
velo
pm
en
ts
78 79FOOD OUTLOOKMAY 2014
CO
UN
TRY
PRO
DU
CT
DA
TEPO
LIC
Y C
ATE
GO
RY
/INST
RU
MEN
TD
ESC
RIP
TIO
N
Paki
stan
Wh
eat
Ap
r-14
Pric
e Su
pp
ort
Ap
pro
ved
incr
ease
in s
up
po
rt p
rice
of
wh
eat
fro
m R
s 1
200
(12.
2 U
SD)
per
40
kg t
o R
s 1
250
(USD
12.
8)
per
kg
.
Mar
-14
Go
vern
men
t p
rocu
rem
ent
Dec
ided
to
red
uce
its
stra
teg
ic r
eser
ves
and
rel
ease
th
em in
th
e m
arke
t in
an
att
emp
t to
sta
bili
ze fl
ou
r p
rice
s an
d c
ut
sto
rag
e co
st.
Un
ited
Sta
tes
Eth
ano
lN
ov-
13Pr
od
uce
r su
bsi
die
sA
nn
ou
nce
d E
PA p
rop
osa
l to
red
uce
Ren
ewab
le F
uel
Sta
nd
ard
fo
r 20
14.
* A
col
lect
ion
of m
ajor
gra
in p
olic
y de
velo
pmen
ts s
tart
ing
in J
uly
2010
is a
vaila
ble
at: h
ttp:
//ww
w.f
ao.o
rg/e
cono
mic
/est
/est
-com
mod
ities
/com
mod
ity-p
olic
y-ar
chiv
e/en
/?gr
oupA
ND
com
mod
ity=
grai
ns
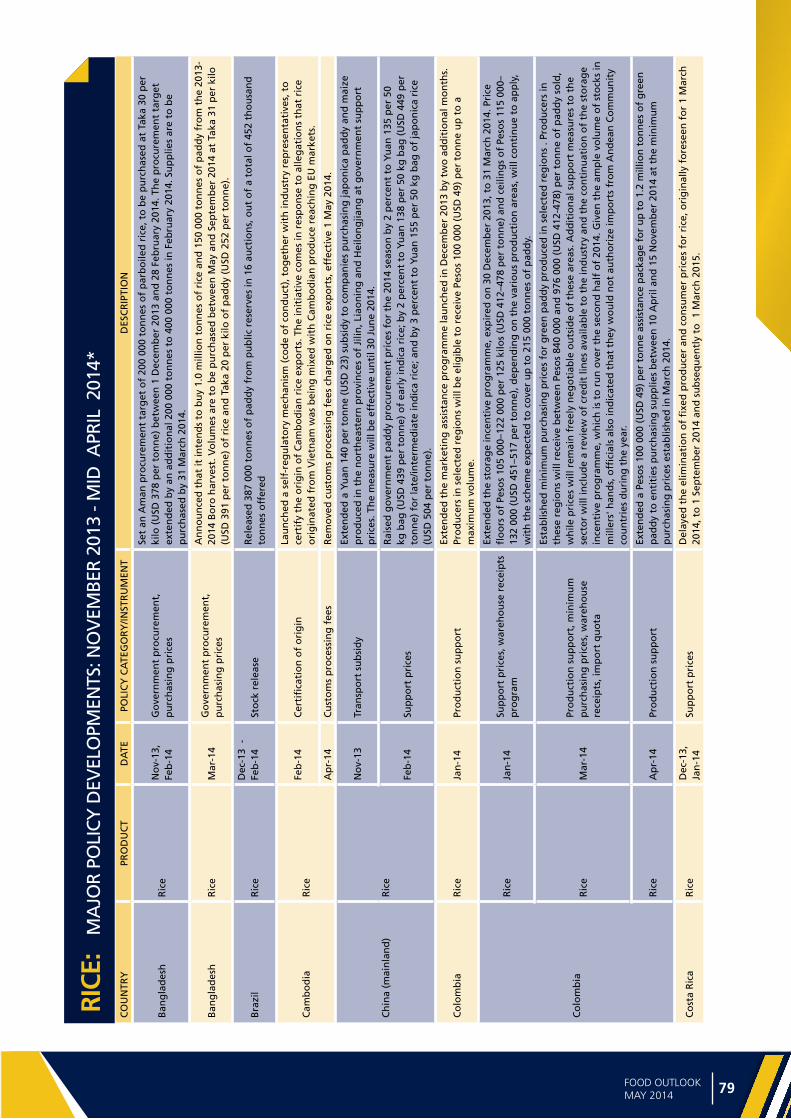
Ma
jor p
olicy d
eve
lop
me
nts
78 79FOOD OUTLOOKMAY 2014
RICE
: M
AJO
R PO
LICY
DEV
ELO
PMEN
TS: N
OV
EMBE
R 20
13 -
MID
APR
IL 2
014*
CO
UN
TRY
PRO
DU
CT
DA
TEPO
LIC
Y C
ATE
GO
RY
/INST
RU
MEN
TD
ESC
RIP
TIO
N
Ban
gla
des
hR
ice
No
v-13
, Fe
b-1
4G
ove
rnm
ent
pro
cure
men
t,
pu
rch
asin
g p
rice
s
Set
an A
man
pro
cure
men
t ta
rget
of
200
000
ton
nes
of
par
bo
iled
ric
e, t
o b
e p
urc
has
ed a
t Ta
ka 3
0 p
er
kilo
(U
SD 3
78 p
er t
on
ne)
bet
wee
n 1
Dec
emb
er 2
013
and
28
Feb
ruar
y 20
14. T
he
pro
cure
men
t ta
rget
ex
ten
ded
by
an a
dd
itio
nal
200
000
to
nn
es t
o 4
00 0
00 t
on
nes
in F
ebru
ary
2014
. Su
pp
lies
are
to b
e p
urc
has
ed b
y 31
Mar
ch 2
014.
Ban
gla
des
hR
ice
Mar
-14
Go
vern
men
t p
rocu
rem
ent,
p
urc
has
ing
pri
ces
An
no
un
ced
th
at it
inte
nd
s to
bu
y 1.
0 m
illio
n t
on
nes
of
rice
an
d 1
50 0
00 t
on
nes
of
pad
dy
fro
m t
he
2013
-20
14 B
oro
har
vest
. Vo
lum
es a
re t
o b
e p
urc
has
ed b
etw
een
May
an
d S
epte
mb
er 2
014
at T
aka
31 p
er k
ilo
(USD
391
per
to
nn
e) o
f ri
ce a
nd
Tak
a 20
per
kilo
of
pad
dy
(USD
252
per
to
nn
e).
Bra
zil
Ric
eD
ec-1
3 -
Fe
b-1
4St
ock
rel
ease
Rel
ease
d 3
87 0
00 t
on
nes
of
pad
dy
fro
m p
ub
lic r
eser
ves
in 1
6 au
ctio
ns,
ou
t o
f a
tota
l of
452
tho
usa
nd
to
nn
es o
ffer
ed
Cam
bo
dia
Ric
eFe
b-1
4C
erti
fica
tio
n o
f o
rig
inLa
un
ched
a s
elf-
reg
ula
tory
mec
han
ism
(co
de
of
con
du
ct),
to
get
her
wit
h in
du
stry
rep
rese
nta
tive
s, t
o
cert
ify
the
ori
gin
of
Cam
bo
dia
n r
ice
exp
ort
s. T
he
init
iati
ve c
om
es in
res
po
nse
to
alle
gat
ion
s th
at r
ice
ori
gin
ated
fro
m V
ietn
am w
as b
ein
g m
ixed
wit
h C
amb
od
ian
pro
du
ce r
each
ing
EU
mar
kets
.
Ap
r-14
Cu
sto
ms
pro
cess
ing
fee
sR
emo
ved
cu
sto
ms
pro
cess
ing
fee
s ch
arg
ed o
n r
ice
exp
ort
s, e
ffec
tive
1 M
ay 2
014.
Ch
ina
(mai
nla
nd
)R
ice
No
v-13
Tran
spo
rt s
ub
sid
yEx
ten
ded
a Y
uan
140
per
to
nn
e (U
SD 2
3) s
ub
sid
y to
co
mp
anie
s p
urc
has
ing
jap
on
ica
pad
dy
and
mai
ze
pro
du
ced
in t
he
no
rth
east
ern
pro
vin
ces
of
Jilin
, Lia
on
ing
an
d H
eilo
ng
jian
g a
t g
ove
rnm
ent
sup
po
rt
pri
ces.
Th
e m
easu
re w
ill b
e ef
fect
ive
un
til 3
0 Ju
ne
2014
.
Feb
-14
Sup
po
rt p
rice
s
Rai
sed
go
vern
men
t p
add
y p
rocu
rem
ent
pri
ces
for
the
2014
sea
son
by
2 p
erce
nt
to Y
uan
135
per
50
kg b
ag (
USD
439
per
to
nn
e) o
f ea
rly
ind
ica
rice
; by
2 p
erce
nt
to Y
uan
138
per
50
kg b
ag (
USD
449
per
to
nn
e) f
or
late
/inte
rmed
iate
ind
ica
rice
; an
d b
y 3
per
cen
t to
Yu
an 1
55 p
er 5
0 kg
bag
of
jap
on
ica
rice
(U
SD 5
04 p
er t
on
ne)
.
Co
lom
bia
Ric
eJa
n-1
4Pr
od
uct
ion
su
pp
ort
Exte
nd
ed t
he
mar
keti
ng
ass
ista
nce
pro
gra
mm
e la
un
ched
in D
ecem
ber
201
3 b
y tw
o a
dd
itio
nal
mo
nth
s.
Pro
du
cers
in s
elec
ted
reg
ion
s w
ill b
e el
igib
le t
o r
ecei
ve P
eso
s 10
0 00
0 (U
SD 4
9) p
er t
on
ne
up
to
a
max
imu
m v
olu
me.
Co
lom
bia
Ric
eJa
n-1
4Su
pp
ort
pri
ces,
war
eho
use
rec
eip
ts
pro
gra
m
Exte
nd
ed t
he
sto
rag
e in
cen
tive
pro
gra
mm
e, e
xpir
ed o
n 3
0 D
ecem
ber
201
3, t
o 3
1 M
arch
201
4. P
rice
fl
oo
rs o
f Pe
sos
105
000–
122
000
per
125
kilo
s (U
SD 4
12–4
78 p
er t
on
ne)
an
d c
eilin
gs
of
Peso
s 11
5 00
0–13
2 00
0 (U
SD 4
51–5
17 p
er t
on
ne)
, dep
end
ing
on
th
e va
rio
us
pro
du
ctio
n a
reas
, will
co
nti
nu
e to
ap
ply
, w
ith
th
e sc
hem
e ex
pec
ted
to
co
ver
up
to
215
000
to
nn
es o
f p
add
y.
Ric
eM
ar-1
4Pr
od
uct
ion
su
pp
ort
, min
imu
m
pu
rch
asin
g p
rice
s, w
areh
ou
se
rece
ipts
, im
po
rt q
uo
ta
Esta
blis
hed
min
imu
m p
urc
has
ing
pri
ces
for
gre
en p
add
y p
rod
uce
d in
sel
ecte
d r
egio
ns
. Pro
du
cers
in
thes
e re
gio
ns
will
rec
eive
bet
wee
n P
eso
s 84
0 00
0 an
d 9
76 0
00 (
USD
412
-478
) p
er t
on
ne
of
pad
dy
sold
, w
hile
pri
ces
will
rem
ain
fre
ely
neg
oti
able
ou
tsid
e o
f th
ese
area
s. A
dd
itio
nal
su
pp
ort
mea
sure
s to
th
e se
cto
r w
ill in
clu
de
a re
view
of
cred
it li
nes
ava
ilab
le t
o t
he
ind
ust
ry a
nd
th
e co
nti
nu
atio
n o
f th
e st
ora
ge
ince
nti
ve p
rog
ram
me,
wh
ich
is t
o r
un
ove
r th
e se
con
d h
alf
of
2014
. Giv
en t
he
amp
le v
olu
me
of
sto
cks
in
mill
ers'
han
ds,
offi
cial
s al
so in
dic
ated
th
at t
hey
wo
uld
no
t au
tho
rize
imp
ort
s fr
om
An
dea
n C
om
mu
nit
y co
un
trie
s d
uri
ng
th
e ye
ar.
Ric
eA
pr-
14Pr
od
uct
ion
su
pp
ort
Exte
nd
ed a
Pes
os
100
000
(USD
49)
per
to
nn
e as
sist
ance
pac
kag
e fo
r u
p t
o 1
.2 m
illio
n t
on
nes
of
gre
en
pad
dy
to e
nti
ties
pu
rch
asin
g s
up
plie
s b
etw
een
10
Ap
ril a
nd
15
No
vem
ber
201
4 at
th
e m
inim
um
p
urc
has
ing
pri
ces
esta
blis
hed
in M
arch
201
4.
Co
sta
Ric
aR
ice
Dec
-13,
Ja
n-1
4Su
pp
ort
pri
ces
Del
ayed
th
e el
imin
atio
n o
f fi
xed
pro
du
cer
and
co
nsu
mer
pri
ces
for
rice
, ori
gin
ally
fo
rese
en f
or
1 M
arch
20
14, t
o 1
Sep
tem
ber
201
4 an
d s
ub
seq
uen
tly
to 1
Mar
ch 2
015.
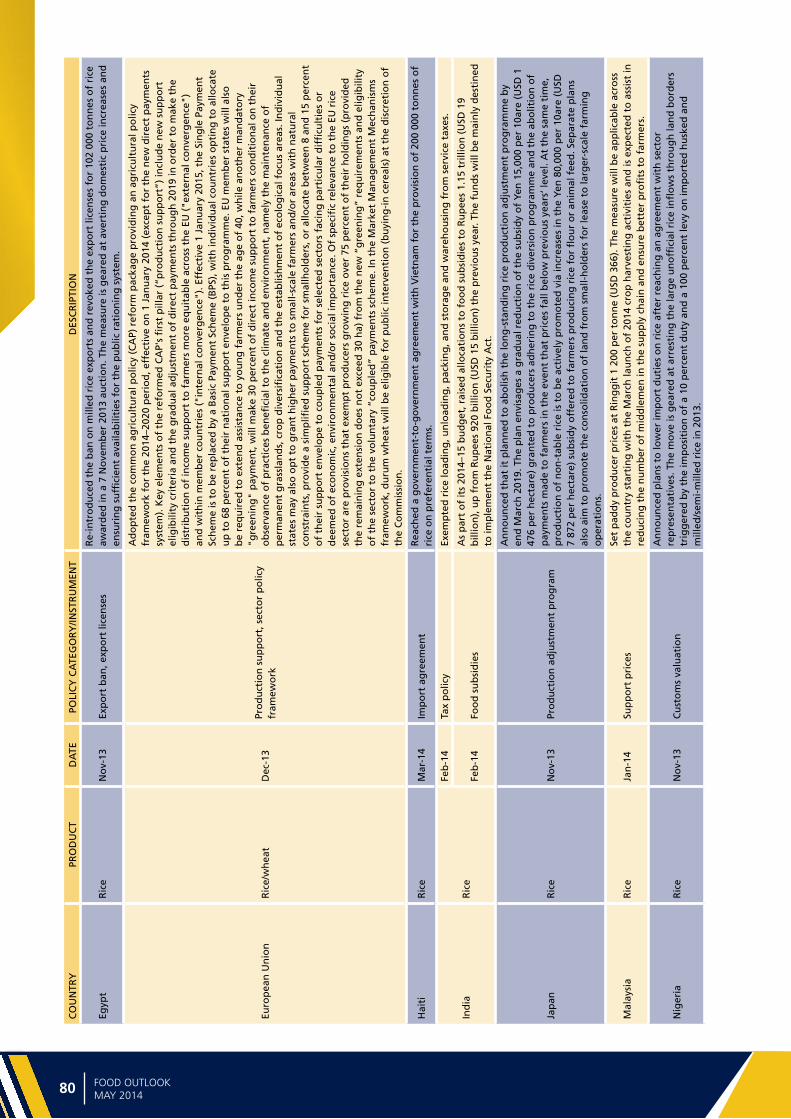
Ma
jor
po
licy
de
velo
pm
en
ts
80 81FOOD OUTLOOKMAY 2014
CO
UN
TRY
PRO
DU
CT
DA
TEPO
LIC
Y C
ATE
GO
RY
/INST
RU
MEN
TD
ESC
RIP
TIO
N
Egyp
tR
ice
No
v-13
Exp
ort
ban
, exp
ort
lice
nse
sR
e-in
tro
du
ced
th
e b
an o
n m
illed
ric
e ex
po
rts
and
rev
oke
d t
he
exp
ort
lice
nse
s fo
r 10
2 00
0 to
nn
es o
f ri
ce
awar
ded
in a
7 N
ove
mb
er 2
013
auct
ion
. Th
e m
easu
re is
gea
red
at
aver
tin
g d
om
esti
c p
rice
incr
ease
s an
d
ensu
rin
g s
uffi
cien
t av
aila
bili
ties
fo
r th
e p
ub
lic r
atio
nin
g s
yste
m.
Euro
pea
n U
nio
nR
ice/
wh
eat
Dec
-13
Pro
du
ctio
n s
up
po
rt, s
ecto
r p
olic
y fr
amew
ork
Ad
op
ted
th
e co
mm
on
ag
ricu
ltu
ral p
olic
y (C
AP)
ref
orm
pac
kag
e p
rovi
din
g a
n a
gri
cult
ura
l po
licy
fram
ewo
rk f
or
the
2014
–202
0 p
erio
d, e
ffec
tive
on
1 J
anu
ary
2014
(ex
cep
t fo
r th
e n
ew d
irec
t p
aym
ents
sy
stem
). K
ey e
lem
ents
of
the
refo
rmed
CA
P's
firs
t p
illar
(“p
rod
uct
ion
su
pp
ort
”) in
clu
de
new
su
pp
ort
el
igib
ility
cri
teri
a an
d t
he
gra
du
al a
dju
stm
ent
of
dir
ect
pay
men
ts t
hro
ug
h 2
019
in o
rder
to
mak
e th
e d
istr
ibu
tio
n o
f in
com
e su
pp
ort
to
far
mer
s m
ore
eq
uit
able
acr
oss
th
e EU
("e
xter
nal
co
nve
rgen
ce")
an
d w
ith
in m
emb
er c
ou
ntr
ies
("in
tern
al c
on
verg
ence
"). E
ffec
tive
1 J
anu
ary
2015
, th
e Si
ng
le P
aym
ent
Sch
eme
is t
o b
e re
pla
ced
by
a B
asic
Pay
men
t Sc
hem
e (B
PS),
wit
h in
div
idu
al c
ou
ntr
ies
op
tin
g t
o a
lloca
te
up
to
68
per
cen
t o
f th
eir
nat
ion
al s
up
po
rt e
nve
lop
e to
th
is p
rog
ram
me.
EU
mem
ber
sta
tes
will
als
o
be
req
uir
ed t
o e
xten
d a
ssis
tan
ce t
o y
ou
ng
far
mer
s u
nd
er t
he
age
of
40, w
hile
an
oth
er m
and
ato
ry
"gre
enin
g"
pay
men
t, w
ill m
ake
30 p
erce
nt
of
dir
ect
inco
me
sup
po
rt t
o f
arm
ers
con
dit
ion
al o
n t
hei
r o
bse
rvan
ce o
f p
ract
ices
ben
efici
al t
o t
he
clim
ate
and
en
viro
nm
ent,
nam
ely
the
mai
nte
nan
ce o
f p
erm
anen
t g
rass
lan
ds,
cro
p d
iver
sifi
cati
on
an
d t
he
esta
blis
hm
ent
of
eco
log
ical
fo
cus
area
s. In
div
idu
al
stat
es m
ay a
lso
op
t to
gra
nt
hig
her
pay
men
ts t
o s
mal
l-sc
ale
farm
ers
and
/or
area
s w
ith
nat
ura
l co
nst
rain
ts, p
rovi
de
a si
mp
lified
su
pp
ort
sch
eme
for
smal
lho
lder
s, o
r al
loca
te b
etw
een
8 a
nd
15
per
cen
t o
f th
eir
sup
po
rt e
nve
lop
e to
co
up
led
pay
men
ts f
or
sele
cted
sec
tors
fac
ing
par
ticu
lar
dif
ficu
ltie
s o
r d
eem
ed o
f ec
on
om
ic, e
nvi
ron
men
tal a
nd
/or
soci
al im
po
rtan
ce. O
f sp
ecifi
c re
leva
nce
to
th
e EU
ric
e se
cto
r ar
e p
rovi
sio
ns
that
exe
mp
t p
rod
uce
rs g
row
ing
ric
e o
ver
75 p
erce
nt
of
thei
r h
old
ing
s (p
rovi
ded
th
e re
mai
nin
g e
xten
sio
n d
oes
no
t ex
ceed
30
ha)
fro
m t
he
new
“g
reen
ing
” re
qu
irem
ents
an
d e
ligib
ility
o
f th
e se
cto
r to
th
e vo
lun
tary
“co
up
led
” p
aym
ents
sch
eme.
In t
he
Mar
ket
Man
agem
ent
Mec
han
ism
s fr
amew
ork
, du
rum
wh
eat
will
be
elig
ible
fo
r p
ub
lic in
terv
enti
on
(b
uyi
ng
-in
cer
eals
) at
th
e d
iscr
etio
n o
f th
e C
om
mis
sio
n.
Hai
tiR
ice
Mar
-14
Imp
ort
ag
reem
ent
Rea
ched
a g
ove
rnm
ent-
to-g
ove
rnm
ent
agre
emen
t w
ith
Vie
tnam
fo
r th
e p
rovi
sio
n o
f 20
0 00
0 to
nn
es o
f ri
ce o
n p
refe
ren
tial
ter
ms.
Ind
iaR
ice
Feb
-14
Tax
po
licy
Exem
pte
d r
ice
load
ing
, un
load
ing
, pac
kin
g, a
nd
sto
rag
e an
d w
areh
ou
sin
g f
rom
ser
vice
tax
es.
Feb
-14
Foo
d s
ub
sid
ies
As
par
t o
f it
s 20
14–1
5 b
ud
get
, rai
sed
allo
cati
on
s to
fo
od
su
bsi
die
s to
Ru
pee
s 1.
15 t
rilli
on
(U
SD 1
9 b
illio
n),
up
fro
m R
up
ees
920
bill
ion
(U
SD 1
5 b
illio
n)
the
pre
vio
us
year
. Th
e fu
nd
s w
ill b
e m
ain
ly d
esti
ned
to
imp
lem
ent
the
Nat
ion
al F
oo
d S
ecu
rity
Act
.
Jap
anR
ice
No
v-13
Pro
du
ctio
n a
dju
stm
ent
pro
gra
m
An
no
un
ced
th
at it
pla
nn
ed t
o a
bo
lish
th
e lo
ng
-sta
nd
ing
ric
e p
rod
uct
ion
ad
just
men
t p
rog
ram
me
by
end
Mar
ch 2
019.
Th
e p
lan
en
visa
ges
a g
rad
ual
red
uct
ion
of
the
sub
sid
y o
f Y
en 1
5,00
0 p
er 1
0are
(U
SD 1
47
6 p
er h
ecta
re)
gra
nte
d t
o p
rod
uce
rs a
dh
erin
g t
o t
he
rice
div
ersi
on
pro
gra
mm
e an
d t
he
abo
litio
n o
f p
aym
ents
mad
e to
far
mer
s in
th
e ev
ent
that
pri
ces
fall
bel
ow
pre
vio
us
year
s’ le
vel.
At
the
sam
e ti
me,
p
rod
uct
ion
of
no
n-t
able
ric
e is
to
be
acti
vely
pro
mo
ted
via
incr
ease
s in
th
e Y
en 8
0,00
0 p
er 1
0are
(U
SD
7 87
2 p
er h
ecta
re)
sub
sid
y o
ffer
ed t
o f
arm
ers
pro
du
cin
g r
ice
for
flo
ur
or
anim
al f
eed
. Sep
arat
e p
lan
s al
so a
im t
o p
rom
ote
th
e co
nso
lidat
ion
of
lan
d f
rom
sm
all-
ho
lder
s fo
r le
ase
to la
rger
-sca
le f
arm
ing
o
per
atio
ns.
Mal
aysi
aR
ice
Jan
-14
Sup
po
rt p
rice
sSe
t p
add
y p
rod
uce
r p
rice
s at
Rin
gg
it 1
200
per
to
nn
e (U
SD 3
66).
Th
e m
easu
re w
ill b
e ap
plic
able
acr
oss
th
e co
un
try
star
tin
g w
ith
th
e M
arch
lau
nch
of
2014
cro
p h
arve
stin
g a
ctiv
itie
s an
d is
exp
ecte
d t
o a
ssis
t in
re
du
cin
g t
he
nu
mb
er o
f m
idd
lem
en in
th
e su
pp
ly c
hai
n a
nd
en
sure
bet
ter
pro
fits
to
far
mer
s.
Nig
eria
Ric
eN
ov-
13C
ust
om
s va
luat
ion
An
no
un
ced
pla
ns
to lo
wer
imp
ort
du
ties
on
ric
e af
ter
reac
hin
g a
n a
gre
emen
t w
ith
sec
tor
rep
rese
nta
tive
s. T
he
mo
ve is
gea
red
at
arre
stin
g t
he
larg
e u
no
ffici
al r
ice
infl
ow
s th
rou
gh
lan
d b
ord
ers
trig
ger
ed b
y th
e im
po
siti
on
of
a 10
per
cen
t d
uty
an
d a
100
per
cen
t le
vy o
n im
po
rted
hu
sked
an
d
mill
ed/s
emi-
mill
ed r
ice
in 2
013.

Ma
jor p
olicy d
eve
lop
me
nts
80 81FOOD OUTLOOKMAY 2014
CO
UN
TRY
PRO
DU
CT
DA
TEPO
LIC
Y C
ATE
GO
RY
/INST
RU
MEN
TD
ESC
RIP
TIO
N
Phili
pp
ines
Ric
e
Jan
-14
Foo
d s
ub
sid
ies
Do
ub
led
allo
cati
on
s o
f g
ove
rnm
ent
sub
sid
ized
ric
e re
leas
ed t
hro
ug
h a
ccre
dit
ed d
eale
rs in
Man
ila, S
an
Juan
an
d Q
uez
on
Cit
y to
ass
ist
vuln
erab
le g
rou
ps
in c
op
ing
wit
h r
isin
g p
rice
s.
No
v-13
Imp
ort
qu
ota
Ap
pro
ved
imp
ort
s o
f 50
0 00
0 to
nn
es o
f ri
ce t
o r
efu
rbis
h in
ven
tori
es a
nd
ser
vice
rel
ief
op
erat
ion
s la
un
ched
in t
he
afte
rmat
h o
f ty
ph
oo
n H
aiya
n.
Jan
-14
Imp
ort
qu
ota
An
no
un
ced
th
at a
pp
licat
ion
s to
imp
ort
163
000
to
nn
es o
f ri
ce u
nd
er 2
014
Min
imu
m A
cces
s V
olu
me
(MA
V)
cou
ntr
y-sp
ecifi
c q
uo
tas
wo
uld
be
op
ened
to
th
e p
riva
te s
ecto
r, st
arti
ng
1 F
ebru
ary
2014
. Im
po
rted
vo
lum
es a
re t
o a
rriv
e n
o la
ter
than
31
Dec
emb
er 2
014.
Mar
-14
Imp
ort
qu
ota
An
no
un
ced
th
at it
wo
uld
co
nd
uct
an
op
en t
end
er o
n 1
5 A
pri
l to
imp
ort
800
000
to
nn
es o
f 15
p
erce
nt
bro
ken
ric
e fo
r d
eliv
ery
bet
wee
n M
ay a
nd
Au
gu
st 2
014.
Th
e su
pp
lies
are
nee
ded
to
ref
urb
ish
in
ven
tori
es a
hea
d o
f th
e le
an s
easo
n a
nd
to
sta
bili
ze p
rice
s.
Rep
ub
lic o
f K
ore
aR
ice
Jan
-14
Pro
du
ctio
n s
up
po
rtR
aise
d d
irec
t ar
ea p
aym
ents
to
ric
e fa
rmer
s u
nd
er t
he
Ric
e In
com
e C
om
pen
sati
on
Act
by
13 p
erce
nt
to
Wo
n 9
00 0
00 (
USD
837
) p
er h
ecta
re. T
he
rice
tar
get
pri
ce u
sed
to
cal
cula
te d
efici
ency
pay
men
ts w
as a
lso
ra
ised
by
11 p
erce
nt
to W
on
188
000
per
80
kilo
s (U
SD 2
186
per
to
nn
e).
Ru
ssia
n F
eder
atio
nR
ice
Oct
-13
Imp
ort
res
tric
tio
ns,
ph
yto
san
itar
y m
easu
res
Imp
ose
d t
emp
ora
ry im
po
rt r
estr
icti
on
s o
n q
uar
anti
ne
pro
du
cts
of
hig
h p
hyt
osa
nit
ary
risk
, in
clu
din
g
rice
, ori
gin
ated
in P
akis
tan
. Res
tric
tio
ns
cam
e in
to e
ffec
t o
n 1
Oct
ob
er 2
013.
Feb
-14
Imp
ort
res
tric
tio
ns,
ph
yto
san
itar
y m
easu
res
Lift
ed t
he
tem
po
rary
imp
ort
res
tric
tio
ns
imp
ose
d in
Oct
ob
er 2
013
on
all
qu
aran
tin
e p
rod
uct
s o
f h
igh
p
hyt
osa
nit
ary
risk
ori
gin
ated
in P
akis
tan
(ex
cep
t fo
r p
ota
toes
) ef
fect
ive
24 F
ebru
ary
2014
.
Sri L
anka
Ric
e
No
v-13
Pro
du
ctio
n s
up
po
rt
As
par
t o
f it
s 20
14 b
ud
get
ary
allo
cati
on
s, a
nn
ou
nce
d t
hat
fer
tiliz
ers
wo
uld
co
nti
nu
e to
be
sold
at
a su
bsi
diz
ed r
ate
of
rup
ees
350
per
50
kilo
bag
(U
SD 5
4 p
er t
on
ne)
to
pad
dy
farm
ers
in 2
014,
an
d t
hat
th
e cr
op
insu
ran
ce s
chem
e in
tro
du
ced
a y
ear
earl
ier
wo
uld
be
exp
and
ed. A
dd
itio
nal
go
vern
men
t in
itia
tive
s w
ill in
clu
de
the
lau
nch
of
a th
ree-
year
pro
gra
mm
e to
bri
ng
ab
and
on
ed p
add
y la
nd
bac
k in
to c
ult
ivat
ion
o
f p
add
y an
d o
ther
cro
ps.
Th
ey a
lso
en
com
pas
s in
cen
tive
s to
pro
du
ce h
igh
qu
alit
y se
eds
and
pla
nti
ng
m
ater
ial,
as w
ell a
s th
e re
hab
ilita
tio
n o
f ir
rig
atio
n in
fras
tru
ctu
re.
Ap
ril-
14Im
po
rt t
arif
f, t
ax p
olic
y
Rem
ove
d t
he
Ru
pee
s 20
per
kilo
(U
SD 1
53 p
er t
on
ne)
du
ty le
vied
on
ric
e, t
og
eth
er w
ith
oth
er a
pp
licab
le
char
ges
, in
clu
din
g t
he
Port
an
d A
irp
ort
Dev
elo
pm
ent
Levy
, Val
ue
Ad
ded
Tax
es a
nd
th
e N
atio
n B
uild
ing
Ta
x. A
low
er r
ate
of
Ru
pee
s 5
per
kilo
(U
SD 3
8 p
er t
on
ne)
will
inst
ead
ap
ply
to
imp
ort
ed p
add
y, h
usk
ed,
sem
i/wh
olly
mill
ed a
nd
/or
bro
ken
ric
e, e
ffec
tive
10
Ap
ril 2
014.
Ap
r-14
Pric
e co
ntr
ols
Set
max
imu
m r
etai
l pri
ces
for
rice
at
Ru
pee
s 77
(U
SD 0
.6)
per
kilo
of
Sam
ba
rice
(ex
cep
tin
g K
eeri
Sam
ba
and
Su
du
ru S
amb
a), a
t R
up
ees
68 (
USD
0.5
2) p
er k
ilo o
f W
hit
e N
adu
, Ru
pee
s 66
(U
SD 0
.50)
fo
r R
ed
Nad
u a
nd
Wh
ite
Raw
an
d a
t R
up
ees
60 (
USD
0.4
6) p
er k
ilo o
f R
ed R
aw r
ice.
Thai
lan
dR
ice
Feb
-14
Go
vern
men
t p
rocu
rem
ent
An
no
un
ced
th
at it
co
uld
no
t ex
ten
d t
he
pad
dy
ple
dg
ing
pro
gra
mm
e to
co
ver
2013
/14
off
seas
on
cro
ps
bec
ause
of
the
limit
ed s
pen
din
g p
ow
ers
it h
eld
as
a ca
reta
ker
go
vern
men
t.
Dec
13-
Ap
r 14
Sto
ck r
elea
seA
uct
ion
ed o
ff a
bo
ut
1.7
mill
ion
to
nn
es o
f ri
ce f
rom
go
vern
men
t st
ock
s th
rou
gh
op
en t
end
ers
and
1.7
m
illio
n t
on
nes
th
rou
gh
th
e A
gri
cult
ura
l Fu
ture
s Ex
chan
ge
of
Thai
lan
d (
AFE
T).
Un
ited
Sta
tes
of
Am
eric
aR
ice/
Wh
eat/
Mai
zeFe
b-1
4Pr
od
uct
ion
su
pp
ort
, sec
tor
po
licy
fram
ewo
rk
Pass
ed t
he
Ag
ricu
ltu
ral A
ct o
f 20
14, o
r 20
14 F
arm
Bill
, au
tho
rizi
ng
ag
ricu
ltu
ral p
rog
ram
mes
fo
r th
e 20
14–2
018
per
iod
. Key
pro
visi
on
s o
f th
e A
ct in
clu
de
the
con
tin
uat
ion
of
mar
keti
ng
ass
ista
nce
loan
s an
d
the
rep
eal o
f th
e D
irec
t an
d C
ou
nte
r-C
yclic
al P
aym
ent
Pro
gra
mm
e (D
CP)
an
d t
he
Ave
rag
e C
rop
Rev
enu
e El
ecti
on
(A
CR
E) p
rog
ram
me
star
tin
g w
ith
th
e 20
14 c
rop
yea
r. In
th
eir
stea
d, U
S fa
rmer
s w
ill h
ave
to o
pt
bet
wee
n r
even
ue-
loss
pro
tect
ion
off
ered
un
der
th
e A
gri
cult
ura
l Ris
k C
ove
rag
e p
rog
ram
me
(eit
her
on
a
com
mo
dit
y-b
y-co
mm
od
ity
bas
is o
r fo
r al
l co
vere
d c
om
mo
dit
ies
cult
ivat
ed in
a f
arm
), o
r fo
r p
rote
ctio
n
agai
nst
low
pri
ces
un
der
th
e Pr
ice
Loss
Co
vera
ge
Pro
gra
mm
e (P
LC).
Th
e la
tter
will
issu
e p
aym
ents
to
en
rolle
d f
arm
ers
in t
he
even
t th
at M
arke
tin
g Y
ear
Ave
rag
e Pr
ices
(o
r m
arke
tin
g a
ssis
tan
ce lo
an r
ates
, d
epen
din
g o
n w
hic
h is
hig
her
) fa
ll b
elo
w t
he
follo
win
g r
efer
ence
leve
ls: U
SD 1
4.0/
cwt
(USD
309
per
to
nn
e) f
or
lon
g-
and
med
ium
-gra
in r
ice
and
USD
16.
1/cw
t (U
SD 3
55 p
er t
on
ne)
in t
he
case
of
Cal
rose
m
ediu
m-g
rain
ric
e. R
egar
din
g w
hea
t an
d m
aize
, th
e re
fere
nce
leve
ls a
re U
SD 5
.5 p
er b
ush
el (
USD
203
p
er t
on
ne)
an
d U
SD 3
.7 p
er b
ush
el (
USD
148
per
to
nn
e) r
esp
ecti
vely
.
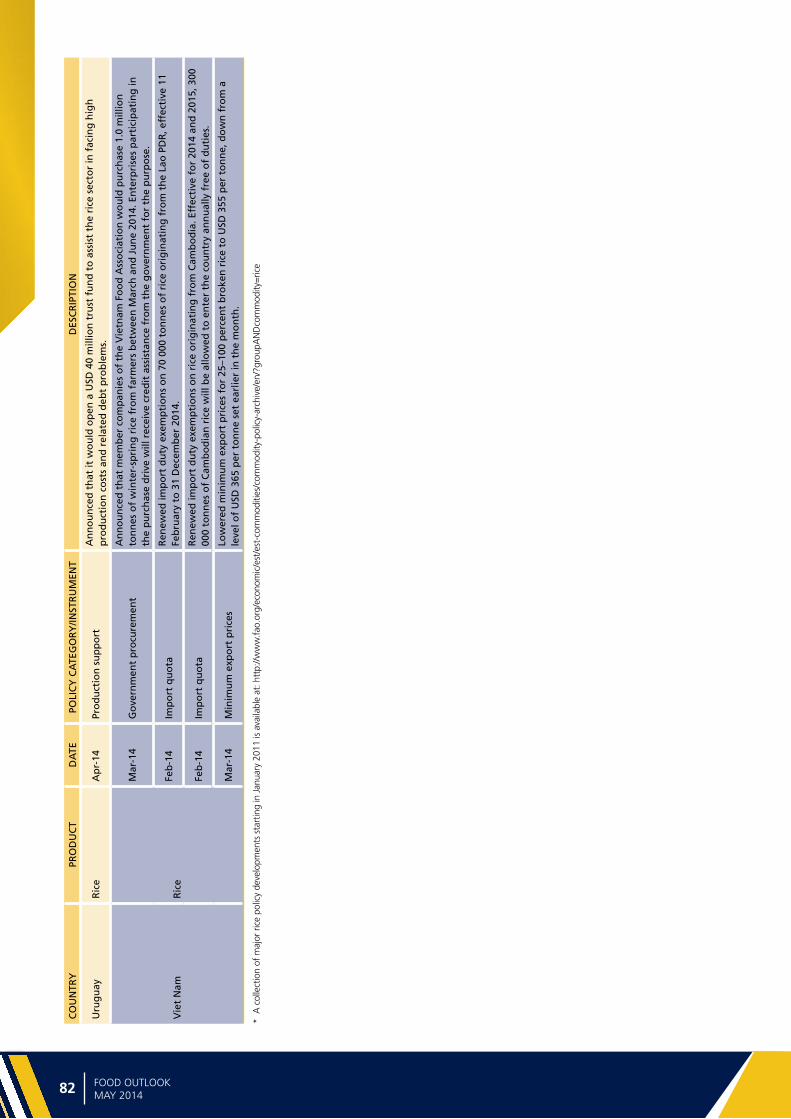
Ma
jor
po
licy
de
velo
pm
en
ts
82 83FOOD OUTLOOKMAY 2014
* A
col
lect
ion
of m
ajor
ric
e po
licy
deve
lopm
ents
sta
rtin
g in
Jan
uary
201
1 is
ava
ilabl
e at
: htt
p://w
ww
.fao
.org
/eco
nom
ic/e
st/e
st-c
omm
oditi
es/c
omm
odity
-pol
icy-
arch
ive/
en/?
grou
pAN
Dco
mm
odity
=ric
e
CO
UN
TRY
PRO
DU
CT
DA
TEPO
LIC
Y C
ATE
GO
RY
/INST
RU
MEN
TD
ESC
RIP
TIO
N
Uru
gu
ayR
ice
Ap
r-14
Pro
du
ctio
n s
up
po
rtA
nn
ou
nce
d t
hat
it w
ou
ld o
pen
a U
SD 4
0 m
illio
n t
rust
fu
nd
to
ass
ist
the
rice
sec
tor
in f
acin
g h
igh
p
rod
uct
ion
co
sts
and
rel
ated
deb
t p
rob
lem
s.
Vie
t N
amR
ice
Mar
-14
Go
vern
men
t p
rocu
rem
ent
An
no
un
ced
th
at m
emb
er c
om
pan
ies
of
the
Vie
tnam
Fo
od
Ass
oci
atio
n w
ou
ld p
urc
has
e 1.
0 m
illio
n
ton
nes
of
win
ter-
spri
ng
ric
e fr
om
far
mer
s b
etw
een
Mar
ch a
nd
Ju
ne
2014
. En
terp
rise
s p
arti
cip
atin
g in
th
e p
urc
has
e d
rive
will
rec
eive
cre
dit
ass
ista
nce
fro
m t
he
go
vern
men
t fo
r th
e p
urp
ose
.
Feb
-14
Imp
ort
qu
ota
Ren
ewed
imp
ort
du
ty e
xem
pti
on
s o
n 7
0 00
0 to
nn
es o
f ri
ce o
rig
inat
ing
fro
m t
he
Lao
PD
R, e
ffec
tive
11
Feb
ruar
y to
31
Dec
emb
er 2
014.
Feb
-14
Imp
ort
qu
ota
Ren
ewed
imp
ort
du
ty e
xem
pti
on
s o
n r
ice
ori
gin
atin
g f
rom
Cam
bo
dia
. Eff
ecti
ve f
or
2014
an
d 2
015,
300
00
0 to
nn
es o
f C
amb
od
ian
ric
e w
ill b
e al
low
ed t
o e
nte
r th
e co
un
try
ann
ual
ly f
ree
of
du
ties
.
Mar
-14
Min
imu
m e
xpo
rt p
rice
sLo
wer
ed m
inim
um
exp
ort
pri
ces
for
25–1
00 p
erce
nt
bro
ken
ric
e to
USD
355
per
to
nn
e, d
ow
n f
rom
a
leve
l of
USD
365
per
to
nn
e se
t ea
rlie
r in
th
e m
on
th.
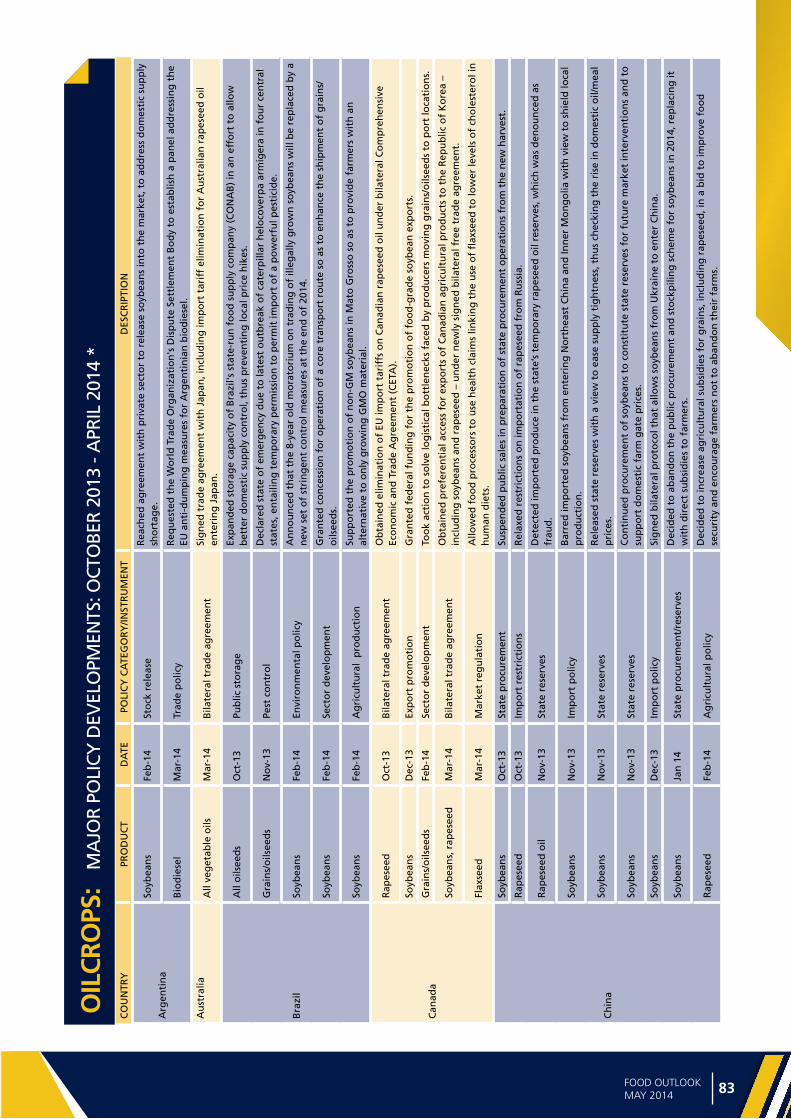
Ma
jor p
olicy d
eve
lop
me
nts
82 83FOOD OUTLOOKMAY 2014
OIL
CRO
PS:
MA
JOR
POLI
CY D
EVEL
OPM
ENTS
: OCT
OBE
R 20
13 -
APR
IL 2
014
*
CO
UN
TRY
PRO
DU
CT
DA
TEPO
LIC
Y C
ATE
GO
RY
/INST
RU
MEN
TD
ESC
RIP
TIO
N
Arg
enti
na
Soyb
ean
sFe
b-1
4St
ock
rel
ease
Rea
ched
ag
reem
ent
wit
h p
riva
te s
ecto
r to
rel
ease
so
ybea
ns
into
th
e m
arke
t, t
o a
dd
ress
do
mes
tic
sup
ply
sh
ort
age.
Bio
die
sel
Mar
-14
Trad
e p
olic
yR
equ
este
d t
he
Wo
rld
Tra
de
Org
aniz
atio
n's
Dis
pu
te S
ettl
emen
t B
od
y to
est
ablis
h a
pan
el a
dd
ress
ing
th
e EU
an
ti-d
um
pin
g m
easu
res
for
Arg
enti
nia
n b
iod
iese
l.
Au
stra
liaA
ll ve
get
able
oils
Mar
-14
Bila
tera
l tra
de
agre
emen
tSi
gn
ed t
rad
e ag
reem
ent
wit
h J
apan
, in
clu
din
g im
po
rt t
arif
f el
imin
atio
n f
or
Au
stra
lian
rap
esee
d o
il en
teri
ng
Jap
an.
Bra
zil
All
oils
eed
sO
ct-1
3Pu
blic
sto
rag
eEx
pan
ded
sto
rag
e ca
pac
ity
of
Bra
zil's
sta
te-r
un
fo
od
su
pp
ly c
om
pan
y (C
ON
AB
) in
an
eff
ort
to
allo
w
bet
ter
do
mes
tic
sup
ply
co
ntr
ol,
thu
s p
reve
nti
ng
loca
l pri
ce h
ikes
.
Gra
ins/
oils
eed
sN
ov-
13Pe
st c
on
tro
l D
ecla
red
sta
te o
f em
erg
ency
du
e to
late
st o
utb
reak
of
cate
rpill
ar h
elo
cove
rpa
arm
iger
a in
fo
ur
cen
tral
st
ates
, en
taili
ng
tem
po
rary
per
mis
sio
n t
o p
erm
it im
po
rt o
f a
po
wer
ful p
esti
cid
e.
Soyb
ean
sFe
b-1
4En
viro
nm
enta
l po
licy
An
no
un
ced
th
at t
he
8-ye
ar o
ld m
ora
tori
um
on
tra
din
g o
f ill
egal
ly g
row
n s
oyb
ean
s w
ill b
e re
pla
ced
by
a n
ew s
et o
f st
rin
gen
t co
ntr
ol m
easu
res
at t
he
end
of
2014
.
Soyb
ean
sFe
b-1
4Se
cto
r d
evel
op
men
tG
ran
ted
co
nce
ssio
n f
or
op
erat
ion
of
a co
re t
ran
spo
rt r
ou
te s
o a
s to
en
han
ce t
he
ship
men
t o
f g
rain
s/o
ilsee
ds.
Soyb
ean
sFe
b-1
4A
gri
cult
ura
l p
rod
uct
ion
Sup
po
rted
th
e p
rom
oti
on
of
no
n-G
M s
oyb
ean
s in
Mat
o G
ross
o s
o a
s to
pro
vid
e fa
rmer
s w
ith
an
al
tern
ativ
e to
on
ly g
row
ing
GM
O m
ater
ial.
Can
ada
Rap
esee
dO
ct-1
3B
ilate
ral t
rad
e ag
reem
ent
Ob
tain
ed e
limin
atio
n o
f EU
imp
ort
tar
iffs
on
Can
adia
n r
apes
eed
oil
un
der
bila
tera
l Co
mp
reh
ensi
ve
Eco
no
mic
an
d T
rad
e A
gre
emen
t (C
ETA
).
Soyb
ean
sD
ec-1
3Ex
po
rt p
rom
oti
on
Gra
nte
d f
eder
al f
un
din
g f
or
the
pro
mo
tio
n o
f fo
od
-gra
de
soyb
ean
exp
ort
s.
Gra
ins/
oils
eed
sFe
b-1
4Se
cto
r d
evel
op
men
tTo
ok
acti
on
to
so
lve
log
isti
cal b
ott
len
ecks
fac
ed b
y p
rod
uce
rs m
ovi
ng
gra
ins/
oils
eed
s to
po
rt lo
cati
on
s.
Soyb
ean
s, r
apes
eed
Mar
-14
Bila
tera
l tra
de
agre
emen
tO
bta
ined
pre
fere
nti
al a
cces
s fo
r ex
po
rts
of
Can
adia
n a
gri
cult
ura
l pro
du
cts
to t
he
Rep
ub
lic o
f K
ore
a –
incl
ud
ing
so
ybea
ns
and
rap
esee
d –
un
der
new
ly s
ign
ed b
ilate
ral f
ree
trad
e ag
reem
ent.
Flax
seed
Mar
-14
Mar
ket
reg
ula
tio
nA
llow
ed f
oo
d p
roce
sso
rs t
o u
se h
ealt
h c
laim
s lin
kin
g t
he
use
of
flax
seed
to
low
er le
vels
of
cho
lest
ero
l in
h
um
an d
iets
.
Ch
ina
Soyb
ean
sO
ct-1
3St
ate
pro
cure
men
tSu
spen
ded
pu
blic
sal
es in
pre
par
atio
n o
f st
ate
pro
cure
men
t o
per
atio
ns
fro
m t
he
new
har
vest
.
Rap
esee
dO
ct-1
3Im
po
rt r
estr
icti
on
sR
elax
ed r
estr
icti
on
s o
n im
po
rtat
ion
of
rap
esee
d f
rom
Ru
ssia
.
Rap
esee
d o
ilN
ov-
13St
ate
rese
rves
Det
ecte
d im
po
rted
pro
du
ce in
th
e st
ate’
s te
mp
ora
ry r
apes
eed
oil
rese
rves
, wh
ich
was
den
ou
nce
d a
s fr
aud
.
Soyb
ean
sN
ov-
13Im
po
rt p
olic
yB
arre
d im
po
rted
so
ybea
ns
fro
m e
nte
rin
g N
ort
hea
st C
hin
a an
d In
ner
Mo
ng
olia
wit
h v
iew
to
sh
ield
loca
l p
rod
uct
ion
.
Soyb
ean
sN
ov-
13St
ate
rese
rves
Rel
ease
d s
tate
res
erve
s w
ith
a v
iew
to
eas
e su
pp
ly t
igh
tnes
s, t
hu
s ch
ecki
ng
th
e ri
se in
do
mes
tic
oil/
mea
l p
rice
s.
Soyb
ean
sN
ov-
13St
ate
rese
rves
Co
nti
nu
ed p
rocu
rem
ent
of
soyb
ean
s to
co
nst
itu
te s
tate
res
erve
s fo
r fu
ture
mar
ket
inte
rven
tio
ns
and
to
su
pp
ort
do
mes
tic
farm
gat
e p
rice
s.
Soyb
ean
sD
ec-1
3Im
po
rt p
olic
ySi
gn
ed b
ilate
ral p
roto
col t
hat
allo
ws
soyb
ean
s fr
om
Ukr
ain
e to
en
ter
Ch
ina.
Soyb
ean
sJa
n 1
4St
ate
pro
cure
men
t/re
serv
esD
ecid
ed t
o a
ban
do
n t
he
pu
blic
pro
cure
men
t an
d s
tock
pili
ng
sch
eme
for
soyb
ean
s in
201
4, r
epla
cin
g it
w
ith
dir
ect
sub
sid
ies
to f
arm
ers.
Rap
esee
dFe
b-1
4A
gri
cult
ura
l po
licy
Dec
ided
to
incr
ease
ag
ricu
ltu
ral s
ub
sid
ies
for
gra
ins,
incl
ud
ing
rap
esee
d, i
n a
bid
to
imp
rove
fo
od
se
curi
ty a
nd
en
cou
rag
e fa
rmer
s n
ot
to a
ban
do
n t
hei
r fa
rms.

Ma
jor
po
licy
de
velo
pm
en
ts
84 85FOOD OUTLOOKMAY 2014
CO
UN
TRY
PRO
DU
CT
DA
TEPO
LIC
Y C
ATE
GO
RY
/INST
RU
MEN
TD
ESC
RIP
TIO
N
Ch
ina
Gra
ins/
Oils
eed
sFe
b-1
4A
gri
cult
ura
l po
licy
Dir
ecte
d s
tate
-ow
ned
gra
in fi
rms
to in
vest
in o
vers
eas
mer
ger
s an
d a
cqu
isit
ion
s so
as
to s
et u
p a
glo
bal
su
pp
ly c
hai
n f
or
gra
ins/
oils
eed
s.
Bio
die
sel
Feb
-14
Ren
ewab
le e
ner
gy
po
licy
Ap
pro
ved
co
mm
erci
al u
se o
f b
io-a
viat
ion
fu
el w
ith
a v
iew
to
div
ersi
fy f
uel
co
nsu
mp
tio
n a
nd
red
uce
ca
rbo
n e
mis
sio
ns.
All
Mar
-14
Pro
du
ctio
n s
up
po
rtIs
sued
new
gu
idel
ines
to
imp
rove
acc
ess
of
farm
ers
and
sm
all c
om
pan
ies
to a
deq
uat
e cr
edit
lin
es.
Rap
esee
d o
ilM
ar-1
4St
ate
rese
rves
Ord
ered
rel
ease
of
rap
esee
d o
il fr
om
sta
te r
eser
ves
in o
rder
to
mak
e ro
om
fo
r p
rocu
rem
ent
fro
m n
ew
har
vest
.
Rap
esee
dM
ar-1
4Im
po
rt r
estr
icti
on
sA
llow
ed im
po
rts
of
Can
adia
n r
apes
eed
mea
l to
res
um
e, f
ollo
win
g t
he
new
reg
istr
atio
n p
roto
col i
n
pla
ce s
ince
ear
ly 2
013.
Euro
pea
n U
nio
n
Rap
esee
d o
ilO
ct-1
3B
ilate
ral t
rad
e ag
reem
ent
Ag
reed
to
th
e el
imin
atio
n o
f EU
imp
ort
tar
iffs
on
Can
adia
n r
apes
eed
oil,
un
der
bila
tera
l Co
mp
reh
ensi
ve
Eco
no
mic
an
d T
rad
e A
gre
emen
t (C
ETA
).
Palm
oil
and
der
ived
p
rod
uct
sJa
n-1
4Im
po
rt p
olic
yEn
ded
pre
fere
nti
al im
po
rt d
uti
es f
or
Ind
on
esia
n p
alm
oil,
pal
m o
il-b
ased
ole
o-c
hem
ical
s an
d b
iofu
els
un
der
th
e re
vise
d G
ener
al S
yste
m o
f Pr
efer
ence
s (G
SP).
Oliv
e o
ilFe
b-1
4D
isea
se p
reve
nti
on
Ban
ned
th
e m
ove
men
t o
f sp
ecifi
c p
lan
ts o
ut
of
an It
alia
n r
egio
n t
o h
elp
pre
ven
t th
e sp
read
of
a d
isea
se
affe
ctin
g o
live
tree
s.
Oliv
e o
ilFe
b-1
4Pr
od
uct
lab
ellin
gA
nn
ou
nce
d t
he
intr
od
uct
ion
– in
Dec
emb
er 2
014
– o
f n
ew la
bel
ling
ru
les
aim
ed a
t m
akin
g p
rod
uct
in
form
atio
n e
asie
r to
rea
d a
nd
un
der
stan
d.
Sun
flo
wer
oil
Ap
r-14
Im
po
rt p
olic
yA
pp
rove
d p
rop
osa
l to
rem
ove
, as
of
23 A
pri
l, im
po
rt t
arif
fs o
n s
ever
al U
krai
nia
n a
gri
cult
ura
l co
mm
od
itie
s –
incl
ud
ing
cru
de
and
refi
ned
su
nfl
ow
er o
il –
anti
cip
atin
g o
n-g
oin
g n
ego
tiat
ion
s o
f a
com
pre
hen
sive
EU
-Ukr
ain
e fr
ee t
rad
e ag
reem
ent.
Ind
ia
Rap
esee
dO
ct-1
3Su
pp
ort
pri
ceR
aise
d o
ffici
al p
rocu
rem
ent
pri
ce f
or
the
rab
i rap
esee
d c
rop
.
Oliv
e o
ilO
ct-1
3M
arke
t re
gu
lati
on
Reg
ula
ted
th
e d
om
esti
c o
live
oil
mar
ket
to s
tan
dar
diz
e p
rod
uct
s, s
o a
s to
pre
ven
t im
pu
riti
es,
adu
lter
atio
n a
nd
oth
er h
ealt
h-r
elat
ed p
rob
lem
s.
Gro
un
dn
ut
No
v-13
Pub
lic p
rocu
rem
ent
Prep
ared
fo
r re
sum
pti
on
of
stat
e p
rocu
rem
ent
follo
win
g a
bu
mp
er c
rop
.
All
edib
le o
ilsJa
n-1
4Im
po
rt d
uty
Rai
sed
imp
ort
du
ty o
n r
efin
ed v
eget
able
oils
, wid
enin
g t
he
du
ty d
iffe
ren
tial
bet
wee
n c
rud
e an
d r
efin
ed
oil,
so
as
to p
rote
ct t
he
do
mes
tic
refi
nin
g in
du
stry
.
Veg
etab
le o
il d
eriv
ativ
es
Feb
-14
Tra
de
po
licy
Init
iate
d in
vest
igat
ion
on
incr
ease
d im
po
rts
of
satu
rate
d f
atty
alc
oh
ols
ad
dre
ssin
g c
laim
s th
at s
uch
im
po
rts
wer
e h
arm
ing
th
e d
om
esti
c re
fin
ing
ind
ust
ry.
All
edib
le o
ilsFe
b-1
4C
on
sum
er p
olic
yEx
ten
ded
a d
ead
line
for
end
ing
th
e sa
le o
f ed
ible
oils
in lo
ose
fo
rm s
o a
s n
ot
to h
arm
po
or
con
sum
ers.
All
oils
eed
sM
ar-1
4Em
erg
ency
rel
ief
An
no
un
ced
mea
sure
s to
su
pp
ort
far
mer
s af
fect
ed b
y h
eavy
rai
ns
in t
he
stat
es o
f M
ahar
ash
tra
and
M
adh
ya P
rad
esh
.
Ind
on
esia
Soyb
ean
sN
ov-
13St
ate
pu
rch
ases
Co
nti
nu
ed s
tate
pu
rch
ases
wit
h a
vie
w t
o s
tab
ilize
do
mes
tic
pri
ces
of
soy
foo
d p
rod
uct
s.
Soyb
ean
sJa
n-1
4Pr
od
uct
ion
su
pp
ort
Rai
sed
go
vern
men
t-se
t fa
rm g
ate
pri
ce f
or
soyb
ean
s to
sti
mu
late
do
mes
tic
pro
du
ctio
n.
Palm
oil
Oct
-13
to
Ap
r-14
Exp
ort
po
licy
Left
in p
lace
th
e sl
idin
g e
xpo
rt t
ax r
egim
e u
sed
to
pre
ven
t h
ikes
in c
on
sum
er p
rice
s (v
ia r
egu
lati
on
of
do
mes
tic
sup
plie
s) a
nd
to
sti
mu
late
gro
wth
in d
ow
nst
ream
pal
m o
il p
roce
ssin
g.
Isla
mic
Rep
ub
lic o
f Ir
anA
ll ed
ible
oils
Jan
-14
Foo
d s
ub
sid
ySt
arte
d p
ub
lic d
istr
ibu
tio
n o
f fo
od
pac
kag
es, i
ncl
ud
ing
veg
etab
le o
il.
Jap
anA
ll ve
get
able
oils
Mar
-14
Bila
tera
l tra
de
agre
emen
tSi
gn
ed t
rad
e ag
reem
ent
wit
h A
ust
ralia
, in
clu
din
g im
po
rt t
arif
f el
imin
atio
n f
or
Au
stra
lian
rap
esee
d o
il en
teri
ng
Jap
an.
Rep
ub
lic o
f K
ore
a
Soyb
ean
sO
ct-1
3St
ate
rese
rves
Set
up
pu
blic
sto
cks
of
wh
eat
and
so
ybea
ns.
Soyb
ean
an
d r
apes
eed
Mar
-14
Bila
tera
l tra
de
agre
emen
tG
ran
ted
pre
fere
nti
al a
cces
s to
ag
ricu
ltu
ral i
mp
ort
s fr
om
Can
ada
– in
clu
din
g s
oyb
ean
s an
d r
apes
eed
, u
nd
er n
ewly
sig
ned
bila
tera
l fre
e tr
ade
agre
emen
t.

Ma
jor p
olicy d
eve
lop
me
nts
84 85FOOD OUTLOOKMAY 2014
* A
col
lect
ion
of m
ajor
oilc
rop/
oil/m
eal p
olic
y de
velo
pmen
ts s
tart
ing
in J
anua
ry 2
011
is a
vaila
ble
at: h
ttp:
//ww
w.f
ao.o
rg/e
cono
mic
/est
/est
-com
mod
ities
/com
mod
ity-p
olic
y-ar
chiv
e/en
/?gr
oupA
ND
com
mod
ity=
Oils
eeds
,%20
oils
%20
and%
20m
eals
CO
UN
TRY
PRO
DU
CT
DA
TEPO
LIC
Y C
ATE
GO
RY
/INST
RU
MEN
TD
ESC
RIP
TIO
N
Mal
aysi
a
Bio
die
sel
Feb
-14
Ren
ewab
le e
ner
gy
po
licy
An
no
un
ced
nat
ion
wid
e m
and
ato
ry b
len
din
g o
f d
iese
l tra
nsp
ort
atio
n f
uel
wit
h 5
% p
alm
oil-
bas
ed
bio
die
sel f
rom
Ju
ly 2
014.
Palm
oil
Oct
-13
to
Ap
r-14
Exp
ort
po
licy
Peri
od
ical
ly a
dju
sted
exp
ort
tax
es in
lin
e w
ith
th
e n
ewly
intr
od
uce
d s
lidin
g t
ax r
egim
e, a
imin
g a
t th
e p
rote
ctio
n o
f d
om
esti
c g
row
ers
and
refi
ner
s.
Palm
oil
Ap
r-14
Bila
tera
l tra
de
agre
emen
tO
bta
ined
pre
fere
nti
al a
cces
s fo
r ex
po
rts
of
Mal
aysi
an p
alm
oil
to T
urk
ey, u
nd
er n
ewly
sig
ned
co
mp
reh
ensi
ve f
ree
trad
e ag
reem
ent
wit
h T
urk
ey.
Mex
ico
All
edib
le o
ilsD
ec-1
3Im
po
rt d
uti
esSu
spen
ded
fin
al s
tag
e o
f el
imin
atio
n o
f im
po
rt d
uti
es o
n v
eget
able
oils
wh
ich
had
bee
n s
ched
ule
d f
or
Mar
ch 2
014.
Paki
stan
Sun
flo
wer
see
dFe
b-1
4Pr
od
uct
ion
su
pp
ort
Dec
ided
to
pro
mo
te lo
cal s
un
flo
wer
see
d c
ult
ivat
ion
in a
bid
to
hel
p r
edu
ce t
he
cou
ntr
y's
defi
cien
cy in
ed
ible
oil
sup
plie
s.
Phili
pp
ines
Co
con
ut
Feb
-14
Pro
du
ctio
n s
up
po
rtA
lloca
ted
fu
nd
s fo
r th
e re
hab
ilita
tio
n o
f th
e d
om
esti
c co
con
ut
ind
ust
ry h
it b
y ty
ph
oo
n Y
ola
nd
a in
N
ove
mb
er 2
013.
Ru
ssia
n F
eder
atio
nSo
ybea
ns
Jan
-14
GM
O c
ult
ivat
ion
Allo
wed
cu
ltiv
atio
n o
f G
M s
oyb
ean
th
rou
gh
ou
t th
e R
uss
ian
Fed
erat
ion
fro
m J
uly
201
4.
Turk
eyPa
lm o
ilA
pr-
14B
ilate
ral t
rad
e ag
reem
ent
Gra
nte
d p
refe
ren
tial
acc
ess
to im
po
rts
of
pal
m o
il fr
om
Mal
aysi
a, u
nd
er n
ewly
sig
ned
co
mp
reh
ensi
ve
free
tra
de
agre
emen
t w
ith
Mal
aysi
a.
Un
ited
Sta
tes
Bio
die
sel
Mar
-14
Ren
ewab
le e
ner
gy
po
licy
An
no
un
ced
new
fu
nd
ing
fo
r co
mm
erci
al e
nte
rpri
ses
in s
up
po
rt o
f ad
van
ced
bio
fuel
pro
du
ctio
n;
dir
ecte
d t
o r
esea
rch
, in
vest
men
t an
d in
fras
tru
ctu
re p
roje
cts,
pay
men
ts c
on
cern
mai
nly
pro
du
cers
of
oil/
fat-
bas
ed b
iod
iese
l.
Soyb
ean
, gro
un
dn
ut
and
su
nfl
ow
erse
edA
pr-
14Ex
po
rt p
rom
oti
on
Mad
e av
aila
ble
new
fu
nd
ing
to
hel
p s
elec
ted
co
mm
od
ity
org
aniz
atio
ns
exp
and
co
mm
erci
al e
xpo
rts.

Ma
jor
po
licy
de
velo
pm
en
ts
86 87FOOD OUTLOOKMAY 2014
SUG
AR:
M
AJO
R PO
LICY
DEV
ELO
PMEN
TS: N
OV
EMBE
R 20
13 -
MID
APR
IL 2
014*
CO
UN
TRY
PRO
DU
CT
DA
TEPO
LIC
Y C
ATE
GO
RY
/INST
RU
MEN
TD
ESC
RIP
TIO
N
Ind
iaSu
gar
M
ar-1
4Tr
ade
No
tifi
ed a
n in
cen
tive
of
3,30
0 ru
pee
s ($
53.2
0) p
er t
on
ne
for
pro
du
ctio
n o
f ra
w s
ug
ar f
or
exp
ort
s in
an
att
emp
t to
bri
ng
do
wn
its
sto
ckp
ile b
y p
rom
oti
ng
exp
ort
s. T
he
go
vern
men
t w
ill p
rovi
de
ince
nti
ve f
or
exp
ort
of
4 m
illio
n t
on
nes
of
raw
su
gar
pro
du
ced
in t
he
2013
/14
and
201
4/15
su
gar
mar
keti
ng
yea
rs, t
hat
ru
n f
rom
Oct
ob
er t
o S
epte
mb
er. T
he
ince
nti
ve o
f 3,
300
rup
ees
will
b
e ap
plic
able
fo
r ex
po
rts
in F
ebru
ary
and
Mar
ch. F
rom
Ap
ril o
nw
ard
s, t
he
ince
nti
ve w
ill b
e re
calc
ula
ted
aft
er e
very
tw
o m
on
ths
dep
end
ing
on
th
e ru
pee
-do
llar
exch
ang
e ra
te.M
ills
nee
d
to p
ay in
cen
tive
s to
mak
e ca
ne
pay
men
ts t
o f
arm
ers,
it a
dd
ed. (
$1 =
62.
0300
Ind
ian
ru
pee
s)
Paki
stan
Sug
ar
Feb
-14
Trad
e D
ecid
ed t
o h
old
fisc
al in
cen
tive
s fo
r ex
po
rts
un
til t
he
cru
shin
g s
easo
n e
nd
s. T
he
dec
isio
n t
o
allo
w f
urt
her
su
gar
exp
ort
s co
uld
be
take
n in
Sep
tem
ber
-Oct
ob
er, w
hen
act
ual
fig
ure
s b
eco
me
avai
lab
le.
Egyp
tSu
gar
Fe
b-1
4C
on
sum
pti
on
an
d m
arke
tin
g
Plan
ned
to
allo
cate
EG
P 2.
83 b
illio
n (
403
mill
ion
USD
) fr
om
th
e b
ud
get
to
su
pp
ly b
asic
pro
du
cts
to E
gyp
tian
cit
izen
s. T
he
Egyp
tian
Su
gar
an
d In
teg
rate
d In
du
stri
es C
om
pan
y(ES
IIC)
will
rec
eive
EG
P 50
0 m
illio
n (
71 m
illio
n U
SD),
bri
ng
ing
th
e to
tal a
mo
un
t re
ceiv
ed b
y th
e co
mp
any
to E
GP
2.98
6 b
illio
n (
426
mill
ion
USD
). T
his
am
ou
nt
incl
ud
es E
GP
1.7
bill
ion
(24
2 m
illio
n U
SD)
for
del
iver
ies
of
sub
sid
ised
su
gar
du
rin
g t
he
curr
ent
fisc
alye
ar a
nd
EG
P 1.
286
bill
ion
(18
3 m
illio
n
USD
) fo
r d
eliv
erie
s m
ade
du
rin
g t
he
pre
vio
us
fisc
al y
ear
Ind
on
esia
Sug
ar
Feb
-14
Pro
du
ctio
n
Gav
e th
e g
o a
hea
d t
o t
wo
sta
te-c
on
tro
lled
pla
nta
tio
n c
om
pan
ies
to c
on
du
ct In
itia
l Pu
blic
O
ffer
ing
s th
is y
ear,
The
go
vern
men
t, t
hro
ug
h a
nu
mb
er o
f st
ateo
wn
ed c
om
pan
ies,
aim
s to
in
crea
se s
ug
ar p
rod
uct
ion
by
up
to
20%
to
mee
t d
om
esti
c su
gar
dem
and
th
at t
op
s 5.
7 m
illio
n
ton
nes
,acc
ord
ing
to
th
e Ja
kart
a Po
st n
ewsp
aper
.
* A
col
lect
ion
of m
ajor
sug
ar p
olic
y de
velo
pmen
ts s
tart
ing
in J
anua
ry 2
013
is a
lso
avai
labl
e at
: htt
p://w
ww
.fao
.org
/eco
nom
ic/e
st/e
st-c
omm
oditi
es/c
omm
odity
-pol
icy-
arch
ive/
en/?
grou
pAN
Dco
mm
odity
=Su
gar
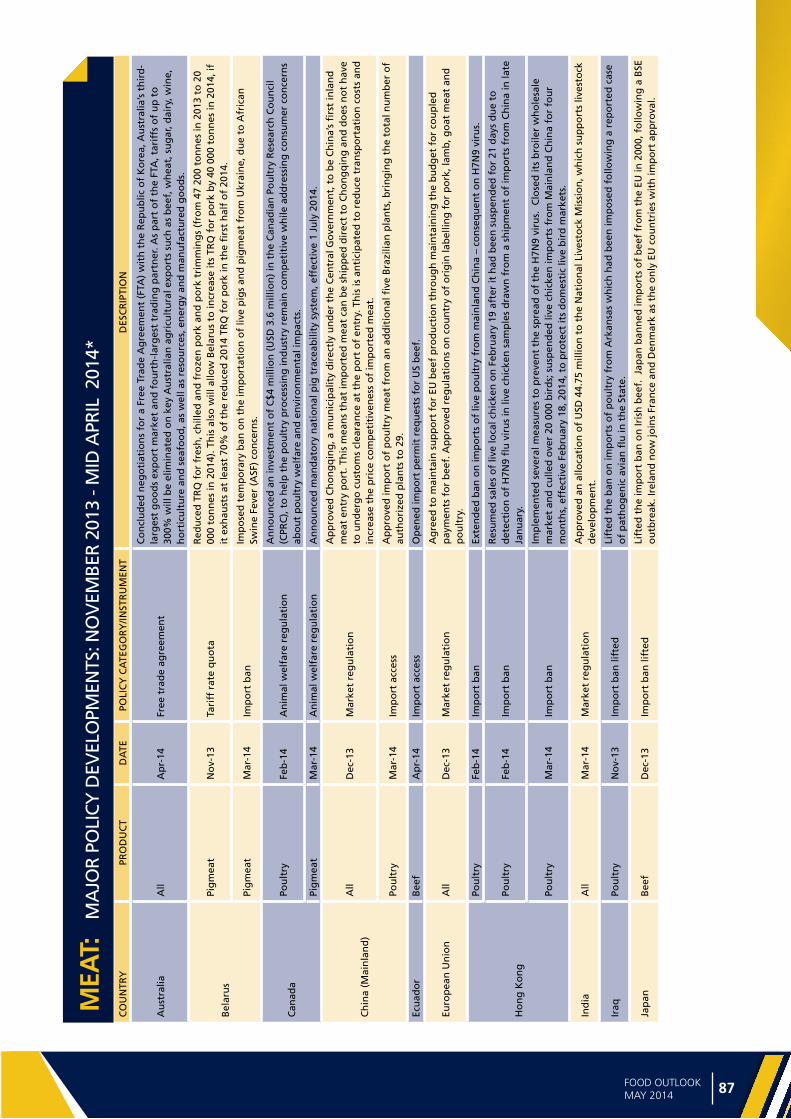
Ma
jor p
olicy d
eve
lop
me
nts
86 87FOOD OUTLOOKMAY 2014
MEA
T:
MA
JOR
POLI
CY D
EVEL
OPM
ENTS
: NO
VEM
BER
2013
- M
ID A
PRIL
201
4*
CO
UN
TRY
PRO
DU
CT
DA
TEPO
LIC
Y C
ATE
GO
RY
/INST
RU
MEN
TD
ESC
RIP
TIO
N
Au
stra
liaA
llA
pr-
14Fr
ee t
rad
e ag
reem
ent
Co
ncl
ud
ed n
ego
tiat
ion
s fo
r a
Free
Tra
de
Ag
reem
ent
(FTA
) w
ith
th
e R
epu
blic
of
Ko
rea,
Au
stra
lia’s
th
ird
-la
rges
t g
oo
ds
exp
ort
mar
ket
and
fo
urt
h-l
arg
est
trad
ing
par
tner
. As
par
t o
f th
e FT
A, t
arif
fs o
f u
p t
o
300%
will
be
elim
inat
ed o
n k
ey A
ust
ralia
n a
gri
cult
ura
l exp
ort
s su
ch a
s b
eef,
wh
eat,
su
gar
, dai
ry, w
ine,
h
ort
icu
ltu
re a
nd
sea
foo
d, a
s w
ell a
s re
sou
rces
, en
erg
y an
d m
anu
fact
ure
d g
oo
ds.
Bel
aru
s
Pig
mea
tN
ov-
13Ta
riff
rat
e q
uo
taR
edu
ced
TR
Q f
or
fres
h, c
hill
ed a
nd
fro
zen
po
rk a
nd
po
rk t
rim
min
gs
(fro
m 4
7 20
0 to
nn
es in
201
3 to
20
000
ton
nes
in 2
014)
. Th
is a
lso
will
allo
w B
elar
us
to in
crea
se it
s TR
Q f
or
po
rk b
y 40
000
to
nn
es in
201
4, if
it
exh
aust
s at
leas
t 70
% o
f th
e re
du
ced
201
4 TR
Q f
or
po
rk in
th
e fi
rst
hal
f o
f 20
14.
Pig
mea
tM
ar-1
4Im
po
rt b
anIm
po
sed
tem
po
rary
ban
on
th
e im
po
rtat
ion
of
live
pig
s an
d p
igm
eat
fro
m U
krai
ne,
du
e to
Afr
ican
Sw
ine
Feve
r (A
SF)
con
cern
s.
Can
ada
Pou
ltry
Feb
-14
An
imal
wel
fare
reg
ula
tio
nA
nn
ou
nce
d a
n in
vest
men
t o
f C
$4 m
illio
n (
USD
3.6
mill
ion
) in
th
e C
anad
ian
Po
ult
ry R
esea
rch
Co
un
cil
(CPR
C),
to
hel
p t
he
po
ult
ry p
roce
ssin
g in
du
stry
rem
ain
co
mp
etit
ive
wh
ile a
dd
ress
ing
co
nsu
mer
co
nce
rns
abo
ut
po
ult
ry w
elfa
re a
nd
en
viro
nm
enta
l im
pac
ts.
Pig
mea
tM
ar-1
4A
nim
al w
elfa
re r
egu
lati
on
An
no
un
ced
man
dat
ory
nat
ion
al p
ig t
race
abili
ty s
yste
m, e
ffec
tive
1 J
uly
201
4.
Ch
ina
(Mai
nla
nd
)
All
Dec
-13
Mar
ket
reg
ula
tio
n
Ap
pro
ved
Ch
on
gq
ing
, a m
un
icip
alit
y d
irec
tly
un
der
th
e C
entr
al G
ove
rnm
ent,
to
be
Ch
ina’
s fi
rst
inla
nd
m
eat
entr
y p
ort
. Th
is m
ean
s th
at im
po
rted
mea
t ca
n b
e sh
ipp
ed d
irec
t to
Ch
on
gq
ing
an
d d
oes
no
t h
ave
to u
nd
erg
o c
ust
om
s cl
eara
nce
at
the
po
rt o
f en
try.
Th
is is
an
tici
pat
ed t
o r
edu
ce t
ran
spo
rtat
ion
co
sts
and
in
crea
se t
he
pri
ce c
om
pet
itiv
enes
s o
f im
po
rted
mea
t.
Pou
ltry
Mar
-14
Imp
ort
acc
ess
Ap
pro
ved
imp
ort
of
po
ult
ry m
eat
fro
m a
n a
dd
itio
nal
five
Bra
zilia
n p
lan
ts, b
rin
gin
g t
he
tota
l nu
mb
er o
f au
tho
rize
d p
lan
ts t
o 2
9.
Ecu
ado
rB
eef
Ap
r-14
Imp
ort
acc
ess
Op
ened
imp
ort
per
mit
req
ues
ts f
or
US
bee
f.
Euro
pea
n U
nio
nA
llD
ec-1
3M
arke
t re
gu
lati
on
Ag
reed
to
mai
nta
in s
up
po
rt f
or
EU b
eef
pro
du
ctio
n t
hro
ug
h m
ain
tain
ing
th
e b
ud
get
fo
r co
up
led
p
aym
ents
fo
r b
eef.
Ap
pro
ved
reg
ula
tio
ns
on
co
un
try
of
ori
gin
lab
ellin
g f
or
po
rk, l
amb
, go
at m
eat
and
p
ou
ltry
.
Ho
ng
Ko
ng
Pou
ltry
Feb
-14
Imp
ort
ban
Exte
nd
ed b
an o
n im
po
rts
of
live
po
ult
ry f
rom
mai
nla
nd
Ch
ina
– co
nse
qu
ent
on
H7N
9 vi
rus.
Pou
ltry
Feb
-14
Imp
ort
ban
Res
um
ed s
ales
of
live
loca
l ch
icke
n o
n F
ebru
ary
19 a
fter
it h
ad b
een
su
spen
ded
fo
r 21
day
s d
ue
to
det
ecti
on
of
H7N
9 fl
u v
iru
s in
live
ch
icke
n s
amp
les
dra
wn
fro
m a
sh
ipm
ent
of
imp
ort
s fr
om
Ch
ina
in la
te
Jan
uar
y.
Pou
ltry
Mar
-14
Imp
ort
ban
Imp
lem
ente
d s
ever
al m
easu
res
to p
reve
nt
the
spre
ad o
f th
e H
7N9
viru
s. C
lose
d it
s b
roile
r w
ho
lesa
le
mar
ket
and
cu
lled
ove
r 20
000
bir
ds;
su
spen
ded
live
ch
icke
n im
po
rts
fro
m M
ain
lan
d C
hin
a fo
r fo
ur
mo
nth
s, e
ffec
tive
Feb
ruar
y 18
, 201
4, t
o p
rote
ct it
s d
om
esti
c liv
e b
ird
mar
kets
.
Ind
iaA
llM
ar-1
4M
arke
t re
gu
lati
on
Ap
pro
ved
an
allo
cati
on
of
USD
44.
75 m
illio
n t
o t
he
Nat
ion
al L
ives
tock
Mis
sio
n, w
hic
h s
up
po
rts
lives
tock
d
evel
op
men
t.
Iraq
Pou
ltry
No
v-13
Imp
ort
ban
lift
edLi
fted
th
e b
an o
n im
po
rts
of
po
ult
ry f
rom
Ark
ansa
s w
hic
h h
ad b
een
imp
ose
d f
ollo
win
g a
rep
ort
ed c
ase
of
pat
ho
gen
ic a
vian
flu
in t
he
Stat
e.
Jap
anB
eef
Dec
-13
Imp
ort
ban
lift
edLi
fted
th
e im
po
rt b
an o
n Ir
ish
bee
f. J
apan
ban
ned
imp
ort
s o
f b
eef
fro
m t
he
EU in
200
0, f
ollo
win
g a
BSE
o
utb
reak
. Ire
lan
d n
ow
join
s Fr
ance
an
d D
enm
ark
as t
he
on
ly E
U c
ou
ntr
ies
wit
h im
po
rt a
pp
rova
l.

Ma
jor
po
licy
de
velo
pm
en
ts
88 FOOD OUTLOOKMAY 2014
* A
col
lect
ion
of m
ajor
mea
t po
licy
deve
lopm
ents
sta
rtin
g in
Jan
uary
201
1 is
ava
ilabl
e at
: htt
p://w
ww
.fao
.org
/eco
nom
ic/e
st/e
st-c
omm
oditi
es/c
omm
odity
-pol
icy-
arch
ive/
en/?
grou
pAN
Dco
mm
odity
=M
eat
CO
UN
TRY
PRO
DU
CT
DA
TEPO
LIC
Y C
ATE
GO
RY
/INST
RU
MEN
TD
ESC
RIP
TIO
N
Kaz
akh
stan
All
No
v-13
Tari
ff r
ate
qu
ota
Red
uce
d t
he
TRQ
vo
lum
e fo
r fr
esh
, ch
illed
an
d f
roze
n b
eef,
fro
m 1
5 40
0 to
nn
es in
201
3 to
15
320
ton
nes
in 2
014.
Ad
dit
ion
ally
, Kaz
akh
stan
pro
vid
ed s
epar
ate
allo
cati
on
s fo
r ch
illed
an
d f
roze
n b
eef
in 2
014,
allo
cati
ng
20
000
ton
nes
fo
r ch
illed
bee
f an
d 1
5 30
0 to
nn
es f
or
fro
zen
bee
f. In
201
4, t
he
Kaz
akh
stan
i TR
Q v
olu
mes
fo
r fr
esh
, ch
illed
an
d f
roze
n p
ork
an
d p
ork
tri
mm
ing
s w
ill r
emai
n t
he
sam
e as
in
201
3 at
9 7
00 t
on
nes
, wh
ile t
he
TRQ
vo
lum
e fo
r p
ou
ltry
will
incr
ease
fro
m 1
00 0
00 t
on
nes
in 2
013
to
110
000
ton
nes
in 2
014.
Mex
ico
All
Jan
-14
Mar
ket
reg
ula
tio
nA
nn
ou
nce
d a
lmo
st U
SD 5
0 m
illio
n t
o s
up
po
rt in
spec
tio
n a
nd
reg
ula
tio
n s
ervi
ces
for
abat
toir
s an
d
pro
cess
ing
pla
nts
un
der
fed
eral
ove
rsig
ht
and
insp
ecti
on
.
Mex
ico
Pou
ltry
Feb
-14
Tari
ff r
ate
qu
ota
Exte
nd
ed t
he
per
iod
du
rin
g w
hic
h M
exic
an c
om
pan
ies
can
imp
ort
po
ult
ry u
nd
er a
300
000
-to
nn
e d
uty
-fr
ee, T
RQ
fo
r p
ou
ltry
mea
t (s
pec
ifica
lly, c
hic
ken
) u
nti
l th
e en
d o
f 20
15.
Rep
ub
lic o
f K
ore
aPo
ult
ryJa
n-1
4Ex
po
rt b
anSu
spen
ded
all
po
ult
ry e
xpo
rts
du
e to
an
ou
tbre
ak o
f h
igh
ly p
ath
og
enic
avi
an in
flu
enza
, H5N
8 ty
pe,
p
end
ing
OIE
cer
tifi
cati
on
of
dis
ease
-fre
e st
atu
s.
Ru
ssia
All
No
v-13
Tari
ff r
ate
qu
ota
Co
nfi
rmed
TR
Q v
olu
mes
fo
r 20
14, t
he
sam
e as
in 2
013,
co
nsi
sten
t w
ith
WTO
co
mm
itm
ents
.
Pig
mea
tJa
n-1
4Im
po
rt b
an li
fted
Lift
ed b
an o
n B
elar
us
pig
mea
t im
po
rts,
fo
llow
ing
co
nce
rns
abo
ut
ASF
.
Pig
mea
tJa
n-1
4Im
po
rt b
anPr
oh
ibit
ed im
po
rts
of
pig
mea
t an
d li
ve p
igs
fro
m t
he
EU, f
ollo
win
g li
mit
ed in
stan
ces
of
ASF
in L
ith
uan
ia
and
Po
lan
d.
Pig
mea
tFe
b-1
4Im
po
rt b
an li
fted
Res
um
ed im
po
rts
of
pig
mea
t fr
om
Bra
zil,
follo
win
g a
pro
hib
itio
n b
ased
on
co
nce
rns
abo
ut
its
foo
d
safe
ty m
on
ito
rin
g s
yste
ms.
Pig
mea
tM
ar-1
4Im
po
rt b
an li
fted
Res
um
ed im
po
rts
of
pig
mea
t fr
om
th
e U
nit
ed S
tate
s, p
rovi
din
g it
is c
erti
fied
as
ract
op
amin
e fr
ee.
Pig
mea
tM
ar-1
4Im
po
rt b
anIm
po
sed
a t
emp
ora
ry b
an o
n p
igm
eat
imp
ort
s fr
om
Ukr
ain
e, d
ue
to c
on
cern
s o
ver
abili
ty o
f lo
cal
vete
rin
ary
serv
ices
to
mo
nit
or
mea
t q
ual
ity.
Bee
fM
ar-1
4Im
po
rt b
anSu
spen
ded
pu
rch
ase
of
bee
f fr
om
eig
ht
Para
gu
ayan
mea
t p
lan
ts f
ollo
win
g d
etec
tio
n o
f p
roh
ibit
ed
sub
stan
ces
in t
he
mea
t.
Sou
th A
fric
aA
llFe
b-1
4Ex
po
rt b
an li
fted
Lift
ed b
an o
n e
xpo
rt o
f re
d m
eat
wh
en in
tern
atio
nal
au
tho
riti
es d
ecla
red
So
uth
Afr
ica
a d
isea
se-f
ree
zon
e. T
he
thre
e-ye
ar e
xpo
rt b
an h
ad b
een
du
e to
an
ou
tbre
ak o
f fo
ot-
and
-mo
uth
dis
ease
.
Thai
lan
dA
llD
ec-1
3Im
po
rt b
an li
fted
Lift
ed b
an o
n U
nit
ed S
tate
s liv
e ca
ttle
imp
ort
s, f
ollo
win
g W
orl
d A
nim
al H
ealt
h O
rgan
izat
ion
’sre
clas
sifi
cati
on
of
the
US
as a
“n
eglig
ible
bo
vin
e sp
on
gif
orm
en
cep
hal
op
ath
y (B
SE)
risk
”.

Ma
jor p
olicy d
eve
lop
me
nts
FOOD OUTLOOKMAY 2014 8989
DA
IRY:
M
AJO
R PO
LICY
DEV
ELO
PMEN
TS: N
OV
EMBE
R 20
13 -
MID
APR
IL 2
014*
CO
UN
TRY
PRO
DU
CT
DA
TEPO
LIC
Y C
ATE
GO
RY
/INST
RU
MEN
TD
ESC
RIP
TIO
N
Au
stra
liaD
airy
pro
du
cts
Dec
-13
Free
Tra
de
Ag
reem
ent
An
no
un
ced
a n
ew f
ree
trad
e ag
reem
ent
wit
h K
ore
a. T
arif
fs o
f u
p t
o 3
00%
will
be
elim
inat
ed o
n k
ey
Au
stra
lian
ag
ricu
ltu
ral e
xpo
rts
incl
ud
ing
bee
f, w
hea
t, s
ug
ar, d
airy
, win
e, h
ort
icu
ltu
re a
nd
sea
foo
d, a
s w
ell a
s re
sou
rces
, en
erg
y an
d m
anu
fact
ure
d g
oo
ds.
Bra
zil
Dai
ry p
rod
uct
sFe
b-1
4St
ate
mar
ket
reg
ula
tio
nA
nn
ou
nce
d a
co
mp
reh
ensi
ve d
airy
sec
tor
dev
elo
pm
ent
stra
teg
y, “
Mo
re m
ilk”,
wit
h s
ho
rt-,
med
ium
- an
d
lon
g-t
erm
go
als
to b
e im
ple
men
ted
by
a n
atio
nal
res
earc
h b
od
y.
Bu
lgar
iaD
airy
pro
du
cts
Feb
-14
Stat
e m
arke
t in
terv
enti
on
Ap
pro
ved
an
allo
cati
on
of
Leva
114
mill
ion
(U
SD 8
0.6
mill
ion
) to
be
pai
d t
o t
he
dai
ry s
ecto
r in
201
4.
Ad
dit
ion
al s
mal
l to
p-u
ps
will
be
pai
d t
o f
arm
ers
wit
h p
astu
re la
nd
an
d s
elec
t fa
rms
will
hav
e ac
cess
to
d
e m
inim
is f
un
ds
of
USD
5.3
mill
ion
.
Can
ada
Dai
ry p
rod
uct
sN
ov-
13A
nim
al w
elfa
re r
egu
lati
on
sEs
tab
lish
ed a
Su
pp
ort
Pro
gra
m f
or
Foo
d S
afet
y, B
io-s
ecu
rity
, Tra
ceab
ility
an
d A
nim
al H
ealt
h a
nd
Wel
fare
Sy
stem
s, w
hic
h p
rom
ote
s th
e es
tab
lish
men
t o
f sy
stem
s fo
r m
on
ito
rin
g t
hes
e is
sues
.
Ch
ina
Dai
ry p
rod
uct
sD
ec-1
3Fo
od
saf
ety
mea
sure
sSt
ren
gth
ened
go
vern
men
t o
vers
igh
t fo
r d
om
esti
c an
d im
po
rted
infa
nt
form
ula
. A
nn
ou
nce
d r
evis
ion
s to
th
e in
spec
tio
n p
roce
ss o
f in
fan
t fo
rmu
la m
ilk p
roce
ssin
g p
lan
ts.
Co
sta
Ric
aD
airy
pro
du
cts
Dec
-13
Foo
d s
afet
y m
easu
res
Rev
ised
imp
ort
req
uir
emen
ts f
or
dai
ry p
rod
uct
s, r
equ
irin
g q
ues
tio
nn
aire
s to
be
com
ple
ted
on
ori
gin
an
d r
esid
ues
/mic
rob
iolo
gy.
Mex
ico
Milk
Po
wd
erD
ec-1
3Im
po
rt r
estr
icti
on
sA
nn
ou
nce
d m
od
ifica
tio
ns
to t
he
rule
s fo
r th
e d
uty
-fre
e im
po
rt o
f m
ilk p
ow
der
fro
m M
ost
Fav
ore
d
Nat
ion
s (M
FNs)
as
par
t o
f it
s W
orl
d T
rad
e O
rgan
izat
ion
(W
TO)
com
mit
men
t.
Ru
ssia
Wh
ey a
nd
wh
ey
pro
du
cts
No
v-13
Tari
ff r
ate
qu
ota
An
no
un
ced
201
4 W
hey
tar
iff
rate
qu
ota
s (T
RQ
s), i
ncl
ud
ing
set
tin
g a
15
000
ton
ne
TRQ
fo
r im
po
rts
of
cert
ain
typ
es o
f w
hey
an
d m
od
ified
wh
ey t
hat
is in
po
wd
er, g
ran
ule
or
oth
er s
olid
fo
rms,
an
d h
as n
o
add
ed s
ug
ar o
r o
ther
sw
eete
nin
g m
atte
r (H
S 04
04 1
0 12
0 1
and
040
4 10
160
1).
Dai
ry p
rod
uct
sD
ec-1
3Im
po
rt b
anIn
itia
ted
a li
mit
ed b
an o
n im
po
rts
of
dai
ry p
rod
uct
s fr
om
th
e N
eth
erla
nd
s, c
itin
g f
oo
d s
afet
y co
nce
rns.
Dai
ry p
rod
uct
sJa
n-1
4Im
po
rt b
an li
fted
Lift
ed b
an o
n d
airy
imp
ort
s fr
om
Lit
hu
ania
, im
po
sed
in O
cto
ber
201
3.
Dai
ry p
rod
uct
sD
ec-1
3Im
po
rt b
anIm
po
sed
ban
on
imp
ort
s fr
om
a n
um
ber
of
dai
ries
in E
sto
nia
, cit
ing
pu
blic
hea
lth
co
nce
rns.
Dai
ry p
rod
uct
sA
pr-
14Im
po
rt b
anIm
po
sed
ban
on
imp
ort
s fr
om
a n
um
ber
of
dai
ries
in t
he
Ukr
ain
e, c
itin
g p
ub
lic h
ealt
h c
on
cern
s.
* A
col
lect
ion
of m
ajor
dai
ry p
olic
y de
velo
pmen
ts s
tart
ing
in J
anua
ry 2
012
is a
vaila
ble
at: h
ttp:
//ww
w.f
ao.o
rg/e
cono
mic
/est
/est
-com
mod
ities
/com
mod
ity-p
olic
y-ar
chiv
e/en
/?gr
oupA
ND
com
mod
ity=
Milk
,%20
Dai
ry%
20pr
oduc
ts
FOOD OUTLOOKMAY 2014
Sta
tist
ica
l a
pp
en
dix
90 91FOOD OUTLOOKMAY 2014
Appendix Table 1 (a) & (b) Cereal statistics 92-93
Appendix Table 2 (a) & (b) Wheat statistics 94-95
Appendix Table 3 (a) & (b) Coarse grains statistics 96-97
Appendix Table 4 (a) & (b) Maize statistics 98-99
Appendix Table 5 (a) & (b) Barley statistics 100-101
Appendix Table 6 (a) & (b) Sorghum statistics 102-103
Appendix Table 7 (a) & (b) Other Coarse grains statistics 102-103
Appendix Table 8 (a) & (b) Rice statistics 104-105
Appendix Table 9 Cereal supply and utilization in main exporting countries 106
Appendix Table 10 Total oilcrops statistics 107
Appendix Table 11 Total oils and fats statistics 108
Appendix Table 12 Total meals and cakes statistics 109
Appendix Table 13 Sugar statistics 110
Appendix Table 14 Total meat statistics 111
Appendix Table 15 Bovine meat statistics 112
Appendix Table 16 Ovine meat statistics 113
Appendix Table 17 Pigmeat statistics 114
Appendix Table 18 Poultry meat statistics 116
Appendix Table 19 Milk and milk products statistics 116
Appendix Table 20 Fish and fishery products statistics 117
Appendix Table 21 Selected international prices for wheat and coarse grains 118
Appendix Table A22 Wheat and maize futures prices 118
Appendix Table 23 Selected international prices for rice and price indices 119
Appendix Table 24 Selected international prices for oilcrop products and price indices 120
Appendix Table 25 Selected international prices for sugar and sugar price index 121
Appendix Table 26 Selected international prices for milk products and dairy price indices 122
Appendix Table 27 Selected international meat prices 123
Appendix Table 28 Selected international meat prices and FAO meat price index 124
Appendix Table 29 Fish price indices 125
Appendix Table 30 Selected international commodity prices 125
Statistical appendix tables

Statistica
l ap
pe
nd
ix
90 91FOOD OUTLOOKMAY 2014
NOTES
General• FAO estimates and forecasts are
based on official and unofficial
sources.
• Unless otherwise stated, all charts
and tables refer to FAO data as
source.
• Estimates of world imports and
exports may not always match, mainly
because shipments and deliveries
do not necessarily occur in the same
marketing year.
• Tonnes refer to metric tonnes.
• All totals are computed from
unrounded data.
• Regional totals may include estimates
for countries not listed. The countries
shown in the tables were chosen
based on their importance of either
production or trade in each region.
The totals shown for Central America
include countries in the Caribbean.
• Estimates for China also include those
for the Taiwan Province, Hong Kong
SAR and Macao SAR, unless otherwise
stated.
• Up to 2012/13, the European
Union includes 27 member states.
From 2013/14, the European Union
includes 28 member states.
• ‘-‘ means nil or negligible.
Production• Cereals: Data refer to the calendar
year in which the whole harvest or
bulk of harvest takes place.
• Sugar: Figures refer to centrifugal
sugar derived from sugar cane or
beet, expressed in raw equivalents.
Data relate to the October/September
season.
Utilization• Cereals: Data are on individual
country’s marketing year basis.
• Sugar: Figures refer to centrifugal
sugar derived from sugar cane or
beet, expressed in raw equivalents.
Data relate to the October/September
season.
Trade• Trade between European Union
member states is excluded, unless
otherwise stated.
• Wheat: Trade data include wheat
flour in wheat grain equivalent. The
time reference period is July/June,
unless otherwise stated.
• Coarse grains: The time reference
period is July/June, unless otherwise
stated.
• Rice, dairy and meat products:
The time reference period is January/
December.
• Oilseeds, oils and fats and meals
and sugar: The time reference
period is October/September, unless
otherwise stated.
Stocks• Cereals: Data refer to carry-overs at
the close of national crop seasons
ending in the year shown.
Price indices• The FAO price indices are calculated
using the Laspeyres formula; the weights used are based on the average export value of each commodity for the 2002-2004
period.
COUNTRY CLASSIFICATION
In the presentation of statistical
material, countries are subdivided
according to geographical location as
well as into the following two main
economic groupings: “developed
countries” (including the developed
market economies and the transition
markets) and “developing countries”
(including the developing market
economies and the Asia centrally
planned countries). The designation
“Developed” and “Developing”
economies is intended for statistical
convenience and does not necessarily
express a judgement about the stage
reached by a particular country or area
in the development process.
References are also made to special country groupings: Low-Income Food-Deficit Countries (LIFDCs), Least Developed Countries (LDCs). The LIFDCs include 55 countries that are net importers of basic foodstuffs with per caput income below the level used by the World Bank to determine eligibility for International Development Aid (IDA) assistance (i.e. USD 1 945 in 2011). The LDCs group currently includes 48 countries with low income as well as weak human resources and low level of economic diversification. The list is reviewed every three years by the Economic and Social Council of the United Nations.
DISCLAIMER
The designations employed and
the presentation of material in
this publication do not imply the
expression of any opinion whatsoever
on the part of the Food and
Agriculture Organization of the United
Nations concerning the legal status
of any country, territory, city or area
or of its authorities, or concerning
the delimitation of its frontiers or
boundaries.

Sta
tist
ica
l a
pp
en
dix
92 93FOOD OUTLOOKMAY 2014
APPENDIX TABLE 1(A): CEREAL STATISTICS
Production Imports Exports
2010-2012 2013 2014
10/11-12/132013/14 2014/15
10/11-12/13 2013/14 2014/15
average average average estim. f’cast estim. f’cast estim. f’cast
(. . . . . . . . . . . . . . . . . . . . . . . . . . . . . . . . . . . . . . . . million tonnes . . . . . . . . . . . . . . . . . . . . . . . . . . . . . . . . . . . . . . .)
ASIA 1 062.3 1 119.7 1 118.7 147.4 172.0 169.8 52.9 56.5 54.9 Bangladesh 36.7 37.9 38.3 3.0 3.5 2.9 - - - China 457.1 489.9 490.6 16.6 29.1 26.2 1.2 1.1 1.4 India 232.2 240.8 243.4 0.2 0.1 0.1 15.1 17.8 16.5 Indonesia 60.7 63.4 64.5 10.7 11.0 10.9 0.2 0.2 0.2 Iran, Islamic Republic of 20.3 20.3 19.8 9.2 13.0 12.9 0.3 0.2 0.2 Iraq 3.8 4.6 4.3 4.9 5.0 5.1 - - - Japan 8.6 8.8 8.7 24.9 26.0 25.9 0.5 0.5 0.5 Kazakhstan 17.0 17.6 17.8 - - - 8.0 7.8 7.8 Korea, Republic of 4.4 4.5 4.5 13.7 14.1 15.1 0.1 0.1 0.1 Myanmar 20.6 19.7 20.3 0.3 0.2 0.2 0.8 1.1 1.0 Pakistan 34.3 36.0 37.4 0.3 1.0 0.6 3.9 3.7 3.6 Philippines 18.2 19.7 20.0 4.0 5.5 4.9 - - - Saudi Arabia 1.4 1.0 1.0 13.3 16.1 15.4 - - - Thailand 29.8 30.6 30.1 3.0 2.6 2.9 8.4 9.5 10.0 Turkey 33.4 37.1 32.2 4.3 4.1 4.6 3.6 3.5 2.7 Viet Nam 32.8 34.6 34.6 4.1 3.7 4.1 7.2 7.2 7.0
AFRICA 159.0 162.4 168.4 68.7 73.4 73.4 9.2 8.6 8.7 Algeria 4.7 4.9 5.0 9.4 10.7 9.9 - - - Egypt 19.6 20.3 20.5 16.3 17.4 17.6 0.3 0.5 0.5 Ethiopia 20.0 23.6 23.6 1.1 0.7 0.7 0.9 1.9 1.9 Morocco 7.2 9.9 7.0 6.1 5.1 6.6 0.1 0.1 0.1 Nigeria 19.4 21.4 21.3 6.8 7.3 7.3 0.9 0.9 0.9 South Africa 14.7 14.7 15.8 3.0 3.4 3.4 2.8 2.0 2.1 Sudan 4.8 2.9 5.0 2.1 2.6 2.3 - - -
CENTRAL AMERICA 38.8 41.1 39.7 25.5 26.8 27.2 1.4 1.1 0.8 Mexico 32.3 34.3 32.8 15.2 16.1 16.5 1.2 0.9 0.6
SOUTH AMERICA 149.8 173.7 164.1 26.0 29.0 28.2 56.2 51.9 56.5 Argentina 45.2 48.1 45.2 - 0.1 0.1 31.6 20.6 25.9 Brazil 77.4 97.2 91.9 8.6 9.7 9.0 18.6 25.1 24.9 Chile 3.5 3.6 3.4 2.4 2.5 2.4 0.1 0.1 0.1 Colombia 3.5 3.9 3.7 5.7 6.4 6.3 0.1 0.1 0.1 Peru 4.0 4.2 4.0 3.8 4.0 4.2 - - - Venezuela 3.4 3.7 3.7 3.7 4.6 4.5 - 0.1 0.1
NORTH AMERICA 427.7 500.2 462.2 8.5 10.6 11.2 95.6 99.0 99.7 Canada 48.7 66.3 54.2 1.5 1.4 1.3 22.0 26.3 25.8 United States of America 379.0 433.8 408.0 7.0 9.2 9.9 73.5 72.8 73.9
EUROPE 429.2 479.3 467.6 20.6 22.5 19.4 63.7 92.8 85.1 European Union 282.7 304.2 302.9 16.2 18.0 15.1 26.6 38.0 33.4 Russian Federation 73.7 88.5 85.9 1.2 1.3 1.1 15.7 22.9 21.8 Serbia 9.0 9.1 9.1 0.1 0.1 0.1 1.7 1.2 1.4 Ukraine 46.5 61.8 55.1 0.1 0.1 0.1 19.1 29.9 27.5
OCEANIA 39.6 42.4 37.5 1.5 1.5 1.5 27.3 25.7 25.0 Australia 38.8 41.6 36.6 0.2 0.2 0.2 27.3 25.7 25.0
WORLD 2 306.3 2 518.8 2 458.2 298.3 335.7 330.8 306.2 335.7 330.8 Developing countries 1 355.3 1 440.5 1 433.8 230.5 262.4 259.5 107.7 107.1 109.8 Developed countries 951.1 1 078.3 1 024.4 67.8 73.3 71.2 198.5 228.6 221.0 LIFDCs 425.6 439.3 448.1 47.0 51.5 50.4 21.0 23.9 22.5 LDCs 160.0 160.8 167.2 23.9 26.2 25.5 6.8 7.4 7.4
Statistica
l ap
pe
nd
ix
92 93FOOD OUTLOOKMAY 2014
APPENDIX TABLE 1(B): CEREAL STATISTICS
Total Utilization Stocks ending in Per caput food use
10/11-12/13 2013/14 2014/15
2011-20132014 2015
10/11-12/13 2013/14 2014/15
average average average estim. f’cast estim. f’cast estim. f’cast
(. . . . . . . . . . . . . . . . . . . . . . . . . . million tonnes . . . . . . . . . . . . . . . . . . . . .) (. . . . . . . . . . Kg/year . . . . . . .)
ASIA 1 138.3 1 203.1 1 232.8 321.2 371.3 370.0 161.7 163.1 163.9 Bangladesh 39.1 41.0 41.4 10.2 9.7 9.5 191.1 193.6 193.5 China 464.1 496.9 518.3 175.9 209.3 206.0 150.3 150.6 150.6 India 212.6 220.3 225.1 44.4 50.7 51.1 154.6 156.3 157.9 Indonesia 69.6 73.6 75.4 12.1 14.1 14.3 207.9 211.8 215.1 Iran, Islamic Republic of 28.3 29.3 29.9 4.1 7.9 9.7 205.9 207.9 207.7 Iraq 8.5 9.1 9.3 1.2 1.7 1.9 196.0 196.3 196.2 Japan 33.2 34.0 34.0 4.9 5.4 5.5 129.5 129.2 129.2 Kazakhstan 9.2 10.2 10.3 3.8 2.6 2.3 165.4 166.5 166.4 Korea, Republic of 17.8 18.2 18.8 4.1 4.1 4.8 122.4 121.9 121.4 Myanmar 21.0 20.4 19.9 5.0 2.0 1.7 223.7 221.1 221.0 Pakistan 30.9 32.6 33.3 4.2 4.3 5.1 147.3 148.8 149.2 Philippines 22.7 24.8 24.8 3.0 3.5 3.6 159.4 164.1 165.7 Saudi Arabia 14.6 16.0 16.3 4.8 6.1 6.1 144.7 147.5 145.8 Thailand 20.5 22.2 22.9 13.6 19.9 20.0 156.2 163.4 167.4 Turkey 34.3 36.9 35.1 4.2 4.5 3.5 235.8 235.5 236.1 Viet Nam 29.3 30.9 31.3 5.4 6.3 6.7 205.1 208.3 209.4
AFRICA 217.1 228.8 233.6 38.6 34.8 34.3 149.5 149.5 150.4 Algeria 13.6 15.0 15.5 4.4 5.7 5.2 223.1 223.6 223.9 Egypt 36.0 37.0 37.4 6.6 5.9 6.1 291.1 290.6 290.4 Ethiopia 20.0 22.0 22.4 2.0 2.4 2.4 177.9 179.9 179.0 Morocco 13.1 14.5 13.8 4.0 3.9 3.5 258.2 258.0 258.8 Nigeria 25.2 27.0 27.4 1.2 1.3 1.3 113.2 114.7 117.1 South Africa 15.2 16.2 16.4 2.9 1.5 2.1 169.3 177.3 178.0 Sudan 6.9 6.5 7.5 1.5 0.5 0.4 168.0 167.2 167.9
CENTRAL AMERICA 62.9 65.3 66.3 5.3 6.2 5.9 157.5 157.6 157.6 Mexico 46.3 48.3 49.2 2.8 3.6 3.2 185.4 184.9 184.8
SOUTH AMERICA 123.5 134.4 137.0 19.4 25.6 24.5 122.3 122.3 122.9 Argentina 15.0 18.8 19.1 4.2 5.3 6.0 135.1 137.4 138.0 Brazil 69.9 74.8 76.5 7.7 12.1 10.9 116.8 115.2 115.8 Chile 5.7 5.9 6.0 0.6 0.8 0.8 149.8 150.8 150.5 Colombia 9.2 10.0 10.1 0.5 0.8 0.8 108.2 110.1 111.2 Peru 7.8 8.2 8.2 1.3 1.5 1.4 147.4 149.4 150.9 Venezuela 7.1 7.9 8.2 0.6 0.9 0.9 133.6 135.8 135.9
NORTH AMERICA 354.5 378.7 381.9 59.8 72.4 65.6 110.3 110.5 110.8 Canada 28.4 29.7 30.3 9.5 19.2 16.5 95.5 97.0 96.2 United States of America 326.0 349.0 351.6 50.3 53.2 49.1 112.0 111.9 112.4
EUROPE 397.4 394.4 398.7 55.0 56.8 59.8 136.1 136.3 136.7 European Union 278.7 276.4 281.0 30.3 33.5 37.1 135.2 135.7 136.1 Russian Federation 63.8 64.9 64.7 13.6 9.6 10.0 127.6 126.6 127.2 Serbia 7.5 7.2 7.3 0.8 0.7 0.8 158.1 158.8 159.5 Ukraine 27.6 28.8 28.8 7.4 9.6 8.5 169.8 169.5 169.2
OCEANIA 15.1 15.9 15.5 8.0 6.7 5.7 91.4 90.3 90.2 Australia 13.0 13.7 13.3 7.5 6.2 5.2 99.2 98.1 98.7
WORLD 2 308.8 2 420.6 2 465.7 507.2 573.9 565.8 151.8 152.7 153.4 Developing countries 1 461.7 1 547.2 1 584.8 367.3 422.7 419.3 157.0 157.8 158.6 Developed countries 847.1 873.4 880.9 139.9 151.2 146.5 131.1 131.7 131.9 LIFDCs 445.2 466.0 475.6 84.9 88.0 87.0 148.7 149.9 151.1 LDCs 176.1 183.2 186.8 37.0 31.6 30.6 153.8 153.3 153.6

Sta
tist
ica
l a
pp
en
dix
94 95FOOD OUTLOOKMAY 2014
APPENDIX TABLE 2(A): WHEAT STATISTICS
Production Imports Exports
2010-2012 2013 2014
10/11-12/132013/14 2014/15
10/11-12/13 2013/14 2014/15
average average average estim. f’cast estim. f’cast estim. f’cast
(. . . . . . . . . . . . . . . . . . . . . . . . . . . . . . . . . . . . . . . . million tonnes . . . . . . . . . . . . . . . . . . . . . . . . . . . . . . . . . . . . . . .)
ASIA 304.8 318.2 318.1 62.8 76.5 74.3 17.3 19.4 18.3 Bangladesh 1.1 1.3 1.3 2.5 3.0 2.4 - - - China 117.8 122.2 122.0 4.1 10.5 8.0 0.5 0.3 0.3 of which Taiwan Prov. - - - 1.4 1.5 1.5 - - - India 87.5 93.5 96.0 0.1 - - 2.6 5.5 5.0 Indonesia - - - 6.4 7.2 7.2 0.1 0.1 0.1 Iran, Islamic Republic of 13.6 14.0 13.5 2.7 6.0 6.0 0.3 0.2 0.2 Iraq 2.6 3.3 3.0 3.3 3.3 3.3 - - - Japan 0.7 0.8 0.8 6.0 6.3 6.2 0.3 0.3 0.3 Kazakhstan 14.1 14.5 14.8 - - - 7.5 7.5 7.5 Korea, Republic of - - - 5.0 4.5 5.0 0.1 0.1 0.1 Pakistan 24.0 24.2 25.4 0.2 1.0 0.5 0.9 0.4 0.4 Philippines - - - 2.8 3.5 3.4 - - - Saudi Arabia 1.0 0.6 0.6 2.2 3.2 3.0 - - - Thailand - - - 2.1 2.0 2.0 0.2 0.2 0.2 Turkey 20.5 22.1 19.7 3.5 3.7 3.7 3.3 3.2 2.5
AFRICA 24.1 27.4 26.5 39.1 39.6 39.8 1.1 1.0 0.9 Algeria 3.1 3.3 3.4 6.2 6.6 6.0 - - - Egypt 8.1 8.8 9.0 9.9 10.5 10.5 - - - Ethiopia 3.3 4.0 4.0 1.0 0.7 0.7 - - - Morocco 4.9 7.0 5.0 3.8 2.5 3.5 0.1 0.1 0.1 Nigeria 0.1 0.1 0.1 3.9 4.2 4.2 0.5 0.5 0.5 South Africa 1.8 1.8 1.7 1.5 1.8 1.8 0.3 0.2 0.1 Tunisia 1.4 1.0 1.7 1.6 2.0 1.6 0.1 0.1 0.1
CENTRAL AMERICA 3.5 3.4 3.6 8.2 7.9 7.5 0.8 0.9 0.6 Cuba - - - 0.8 0.8 0.8 - - - Mexico 3.5 3.4 3.6 4.2 4.0 3.5 0.7 0.8 0.5
SOUTH AMERICA 22.9 19.1 21.7 13.5 14.4 13.3 13.1 3.5 7.6 Argentina 12.9 9.2 10.5 - - - 8.9 1.5 4.0 Brazil 5.4 5.7 6.7 6.8 7.5 6.5 2.0 0.7 2.0 Chile 1.4 1.5 1.4 0.8 0.9 0.7 - - - Colombia - - - 1.5 1.6 1.6 - - - Peru 0.2 0.2 0.2 1.7 1.7 1.7 - - - Venezuela - - - 1.7 1.8 1.8 - - -
NORTH AMERICA 84.0 95.5 86.3 2.7 4.7 5.2 48.0 51.5 51.5 Canada 25.3 37.5 29.3 0.2 0.2 0.2 17.6 21.5 21.5 United States of America 58.7 58.0 57.0 2.5 4.5 5.0 30.4 30.0 30.0
EUROPE 205.8 224.2 220.4 8.0 6.6 8.7 37.5 55.6 51.6 European Union 135.3 143.2 143.7 5.6 4.0 6.3 19.9 29.0 25.5 Russian Federation 45.2 52.1 51.0 0.5 0.7 0.5 11.9 16.5 16.0 Ukraine 18.3 21.5 19.0 - - - 5.3 9.5 9.5
OCEANIA 26.9 27.3 25.1 0.8 0.7 0.7 20.9 18.5 19.0 Australia 26.6 27.0 24.8 - - - 20.9 18.5 19.0
WORLD 672.0 715.1 701.7 135.0 150.5 149.5 138.7 150.5 149.5 Developing countries 327.2 338.8 340.8 108.7 123.2 119.5 23.5 16.2 18.8 Developed countries 344.8 376.3 360.9 26.3 27.3 30.0 115.1 134.3 130.8 LIFDCs 107.8 115.0 117.5 28.6 30.4 30.2 3.8 6.7 6.2 LDCs 11.6 12.6 12.7 14.6 15.9 15.6 - - -

Statistica
l ap
pe
nd
ix
94 95FOOD OUTLOOKMAY 2014
APPENDIX TABLE 2(B): WHEAT STATISTICS
Total Utilization Stocks ending in Per caput food use
10/11-12/13 2013/14 2014/15
2011-20132014 2015
10/11-12/13 2013/14 2014/15
average average average estim. f’cast estim. f’cast estim. f’cast
(. . . . . . . . . . . . . . . . . . . . . . . . . . million tonnes . . . . . . . . . . . . . . . . . . . . .) (. . . . . . . . . . Kg/year . . . . . . . .)
ASIA 351.6 362.2 366.8 91.5 99.7 105.5 64.3 64.7 64.9 Bangladesh 3.4 3.7 3.7 3.1 3.0 3.0 20.7 20.8 20.6 China 125.8 125.4 127.4 38.9 40.9 43.1 63.4 63.5 63.5 of which Taiwan Prov. 1.3 1.5 1.5 0.4 0.4 0.4 45.2 45.0 45.8 India 82.6 85.8 87.5 16.9 22.0 24.6 60.5 61.1 61.5 Indonesia 6.0 6.8 7.1 2.2 2.8 2.8 18.8 19.1 20.3 Iran, Islamic Republic of 15.8 16.7 16.9 1.9 5.2 7.1 167.7 167.2 166.9 Iraq 5.7 6.0 6.2 1.0 1.6 1.7 143.3 142.2 142.4 Japan 6.3 6.6 6.6 0.8 1.3 1.3 42.8 42.9 42.9 Kazakhstan 6.8 7.6 7.7 3.6 2.3 1.9 150.1 150.8 150.5 Korea, Republic of 4.9 4.3 4.4 1.0 1.2 1.8 47.9 48.1 47.9 Pakistan 23.6 24.4 24.7 2.1 2.1 2.9 124.5 124.8 124.2 Philippines 2.7 3.4 3.4 0.3 0.5 0.5 23.1 24.5 24.3 Saudi Arabia 3.3 3.6 3.6 2.5 2.5 2.5 97.7 98.9 98.7 Thailand 1.9 2.0 2.0 0.5 0.4 0.2 14.8 16.3 17.0 Turkey 20.9 22.2 21.5 2.4 2.2 1.6 209.4 208.9 209.7
AFRICA 61.9 65.4 65.7 16.6 16.4 15.9 51.2 50.7 50.5 Algeria 8.8 9.5 9.7 3.5 4.4 4.1 201.4 202.1 202.9 Egypt 18.1 19.1 19.3 5.0 4.7 4.9 197.2 196.8 196.7 Ethiopia 4.4 4.7 4.7 0.4 0.2 0.2 42.5 42.5 40.7 Morocco 8.4 9.1 8.8 2.7 2.8 2.4 202.7 203.0 203.0 Nigeria 3.4 3.5 3.5 0.2 0.2 0.2 17.4 17.6 17.6 South Africa 3.1 3.3 3.2 0.5 0.5 0.7 57.9 59.2 58.8 Tunisia 3.0 3.0 3.1 0.6 0.6 0.7 211.4 209.1 211.4
CENTRAL AMERICA 10.6 10.5 10.6 1.4 1.8 1.8 43.5 43.8 43.6 Cuba 0.8 0.8 0.8 - - - 56.4 56.5 57.0 Mexico 6.9 6.7 6.7 0.5 0.6 0.5 47.2 47.0 46.9
SOUTH AMERICA 25.5 26.4 27.0 5.2 6.2 7.2 59.9 60.3 60.2 Argentina 5.3 5.5 5.6 1.5 2.2 3.2 119.1 119.4 119.6 Brazil 10.7 11.2 11.5 0.8 1.5 1.5 52.4 52.9 52.5 Chile 2.2 2.3 2.4 0.2 0.2 0.2 119.4 120.6 120.4 Colombia 1.4 1.4 1.5 0.3 0.5 0.6 28.0 27.8 27.9 Peru 1.9 1.9 2.0 0.4 0.5 0.5 59.4 60.6 62.5 Venezuela 1.7 1.8 1.8 0.2 0.2 0.2 56.4 56.9 57.7
NORTH AMERICA 42.2 43.4 43.8 27.2 27.7 24.2 81.0 81.2 81.4 Canada 8.6 9.3 9.4 6.1 11.8 9.7 79.7 81.0 80.2 United States of America 33.7 34.1 34.4 21.1 15.9 14.5 81.1 81.2 81.5
EUROPE 181.4 172.1 177.7 27.1 22.4 22.1 109.4 109.1 109.4 European Union 123.2 117.3 123.0 10.1 9.5 11.0 111.0 111.2 111.4 Russian Federation 36.9 34.7 34.7 10.7 7.1 7.9 99.5 98.0 98.3 Ukraine 12.8 12.1 12.1 4.8 3.9 1.3 121.4 119.4 120.2
OCEANIA 7.6 7.8 7.7 4.9 3.5 2.9 67.5 65.8 66.2 Australia 6.6 6.8 6.7 4.5 3.1 2.5 78.9 77.1 78.3
WORLD 680.9 687.9 699.2 173.9 177.5 179.5 67.2 67.2 67.2 Developing countries 415.6 428.3 433.8 104.9 115.1 122.0 60.0 60.1 60.2 Developed countries 265.2 259.5 265.5 69.0 62.4 57.5 96.0 96.1 96.3 LIFDCs 130.1 136.6 138.8 32.1 36.1 37.7 45.9 46.0 46.1 LDCs 26.8 28.5 28.7 8.9 8.2 7.9 28.2 27.9 27.6

Sta
tist
ica
l a
pp
en
dix
96 97FOOD OUTLOOKMAY 2014
APPENDIX TABLE 3(A): COARSE GRAIN STATISTICS
Production Imports Exports
2010-2012 2013 2014
10/11-12/132013/14 2014/15
10/11-12/13 2013/14 2014/15
average average average estim. f’cast estim. f’cast estim. f’cast
(. . . . . . . . . . . . . . . . . . . . . . . . . . . . . . . . . . . . . . . . million tonnes . . . . . . . . . . . . . . . . . . . . . . . . . . . . . . . . . . . . . . .)
ASIA 320.3 350.7 347.4 67.1 77.4 77.7 6.2 5.5 5.4 China 200.9 227.2 227.3 10.2 15.7 15.5 0.3 0.3 0.4 of which Taiwan Prov. 0.1 0.1 0.1 4.5 4.7 4.8 - - - India 42.5 41.1 40.4 - - - 3.9 2.5 3.0 Indonesia 18.5 18.5 19.1 2.5 2.7 2.6 0.1 0.1 0.1 Iran, Islamic Republic of 4.9 4.5 4.5 5.1 5.5 5.3 - - - Japan 0.2 0.2 0.2 18.2 19.0 19.0 - - - Korea, D.P.R. 2.2 2.3 2.3 0.3 0.2 0.2 - - - Korea, Republic of 0.2 0.2 0.2 8.2 9.1 9.6 - - - Malaysia 0.1 0.1 0.1 3.1 3.3 3.5 - - - Pakistan 4.8 5.3 5.4 - - - - - - Philippines 6.9 7.4 7.4 0.1 0.6 0.1 - - - Saudi Arabia 0.4 0.4 0.4 9.8 11.5 11.0 - - - Thailand 5.1 5.2 5.3 0.3 0.3 0.6 0.2 0.6 0.1 Turkey 12.4 14.5 12.0 0.6 0.2 0.6 0.3 0.3 0.2 Viet Nam 4.8 5.2 5.2 1.2 1.4 1.5 - - -
AFRICA 117.6 117.1 123.6 16.6 19.8 19.5 7.7 7.1 7.3 Algeria 1.6 1.6 1.6 3.1 4.0 3.8 - - - Egypt 7.9 7.3 7.3 6.0 6.6 6.8 - - - Ethiopia 16.7 19.5 19.5 - - - 0.9 1.9 1.9 Kenya 3.8 3.3 3.7 0.5 1.0 0.9 - - - Morocco 2.3 2.9 1.9 2.3 2.6 3.1 - - - Nigeria 16.7 18.5 18.4 0.2 0.2 0.2 0.4 0.4 0.4 South Africa 12.9 12.9 14.1 0.3 0.2 0.2 2.6 1.8 2.0 Sudan 4.5 2.6 4.7 0.2 0.6 0.3 - - - Tanzania, United Rep. of 5.8 5.7 5.8 - - - 0.3 0.2 -
CENTRAL AMERICA 33.4 35.7 34.0 15.3 16.7 17.6 0.5 0.2 0.2 Mexico 28.7 30.8 29.1 10.3 11.5 12.4 0.5 0.1 0.1
SOUTH AMERICA 110.3 137.7 125.0 11.0 12.9 13.1 39.8 45.1 45.6 Argentina 31.4 37.8 33.6 - 0.1 0.1 22.1 18.5 21.3 Brazil 63.8 83.5 76.7 1.1 1.5 1.8 15.5 23.5 22.0 Chile 2.0 2.0 1.9 1.4 1.5 1.5 0.1 0.1 0.1 Colombia 1.7 2.0 1.8 4.1 4.6 4.5 - 0.1 0.1 Peru 1.8 1.9 1.8 1.9 2.1 2.3 - - - Venezuela 2.8 3.0 3.0 1.7 2.4 2.3 - 0.1 0.1
NORTH AMERICA 337.1 398.6 369.0 4.8 4.8 4.9 44.3 44.3 44.8 Canada 23.4 28.8 24.9 0.9 0.8 0.7 4.5 4.8 4.3 United States of America 313.6 369.8 344.1 3.9 4.0 4.2 39.8 39.5 40.5
EUROPE 220.7 252.6 244.6 11.0 14.0 8.9 25.8 37.0 33.2 European Union 145.4 159.2 157.5 9.4 12.7 7.5 6.5 8.9 7.8 Russian Federation 27.9 35.8 34.2 0.5 0.4 0.4 3.6 6.2 5.7 Serbia 7.1 6.6 7.0 - - - 1.4 0.8 1.0 Ukraine 28.1 40.2 36.0 0.1 - - 13.9 20.4 18.0
OCEANIA 12.3 14.3 11.8 0.2 0.3 0.3 5.9 6.8 5.6 Australia 11.8 13.8 11.2 - - - 5.9 6.8 5.6
WORLD 1 151.8 1 306.7 1 255.4 126.0 146.0 142.0 130.2 146.0 142.0 Developing countries 563.4 622.4 610.2 89.6 105.4 106.4 51.2 55.8 56.1 Developed countries 588.4 684.3 645.2 36.5 40.5 35.7 79.1 90.2 85.9 LIFDCs 148.4 148.3 153.3 4.3 5.8 4.9 8.5 7.3 7.6 LDCs 74.4 74.1 79.0 2.0 2.5 2.1 4.9 5.5 5.4

Statistica
l ap
pe
nd
ix
96 97FOOD OUTLOOKMAY 2014
APPENDIX TABLE 3(B): COARSE GRAIN STATISTICS
Total Utilization Stocks ending in Per caput food use
10/11-12/13 2013/14 2014/15
2011-20132014 2015
10/11-12/13 2013/14 2014/15
average average average estim. f’cast estim. f’cast estim. f’cast
(. . . . . . . . . . . . . . . . . . . . . . . . . . million tonnes . . . . . . . . . . . . . . . . . . . . .) (. . . . . . . . . . Kg/year . . . . . . . .)
ASIA 373.8 410.5 425.3 76.9 97.6 91.1 15.5 15.5 15.6 China 205.9 234.3 247.7 52.2 68.5 62.7 10.9 11.1 11.1 of which Taiwan Prov. 4.7 4.7 4.8 0.3 0.3 0.3 6.7 6.6 7.1 India 37.2 37.2 37.8 4.7 5.7 4.8 21.8 21.2 21.3 Indonesia 20.1 21.1 21.9 4.0 4.9 5.0 29.3 30.2 31.9 Iran, Islamic Republic of 9.4 9.3 9.6 1.8 2.2 2.1 1.4 1.3 1.3 Japan 18.8 19.2 19.3 1.5 1.4 1.4 29.2 29.2 29.3 Korea, D.P.R. 2.4 2.6 2.6 0.2 0.2 0.2 75.7 78.7 78.5 Korea, Republic of 8.4 9.3 9.8 1.5 1.2 1.2 4.4 4.5 4.5 Malaysia 3.2 3.3 3.4 0.2 0.1 0.3 1.6 1.6 1.6 Pakistan 4.5 5.1 5.2 1.7 1.8 1.8 9.5 9.9 9.7 Philippines 7.2 8.0 7.5 0.3 0.4 0.4 16.4 16.8 16.8 Saudi Arabia 10.0 11.1 11.4 2.1 3.5 3.5 3.5 3.3 3.3 Thailand 5.1 5.2 5.4 0.4 0.2 0.6 2.8 2.8 2.8 Turkey 12.7 14.0 12.8 1.8 2.2 1.8 17.5 17.2 17.0 Viet Nam 6.1 6.3 6.6 0.5 0.8 0.8 5.2 5.3 6.0
AFRICA 126.0 132.0 135.5 18.8 15.4 15.8 73.8 73.5 74.3 Algeria 4.7 5.3 5.6 1.0 1.3 1.1 18.9 18.4 18.0 Egypt 14.0 13.9 14.0 0.9 0.7 0.8 50.2 49.9 49.7 Ethiopia 15.5 17.2 17.6 1.5 2.2 2.2 134.5 136.3 137.2 Kenya 4.3 4.4 4.6 0.4 0.3 0.3 85.7 85.4 85.5 Morocco 4.7 5.3 5.0 1.3 1.1 1.1 54.1 53.1 53.9 Nigeria 16.6 17.9 18.2 0.5 0.7 0.7 67.8 68.7 70.5 South Africa 11.1 11.6 11.8 2.4 0.9 1.4 94.0 93.8 94.1 Sudan 4.4 3.9 4.9 0.5 - 0.1 99.5 98.4 101.7 Tanzania, United Rep. of 5.4 5.7 5.8 0.7 0.6 0.7 86.9 86.5 86.8
CENTRAL AMERICA 48.4 50.7 51.6 3.5 4.2 3.9 96.2 95.7 95.9 Mexico 38.6 40.8 41.6 2.4 3.0 2.7 131.7 131.4 131.5
SOUTH AMERICA 82.7 92.7 94.2 12.1 17.4 15.1 27.0 27.2 27.3 Argentina 9.3 12.8 13.0 2.7 3.0 2.7 7.4 7.4 7.4 Brazil 50.9 55.8 56.9 5.5 9.5 8.0 24.7 25.0 25.3 Chile 3.3 3.4 3.5 0.5 0.6 0.6 18.8 18.6 18.4 Colombia 5.9 6.5 6.5 0.1 0.2 0.1 42.9 43.3 43.1 Peru 3.8 4.0 4.0 0.6 0.6 0.6 24.7 24.0 23.8 Venezuela 4.5 5.1 5.3 0.4 0.7 0.7 51.0 51.5 50.7
NORTH AMERICA 307.9 331.1 333.7 31.2 43.8 40.3 18.4 18.3 18.2 Canada 19.5 20.0 20.5 3.3 7.4 6.8 4.9 4.7 4.7 United States of America 288.4 311.0 313.2 27.9 36.4 33.6 19.8 19.8 19.7
EUROPE 212.1 218.2 216.8 27.3 34.0 37.2 21.8 22.0 22.2 European Union 152.7 156.1 155.1 19.8 23.6 25.7 18.9 19.1 19.4 Russian Federation 26.2 29.4 29.2 2.8 2.4 2.1 23.5 23.5 23.6 Serbia 5.8 5.4 5.6 0.5 0.3 0.5 19.8 19.3 19.4 Ukraine 14.7 16.6 16.5 2.6 5.8 7.2 45.1 46.6 45.6
OCEANIA 6.9 7.3 7.1 3.1 3.1 2.7 8.1 8.2 8.1 Australia 6.1 6.5 6.3 3.0 3.0 2.6 9.9 9.6 9.5
WORLD 1 157.7 1 242.4 1 264.2 172.8 215.5 206.3 28.0 28.2 28.5 Developing countries 594.3 647.8 668.2 106.6 131.0 121.6 29.3 29.5 29.8 Developed countries 563.4 594.7 596.1 66.2 84.4 84.6 23.0 23.1 23.1 LIFDCs 141.8 147.5 150.9 17.3 16.8 15.9 39.8 39.8 40.2 LDCs 69.9 73.1 75.9 12.1 10.6 10.5 57.6 57.7 58.4

Sta
tist
ica
l a
pp
en
dix
98 99FOOD OUTLOOKMAY 2014
APPENDIX TABLE 4(A): MAIZE STATISTICS
Production Imports Exports
2010-2012 2013 2014
10/11-12/132013/14 2014/15
10/11-12/13 2013/14 2014/15
average average average estim. f’cast estim. f’cast estim. f’cast
(. . . . . . . . . . . . . . . . . . . . . . . . . . . . . . . . . . . . . . . . million tonnes . . . . . . . . . . . . . . . . . . . . . . . . . . . . . . . . . . . . . . .)
ASIA 271.4 302.7 301.5 49.9 55.9 56.7 5.4 5.0 4.9 China 191.9 217.8 218.0 7.7 10.5 10.4 0.2 0.2 0.3 of which Taiwan Prov. - - - 4.3 4.4 4.5 - - - India 21.9 23.3 22.3 - - - 3.9 2.5 3.0 Indonesia 18.5 18.5 19.1 2.4 2.6 2.5 0.1 0.1 0.1 Iran, Islamic Republic of 1.6 1.3 1.3 4.0 4.5 4.3 - - - Japan - - - 15.1 15.5 15.6 - - - Korea, D.P.R. 2.1 2.2 2.3 0.3 0.2 0.2 - - - Korea, Republic of 0.1 0.1 0.1 8.2 9.0 9.5 - - - Malaysia 0.1 0.1 0.1 3.1 3.3 3.5 - - - Pakistan 4.2 4.7 4.8 - - - - - - Philippines 6.9 7.4 7.4 0.1 0.6 0.1 - - - Thailand 4.9 5.1 5.1 0.3 0.3 0.6 0.2 0.6 0.1 Turkey 4.4 5.9 4.8 0.4 0.1 0.4 0.1 0.2 0.2 Viet Nam 4.7 5.2 5.2 1.2 1.3 1.4 - - -
AFRICA 69.0 70.1 72.7 14.3 16.6 16.9 6.0 5.1 5.3 Algeria - - - 2.7 3.5 3.5 - - - Egypt 7.0 6.5 6.5 5.9 6.5 6.7 - - - Ethiopia 6.6 7.6 7.6 - - - 0.5 0.8 0.8 Kenya 3.5 3.0 3.4 0.4 0.9 0.9 - - - Morocco 0.2 0.2 0.2 1.8 2.1 2.3 - - - Nigeria 8.7 10.4 10.3 0.2 0.2 0.2 0.3 0.3 0.3 South Africa 12.4 12.4 13.6 0.1 - 0.1 2.5 1.8 2.0 Tanzania, United Rep. of 4.6 4.7 4.7 - - - 0.3 0.2 -
CENTRAL AMERICA 25.4 27.2 25.7 13.2 15.7 16.2 0.5 0.2 0.2 Mexico 21.0 22.7 21.2 8.2 10.5 11.0 0.5 0.1 0.1
SOUTH AMERICA 96.5 123.5 110.9 8.9 10.6 10.8 34.3 40.5 40.7 Argentina 22.6 29.0 25.0 - - - 16.8 14.0 16.5 Brazil 61.2 80.5 73.7 0.7 1.0 1.2 15.5 23.5 22.0 Chile 1.4 1.5 1.4 0.7 0.9 0.9 - - - Colombia 1.6 1.9 1.7 3.4 3.7 3.7 - 0.1 0.1 Peru 1.6 1.7 1.6 1.8 2.0 2.2 - - - Venezuela 2.4 2.5 2.5 1.7 2.4 2.3 - 0.1 0.1
NORTH AMERICA 313.5 367.9 342.7 2.6 2.1 2.2 38.2 36.5 36.8 Canada 12.2 14.2 12.7 0.9 0.7 0.6 1.2 1.5 0.8 United States of America 301.3 353.7 330.0 1.7 1.4 1.6 37.0 35.0 36.0
EUROPE 97.0 116.4 112.9 8.9 12.0 7.1 16.0 25.7 22.1 European Union 60.6 64.6 66.8 8.3 11.5 6.5 2.0 3.0 2.2 Russian Federation 6.1 10.7 10.0 0.1 0.1 0.1 1.4 3.5 3.0 Serbia 6.7 6.2 6.6 - - - 1.4 0.8 1.0 Ukraine 18.1 30.9 26.0 - - - 11.1 18.0 15.5
OCEANIA 0.6 0.7 0.5 - - - 0.1 0.1 0.1
WORLD 873.2 1 008.4 966.9 97.9 113.0 110.0 100.7 113.0 110.0 Developing countries 448.1 509.2 495.5 69.7 81.8 83.4 43.7 48.9 49.0 Developed countries 425.1 499.2 471.5 28.1 31.2 26.7 56.9 64.1 60.9 LIFDCs 83.0 87.4 87.7 3.6 4.8 4.1 6.8 5.3 5.6 LDCs 40.1 41.9 42.5 1.6 1.7 1.7 3.4 3.7 3.6
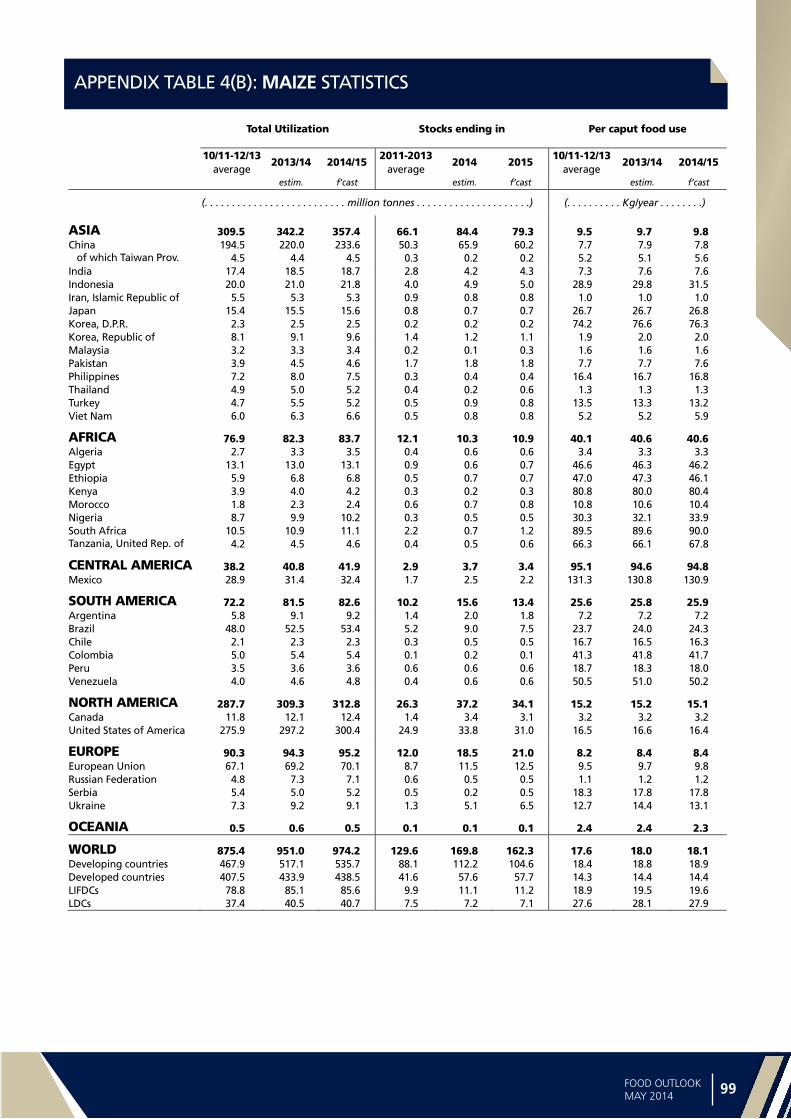
Statistica
l ap
pe
nd
ix
98 99FOOD OUTLOOKMAY 2014
APPENDIX TABLE 4(B): MAIZE STATISTICS
Total Utilization Stocks ending in Per caput food use
10/11-12/13 2013/14 2014/15
2011-20132014 2015
10/11-12/13 2013/14 2014/15
average average average estim. f’cast estim. f’cast estim. f’cast
(. . . . . . . . . . . . . . . . . . . . . . . . . . million tonnes . . . . . . . . . . . . . . . . . . . . .) (. . . . . . . . . . Kg/year . . . . . . . .)
ASIA 309.5 342.2 357.4 66.1 84.4 79.3 9.5 9.7 9.8 China 194.5 220.0 233.6 50.3 65.9 60.2 7.7 7.9 7.8 of which Taiwan Prov. 4.5 4.4 4.5 0.3 0.2 0.2 5.2 5.1 5.6 India 17.4 18.5 18.7 2.8 4.2 4.3 7.3 7.6 7.6 Indonesia 20.0 21.0 21.8 4.0 4.9 5.0 28.9 29.8 31.5 Iran, Islamic Republic of 5.5 5.3 5.3 0.9 0.8 0.8 1.0 1.0 1.0 Japan 15.4 15.5 15.6 0.8 0.7 0.7 26.7 26.7 26.8 Korea, D.P.R. 2.3 2.5 2.5 0.2 0.2 0.2 74.2 76.6 76.3 Korea, Republic of 8.1 9.1 9.6 1.4 1.2 1.1 1.9 2.0 2.0 Malaysia 3.2 3.3 3.4 0.2 0.1 0.3 1.6 1.6 1.6 Pakistan 3.9 4.5 4.6 1.7 1.8 1.8 7.7 7.7 7.6 Philippines 7.2 8.0 7.5 0.3 0.4 0.4 16.4 16.7 16.8 Thailand 4.9 5.0 5.2 0.4 0.2 0.6 1.3 1.3 1.3 Turkey 4.7 5.5 5.2 0.5 0.9 0.8 13.5 13.3 13.2 Viet Nam 6.0 6.3 6.6 0.5 0.8 0.8 5.2 5.2 5.9
AFRICA 76.9 82.3 83.7 12.1 10.3 10.9 40.1 40.6 40.6 Algeria 2.7 3.3 3.5 0.4 0.6 0.6 3.4 3.3 3.3 Egypt 13.1 13.0 13.1 0.9 0.6 0.7 46.6 46.3 46.2 Ethiopia 5.9 6.8 6.8 0.5 0.7 0.7 47.0 47.3 46.1 Kenya 3.9 4.0 4.2 0.3 0.2 0.3 80.8 80.0 80.4 Morocco 1.8 2.3 2.4 0.6 0.7 0.8 10.8 10.6 10.4 Nigeria 8.7 9.9 10.2 0.3 0.5 0.5 30.3 32.1 33.9 South Africa 10.5 10.9 11.1 2.2 0.7 1.2 89.5 89.6 90.0 Tanzania, United Rep. of 4.2 4.5 4.6 0.4 0.5 0.6 66.3 66.1 67.8
CENTRAL AMERICA 38.2 40.8 41.9 2.9 3.7 3.4 95.1 94.6 94.8 Mexico 28.9 31.4 32.4 1.7 2.5 2.2 131.3 130.8 130.9
SOUTH AMERICA 72.2 81.5 82.6 10.2 15.6 13.4 25.6 25.8 25.9 Argentina 5.8 9.1 9.2 1.4 2.0 1.8 7.2 7.2 7.2 Brazil 48.0 52.5 53.4 5.2 9.0 7.5 23.7 24.0 24.3 Chile 2.1 2.3 2.3 0.3 0.5 0.5 16.7 16.5 16.3 Colombia 5.0 5.4 5.4 0.1 0.2 0.1 41.3 41.8 41.7 Peru 3.5 3.6 3.6 0.6 0.6 0.6 18.7 18.3 18.0 Venezuela 4.0 4.6 4.8 0.4 0.6 0.6 50.5 51.0 50.2
NORTH AMERICA 287.7 309.3 312.8 26.3 37.2 34.1 15.2 15.2 15.1 Canada 11.8 12.1 12.4 1.4 3.4 3.1 3.2 3.2 3.2 United States of America 275.9 297.2 300.4 24.9 33.8 31.0 16.5 16.6 16.4
EUROPE 90.3 94.3 95.2 12.0 18.5 21.0 8.2 8.4 8.4 European Union 67.1 69.2 70.1 8.7 11.5 12.5 9.5 9.7 9.8 Russian Federation 4.8 7.3 7.1 0.6 0.5 0.5 1.1 1.2 1.2 Serbia 5.4 5.0 5.2 0.5 0.2 0.5 18.3 17.8 17.8 Ukraine 7.3 9.2 9.1 1.3 5.1 6.5 12.7 14.4 13.1
OCEANIA 0.5 0.6 0.5 0.1 0.1 0.1 2.4 2.4 2.3
WORLD 875.4 951.0 974.2 129.6 169.8 162.3 17.6 18.0 18.1 Developing countries 467.9 517.1 535.7 88.1 112.2 104.6 18.4 18.8 18.9 Developed countries 407.5 433.9 438.5 41.6 57.6 57.7 14.3 14.4 14.4 LIFDCs 78.8 85.1 85.6 9.9 11.1 11.2 18.9 19.5 19.6 LDCs 37.4 40.5 40.7 7.5 7.2 7.1 27.6 28.1 27.9
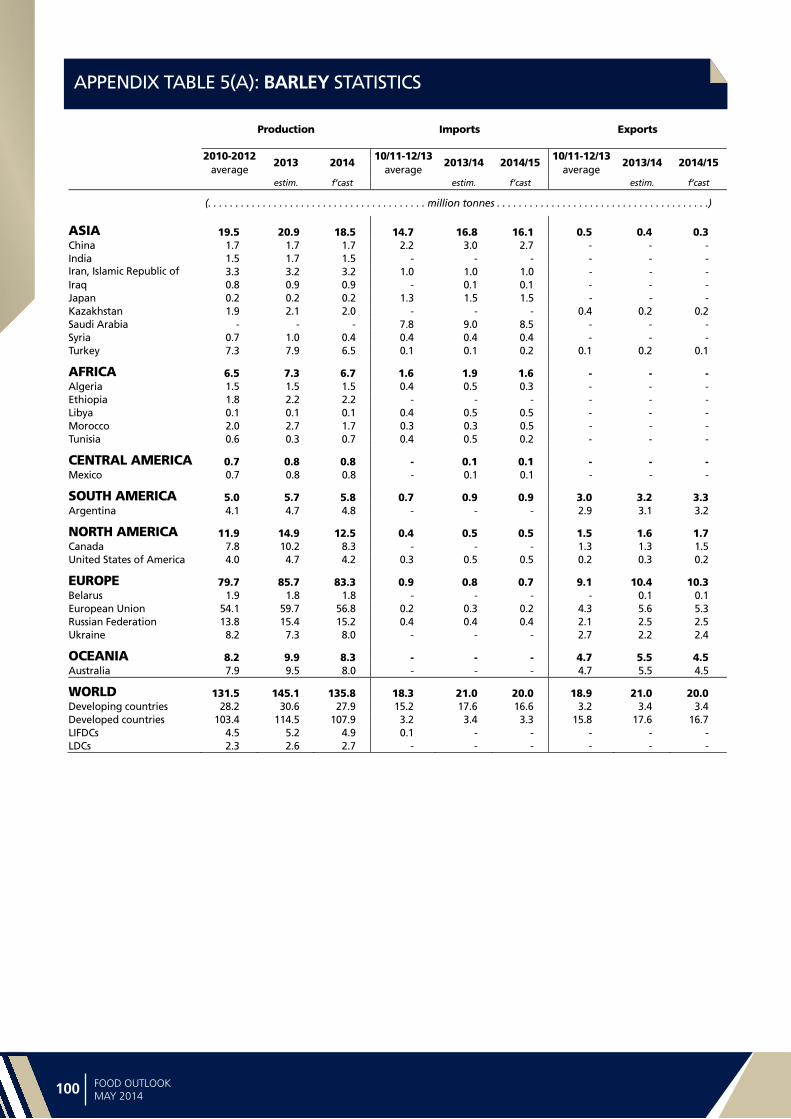
Sta
tist
ica
l a
pp
en
dix
100 101FOOD OUTLOOKMAY 2014
APPENDIX TABLE 5(A): BARLEY STATISTICS
1,> Production Imports Exports
2010-2012 2013 2014
10/11-12/132013/14 2014/15
10/11-12/13 2013/14 2014/15
average average average estim. f’cast estim. f’cast estim. f’cast
(. . . . . . . . . . . . . . . . . . . . . . . . . . . . . . . . . . . . . . . . million tonnes . . . . . . . . . . . . . . . . . . . . . . . . . . . . . . . . . . . . . . .)
ASIA 19.5 20.9 18.5 14.7 16.8 16.1 0.5 0.4 0.3 China 1.7 1.7 1.7 2.2 3.0 2.7 - - - India 1.5 1.7 1.5 - - - - - - Iran, Islamic Republic of 3.3 3.2 3.2 1.0 1.0 1.0 - - - Iraq 0.8 0.9 0.9 - 0.1 0.1 - - - Japan 0.2 0.2 0.2 1.3 1.5 1.5 - - - Kazakhstan 1.9 2.1 2.0 - - - 0.4 0.2 0.2 Saudi Arabia - - - 7.8 9.0 8.5 - - - Syria 0.7 1.0 0.4 0.4 0.4 0.4 - - - Turkey 7.3 7.9 6.5 0.1 0.1 0.2 0.1 0.2 0.1
AFRICA 6.5 7.3 6.7 1.6 1.9 1.6 - - - Algeria 1.5 1.5 1.5 0.4 0.5 0.3 - - - Ethiopia 1.8 2.2 2.2 - - - - - - Libya 0.1 0.1 0.1 0.4 0.5 0.5 - - - Morocco 2.0 2.7 1.7 0.3 0.3 0.5 - - - Tunisia 0.6 0.3 0.7 0.4 0.5 0.2 - - -
CENTRAL AMERICA 0.7 0.8 0.8 - 0.1 0.1 - - - Mexico 0.7 0.8 0.8 - 0.1 0.1 - - -
SOUTH AMERICA 5.0 5.7 5.8 0.7 0.9 0.9 3.0 3.2 3.3 Argentina 4.1 4.7 4.8 - - - 2.9 3.1 3.2
NORTH AMERICA 11.9 14.9 12.5 0.4 0.5 0.5 1.5 1.6 1.7 Canada 7.8 10.2 8.3 - - - 1.3 1.3 1.5 United States of America 4.0 4.7 4.2 0.3 0.5 0.5 0.2 0.3 0.2
EUROPE 79.7 85.7 83.3 0.9 0.8 0.7 9.1 10.4 10.3 Belarus 1.9 1.8 1.8 - - - - 0.1 0.1 European Union 54.1 59.7 56.8 0.2 0.3 0.2 4.3 5.6 5.3 Russian Federation 13.8 15.4 15.2 0.4 0.4 0.4 2.1 2.5 2.5 Ukraine 8.2 7.3 8.0 - - - 2.7 2.2 2.4
OCEANIA 8.2 9.9 8.3 - - - 4.7 5.5 4.5 Australia 7.9 9.5 8.0 - - - 4.7 5.5 4.5
WORLD 131.5 145.1 135.8 18.3 21.0 20.0 18.9 21.0 20.0 Developing countries 28.2 30.6 27.9 15.2 17.6 16.6 3.2 3.4 3.4 Developed countries 103.4 114.5 107.9 3.2 3.4 3.3 15.8 17.6 16.7 LIFDCs 4.5 5.2 4.9 0.1 - - - - - LDCs 2.3 2.6 2.7 - - - - - -

Statistica
l ap
pe
nd
ix
100 101FOOD OUTLOOKMAY 2014
APPENDIX TABLE 5(B): BARLEY STATISTICS
1,> Total Utilization Stocks ending in Per caput food use
10/11-12/13 2013/14 2014/15
2011-20132014 2015
10/11-12/13 2013/14 2014/15
average average average estim. f’cast estim. f’cast estim. f’cast
(. . . . . . . . . . . . . . . . . . . . . . . . . . million tonnes . . . . . . . . . . . . . . . . . . . . .) (. . . . . . . . . . Kg/year . . . . . . . .)
ASIA 33.3 35.3 34.7 7.0 9.9 9.5 0.6 0.7 0.6 China 4.0 4.1 4.3 0.9 1.5 1.5 0.1 0.1 0.1 India 1.5 1.7 1.5 - - - 1.1 1.2 1.0 Iran, Islamic Republic of 4.0 4.0 4.3 0.9 1.4 1.3 0.4 0.3 0.3 Iraq 0.8 1.0 1.0 0.1 - - 3.9 3.9 3.7 Japan 1.6 1.6 1.6 0.4 0.5 0.5 2.4 2.4 2.4 Kazakhstan 1.5 1.7 1.7 0.1 0.3 0.4 1.2 1.2 1.2 Saudi Arabia 7.5 8.2 8.5 2.0 3.4 3.4 1.0 1.0 1.0 Syria 1.4 1.3 0.9 0.7 0.7 0.5 12.9 12.8 12.7 Turkey 7.3 7.7 7.0 1.2 1.3 1.0 1.1 1.1 1.1
AFRICA 8.5 8.9 8.6 1.8 1.9 1.6 3.6 3.5 3.7 Algeria 1.9 1.9 2.0 0.5 0.7 0.5 15.4 15.0 14.8 Ethiopia 1.8 2.0 2.2 0.1 0.2 0.2 17.4 17.5 18.6 Libya 0.5 0.6 0.6 - - - 13.6 13.4 13.3 Morocco 2.6 2.8 2.3 0.7 0.4 0.3 43.1 42.4 43.3 Tunisia 1.0 0.9 0.8 0.3 0.3 0.4 8.4 8.2 8.1
CENTRAL AMERICA 0.7 0.9 0.8 0.1 0.2 0.2 - - - Mexico 0.7 0.9 0.8 0.1 0.2 0.2 - - -
SOUTH AMERICA 2.7 3.0 3.2 0.6 0.6 0.6 0.5 0.5 0.5 Argentina 1.1 1.3 1.4 0.5 0.5 0.5 - - -
NORTH AMERICA 10.8 11.3 11.4 2.8 4.3 3.6 0.5 0.5 0.5 Canada 6.4 6.6 6.8 1.2 2.5 1.9 0.3 0.3 0.3 United States of America 4.5 4.7 4.6 1.7 1.8 1.7 0.6 0.5 0.5
EUROPE 75.7 74.6 72.7 10.4 9.6 10.7 1.4 1.5 1.5 Belarus 1.9 1.8 1.7 0.1 - 0.1 - - - European Union 53.4 52.4 50.7 7.7 8.0 9.0 0.7 0.8 0.8 Russian Federation 12.9 13.2 13.2 1.1 0.8 0.7 0.3 0.4 0.4 Ukraine 5.6 5.6 5.6 1.1 0.5 0.5 13.0 12.6 12.7
OCEANIA 3.6 3.9 4.0 1.9 1.8 1.7 0.2 0.2 0.2 Australia 3.3 3.5 3.6 1.9 1.8 1.7 0.3 0.3 0.3
WORLD 135.3 137.8 135.3 24.6 28.2 27.8 1.1 1.2 1.1 Developing countries 40.1 42.5 41.6 8.5 11.0 10.3 1.1 1.1 1.1 Developed countries 95.2 95.3 93.7 16.2 17.3 17.5 1.2 1.2 1.2 LIFDCs 4.6 5.0 4.9 0.4 0.7 0.7 1.3 1.3 1.3 LDCs 2.4 2.5 2.7 0.2 0.3 0.3 2.0 2.0 2.1

Sta
tist
ica
l a
pp
en
dix
102 103FOOD OUTLOOKMAY 2014
APPENDIX TABLE 6(A): SORGHUM STATISTICS
APPENDIX TABLE 7(A): OTHER COARSE GRAIN STATISTICS: MILLET, RYE, OATS AND OTHER GRAINS
1,> Production Imports Exports
2010-2012 2013 2014
10/11-12/132013/14 2014/15
10/11-12/13 2013/14 2014/15
average average average estim. f’cast estim. f’cast estim. f’cast
(. . . . . . . . . . . . . . . . . . . . . . . . . . . . . . . . . . . . . . . . million tonnes . . . . . . . . . . . . . . . . . . . . . . . . . . . . . . . . . . . . . . .)
ASIA 9.4 9.3 9.7 2.0 3.9 4.0 0.1 0.1 0.1 China 2.4 3.0 2.7 0.2 2.1 2.3 - - - India 6.0 5.3 6.0 - - - - - - Japan - - - 1.6 1.6 1.6 - - -
AFRICA 25.1 23.6 26.1 0.6 1.2 0.9 0.9 0.8 0.7 Burkina Faso 1.8 1.9 1.9 - - - 0.2 0.2 0.1 Ethiopia 4.0 4.6 4.6 - - - 0.3 0.4 0.4 Nigeria 6.6 6.7 6.7 - - - 0.1 0.1 0.1 Sudan 3.7 2.2 4.0 0.1 0.5 0.2 - - -
CENTRAL AMERICA 7.2 7.6 7.4 1.9 0.8 1.1 - - - Mexico 6.8 7.2 7.0 1.9 0.7 1.0 - - -
SOUTH AMERICA 7.1 6.9 6.7 1.2 1.2 1.1 2.3 1.4 1.6 Argentina 4.1 3.6 3.3 - - - 2.3 1.4 1.6 Brazil 1.8 2.1 2.1 - - - - - - Venezuela 0.5 0.5 0.5 - - - - - -
NORTH AMERICA 6.8 9.9 8.5 0.1 - 0.1 2.5 4.2 4.2 United States of America 6.8 9.9 8.5 0.1 - 0.1 2.5 4.2 4.2
EUROPE 0.8 0.9 0.8 0.6 0.3 0.4 - - - European Union 0.6 0.6 0.6 0.5 0.2 0.3 - - -
OCEANIA 1.9 2.0 1.3 0.1 0.1 0.1 1.0 1.0 0.9 Australia 1.9 2.0 1.3 - - - 1.0 1.0 0.9
WORLD 58.4 60.1 60.5 6.6 7.5 7.5 6.9 7.5 7.5 Developing countries 48.7 47.2 49.7 4.0 5.3 5.4 3.3 2.3 2.4 Developed countries 9.7 12.9 10.8 2.5 2.2 2.2 3.6 5.3 5.2 LIFDCs 30.8 28.6 31.7 0.5 0.9 0.6 0.9 0.8 0.7 LDCs 16.5 14.9 17.3 0.3 0.7 0.5 0.8 0.7 0.6
Production Imports Exports
2010-2012 2013 2014
10/11-12/132013/14 2014/15
10/11-12/13 2013/14 2014/15
average average average estim. f’cast estim. f’cast estim. f’cast
(. . . . . . . . . . . . . . . . . . . . . . . . . . . . . . . . . . . . . . . . million tonnes . . . . . . . . . . . . . . . . . . . . . . . . . . . . . . . . . . . . . . .)
ASIA 20.1 17.9 17.7 0.5 0.9 0.8 0.1 0.1 0.1
AFRICA 17.0 16.1 18.0 0.1 0.1 0.1 0.8 1.2 1.3
CENTRAL AMERICA 0.1 0.1 0.1 0.2 0.2 0.3 - - -
SOUTH AMERICA 1.7 1.7 1.6 0.1 0.2 0.3 0.1 0.1 0.1
NORTH AMERICA 4.9 5.8 5.3 1.8 2.2 2.1 2.0 2.0 2.1
EUROPE 43.3 49.7 47.6 0.5 0.9 0.8 0.6 1.0 0.9
OCEANIA 1.6 1.8 1.7 0.1 0.1 0.1 0.2 0.1 0.1
WORLD 88.7 93.1 92.2 3.3 4.5 4.5 3.7 4.5 4.5
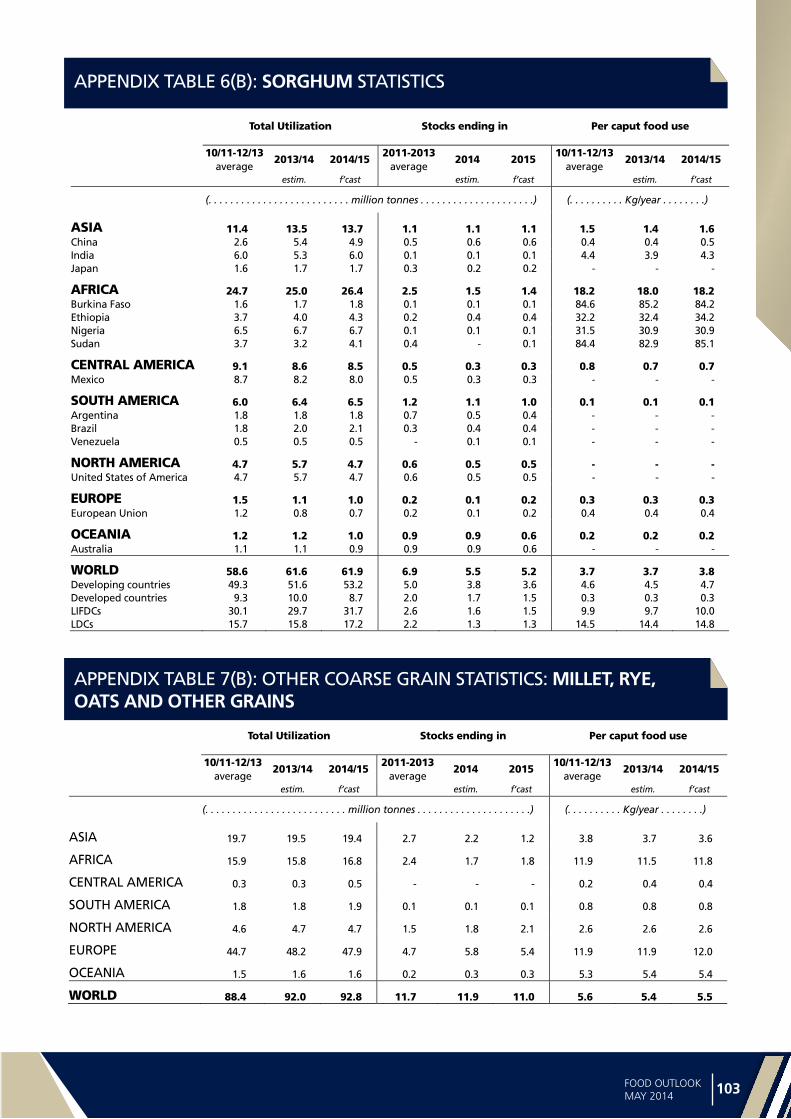
Statistica
l ap
pe
nd
ix
102 103FOOD OUTLOOKMAY 2014
APPENDIX TABLE 7(B): OTHER COARSE GRAIN STATISTICS: MILLET, RYE, OATS AND OTHER GRAINS
APPENDIX TABLE 6(B): SORGHUM STATISTICS
Total Utilization Stocks ending in Per caput food use
10/11-12/13 2013/14 2014/15
2011-20132014 2015
10/11-12/13 2013/14 2014/15
average average average estim. f’cast estim. f’cast estim. f’cast
(. . . . . . . . . . . . . . . . . . . . . . . . . . million tonnes . . . . . . . . . . . . . . . . . . . . .) (. . . . . . . . . . Kg/year . . . . . . . .)
ASIA 11.4 13.5 13.7 1.1 1.1 1.1 1.5 1.4 1.6 China 2.6 5.4 4.9 0.5 0.6 0.6 0.4 0.4 0.5 India 6.0 5.3 6.0 0.1 0.1 0.1 4.4 3.9 4.3 Japan 1.6 1.7 1.7 0.3 0.2 0.2 - - -
AFRICA 24.7 25.0 26.4 2.5 1.5 1.4 18.2 18.0 18.2 Burkina Faso 1.6 1.7 1.8 0.1 0.1 0.1 84.6 85.2 84.2 Ethiopia 3.7 4.0 4.3 0.2 0.4 0.4 32.2 32.4 34.2 Nigeria 6.5 6.7 6.7 0.1 0.1 0.1 31.5 30.9 30.9 Sudan 3.7 3.2 4.1 0.4 - 0.1 84.4 82.9 85.1
CENTRAL AMERICA 9.1 8.6 8.5 0.5 0.3 0.3 0.8 0.7 0.7 Mexico 8.7 8.2 8.0 0.5 0.3 0.3 - - -
SOUTH AMERICA 6.0 6.4 6.5 1.2 1.1 1.0 0.1 0.1 0.1 Argentina 1.8 1.8 1.8 0.7 0.5 0.4 - - - Brazil 1.8 2.0 2.1 0.3 0.4 0.4 - - - Venezuela 0.5 0.5 0.5 - 0.1 0.1 - - -
NORTH AMERICA 4.7 5.7 4.7 0.6 0.5 0.5 - - - United States of America 4.7 5.7 4.7 0.6 0.5 0.5 - - -
EUROPE 1.5 1.1 1.0 0.2 0.1 0.2 0.3 0.3 0.3 European Union 1.2 0.8 0.7 0.2 0.1 0.2 0.4 0.4 0.4
OCEANIA 1.2 1.2 1.0 0.9 0.9 0.6 0.2 0.2 0.2 Australia 1.1 1.1 0.9 0.9 0.9 0.6 - - -
WORLD 58.6 61.6 61.9 6.9 5.5 5.2 3.7 3.7 3.8 Developing countries 49.3 51.6 53.2 5.0 3.8 3.6 4.6 4.5 4.7 Developed countries 9.3 10.0 8.7 2.0 1.7 1.5 0.3 0.3 0.3 LIFDCs 30.1 29.7 31.7 2.6 1.6 1.5 9.9 9.7 10.0 LDCs 15.7 15.8 17.2 2.2 1.3 1.3 14.5 14.4 14.8
,> Total Utilization Stocks ending in Per caput food use
10/11-12/13 2013/14 2014/15
2011-20132014 2015
10/11-12/13 2013/14 2014/15
average average average estim. f’cast estim. f’cast estim. f’cast
(. . . . . . . . . . . . . . . . . . . . . . . . . . million tonnes . . . . . . . . . . . . . . . . . . . . .) (. . . . . . . . . . Kg/year . . . . . . . .)
ASIA 19.7 19.5 19.4 2.7 2.2 1.2 3.8 3.7 3.6
AFRICA 15.9 15.8 16.8 2.4 1.7 1.8 11.9 11.5 11.8
CENTRAL AMERICA 0.3 0.3 0.5 - - - 0.2 0.4 0.4
SOUTH AMERICA 1.8 1.8 1.9 0.1 0.1 0.1 0.8 0.8 0.8
NORTH AMERICA 4.6 4.7 4.7 1.5 1.8 2.1 2.6 2.6 2.6
EUROPE 44.7 48.2 47.9 4.7 5.8 5.4 11.9 11.9 12.0
OCEANIA 1.5 1.6 1.6 0.2 0.3 0.3 5.3 5.4 5.4
WORLD 88.4 92.0 92.8 11.7 11.9 11.0 5.6 5.4 5.5

Sta
tist
ica
l a
pp
en
dix
104 105FOOD OUTLOOKMAY 2014
APPENDIX TABLE 8(A): RICE STATISTICS
Production Imports Exports
10/11-12/13 2013/14 2014/15
2010-20122013 2014
2010-2012 2013 2014
average average average estim. f’cast estim. f’cast estim. f’cast
(. . . . . . . . . . . . . . . . . . . . . . . . . . . . . . . . million tonnes, milled equivalent . . . . . . . . . . . . . . . . . . . . . . . . . . . . . . .)
ASIA 437.1 450.8 453.2 17.2 16.8 18.0 27.6 29.5 31.5 Bangladesh 33.8 34.3 34.7 0.7 - 0.4 - - - China 138.4 140.5 141.4 1.8 2.7 3.0 0.5 0.5 0.4 of which Taiwan Prov. 1.2 1.2 1.3 0.3 0.2 0.2 0.1 - - India 102.2 106.2 107.0 0.1 0.1 0.1 5.8 10.5 9.8 Indonesia 42.3 44.9 45.4 1.9 0.7 1.1 - - - Iran, Islamic Republic of 1.8 1.8 1.9 1.2 1.9 1.5 - - - Iraq 0.1 0.1 0.1 1.3 1.5 1.5 - - - Japan 7.7 7.8 7.7 0.7 0.7 0.7 0.2 0.2 0.2 Korea, D.P.R. 1.7 1.9 1.9 0.1 0.1 - - - - Korea, Republic of 4.2 4.2 4.3 0.4 0.6 0.5 - - - Malaysia 1.7 1.7 1.7 1.0 1.0 1.1 - - - Myanmar 18.8 17.6 18.3 - - - 0.6 0.5 0.6 Pakistan 5.5 6.4 6.5 - 0.1 0.1 3.1 3.1 3.3 Philippines 11.3 12.4 12.6 1.6 0.7 1.4 - - - Saudi Arabia - - - 1.2 1.4 1.4 - - - Sri Lanka 2.7 3.1 2.6 0.1 - 0.1 - 0.1 - Thailand 24.7 25.3 24.8 0.5 0.6 0.3 8.8 6.6 8.7 Viet Nam 28.0 29.4 29.5 0.6 0.6 0.5 7.2 6.7 7.2
AFRICA 17.2 17.8 18.4 11.7 13.5 14.0 0.4 0.5 0.6 Cote d’Ívoire 0.4 0.5 0.5 1.1 1.3 1.3 - - - Egypt 3.7 4.2 4.2 0.3 0.3 0.3 0.3 0.4 0.5 Madagascar 3.0 2.4 2.9 0.2 0.4 0.4 - - - Nigeria 2.7 2.8 2.8 2.5 2.5 2.9 - - - Senegal 0.3 0.3 0.4 0.9 1.0 1.0 - - - South Africa - - - 1.0 1.4 1.4 - - - Tanzania, United Rep. of 1.5 1.3 1.2 0.1 0.2 0.2 - - -
CENTRAL AMERICA 1.8 2.0 2.0 2.1 2.1 2.2 0.1 - - Cuba 0.4 0.5 0.5 0.4 0.4 0.4 - - - Mexico 0.1 0.1 0.1 0.6 0.7 0.7 - - -
SOUTH AMERICA 16.6 16.9 17.5 1.3 1.6 1.7 3.1 3.1 3.2 Argentina 1.0 1.1 1.1 - - - 0.6 0.5 0.6 Brazil 8.2 7.9 8.6 0.7 0.7 0.7 0.9 0.8 0.9 Peru 1.9 2.1 1.9 0.2 0.2 0.2 - - - Uruguay 1.0 1.0 0.9 - - - 0.9 0.9 0.8
NORTH AMERICA 6.6 6.1 6.9 1.0 1.1 1.1 3.5 3.3 3.3 Canada - - - 0.4 0.4 0.4 - - - United States of America 6.6 6.1 6.9 0.6 0.7 0.7 3.5 3.3 3.3
EUROPE 2.7 2.5 2.6 1.6 1.7 1.8 0.4 0.3 0.2 European Union 1.9 1.7 1.8 1.2 1.2 1.3 0.2 0.2 0.1 Russian Federation 0.7 0.6 0.7 0.2 0.2 0.2 0.2 0.1 0.1
OCEANIA 0.4 0.8 0.6 0.5 0.5 0.5 0.3 0.5 0.5 Australia 0.4 0.8 0.6 0.2 0.1 0.1 0.3 0.5 0.5
WORLD 482.6 496.9 501.1 35.3 37.2 39.3 35.3 37.2 39.3 Developing countries 464.7 479.2 482.8 30.6 31.9 33.8 30.9 32.9 35.1 Developed countries 17.9 17.7 18.3 4.7 5.3 5.5 4.4 4.3 4.2 LIFDCs 169.3 176.0 177.3 14.0 13.6 15.3 6.0 10.7 9.9 LDCs 74.1 74.1 75.5 7.0 7.2 7.8 1.8 1.9 1.9
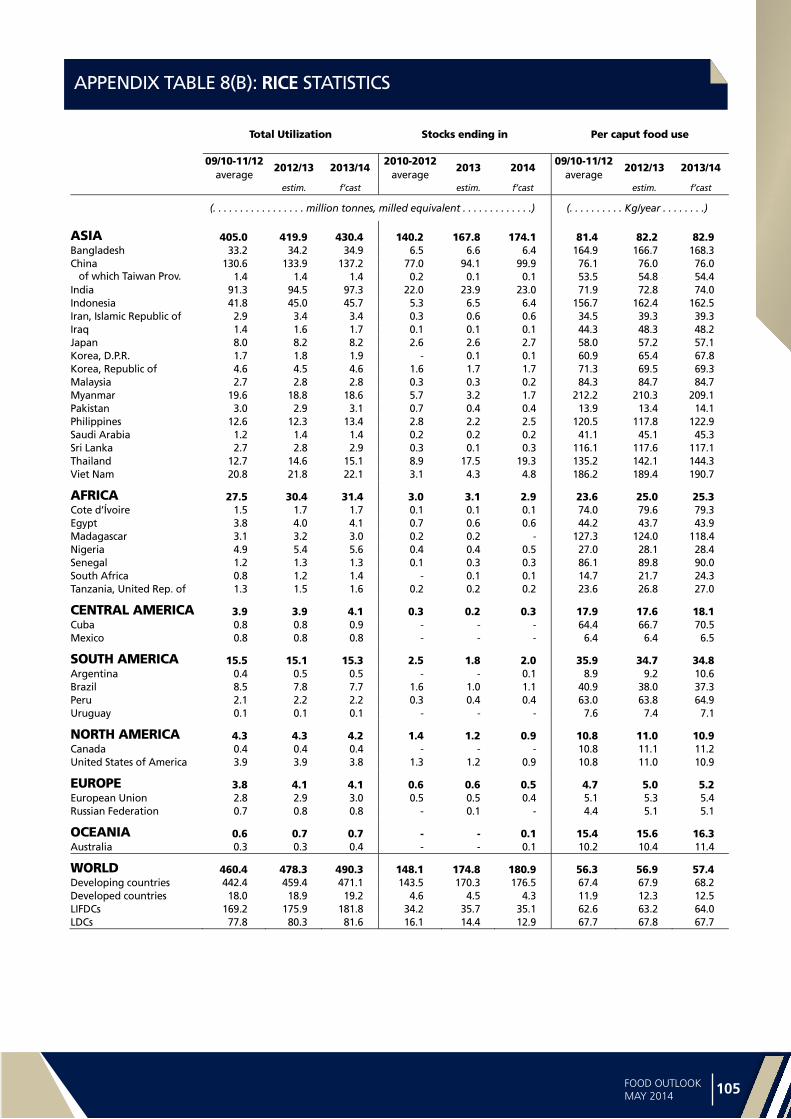
Statistica
l ap
pe
nd
ix
104 105FOOD OUTLOOKMAY 2014
APPENDIX TABLE 8(B): RICE STATISTICS
1,> Total Utilization Stocks ending in Per caput food use
09/10-11/12 2012/13 2013/14
2010-20122013 2014
09/10-11/12 2012/13 2013/14
average average average estim. f’cast estim. f’cast estim. f’cast
(. . . . . . . . . . . . . . . . . million tonnes, milled equivalent . . . . . . . . . . . . .) (. . . . . . . . . . Kg/year . . . . . . . .)
ASIA 405.0 419.9 430.4 140.2 167.8 174.1 81.4 82.2 82.9 Bangladesh 33.2 34.2 34.9 6.5 6.6 6.4 164.9 166.7 168.3 China 130.6 133.9 137.2 77.0 94.1 99.9 76.1 76.0 76.0 of which Taiwan Prov. 1.4 1.4 1.4 0.2 0.1 0.1 53.5 54.8 54.4 India 91.3 94.5 97.3 22.0 23.9 23.0 71.9 72.8 74.0 Indonesia 41.8 45.0 45.7 5.3 6.5 6.4 156.7 162.4 162.5 Iran, Islamic Republic of 2.9 3.4 3.4 0.3 0.6 0.6 34.5 39.3 39.3 Iraq 1.4 1.6 1.7 0.1 0.1 0.1 44.3 48.3 48.2 Japan 8.0 8.2 8.2 2.6 2.6 2.7 58.0 57.2 57.1 Korea, D.P.R. 1.7 1.8 1.9 - 0.1 0.1 60.9 65.4 67.8 Korea, Republic of 4.6 4.5 4.6 1.6 1.7 1.7 71.3 69.5 69.3 Malaysia 2.7 2.8 2.8 0.3 0.3 0.2 84.3 84.7 84.7 Myanmar 19.6 18.8 18.6 5.7 3.2 1.7 212.2 210.3 209.1 Pakistan 3.0 2.9 3.1 0.7 0.4 0.4 13.9 13.4 14.1 Philippines 12.6 12.3 13.4 2.8 2.2 2.5 120.5 117.8 122.9 Saudi Arabia 1.2 1.4 1.4 0.2 0.2 0.2 41.1 45.1 45.3 Sri Lanka 2.7 2.8 2.9 0.3 0.1 0.3 116.1 117.6 117.1 Thailand 12.7 14.6 15.1 8.9 17.5 19.3 135.2 142.1 144.3 Viet Nam 20.8 21.8 22.1 3.1 4.3 4.8 186.2 189.4 190.7
AFRICA 27.5 30.4 31.4 3.0 3.1 2.9 23.6 25.0 25.3 Cote d’Ívoire 1.5 1.7 1.7 0.1 0.1 0.1 74.0 79.6 79.3 Egypt 3.8 4.0 4.1 0.7 0.6 0.6 44.2 43.7 43.9 Madagascar 3.1 3.2 3.0 0.2 0.2 - 127.3 124.0 118.4 Nigeria 4.9 5.4 5.6 0.4 0.4 0.5 27.0 28.1 28.4 Senegal 1.2 1.3 1.3 0.1 0.3 0.3 86.1 89.8 90.0 South Africa 0.8 1.2 1.4 - 0.1 0.1 14.7 21.7 24.3 Tanzania, United Rep. of 1.3 1.5 1.6 0.2 0.2 0.2 23.6 26.8 27.0
CENTRAL AMERICA 3.9 3.9 4.1 0.3 0.2 0.3 17.9 17.6 18.1 Cuba 0.8 0.8 0.9 - - - 64.4 66.7 70.5 Mexico 0.8 0.8 0.8 - - - 6.4 6.4 6.5
SOUTH AMERICA 15.5 15.1 15.3 2.5 1.8 2.0 35.9 34.7 34.8 Argentina 0.4 0.5 0.5 - - 0.1 8.9 9.2 10.6 Brazil 8.5 7.8 7.7 1.6 1.0 1.1 40.9 38.0 37.3 Peru 2.1 2.2 2.2 0.3 0.4 0.4 63.0 63.8 64.9 Uruguay 0.1 0.1 0.1 - - - 7.6 7.4 7.1
NORTH AMERICA 4.3 4.3 4.2 1.4 1.2 0.9 10.8 11.0 10.9 Canada 0.4 0.4 0.4 - - - 10.8 11.1 11.2 United States of America 3.9 3.9 3.8 1.3 1.2 0.9 10.8 11.0 10.9
EUROPE 3.8 4.1 4.1 0.6 0.6 0.5 4.7 5.0 5.2 European Union 2.8 2.9 3.0 0.5 0.5 0.4 5.1 5.3 5.4 Russian Federation 0.7 0.8 0.8 - 0.1 - 4.4 5.1 5.1
OCEANIA 0.6 0.7 0.7 - - 0.1 15.4 15.6 16.3 Australia 0.3 0.3 0.4 - - 0.1 10.2 10.4 11.4
WORLD 460.4 478.3 490.3 148.1 174.8 180.9 56.3 56.9 57.4 Developing countries 442.4 459.4 471.1 143.5 170.3 176.5 67.4 67.9 68.2 Developed countries 18.0 18.9 19.2 4.6 4.5 4.3 11.9 12.3 12.5 LIFDCs 169.2 175.9 181.8 34.2 35.7 35.1 62.6 63.2 64.0 LDCs 77.8 80.3 81.6 16.1 14.4 12.9 67.7 67.8 67.7

Sta
tist
ica
l a
pp
en
dix
106 107FOOD OUTLOOKMAY 2014
APPENDIX TABLE 9: CEREAL SUPPLY AND UTILIZATION IN SELECTED EXPORTERS (million tonnes)
,11,> Wheat1 Coarse Grains2 Rice (milled basis)
2012/13 2013/14 2014/15 2012/13 2013/14 2014/15 2012/13 2013/14 2014/15 estim. f’cast estim. f’cast estim. f’cast
UNITED STATES (June/May) UNITED STATES UNITED STATES (Aug./July) Opening stocks 20.2 19.5 15.9 27.8 23.5 36.4 1.3 1.2 0.9 Production 61.7 58.0 57.0 286.3 369.8 344.1 6.3 6.1 6.9 Imports 3.3 4.5 5.0 6.8 3.0 4.3 0.7 0.7 0.7 Total Supply 85.2 82.0 77.9 320.9 396.3 384.8 8.3 8.0 8.5 Domestic use 38.3 34.1 34.4 276.6 311.0 313.2 3.8 4.0 4.1 Exports 27.4 32.0 29.0 20.8 48.9 38.1 3.4 3.1 3.4 Closing stocks 19.5 15.9 14.5 23.5 36.4 33.6 1.2 0.9 1.0
CANADA (August/July) CANADA THAILAND (Nov./Oct.)3 Opening stocks 5.9 5.1 11.8 3.4 2.9 7.4 13.0 17.5 19.3 Production 27.2 37.5 29.3 24.5 28.8 24.9 25.2 25.3 24.8 Imports 0.1 0.0 0.0 0.6 0.9 0.5 0.6 0.3 0.3 Total Supply 33.2 42.6 41.1 28.6 32.6 32.7 38.7 43.1 44.4 Domestic use 8.7 9.3 9.4 19.3 20.0 20.5 14.6 15.1 15.5 Exports 19.4 21.6 22.1 6.4 5.2 5.4 6.6 8.7 9.7 Closing stocks 5.1 11.8 9.7 2.9 7.4 6.8 17.5 19.3 19.2
ARGENTINA (Dec./Nov.) ARGENTINA INDIA (Oct./Sept.)3 Opening stocks 0.8 0.5 2.2 4.0 1.8 3.0 23.5 23.9 23.0 Production 8.2 9.2 10.5 31.2 37.8 33.6 105.2 106.2 107.0 Imports 0.0 0.0 0.0 0.0 0.1 0.1 0.1 0.1 0.1 Total Supply 9.0 9.7 12.8 35.2 39.7 36.7 128.8 130.1 130.1 Domestic use 5.3 5.5 5.6 9.6 12.8 13.0 94.5 97.3 99.8 Exports 3.3 2.0 4.0 23.8 23.9 21.0 10.5 9.8 8.5 Closing stocks 0.5 2.2 3.2 1.8 3.0 2.7 23.9 23.0 21.8
AUSTRALIA (Oct./Sept.) AUSTRALIA PAKISTAN (Nov./Oct.)3 Opening stocks 4.9 2.4 3.1 2.8 2.6 3.0 0.8 0.4 0.4 Production 22.5 27.0 24.8 11.8 13.8 11.2 5.5 6.4 6.5 Imports 0.0 0.0 0.0 0.0 0.0 0.0 0.1 0.1 0.1 Total Supply 27.4 29.4 27.9 14.6 16.4 14.3 6.3 6.8 7.0 Domestic use 6.3 6.8 6.7 6.1 6.5 6.3 2.9 3.1 3.4 Exports 18.6 19.5 18.7 5.9 6.8 5.4 3.1 3.3 3.2 Closing stocks 2.4 3.1 2.5 2.6 3.0 2.6 0.4 0.4 0.4
EU (July/June) EU VIET NAM (Nov./Oct.)3 Opening stocks 10.8 8.7 9.5 21.4 16.6 23.6 2.9 4.3 4.8 Production 132.3 143.2 143.7 143.9 159.2 157.5 29.2 29.4 29.5 Imports 5.3 4.0 6.3 11.9 12.7 7.5 0.6 0.5 0.5 Total Supply 148.3 155.9 159.5 177.2 188.5 188.5 32.7 34.1 34.7 Domestic use 117.7 117.3 123.0 153.8 156.1 155.1 21.8 22.1 22.4 Exports 21.9 29.2 25.5 6.8 8.9 7.8 6.7 7.2 7.0 Closing stocks 8.7 9.5 11.0 16.6 23.6 25.7 4.3 4.8 5.4
TOTAL OF ABOVE TOTAL OF ABOVE TOTAL OF ABOVE Opening stocks 42.7 36.2 42.5 59.5 47.5 73.4 41.5 47.2 48.4 Production 251.8 275.0 265.3 497.7 609.4 571.3 171.4 173.4 174.7 Imports 8.7 8.5 11.4 19.3 16.6 12.3 2.0 1.6 1.6 Total Supply 303.2 319.7 319.2 576.6 673.4 657.0 214.9 222.2 224.7 Domestic use 176.3 173.0 179.0 465.4 506.4 508.0 137.4 141.7 145.2 Exports 90.7 104.2 99.3 63.7 93.7 77.7 30.3 32.1 31.8 Closing stocks 36.2 42.5 40.9 47.5 73.4 71.3 47.2 48.4 47.7
1 Trade data include wheat flour in wheat grain equivalent. For the EU semolina is also included. 2 Argentina (December/November) for rye, barley and oats, (March/February) for maize and sorghum; Australia (November/October) for rye, barley and oats, (March/February) for maize and sorghum; Canada (August/July); EU (July/June); United States (June/May) for rye, barley and oats, (September/August) for maize and sorghum. 3 Rice trade data refer to the calendar year of the second year shown.
Statistica
l ap
pe
nd
ix
106 107FOOD OUTLOOKMAY 2014
APPENDIX TABLE 10: TOTAL OILCROPS STATISTICS (million tonnes)
Production1 Imports Exports
09/10-11/12 2012/13 2013/14
09/10-11/122012/13 2013/14
09/10-11/12 2012/13 2013/14
average average average estim. f’cast estim. f’cast estim. f’cast
ASIA 130.4 135.0 136.5 79.5 86.7 97.9 2.5 2.2 2.7 China 59.4 60.5 59.3 59.1 66.6 76.9 1.1 1.0 0.9 of which Taiwan Prov. 0.1 0.1 0.1 2.4 2.3 2.3 - - - India 36.6 37.9 39.7 0.2 0.1 0.2 0.7 0.6 0.9 Indonesia 9.4 10.2 10.9 2.0 2.0 2.2 0.1 0.1 0.1 Iran, Islamic Republic of 0.7 0.7 0.7 0.7 0.5 0.5 - - - Japan 0.3 0.3 0.3 5.7 5.7 5.7 - - - Korea, Republic of 0.2 0.2 0.2 1.6 1.6 1.5 - - - Malaysia 4.7 5.0 5.1 0.7 0.7 0.7 - - 0.1 Pakistan 5.2 5.3 5.2 1.3 1.1 1.3 0.1 - - Thailand 0.7 0.8 0.8 2.0 1.9 2.0 - - - Turkey 2.4 2.7 3.2 2.4 2.0 2.0 0.1 0.1 0.1
AFRICA 17.1 17.1 17.3 3.2 3.3 3.4 0.9 0.8 0.8 Nigeria 4.8 5.0 4.9 - - - 0.2 0.1 0.1
CENTRAL AMERICA 1.4 1.6 1.6 6.2 5.9 6.4 0.2 0.1 0.2 Mexico 0.9 1.1 1.2 5.5 5.4 5.8 - - -
SOUTH AMERICA 137.9 154.3 162.2 1.3 1.6 1.7 49.2 59.4 63.7 Argentina 51.8 53.9 57.6 0.1 0.3 0.1 10.4 8.4 10.5 Brazil 73.7 84.6 89.5 0.2 0.3 0.3 31.7 42.1 45.1 Paraguay 7.0 8.5 8.1 - - - 4.7 5.2 4.5
NORTH AMERICA 116.5 114.1 122.6 2.0 2.3 3.2 52.0 48.1 56.6 Canada 18.8 20.4 24.7 0.6 0.5 0.5 11.3 11.5 12.7 United States of America 97.7 93.7 97.9 1.3 1.8 2.7 40.8 36.6 43.9
EUROPE 52.8 53.8 63.7 19.0 19.6 20.8 4.2 4.5 6.2 European Union 29.8 28.2 32.0 17.4 18.3 18.6 0.9 0.8 1.2 Russian Federation 9.4 10.9 13.1 1.1 0.9 1.7 0.3 0.3 0.4 Ukraine 11.6 12.5 16.2 - - - 2.6 3.0 4.1
OCEANIA 4.3 6.0 5.4 0.1 - - 2.3 4.3 3.6 Australia 3.9 5.6 5.0 - - - 2.2 4.2 3.5
WORLD 460.3 481.9 509.4 111.2 119.4 133.5 111.2 119.4 133.7 Developing countries 281.4 302.6 311.7 83.5 91.0 102.7 52.6 62.4 67.1 Developed countries 178.9 179.3 197.7 27.7 28.4 30.8 58.6 57.0 66.6 LIFDCs 123.8 127.3 127.1 60.0 67.2 78.0 3.1 2.9 3.1 LDCs 11.0 10.9 10.9 0.5 0.3 0.4 0.4 0.5 0.5
1 The split years bring together northern hemisphere annual crops harvested in the latter part of the first year shown, with southern hemisphere annual crops harvested in the early part of the second year shown; for tree crops which are produced throughout the year, calendar year production for the second year shown is used.

Sta
tist
ica
l a
pp
en
dix
108 109FOOD OUTLOOKMAY 2014
APPENDIX TABLE 11: TOTAL OILS AND FATS STATISTICS 1 (million tonnes)
Imports Exports Utilization
09/10-11/12 2012/13 2013/14
09/10-11/122012/13 2013/14
09/10-11/12 2012/13 2013/14
average average average estim. f’cast estim. f’cast estim. f’cast
ASIA 38.4 43.7 43.1 43.3 48.9 47.5 87.5 98.6 104.7 Bangladesh 1.4 1.6 1.6 - - - 1.7 1.8 1.9 China 10.5 12.6 11.6 0.6 0.7 0.7 32.1 36.5 38.0 of which Taiwan Prov. 0.4 0.4 0.4 - - - 0.8 0.8 0.8 India 9.4 10.8 11.1 0.5 0.5 0.5 18.9 20.5 21.3 Indonesia 0.1 0.1 0.1 19.9 23.6 23.7 7.4 9.5 11.8 Iran 1.4 2.1 1.7 0.2 0.2 0.2 1.7 2.2 2.2 Japan 1.2 1.3 1.3 - - - 3.1 3.1 3.2 Korea, Republic of 1.0 1.0 1.0 - - - 1.3 1.4 1.4 Malaysia 2.5 1.6 1.3 18.6 20.0 18.8 3.8 4.1 4.4 Pakistan 2.3 2.5 2.5 0.1 0.1 0.1 4.0 4.2 4.3 Philippines 0.5 0.7 0.8 1.1 1.2 0.9 1.3 1.5 1.6 Singapore 0.8 0.8 0.8 0.3 0.2 0.1 0.6 0.7 0.7 Turkey 1.3 1.7 1.8 0.4 0.7 0.7 2.4 2.7 2.7
AFRICA 8.3 8.7 9.5 1.7 1.8 1.7 13.9 14.4 15.1 Algeria 0.6 0.5 0.7 - - - 0.7 0.7 0.8 Egypt 1.9 1.8 2.0 0.3 0.4 0.3 2.0 1.9 2.1 Nigeria 1.0 1.0 1.2 0.1 0.2 0.1 2.7 2.8 2.9 South Africa 0.8 0.9 0.9 0.1 0.1 0.1 1.2 1.3 1.4
CENTRAL AMERICA 2.4 2.4 2.6 0.7 0.9 1.0 4.7 4.9 5.0 Mexico 1.3 1.3 1.4 0.1 0.1 0.1 3.1 3.3 3.3
SOUTH AMERICA 2.6 2.9 3.1 8.8 8.3 8.4 14.3 15.9 16.4 Argentina 0.1 0.1 - 5.5 5.1 5.1 2.8 3.6 3.8Brazil 0.5 0.7 0.7 1.9 1.6 1.6 7.5 8.0 8.0
NORTH AMERICA 4.5 4.8 4.9 6.8 6.7 6.5 18.2 19.2 19.3 Canada 0.6 0.7 0.5 3.1 3.1 3.3 1.1 1.3 1.2 United States of America 3.9 4.1 4.4 3.8 3.6 3.2 17.1 17.8 18.0
EUROPE 13.1 13.7 13.3 6.9 8.5 10.3 36.5 35.3 36.3 European Union 10.7 11.2 10.5 2.5 3.3 3.4 30.2 28.9 29.7 Russian Federation 1.1 1.2 1.2 1.0 1.5 2.4 4.0 4.1 4.2 Ukraine 0.4 0.4 0.5 3.0 3.3 4.1 1.0 1.1 1.1
OCEANIA 0.6 0.7 0.7 1.8 1.9 1.9 1.1 1.1 1.2 Australia 0.4 0.5 0.6 0.7 0.7 0.7 0.7 0.8 0.8
WORLD 69.9 77.0 77.2 70.0 77.0 77.3 176.1 189.4 198.0 Developing countries 49.3 55.2 55.7 55.0 60.5 59.2 115.1 128.3 135.6 Developed countries 20.6 21.8 21.5 15.0 16.5 18.0 61.0 61.1 62.4 LIFDCs 30.1 34.8 34.7 4.2 4.6 4.4 69.6 76.7 79.8 LDCs 5.0 5.4 5.7 0.4 0.4 0.4 8.0 8.5 8.8
1 Includes oils and fats of vegetable, marine and animal origin.

Statistica
l ap
pe
nd
ix
108 109FOOD OUTLOOKMAY 2014
APPENDIX TABLE 12: TOTAL MEALS AND CAKES STATISTICS 1 (million tonnes)
,> Imports Exports Utilization
09/10-11/12 2012/13 2013/14
09/10-11/122012/13 2013/14
09/10-11/12 2012/13 2013/14
average average average estim. f’cast estim. f’cast estim. f’cast
ASIA 29.5 32.6 34.6 14.4 16.1 15.9 124.0 137.0 142.7 China 3.5 2.6 2.8 1.4 2.0 2.1 66.9 75.6 78.4 of which Taiwan Prov. 0.4 0.5 0.5 - - - 2.3 2.4 2.4 India 0.2 0.2 0.2 5.1 5.3 4.9 12.0 12.0 12.7 Indonesia 3.2 3.7 4.1 3.1 3.8 4.0 4.6 5.4 5.9 Japan 2.8 2.3 2.5 - - - 6.9 6.3 6.5 Korea, Republic of 3.4 3.8 3.8 0.1 0.1 0.1 4.6 4.9 4.9 Malaysia 1.1 1.4 1.4 2.4 2.5 2.6 1.9 2.0 2.1 Pakistan 0.6 0.6 0.6 0.2 0.1 0.1 3.2 3.5 3.4 Philippines 1.8 2.1 2.1 0.5 0.8 0.5 2.3 2.4 2.5 Saudi Arabia 0.5 0.8 0.8 - - - 0.6 0.8 0.9 Thailand 3.0 3.6 3.6 0.1 0.2 0.2 5.1 5.7 5.7 Turkey 1.3 1.8 2.1 0.2 0.1 0.2 3.6 4.2 4.6 Viet Nam 3.3 3.8 4.0 0.1 0.1 0.1 3.7 4.8 5.1
AFRICA 4.3 4.8 5.2 0.9 0.9 0.9 10.7 11.4 11.9 Egypt 0.9 1.0 1.1 - - - 2.3 2.6 2.6 South Africa 1.2 1.4 1.3 0.1 0.1 0.1 1.9 2.2 2.2
CENTRAL AMERICA 3.4 3.3 3.5 0.2 0.2 0.2 8.1 8.3 8.5 Mexico 1.8 1.6 1.8 0.1 0.1 0.1 6.0 6.2 6.3
SOUTH AMERICA 4.8 4.9 5.1 44.6 43.0 45.6 22.9 23.4 24.4 Argentina - - - 26.9 25.5 26.5 2.3 2.8 3.4 Bolivia - - - 1.3 1.5 1.5 0.2 0.1 0.1 Brazil 0.2 - - 13.8 13.3 13.7 14.3 14.0 14.1 Chile 1.0 1.2 1.3 0.3 0.3 0.3 1.4 1.4 1.6 Paraguay - - - 0.9 1.6 2.4 0.5 0.3 0.3 Peru 0.8 0.9 0.9 1.3 0.8 0.9 1.0 1.1 1.1 Venezuela 1.3 1.3 1.3 - - - 1.4 1.4 1.4
NORTH AMERICA 3.6 4.6 4.6 13.1 14.8 15.1 34.3 33.8 33.6 Canada 1.2 1.1 1.0 3.6 4.2 4.5 2.2 2.2 2.1 United States of America 2.4 3.6 3.5 9.5 10.6 10.6 32.1 31.6 31.5
EUROPE 31.5 29.0 30.4 6.0 6.7 8.0 61.8 60.4 62.7 European Union 29.1 26.4 27.8 1.3 1.3 1.2 54.7 52.5 54.5 Russian Federation 0.6 0.7 0.5 1.3 1.8 2.4 4.0 4.4 4.7 Ukraine 0.1 - - 2.9 3.1 4.0 0.8 0.9 0.8
OCEANIA 2.3 2.6 2.5 0.2 0.2 0.2 2.9 3.3 3.2 Australia 0.7 0.8 0.8 0.1 0.1 0.1 1.3 1.4 1.4
WORLD 79.4 82.0 85.9 79.5 81.9 86.0 264.8 277.6 287.0 Developing countries 37.6 41.5 44.0 59.9 60.1 62.4 155.1 169.6 176.8 Developed countries 41.8 40.5 41.9 19.6 21.8 23.6 109.7 108.0 110.2 LIFDCs 8.6 8.4 9.0 8.3 9.3 8.8 91.1 100.4 104.5 LDCs 0.5 0.6 0.7 0.4 0.4 0.4 3.7 3.7 3.8
1 Expressed in product weight; includes meals and cakes derived from oilcrops as well as fish meal and other meals from animal origin.
Sta
tist
ica
l a
pp
en
dix
110 111FOOD OUTLOOKMAY 2014
APPENDIX TABLE 13: SUGAR STATISTICS (million tonnes, raw value)
Production Imports Exports Utilization
2012/13 2013/14 2012/13 2013/14 2012/13 2013/14 2012/13 2013/14 estim. f’cast estim. f’cast estim. f’cast estim. f’cast
ASIA 68.5 69.4 27.3 29.5 10.9 14.4 81.1 83.5 China 14.7 14.4 3.7 5.3 0.1 0.3 17.8 18.6 India 26.5 26.0 0.9 0.5 0.8 2.0 25.1 25.6 Indonesia 2.6 2.7 4.0 5.4 - - 6.5 6.8 Japan 0.7 0.7 1.5 1.5 - - 2.3 2.2 Korea, Republic of - - 1.9 1.6 0.3 0.3 1.4 1.4 Malaysia - - 1.8 1.7 0.1 0.1 1.8 1.8 Pakistan 5.3 5.8 0.1 0.1 0.2 0.5 4.9 5.0 Philippines 2.4 2.4 - - 0.4 0.4 2.1 2.1 Thailand 10.3 11.3 - - 7.5 8.2 2.5 2.5 Turkey 2.4 2.3 0.2 0.5 - 0.1 2.6 2.6 Viet Nam 1.6 1.6 0.1 0.1 0.3 0.2 1.4 1.4
AFRICA 11.8 12.4 10.7 10.1 2.2 2.9 19.9 20.2 Algeria - - 1.7 1.6 0.3 0.3 1.4 1.4 Egypt 2.0 2.1 1.4 1.3 - 0.1 3.4 3.4 Ethiopia 0.4 0.4 0.1 0.2 - - 0.5 0.5 Kenya 0.6 0.6 0.3 0.4 - - 0.9 0.9 Mauritius 0.4 0.4 - - 0.4 0.4 0.1 0.1 Morocco 0.3 0.4 1.0 0.8 - - 1.3 1.3 Mozambique 0.4 0.5 - - 0.3 0.3 0.2 0.2 South Africa 2.4 2.5 0.2 0.3 0.4 0.5 2.4 2.5 Sudan 0.9 0.9 0.8 0.8 - - 1.6 1.7 Swaziland 0.7 0.7 - - 0.6 0.6 0.1 0.1 Tanzania, United Rep. of 0.3 0.4 0.2 0.2 - - 0.5 0.5 Zambia
CENTRAL AMERICA 14.3 14.6 0.6 0.5 5.2 6.4 8.7 9.0 Cuba 1.6 1.8 - - 0.9 0.9 0.6 0.7 Dominican Republic 0.6 0.6 - - 0.2 0.2 0.4 0.5 Guatemala 2.9 2.9 0.1 0.1 1.9 2.0 0.9 0.9 Mexico 6.6 6.5 0.1 - 1.7 1.8 4.6 4.8
SOUTH AMERICA 48.0 48.0 2.3 2.2 29.5 27.2 20.7 21.3 Argentina 2.1 2.2 - - 0.3 0.4 1.8 1.8 Brazil 40.0 39.7 - - 28.4 25.5 12.2 12.4 Colombia 2.4 2.5 0.3 0.4 0.7 0.8 2.0 2.1 Peru 1.1 1.1 0.3 0.3 - - 1.4 1.4 Venezuela 0.6 0.6 0.7 0.6 - - 1.2 1.2
NORTH AMERICA 8.5 8.3 4.3 4.3 0.3 0.3 12.1 12.3 United States of America 8.4 8.2 2.9 2.9 0.3 0.2 10.6 10.8
EUROPE 26.6 24.7 6.2 7.4 2.4 2.2 29.9 30.2 European Union 17.3 16.7 4.3 4.9 1.3 1.4 19.3 19.8 Russian Federation 5.2 4.1 0.9 1.6 0.2 0.1 6.2 6.3 Ukraine 2.4 2.2 - - 0.3 0.1 2.0 2.0
OCEANIA 4.7 4.6 0.3 0.3 3.2 3.5 1.4 1.5 Australia 4.5 4.4 - - 3.2 3.3 1.1 1.1 Fiji 0.2 0.2 - - 0.1 0.1 - -
WORLD 182.4 182.0 51.6 54.4 53.5 56.8 173.9 178.0 Developing countries 139.6 141.4 36.5 38.3 47.3 50.4 123.1 126.8 Developed countries 42.8 40.7 15.1 16.1 6.2 6.4 50.8 51.1 LIFDCs 35.7 35.4 10.4 10.0 1.8 3.8 41.8 43.4 LDCs 4.2 4.2 5.9 5.9 0.5 1.0 9.1 9.4
Statistica
l ap
pe
nd
ix
110 111FOOD OUTLOOKMAY 2014
APPENDIX TABLE 14: TOTAL MEAT STATISTICS1
(thousand tonnes, carcass weight equivalent)
Production Imports Exports Utilization
2013 2014 2013 2014 2013 2014 2013 2014 estim. f’cast estim. f’cast estim. f’cast estim. f’cast
ASIA 131 486 133 398 15 296 15 645 5 367 5 638 141 414 143 405 China 85 534 86 272 4 407 4 499 1 900 1 925 88 041 88 847 of which Hong Kong, SAR 165 166 2 132 2 174 913 930 1 384 1 410 India 6 675 6 986 1 1 1 774 1 893 4 902 5 094 Indonesia 3 175 3 203 63 68 5 5 3 233 3 265 Iran, Islamic Republic of 2 556 2 612 138 149 48 50 2 645 2 711 Japan 3 243 3 235 3 102 3 106 13 13 6 332 6 328 Korea, Republic of 2 144 2 100 875 877 42 48 2 977 2 929 Malaysia 1 637 1 666 267 269 50 46 1 854 1 890 Pakistan 2 963 3 039 4 4 65 72 2 901 2 971 Philippines 3 105 3 233 334 331 14 15 3 425 3 549 Saudi Arabia 953 1 085 1 090 1 152 53 62 1 989 2 176 Singapore 117 119 312 303 60 29 370 393 Thailand 2 397 2 511 38 35 800 853 1 635 1 693 Turkey 2 977 3 105 377 376 394 460 2 960 3 021 Viet Nam 4 302 4 402 1 351 1 336 20 22 5 633 5 717
AFRICA 16 537 16 713 2 899 2 992 171 179 19 265 19 526 Algeria 713 730 89 98 - - 802 827 Angola 229 238 631 672 - - 860 910 Egypt 2 077 2 117 411 394 6 6 2 483 2 504 Nigeria 1 540 1 568 7 4 1 1 1 545 1 572 South Africa 2 774 2 799 436 433 47 51 3 162 3 180
CENTRAL AMERICA 8 864 8 962 2 806 2 805 477 501 11 193 11 265 Cuba 283 284 257 276 - - 540 560 Mexico 6 155 6 228 1 802 1 796 250 268 7 707 7 755
SOUTH AMERICA 39 875 40 609 1 127 1 170 8 012 8 389 32 989 33 389 Argentina 4 929 5 041 23 26 602 683 4 350 4 384 Brazil 25 257 25 742 64 61 6 423 6 644 18 898 19 159 Chile 1 438 1 453 360 385 292 301 1 506 1 538 Colombia 2 257 2 287 122 124 42 46 2 337 2 364 Uruguay 678 723 39 40 341 377 377 385 Venezuela 1 508 1 527 422 438 - - 1 930 1 964
NORTH AMERICA 47 209 46 885 2 398 2 434 9 290 9 298 40 317 40 021 Canada 4 430 4 469 776 771 1 720 1 734 3 487 3 506 United States of America 42 778 42 415 1 608 1 648 7 569 7 564 36 816 36 500
EUROPE 58 525 59 356 4 590 4 531 4 694 4 508 58 421 59 380 Belarus 1 144 1 157 122 128 368 410 898 875 European Union 44 897 45 203 1 336 1 345 4 016 3 822 42 217 42 725 Russian Federation 8 162 8 513 2 370 2 330 36 39 10 495 10 803 Ukraine 2 508 2 654 277 237 169 127 2 615 2 765
OCEANIA 6 174 6 057 421 416 2 891 2 826 3 704 3 647 Australia 4 323 4 248 209 208 1 965 1 944 2 567 2 512 New Zealand 1 340 1 296 62 62 923 879 478 479
WORLD 308 486 311 795 29 444 29 889 30 874 31 309 307 057 310 374 Developing countries 187 645 190 504 18 197 18 615 13 955 14 627 191 887 194 491 Developed countries 120 842 121 290 11 247 11 274 16 919 16 682 115 170 115 883 LIFDCs 22 330 22 918 1 842 1 904 1 940 2 063 22 231 22 759 LDCs 9 716 9 836 1 506 1 594 10 11 11 211 11 419
1 Including “other meat”.
Sta
tist
ica
l a
pp
en
dix
112 113FOOD OUTLOOKMAY 2014
APPENDIX TABLE 15: BOVINE MEAT STATISTICS (thousand tonnes, carcass weight equivalent)
Production Imports Exports Utilization
2013 2014 2013 2014 2013 2014 2013 2014 estim. f’cast estim. f’cast estim. f’cast estim. f’cast
ASIA 17 856 18 262 4 147 4 390 2 123 2 223 19 874 20 421 China 6 704 6 839 1 046 1 233 179 169 7 570 7 903 India 2 851 3 001 - - 1 747 1 852 1 104 1 149 Indonesia 530 521 54 61 1 1 583 580 Iran, Islamic Republic of 251 250 105 121 3 3 354 368 Japan 504 494 758 771 2 2 1 258 1 259 Korea, Republic of 323 304 327 337 6 6 644 634 Malaysia 31 31 181 186 9 10 202 207 Pakistan 1 630 1 675 3 3 28 32 1 605 1 646 Philippines 297 298 108 105 3 3 401 400
AFRICA 5 932 5 980 714 707 85 88 6 561 6 598 Algeria 135 137 83 91 - - 218 228 Angola 102 104 135 135 - - 237 239 Egypt 880 896 319 310 2 2 1 197 1 204 South Africa 845 846 6 6 15 15 835 837
CENTRAL AMERICA 2 528 2 548 389 400 290 299 2 627 2 650 Mexico 1 808 1 820 247 256 118 126 1 937 1 950
SOUTH AMERICA 15 378 15 816 521 537 2 623 2 861 13 276 13 492 Argentina 2 673 2 709 - - 204 249 2 469 2 460 Brazil 9 596 9 920 50 48 1 767 1 904 7 879 8 064 Chile 202 207 228 243 6 6 424 445 Colombia 839 840 4 4 41 45 802 799 Uruguay 519 557 1 1 302 330 219 228 Venezuela 493 491 221 224 - - 714 715
NORTH AMERICA 12 906 12 384 1 212 1 245 1 528 1 499 12 631 12 118 Canada 1 149 1 154 281 283 305 307 1 139 1 133 United States of America 11 757 11 230 927 958 1 223 1 192 11 487 10 982
EUROPE 10 220 10 286 1 311 1 334 479 493 11 052 11 127 European Union 7 371 7 445 332 354 284 286 7 419 7 513 Russian Federation 1 663 1 640 857 862 8 8 2 512 2 494 Ukraine 419 439 6 6 15 17 410 428
OCEANIA 2 890 2 790 60 61 1 932 1 916 1 004 924 Australia 2 242 2 152 10 10 1 446 1 441 791 710 New Zealand 628 618 14 15 483 472 159 160
WORLD 67 679 68 033 8 335 8 655 9 053 9 368 66 980 67 288 Developing countries 38 593 39 490 4 876 5 118 5 103 5 452 38 364 39 154 Developed countries 29 086 28 542 3 458 3 536 3 951 3 917 28 616 28 134 LIFDCs 8 324 8 549 247 240 1 884 1 990 6 687 6 799 LDCs 3 410 3 461 194 200 3 4 3 600 3 657
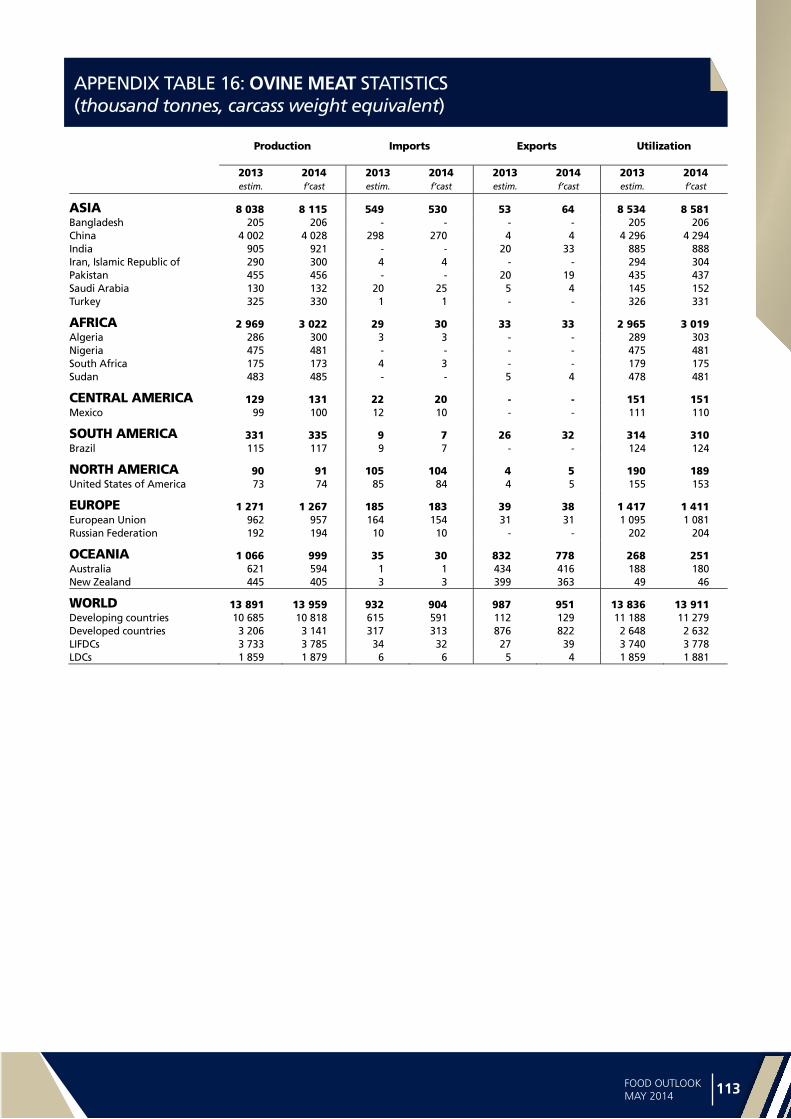
Statistica
l ap
pe
nd
ix
112 113FOOD OUTLOOKMAY 2014
APPENDIX TABLE 16: OVINE MEAT STATISTICS (thousand tonnes, carcass weight equivalent)
Production Imports Exports Utilization
2013 2014 2013 2014 2013 2014 2013 2014 estim. f’cast estim. f’cast estim. f’cast estim. f’cast
ASIA 8 038 8 115 549 530 53 64 8 534 8 581 Bangladesh 205 206 - - - - 205 206 China 4 002 4 028 298 270 4 4 4 296 4 294 India 905 921 - - 20 33 885 888 Iran, Islamic Republic of 290 300 4 4 - - 294 304 Pakistan 455 456 - - 20 19 435 437 Saudi Arabia 130 132 20 25 5 4 145 152 Turkey 325 330 1 1 - - 326 331
AFRICA 2 969 3 022 29 30 33 33 2 965 3 019 Algeria 286 300 3 3 - - 289 303 Nigeria 475 481 - - - - 475 481 South Africa 175 173 4 3 - - 179 175 Sudan 483 485 - - 5 4 478 481
CENTRAL AMERICA 129 131 22 20 - - 151 151 Mexico 99 100 12 10 - - 111 110
SOUTH AMERICA 331 335 9 7 26 32 314 310 Brazil 115 117 9 7 - - 124 124
NORTH AMERICA 90 91 105 104 4 5 190 189 United States of America 73 74 85 84 4 5 155 153
EUROPE 1 271 1 267 185 183 39 38 1 417 1 411 European Union 962 957 164 154 31 31 1 095 1 081 Russian Federation 192 194 10 10 - - 202 204
OCEANIA 1 066 999 35 30 832 778 268 251 Australia 621 594 1 1 434 416 188 180 New Zealand 445 405 3 3 399 363 49 46
WORLD 13 891 13 959 932 904 987 951 13 836 13 911 Developing countries 10 685 10 818 615 591 112 129 11 188 11 279 Developed countries 3 206 3 141 317 313 876 822 2 648 2 632 LIFDCs 3 733 3 785 34 32 27 39 3 740 3 778 LDCs 1 859 1 879 6 6 5 4 1 859 1 881

Sta
tist
ica
l a
pp
en
dix
114 115FOOD OUTLOOKMAY 2014
APPENDIX TABLE 17: PIGMEAT STATISTICS (thousand tonnes, carcass weight equivalent)
Production Imports Exports Utilization
2013 2014 2013 2014 2013 2014 2013 2014 estim. f’cast estim. f’cast estim. f’cast estim. f’cast
ASIA 65 573 66 579 3 387 3 275 550 550 68 400 69 356 China 54 777 55 668 1 352 1 251 441 466 55 688 56 453 of which Hong Kong, SAR 121 122 565 540 177 187 509 475 India 328 327 1 1 - 1 329 327 Indonesia 736 754 2 1 - - 738 754 Japan 1 305 1 309 1 243 1 240 2 2 2 546 2 546 Korea, D.P.R. 113 113 2 2 - - 115 115 Korea, Republic of 1 095 1 050 395 380 3 5 1 476 1 479 Malaysia 234 235 15 17 8 9 241 243 Philippines 1 728 1 780 122 123 3 3 1 848 1 900 Thailand 890 895 4 4 30 34 864 865 Viet Nam 3 226 3 284 35 35 20 21 3 241 3 298
AFRICA 1 217 1 238 296 305 12 13 1 501 1 530 Madagascar 56 57 - - - - 56 57 Nigeria 250 255 1 1 - - 251 256 South Africa 215 221 36 35 7 8 244 247 Uganda 114 112 - 1 - - 114 112
CENTRAL AMERICA 1 797 1 823 886 852 141 151 2 541 2 524 Cuba 164 162 45 47 - - 209 209 Mexico 1 270 1 290 682 650 121 131 1 831 1 810
SOUTH AMERICA 5 380 5 489 204 210 814 851 4 769 4 849 Argentina 356 367 18 21 1 1 373 386 Brazil 3 505 3 573 2 2 651 684 2 856 2 891 Chile 531 529 49 56 158 162 422 422 Colombia 240 244 60 56 - - 300 300 Venezuela 168 170 18 18 - - 186 188
NORTH AMERICA 12 522 12 341 727 729 3 377 3 322 9 860 9 757 Canada 1 992 2 008 246 230 1 205 1 210 1 033 1 030 United States of America 10 530 10 332 475 494 2 173 2 112 8 822 8 722
EUROPE 27 406 27 657 1 385 1 339 2 451 2 299 26 339 26 697 Belarus 463 476 96 96 119 148 440 424 European Union 22 682 22 818 17 17 2 288 2 100 20 411 20 735 Russian Federation 2 611 2 686 906 870 3 3 3 514 3 553 Serbia 252 252 20 20 9 11 263 262 Ukraine 784 810 195 185 8 9 970 986
OCEANIA 506 511 247 243 35 36 719 718 Australia 357 360 184 181 34 35 507 506 Papua New Guinea 78 80 8 8 - - 86 88
WORLD 114 281 115 515 7 060 6 884 7 373 7 215 113 947 115 246 Developing countries 72 247 73 400 3 464 3 325 1 507 1 554 74 195 75 223 Developed countries 42 033 42 116 3 596 3 558 5 866 5 661 39 752 40 022 LIFDCs 3 231 3 300 273 279 7 8 3 498 3 571 LDCs 1 467 1 493 210 218 - 1 1 677 1 710
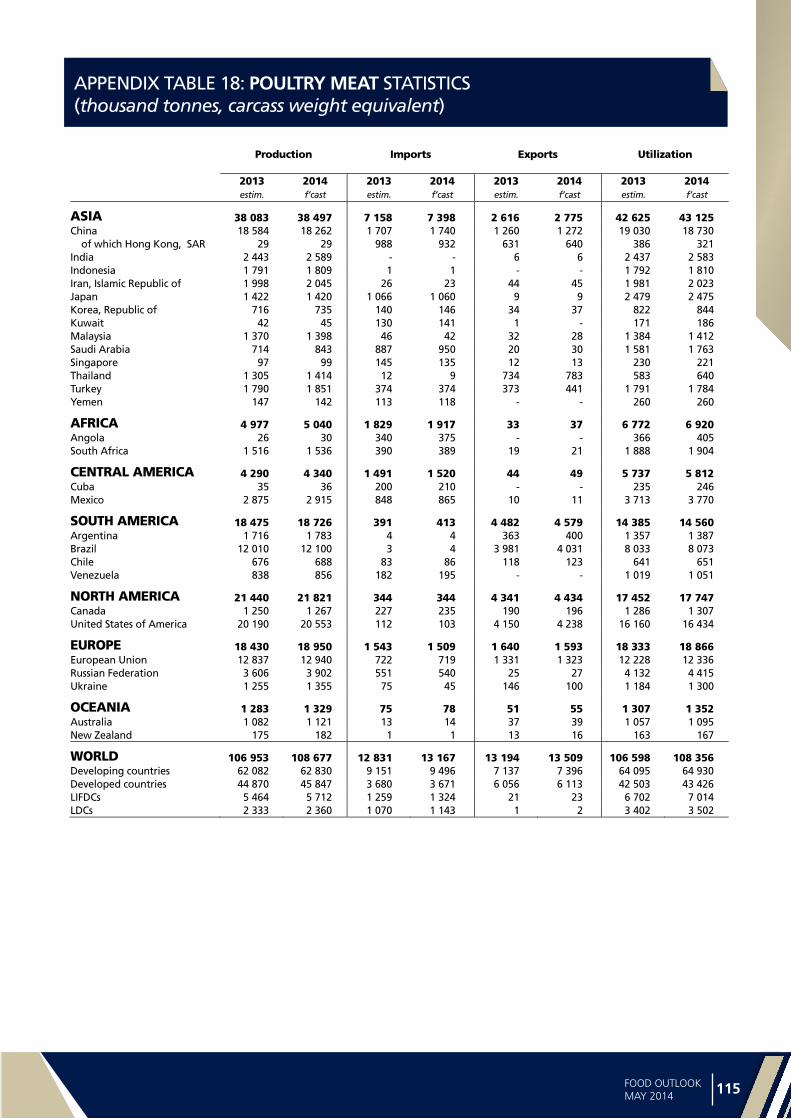
Statistica
l ap
pe
nd
ix
114 115FOOD OUTLOOKMAY 2014
APPENDIX TABLE 18: POULTRY MEAT STATISTICS (thousand tonnes, carcass weight equivalent)
Production Imports Exports Utilization
2013 2014 2013 2014 2013 2014 2013 2014 estim. f’cast estim. f’cast estim. f’cast estim. f’cast
ASIA 38 083 38 497 7 158 7 398 2 616 2 775 42 625 43 125 China 18 584 18 262 1 707 1 740 1 260 1 272 19 030 18 730 of which Hong Kong, SAR 29 29 988 932 631 640 386 321 India 2 443 2 589 - - 6 6 2 437 2 583 Indonesia 1 791 1 809 1 1 - - 1 792 1 810 Iran, Islamic Republic of 1 998 2 045 26 23 44 45 1 981 2 023 Japan 1 422 1 420 1 066 1 060 9 9 2 479 2 475 Korea, Republic of 716 735 140 146 34 37 822 844 Kuwait 42 45 130 141 1 - 171 186 Malaysia 1 370 1 398 46 42 32 28 1 384 1 412 Saudi Arabia 714 843 887 950 20 30 1 581 1 763 Singapore 97 99 145 135 12 13 230 221 Thailand 1 305 1 414 12 9 734 783 583 640 Turkey 1 790 1 851 374 374 373 441 1 791 1 784 Yemen 147 142 113 118 - - 260 260
AFRICA 4 977 5 040 1 829 1 917 33 37 6 772 6 920 Angola 26 30 340 375 - - 366 405 South Africa 1 516 1 536 390 389 19 21 1 888 1 904
CENTRAL AMERICA 4 290 4 340 1 491 1 520 44 49 5 737 5 812 Cuba 35 36 200 210 - - 235 246 Mexico 2 875 2 915 848 865 10 11 3 713 3 770
SOUTH AMERICA 18 475 18 726 391 413 4 482 4 579 14 385 14 560 Argentina 1 716 1 783 4 4 363 400 1 357 1 387 Brazil 12 010 12 100 3 4 3 981 4 031 8 033 8 073 Chile 676 688 83 86 118 123 641 651 Venezuela 838 856 182 195 - - 1 019 1 051
NORTH AMERICA 21 440 21 821 344 344 4 341 4 434 17 452 17 747 Canada 1 250 1 267 227 235 190 196 1 286 1 307 United States of America 20 190 20 553 112 103 4 150 4 238 16 160 16 434
EUROPE 18 430 18 950 1 543 1 509 1 640 1 593 18 333 18 866 European Union 12 837 12 940 722 719 1 331 1 323 12 228 12 336 Russian Federation 3 606 3 902 551 540 25 27 4 132 4 415 Ukraine 1 255 1 355 75 45 146 100 1 184 1 300
OCEANIA 1 283 1 329 75 78 51 55 1 307 1 352 Australia 1 082 1 121 13 14 37 39 1 057 1 095 New Zealand 175 182 1 1 13 16 163 167
WORLD 106 953 108 677 12 831 13 167 13 194 13 509 106 598 108 356 Developing countries 62 082 62 830 9 151 9 496 7 137 7 396 64 095 64 930 Developed countries 44 870 45 847 3 680 3 671 6 056 6 113 42 503 43 426 LIFDCs 5 464 5 712 1 259 1 324 21 23 6 702 7 014 LDCs 2 333 2 360 1 070 1 143 1 2 3 402 3 502

Sta
tist
ica
l a
pp
en
dix
116 117FOOD OUTLOOKMAY 2014
APPENDIX TABLE 19: MILK AND MILK PRODUCTS STATISTICS (thousand tonnes, milk equivalent)
Production Imports Exports
2010-2012 2013 2014 2010-2012 2013 2014 2010-2012 2013 2014
average average average
estim. f’cast estim. f’cast estim. f’cast
ASIA 276 764 292 405 301 467 32 147 37 472 38 233 5 727 6 621 6 740 China 41 879 40 316 41 121 8 151 12 337 13 320 236 203 204 India1 127 382 138 093 144 860 339 61 71 296 1 189 1 244 Indonesia 1 372 1 465 1 480 2 313 2 581 2 630 133 97 97 Iran, Islamic Republic of 7 287 7 500 7 700 457 608 624 349 419 409Japan 7 608 7 508 7 529 1 661 1 709 1 723 10 5 5Korea, Republic of 1 951 1 942 1 980 845 853 861 13 20 20Malaysia 77 87 86 1 547 1 803 1 816 337 479 533 Pakistan 36 669 38 560 38 750 409 541 515 33 42 48 Philippines 17 20 21 1 724 1 718 1 757 270 115 117 Saudi Arabia 1 949 2 100 2 200 2 282 2 477 2 265 1 486 1 153 1 157 Singapore - - - 1 650 1 702 1 639 605 669 671 Thailand 987 1 100 1 125 1 307 1 260 1 148 254 140 144 Turkey 15 335 17 430 17 500 164 189 207 315 505 487
AFRICA 45 108 47 021 47 293 9 498 8 331 8 596 1 288 1 199 1 104 Algeria 2 869 3 070 3 057 2 493 2 231 2 480 9 12 11Egypt 5 856 6 100 6 150 1 581 1 551 1 551 759 550 527Kenya 4 903 5 000 4 950 33 33 34 32 17 17South Africa 3 286 3 400 3 450 212 199 231 116 199 171 Sudan 7 494 7 550 7 580 314 258 235 - - -Tunisia 1 104 1 170 1 190 104 101 101 53 41 41
CENTRAL AMERICA 16 400 16 611 16 729 4 790 4 768 4 813 612 661 657 Costa Rica 978 1 050 1 100 44 54 52 157 158 159 Mexico 10 920 11 020 11 097 2 859 2 910 2 962 154 170 179
SOUTH AMERICA 65 038 67 004 68 129 3 182 3 545 3 379 4 152 4 593 4 575 Argentina 11 174 11 038 10 817 92 64 61 2 348 2 546 2 529 Brazil 31 855 33 362 34 397 971 931 917 120 91 100 Colombia 6 351 6 640 6 800 126 114 145 13 51 4 Uruguay 1 993 2 212 2 250 16 20 19 1 153 1 324 1 333 Venezuela 2 360 2 450 2 490 1 239 1 645 1 491 - - -
NORTH AMERICA 97 484 99 819 101 990 1 957 2 064 2 036 8 744 10 910 11 222 Canada 8 364 8 374 8 350 562 612 620 384 497 493 United States of America 89 118 91 444 93 639 1 380 1 438 1 401 8 358 10 412 10 727
EUROPE 215 153 215 828 217 935 6 500 7 334 7 648 21 205 22 858 23 105 Belarus 6 631 6 750 6 716 37 60 55 2 926 4 310 4 361 European Union 154 394 156 543 158 891 1 405 1 391 1 499 15 533 15 822 16 235 Russian Federation 31 769 30 661 30 220 4 192 5 005 5 158 125 83 83 Ukraine 11 293 11 642 11 851 143 230 275 913 858 624
OCEANIA 27 590 28 470 29 648 836 809 808 19 453 21 020 21 655 Australia2 9 201 9 200 9 034 583 558 559 3 682 3 282 3 277 New Zealand3 18 319 19 200 20 544 74 68 71 15 767 17 734 18 375
WORLD 743 535 767 158 783 192 58 911 64 322 65 513 61 181 67 862 69 058 Developing countries 372 149 390 563 400 483 47 259 51 713 52 541 11 611 12 829 12 862 Developed countries 371 386 376 596 382 709 11 651 12 610 12 972 49 570 55 032 56 196 LIFDCs 174 693 187 878 195 316 7 712 6 559 6 684 1 174 1 979 1 977 LDCs 31 978 32 919 33 215 3 142 3 084 3 065 144 176 177
1 Dairy years starting April of the year stated (production only). 2 Dairy years ending June of the year stated (production only).
3 Dairy years ending May of the year stated (production only). Note: Trade figures refer to the milk equivalent trade in the following products: butter (6.60), cheese (4.40), milk powder (7.60), skim condensed/evaporated milk (1.90), whole condensed/evaporated milk (2.10), yoghurt (1.0), cream (3.60), casein (7.40), skim milk (0.70), liquid milk (1.0), whey dry (7.6). The conversion factors cited refer to the solids content method. Refer to IDF Bulletin No. 390 (March 2004).

Statistica
l ap
pe
nd
ix
116 117FOOD OUTLOOKMAY 2014
APPENDIX TABLE 20: FISH AND FISHERY PRODUCTS STATISTICS1
,> Capture fisheries production
Aquaculture fisheries production Exports Imports
2011 2012 2011 2012 2011 2012 2013 2011 2012 2013 estim.. estim..
Million tonnes (live weight equivalent) USD billion USD billion
ASIA 48.9 50.2 54.8 58.9 50.1 51.1 53.2 42.5 43.9 42.2 China2 16.8 17.2 38.9 41.5 19.8 20.9 22.3 12.2 12.2 12.9 of which: Hong Kong SAR 0.2 0.2 - - 0.6 0.7 1.0 3.5 3.7 3.8 Taiwan Prov. 0.9 0.9 0.3 0.3 2.3 2.0 1.8 1.0 1.0 1.0 India 4.3 4.9 3.7 4.2 3.5 3.4 4.6 0.1 0.1 0.1 Indonesia 5.7 5.8 2.7 3.1 3.2 3.6 3.8 0.4 0.4 0.4 Japan 3.8 3.6 0.6 0.6 1.9 1.8 2.0 17.3 18.0 15.4 Korea, Rep. of 1.7 1.7 0.5 0.5 2.0 2.0 1.8 3.9 3.7 3.6 Philippines 2.4 2.3 0.8 0.8 0.6 0.8 1.2 0.2 0.2 0.3 Thailand 1.8 1.8 1.2 1.2 8.1 8.1 7.0 2.7 3.1 3.2 Viet Nam 2.5 2.6 2.8 3.1 6.2 6.3 6.3 0.7 0.8 0.8
AFRICA 7.7 8.2 1.4 1.5 5.2 5.4 5.2 5.4 5.3 7.3 Ghana 0.3 0.4 - - 0.1 - - 0.3 0.2 0.3 Morocco 1.0 1.2 - - 1.4 1.6 1.8 0.1 0.1 0.2 Namibia 0.4 0.5 - - 0.8 0.8 0.7 - - 0.1 Nigeria 0.6 0.7 0.2 0.3 0.1 0.3 0.2 2.0 1.5 3.0 Senegal 0.4 0.5 - - 0.3 0.3 0.3 - - - South Africa 0.5 0.7 - - 0.6 0.6 0.5 0.3 0.4 0.5
CENTRAL AMERICA 2.4 2.2 0.3 0.3 2.1 2.0 2.3 1.4 1.7 1.9 Mexico 1.6 1.6 0.1 0.1 1.1 0.9 0.9 0.6 0.6 0.8 Panama 0.2 0.1 - - 0.1 0.1 0.2 - 0.1 0.1
SOUTH AMERICA 14.0 10.1 2.1 2.3 12.6 12.8 13.7 2.8 2.8 3.4 Argentina 0.8 0.7 - - 1.5 1.3 1.5 0.2 0.2 0.2 Brazil 0.8 0.8 0.6 0.7 0.2 0.2 0.2 1.3 1.2 1.5 Chile 3.1 2.6 1.0 1.1 4.5 4.3 5.0 0.4 0.4 0.4 Ecuador 0.5 0.5 0.3 0.3 2.5 2.8 3.6 0.3 0.2 0.1 Peru 8.2 4.8 0.1 0.1 3.1 3.3 2.7 0.1 0.1 0.2
NORTH AMERICA 6.2 6.2 0.6 0.6 10.4 10.4 10.7 20.1 20.3 21.8 Canada 0.9 0.8 0.2 0.2 4.2 4.2 4.4 2.6 2.7 2.8 United States of America 5.2 5.1 0.4 0.4 5.8 5.8 6.0 17.5 17.6 19.0
EUROPE 13.3 13.1 2.7 2.9 46.4 44.5 48.3 55.9 53.6 57.6 European Union2 5.1 4.6 1.3 1.3 30.1 29.0 31.1 49.8 47.2 50.7 of which Extra -EU 5.3 5.7 6.2 26.7 24.9 26.4 Iceland 1.1 1.4 - - 2.2 2.2 2.3 0.1 0.1 0.1 Norway 2.3 2.2 1.1 1.3 9.5 8.9 10.4 1.3 1.4 1.3 Russian Federation 4.3 4.3 0.1 0.1 3.3 3.2 3.4 2.7 2.7 3.1
OCEANIA 1.2 1.3 0.2 0.2 2.9 3.1 2.8 1.8 2.0 2.1 Australia 0.2 0.2 0.1 0.1 1.0 1.0 0.9 1.5 1.6 1.6 New Zealand 0.4 0.4 0.1 0.1 1.2 1.2 1.2 0.1 0.2 0.2
WORLD3 93.7 91.3 62.0 66.6 129.8 129.2 136.0 129.9 129.5 136.2 Excl. Intra-EU 104.9 106.0 111.1 106.8 107.2 112.0 Developing countries 69.3 67.2 58.0 62.3 68.6 70.0 72.7 34.1 35.0 38.5 Developed countries 24.4 24.1 4.0 4.3 61.1 59.2 63.3 95.9 94.4 97.7 LIFDCs 14.0 14.8 6.5 7.3 7.2 7.2 8.6 4.2 3.6 5.4 LDCs 9.4 9.8 2.7 3.0 2.7 2.4 2.1 0.8 0.9 1.0
1 Production and trade data exclude whales, seals, other aquatic mammals and aquatic plants. Trade data include fish meal and fish oil. 2 Including intra-trade. Cyprus is included in the European Union as well as in Asia. Starting with 2013 data, EU includes Croatia. 3 For capture fisheries production, the aggregate includes also 64 081 tonnes in 2011 and 37 360 in 2012 of not identified countries, data not included in any other aggregates.
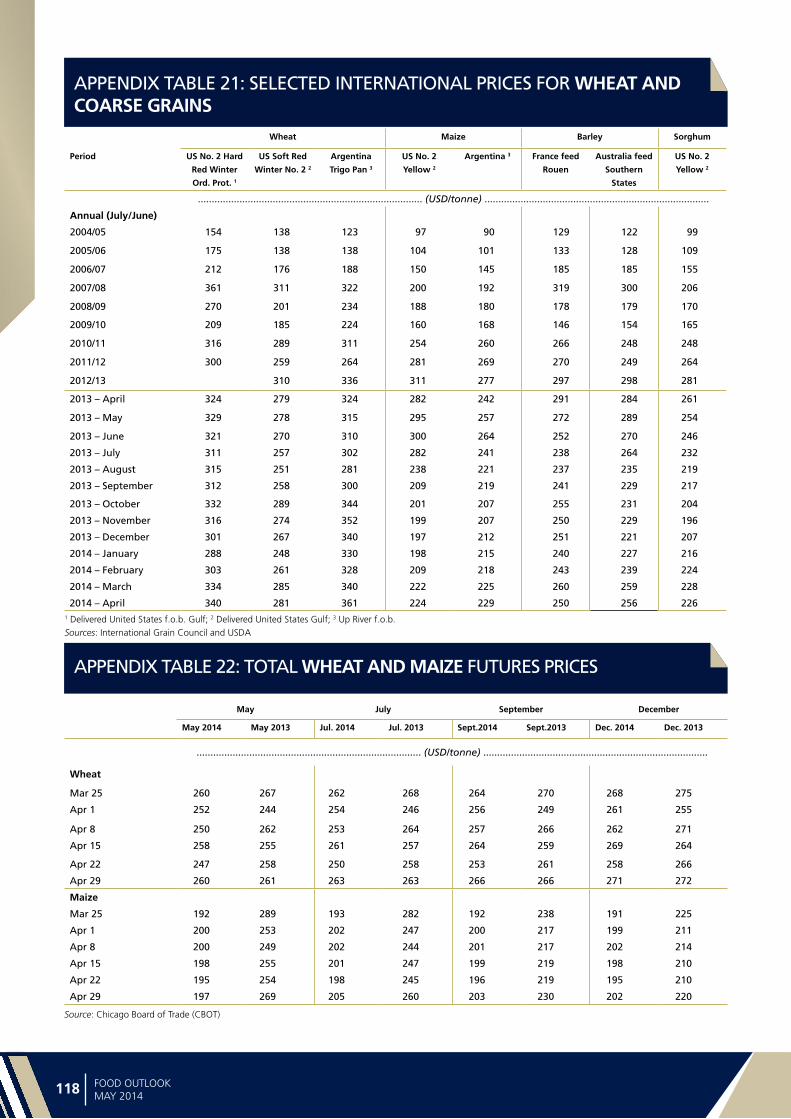
Sta
tist
ica
l a
pp
en
dix
118 119FOOD OUTLOOKMAY 2014
APPENDIX TABLE 21: SELECTED INTERNATIONAL PRICES FOR WHEAT AND COARSE GRAINS
APPENDIX TABLE 22: TOTAL WHEAT AND MAIZE FUTURES PRICES
Wheat Maize Barley Sorghum
Period US No. 2 Hard
Red Winter
Ord. Prot. 1
US Soft Red
Winter No. 2 2
Argentina
Trigo Pan 3
US No. 2
Yellow 2
Argentina 3 France feed
Rouen
Australia feed
Southern
States
US No. 2
Yellow 2
................................................................................. (USD/tonne) .................................................................................
Annual (July/June)
2004/05 154 138 123 97 90 129 122 99
2005/06 175 138 138 104 101 133 128 109
2006/07 212 176 188 150 145 185 185 155
2007/08 361 311 322 200 192 319 300 206
2008/09 270 201 234 188 180 178 179 170
2009/10 209 185 224 160 168 146 154 165
2010/11 316 289 311 254 260 266 248 248
2011/12 300 259 264 281 269 270 249 264
2012/13 310 336 311 277 297 298 281
2013 – April 324 279 324 282 242 291 284 261
2013 – May 329 278 315 295 257 272 289 254
2013 – June 321 270 310 300 264 252 270 246
2013 – July 311 257 302 282 241 238 264 232
2013 – August 315 251 281 238 221 237 235 219
2013 – September 312 258 300 209 219 241 229 217
2013 – October 332 289 344 201 207 255 231 204
2013 – November 316 274 352 199 207 250 229 196
2013 – December 301 267 340 197 212 251 221 207
2014 – January 288 248 330 198 215 240 227 216
2014 – February 303 261 328 209 218 243 239 224
2014 – March 334 285 340 222 225 260 259 228
2014 – April 340 281 361 224 229 250 256 2261 Delivered United States f.o.b. Gulf; 2 Delivered United States Gulf; 3 Up River f.o.b. Sources: International Grain Council and USDA
May July September December
May 2014 May 2013 Jul. 2014 Jul. 2013 Sept.2014 Sept.2013 Dec. 2014 Dec. 2013
................................................................................. (USD/tonne) .................................................................................
Wheat
Mar 25 260 267 262 268 264 270 268 275
Apr 1 252 244 254 246 256 249 261 255
Apr 8 250 262 253 264 257 266 262 271
Apr 15 258 255 261 257 264 259 269 264
Apr 22 247 258 250 258 253 261 258 266
Apr 29 260 261 263 263 266 266 271 272
Maize
Mar 25 192 289 193 282 192 238 191 225
Apr 1 200 253 202 247 200 217 199 211
Apr 8 200 249 202 244 201 217 202 214
Apr 15 198 255 201 247 199 219 198 210
Apr 22 195 254 198 245 196 219 195 210
Apr 29 197 269 205 260 203 230 202 220
Source: Chicago Board of Trade (CBOT)

Statistica
l ap
pe
nd
ix
118 119FOOD OUTLOOKMAY 2014
APPENDIX TABLE 23: SELECTED INTERNATIONAL PRICES FOR RICE AND PRICE INDICES
International prices FAO indices
Indica
Period Thai 100% B1
Thai broken 2
US long grain 3
Pakisan Basmati4
Total Higher quality
Lower quality
Japonica Aromatic
Annual (Jan/Dec) ..........................(USD per tonne) .......................... ............................. (2002-2004=100) .............................
2008 695 506 782 1077 282 291 286 287 252
2009 587 329 545 937 253 224 196 317 231
2010 518 386 510 881 227 206 212 252 229
2011 565 464 577 1060 242 232 250 258 220
2012 588 540 567 1137 231 225 241 235 222
2013 534 483 628 1372 233 219 226 230 268
Monthly
2013 – April 586 551 649 1 362 237 226 238 225 274
2013 – May 574 539 652 1 375 238 224 237 231 273
2013 – June 550 518 642 1 415 237 222 235 229 274
2013 – July 542 509 639 1 405 237 222 235 233 273
2013 – August 505 472 618 1 398 238 215 223 248 269
2013 – September 460 406 622 1 324 226 206 206 235 263
2013 – October 457 405 615 1 310 224 207 209 227 259
2013 – November 451 376 608 1 385 224 212 206 223 265
2013 – December 459 347 604 1 411 227 214 206 226 271
2014 – January 456 309 605 1 396 227 212 198 236 263
2014 – February 466 311 596 1 348 237 212 197 267 263
2014 – March 430 312 594 1 362 238 207 199 270 264
2014 – April 408 307 594 1 350 236 204 198 268 264
1 White rice, 100% second grade, f.o.b. Bangkok, indicative traded prices.2 A1 super, f.o.b. Bangkok, indicative traded prices.3 US No.2, 4% brokens f.o.b.4 Up to May 2011: Basmati ordinary, f.o.b. Karachi; from June 2011 onwards: Super Kernel White Basmati Rice 2%.Note: The FAO Rice Price Index is based on 16 rice export quotations. ‘Quality’ is defined by the percentage of broken kernels, with higher (lower) quality referring to rice with less (equal to or more) than 20 percent brokens. The sub-index for Aromatic Rice follows movements in prices of Basmati and Fragrant rice.Sources: FAO for indices. Rice prices: Livericeindex.com, Thai Department of Foreign Trade (DFT) and other public sources.

Sta
tist
ica
l a
pp
en
dix
120 121FOOD OUTLOOKMAY 2014
APPENDIX TABLE 24: SELECTED INTERNATIONAL PRICES FOR OILCROP PRODUCTS
Period Soybeans 2 Soybean oil 3 Palm oil 4 Soybean
cake 5
Rapeseed
meal 6
Oilseeds Vegetable oils Oilcakes/
meals
Annual (Oct/Sept) .............................................. (USD per tonne) 1 .............................................. ................... (2002-2004=100) ................
2004/05 275 545 419 212 130 104 103 101
2005/06 259 572 451 202 130 100 107 96
2006/07 335 772 684 264 184 129 150 128
2007/08 549 1325 1050 445 296 216 246 214
2008/09 422 826 627 385 196 157 146 179
2009/10 429 924 806 388 220 162 177 183
2010/11 549 1308 1147 418 279 214 259 200
2011/12 562 1235 1051 461 295 214 232 219
2012/13 563 1099 835 539 345 213 193 255
Monthly
2012 - October 617 1183 844 555 359 234 202 261
2012 - November 595 1148 816 539 378 226 196 255
2012 - December 603 1153 772 553 396 229 191 261
2013 - January 591 1192 838 512 367 226 200 245
2013 - February 597 1164 862 513 381 228 202 246
2013 - March 588 1117 853 503 367 224 197 241
2013 - April 559 1099 841 521 300 214 194 247
2013 - May 498 1077 849 527 404 192 194 254
2013 - June 523 1036 858 551 321 198 193 261
2013 - July 514 997 838 568 304 191 187 267
2013 - August 514 995 824 564 277 190 182 263
2013 - September 554 1028 823 557 291 204 184 261
2013 - October 544 989 866 555 318 202 188 262
2013 - November 556 992 921 541 316 206 199 257
2013 - December 568 979 907 548 336 210 196 260
2014 - January 566 935 871 539 337 208 189 256
2014 - February 594 991 911 571 361 219 198 271
2014 - March 501 1 01 959 582 396 193 205 278
2014 - April 516 1 005 911 563 375 198 199 269
1 Spot prices for nearest forward shipment 2 Soybeans: US, No.2 yellow, c.i.f. Rotterdam.3 Soybean oil: Dutch, fob ex-mill.4 Palm oil: Crude, c.i.f. Northwest Europe.5 Soybean cake: Pellets, 44/45 percent, Argentina, c.i.f. Rotterdam.6 Rapeseed meal: 34 percent, Hamburg, f.o.b. ex-mill. Notes:- The sudden drop in the FAO price index for oilseeds in March 2014 is due to a structural break in the underlying price series for soybeans (US no.2 yellow, c.i.f.
Rotterdam), the component with the highest weight. A look at alternative reference prices for soybeans reveals that, during March and April 2014, international soybean values have actually appreciated further rather than falling. For a detailed explanation of the anomalous trend in the soybean reference price, please refer to issue no. 58 of the Oilcrops Monthly Price and Policy Update (MPPU), which can be downloaded through the following link.
http://www.fao.org/fileadmin/templates/est/COMM_MARKETS_MONITORING/Oilcrops/Documents/MPPU_April_14.pdf - The indices are based on the international prices of five selected seeds, ten selected oils and five selected cakes and meals.
Sources: FAO and Oil World.

Statistica
l ap
pe
nd
ix
120 121FOOD OUTLOOKMAY 2014
APPENDIX TABLE 25: SELECTED INTERNATIONAL PRICES FOR SUGAR AND SUGAR PRICE INDEX
I.S.A. average of daily prices ISO (Euronext, Liffe) white sugar price index
FAO sugar price index
Raw Sugar White Sugar
Annual (Jan/Dec) ................. (US cents/lb) ................. ...(2002/04 = 100) ...
2005 9.9 13.2 140.3
2006 14.8 19.0 209.6
2007 10.1 14.0 143.0
2008 12.8 16.1 181.6
2009 18.1 22.2 257.3
2010 21.3 27.2 302.0
2011 26.0 31.1 368.9
2012 21.5 26.3 305.7
2013 17.8 22.4 251.2
Monthly
October, 2012 20.3 25.3 288.2
November, 2012 19.3 23.7 274.5
December, 2012 19.3 23.5 274.0
January, 2013 18.9 22.9 267.8
February, 2013 18.3 22.6 259.2
March, 2013 18.5 23.5 262.0
April, 2013 17.8 22.7 252.6
May, 2013 17.6 21.9 250.1
June, 2013 17.1 21.9 242.6
July, 2013 16.8 21.9 239.0
August, 2013 17.0 22.0 241.7
September, 2013 17.4 22.0 246.5
October, 2013 18.7 22.7 264.8
November, 2013 17.7 21.5 250.6
December, 2013 16.6 20.2 234.9
January, 2014 15.6 19.2 221.7
February, 2014 16.6 20.6 235.4
March, 2014 17.9 21.4 254.0
April, 2014 17.6 21.0 249.9
1 International Sugar Agreement (ISA) prices: simple average of the closing quotes for the first three future positions of the New York Intercontinental Exchange (NYCE) Trade Sugar Contract no. 11.2 ISA white sugar prices: white sugar price is a simple average of the closing quotes for the first two future positions of the White Sugar Contract in UK Euronext.liffe.
Sources: International Sugar Organization (ISO). FAO for the sugar index.
1 International Sugar Agreement (ISA) prices: simple average of the closing quotes for the first three future positions of the New York Intercontinental Exchange (NYCE) Trade Sugar Contract no. 11.
2 ISA white sugar prices: white sugar price is a simple average of the closing quotes for the first two future positions of the White Sugar Contract in UK Euronext.liffe.
Sources: International Sugar Organization (ISO). FAO for the sugar index.
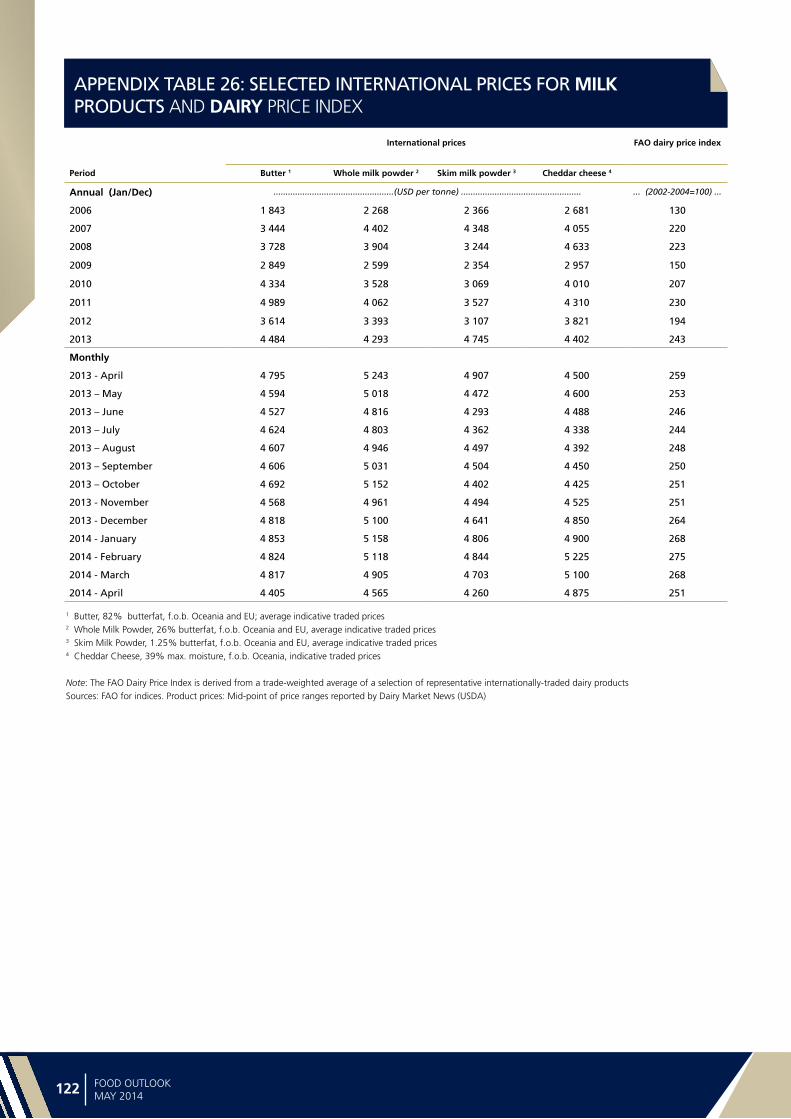
Sta
tist
ica
l a
pp
en
dix
122 123FOOD OUTLOOKMAY 2014
APPENDIX TABLE 26: SELECTED INTERNATIONAL PRICES FOR MILK PRODUCTS AND DAIRY PRICE INDEX
International prices FAO dairy price index
Period Butter 1 Whole milk powder 2 Skim milk powder 3 Cheddar cheese 4
Annual (Jan/Dec) ..................................................(USD per tonne) .................................................. ... (2002-2004=100) ...
2006 1 843 2 268 2 366 2 681 130
2007 3 444 4 402 4 348 4 055 220
2008 3 728 3 904 3 244 4 633 223
2009 2 849 2 599 2 354 2 957 150
2010 4 334 3 528 3 069 4 010 207
2011 4 989 4 062 3 527 4 310 230
2012 3 614 3 393 3 107 3 821 194
2013 4 484 4 293 4 745 4 402 243
Monthly
2013 - April 4 795 5 243 4 907 4 500 259
2013 – May 4 594 5 018 4 472 4 600 253
2013 – June 4 527 4 816 4 293 4 488 246
2013 – July 4 624 4 803 4 362 4 338 244
2013 – August 4 607 4 946 4 497 4 392 248
2013 – September 4 606 5 031 4 504 4 450 250
2013 – October 4 692 5 152 4 402 4 425 251
2013 - November 4 568 4 961 4 494 4 525 251
2013 - December 4 818 5 100 4 641 4 850 264
2014 - January 4 853 5 158 4 806 4 900 268
2014 - February 4 824 5 118 4 844 5 225 275
2014 - March 4 817 4 905 4 703 5 100 268
2014 - April 4 405 4 565 4 260 4 875 251
1 Butter, 82% butterfat, f.o.b. Oceania and EU; average indicative traded prices2 Whole Milk Powder, 26% butterfat, f.o.b. Oceania and EU, average indicative traded prices3 Skim Milk Powder, 1.25% butterfat, f.o.b. Oceania and EU, average indicative traded prices4 Cheddar Cheese, 39% max. moisture, f.o.b. Oceania, indicative traded prices
Note: The FAO Dairy Price Index is derived from a trade-weighted average of a selection of representative internationally-traded dairy productsSources: FAO for indices. Product prices: Mid-point of price ranges reported by Dairy Market News (USDA)

Statistica
l ap
pe
nd
ix
122 123FOOD OUTLOOKMAY 2014
APPENDIX TABLE 27: SELECTED INTERNATIONAL MEAT PRICES
Bovine meat prices Ovine meat
price
Pig meat prices Poultry meat prices
Period Australia United
States
Brazil New
Zealand
United
States
Brazil Germany United
States
Brazil
Annual (Jan/Dec) ......................................................................................... (USD per tonne) .........................................................................................
2006 2 522 3 803 2 219 2 392 1 986 2 134 1 935 734 1180
2007 2 544 4 023 2 367 2 498 2 117 2 200 1 907 935 1443
2008 3 024 4 325 3 785 2 975 2 270 3 000 2 364 997 1896
2009 2 562 3 897 3 118 3 495 2 202 2 223 2 035 989 1552
2010 3 272 4 378 3 919 3 662 2 454 2 747 1 913 1032 1781
2011 3 944 4 516 4 816 5 370 2 648 3 023 2 169 1 147 2083
2012 4 176 4 913 4 492 4 754 2 676 2 784 2 233 1 228 1931
2013 4 009 5 535 4 326 4 130 2 717 2 872 2 311 1 229 2014
Monthly
2013 – April 4 112 5 390 4 358 3 685 2 670 3 000 2 233 1 270 2 245
2013– May 3 804 5 313 4 179 3 684 2 593 2 882 2 124 1 237 2 189
2013 – June 3 692 5 453 4 222 3 815 2 628 2 744 2 258 1 247 2 050
2013 – July 3 724 5 299 4 230 3 973 2 664 2 725 2 326 1 254 1 966
2013 – August 3 828 5 467 4 128 4 146 2 717 2 756 2 536 1 250 1 892
2013 - September 3 909 5 861 4 304 4 502 2 766 2 891 2 483 1 247 1 870
2013 - October 4 002 5 960 4 371 4 739 2 771 2 952 2 405 1 240 1 875
2013 - November 4 099 5 747 4 437 4 846 2 806 2 888 2 273 1 187 1 906
2013 - December 4 151 5 924 4 504 4 640 2 748 2 924 2 333 1 143 1 859
2014 – January 4 182 5 998 4 184 4 457 2 856 2 794 2 175 1 150 1 841
2014 - February 4 226 6 191 4 239 4 527 2 712 2 795 2 111 1 144 1 831
2014 - March 4 446 6 200 4 255 4 569 2 798 2 893 2 178 1 150 1 824
2014 - April 4 315 6 158 4 300 4 529 2 850 2 950 2 266 1 152 1 822
Bovine meat prices:Australia: Cow 90CL export prices to the USA (FAS)USA: Frozen beef, export unit valueBrazil: Frozen beef, export unit value
Ovine meat pricesNew Zealand: Lamb 17.5kg cwt, export price
Pig meat prices:USA: Frozen pigmeat, export unit valueBrazil: Frozen pigmeat, export unit valueGermany: Monthly market price for pig carcase grade E
Poultry meat prices:USA: Broiler cuts, export unit valueBrazil: Export unit value for chicken (f.o.b.)

Sta
tist
ica
l a
pp
en
dix
124 125FOOD OUTLOOKMAY 2014
APPENDIX TABLE 28: SELECTED INTERNATIONAL MEAT PRICES AND FAO MEAT PRICE INDICES
FAO indices
Period Total meat Bovine meat Ovine meat Pig meat Poultry meat
Annual (Jan/Dec) .............................................................................. (2002-2004=100) .........................................................................
2006 121 121 103 123 122
2007 131 126 108 125 151
2008 161 158 128 152 184
2009 141 135 151 131 162
2010 158 165 158 138 179
2011 183 191 232 153 206
2012 182 195 205 153 201
2013 184 197 178 157 206
Monthly
2013 – April 187 198 159 155 224
2013– May 180 189 159 149 218
2013 – June 180 189 165 152 210
2013 – July 179 188 172 155 205
2013 – August 182 190 179 163 200
2013 - September 186 199 194 164 198
2013 - October 187 203 205 162 198
2013 - November 186 203 209 157 197
2013 - December 186 207 200 159 191
2014 – January 182 204 192 154 190
2014 - February 182 208 195 149 189
2014 - March 185 212 197 154 189
2014 - April 186 210 196 159 189
The FAO Meat Price Indices consist of 2 poultry meat product quotations (the average weighted by assumed fixed trade weights), 3 bovine meat product quotations (average weighted by assumed fixed trade weights), 3 pig meat product quotations (average weighted by assumed fixed trade weights), 1 ovine meat product quotation (average weighted by assumed fixed trade weights): the four meat group average prices are weighted by world average export trade shares for 2002/2004.Prices for the two most recent months may be estimates and subject to revision.

Statistica
l ap
pe
nd
ix
124 125FOOD OUTLOOKMAY 2014
APPENDIX TABLE 29: FISH PRICE INDICES
APPENDIX TABLE 30: SELECTED INTERNATIONAL COMMODITY PRICES
Period Total Aquaculture Capture White fish Salmon Shrimp Pelagic
e/tuna
Tuna Other fish
Annual (Jan/Dec) .................................................................. (2002-2004=100) ..................................................................
2006 102 99 105 110 109 98 112 102 93
2007 109 100 116 119 110 101 118 116 98
2008 119 104 130 130 114 108 134 139 104
2009 109 103 114 113 120 96 126 126 98
2010 119 119 119 121 141 107 130 125 110
2011 154 149 157 195 124 173 175 166 151
2012 144 124 157 146 107 207 195 176 145
2013 148 141 151 134 157 126 215 190 175
Monthly
2012 - December 148 123 164 143 150 110 192 203 184
2013 - January 143 124 155 141 153 100 216 191 183
2013 - February 138 120 147 130 154 96 201 190 167
2013 - March 145 136 148 130 163 112 203 192 165
2013 - April 147 136 151 130 156 116 222 185 184
2013 - May 139 137 141 129 158 112 184 188 176
2013 - June 143 141 144 134 157 117 202 186 176
2013 - July 142 140 144 133 159 118 194 182 173
2013 - August 148 141 151 132 154 127 223 196 183
2013 - September 154 143 161 137 144 139 236 208 175
2013 - October 160 156 160 136 156 155 240 193 170
2013 - November 158 159 154 135 159 158 226 183 164
2013 - December 164 164 159 138 176 159 234 186 179
Source= Norwegian Seafood Council.Note: The FAO Fish Price Index is based on nominal import values expressed in CIF in the three major import markets; Japan, USA and EU. Separate indexes exist for products from aquaculture and from capture fisheries. Additional sub-indexes exist for the major commodity groups based on species.
Currency and unit Effective date Latest quotation One month ago One year ago Average
2009-2013
Sugar (ISA daily price) US cents per lb 28-04-14 17.58 18.30 17.59 20.93
Coffee (ICO daily price) US cents per lb 28-04-14 173.48 160.53 129.55 149.83
Cocoa (ICCO daily price) US cents per lb 28-04-14 137.11 138.91 104.08 125.49
Tea (FAO Tea Composite Price) USD per kg 31-03-14 2.69 2.73 2.98 2.80
Cotton (COTLOOK A index) US cents per lb 31-03-14 96.95 94.05 94.45 99.37
Jute “BTD” USD per tonne 31-03-14 575.00 600.00 600.00 637.40
(Fob Bangladesh Port)

126 127
MA
RKET
IND
ICAT
ORS
MAR
KET
INDI
CATO
RS
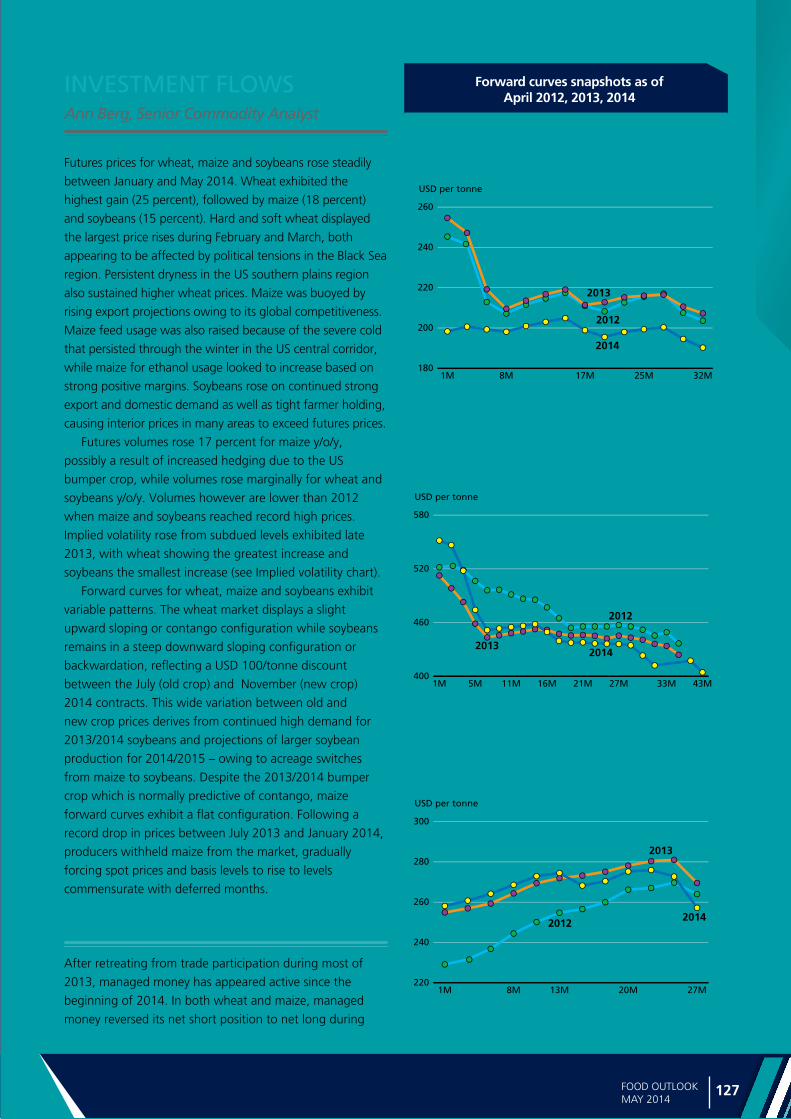
Ma
rke
t ind
icato
rs
126 127FOOD OUTLOOKMAY 2014
INVESTMENT FLOWS Ann Berg, Senior Commodity Analyst
Futures prices for wheat, maize and soybeans rose steadily
between January and May 2014. Wheat exhibited the
highest gain (25 percent), followed by maize (18 percent)
and soybeans (15 percent). Hard and soft wheat displayed
the largest price rises during February and March, both
appearing to be affected by political tensions in the Black Sea
region. Persistent dryness in the US southern plains region
also sustained higher wheat prices. Maize was buoyed by
rising export projections owing to its global competitiveness.
Maize feed usage was also raised because of the severe cold
that persisted through the winter in the US central corridor,
while maize for ethanol usage looked to increase based on
strong positive margins. Soybeans rose on continued strong
export and domestic demand as well as tight farmer holding,
causing interior prices in many areas to exceed futures prices.
Futures volumes rose 17 percent for maize y/o/y,
possibly a result of increased hedging due to the US
bumper crop, while volumes rose marginally for wheat and
soybeans y/o/y. Volumes however are lower than 2012
when maize and soybeans reached record high prices.
Implied volatility rose from subdued levels exhibited late
2013, with wheat showing the greatest increase and
soybeans the smallest increase (see Implied volatility chart).
Forward curves for wheat, maize and soybeans exhibit
variable patterns. The wheat market displays a slight
upward sloping or contango configuration while soybeans
remains in a steep downward sloping configuration or
backwardation, reflecting a USD 100/tonne discount
between the July (old crop) and November (new crop)
2014 contracts. This wide variation between old and
new crop prices derives from continued high demand for
2013/2014 soybeans and projections of larger soybean
production for 2014/2015 – owing to acreage switches
from maize to soybeans. Despite the 2013/2014 bumper
crop which is normally predictive of contango, maize
forward curves exhibit a flat configuration. Following a
record drop in prices between July 2013 and January 2014,
producers withheld maize from the market, gradually
forcing spot prices and basis levels to rise to levels
commensurate with deferred months.
INVESTMENT FLOWS
After retreating from trade participation during most of
2013, managed money has appeared active since the
beginning of 2014. In both wheat and maize, managed
money reversed its net short position to net long during
Forward curves snapshots as of April 2012, 2013, 2014
180
200
220
240
260
32M25M17M8M1M
2014
2012
2013
USD per tonne
Maize
Soybeans
Wheat
400
460
520
580
43M33M27M21M16M11M5M1M
2013
2012
2014
USD per tonne
220
240
260
280
300
27M20M13M8M1M
2013
20142012
USD per tonne
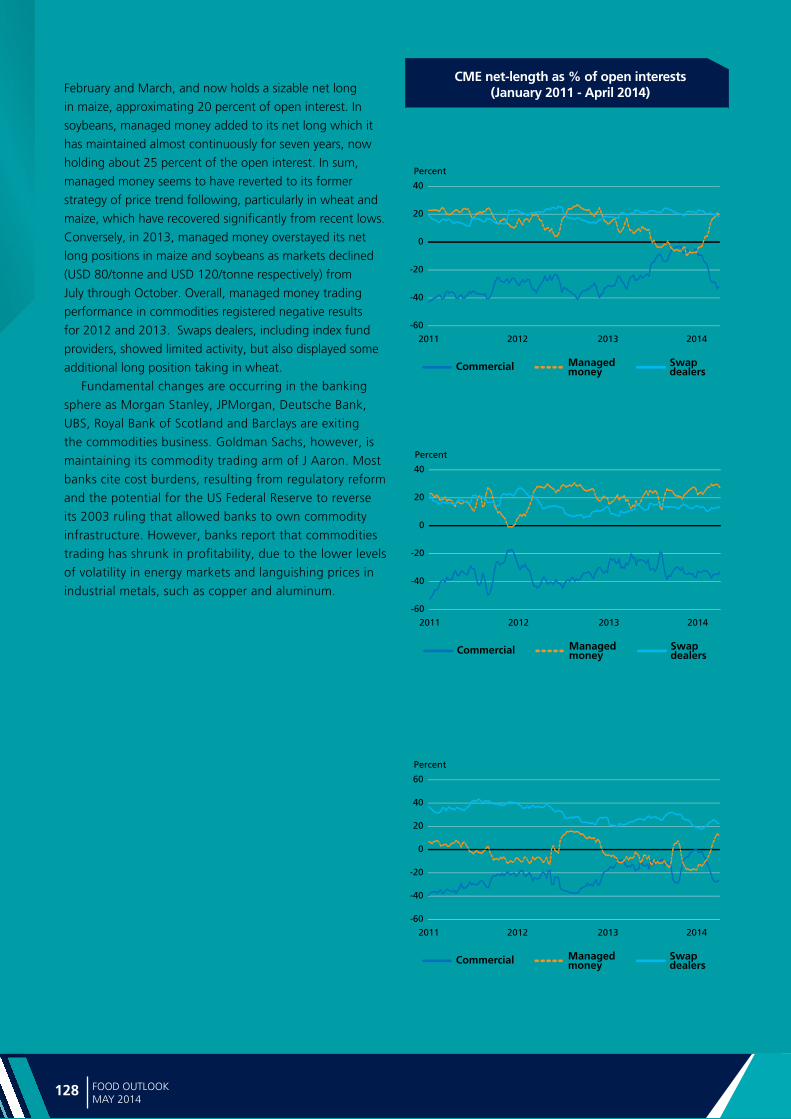
Ma
rke
t in
dic
ato
rs
128 129FOOD OUTLOOKMAY 2014
February and March, and now holds a sizable net long
in maize, approximating 20 percent of open interest. In
soybeans, managed money added to its net long which it
has maintained almost continuously for seven years, now
holding about 25 percent of the open interest. In sum,
managed money seems to have reverted to its former
strategy of price trend following, particularly in wheat and
maize, which have recovered significantly from recent lows.
Conversely, in 2013, managed money overstayed its net
long positions in maize and soybeans as markets declined
(USD 80/tonne and USD 120/tonne respectively) from
July through October. Overall, managed money trading
performance in commodities registered negative results
for 2012 and 2013. Swaps dealers, including index fund
providers, showed limited activity, but also displayed some
additional long position taking in wheat.
Fundamental changes are occurring in the banking
sphere as Morgan Stanley, JPMorgan, Deutsche Bank,
UBS, Royal Bank of Scotland and Barclays are exiting
the commodities business. Goldman Sachs, however, is
maintaining its commodity trading arm of J Aaron. Most
banks cite cost burdens, resulting from regulatory reform
and the potential for the US Federal Reserve to reverse
its 2003 ruling that allowed banks to own commodity
infrastructure. However, banks report that commodities
trading has shrunk in profitability, due to the lower levels
of volatility in energy markets and languishing prices in
industrial metals, such as copper and aluminum.
CME net-length as % of open interests (January 2011 - April 2014)
Soybeans
Wheat
Maize
-60
-40
-20
0
20
40
2014201320122011
Percent
Commercial Managedmoney
Swapdealers
-60
-40
-20
0
20
40
2014201320122011
Percent
Commercial Managedmoney
Swapdealers
-60
-40
-20
0
20
40
60
2014201320122011
Percent
Commercial Managedmoney
Swapdealers
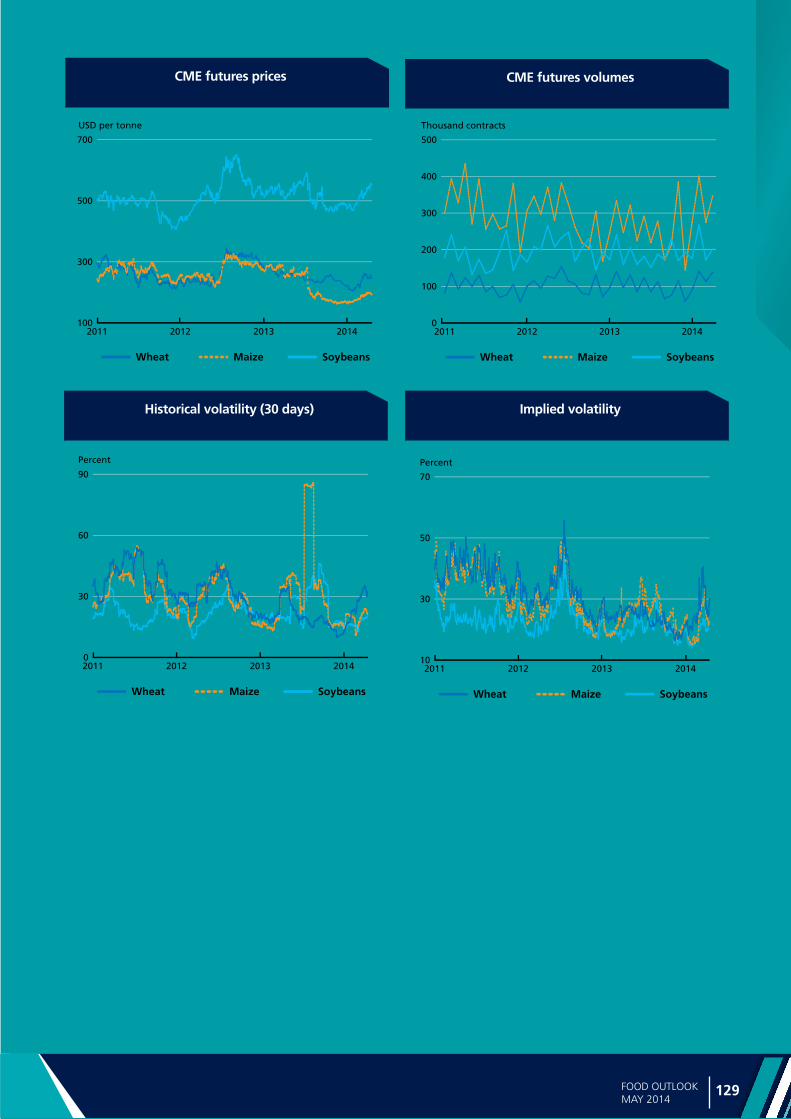
Ma
rke
t ind
icato
rs
128 129FOOD OUTLOOKMAY 2014
CME futures prices
100
300
500
700
2014201320122011
Wheat Maize Soybeans
USD per tonne
CME futures volumes
0
100
200
300
400
500
2014201320122011
Wheat Maize Soybeans
Thousand contracts
Historical volatility (30 days)
0
30
60
90
2014201320122011
Wheat Maize Soybeans
Percent
Implied volatility
10
30
50
70
2014201320122011
Wheat Maize Soybeans
Percent

Ma
rke
t in
dic
ato
rs
130 131FOOD OUTLOOKMAY 2014
OCEAN FREIGHT RATES Contributed by the International Grains Council (IGC) www.igc.org.uk
OCEAN FREIGHT MARKET (NOVEMBER 2013 - MID-APRIL 2014)
Dry bulk ocean freight rates remained volatile during
the past five months. After initial growth in November/
December, mostly sparked by renewed demand for
commodities and raw materials, rates for larger and
medium-size vessels fell sharply through January, due to
slowing chartering activity and an oversupply of tonnage.
Poor weather conditions have also affected the freight
market, particularly in the US and in Europe. Handysize
rates were less affected, notably on routes from the US
Gulf, underpinned by shipments of commodities, including
grains and soyabeans.
Rates in the grains-carrying sectors have remained
under pressure since mid-December, notably in the Atlantic
Panamax market, due to surplus tonnage, exacerbated by
ballasters from the Pacific. Freight rates in the medium and
smaller-size categories have been less affected, helped by
an increase in chartering activity for shipments of grains
and soyabeans on routes from South America. However,
April saw an acceleration in the decline in all market sectors
due to poor demand.
Selected routes (monthly averages) USD/tonne
Brazil/EU ARAH US Gulf/EU ARAH US Gulf/Japan US Gulf/S. Korea
Vessel size Handysize Panamax Panamax Panamax
Origin Brazil US (Gulf) US (Gulf) US (Gulf)
Destination EU (ARAH) EU (ARAH) Japan South Korea
March 2013 31 23 46 47
April 2013 32 23 45 46
May 2013 34 23 44 45
June 2013 34 22 45 46
July 2013 34 22 45 46
August 2013 33 21 44 45
September 2013 32 22 46 47
October 2013 32 25 51 52
November 2013 31 25 52 52
December 2013 34 27 56 55
January 2014 33 25 54 55
February 2014 32 22 50 51
March 2014 32 20 48 49
The average of the Baltic Indices of the three grains-
carrying sectors has fallen by 37% since the beginning of
November 2013, and by 12% y/y, with the biggest decline
in the Panamax sector. The Baltic Dry Index, which also
includes the Capesize sector, was down 36% from early
November, but is 11% higher y/y due to firmer Capesize
values.
Following some rebound in early December, with
shipments from the US Gulf the main driving force,
Panamax rates fell sharply, firstly, in sympathy with initially
weak Capesize sector, and secondly, due to surplus tonnage
and insufficient demand. The decline continued through to
mid-April, notably on transatlantic routes. Grains chartering
demand on routes from South America to Far East Asia
was largely serviced by ballasters from the Pacific, where,
negative sentiment continued to weigh on rates. Tonnage
oversupply and thin cargo availabilities further pressured in
the region. Over the November to mid-April period, the Baltic
Panamax Index (BPI) plummeted by 52%.
Rates in the Supramax/Handysize sectors rose steadily
from November to mid-December, on good demand for
commodities, including grains and soyabeans, notably on
routes from the US Gulf, South America and the Black Sea.
Rates in the Pacific were supported by mineral business
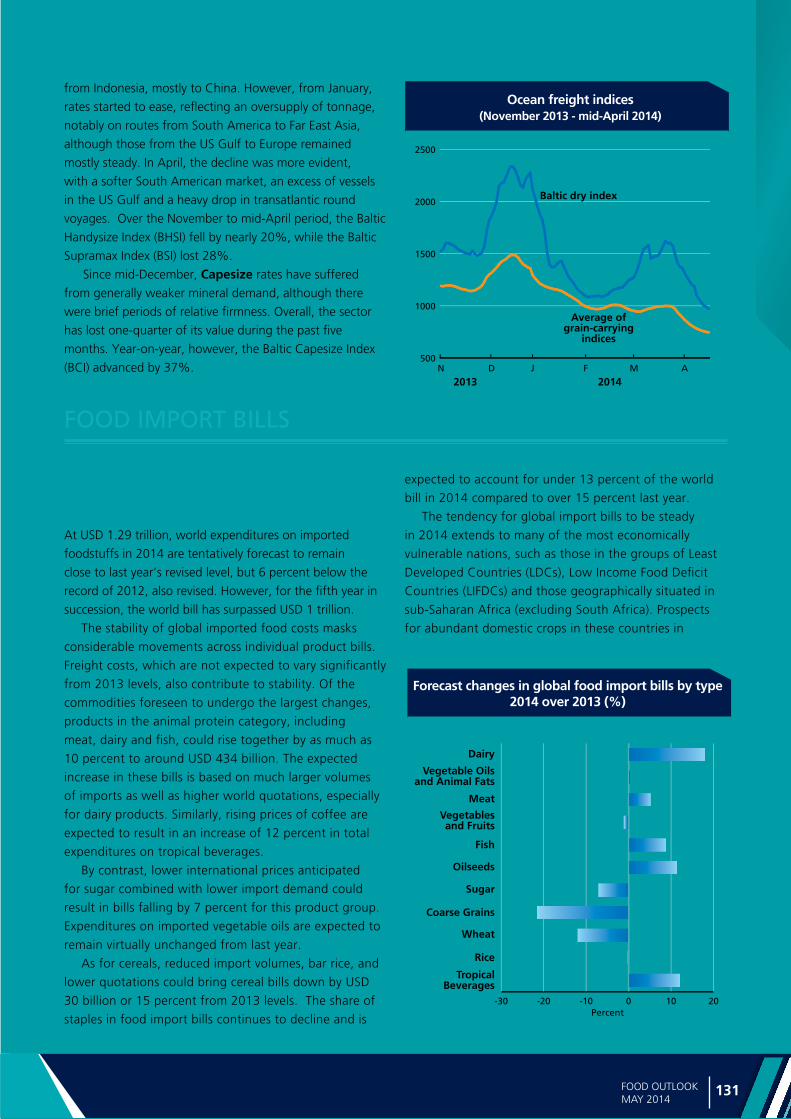
Ma
rke
t ind
icato
rs
130 131FOOD OUTLOOKMAY 2014
Ocean freight indices (November 2013 - mid-April 2014)
from Indonesia, mostly to China. However, from January,
rates started to ease, reflecting an oversupply of tonnage,
notably on routes from South America to Far East Asia,
although those from the US Gulf to Europe remained
mostly steady. In April, the decline was more evident,
with a softer South American market, an excess of vessels
in the US Gulf and a heavy drop in transatlantic round
voyages. Over the November to mid-April period, the Baltic
Handysize Index (BHSI) fell by nearly 20%, while the Baltic
Supramax Index (BSI) lost 28%.
Since mid-December, Capesize rates have suffered
from generally weaker mineral demand, although there
were brief periods of relative firmness. Overall, the sector
has lost one-quarter of its value during the past five
months. Year-on-year, however, the Baltic Capesize Index
(BCI) advanced by 37%.500
1000
1500
2000
2500
AMFJDN
2013 2014
Baltic dry index
Average ofgrain-carrying
indices
FOOD IMPORT BILLS
Global food import bills expected to stabilize in 2014
At USD 1.29 trillion, world expenditures on imported
foodstuffs in 2014 are tentatively forecast to remain
close to last year’s revised level, but 6 percent below the
record of 2012, also revised. However, for the fifth year in
succession, the world bill has surpassed USD 1 trillion.
The stability of global imported food costs masks
considerable movements across individual product bills.
Freight costs, which are not expected to vary significantly
from 2013 levels, also contribute to stability. Of the
commodities foreseen to undergo the largest changes,
products in the animal protein category, including
meat, dairy and fish, could rise together by as much as
10 percent to around USD 434 billion. The expected
increase in these bills is based on much larger volumes
of imports as well as higher world quotations, especially
for dairy products. Similarly, rising prices of coffee are
expected to result in an increase of 12 percent in total
expenditures on tropical beverages.
By contrast, lower international prices anticipated
for sugar combined with lower import demand could
result in bills falling by 7 percent for this product group.
Expenditures on imported vegetable oils are expected to
remain virtually unchanged from last year.
As for cereals, reduced import volumes, bar rice, and
lower quotations could bring cereal bills down by USD
30 billion or 15 percent from 2013 levels. The share of
staples in food import bills continues to decline and is
expected to account for under 13 percent of the world
bill in 2014 compared to over 15 percent last year.
The tendency for global import bills to be steady
in 2014 extends to many of the most economically
vulnerable nations, such as those in the groups of Least
Developed Countries (LDCs), Low Income Food Deficit
Countries (LIFDCs) and those geographically situated in
sub-Saharan Africa (excluding South Africa). Prospects
for abundant domestic crops in these countries in
Forecast changes in global food import bills by type 2014 over 2013 (%)
-30 -20 -10 0 10 20Percent
Dairy
Meat
Wheat
Rice
TropicalBeverages
Vegetablesand Fruits
Vegetable Oilsand Animal Fats
Oilseeds
Fish
Sugar
Coarse Grains
Ma
rke
t in
dic
ato
rs
132 133FOOD OUTLOOKMAY 2014
World Developed Developing LDC LIFDC Sub-Saharan Africa
2013 2014
f’cast
2013 2014
f’cast
2013 2014
f’cast
2013 2014
f’cast
2013 2014
f’cast
2013 2014
f’cast
TOTAL FOOD 1 287 1 290 762 771 524 519 38 36 132 127 44 43
Vegetables and Fruits 219 217 160 159 59 59 3 3 14 14 3 3
Cereals 196 165 79 67 117 99 14 11 39 33 15 13
Meat 132 144 96 104 36 39 1 1 7 7 5 5
Fish 161 169 109 114 52 55 3 4 7 7 4 4
Dairy 108 128 66 79 42 49 3 3 9 10 3 4
Vegetable Oils and animal Fats
103 104 44 43 60 60 6 6 23 23 4 4
Oilseeds 80 89 27 30 53 60 4 5 1 1
Sugar 48 45 24 23 24 23 4 4 11 10 3 3
Tropical beverages 89 100 69 77 20 23 1 1 5 5 1 2
Import bills of total food and major foodstuffs (USD billion)
FAO PRICE INDICES
FAO Global Food Consumption Price Index remains stable1
The FAO Global Food Consumption Price Index Index
tracks changes in the cost of the global food basket as
depicted by the latest FAO world food balance sheet (see
http://faostat3.fao.org/faostat-gateway/go/to/download/
FB/FB/E).
At the beginning of the year, the index increased
sharply, rising to a 10 month high in March before
retreating slightly in April. Rising international prices
of most foodstuffs, notably cereals, products that carry
a much higher weight in total consumption than in
trade (65 percent versus 27 percent), was behind its
strengthening. The index’s recent convergence with the
FAO Food Price Index (FPI) is a result of upward trending
quotations for livestock products, which by contrast, are
more influential in determining the FPI.
1 The FAO Global Food Consumption Price Index is published twice a year in Food Outlook.
The FAO global food consumption and food price indices
(April 2011 - April 2014)
190
210
230
250
2014201320122011
2002-2004=100
FAO global foodconsumption price index
FAO foodprice index
2014, particularly for staples, are expected to limit
their need to rely on foreign supplies. With higher
international prices for key export primary commodities,
such as coffee and cocoa, the terms-of-trade in food
and agriculture for commodity-dependent countries is
expected to improve.

Ma
rke
t ind
icato
rs
132 133FOOD OUTLOOKMAY 2014
FAO Food Price Index fell in April
The FAO Food Price Index2 averaged 209.3 points in April
2014, down 3.5 points, or 1.6 percent, from March and
7.6 points, or 3.5 percent, below April 2013. Last month’s
decline was mostly caused by a sharp drop of dairy prices,
although sugar and vegetable oil also fell. By contrast, cere-
als and meat prices firmed slightly.
The FAO Cereal Price Index averaged 206.9 points in
April, up only 1 point (or 0.5 percent) from March but still
24 points (or 10.3 percent) below its value in April 2013.
The monthly increase was less pronounced than those
registered in February and March, as weather conditions
improved in the United States and tensions in Ukraine had
little effect on the country’s pace of grain shipments. Rice
prices tended to weaken in the various market segments,
with the exception of aromatic rice varieties, where they
remained stable.
The FAO Vegetable Oil Price Index averaged 199 points
in April, down 6 points (or 2.8 percent) from March.
The slide in the index is driven by palm oil, whose values
dropped following reports of lower than anticipated
import demand, most notably from the European Union.
Furthermore, Malaysia’s exports have been hit by the
persistent strength of the country’s currency. Soybean
oil prices, on the other hand, appreciated slightly as the
market responded to the lingering tightness in global
soybean supplies.
The FAO Dairy Price Index averaged 251.5 points in April,
a sharp fall of 17 points, or 6.9 percent, over March. The
market of all dairy products has been affected by reduced
purchases by China (the main importer of Whole Milk
Powder and second largest importer of Skimmed Milk
Powder) and the Russian Federation (the main importer
of butter). Additionally, an extended season in New
Zealand and a good start to the dairy-year in the northern-
hemisphere have meant that supplies for export have
increased. Prices of all dairy commodities subsided, but
particularly butter and milk powder.
The FAO Meat Price Index averaged 185.8 points in April,
0.8 points, or 0.4 percent, above March. The marginal
increase was a result of stronger prices for pigmeat, in part
on concerns over the effect of Porcine Epidemic Diarrhea
virus on export supplies in the United States. Although little
changed, bovine meat prices are close to historic highs, due
to dry weather conditions affecting production in Australia
and the United States. Prices of poultry and ovine meat were
also stable.
The FAO Sugar Price Index averaged 249.9 points in
April, down 4.1 points, or 1.6 percent, from March. Prices
declined amid reports of large sugar availabilities in the main
producing regions, including Thailand, India, and Australia.
Generally Dry weather in most producing countries, which
should boost the sucrose level, also weighed on prices.
2 The FAO food price indices are updated on a monthly basis and are available on: http://www.fao.org/worldfoodsituation
150
175
200
225
250
2002-2004=100
2011
2010
2014 2013
2012
FAO Food Price Index
DNOSAJJMAMFJ170
200
230
260
290
2013 2014
2002-2004=100
Dairy
Vegetableoils Cereals
Sugar
Meat
FAO Food Commodity Price Indices
AMFJDNOSAJJMA
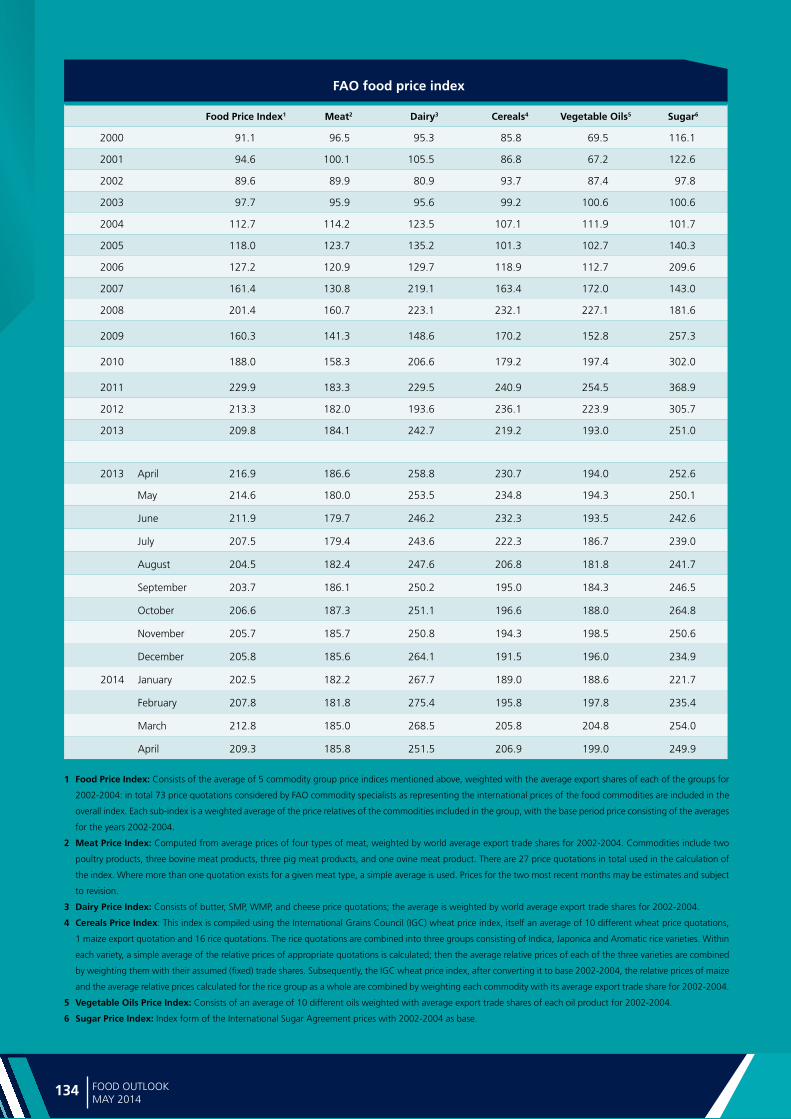
Ma
rke
t in
dic
ato
rs
134
Food Price Index1 Meat2 Dairy3 Cereals4 Vegetable Oils5 Sugar6
2000 91.1 96.5 95.3 85.8 69.5 116.1
2001 94.6 100.1 105.5 86.8 67.2 122.6
2002 89.6 89.9 80.9 93.7 87.4 97.8
2003 97.7 95.9 95.6 99.2 100.6 100.6
2004 112.7 114.2 123.5 107.1 111.9 101.7
2005 118.0 123.7 135.2 101.3 102.7 140.3
2006 127.2 120.9 129.7 118.9 112.7 209.6
2007 161.4 130.8 219.1 163.4 172.0 143.0
2008 201.4 160.7 223.1 232.1 227.1 181.6
2009 160.3 141.3 148.6 170.2 152.8 257.3
2010 188.0 158.3 206.6 179.2 197.4 302.0
2011 229.9 183.3 229.5 240.9 254.5 368.9
2012 213.3 182.0 193.6 236.1 223.9 305.7
2013 209.8 184.1 242.7 219.2 193.0 251.0
2013 April 216.9 186.6 258.8 230.7 194.0 252.6
May 214.6 180.0 253.5 234.8 194.3 250.1
June 211.9 179.7 246.2 232.3 193.5 242.6
July 207.5 179.4 243.6 222.3 186.7 239.0
August 204.5 182.4 247.6 206.8 181.8 241.7
September 203.7 186.1 250.2 195.0 184.3 246.5
October 206.6 187.3 251.1 196.6 188.0 264.8
November 205.7 185.7 250.8 194.3 198.5 250.6
December 205.8 185.6 264.1 191.5 196.0 234.9
2014 January 202.5 182.2 267.7 189.0 188.6 221.7
February 207.8 181.8 275.4 195.8 197.8 235.4
March 212.8 185.0 268.5 205.8 204.8 254.0
April 209.3 185.8 251.5 206.9 199.0 249.9
FAO food price index
1 Food Price Index: Consists of the average of 5 commodity group price indices mentioned above, weighted with the average export shares of each of the groups for
2002-2004: in total 73 price quotations considered by FAO commodity specialists as representing the international prices of the food commodities are included in the
overall index. Each sub-index is a weighted average of the price relatives of the commodities included in the group, with the base period price consisting of the averages
for the years 2002-2004.
2 Meat Price Index: Computed from average prices of four types of meat, weighted by world average export trade shares for 2002-2004. Commodities include two
poultry products, three bovine meat products, three pig meat products, and one ovine meat product. There are 27 price quotations in total used in the calculation of
the index. Where more than one quotation exists for a given meat type, a simple average is used. Prices for the two most recent months may be estimates and subject
to revision.
3 Dairy Price Index: Consists of butter, SMP, WMP, and cheese price quotations; the average is weighted by world average export trade shares for 2002-2004.
4 Cereals Price Index: This index is compiled using the International Grains Council (IGC) wheat price index, itself an average of 10 different wheat price quotations,
1 maize export quotation and 16 rice quotations. The rice quotations are combined into three groups consisting of Indica, Japonica and Aromatic rice varieties. Within
each variety, a simple average of the relative prices of appropriate quotations is calculated; then the average relative prices of each of the three varieties are combined
by weighting them with their assumed (fixed) trade shares. Subsequently, the IGC wheat price index, after converting it to base 2002-2004, the relative prices of maize
and the average relative prices calculated for the rice group as a whole are combined by weighting each commodity with its average export trade share for 2002-2004.
5 Vegetable Oils Price Index: Consists of an average of 10 different oils weighted with average export trade shares of each oil product for 2002-2004.
6 Sugar Price Index: Index form of the International Sugar Agreement prices with 2002-2004 as base.
FOOD OUTLOOKMAY 2014

www.geoglam-crop-monitor.org
GEOGLAM is the Group on Earth Observations Global Agricultural Monitoring Initiative adopted by the G-20 in 2011. It was developed in response to the growing calls for improved agricultural information.
GEOGLAM is working to strengthen capacity to produce and disseminate relevant, timely and accurate forecasts of agricultural production at national, regional and global scales through the use of Earth observations.
The GEOGLAM Crop MonitorInternational Coordination to Strengthen Global Crop Monitoring in Support of AMIS

Food Outlook is published by the Trade and Market Division of FAO under Global Information and Early Warning System (GIEWS). It is a
biannual publication focusing on developments affecting global food and feed markets. Each report provides comprehensive assessments and short term forecasts for production, utilization, trade, stocks and prices on a commodity by commodity basis and includes feature articles on topical issues. Food Outlook maintains a close synergy with another major GIEWS publication, Crop Prospects and Food Situation, especially with regard to the coverage of cereals. Food outlook is available in English. The summary section is also available in Arabic, Chinese, French, Spanish and Russian.
Food Outlook and other GIEWS reports are available on the internet as part of the FAO world wide web (http://www.fao.org/) at the following URL address: http://www.fao.org/giews/. Other relevant studies on markets and global food situation can be found at http://www.fao.org/worldfoodsituation.
This report is based on information available up to late April 2014. The next Food Outlook report will be published in October 2014.
For enquiries or further information contact:
Abdolreza Abbassian
Trade and Markets Division
Food and Agriculture Organization of the United Nations
Via delle Terme di Caracalla
00153 Rome - Italy
Telephone: 0039-06-5705-3264
Facsimile: 0039-06-5705-4495
E-mail: [email protected] or [email protected]
I3751E/1/04.14