food labelling - university of auckland and... · directive fopl, which is characterised by the...
TRANSCRIPT

LENScience Healthy Start to Life Education Project: My Food, My Future © University of Auckland 2014
1
LENScience Healthy Start to Life Education for Adolescents Project: My Food, My Future
Food Labelling: A Summary of Current Evidence and Practice
Andrea Ler1, Ana-Mishel Spiroski2,4, Helen Eyles3, Wilma Waterlander3,
Sarah Hanrahan1, Jacquie Bay2,4
1Nutrition Foundation of New Zealand, 2The Liggins Institute, 3National Institute of Health Innovation,
4Gravida: National Centre for Growth and Development
Foods sold in New Zealand must be labelled according to the Food Standards Code, which was
established by Food Standards Australia New Zealand (FSANZ) in 2002 and is implemented
by the Ministry of Primary Industries (MPI). Food labels must include:
Name and description of the food
Name and address of the New Zealand distributor or manufacturer
Advisory or warning statements
Ingredient list
Nutrition Information Panel
Percentage labelling of key ingredients
Net weight or volume
Date marking
Lot identification
Directions for use and storage
All ingredients used in the production of a processed food item, including natural and
synthetic food additives that extend shelf life or improve the product’s appearance or taste,
must be identified on the label, and listed relative to the total contribution by weight or
volume (Food Standards Australia New Zealand, 2003). Providing the country of origin of a
food is voluntary, and the country of origin of the ingredients, whether produced locally or
imported, is not required. However, all foods must be labelled with contact details of the New
Zealand manufacturer or distributor.
Foods which are unpackaged, whole or cut fresh fruit and vegetables in transparent
packaging, ready-to-eat delivered-to-order, sold at fundraising events, made and packaged
where sold, or packaged by the purchaser or in the presence of the purchaser do not require
labelling. Certain foods are exempt from the full labelling requirements, including small food
packets (e.g. chewing gum), food products for catering purposes and alcoholic beverages,
herbs, spices, tea, coffee, and mineral water, unless a nutrition claim is made about these
foods (Food Standards Australia New Zealand, 2003).
LENScience Healthy Start to Life Education Project: My Food, My Future © University of Auckland 2014
2
Nutrition Information Panel
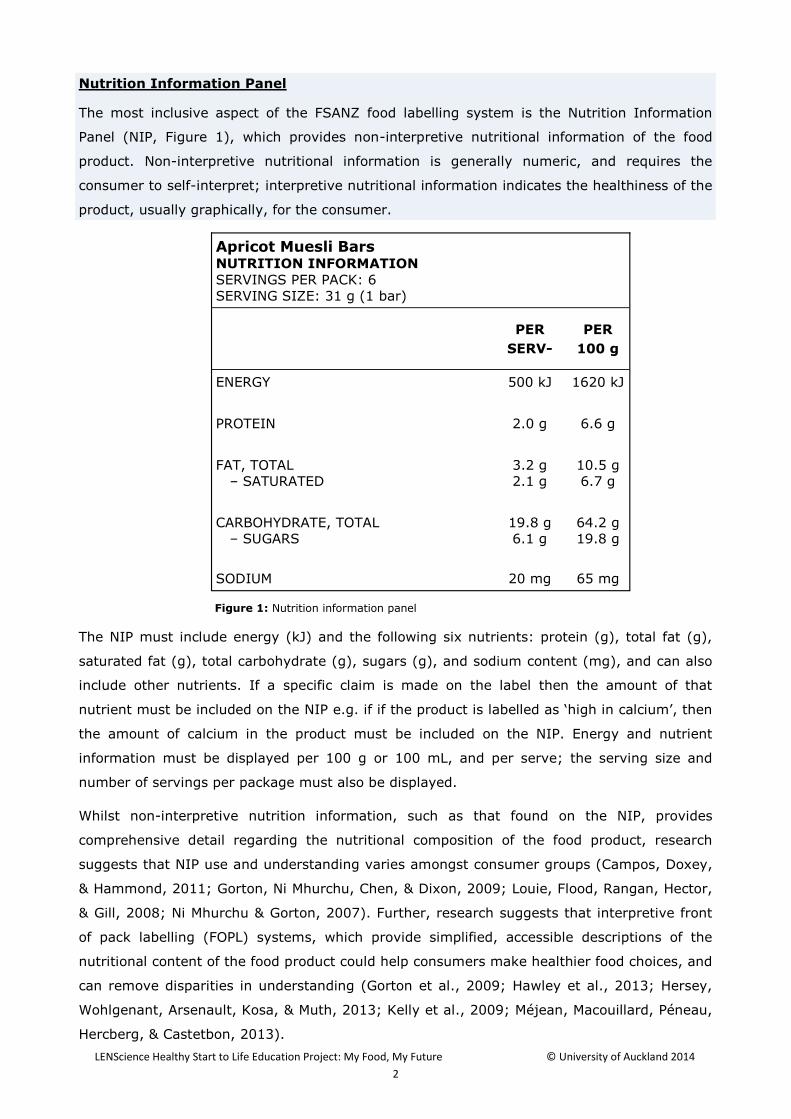
The most inclusive aspect of the FSANZ food labelling system is the Nutrition Information
Panel (NIP, Figure 1), which provides non-interpretive nutritional information of the food
product. Non-interpretive nutritional information is generally numeric, and requires the
consumer to self-interpret; interpretive nutritional information indicates the healthiness of the
product, usually graphically, for the consumer.
The NIP must include energy (kJ) and the following six nutrients: protein (g), total fat (g),
saturated fat (g), total carbohydrate (g), sugars (g), and sodium content (mg), and can also
include other nutrients. If a specific claim is made on the label then the amount of that
nutrient must be included on the NIP e.g. if if the product is labelled as ‘high in calcium’, then
the amount of calcium in the product must be included on the NIP. Energy and nutrient
information must be displayed per 100 g or 100 mL, and per serve; the serving size and
number of servings per package must also be displayed.
Whilst non-interpretive nutrition information, such as that found on the NIP, provides
comprehensive detail regarding the nutritional composition of the food product, research
suggests that NIP use and understanding varies amongst consumer groups (Campos, Doxey,
& Hammond, 2011; Gorton, Ni Mhurchu, Chen, & Dixon, 2009; Louie, Flood, Rangan, Hector,
& Gill, 2008; Ni Mhurchu & Gorton, 2007). Further, research suggests that interpretive front
of pack labelling (FOPL) systems, which provide simplified, accessible descriptions of the
nutritional content of the food product could help consumers make healthier food choices, and
can remove disparities in understanding (Gorton et al., 2009; Hawley et al., 2013; Hersey,
Wohlgenant, Arsenault, Kosa, & Muth, 2013; Kelly et al., 2009; Méjean, Macouillard, Péneau,
Hercberg, & Castetbon, 2013).
Apricot Muesli Bars
NUTRITION INFORMATION
SERVINGS PER PACK: 6
SERVING SIZE: 31 g (1 bar)
PER
SERV-
PER
100 g
ENERGY 500 kJ 1620 kJ
PROTEIN 2.0 g 6.6 g
FAT, TOTAL
– SATURATED
3.2 g
2.1 g
10.5 g
6.7 g
CARBOHYDRATE, TOTAL
– SUGARS
19.8 g
6.1 g
64.2 g
19.8 g
SODIUM
20 mg
65 mg
Figure 1: Nutrition information panel

LENScience Healthy Start to Life Education Project: My Food, My Future © University of Auckland 2014
3
Front of Pack Labelling
Front of pack labelling (FOPL) provides quick and easily interpreted information to help
consumers select healthier products. This information can be categorised into three groups:
Non-directive FOPL, which provides information about the core nutrients in a product
and enables the consumer to determine the healthiness of the product, eg: Guideline
Daily Amounts (GDA), Daily Intake Guides (DIG), NuVal;
Semi-directive FOPL, which provides some guidance and/or benchmarks (for example
by the use of colours), but leave the interpretation of healthiness to the consumer,
eg: Traffic Light Labelling, Health Star Rating;
Directive FOPL, which is characterised by the presence of a logo, and therefore a
determined level of ‘healthiness’, eg: Heart Foundation Tick (Australia and New
Zealand).
Health Star Rating System
In 2012 the New Zealand Front of Pack Labelling Advisory Group developed principles
following a recommendation from the Labelling Logic Report that a single, interpretive FOPL
system, based on the FSANZ NPSC, be developed to meaningfully rank products according to
‘healthfulness” (New Zealand Front of Pack Labelling Advisory Group, 2012). The system is
expected to help consumers evaluate the nutritional value of a food item, and enable the
selection of healthier food choices. The advisory group followed Australian adoption of the
system, and endorsed use of the Health Star Rating system in New Zealand. In July 2014 the
New Zealand government announced the adoption of this system, which consumers can
expect to see appearing on food packages in early 2015.
The Health Star Rating System may use a combination of the following elements: a graphic
rating of ½ to 5 stars, nutritional information icons for energy (kJ), saturated fat (g), sugars
(g), sodium (mg), and one additional ‘positive’ nutrient such as calcium or fibre. The Health
Star Rating graphic (Figure 2) provides nutrition information in an identical manner to the
Australian Health Star system. As some products may not be able to display the full label due
to pack or label size, these products will report Star Rating information in modified formats.
Figure 2: Example of the Health Star Rating graphic,
reproduced with permissions from the Ministry of
Primary Industries.
LENScience Healthy Start to Life Education Project: My Food, My Future © University of Auckland 2014
4
How is Health Star Rating determined?
The Health Star Rating system provides both ‘positive’ and ‘negative’ aspects of a food, and
information regarding the nutritional value of the product as a whole (New Zealand Front of
Pack Labelling Advisory Group, 2012). The nutritional value of a food is rated using a
mathematical algorithm, which includes four basic nutritional components: energy, saturated
fat, sugars and sodium, the overconsumption of which are associated with increased risk of
non-communicable disease (NCD) development (New Zealand Ministry of Health, 2003).
‘Positive’ components, such as fruit and vegetable content, dietary fibre and protein are also
included. The amount of these components per 100 g, or mL, of the food product is included
in the mathematical algorithm, and contributes to the overall Health Star Rating.
Is the Health Star Rating system effective in helping consumers make better food choices?
A market research study was commissioned by the Ministry of Primary Industries (MPI) in
2013 to determine whether the Health Star Rating system can assist consumers to correctly
identify healthier food choices (Colmar Brunton Social Research Agency, 2013). Participants
were recruited from a market research group via either online or “street intercept” methods.
Participants were recruited into a general population group (General, n=1,022),
representative of the adult New Zealand population, and further targeted recruitment of
Māori (n=696) and Pacific (n=567) groups. Due to increased prevalence of risk factors for
nutrition-related NCDs in Māori and Pacific peoples (New Zealand Ministry of Health, 2013),
these groups were targeted for the purposes of this study. Participants were randomly
assigned to one of four conditions, a standard NIP (control), or one of three experimental
conditions presented in addition to a standard NIP (Colmar Brunton Social Research Agency,
2013):
1. The Australian Health Star Rating System
2. A Star Rating only
3. A Star Rating and DIG
Participants were asked to select the healthier food choice of a pair of food products (both
snack and frozen food product pairs) using one of the four conditions.
Results suggest that compared to the NIP, all FOPL conditions tested had a positive effect on
the ability of research groups to select the healthier food product of the pair (Colmar Brunton
Social Research Agency, 2013). Although these results suggest that FOPL assists consumers
in selecting healthier food choices, this study does not evaluate the Health Star Rating

LENScience Healthy Start to Life Education Project: My Food, My Future © University of Auckland 2014
5
System in a “real world” setting; whether the Health Star Rating influences consumer
purchasing behaviours is unknown.
Multiple Traffic Light Labelling System
The multiple traffic light labelling system (Figure 3) is an interpretive label that utilises a
simple colour scheme to indicate relative levels of total fat, saturated fat, sugar and salt in
food products, with green indicating low, amber moderate, and red high levels. A multiple
traffic light labelling format was proposed by the United Kingdom (UK) Food Standards
Agency in 2007 (Food Standards Agency, 2007), and adopted in 2013. A New Zealand study
has shown that multiple traffic light labelling systems were most easily understood when
compared with other FOPL systems, across multiple consumer groups (Gorton et al., 2009).
How is multiple traffic light labelling determined?
Traffic light colours are determined by a set of established standards for total fat, saturated
fat, sugars and salt (Table 1 and 2; Food Standards Agency, 2007).
Food
Low Medium High
Fat ≤3.0 g/100 g >3.0 to ≤20.0 g/100 g >20.0 g/100 g >21.0 g/portion
Saturates ≤1.5 g/100 g >1.5 to ≤5.0 g/100 g >5.0 g/100 g >6.0 g/portion
Total Sugars
≤5.0 g/100 g >5.0 to ≤12.5 g/100 g >12.5 g/100 g >15.0 g/portion
Salt ≤0.30 g/100 g >0.30 to ≤1.5 g/100 g >1.5 g/100 g >2.4 g/portion
Table 1: Traffic light colour categories for food products.
Drinks
Low Medium High
Fat ≤1.5 g/100 mL >1.5 to ≤10.0 g/100 mL >10.0 g/100 mL
Saturates ≤0.75 g/100 mL >0.75 to ≤2.5 g/100 mL >2.5 g/100 mL
Total Sugars
≤2.5 g/100 mL >2.5 to ≤6.3 g/100 mL >6.3 g/100 mL
Salt ≤0.3 g/100 mL >0.3 to ≤1.50 g/100 mL >1.5 g/100 mL
Table 2: Traffic light colour categories for food and drinks, reproduced from.

LENScience Healthy Start to Life Education Project: My Food, My Future © University of Auckland 2014
6
Is multiple traffic light labelling effective in helping make better food choices?
The “traffic light” interpretation of select nutritional components has been shown to help
consumers identify healthier food products (Hawley et al., 2013); however, only ‘negative’
nutrients are graphically represented. Thus, this labelling system does not provide consumers
with interpretive information regarding the overall healthiness of a product. As such, the
multiple traffic light labelling system does not meet the set of FOPL principles developed by
the advisory group (New Zealand Front of Pack Labelling Advisory Group, 2012). Additionally,
research has shown that, based on the multiple traffic light labelling system, most foods
classified as healthy by NPSC criteria would also display one ‘red light’ on the FOPL
(Rosentreter, Eyles, & Ni Mhurchu, 2013).
Are there other ways to help consumers make healthier food choices?
The FoodSwitch application (app), developed by The George Institute for Global Health at the
University of Sydney, in partnership with Bupa Australia, is a smartphone app that allows
consumers to scan the barcode of a packaged food product using the in-phone camera.
FoodSwitch then presents immediate and
easy-to-understand nutritional information,
using the multiple traffic light system (Figure
4). The app also lists healthier options using
the same multiple traffic light scheme (Bupa
Australia, 2014). Food Switch is a
partnership between the National Institute
for Health Innovation (NIHI) at the
University of Auckland, The George Institute,
and Bupa New Zealand. A study to examine
the effectiveness of this technology in
changing food purchasing behaviour is
currently underway.
What is most effective in helping consumers make healthier food choices?
Although the multiple traffic light system has been shown to be effective in assisting
consumers to identify healthier food choices (Kelly et al., 2009), studies investigating the
effect of FOPL on consumer purchasing behaviours (Sonnenberg et al., 2013) (Levy, Riis,
Sonnenberg, Barraclough, & Thorndike, 2012), and actual dietary intake (Hersey et al., 2013)
are limited. NIHI is currently investigating the effect of FOPL on food choices and consumer
purchasing behaviours.
Figure 4: Example of FoodSwitch app nutritional information

LENScience Healthy Start to Life Education Project: My Food, My Future © University of Auckland 2014
7
What is the best way to improve the diets and health of New Zealanders?
The Dietary Interventions: Evidence & Translation (DIET) programme aims to identify the
most effective and cost-efficient methods to improve the diets and health of New Zealanders
(University of Auckland, 2014). Funded by the Health Research Council of New Zealand, this
NIHI-led research programme will be conducted in collaboration with the Department of Public
Health at the University of Otago, Wellington, the George Institute for Global Health at the
University of Sydney, and the British Heart Foundation Centre on Population Approaches for
Non-Communicable Disease Prevention at Oxford University. The DIET programme hopes to
provide vital information on the most effective ways to support people in making healthier
food choices, which could have important long-term health benefits.
The Virtual Supermarket
The Virtual Supermarket, a web-based platform where researchers can investigate the impact of simulated price changes on consumer food pur-chases, is currently being developed by NIHI in collaboration with the University of Otago, Wel-lington and LENScience. The Virtual Supermarket will provide an avenue for researchers to model the impacts of policy changes, such as those as-sociated with food taxes and subsidies, on the consumer.
The Starlight Study
NIHI is currently recruiting participants to take part in the Starlight project, which aims to as-sess the effect of FOPLs on consumer purchas-ing behaviours. A smartphone app, which scans the barcode of a packaged food and provides a FOPL for the selected product, will be used by participants when shopping. Participants will be randomly assigned to receive nutritional infor-mation about the selected product in one three FOPL styles. The consumer’s food purchases will then be analysed to determine which FOPL style assists in making healthier food choices.

LENScience Healthy Start to Life Education Project: My Food, My Future © University of Auckland 2014
8
Useful web links
NIHI - http://nihi.auckland.ac.nz/
Starlight - http://www.diet.auckland.ac.nz/content/starlight
Nutrition foundation of NZ - http://www.nutritionfoundation.org.nz/
LENScience - http://lenscience.auckland.ac.nz/
Food Safety NZ - NZ Health Star Rating http://www.foodsafety.govt.nz/industry/general/labelling-composition/health-
star-rating/
References
Bupa Australia. (2014). FoodSwitch FAQ. Retrieved 24 September 2014, 2014, from http://
www.bupa.com.au/health-and-wellness/tools-and-apps/mobile-apps/foodswitch-app-
faq
Campos, S., Doxey, J., & Hammond, D. (2011). Nutrition labels on pre-packaged foods: a
systematic review. Public Health Nutrition, 14(08), 1496-1506.
Colmar Brunton Social Research Agency. (2013). Research report: The ability of New Zealand
consumers to use the Health Star Rating System. Wellington, New Zealand: New
Zealand Ministry for Primary Industries.
Food Standards Agency. (2007). Front-of-pack traffic light signpost labelling technical
guidance. London, United Kingdom: Food Standards Agency, United Kingdom.
Food Standards Australia New Zealand. (2003). Australia New Zealand Food Standards Code.
(F2011C00538). Kingston, Australia: Food Standards Australia New Zealand.
Gorton, D., Ni Mhurchu, C., Chen, M., & Dixon, R. (2009). Nutrition labels: a survey of use,
understanding and preferences among ethnically diverse shoppers in New Zealand.
Public Health Nutrition, 12(09), 1359-1365.
Hawley, K., Roberto, C., Bragg, M., Liu, P., Schwartz, M., & Brownell, K. (2013). The science
on front-of-package food labels. Public Health Nutrition, 16(03), 430-439.
Hersey, J., Wohlgenant, K., Arsenault, J., Kosa, K., & Muth, M. (2013). Effects of front-of-
package and shelf nutrition labeling systems on consumers. Nutrition Reviews, 71(1),
1-14.
Kelly, B., Hughes, C., Chapman, K., Louie, J., Dixon, H., Crawford, J., . . . Slevin, T. (2009).
Consumer testing of the acceptability and effectiveness of front-of-pack food labelling
systems for the Australian grocery market. Health Promotion International, 24(2), 120
-129.
Levy, D., Riis, J., Sonnenberg, L., Barraclough, S., & Thorndike, A. (2012). Food Choices of
Minority and Low-Income Employees: A Cafeteria Intervention. American Journal of
Preventive Medicine, 43(3), 240-248.
Louie, J., Flood, V., Rangan, A., Hector, D., & Gill, T. (2008). A comparison of two nutrition
signposting systems for use in Australia. New South Wales Public Health Bulletin, 19
(8), 121-126.
Méjean, C., Macouillard, P., Péneau, S., Hercberg, S., & Castetbon, K. (2013). Perception of
front-of-pack labels according to social characteristics, nutritional knowledge and food
purchasing habits. Public Health Nutrition, 16(03), 392-402.
New Zealand Front of Pack Labelling Advisory Group. (2012). Final Report to the Minister for
Food Safety. Wellington, New Zealand: New Zealand Ministry for Primary Industries.
New Zealand Ministry of Health. (2003). Food and Nutrition Guidelines for Healthy Adults: A
background paper. Wellington, New Zealand: New Zealand Ministry of Health.

LENScience Healthy Start to Life Education Project: My Food, My Future © University of Auckland 2014
9
New Zealand Ministry of Health. (2013). New Zealand Health Survey: Annual update of key
findings 2012/13. Wellington, New Zealand: New Zealand Ministry of Health.
Ni Mhurchu, C., & Gorton, D. (2007). Nutrition labels and claims in New Zealand and
Australia: a review of use and understanding. Australian and New Zealand Journal of
Public Health, 31(2), 105-112.
Rosentreter, S. C., Eyles, H., & Ni Mhurchu, C. (2013). Traffic lights and health claims: a
comparative analysis of the nutrient profile of packaged foods available for sale in New
Zealand supermarkets. Australian and New Zealand Journal of Public Health, 37(3),
278-283.
Sonnenberg, L., Gelsomin, E., Levy, D., Riis, J., Barraclough, S., & Thorndike, A. (2013). A
traffic light food labeling intervention increases consumer awareness of health and
healthy choices at the point-of-purchase. Preventive Medicine, 57(4), 253-257.
University of Auckland. (2014). Dietary Interventions: Evidence & Translation. Retrieved 24
September 2014, 2014, from http://www.diet.auckland.ac.nz/
Acknowledgements
My Food My Future is a collaboration between the Liggins Institute, the Nutrition
Foundation of New Zealand and the National Institute for Health Innovation at the University of Auckland.
Development of this education resource has been funded by grants from The Youthtown Trust , The Dick Roberts Trust, and Gravida: National Centre for Growth
and Development
Images within the resource are from thinkstockphotos.com (used under licence to
the Liggins Institute), The National Institute for Health and Innovation, or used with permission.
The resource has been developed to provide teachers with an up to date summary of
evidence and practice surrounding food labelling in New Zealand.
Accompanying learning resources are found in the LENScience My Food My Future
web page: http://www.lenscience.auckland.ac.nz/en/about/teaching-and-learning-resources/
MyFoodMyFuture.html
©University of Auckland 2014
www.lenscience.auckland.ac.nz