food integrity application compendium
TRANSCRIPT

APPLICATION NOTE 10509
TRUSTyour foods are all they should be.
Food Integrity Application CompendiumAuthenticity Adulteration/Food Fraud Halal Foods

2
Table of contents
Introduction 3
General 4
Dyes 9
Fish 10
Fruit 11
Halal foods 12
Honey 13
Edible oils 19
Spices 21
Beverages 25
Product highlight 46
Other resources 47

3
IntroductionAdulteration has become an increasing problem for the global food industry and for consumers, bringing new urgency to testing olive oil, honey, spices, meats and seafood. Determining if the product is authentic, meets label claims or has been adulterated is important for all food laboratories. The advanced instrumentation available from Thermo Fisher Scientific streamlines determination of both known and unknown components. The world’s top ten food and beverage companies trust us to help keep their products safe, authentic, and unadulterated.
This food integrity compendium highlights key applications for authenticity, adulteration and halal foods.

4
General
Infographic
COMMON CAUSES FOR
CONTAMINATION NATURAL TOXINS
processing defects labeling issues
physical contamination
food fraud
13% 26%
7%
1%
Lack of sterility, lack of thiamine, mold
Mislabeled as another product, manufacturing error that caused labeling issue
Particulate matter, glass, metal, foreign
material
chemical contamination
6%
Plastic, undeclared active pharmaceutical ingredients, higher-than-acceptable level of copper
Undeclared tree nuts, milk,
eggs, soy, wheat, sulfites,
shellfish and color
Salmonella, Listeria monocytogenes, Clostridium perfringens, Staphylococcus aureus, E. coli
microbiological contamination
METALSArsenic, lead, mercury, and methylmercury
orange juicehoneytruffle oilblueberries milkfishsaffron olive oilpomegranate juicecoffee and spices
THE MULTI-BILLION DOLLAR IMPACT OF
GLOBAL FOOD FRAUD
FOOD PRODUCT
RECALLS
FOOD-BORNE OUTBREAKS
Medical treatment, lost productivity and illness-related mortality contribute to multi-billion dollar impact
1 OUT OF 6 PEOPLE WILL BECOME SICK DUE TO FOOD-BORNE ILLNESS
THE GLOBAL ECONOMICS OF
PESTICIDES
Look before you eat!
COMMON PATHOGENSSalmonella, Clostridium perfringens, Campylobacter, Staphylococcus aureus, E. coli O157:H7, Listeria monocytogenes, Norovirus, and Toxoplasma gondii
CHEMICAL CONTAMINANTSDioxins, such as benzene, PCBs, ethyl carbamate, furan, perchlorate, radionuclides, melamines, detergents, and sanitizers
47%
Good data goes well with everything.
COMMON FOOD
ALLERGEN
LABELING peanuts, tree nuts, milk, eggs,
wheat, soy, fish, shellfish, sesame
If you are facing the challenges of increased regulation, labeling and testing requirements, find out how good data and lab management can help you avoid these common threats to safe food production. Visit www.thermofisher.com/traceability
Full infographic
5
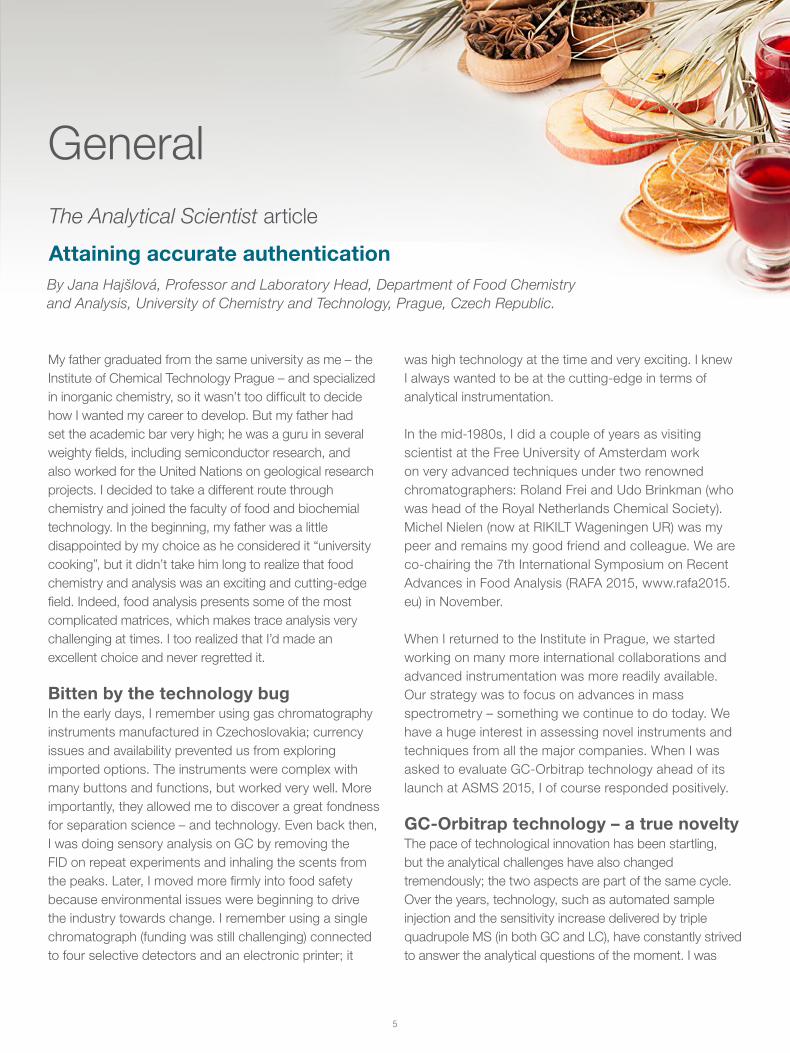
GeneralThe Analytical Scientist article
Attaining accurate authentication
My father graduated from the same university as me – the Institute of Chemical Technology Prague – and specialized in inorganic chemistry, so it wasn’t too difficult to decide how I wanted my career to develop. But my father had set the academic bar very high; he was a guru in several weighty fields, including semiconductor research, and also worked for the United Nations on geological research projects. I decided to take a different route through chemistry and joined the faculty of food and biochemial technology. In the beginning, my father was a little disappointed by my choice as he considered it “university cooking”, but it didn’t take him long to realize that food chemistry and analysis was an exciting and cutting-edge field. Indeed, food analysis presents some of the most complicated matrices, which makes trace analysis very challenging at times. I too realized that I’d made an excellent choice and never regretted it.
Bitten by the technology bugIn the early days, I remember using gas chromatography instruments manufactured in Czechoslovakia; currency issues and availability prevented us from exploring imported options. The instruments were complex with many buttons and functions, but worked very well. More importantly, they allowed me to discover a great fondness for separation science – and technology. Even back then, I was doing sensory analysis on GC by removing the FID on repeat experiments and inhaling the scents from the peaks. Later, I moved more firmly into food safety because environmental issues were beginning to drive the industry towards change. I remember using a single chromatograph (funding was still challenging) connected to four selective detectors and an electronic printer; it
By Jana Hajšlová, Professor and Laboratory Head, Department of Food Chemistry and Analysis, University of Chemistry and Technology, Prague, Czech Republic.
was high technology at the time and very exciting. I knew I always wanted to be at the cutting-edge in terms of analytical instrumentation.
In the mid-1980s, I did a couple of years as visiting scientist at the Free University of Amsterdam work on very advanced techniques under two renowned chromatographers: Roland Frei and Udo Brinkman (who was head of the Royal Netherlands Chemical Society). Michel Nielen (now at RIKILT Wageningen UR) was my peer and remains my good friend and colleague. We are co-chairing the 7th International Symposium on Recent Advances in Food Analysis (RAFA 2015, www.rafa2015.eu) in November.
When I returned to the Institute in Prague, we started working on many more international collaborations and advanced instrumentation was more readily available. Our strategy was to focus on advances in mass spectrometry – something we continue to do today. We have a huge interest in assessing novel instruments and techniques from all the major companies. When I was asked to evaluate GC-Orbitrap technology ahead of its launch at ASMS 2015, I of course responded positively.
GC-Orbitrap technology – a true noveltyThe pace of technological innovation has been startling, but the analytical challenges have also changed tremendously; the two aspects are part of the same cycle. Over the years, technology, such as automated sample injection and the sensitivity increase delivered by triple quadrupole MS (in both GC and LC), have constantly strived to answer the analytical questions of the moment. I was

6
GeneralThe Analytical Scientist article (continued)
Attaining accurate authenticationBy Jana Hajšlová, Professor and Laboratory Head, Department of Food Chemistry and Analysis, University of Chemistry and Technology, Prague, Czech Republic.
telling my students recently that the current challenges in food analysis are most likely to be addressed by high-resolution MS (HR-MS), which offers so many advantages compared with unit resolution MS/MS. In the past, I’ve worked with medium resolution time-of-flight (TOF).
In the past, I’ve worked with medium resolution time-of- flight (TOF) instruments with a maximum resolving power of about 10,000 FWHM, and then moved onto improved TOFs with about 30,000 FWHM. Orbitrap technology coupled to LC was a real breakthrough, offering resolution up to 60,000 FWHM with high mass accuracy – and further developments increased resolving power in some variants up to 450,000 FWHM (at m/z 200).
Today, Orbitrap is available for GC instrumentation in the Thermo Scientific™ Q Exactive™ GC Orbitrap™ GC-MS/MS system, which is yet another key advance. I consider myself impartial when it comes to technology, but I can say that GC-Orbitrap technology offers several real benefits. I was particularly impressed with the linearity range of the instrument, which is a limitation of TOF instruments. In ‘fingerprinting’ style studies, relative ratios of responses for features are also diagnostic, so linearity plays a very important role. In our studies, we saw good linearity over six or seven orders of magnitude.
For me, two challenging areas stand out as real opportunities for Orbitrap technology to differentiate itself against triple-quadrupole instrumentation. The first is non-targeted screening, where you wish to confirm whether or not a sample is contaminated with unknown compounds – mycotoxins or other natural toxins using Thermo Scientific™ LC-Orbitrap™, for example.
Here, the combination of full scan and accurate mass is unparalleled, as discussed in my recent lecture ‘Effective Food Safety Control: Pesticide Residues and More within a Single Run’ at the 1st International Symposium on Recent Developments in Pesticide Analysis (you can watch the video here: http://tas.txp.to/0915/janapresents). The second area is food authentication, which I believe is even more challenging. Traditionally, several markers have been used to answer questions of authentication, but with little in-depth knowledge of the matrices and other potential clues. Comprehensive MS fingerprinting using full-scan HRAM data coupled with advanced chemometrics can offer surprising insights into authenticity and classification of samples – something that was not before possible in a single analytical run.
Whiskey or Whisky?When I tested the Q Exactive GC ahead of its launch, I was keen to benchmark it in three main areas: linearity, sensitivity and selectivity. But more than that, I wanted toassess its potential in the aforementioned area of food authenticity, which is why we focused on several whisky samples in addition to pesticide analysis. I was quite surprised to find that many compounds were identified automatically in both sets of samples, which proved to me that the deconvolution function was working well.
Analyzing the very important food commodity that is whisky seemed like a good idea given the fact I was in the UK. In particular, we were interested to see if we could authenticate whiskies in terms of age, geographical origin, brand and raw materials by building up databases and statistical models from samples of known origin. The end game is to use the data and models generated
7
GeneralThe Analytical Scientist article (continued)
Attaining accurate authenticationBy Jana Hajšlová, Professor and Laboratory Head, Department of Food Chemistry and Analysis, University of Chemistry and Technology, Prague, Czech Republic.
to assess unknown samples using HRAM fingerprints to gain a probability of authenticity. In our early work with GC-Orbitrap technology, we were fine tuning the method and found that ethyl acetate extraction gave us a good signature in terms of the compounds derived from the oak casks used in the aging process for whisky. As I hinted earlier, I was especially impressed with the linearity across major and minor compounds and the ability to identify ions that could be used to discriminate between whiskies.
A growing wish list of recent advancesHaving spent time with GC-Orbitrap technology, what is my conclusion? Well, the Q Exactive GC is on my wish list! Especially as we have plans to establish a center of excellence in food and nutritional science – and that means we need great instrumentation. GC-Orbitrap technology represents the current pinnacle of innovation in that space right now, and would complete my collection – after all, I already have four TOF instruments, including a GC×GC-TOF-MS system.
Over the next few weeks, Michel Nielen and I – along with the rest of the team – will be conducting the strict selection process of oral abstracts for RAFA 2015. We started the conference 14 years ago to place an emphasis on excellence – and, as the name indicates, recent advances in the field – the two aspects that drive
our selection process. Notably, we made a decision right from the beginning to separate presentations from independent (academic or industry) scientists and instrument company researchers – though certainly not in terms of quality. Richard Fussell is a perfect example of a quality scientist who will command attention and respect on both sides of the divide. Indeed, vendor lunchtime seminars are always packed and I am sure we will learn more about the Q Exactive GC this November. I will also be very interested to see if anyone will independently present work based on their experience with GC-Orbitrap technology – I’m quite confident we will...
When I was invited to Thermo Fisher Scientific’s laboratory in Runcorn, UK, to test drive GC-Orbitrap technology, I was very curious to learn what added value or extra features it could offer. I can say that it certainly fills a gap – especially in metabolomic style approaches. I also suspect it will have a disruptive impact on certain areas of the mass spectrometry market. My independent advice? Take Orbitrap technology for a spin and decide for yourself.
Video interview with Jana Hajšlová:tas.txp.to/0915/JanaTo find out more:thermoscientific.com/QExactiveGC
© 2017 Thermo Fisher Scientific Inc. All rights reserved. All trademarks are the property of Thermo Fisher Scientific and its subsidiaries unless otherwise specified. AB72323-EN 0417S
Find out more at www.thermofisher.com/FoodIntegrity
Read the full article.

8
General
Application summary AN 1064
Product authentication and adulteration determination using a novel spectro-electro array platform
OverviewPlants contain an extraordinarily diverse variety of secondary metabolites, including polyphenols, alkaloids, and terpenoids, with potential roles in the purported health benefits as well as the quality and sensory characteristics of plant-based beverages such as juice, wine, beer, and tea.
This application note presents a method using chemometric modeling software to evaluate changes in metabolite patterns that can indicate product adulteration, contamination, composition, and stability, and—in the case of wine and juice—the effects of growing region and differences between the varietals used in production.
MethodA gradient HPLC method was established using spectro-electro array detection to easily generate both targeted and information-rich metabolomic data. Metabolite profiles are generated with sensitive three-dimensional EC array data, which can be imported into pattern-recognition software and combined with principal component analysis (PCA) to readily identify product adulteration and authenticity.
Paul A. Ullucci, Marc Plante, Ian N. Acworth, Christopher Crafts, and Bruce BaileyThermo Fisher Scientific, Chelmsford, MA, USA
ConclusionUsing this method, PCA easily differentiated a variety of wines and teas. Fruit juice adulteration was readily detected, and it was possible to classify orange juice samples by varietal and geographical region. Although this work highlighted the application of the method to beverages, this method is also applicable to other fields, including botanical/supplement testing, fuel/oil testing, drug testing, and counterfeit product identification.
Thermo Scientific™ UltiMate™ 3000 Rapid Separation system
Read the full application note.Part Number Description
063691Thermo Scientific™ Acclaim™ 120 column, C18, 3 μm analytical (3.0 × 150 mm)
© 2017 Thermo Fisher Scientific Inc. All rights reserved. All trademarks are the property of Thermo Fisher Scientific and its subsidiaries unless otherwise specified. AB72323-EN 0417S
Find out more at www.thermofisher.com/FoodIntegrity

9
Dyes
Application summary AN 245
Fast HPLC analysis of dyes in foods and beverages
OverviewIn the food and beverage industries, dyes may be used to make food more appealing, hide defects, or to strengthen consumer perception of the association between color and flavor. While many dyes exist, only a few have been approved for use in foods and beverages.
MethodThis application note demonstrates fast separation of 10 dyes in less than 5 minutes using a Thermo Scientific™ Acclaim™ PA2 column, which is suited to resolving mixtures of compounds with a wide range of hydrophobicities, including very polar compounds.
ConclusionThis method was used to determine the quantity of food dyes in six soft drinks and a gelatin dessert. It is suitable for the fast (< 5 minutes) analysis of food and beverage samples that have both approved and illegal dyes.
Thermo Scientific™ UltiMate™ 3000 Rapid Separation system
Read the full application note.
Part Number Description
066277Acclaim PA2 (3 μm) column in a 3 × 75 mm format
© 2017 Thermo Fisher Scientific Inc. All rights reserved. All trademarks are the property of Thermo Fisher Scientific and its subsidiaries unless otherwise specified. AB72323-EN 0417S
Find out more at www.thermofisher.com/FoodIntegrity
10
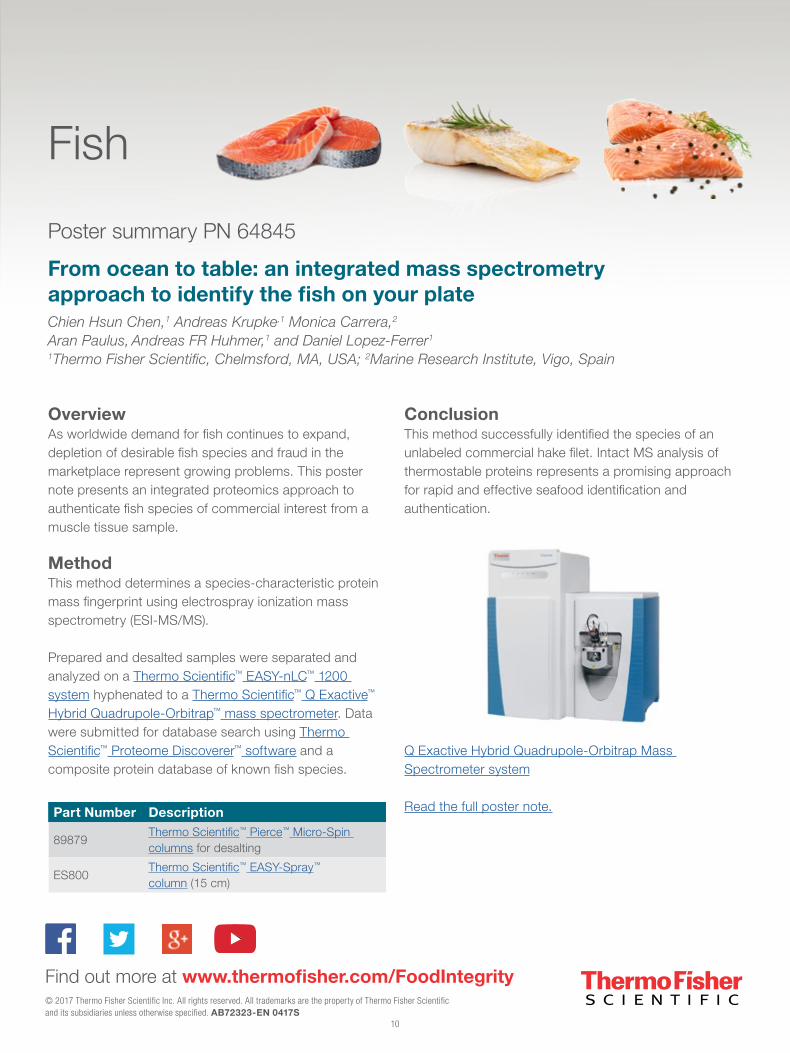
Fish
Poster summary PN 64845
From ocean to table: an integrated mass spectrometry approach to identify the fish on your plateChien Hsun Chen,1 Andreas Krupke,1 Monica Carrera,2 Aran Paulus, Andreas FR Huhmer,1 and Daniel Lopez-Ferrer1
1Thermo Fisher Scientific, Chelmsford, MA, USA; 2Marine Research Institute, Vigo, Spain
OverviewAs worldwide demand for fish continues to expand, depletion of desirable fish species and fraud in the marketplace represent growing problems. This poster note presents an integrated proteomics approach to authenticate fish species of commercial interest from a muscle tissue sample.
MethodThis method determines a species-characteristic protein mass fingerprint using electrospray ionization mass spectrometry (ESI-MS/MS).
Prepared and desalted samples were separated and analyzed on a Thermo Scientific™ EASY-nLC™ 1200 system hyphenated to a Thermo Scientific™ Q Exactive™ Hybrid Quadrupole-Orbitrap™ mass spectrometer. Data were submitted for database search using Thermo Scientific™ Proteome Discoverer™ software and a composite protein database of known fish species.
ConclusionThis method successfully identified the species of an unlabeled commercial hake filet. Intact MS analysis of thermostable proteins represents a promising approach for rapid and effective seafood identification and authentication.
Q Exactive Hybrid Quadrupole-Orbitrap Mass Spectrometer system
Read the full poster note.Part Number Description
89879Thermo Scientific™ Pierce™ Micro-Spin columns for desalting
ES800Thermo Scientific™ EASY-Spray™ column (15 cm)
© 2017 Thermo Fisher Scientific Inc. All rights reserved. All trademarks are the property of Thermo Fisher Scientific and its subsidiaries unless otherwise specified. AB72323-EN 0417S
Find out more at www.thermofisher.com/FoodIntegrity

11
Fruit
Application summary AN 281
Rapid and sensitive determination of anthocyanins in bilberries using UHPLC
OverviewBilberry extracts are widely used in nutritional supplements and pharmaceuticals for improving visual acuity and treating circulatory disorders. Bilberries cannot be cultivated and are difficult to harvest and process, making them one of the most expensive botanical ingredients in the health food industry. Chemical and pharmacological studies have identified anthocyanins as the main components responsible for their therapeutic effect.
This application note presents a rapid, simple, and reproducible method to determine anthocyanins in bilberry-based nutraceutical products to ensure their potency.
MethodThis method uses HPLC with a high-resolution silica-based C18 column and photodiode array detection to separate, detect, and quantify anthocyanins in several commercially available bilberry nutritional supplements.
ConclusionThis method accurately separated and quantified anthocyanins in commercially available nutraceutical products with minimal sample preparation and in only 30 minutes, compared to competing methods with run times of 50 minutes or greater.
Thermo Scientific™ UltiMate™ 3000 Rapid Separation system
Read the full application note.Part Number Description
059130Thermo Scientific™ Acclaim™ RSLC 120 C18, 2.2 μm, analytical column, 2.1 × 150 mm
© 2017 Thermo Fisher Scientific Inc. All rights reserved. All trademarks are the property of Thermo Fisher Scientific and its subsidiaries unless otherwise specified. AB72323-EN 0417S
Find out more at www.thermofisher.com/FoodIntegrity

12
Halal foods
Application summary AN 646
Determination of meat authenticity using a comprehensive targeted proteomic strategy and high-resolution mass spectrometry
OverviewDue to the internationalization of food production and distribution, there has been a significant increase of food fraud in recent years. For example, in 2013, horse and pig DNAs were detected in beef products sold by several retailers.
This application brief presents a sensitive and robust liquid chromatography/mass spectrometry (HRAM LC-MS) method for the identification and detection of marker proteins in raw meat samples.
MethodThis method was performed using a Thermo Scientific™ UltiMate™ 3000 RSLC system coupled to a benchtop Thermo Scientific™ Q Exactive™ Hybrid Quadrupole-Orbitrap™ Mass Spectrometer.
ConclusionThis targeted method enabled the detection of undesired meat species down to 1% (w/w) of the entire sample with a potential to go significantly lower using straightforward sample enrichment techniques.
Q Exactive Hybrid Quadrupole-Orbitrap Mass Spectrometer system
Read the full application note.Part Number Description
72205-101030Thermo Scientific™ BioBasic™ C8 column (5 μm, 100 × 1 mm)
© 2017 Thermo Fisher Scientific Inc. All rights reserved. All trademarks are the property of Thermo Fisher Scientific and its subsidiaries unless otherwise specified. AB72323-EN 0417S
Find out more at www.thermofisher.com/FoodIntegrity

13
Honey
Application summary AN 1158
HPAE-PAD determination of carbohydrates in honey to evaluate samples for quality and adulteration
Manali Aggrawal and Jeffrey Rohrer, Sunnyvale, CA, USA
OverviewThe sugar composition of honey is mainly dependent on its floral source. It is also affected by climate, processing, and storage conditions. Studies have shown that the amount of sucrose can be used to differentiate the adulteration of honey samples by sugar syrups. Therefore, carbohydrate analysis is important as a honey quality parameter and for floral origin determinations.
This application note presents a fast, high-resolution method to assay fructose and glucose, and to measure the entire profile of di- and trisaccharides in honey using high-performance anion exchange chromatography coupled with pulsed amperometric detection (HPAE-PAD).
MethodSugars in 12 honey samples were determined using HPAE-PAD on a Thermo Scientific™ Dionex™ ICS-5000+ Capillary HPIC™ system. The separation uses a
Thermo Scientific™ Dionex™ CarboPac™ PA210-4μm column, which was developed to provide fast, high-resolution separations for most mono- through tetrasaccharides in food and beverage samples.
ConclusionThis HPAE-PAD method successfully performs the sugar analysis of 12 commercial honey samples. In addition, HPAE-PAD profiling provides a robust method to study the adulteration of honey samples with commercial sugar syrups. Use of the Dionex CarboPac PA210-4μm column enables the separation of 15 sugars in honey with minimal sample preparation and an overall cycle time of 45 minutes.
Dionex ICS-5000+ Capillary HPIC system
Read the full application note.
Part Number Description
088953Dionex CarboPac PA210-4μm 4 × 150 mm analytical column
088955Dionex CarboPac PA210-4μm 4 × 30 mm guard column
075778Thermo Scientific™ Dionex™ EGC 500 KOH Eluent Generator cartridge
© 2017 Thermo Fisher Scientific Inc. All rights reserved. All trademarks are the property of Thermo Fisher Scientific and its subsidiaries unless otherwise specified. AB72323-EN 0417S
Find out more at www.thermofisher.com/FoodIntegrity

14
Honey
Application summary AN 30177
EA-IRMS: detection of honey adulteration
Oliver Kracht and Andreas Hilkert, Thermo Fisher Scientific, Bremen, Germany
OverviewHoney is subject to fraud by adulteration with low price invert sugar syrups. Saccharides in syrups derived from cane, corn or beet sugar are difficult to distinguish from those in pure honeys.
This application note demonstrates stable isotope analysis of honey as a means to detect adulteration, using an elemental analyzer (EA) coupled to an isotope ratio mass spectrometer (IRMS).
MethodDetermination of 13C/12C isotope ratio was undertaken on a Thermo Scientific™ EA IsoLink™ IRMS system.
ConclusionThe EA IsoLink IRMS system ensures reproducible δ13C analyses for the detection of honey adulteration with C4-syrups according to the AOAC (Association of Analytical Communities) 998.12 guideline. Compound-specific isotope analysis of individual sugars combined with bulk honey analysis enables the detection of adulteration with C3-sugar, e.g., rice syrup. The same method can be used for other products, such as fruit juices and wine.
EA IsoLink IRMS system
Read the full application note.
© 2017 Thermo Fisher Scientific Inc. All rights reserved. All trademarks are the property of Thermo Fisher Scientific and its subsidiaries unless otherwise specified. AB72323-EN 0417S
Find out more at www.thermofisher.com/FoodIntegrity

15
Honey
Application summary AN 270
Determination of hydroxymethylfurfural in honey and biomass
Lipika Basumallick and Jeff Rohrer, Thermo Fisher Scientific, Sunnyvale, CA, USA
OverviewHydroxymethylfurfural (HMF) is a water-soluble heterocyclic organic compound derived from sugars. Naturally found in very low concentrations in fresh sugar-containing foods, HMF is also formed during extended food storage under certain conditions, and can serve as an indicator of excessive heat-treatment, spoilage, and of possible adulteration with other sugars or syrups.
This application note describes a method using high-performance anion-exchange chromatography with pulsed amperometric detection (HPAE-PAD) for the accurate determination of HMF in foods and biomass.
MethodThis method is performed on a Thermo Scientific™ Dionex™ ICS-5000+ Capillary HPIC™ system with a Thermo Scientific™ Dionex™ CarboPac™ PA1 column,
electrolytically generated hydroxide eluent, and electrochemical detection with disposable Au-on-polytetra-fluoroethylene (PTFE) working electrodes.
ConclusionThe method is shown to have a broad linear range, high precisions, and low detection limits. It is accurate and reliable, and should be applicable to online monitoring of HMF levels in food and biomass applications.
Dionex ICS-5000+ Capillary HPIC system
Read the full application note.
Part Number Description
035391Dionex CarboPac PA1, analytical column, 4 × 250 mm
043096Dionex CarboPac PA1, guard column, 4 × 50 mm
058900Thermo Scientific™ Dionex™ EGC II KOH cartridge
© 2017 Thermo Fisher Scientific Inc. All rights reserved. All trademarks are the property of Thermo Fisher Scientific and its subsidiaries unless otherwise specified. AB72323-EN 0417S
Find out more at www.thermofisher.com/FoodIntegrity

16
Honey
Application summary AN 30024
Authenticity control of honey using the Thermo Scientific LC IsoLink LC-IRMS
Andreas W. Hilkert, Michael Krummen, and Dieter Juchelka, Thermo Fisher Scientific, Bremen, Germany
OverviewSugars can carry information of the origin and processing of food products containing them. If isotopically labeled they tell us about their pathways and metabolism.
This application develops a method to determine 13C/12C isotope ratios of carbohydrates for the authentication of honey using liquid chromatography coupled with isotope ratio mass spectrometry (LC-IRMS).
MethodIsotope ratio monitoring-LC-MS (or LC-IRMS) was performed on the Thermo Scientific™ LC IsoLink™ Interface for IRM-LC-MS.
ConclusionUsing this method, small amounts in complex mixtures can be analyzed for compound-specific isotope analysis without extensive preparation or derivatization. The analysis of sugars by LC-IRMS results in accurate, precise and fast results.
© 2017 Thermo Fisher Scientific Inc. All rights reserved. All trademarks are the property of Thermo Fisher Scientific and its subsidiaries unless otherwise specified. AB72323-EN 0417S
Find out more at www.thermofisher.com/FoodIntegrity
LC IsoLink Interface for IRM-LC-MS
Read the full application note.

17
Honey
Application summary CAN 123
Sugars in honey using HPAE-PAD: What is the best column?
Katrin Hostettler,1 Robert Brogioli,1 Silvio Arpagaus,1 Beate Müller-Werner,2 Detlef Jensen2
1Department of Food Control and Consumer Protection, Lucerne, Switzerland 2Thermo Fisher Scientific, Switzerland
OverviewThe sugar content in honey varies depending on region of production, flower, and feeding practice of the bees. For this reason, the quantification of a broad variety of sugars in honey samples is a useful tool for verifying product declaration and labeling as well as uncovering honey adulteration.
This customer application note compares the performance of three columns for the determination of sugars in different honey samples using high-performance anion-exchange chromatography with pulsed amperometry detection (HPAE-PAD).
MethodThis study compares the following column sets using HPAE-PAD.
ConclusionThe Thermo Scientific™ Dionex™ CarboPac™ PA100 analytical & guard column allows the separation of fructose, glucose, sucrose, turanose, maltose, trehalose, isomaltose, erlose, raffinose, and melezitose with minimum sample preparation and an overall cycle time of 38 minutes. The detection method is sensitive enough to allow the determination of lower concentrations of carbohydrates, while also being robust enough to handle higher concentrations of the major components glucose and fructose.
Thermo Scientific™ Dionex™ ICS-5000+ Reagent-Free HPIC system
Read the full application note.
Part Number Description062896 Dionex CarboPac PA200 column, 3 × 250 mm
062895 Dionex CarboPac PA200 guard, 3 × 50 mm
057180 Dionex CarboPac PA10 column, 2 × 250 mm
057181 Dionex CarboPac PA10 guard, 2 × 50 mm
057182 Dionex CarboPac PA100 column, 2 × 250 mm
057183 Dionex CarboPac PA100 guard, 2 × 50 mm
© 2017 Thermo Fisher Scientific Inc. All rights reserved. All trademarks are the property of Thermo Fisher Scientific and its subsidiaries unless otherwise specified. AB72323-EN 0417S
Find out more at www.thermofisher.com/FoodIntegrity

18
Honey
Poster summary PN 30397
Food and beverage fraud prevention using stable isotope fingerprints
Christopher Brodie, Oliver Kracht, Dieter Juchelka, Jens Radke, and Andreas HilkertThermo Fisher Scientific, Germany
OverviewFood and beverage fraud can be detected using stable isotope measurements, which can differentiate between food and beverage samples which otherwise share identical chemical composition.
In this poster note, data are shown demonstrating how stable isotope fingerprints offer conclusive answers on questions associated with origin, adulteration, and labeling of food and beverage products.
MethodThis study presents examples of data showing food and beverage adulteration, and differences between foods grown organically and not organically. For wine analysis, the samples are analyzed using isotope ratio mass spectrometry (IRMS) on a Thermo Scientific™ GasBench II system interfaced with a Thermo Scientific™ DELTA V™ IRMS system. Organic and non-organic vegetables are analyzed with the Thermo Scientific™ EA IsoLink™ IRMS system (elemental analyzer IRMS or EA-IRMS). Analysis for the origin of tequila is done with the Thermo Scientific™ GC IsoLink II™ Interface for gas chromatography coupled with IRMS (GC-IRMS). Finally, honey is analyzed with the Thermo Scientific™ LC IsoLink™ Interface for liquid chromatography coupled with IRMS (IRM-LC-MS).
© 2017 Thermo Fisher Scientific Inc. All rights reserved. All trademarks are the property of Thermo Fisher Scientific and its subsidiaries unless otherwise specified. AB72323-EN 0417S
Find out more at www.thermofisher.com/FoodIntegrity
ConclusionStable isotope values can provide conclusive information on the origin of food and beverage products, making it possible to identify whether a product was grown organically, where a product originated, and whether product composition has changed from its raw composition.
Thermo Scientific™ TRACE™ 1310 GC, GC IsoLink II™ system
Read the full poster note.

19
Edible oils
Application summary AB 30276
EA-IRMS: Detection of squalane from animal and vegetable sources
OverviewSqualane and its natural precursor squalene are widely used in cosmetic products such as skin moisturizers. Many consumers now prefer renewably sourced, animal-free cosmetics. The two major source materials for squalene are shark liver oil and olive oil, which exhibit significantly distinct carbon isotopic compositions, and thus, can provide a means to identify the source material.
This application note presents a method for distinguishing origins of squalane using an elemental analyzer coupled to an isotope ratio mass spectrometer (EA-IRMS).
MethodCarbon isotope compositions of squalene and squalane from shark liver oil, olive oil, and mixtures of both oils were measured by the Thermo Scientific™ EA IsoLink™ IRMS system.
ConclusionThis method determined a significant difference in δ13C between the two sources of squalane. The high precision of EA-IRMS facilitates reliable and conclusive quantifications of the contents of squalane derived from olive oil versus shark liver oil in mixtures.
Thermo Scientific™ EA IsoLink™ IRMS system
Read the full application brief.
© 2017 Thermo Fisher Scientific Inc. All rights reserved. All trademarks are the property of Thermo Fisher Scientific and its subsidiaries unless otherwise specified. AB72323-EN 0417S
Find out more at www.thermofisher.com/FoodIntegrity

20
Edible oils
Infographic
Quality
Safety
Authenticity
Process monitoring
PESTICIDESSTIGMASTADIENESFATTY ACID ETHYL ESTERS (FAEES)
TRACE METALSEQUIVALENT CARBON NUMBER (ECN)
FREE FATTY ACIDS (FFA)
DIGLYCERIDESHALOGENATED HYDROCARBONS
FATTY ACID PROFILE (FAP)
TOTAL STEROLSORGANOLEPTIC CONTENT
TRANS ISOMERSDI- AND TRI-ACETYL GLYCEROL (DAG)
PYROPHEOPHYTINS (PPP)MINERAL OIL COMPONENTS (MOSH/MOAH)
PEROXIDE VALUE (PV)FATTY ACID METHYL ESTERS (FAMES)
WAX CONTENT
Olive oil should ONLY be olive oil.The olive oil industry faces increased pressure to prove that its products live up to the quality and origin on the bottle. Consumers are now more aware than ever, that olive oils may not always be what is claimed or advertised. Our separation and detection technologies provide ideal solutions to address these challenges the olive oil industry faces today.
WHAT’S POTENTIALLY IN MY BOTTLE?
KEY AREAS IN OLIVE OIL TESTING
YOUR BRAND IS EVERYTHING.ThermoFisher.com/EdibleOilTesting
©2016 Thermo Fisher Scientific Inc. All rights reserved. ST72120-EN 0716M
Nutritional value per 100 g (3.5 oz)
Energy 3,699 kJ (884 kcal)
Carbohydrates 0 g
Fat 100 g
Saturated 14 g
Monounsaturated 73 g
Polyunsaturated 11 g
omega‑3 0.8 g
omega‑6 9.8 g
Protein 0 g
Vitamins
Vitamin E 14 mg (93%)
Vitamin K 60 μg (57%)
Minerals
Iron 0.56 mg (4%)
NUTRITION FACTS
Unitsμg = micrograms • mg = milligrams
IU = International units
Percentages are roughly approximated using US recommendations for adults.Source: USDA Nutrient Database
BRANCH OF TECHNIQUES
Liquid Chromatography
Elemental Analysis
Gas Chromatography
Ion Chromatography
Portable Devices
NIR, UV-VIS SpectroscopyMass
SpectrometrySample
Preparation
Full infographic
21
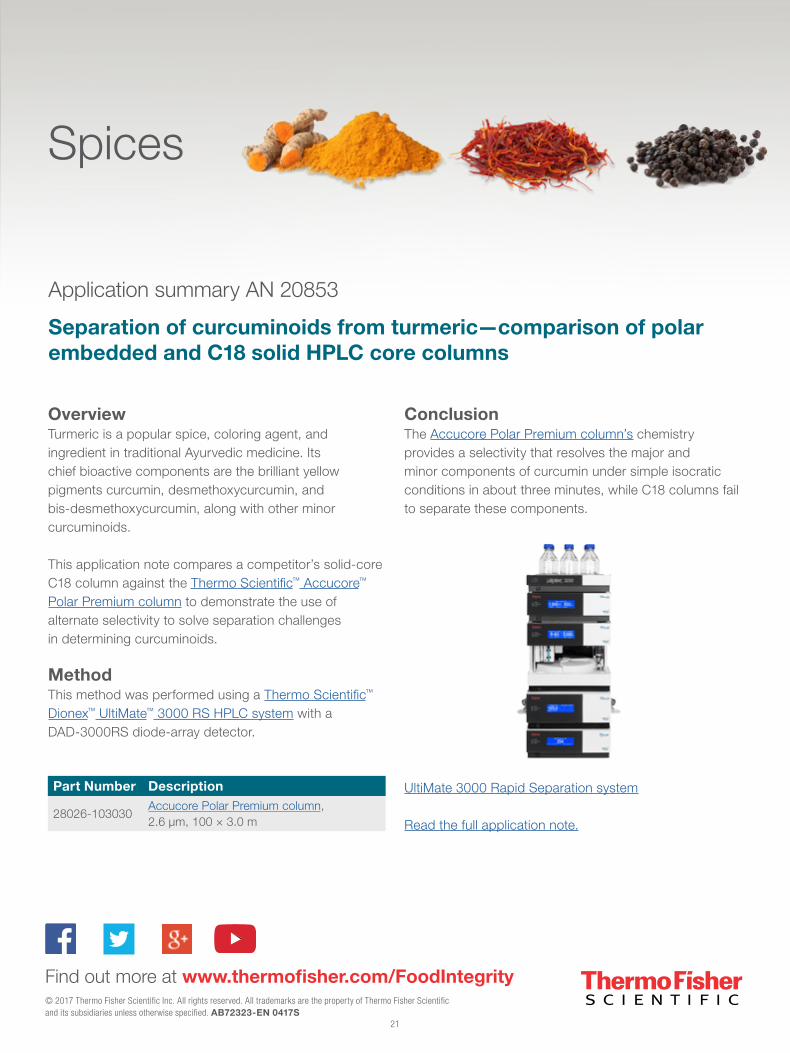
Spices
Application summary AN 20853
Separation of curcuminoids from turmeric—comparison of polar embedded and C18 solid HPLC core columns
OverviewTurmeric is a popular spice, coloring agent, and ingredient in traditional Ayurvedic medicine. Its chief bioactive components are the brilliant yellow pigments curcumin, desmethoxycurcumin, and bis-desmethoxycurcumin, along with other minor curcuminoids.
This application note compares a competitor’s solid-core C18 column against the Thermo Scientific™ Accucore™ Polar Premium column to demonstrate the use of alternate selectivity to solve separation challenges in determining curcuminoids.
MethodThis method was performed using a Thermo Scientific™ Dionex™ UltiMate™ 3000 RS HPLC system with a DAD-3000RS diode-array detector.
ConclusionThe Accucore Polar Premium column’s chemistry provides a selectivity that resolves the major and minor components of curcumin under simple isocratic conditions in about three minutes, while C18 columns fail to separate these components.
UltiMate 3000 Rapid Separation system
Read the full application note.
Part Number Description
28026-103030Accucore Polar Premium column, 2.6 μm, 100 × 3.0 m
© 2017 Thermo Fisher Scientific Inc. All rights reserved. All trademarks are the property of Thermo Fisher Scientific and its subsidiaries unless otherwise specified. AB72323-EN 0417S
Find out more at www.thermofisher.com/FoodIntegrity
22
Spices
Application summary AN 287
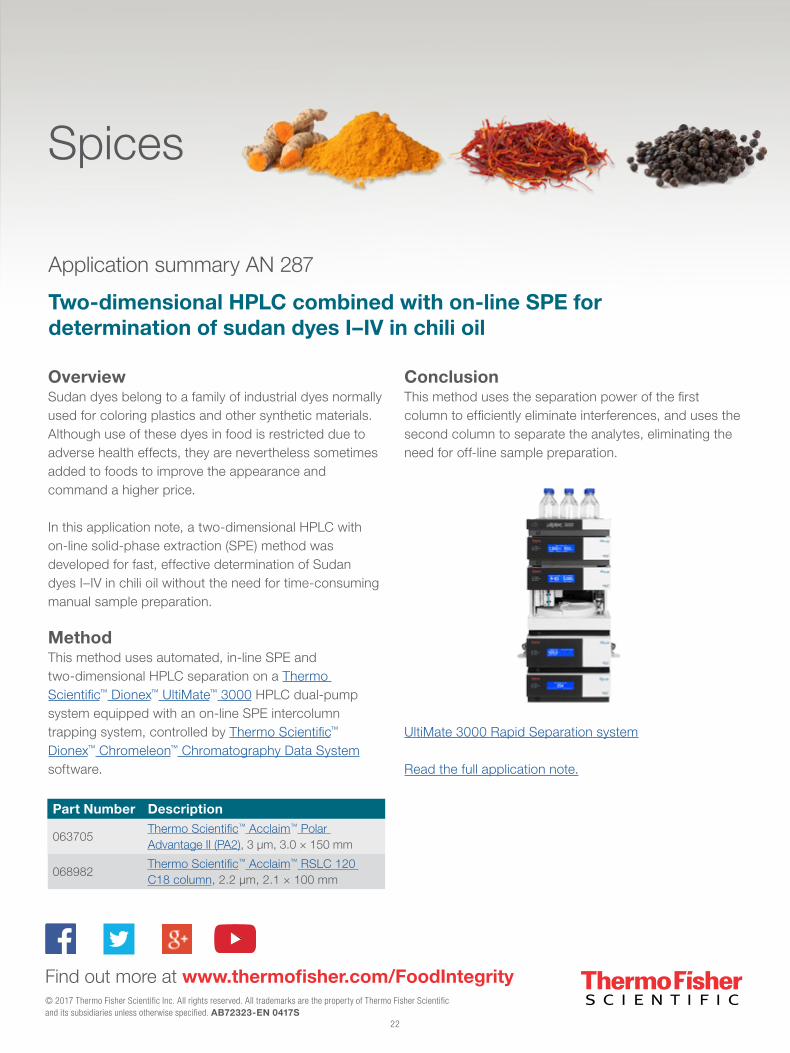
Two-dimensional HPLC combined with on-line SPE for determination of sudan dyes I–IV in chili oil
OverviewSudan dyes belong to a family of industrial dyes normally used for coloring plastics and other synthetic materials. Although use of these dyes in food is restricted due to adverse health effects, they are nevertheless sometimes added to foods to improve the appearance and command a higher price.
In this application note, a two-dimensional HPLC with on-line solid-phase extraction (SPE) method was developed for fast, effective determination of Sudan dyes I–IV in chili oil without the need for time-consuming manual sample preparation.
MethodThis method uses automated, in-line SPE and two-dimensional HPLC separation on a Thermo Scientific™ Dionex™ UltiMate™ 3000 HPLC dual-pump system equipped with an on-line SPE intercolumn trapping system, controlled by Thermo Scientific™ Dionex™ Chromeleon™ Chromatography Data System software.
ConclusionThis method uses the separation power of the first column to efficiently eliminate interferences, and uses the second column to separate the analytes, eliminating the need for off-line sample preparation.
UltiMate 3000 Rapid Separation system
Read the full application note.
Part Number Description
063705Thermo Scientific™ Acclaim™ Polar Advantage II (PA2), 3 μm, 3.0 × 150 mm
068982Thermo Scientific™ Acclaim™ RSLC 120 C18 column, 2.2 μm, 2.1 × 100 mm
© 2017 Thermo Fisher Scientific Inc. All rights reserved. All trademarks are the property of Thermo Fisher Scientific and its subsidiaries unless otherwise specified. AB72323-EN 0417S
Find out more at www.thermofisher.com/FoodIntegrity
23
SpicesApplication summary AB 163
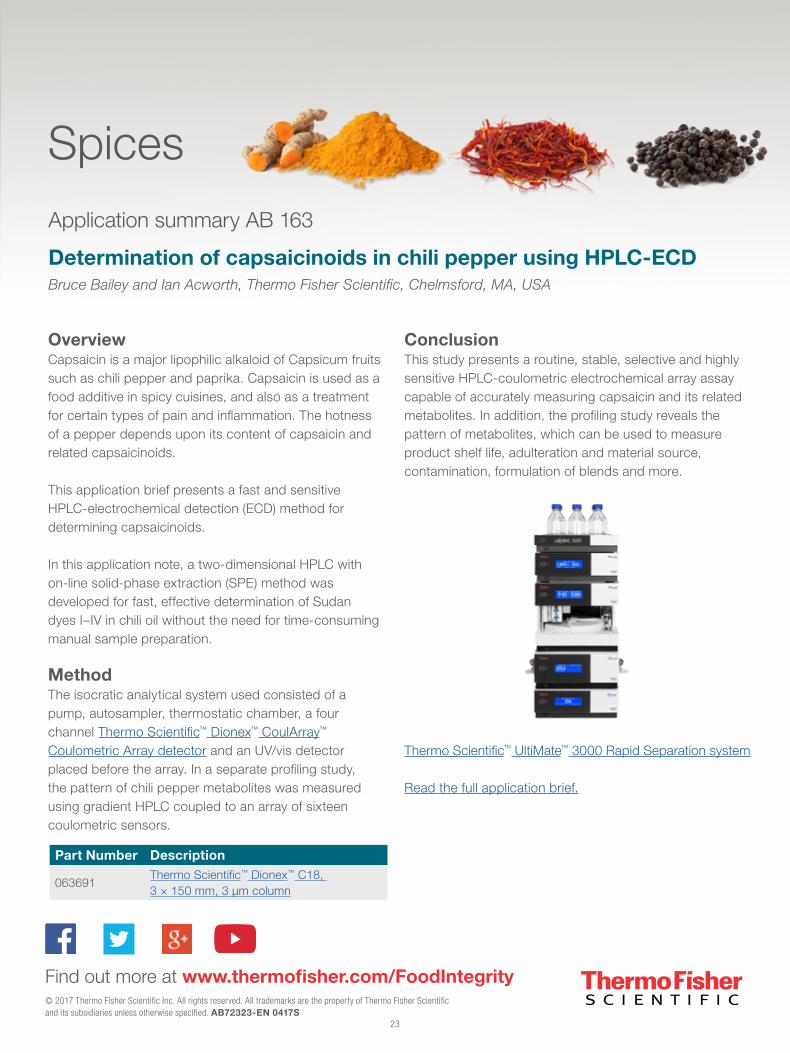
Determination of capsaicinoids in chili pepper using HPLC-ECDBruce Bailey and Ian Acworth, Thermo Fisher Scientific, Chelmsford, MA, USA
OverviewCapsaicin is a major lipophilic alkaloid of Capsicum fruits such as chili pepper and paprika. Capsaicin is used as a food additive in spicy cuisines, and also as a treatment for certain types of pain and inflammation. The hotness of a pepper depends upon its content of capsaicin and related capsaicinoids.
This application brief presents a fast and sensitive HPLC-electrochemical detection (ECD) method for determining capsaicinoids.
In this application note, a two-dimensional HPLC with on-line solid-phase extraction (SPE) method was developed for fast, effective determination of Sudan dyes I–IV in chili oil without the need for time-consuming manual sample preparation.
MethodThe isocratic analytical system used consisted of a pump, autosampler, thermostatic chamber, a four channel Thermo Scientific™ Dionex™ CoulArray™ Coulometric Array detector and an UV/vis detector placed before the array. In a separate profiling study, the pattern of chili pepper metabolites was measured using gradient HPLC coupled to an array of sixteen coulometric sensors.
ConclusionThis study presents a routine, stable, selective and highly sensitive HPLC-coulometric electrochemical array assay capable of accurately measuring capsaicin and its related metabolites. In addition, the profiling study reveals the pattern of metabolites, which can be used to measure product shelf life, adulteration and material source, contamination, formulation of blends and more.
Thermo Scientific™ UltiMate™ 3000 Rapid Separation system
Read the full application brief.
Part Number Description
063691Thermo Scientific™ Dionex™ C18, 3 × 150 mm, 3 μm column
© 2017 Thermo Fisher Scientific Inc. All rights reserved. All trademarks are the property of Thermo Fisher Scientific and its subsidiaries unless otherwise specified. AB72323-EN 0417S
Find out more at www.thermofisher.com/FoodIntegrity

24
Spices
Application summary AB 168
Deconvolution of curry powder constituents using HPLC-ECDPaul Gamache and Ian Acworth, Thermo Fisher Scientific, Chelmsford, MA, USA
OverviewUnderstanding the dynamics of a mixture of complex materials such as curry powders poses difficult analytical problems.
This application brief develops develop a robust and sensitive HPLC-electrochemical detection (ECD) method for separating and analyzing non-volatile phenols, flavonoids and related compounds in curry powder.
MethodThis study uses HPLC coupled with coulometric array detection to produce sensitive and selective data, creating three-dimensional chromatograms, or analyte patterns, for each sample. The method uses a gradient analytical system consisted of two pumps, an autosampler, a 16-channel Thermo Scientific™ Dionex™ UltiMate™ 3000 CoulArray™ Coulometric Array detector and software to deconvolute the samples.
Conclusion3D data sets describing the sample and its components are generated in real time. The data can then be analyzed in a number of ways to gain information about ingredient inter-relationships, degradation or contamination, or consistency in the ratios of starting materials. Patterns of components in the mixture can be further analyzed using external pattern recognition software.
Thermo Scientific™ UltiMate™ 3000 Rapid Separation system
Read the full application brief.
Part Number Description
059148Thermo Scientific™ Dionex™ C18, 4.6 × 150 mm, 5 μm column
© 2017 Thermo Fisher Scientific Inc. All rights reserved. All trademarks are the property of Thermo Fisher Scientific and its subsidiaries unless otherwise specified. AB72323-EN 0417S
Find out more at www.thermofisher.com/FoodIntegrity

25
Beverages
Application summary AN 1065
Gradient HPLC method for analysis of beer polyphenols, proanthocyanidins, and bitter acids using a novel spectro-electro array platformPaul A. Ullucci, Ian N. Acworth, Marc Plante, Bruce A. Bailey, and Christopher CraftsThermo Fisher Scientific, Chelmsford, MA, US
OverviewBeer contains a complex mixture of phenolic compounds, bitter acids, and polyphenols extracted from the starch source and hops. These elements contribute to the flavor, including bitterness, as well as stability, and in some cases, degradation of the beverage.
This application note develops gradient high-performance liquid chromatography (HPLC) methods using a spectro-electro array platform to measure specific analytes in beer samples and—in a metabolomic approach—to distinguish between different beer samples and study beer stability.
MethodThis study uses a Thermo Scientific™ Dionex™ UltiMate™ 3000 HPLC system equipped with a Thermo Scientific™
Dionex™ UltiMate™ 3000 Rapid Separation Diode Array Detector, Thermo Scientific™ Dionex™ UltiMate™ 3000 CoulArray™ Coulometric Array detector, and Model 5011A High Sensitivity Analytical Cell.
ConclusionThree methods are developed: one for determination of polyphenols, a second for determination of bitter acids, and a metabolomics approach. Method 1 can be used in a targeted approach to accurately and sensitively measure numerous phenols, phenolic acids, and polyphenols in beer and other samples. Method 2 enables sensitive, targeted measurement of multiple bitter acids in a single run. Metabolomic approaches can be used to differentiate between different beers.
UltiMate 3000 Rapid Separation system
Read the full application note.
Part Number Description
063691Thermo Scientific™ Acclaim™ 120 C18, 3 μm analytical column (3.0 × 150 mm)
© 2017 Thermo Fisher Scientific Inc. All rights reserved. All trademarks are the property of Thermo Fisher Scientific and its subsidiaries unless otherwise specified. AB72323-EN 0417S
Find out more at www.thermofisher.com/FoodIntegrity

26
Beverages
Application summary AB 201
Determination of carbohydrates in coffee using a compact ion chromatography systemSachin Patil and Jeff Rohrer, Thermo Fisher Scientific, Sunnyvale, CA, USA
OverviewCarbohydrates constitute as much as 50% of raw coffee beans, and contribute to the flavor, viscosity, and aromas of the beverage. They are also useful tracers for assessing the authenticity of soluble (instant) coffee.
This application proof note demonstrates a fast, high-resolution method for determining common sugars of interest in foods and beverages using high-performance anion-exchange (HPAE) chromatography with pulsed amperometric detection (PAD).
MethodThis study uses HPAE-PAD on a Thermo Scientific™ Dionex™ Integrion™ HPIC™ system. The Thermo Scientific™ Dionex™ CarboPac™ SA10 column used in the related Thermo Scientific™ Application Note 280 (AN280) is replaced with the Dionex CarboPac SA10-4μm column which delivers faster and greater resolution separations.
ConclusionThis study examines the effect of brewing heat and time on sugar content of coffee samples.
Dionex Integrion HPIC system
Read the full application note.
Part Number Description
088233 (standard) 088235 (microbore)
Dionex CarboPac SA10-4μm analytical column
088234 (standard)088236 (microbore)
Dionex CarboPac SA10-4μm guard column
© 2017 Thermo Fisher Scientific Inc. All rights reserved. All trademarks are the property of Thermo Fisher Scientific and its subsidiaries unless otherwise specified. AB72323-EN 0417S
Find out more at www.thermofisher.com/FoodIntegrity
27
Beverages
Application summary AN 280
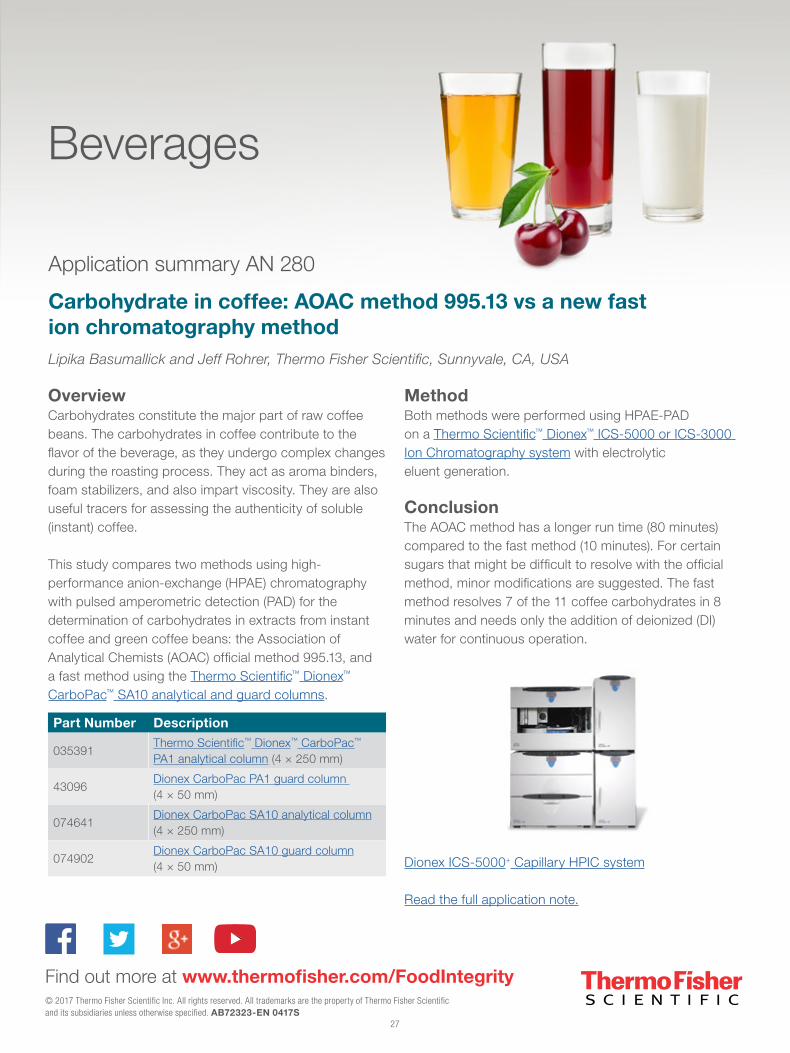
Carbohydrate in coffee: AOAC method 995.13 vs a new fast ion chromatography methodLipika Basumallick and Jeff Rohrer, Thermo Fisher Scientific, Sunnyvale, CA, USA
OverviewCarbohydrates constitute the major part of raw coffee beans. The carbohydrates in coffee contribute to the flavor of the beverage, as they undergo complex changes during the roasting process. They act as aroma binders, foam stabilizers, and also impart viscosity. They are also useful tracers for assessing the authenticity of soluble (instant) coffee.
This study compares two methods using high-performance anion-exchange (HPAE) chromatography with pulsed amperometric detection (PAD) for the determination of carbohydrates in extracts from instant coffee and green coffee beans: the Association of Analytical Chemists (AOAC) official method 995.13, and a fast method using the Thermo Scientific™ Dionex™ CarboPac™ SA10 analytical and guard columns.
MethodBoth methods were performed using HPAE-PAD on a Thermo Scientific™ Dionex™ ICS-5000 or ICS-3000 Ion Chromatography system with electrolytic eluent generation.
ConclusionThe AOAC method has a longer run time (80 minutes) compared to the fast method (10 minutes). For certain sugars that might be difficult to resolve with the official method, minor modifications are suggested. The fast method resolves 7 of the 11 coffee carbohydrates in 8 minutes and needs only the addition of deionized (DI) water for continuous operation.
Dionex ICS-5000+ Capillary HPIC system
Read the full application note.
Part Number Description
035391Thermo Scientific™ Dionex™ CarboPac™ PA1 analytical column (4 × 250 mm)
43096Dionex CarboPac PA1 guard column (4 × 50 mm)
074641Dionex CarboPac SA10 analytical column (4 × 250 mm)
074902Dionex CarboPac SA10 guard column (4 × 50 mm)
© 2017 Thermo Fisher Scientific Inc. All rights reserved. All trademarks are the property of Thermo Fisher Scientific and its subsidiaries unless otherwise specified. AB72323-EN 0417S
Find out more at www.thermofisher.com/FoodIntegrity

28
Beverages
Application summary AU 202
A fast method for sugar analysis of instant coffee samplesSachin Patil and Jeffrey Rohrer, Thermo Fisher Scientific, Sunnyvale, CA
OverviewCarbohydrates are an important constituent of the coffee beans. They undergo complex changes during roasting and can affect the final taste and aroma of the coffee. Carbohydrate content is also used for detecting coffee adulteration.
The current study updates a fast method for determining carbohydrates in coffee described in Thermo Scientific™ Application Note 280 (AN280) to use the Thermo Scientific™ Dionex™ CarboPac™ SA10-4μm column.
MethodThis method quickly determines sugars in instant coffee using a Thermo Scientific™ Dionex™ Integrion™
HPIC™ system with electrolytically generated eluent and electrochemical detection.
ConclusionThe smaller particle size of the Dionex CarboPac SA10-4μm column allows higher resolution separation of nine dominant sugars within 6 minutes. The method demonstrated excellent precision and accuracy, making it an ideal candidate for the fast analysis of coffee extracts to determine both the amount of free carbohydrates and total amount carbohydrates.
Dionex Integrion HPIC system
Read the full application update.
Part Number Description
088233 Dionex CarboPac SA10-4μm column
088234Dionex CarboPac SA10-4μm guard column 4 × 50
075778Thermo Scientific™ Dionex™ EGC 500 KOH Eluent Generator cartridge
088662Thermo Scientific™ Dionex™ ATC-600 Continuously Regenerated Anion Trap column
© 2017 Thermo Fisher Scientific Inc. All rights reserved. All trademarks are the property of Thermo Fisher Scientific and its subsidiaries unless otherwise specified. AB72323-EN 0417S
Find out more at www.thermofisher.com/FoodIntegrity

29
Beverages
Application summary AB 127
Determination of carbohydrates in fruit juice using capillary high-performance anion-exchange chromatographyFei Pang, Terri Christison, and Linda Lopez, Thermo Fisher Scientific, Sunnyvale, CA, USA
OverviewHigh-performance anion-exchange chromatography (HPAE) coupled with pulsed amperometric detection (PAD) is a well-established technique to identify and quantify carbohydrates in food and beverage samples.
This application brief presents a method to simplify routine determination of carbohydrates in foods and beverages using a Thermo Scientific™ Reagent-Free™ ion chromatography (RFIC™) system.
MethodThis method uses a Thermo Scientific™ Dionex™
ICS-5000 capillary IC system with automatic eluent generation and PAD.
Part Number Description
072072Thermo Scientific™ Dionex™ CarboPac™ PA20 capillary column, 0.4 × 150 mm
© 2017 Thermo Fisher Scientific Inc. All rights reserved. All trademarks are the property of Thermo Fisher Scientific and its subsidiaries unless otherwise specified. AB72323-EN 0417S
Find out more at www.thermofisher.com/FoodIntegrity
ConclusionGlucose, fructose, and sucrose in fruit juices are well resolved following this method. Capillary RFIC systems expand and simplify the application of ion chromatography to routine carbohydrate analysis for the food and beverage industries by enhancing mass sensitivity, ease-of-use, and reproducibility.
Dionex ICS-5000+ Capillary HPIC system
Read the full application brief.

30
Beverages
Application summary AN 143
Determination of organic acids in fruit juices
Swati Gokhale and Jeff Rohrer, Thermo Fisher Scientific, Inc.
OverviewThe presence and concentrations of organic acids determine tartness and other flavor attributes in fruit juices, and can also indicate juice freshness or spoilage. Organic acid profiles are distinct to juice type, so evidence of product adulteration can be evaluated by comparison against a known juice fingerprint.
This application note shows a method to determine organic acids in fruit juices at low to high mg/L concentrations.
MethodThe study demonstrates determination of organic acids in orange, grape, apple and cranberry juices. It uses a simple dilution, and quantification on a Thermo Scientific™ Dionex™ ion chromatography system equipped with a high-capacity column and electrolytic eluent generation, with suppressed conductivity detection.
ConclusionThis method is suitable for a variety of fruit juices. The electrolytic eluent generator creates high-purity, carbonate-free eluents to suppress baseline drift, and improve retention time and reproducibility. The Thermo Scientific™ Dionex™ IonPac™ AS11-HC column’s high capacity improves separation of a wide variety of organic acids.
Thermo Scientific™ Dionex™ ICS-5000+ Capillary HPIC™ system
Read the full application note.
Part Number Description
052960Dionex IonPac AS11-HC column, 4 × 250 mm
© 2017 Thermo Fisher Scientific Inc. All rights reserved. All trademarks are the property of Thermo Fisher Scientific and its subsidiaries unless otherwise specified. AB72323-EN 0417S
Find out more at www.thermofisher.com/FoodIntegrity
31
Beverages
Application summary AN 264
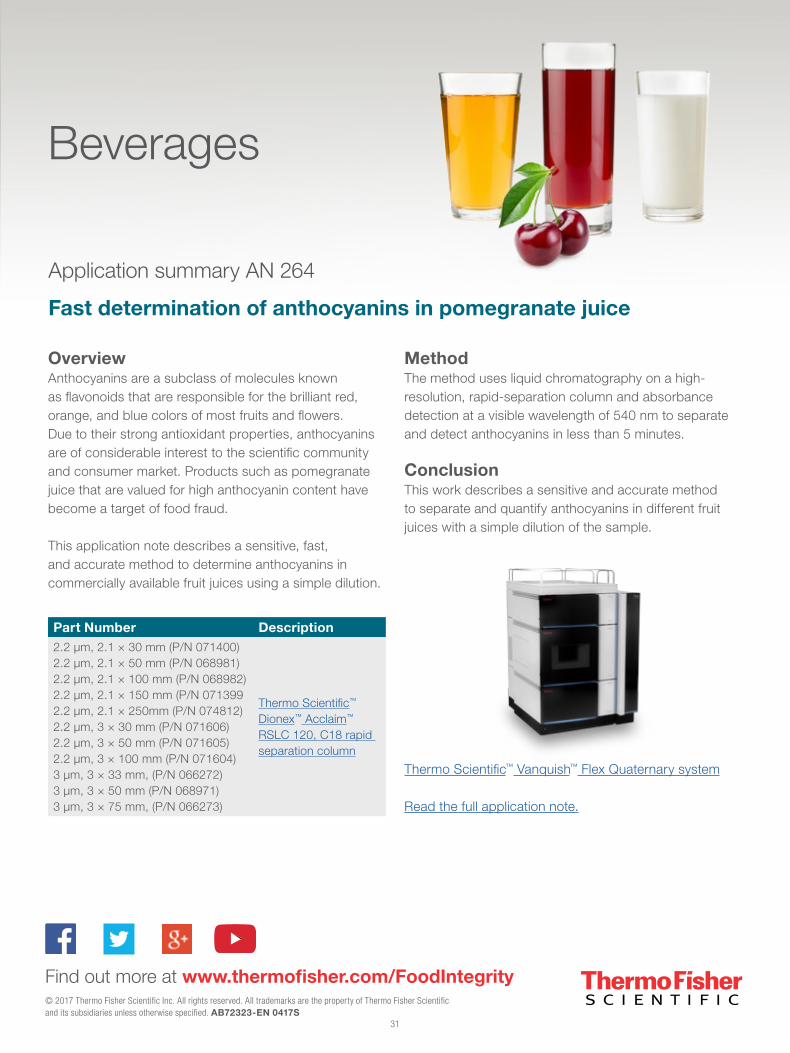
Fast determination of anthocyanins in pomegranate juice
OverviewAnthocyanins are a subclass of molecules known as flavonoids that are responsible for the brilliant red, orange, and blue colors of most fruits and flowers. Due to their strong antioxidant properties, anthocyanins are of considerable interest to the scientific community and consumer market. Products such as pomegranate juice that are valued for high anthocyanin content have become a target of food fraud.
This application note describes a sensitive, fast, and accurate method to determine anthocyanins in commercially available fruit juices using a simple dilution.
MethodThe method uses liquid chromatography on a high-resolution, rapid-separation column and absorbance detection at a visible wavelength of 540 nm to separate and detect anthocyanins in less than 5 minutes.
ConclusionThis work describes a sensitive and accurate method to separate and quantify anthocyanins in different fruit juices with a simple dilution of the sample.
Thermo Scientific™ Vanquish™ Flex Quaternary system
Read the full application note.
Part Number Description2.2 μm, 2.1 × 30 mm (P/N 071400)2.2 μm, 2.1 × 50 mm (P/N 068981)2.2 μm, 2.1 × 100 mm (P/N 068982)2.2 μm, 2.1 × 150 mm (P/N 0713992.2 μm, 2.1 × 250mm (P/N 074812)2.2 μm, 3 × 30 mm (P/N 071606)2.2 μm, 3 × 50 mm (P/N 071605)2.2 μm, 3 × 100 mm (P/N 071604)3 μm, 3 × 33 mm, (P/N 066272)3 μm, 3 × 50 mm (P/N 068971)3 μm, 3 × 75 mm, (P/N 066273)
Thermo Scientific™ Dionex™ Acclaim™ RSLC 120, C18 rapid separation column
© 2017 Thermo Fisher Scientific Inc. All rights reserved. All trademarks are the property of Thermo Fisher Scientific and its subsidiaries unless otherwise specified. AB72323-EN 0417S
Find out more at www.thermofisher.com/FoodIntegrity
32
Beverages
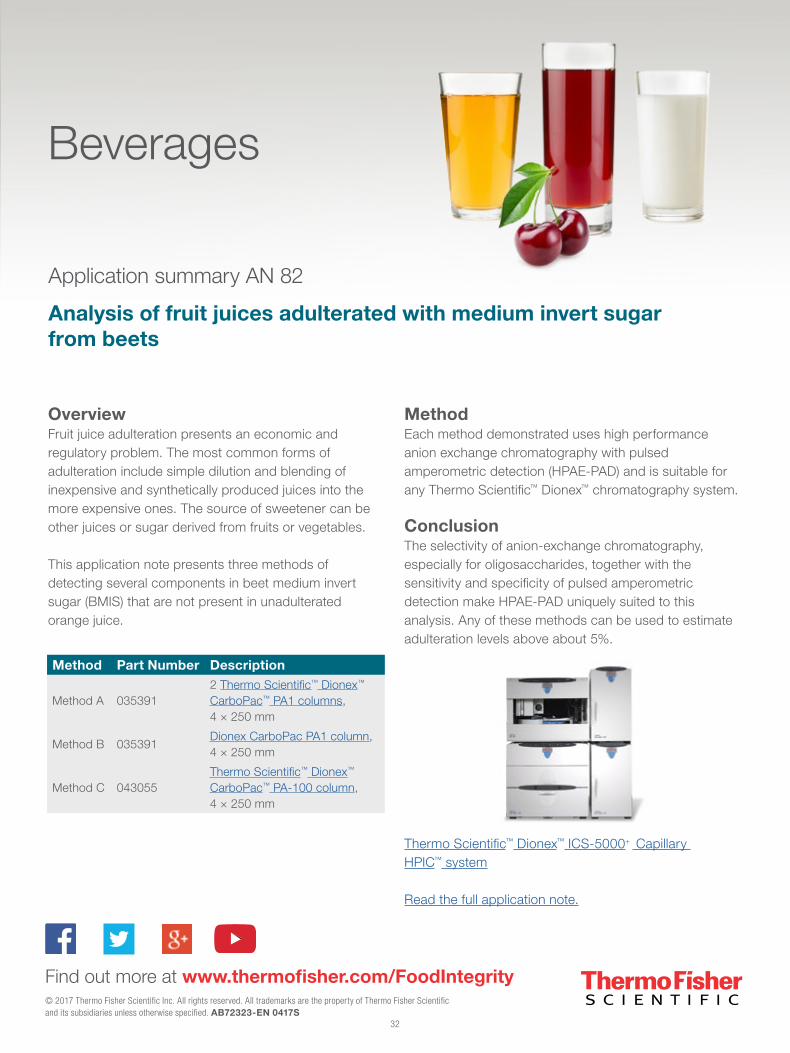
Application summary AN 82
Analysis of fruit juices adulterated with medium invert sugar from beets
OverviewFruit juice adulteration presents an economic and regulatory problem. The most common forms of adulteration include simple dilution and blending of inexpensive and synthetically produced juices into the more expensive ones. The source of sweetener can be other juices or sugar derived from fruits or vegetables.
This application note presents three methods of detecting several components in beet medium invert sugar (BMIS) that are not present in unadulterated orange juice.
MethodEach method demonstrated uses high performance anion exchange chromatography with pulsed amperometric detection (HPAE-PAD) and is suitable for any Thermo Scientific™ Dionex™ chromatography system.
ConclusionThe selectivity of anion-exchange chromatography, especially for oligosaccharides, together with the sensitivity and specificity of pulsed amperometric detection make HPAE-PAD uniquely suited to this analysis. Any of these methods can be used to estimate adulteration levels above about 5%.
Thermo Scientific™ Dionex™ ICS-5000+ Capillary HPIC™ system
Read the full application note.
Method Part Number Description
Method A 0353912 Thermo Scientific™ Dionex™ CarboPac™ PA1 columns, 4 × 250 mm
Method B 035391Dionex CarboPac PA1 column, 4 × 250 mm
Method C 043055Thermo Scientific™ Dionex™ CarboPac™ PA-100 column, 4 × 250 mm
© 2017 Thermo Fisher Scientific Inc. All rights reserved. All trademarks are the property of Thermo Fisher Scientific and its subsidiaries unless otherwise specified. AB72323-EN 0417S
Find out more at www.thermofisher.com/FoodIntegrity

33
Beverages
Application summary TN 119
Fast separations of organic acids in an orange juice sample using high-pressure capillary IC
Terri Christison, Fei Pang, and Linda Lopez, Thermo Fisher Scientific, Sunnyvale, CA, USA
OverviewDeterminations of organic acid profiles in fruit juices are used in the beverage industry to characterize flavor components, identify spoilage and potential sources of adulteration, and to meet labeling requirements for food products.
This technical note demonstrates the use of a high-pressure capillary Thermo Scientific™ Reagent-Free™ ion chromatography (RFIC™) system for fast analysis of organic acids in juice samples.
MethodIn this study, inorganic anions and organic acids from a diluted orange juice sample are separated by anion-
exchange chromatography on a Thermo Scientific™ Dionex™ ICS-5000+ HPIC Reagent-Free capillary IC system and detected by suppressed conductivity detection, using the Thermo Scientific™ Dionex™ ACES™ Anion Capillary Electrolytic Suppressor.
ConclusionThe high-pressure method is shown to provide comparable results and the same advantages as standard pressure capillary IC, with low consumption of water (30 to 40 mL/day of water) and reduced waste generation, using a sample injection of only 0.4 μL.
Dionex ICS-5000+ Capillary HPIC system
Read the full technical note.
Part Number Description
074246Thermo Scientific™ Dionex™ IonSwift™ MAX-100 monolith column, 0.25 × 250 m
074247 Dionex IonSwift MAX-100 guard column
072076Thermo Scientific™ Dionex™ EGC KOH capillary cartridge
072078Thermo Scientific™ Dionex™ CR-ATC Capillary Continuously Regenerated Anion Trap column
© 2017 Thermo Fisher Scientific Inc. All rights reserved. All trademarks are the property of Thermo Fisher Scientific and its subsidiaries unless otherwise specified. AB72323-EN 0417S
Find out more at www.thermofisher.com/FoodIntegrity

34
Beverages
Application summary AN 1095
Determination of dicyandiamide in milk powderChen Jing,1 Dai Zhenyu,1 Xu Qun,1 Liang Lina,1 and Jeffrey Rohrer2
1Thermo Fisher Scientific, Shanghai, People’s Republic of China;2Thermo Fisher Scientific, Sunnyvale, CA, USA
OverviewDicyandiamide is used by farmers to minimize the environmental impact of livestock on land, by reducing the rate at which soil microbes convert ammonia from animal urine into nitrates and nitrous oxide, slowing nitrate leaching. Overuse of dicyandiamide can lead to its appearance in dairy products.
This application note demonstrates a straightforward method to quantify dicyandiamide with high sensitivity without the need for time-consuming sample cleanup.
MethodThis study separates and quantifies dicynandiamide using ion-exclusion chromatography on a Thermo Scientific™ Dionex™ UltiMate™ 3000 Rapid Separation LC (RSLC) system with UV detection at 220 nm.
ConclusionThis simple HPLC method provides an excellent separation for the determination of dicyandiamide in milk powder samples. The separation power of the Thermo Scientific™ Dionex™ IonPac™ ICE-AS1 analytical & guard column simplifies the sample preparation process and eliminates the cartridge cleanup procedure, reducing analysis time and cost.
UltiMate 3000 Rapid Separation systems
Read the full application note.
Part Number Description
043197Dionex IonPac ICE-AS1 analytical column, 9 × 250 mm
© 2017 Thermo Fisher Scientific Inc. All rights reserved. All trademarks are the property of Thermo Fisher Scientific and its subsidiaries unless otherwise specified. AB72323-EN 0417S
Find out more at www.thermofisher.com/FoodIntegrity
35
Beverages
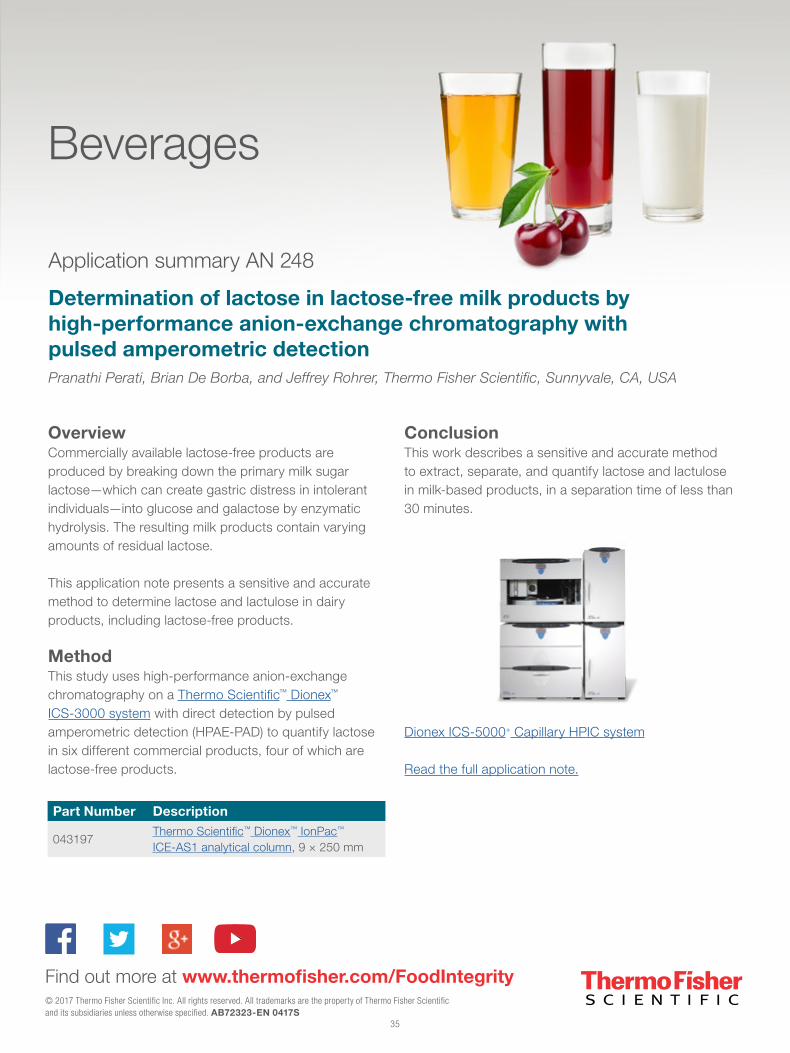
Application summary AN 248
Determination of lactose in lactose-free milk products by high-performance anion-exchange chromatography with pulsed amperometric detectionPranathi Perati, Brian De Borba, and Jeffrey Rohrer, Thermo Fisher Scientific, Sunnyvale, CA, USA
OverviewCommercially available lactose-free products are produced by breaking down the primary milk sugar lactose—which can create gastric distress in intolerant individuals—into glucose and galactose by enzymatic hydrolysis. The resulting milk products contain varying amounts of residual lactose.
This application note presents a sensitive and accurate method to determine lactose and lactulose in dairy products, including lactose-free products.
MethodThis study uses high-performance anion-exchange chromatography on a Thermo Scientific™ Dionex™
ICS-3000 system with direct detection by pulsed amperometric detection (HPAE-PAD) to quantify lactose in six different commercial products, four of which are lactose-free products.
ConclusionThis work describes a sensitive and accurate method to extract, separate, and quantify lactose and lactulose in milk-based products, in a separation time of less than 30 minutes.
Dionex ICS-5000+ Capillary HPIC system
Read the full application note.
Part Number Description
043197Thermo Scientific™ Dionex™ IonPac™ ICE-AS1 analytical column, 9 × 250 mm
© 2017 Thermo Fisher Scientific Inc. All rights reserved. All trademarks are the property of Thermo Fisher Scientific and its subsidiaries unless otherwise specified. AB72323-EN 0417S
Find out more at www.thermofisher.com/FoodIntegrity
36
Beverages
Application summary AN 231
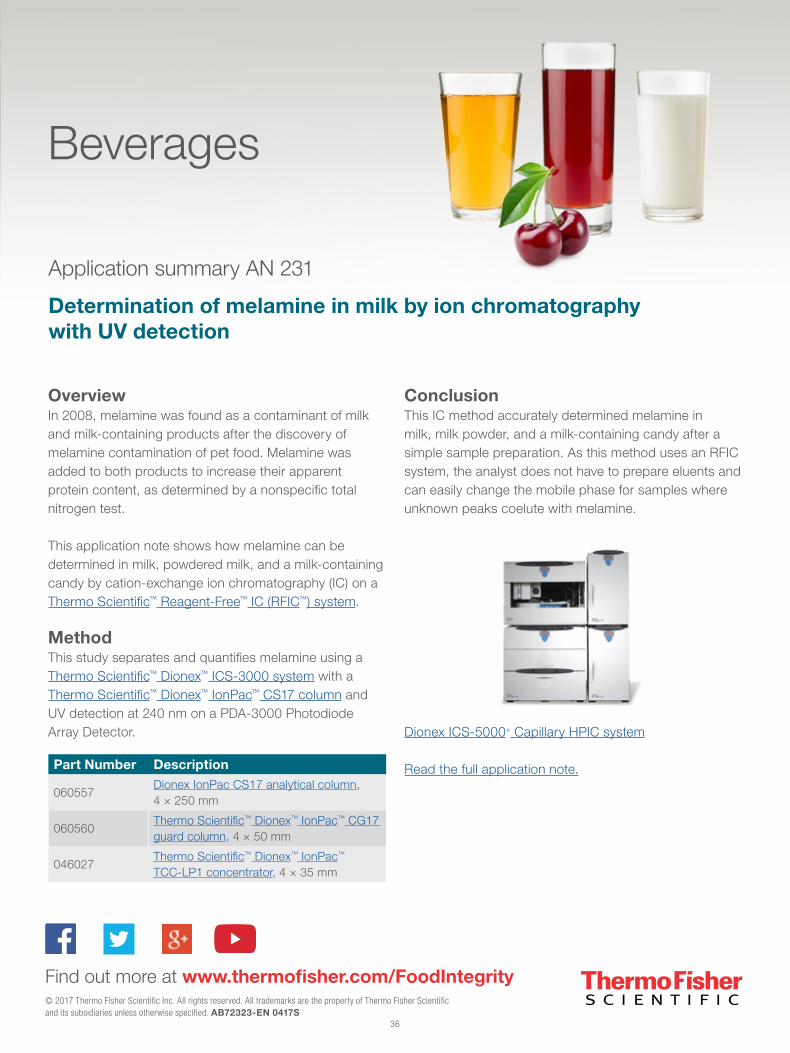
Determination of melamine in milk by ion chromatography with UV detection
OverviewIn 2008, melamine was found as a contaminant of milk and milk-containing products after the discovery of melamine contamination of pet food. Melamine was added to both products to increase their apparent protein content, as determined by a nonspecific total nitrogen test.
This application note shows how melamine can be determined in milk, powdered milk, and a milk-containing candy by cation-exchange ion chromatography (IC) on a Thermo Scientific™ Reagent-Free™ IC (RFIC™) system.
MethodThis study separates and quantifies melamine using a Thermo Scientific™ Dionex™ ICS-3000 system with a Thermo Scientific™ Dionex™ IonPac™ CS17 column and UV detection at 240 nm on a PDA-3000 Photodiode Array Detector.
ConclusionThis IC method accurately determined melamine in milk, milk powder, and a milk-containing candy after a simple sample preparation. As this method uses an RFIC system, the analyst does not have to prepare eluents and can easily change the mobile phase for samples where unknown peaks coelute with melamine.
Dionex ICS-5000+ Capillary HPIC system
Read the full application note.Part Number Description
060557Dionex IonPac CS17 analytical column, 4 × 250 mm
060560Thermo Scientific™ Dionex™ IonPac™ CG17 guard column, 4 × 50 mm
046027Thermo Scientific™ Dionex™ IonPac™
TCC-LP1 concentrator, 4 × 35 mm
© 2017 Thermo Fisher Scientific Inc. All rights reserved. All trademarks are the property of Thermo Fisher Scientific and its subsidiaries unless otherwise specified. AB72323-EN 0417S
Find out more at www.thermofisher.com/FoodIntegrity

37
Beverages
Application summary AN ANCCSCETMELCYAN
Analysis of melamine and cyanuric acid using a core enhanced technology accucore HILIC HPLC column
Joanna Freeke, Thermo Fisher Scientific, Runcorn, Cheshire, UK
OverviewIn recent years there have been a number of food recalls relating to melamine adulteration. Cyanuric acid is a degradation product of melamine. Food safety regulatory bodies including the U.S. and Japan recommend the analysis of melamine and cyanuric acid using hydrophilic interaction (HILIC) HPLC separation prior to detection by mass spectrometry.
MethodThis application note demonstrates the use of the Thermo Scientific™ Accucore™ HILIC HPLC column for the fast analysis of melamine and cyanuric acid without compromising backpressure.
ConclusionThe use of the Accucore HILIC column allowed the successful analysis of melamine and cyanuric acid giving good retention and separation at a back pressure suitable for use in a conventional HPLC system.
Thermo Scientific™ Vanquish™ Flex Quaternary system
Read the full application note.
Part Number Description
17526-154630Accucore HILIC 2.6 μm 150 × 4.6 mm column
© 2017 Thermo Fisher Scientific Inc. All rights reserved. All trademarks are the property of Thermo Fisher Scientific and its subsidiaries unless otherwise specified. AB72323-EN 0417S
Find out more at www.thermofisher.com/FoodIntegrity

38
Beverages
Application summary AN 20694
Determination of melamine in powdered milk by LC-MS/MS using a core enhanced technology solid core HPLC columnKimberly Phipps, Thermo Fisher Scientific, Runcorn, Cheshire, UK
OverviewIn recent years melamine has been found in adulterated milk and milk based products, including infant formula milk, causing thousands of children to become ill. Limits have now been set for the amount of melamine that can be present in foodstuffs; zero for infant formula milk, and 2.5 ppm maximum for other foodstuffs.
This application note presents an method for simple extraction and rapid quantification of melamine in infant formula.
MethodThis study used solid-phase extraction on Thermo Scientific™ Ultra Vap hardware followed by liquid chromatography/mass spectrometry (LC-MS), using HILIC separation on a Thermo Scientific™ Accela™ 600 pump equipped with a Thermo Scientific™ CTC autosampler. Detection was performed on a Thermo Scientific™ TSQ Vantage™ mass spectrometer.
ConclusionUsing Thermo Scientific™ HyperSep™ Retain CX solid phase extraction cartridges sample preparation is fast and efficient giving an average recovery of 121 percent. The HILIC column provided a fast run time of 2 minutes. The method provided a linear dynamic range between 10 and 1000 ng/g with accuracies of +/- 20% for standards.
Thermo Scientific™ TSQ™ Triple Quadrupole LC-MS systems
Read the full application note.Part Number Description
60107-303HyperSep Retain-CX, 60 mg/3 m SPE cartridge
17526-102130Thermo Scientific™ Accucore™ HILIC 2.6 μm, 100 × 2.1 m column
© 2017 Thermo Fisher Scientific Inc. All rights reserved. All trademarks are the property of Thermo Fisher Scientific and its subsidiaries unless otherwise specified. AB72323-EN 0417S
Find out more at www.thermofisher.com/FoodIntegrity

39
Beverages
Application summary method TG 52251
Analysis of plasticizer contaminants in beverages and milk using an automated system based on turbulent-flow chromatography coupled to LC-MS/MSEbru Ates, Klaus Mittendorf, Thermo Fisher Scientific Food Safety Response Center, Dreieich, Germany
OverviewPhthalates have been used to deliberately adulterate beverages and sports drinks in Taiwan, and phthalates and other plasticizers are widely found as ubiquitous contaminants, particularly in fatty foodstuffs. Contamination arises from numerous sources such as the environment and food packaging.
Cross-contamination with phthalates can easily arise during trace analysis in the laboratory. A method for phthalates analysis is presented that minimizes sample handling through online automated analysis.
MethodThis approach employs online Thermo Scientific™ TurboFlow™ chromatography for automated sample concentration, cleanup and analytical separation in a single run on a Thermo Scientific™ Transcend™ TLX liquid chromatography system. Identification of plasticizers is
based on ion-ratios using selected reaction monitoring (SRM), on a Thermo Scientific™ TSQ Quantum™ Access MAX triple quadrupole mass spectrometer controlled by Thermo Scientific™ Aria™ software.
ConclusionOnline TurboFlow sample preparation coupled to LC-MS separation and detection enables very selective and effective determination of plasticizers. Elimination of time-consuming sample preparation steps provides high sample throughput while reducing the probability of sample contamination.
Transcend II system with multi-channel and TurboFlow technology
Read the full application note.
Part Number Description
25003152130Thermo Scientific™ Hypersil GOLD™ column, 150 × 2.1 mm 3 μm
CH953280Thermo Scientific™ Turboflow™ C18 XL column, 0.5 × 50 mm
© 2017 Thermo Fisher Scientific Inc. All rights reserved. All trademarks are the property of Thermo Fisher Scientific and its subsidiaries unless otherwise specified. AB72323-EN 0417S
Find out more at www.thermofisher.com/FoodIntegrity

40
Beverages
Application summary AN 502
Simple and rapid screening of melamine in milk products with high resolution accurate mass benchtop orbitrap LC MS
Kefei Wang, Chunang (Christine) Gu, Thermo Fisher Scientific, San Jose, CA, USA
OverviewGenerally used for industrial manufacturing, melamine, a nitrogen-rich white crystal, has been found as an adulterant used to falsify the protein levels in many milk products. Different countries vary in setting the Maximum Residue Limit (MRL) for melamine, but generally follow the United States Food and Drug Administration (US FDA) MRL of 1 ppm for infant formula and 2.5 ppm for other milk products.
This application note demonstrates a high-resolution benchtop liquid chromatography/mass spectrometry (LC-MS) method for simple and rapid monitoring of melamine in milk products.
MethodThis study uses a Thermo Scientific™ Accela™ LC system and a Thermo Scientific™ Q Exactive™ Hybrid Quadrupole-Orbitrap™ mass spectrometer to screen trace levels of melamine in milk products.
Part Number Description
73105-053030Thermo Scientific™ BioBasic™ AX 3 × 50 mm, 5 μm column
© 2017 Thermo Fisher Scientific Inc. All rights reserved. All trademarks are the property of Thermo Fisher Scientific and its subsidiaries unless otherwise specified. AB72323-EN 0417S
Find out more at www.thermofisher.com/FoodIntegrity
ConclusionThis method rapidly analyzes infant formula and coffee creamers with a detection limit lower than 250 ppb, the reporting limit of quantitation (LOQ) set by the US FDA method for infant formula on a triple quadrupole mass spectrometer. Analysis required only a 1-minute, isocratic LC separation.
Q Exactive Hybrid Quadrupole-Orbitrap mass spectrometer systems
Read the full application note.

41
Beverages
Application summary AN 52087
Detection of ricin in milk using immunomagnetic separation (IMS) with surface-enhanced raman scattering (SERS) detection
Lili He, Ph.D., Ted Labuza, Ph.D., University of Minnesota, Dept of Food Science and Nutrition, St. Paul, MN, USA; Timothy O. Deschaines, Ph.D., Thermo Fisher Scientific, Madison, WI, USA
OverviewRicin, a water-soluble protein toxin naturally present in the castor bean (R. communis), is considered a potential bioterrorism agent due to its toxicity, easy availability, simple and inexpensive production, and past history of use. Prior methods for detecting ricin are based on immune- or toxicity based methods, which, though sensitive to parts per billion and parts per trillion, are often time-consuming, labor intensive, unreliable, and/or expensive.
This application note combines two techniques to develop a method for fast, reliable, and economic determination of ricin in milk.
MethodThis study combines immunomagnetic separation (IMS) and surface-enhanced Raman scattering (SERS) detection using a Thermo Scientific™ DXR™ Raman microscope equipped with Thermo Scientific™ OMNIC™ Array Automation software for the automated collection and processing of groups of samples.
ConclusionThe combination of immunomagnetic separation with surface-enhanced Raman scattering can separate and detect the presence of ricin in milk with a detection limit of at least 4 micrograms per milliliter within a 20-minute time frame.
DXR 2 Raman microscope
Read the full application note.
Part Number Description
10007DThermo Scientific™ Dynabeads™ Protein G Immunoprecipitation Kit
© 2017 Thermo Fisher Scientific Inc. All rights reserved. All trademarks are the property of Thermo Fisher Scientific and its subsidiaries unless otherwise specified. AB72323-EN 0417S
Find out more at www.thermofisher.com/FoodIntegrity

42
Beverages
Application summary AN 10492
Chemical profiling and differential analysis of whiskies using Orbitrap GC-MSDominic Roberts,1 Jana Hajslova,2 Jana Pulkrabova,2 and Paul Silcock1
1Thermo Fisher Scientific, Runcorn, UK; 2University of Chemistry and Technology, Prague, Czech Republic
OverviewThe complex, tradition-rich process of whiskey making results in a beverage that has both a high value and high degree of variability. Given the high retail price, counterfeiting and/or adulteration is commonplace. Whisky producers use analytical technology to accurately and comprehensively characterize their products both so that adulteration can be identified, and as part of quality control procedures to compare production batches and process over time.
This application notes demonstrates fast, robust methods to profile whiskey samples of different origins, ages and types by gas chromatography mass spectrometry (GC-MS).
MethodThis study takes advantage of the performance of the Thermo Scientific™ TRACE™ 1310 gas chromatograph and Thermo Scientific™ Q Exactive™ GC Orbitrap™ GC-MS/MS system in combination with Thermo Scientific™
TraceFinder™ software and Thermo Scientific™ SIEVE 2.2 software to characterize nine whiskey samples. It evaluates the application of a complete untargeted chemometric workflow to detect and identify chemical components, and demonstrates a process to identify chemical differences in whiskies of different origins.
ConclusionIn this method, fast scan speeds in combination with a high in-scan dynamic range and high sensitivity facilitate the detection of both low and high intensity components. These features and unique software algorithms for automated deconvolution and sample comparison create a powerful solution for comprehensive characterization, quality control, and brand protection.
Q Exactive GC Orbitrap GC-MS/MS system
Read the full application note.
Part Number Description
26096-1425
Thermo Scientific™ TraceGOLD™ TG-5SilMS 0.25 × 30 mm, 0.25 μm film capillary column with 10 m integrated guard
© 2017 Thermo Fisher Scientific Inc. All rights reserved. All trademarks are the property of Thermo Fisher Scientific and its subsidiaries unless otherwise specified. AB72323-EN 0417S
Find out more at www.thermofisher.com/FoodIntegrity

43
Beverages
Application summary AN 1068
Determination of organic acids in fruit juices and wines by high-pressure ICLillian Chen, Brian De Borba, and Jeffrey Rohrer, Thermo Fisher Scientific, Sunnyvale, CA, USA
OverviewOrganic acid profiles are monitored to determine authenticity, freshness and quality of fruit juices, wines, and other beverages. Organic acids influence the beverages’ organoleptic properties (flavor, color, and aroma) as well as product stability and microbiological control.
This application note presents a method to determine organic acids in fruit juices and wines with high sensitivity and simple sample preparation.
MethodThis study uses a Thermo Scientific™ Dionex™ ICS-5000+ HPIC™ system with suppressed conductivity detection to separate a large variety of organic acids with inorganic anions and detect them with high sensitivity while
minimizing sugar interferences. The separation of 30 anions on the Thermo Scientific™ Dionex™ IonPac™ AS11-HC-4µm Capillary analytical and guard column (9 μm) and the Dionex IonPac AS11-HC-4 μm column sets are compared.
ConclusionThis study presents characterization of ionic composition profiles and determination of organic acids in fruit juices and wines, with good accuracy and high sensitivity even for ions present in low concentrations. The Dionex IonPac AS11-HC-4 μm column set offers superior resolving power for separation of the target anions. The specificity and sensitivity of this method allow simple sample treatments without complex procedures such as extraction and/or derivatization.
Dionex ICS-5000+ Capillary HPIC system
Read the full application note.
Part Number Description
078035Dionex IonPac AS11-HC-4 μm analytical column, 2 × 250 mm
078036Dionex IonPac AS11-HC-4 μm guard column, 2 × 50 mm
052961Dionex IonPac AS11-HC-9 μm analytical column, 2 × 250 mm
052963Dionex IonPac AS11-HC-9 μm guard column, 2 × 50 mm
075778Thermo Scientific™ Dionex™ EGC 500 KOH Eluent Generator cartridge
075550Thermo Scientific™ Dionex™ CR-ATC 500 Continuously Regenerated Anion Trap column
© 2017 Thermo Fisher Scientific Inc. All rights reserved. All trademarks are the property of Thermo Fisher Scientific and its subsidiaries unless otherwise specified. AB72323-EN 0417S
Find out more at www.thermofisher.com/FoodIntegrity

44
Beverages
Infographic
Full infographic
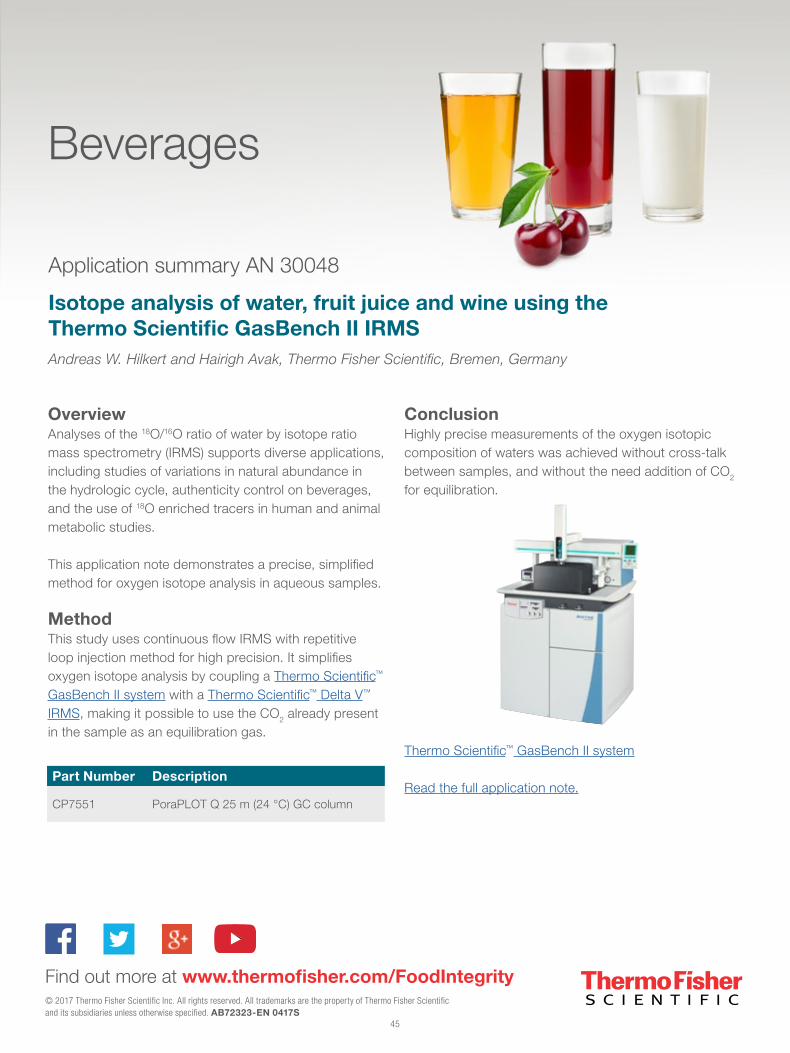
45
Beverages
Application summary AN 30048
Isotope analysis of water, fruit juice and wine using the Thermo Scientific GasBench II IRMSAndreas W. Hilkert and Hairigh Avak, Thermo Fisher Scientific, Bremen, Germany
OverviewAnalyses of the 18O/16O ratio of water by isotope ratio mass spectrometry (IRMS) supports diverse applications, including studies of variations in natural abundance in the hydrologic cycle, authenticity control on beverages, and the use of 18O enriched tracers in human and animal metabolic studies.
This application note demonstrates a precise, simplified method for oxygen isotope analysis in aqueous samples.
MethodThis study uses continuous flow IRMS with repetitive loop injection method for high precision. It simplifies oxygen isotope analysis by coupling a Thermo Scientific™ GasBench II system with a Thermo Scientific™ Delta V™ IRMS, making it possible to use the CO2 already present in the sample as an equilibration gas.
Part Number Description
CP7551 PoraPLOT Q 25 m (24 °C) GC column
© 2017 Thermo Fisher Scientific Inc. All rights reserved. All trademarks are the property of Thermo Fisher Scientific and its subsidiaries unless otherwise specified. AB72323-EN 0417S
Find out more at www.thermofisher.com/FoodIntegrity
ConclusionHighly precise measurements of the oxygen isotopic composition of waters was achieved without cross-talk between samples, and without the need addition of CO2 for equilibration.
Thermo Scientific™ GasBench II system
Read the full application note.

46
Thermo Scientific™ Dionex™
Integrion™ HPIC™ system
Thermo Scientific™ TSQ™
Triple Quadrupole LC-MS system
Thermo Scientific™ Vanquish™
Flex Quaternary system
Thermo Scientific™ EA IsoLink™
IRMS system
Thermo Scientific™ Dionex™ ICS-5000+
Capillary HPIC™ system
Thermo Scientific™ LC IsoLink™
Interface for IRM-LC-MS
Thermo Scientific™ Q Exactive™ Hybrid
Quadrupole-Orbitrap™ MS systems
Thermo Scientific™ DXR™ 2 Raman microscope
Thermo Scientific™ Transcend™ II system with Multi-channel
and TurboFlow™ Technology
Products highlighted in the applications
Thermo Scientific™ Q Exactive™
GC Orbitrap™ GC-MS/MS system
Thermo Scientific™ UltiMate™ 3000
Rapid Separation system
Thermo Scientific™ GC IsoLink II™
Interface for GC-IRMS

47
Other resourcesType Title Category Resource
Application
notebook
Adulteration and
authenticityGeneral
Chromatography for Foods and Beverages: Adulteration and
Authentication Applications NotebookIC + LC AI71475
Brochure Halal foods Halal foods Solutions for food safety, quality, and halal testing BR63865
Application
notebook
Adulteration and
authenticityAdditives
Chromatography for Foods and Beverages Flavors, Colorants
and Additives Analysis Applications NotebookAll AI71472
PresentationAdulteration and
authenticityAuthenticity
Isotope Ratio Mass Spectrometry: Authenticity control, Fraud &
Forensics in Food
Application
notebook
Adulteration and
authenticityContaminants
Chromatography for Foods and Beverages: Contaminants
Applications NotebookAll AI71476
Application
notebook
Adulteration and
authenticityBeverages Chromatography for Profiling Beverages Applications Notebook All AI71474
Application
notebookAuthenticity Wine
Application Note: Application Summary Compendium – Wine
should ONLY be WineAI72110
Application
notebookAuthenticity Wine
Wine Analysis: from 'Grapes to Glass' – An Analytical Testing
Digest of the Wine Manufacturing ProcessAll XX72102
Application
notebook
Authenticity and
adulterationOils
Chromatography for Foods and Beverages - Fats and Oils
Analysis Applications NotebookAll AI71471
Poster note Adulteration GeneralA Turn-key System for Automated Detection of Organic
Contaminants in Food Matrices and Economic AdulterationLC- HRAM
Poster note Adulteration FruitsDetermination of Organic Acids and Anthocyanins in
Cranberry ExtractIC + LC PN70227
Poster note Adulteration Honey
Sensitive Detection of Economically Motivated Adulteration of
Honey by Bulk and Compound Specific 13C IRMS using Liquid
Chromatography and Elemental Analysis Inlet Devices
EA–IRMS PO30334
Case studyAuthenticity and
adulterationHoney
Case Study: Simplicity Achieved for Testing Honey in a South
African Contract LaboratoryLC-CAD CS71815
Poster note Authenticity OilsCharacterization of Used Cooking Oils by High Performance
Liquid Chromatography and Corona Charged Aerosol DetectionLC-CAD PN70536
Poster note Authenticity OilsDetermination of Olive Oil Adulteration by Principal Component
Analysis with HPLC–Charged Aerosol Detector DataLC-CAD PN70689
Poster note Adulteration Juice
Evaluation of Herb and Fruit Juice Adulterationand and
Authenticity by Coulometric Array Detection and Pattern
Recognition Analysis
LC PN70534
Poster note Adulteration JuiceUsing Capillary IC with Suppressed Conductivity and Charge
Detection to Profile Organic Acids in Juices and BeveragesIC PN71719
Smart note Authenticity GeneralHow can stable isotopes be used to determine origin and
authenticity of food and beverage products?IRMS SN30410
Smart note Authenticity GeneralAre there official methods for food and beverage product origin,
authenticity and label claims?IRMS SN30414

48
© 2017 Thermo Fisher Scientific Inc. All rights reserved. All trademarks are the property of Thermo Fisher Scientific and its subsidiaries unless otherwise specified. This information is presented as an example of the capabilities of Thermo Fisher Scientific Inc. products. It is not intended to encourage use of these products in any manner that might infringe on the intellectual property rights of others. AB72323-EN 0417S
Find out more at www.thermofisher.com/FoodIntegrity