food & beverage mergers & acquisitions update q1 2020 and beverage … · calavo growers,...
TRANSCRIPT

800.644.1704 | bkdcapitaladvisors.com
FOOD & BEVERAGE MERGERS &
ACQUISITIONS UPDATE
Q1 2020

BKD CAPITAL ADVISORS CHICAGO | DALLAS | DENVER | INDIANAPOLIS | SPRINGFIELD Page 2
Mid-Atlantic Region
OVERVIEW & OUTLOOK
The food and beverage industry began the first quarter with strong M&A activity and expectations among deal makers that the positive deal environment would continue throughout 2020. However, due to the effects of the SARS-CoV-2 virus and the incidence of COVID-19 (COVID-19), the quarter ended with unprecedented uncertainty. While the full impact of COVID-19 remains unknown, the outbreak has led to a dramatic slowdown in overall M&A activity. Even though much of the food & beverage industry falls into the essential business category during lockdown and stay-at-home orders, it has not been spared by the effects of the pandemic. While some businesses such as nonperishable and processed food companies are seeing an increase in sales as customers are either by choice or by lockdown orders stocking up and eating at home, others, such as retail food establishments and restaurants are facing challenges with a shortage of food supplies, employees and consumer demand.
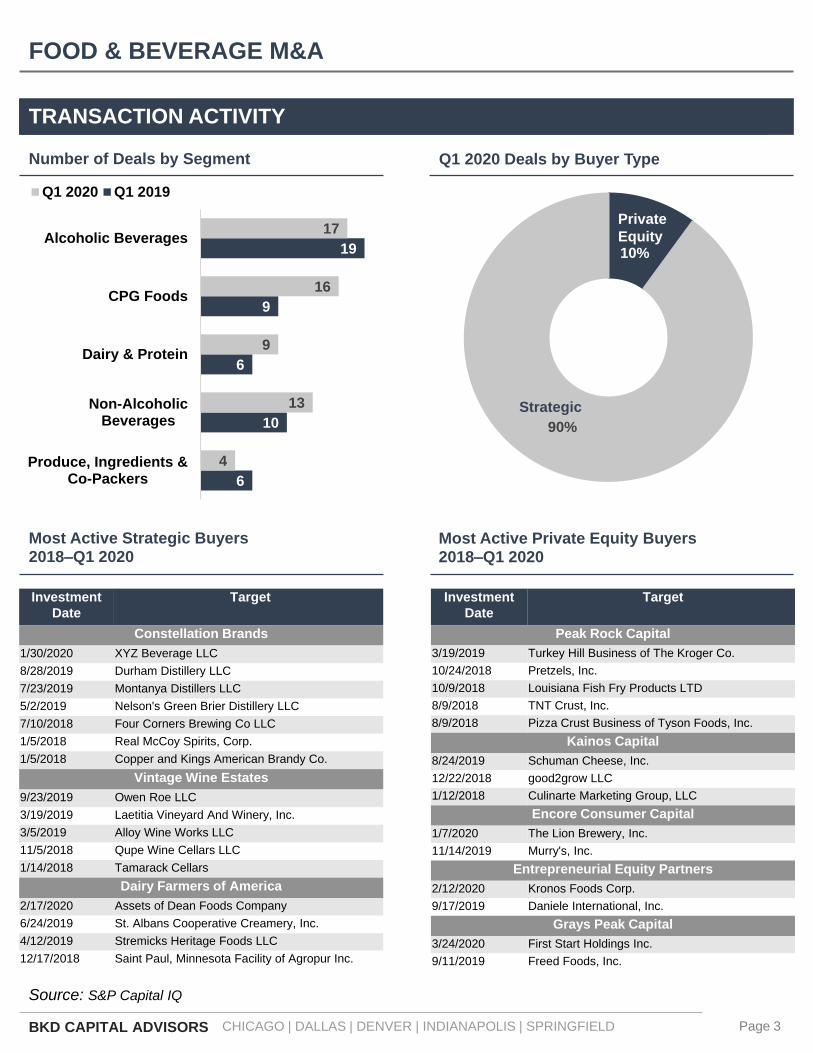
Throughout Q1, many transactions that were underway or close to completion moved toward closing, while a high proportion of deals in the early stages were paused in a “wait-and-see” approach. As reflected in the chart below, the number of deals completed in Q1 2020 closely reflected numbers seen in Q1 2019. However, we expect a significant decline in Q2 year-over-year transactional volumes. Notable transactions in the food and beverage category during the first quarter include the acquisition of Rockstar, Inc. by PepsiCo, Inc. for $3.85 billion and the acquisition of Fairlife, LLC by The Coca-Cola Company for $1 billion. Also of note was the sale of Dean Foods, America’s largest milk producer, to Dairy Farmers of America for $425 million.
bkdcapitaladvisors.com
FOOD & BEVERAGE M&A
Food & Beverage Total Deals 2008–Q1 2020
242
187
251275 283 278
310326 335
366339
363
86 93
Source: S&P Capital IQ
BKD CAPITAL ADVISORS SERVICES
▪ Company Sales & Divestitures ▪ Management Buyouts
▪ Debt & Equity Recapitalizations▪ Succession Planning & Strategic
Options Analysis
▪ Mergers & Acquisitions ▪ Affiliations
BKD CAPITAL ADVISORS CHICAGO | DALLAS | DENVER | INDIANAPOLIS | SPRINGFIELD Page 3
Mid-Atlantic Region
TRANSACTION ACTIVITY
BKD CAPITAL ADVISORS SERVICES
bkdcapitaladvisors.comSource: S&P Capital IQ
FOOD & BEVERAGE M&A
Most Active Strategic Buyers2018–Q1 2020
Most Active Private Equity Buyers2018–Q1 2020
6
10
6
9
19
4
13
9
16
17
Produce, Ingredients &Co-Packers
Non-AlcoholicBeverages
Dairy & Protein
CPG Foods
Alcoholic Beverages
Q1 2020 Q1 2019
10%
90%
Private
Equity
Strategic
Number of Deals by Segment Q1 2020 Deals by Buyer Type
Investment
Date
Target
Constellation Brands
1/30/2020 XYZ Beverage LLC
8/28/2019 Durham Distillery LLC
7/23/2019 Montanya Distillers LLC
5/2/2019 Nelson's Green Brier Distillery LLC
7/10/2018 Four Corners Brewing Co LLC
1/5/2018 Real McCoy Spirits, Corp.
1/5/2018 Copper and Kings American Brandy Co.
Vintage Wine Estates
9/23/2019 Owen Roe LLC
3/19/2019 Laetitia Vineyard And Winery, Inc.
3/5/2019 Alloy Wine Works LLC
11/5/2018 Qupe Wine Cellars LLC
1/14/2018 Tamarack Cellars
Dairy Farmers of America
2/17/2020 Assets of Dean Foods Company
6/24/2019 St. Albans Cooperative Creamery, Inc.
4/12/2019 Stremicks Heritage Foods LLC
12/17/2018 Saint Paul, Minnesota Facility of Agropur Inc.
Investment
Date
Target
Peak Rock Capital
3/19/2019 Turkey Hill Business of The Kroger Co.
10/24/2018 Pretzels, Inc.
10/9/2018 Louisiana Fish Fry Products LTD
8/9/2018 TNT Crust, Inc.
8/9/2018 Pizza Crust Business of Tyson Foods, Inc.
Kainos Capital
8/24/2019 Schuman Cheese, Inc.
12/22/2018 good2grow LLC
1/12/2018 Culinarte Marketing Group, LLC
Encore Consumer Capital
1/7/2020 The Lion Brewery, Inc.
11/14/2019 Murry's, Inc.
Entrepreneurial Equity Partners
2/12/2020 Kronos Foods Corp.
9/17/2019 Daniele International, Inc.
Grays Peak Capital
3/24/2020 First Start Holdings Inc.
9/11/2019 Freed Foods, Inc.
BKD CAPITAL ADVISORS CHICAGO | DALLAS | DENVER | INDIANAPOLIS | SPRINGFIELD Page 4
Mid-Atlantic Region
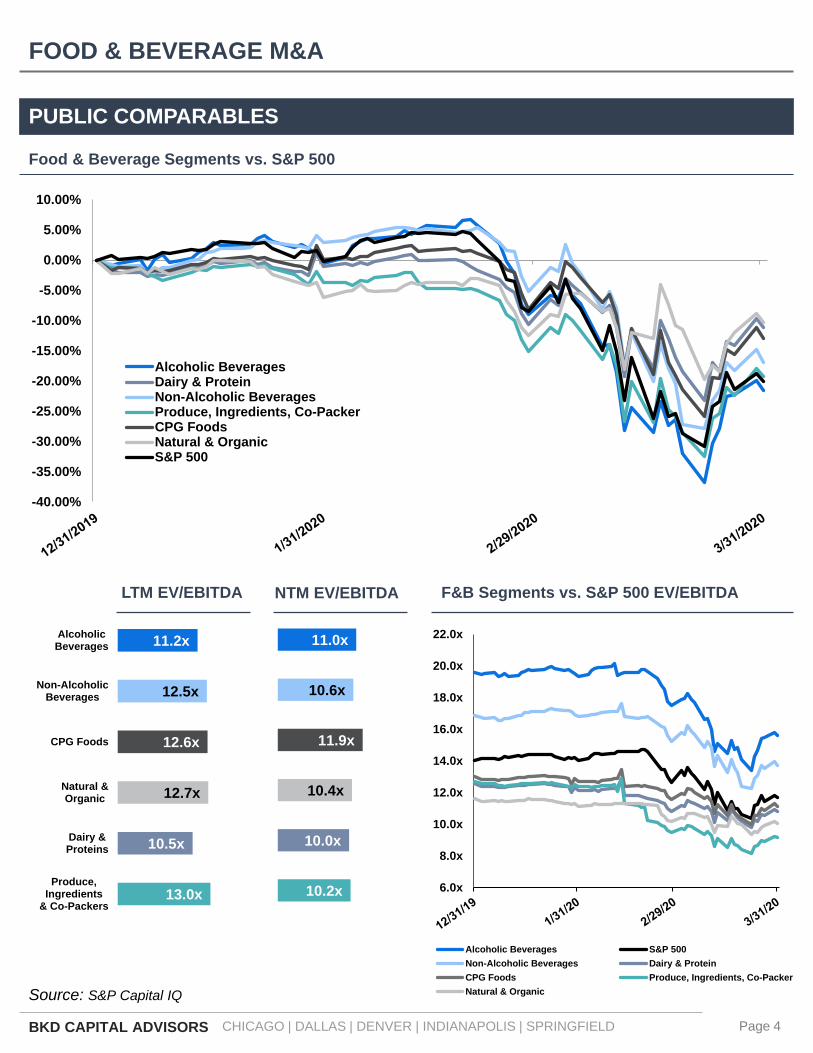
6.0x
8.0x
10.0x
12.0x
14.0x
16.0x
18.0x
20.0x
22.0x
Alcoholic Beverages S&P 500
Non-Alcoholic Beverages Dairy & Protein
CPG Foods Produce, Ingredients, Co-Packer
Natural & Organic
11.0x
10.6x
11.9x
10.4x
10.0x
10.2x
11.2x
12.5x
12.6x
12.7x
10.5x
13.0x
AlcoholicBeverages
Non-AlcoholicBeverages
CPG Foods
Natural &Organic
Dairy &Proteins
Produce,Ingredients
& Co-Packers
-40.00%
-35.00%
-30.00%
-25.00%
-20.00%
-15.00%
-10.00%
-5.00%
0.00%
5.00%
10.00%
Alcoholic BeveragesDairy & ProteinNon-Alcoholic BeveragesProduce, Ingredients, Co-PackerCPG FoodsNatural & OrganicS&P 500
PUBLIC COMPARABLES
FOOD & BEVERAGE M&A
F&B Segments vs. S&P 500 EV/EBITDANTM EV/EBITDA
Food & Beverage Segments vs. S&P 500
Source: S&P Capital IQ
LTM EV/EBITDA

BKD CAPITAL ADVISORS CHICAGO | DALLAS | DENVER | INDIANAPOLIS | SPRINGFIELD Page 5
Mid-Atlantic Region
PUBLIC COMPARABLES
Select Alcoholic Beverage Comparables by Market Capitalization
Select Non-Alcoholic Beverage Comparables by Market Capitalization
bkdcapitaladvisors.com
FOOD & BEVERAGE M&A
in millions of dollars
Recent Price Shares TTM TTM Enterprise Market EBITDA EV to EV to
Company Ticker 3/31/2020 Outstanding Revenue EBITDA Value Cap Margin Revenue EBITDA
Constellation Brands, Inc. STZ $143.36 192 $8,344 $3,041 $40,652 $27,481 36.45% 4.87x 13.37x
Brown-Forman Corporation BF.B 55.51 480 3,398 1,184 27,920 25,843 34.84% 8.22x 23.58x
Molson Coors Beverage Company TAP 39.01 217 10,579 2,328 17,500 8,454 22.01% 1.65x 7.52x
The Boston Beer Company, Inc. SAM 367.56 12 1,329 209 4,448 4,423 15.71% 3.35x 21.30x
MGP Ingredients, Inc. MGPI 26.89 17 363 59 503 459 16.21% 1.39x 8.55x
Craft Brew Alliance, Inc. BREW 14.90 19 193 (3) 350 291 -1.48% 1.81x -122.31x
Crimson Wine Group, Ltd. CWGL 5.85 24 67 (0) 135 136 -0.64% 2.02x -313.60x
Willamette Valley Vineyards, Inc. WVVI 4.85 5 25 5 48 24 21.70% 1.94x 8.94x
Eastside Distilling, Inc. EAST 1.16 9 16 (12) 20 11 -74.92% 1.30x -1.73x
Top 10 Median 2.64x 11.15x
Top 10 Average 3.57x 13.88x
Average Large Cap (Over $10B) 6.54x 18.47x
Average Mid Cap ($2B–$10B) 2.50x 14.41x
Average Small Cap (Under $2B) 1.66x 8.74x
Source: S&P Capital IQ
*Excluded outliers from mean & median data
in millions of dollars
Recent Price Shares TTM TTM Enterprise Market EBITDA EV to EV to
Company Ticker 3/31/2020 Outstanding Revenue EBITDA Value Cap Margin Revenue EBITDA
The Coca-Cola Company KO $44.25 4,319 $37,173 $12,120 $225,091 $189,983 32.60% 6.06x 18.57x
PepsiCo, Inc. PEP 120.10 1,403 68,158 12,542 194,820 166,848 18.40% 2.86x 15.53x
Keurig Dr Pepper Inc. KDP 24.27 1,420 11,229 3,437 49,298 34,148 30.61% 4.39x 14.34x
The Kraft Heinz Company KHC 24.74 1,224 24,977 6,562 57,918 30,226 26.27% 2.32x 8.83x
The Hain Celestial Group, Inc. HAIN 25.97 104 2,239 168 3,090 2,711 7.51% 1.38x 18.37x
TreeHouse Foods, Inc. THS 44.15 56 4,289 454 4,636 2,484 10.58% 1.08x 10.22x
National Beverage Corp. FIZZ 42.65 47 978 171 1,769 1,988 17.44% 1.81x 10.37x
Coca-Cola Consolidated, Inc. COKE 208.53 9 4,827 351 2,753 1,489 7.27% 0.57x 7.84x
Primo Water Corporation PRMW 9.01 135 2,395 308 2,669 1,410 12.85% 1.11x 8.68x
Farmer Bros. Co. FARM 6.96 17 580 14 202 120 2.37% 0.35x 14.69x
Top 10 Median 1.59x 12.36x
Top 10 Average 2.19x 12.74x
Average Large Cap (Over $10B) 3.91x 14.32x
Average Mid Cap ($2B–$10B) 1.23x 14.29x
Average Small Cap (Under $2B) 0.96x 10.40x

BKD CAPITAL ADVISORS CHICAGO | DALLAS | DENVER | INDIANAPOLIS | SPRINGFIELD Page 6
Mid-Atlantic Region
in millions of dollars
Recent Price Shares TTM TTM Enterprise Market EBITDA EV to EV to
Company Ticker 3/31/2020 Outstanding Revenue EBITDA Value Cap Margin Revenue EBITDA
General Mills, Inc. GIS $52.77 611 $16,765 $3,643 $46,241 $31,986 21.73% 2.76x 12.69x
Herbalife Nutrition Ltd. HLF 29.16 142 4,877 679 5,186 4,015 13.92% 1.06x 7.64x
Darling Ingredients Inc. DAR 19.17 168 3,364 408 4,928 3,145 12.12% 1.46x 12.09x
The Hain Celestial Group, Inc. HAIN 25.97 104 2,239 168 3,090 2,711 7.51% 1.38x 18.37x
Sprouts Farmers Market, Inc. SFM 18.59 120 5,635 345 3,835 2,185 6.13% 0.68x 11.10x
United Natural Foods, Inc. UNFI 9.18 53 24,527 478 4,642 492 1.95% 0.19x 9.70x
Calavo Growers, Inc. CVGW 57.69 18 1,211 66 1,115 1,016 5.45% 0.92x 16.88x
SunOpta Inc. SOY 1.71 88 1,190 34 745 151 2.89% 0.63x 21.68x
Natural Grocers by Vitamin Cottage,
Inc.NGVC 8.51 23 912 46 601 191 5.06% 0.66x 13.03x
Top 10 Median 0.92x 12.69x
Top 10 Average 1.08x 13.69x
Average Large Cap (Over $10B) 2.76x 12.69x
Average Mid Cap ($2B–$10B) 1.15x 12.30x
Average Small Cap (Under $2B) 0.60x 15.32x
PUBLIC COMPARABLES
Select CPG Food Comparables by Market Capitalization
Select Natural & Organic Comparables by Market Capitalization
bkdcapitaladvisors.com
FOOD & BEVERAGE M&A
Source: S&P Capital IQ
*Excluded outliers from mean & median data
in millions of dollars
Recent Price Shares TTM TTM Enterprise Market EBITDA EV to EV to
Company Ticker 3/31/2020 Outstanding Revenue EBITDA Value Cap Margin Revenue EBITDA
Mondelez International, Inc. MDLZ $50.08 1,454 $26,037 $5,122 $89,725 $71,762 19.67% 3.45x 17.52x
General Mills, Inc. GIS 52.77 611 16,765 3,643 46,241 31,986 21.73% 2.76x 12.69x
The Kraft Heinz Company KHC 24.74 1,224 24,977 6,562 57,918 30,226 26.27% 2.32x 8.83x
The Hershey Company HSY 132.50 211 8,007 1,937 31,652 27,659 24.19% 3.95x 16.34x
Lamb Weston Holdings, Inc. LW 57.10 147 3,949 854 10,733 8,342 21.62% 2.72x 12.57x
Post Holdings, Inc. POST 82.97 74 5,727 1,136 11,954 5,800 19.84% 2.09x 10.52x
Flowers Foods, Inc. FLO 20.52 212 4,124 402 5,615 4,342 9.76% 1.36x 13.95x
The Simply Good Foods Company SMPL 19.26 92 658 115 2,431 1,834 17.48% 3.70x 21.14x
Hostess Brands, Inc. TWNK 10.66 115 908 175 2,111 1,313 19.23% 2.33x 12.09x
B&G Foods, Inc. BGS 18.09 65 1,660 300 3,069 1,159 18.07% 1.85x 10.23x
Top 10 Median 2.52x 12.63x
Top 10 Average 2.65x 13.59x
Average Large Cap (Over $10B) 3.12x 13.84x
Average Mid Cap ($2B–$10B) 2.06x 12.35x
Average Small Cap (Under $2B) 2.62x 14.49x

BKD CAPITAL ADVISORS CHICAGO | DALLAS | DENVER | INDIANAPOLIS | SPRINGFIELD Page 7
Mid-Atlantic Region
in millions of dollars
Recent Price Shares TTM TTM Enterprise Market EBITDA EV to EV to
Company Ticker 3/31/2020 Outstanding Revenue EBITDA Value Cap Margin Revenue EBITDA
Mondelez International, Inc. MDLZ $50.08 1,454 $26,037 $5,122 $89,725 $71,762 19.67% 3.45x 17.52x
The Kraft Heinz Company KHC 24.74 1,224 24,977 6,562 57,918 30,226 26.27% 2.32x 8.83x
General Mills, Inc. GIS 52.77 611 16,765 3,643 46,241 31,986 21.73% 2.76x 12.69x
Tyson Foods, Inc. TSN 57.87 366 43,027 4,110 33,021 21,125 9.55% 0.77x 8.03x
Hormel Foods Corporation HRL 46.64 545 9,521 1,293 24,726 25,082 13.58% 2.60x 19.12x
Post Holdings, Inc. POST 82.97 74 5,727 1,136 11,954 5,800 19.84% 2.09x 10.52x
Pilgrim's Pride Corporation PPC 18.12 250 11,409 976 6,870 4,516 8.56% 0.60x 7.04x
Beyond Meat, Inc. BYND 66.60 42 298 12 3,874 4,119 4.19% 13.00x 310.25x
B&G Foods, Inc. BGS 18.09 65 1,660 300 3,069 1,159 18.07% 1.85x 10.23x
Armanino Foods of Distinction, Inc. AMNF 2.46 32 42 9 74 79 20.59% 1.76x 8.55x
Top 10 Median 2.20x 11.61x
Top 10 Average 3.18x 42.50x
Average Large Cap (Over $10B) 2.38x 13.24x
Average Mid Cap ($2B–$10B) 7.55x 160.39x
Average Small Cap (Under $2B) 1.61x 12.68x
PUBLIC COMPARABLES
Select Dairy & Protein Comparables by Market Capitalization
Select Produce, Ingredients & Co-Packer Comparables by Market Capitalization
bkdcapitaladvisors.com
FOOD & BEVERAGE M&A
Source: S&P Capital IQ
*Excluded outliers from mean & median data
in millions of dollars
Recent Price Shares TTM TTM Enterprise Market EBITDA EV to EV to
Company Ticker 3/31/2020 Outstanding Revenue EBITDA Value Cap Margin Revenue EBITDA
The Kraft Heinz Company KHC $24.74 1,224 $24,977 $6,562 $57,918 $30,226 26.27% 2.32x 8.83x
The Hershey Company HSY 132.50 211 8,007 1,937 31,652 27,659 24.19% 3.95x 16.34x
Archer-Daniels-Midland Company ADM 35.18 565 64,656 2,580 28,743 19,603 3.99% 0.44x 11.14x
McCormick & Company, Incorporated MKC 141.21 134 5,328 1,138 23,195 18,779 21.35% 4.35x 20.39x
Bunge Limited BG 41.03 141 41,140 1,486 12,060 5,820 3.61% 0.29x 8.12x
Lancaster Colony Corporation LANC 144.64 28 1,334 218 3,805 3,979 16.35% 2.85x 17.45x
Seaboard Corporation SEB 2,812.80 1 6,980 332 3,291 3,274 4.76% 0.47x 9.91x
B&G Foods, Inc. BGS 18.09 65 1,660 300 3,069 1,159 18.07% 1.85x 10.23x
John B. Sanfilippo & Son, Inc. JBSS 89.40 12 883 90 1,063 1,021 10.17% 1.20x 11.84x
Landec Corporation LNDC 8.69 29 587 11 456 253 1.92% 0.78x 40.41x
Top 10 Median 1.53x 11.49x
Top 10 Average 1.85x 15.47x
Average Large Cap (Over $10B) 2.77x 14.17x
Average Mid Cap ($2B–$10B) 1.21x 11.83x
Average Small Cap (Under $2B) 1.28x 20.82x

BKD SERVICES
Mid-Atlantic Region
CHICAGO | DALLAS | DENVER | INDIANAPOLIS | SPRINGFIELD BKD CAPITAL ADVISORS Page 8
Abundant services.
Sheer precision.
BKD, LLP offers a full range of services and industry-focused expertise to provide you with insightful
solutions and help you stay a cut above the competition.
FINANCIAL
ASSURANCE & RISK▪ Audit, review & compilations
▪ Benchmarking
▪ Internal audit
▪ Internal control studies
▪ SEC filings
▪ SOX 404 compliance
CONSULTING▪ Accounting outsourcing
▪ Budgeting & financial planning
▪ Cost accounting
▪ Employee benefit plan &
administering
▪ ESOP feasibility analysis
▪ Forecasts & projections
FEDERAL & STATE TAX
PLANNING & COMPLIANCE▪ Corporate tax planning
▪ Inventory tax planning
▪ R&D tax credit enhancements
▪ Real estate cost segregation
studies
▪ Restructuring planning
▪ State & local tax planning
FORENSICS & VALUATION
CONSULTING▪ Strategic Insolvency &
Bankruptcy
▪ Business valuations
▪ Fraud detection
▪ Litigation support
▪ Computer Forensics
▪ Data Analytics
INTERNATIONAL TAX
STRATEGIES▪ DISC
▪ Expatriate assignment
services
▪ Foreign tax credit planning
▪ Global structuring support
▪ Indirect global taxes
▪ Transfer pricing
INVESTMENT & FINANCIAL
PLANNING▪ Estate & gift planning
▪ Family tax planning
▪ Investment management
▪ Personal wealth planning
▪ Retirement planning
TRANSACTION SERVICES▪ Financial diligence
▪ M&A tax structuring
▪ Federal, state & local tax
diligence
▪ Technology diligence
GROWTH & ADVISORY
INVESTMENT BANKING▪ Mergers & acquisitions
▪ Company sales & divestitures
▪ Debt & equity recapitalizations
▪ Management buyouts
▪ Affiliations
▪ Succession planning
▪ Strategic options analysis
ECONOMIC DEVELOPMENT▪ Expansion projects
▪ Grants & public incentives
INTERNATIONAL MARKET▪ Development
▪ Exporting
▪ Direct investment
▪ Licensing
▪ Acquisitions
BKD OPTICS
BUSINESS PERFORMANCE
INTELLIGENCE• Data extraction & analysis
• Business activity analysis
• Cost and profitability reporting
• Business strengths, values and
opportunity planning
TECHNOLOGY
APPLICATIONS SOFTWARE▪ Sage
▪ Sage Intacct
▪ Microsoft Dynamics CRM
▪ Microsoft Dynamics F&O
▪ Microsoft Dynamics GP &
Business Central
IT RISK SERVICES▪ Virtual CIO
▪ IT audits & general control testing
▪ Cyber risk assessment
▪ Penetration testing
▪ Incident response
▪ Regulatory compliance
FOOD & BEVERAGE M&A

ABOUT US
INDUSTRY FOCUS
BKDCA, a wholly owned subsidiary of BKD, LLP, helps companies and
stockholders go beyond their numbers by creating value through investment
banking solutions that include mergers, acquisitions, sales, recapitalizations,
management buyouts and financings.
Founded in 1994, BKDCA is staffed with experienced investment bankers and
financial analysts. In addition, the firm draws on the resources of BKD with its
network of accountants, auditors, tax professionals, business consultants and
industry-specific consultants.
The professionals of BKD Capital Advisors (BKDCA) have more than 200
years of combined experience helping company owners plan for and execute
their growth and exit strategies. From managing the sale of a company to
negotiating the acquisition of a competitor or raising debt and equity capital to
improve financial and operational flexibility, BKDCA can help you to develop a
specific course of action for achieving your desired results.
BKDCA is a member of the Financial Industry Regulatory Authority and the Securities Investor Protection Corporation.
Financial
Services
Health
Care
Business
Services
Consumer
Services
& Products
Construction
& EngineeringEnergy
Manufacturing
& Distribution
Technology,
Media &
Telecom
Transportation
& Logistics
Mid-Atlantic Region
CHICAGO | DALLAS | DENVER | INDIANAPOLIS | SPRINGFIELD BKD CAPITAL ADVISORS Page 9
CONTACT US
Tony Schneider
Managing Director
Indianapolis, IN
317.383.4000
bkdcapitaladvisors.com
FOOD & BEVERAGE M&A
Michael McElreath
Asst. Vice President
Denver, CO
303.837.2283