food beverage information project 2011 markets stream –global · some form of the “food to...
TRANSCRIPT

This information was prepared by Coriolis solely for the use of our client; it is not to be relied on by any third party without prior written consent.
Food & Beverage Information Project 2011Markets Stream – Global
Final ReportOctober 2011 – v1.21
www.foodandbeverage.govt.nz

Coriolis is a strategic management consulting andmarket research firm
We work with organisations to help them grow. For corporations, thatoften means developing strategies for revenue growth. Forgovernments, it means working on national economic development. Fornon‐profits, it means helping to grow their social impact.
We address all the problems that are involved in growth: strategy,marketing, pricing, innovation, new product development, new markets,organisation, leadership, economic competitiveness.
We bring to our clients specialised industry and functional expertise.We invest significant resources in building knowledge. We see it as ourmission to bring this knowledge to our clients and we publish much of itfor the benefit of others.
A hallmark of our work is rigorous, fact‐based analysis, grounded inproven methodologies. We rely on data because it provides clarity andaligns people.
However, we deliver results, not reports. To that end, we work side byside with our clients to create and implement practical solutions.
The Coriolis name
The coriolis force, named for French physicist Gaspard Coriolis (1792‐1843), may be seen on a large scale in the movement of winds andocean currents on the rotating earth. It dominates weather patterns,producing the counterclockwise flow observed around low‐pressurezones in the Northern Hemisphere and the clockwise flow around suchzones in the Southern Hemisphere. To us it means understanding thebig picture before you get into the details.
PO Box 90‐509, Victoria Street West, Auckland 1142, New ZealandTel: +64 9 623 1848 www.coriolisresearch.com

The objective of this report is to provide a factual source of high quality information on the current situation in the New Zealand Food and Beverage export markets for four audiences:
‐ Investors (domestic or international)‐ Industry participants (firms & individuals)‐ Government (across all roles and responsibilities)‐ Scientific researchers (academic, government & firm)
It creates a common set of facts and figures on the current situation in the industry.
It draws conclusions on potential industry strategic directionsand highlights opportunities for further investment and identifies how New Zealand can potentially triple exports by 2025
It forms a part of the wider Food & Beverage Information Project and will be updated annually.
PAGE 3

TABLE OF CONTENTS
Section Page
Contents 4
Glossary of terms 5
Methodology & data sources 6
F&B IP Overview 8
New Zealand F&B trade overview 10
New Zealand performance by region/market 16
a. High priority markets
1. Australia/Pacific Islands 23
2. South East Asia 33
3. East Asia 44
b. Secondary markets
1. South Asia 54
2. North Africa/Middle East/Central Asia 59
3. North America 64
4. Europe 70
c. Other markets 75

GLOSSARY OF TERMS
PAGE 5
This report uses the following acronyms and abbreviations
A$/AUD Australian dollar NA/ME/CA North Africa / Middle East / Central Asia
ABS Absolute change NZ New Zealand
ANZSIC AU/NZ Standard Industry Classification NZ$/NZD New Zealand dollar
AU Australia R&D Research and Development
Australasia Australia and New Zealand S Asia South Asia (Indian Subcontinent)
b Billion SE Asia South East Asia
CIF Cost, Insurance and Freight S.H./N.H. Southern/Northern Hemisphere
CAGR Compound Annual Growth Rate SS Africa Sub‐Saharan Africa
C/S America Central & South America (Latin America) T/O Turnover
CRI Crown Research Institute US/USA United States of America
CY Calendar year (ending Dec 21) US$/USD United States dollar
E Asia East Asia UK United Kingdom
EBITDA Earnings before interest, tax, depreciation and amortization
YE/YTD Year ending/Year to date
FOB Free on Board Sources
FY Financial year (of firm in question) AR Annual report
£/GBP British pounds Ce Coriolis estimate
HS Codes Harmonised System Codes for commodity classifications
Ci Coriolis interview
JV Joint venture K Kompass
m Million Ke Kompass estimate
n/a Not available/not applicable ws Website

METHODOLOGY & DATA SOURCES
PAGE 6 * Food and Agriculture Organisation of the United Nations
Data was from a variety of sources, and has a number of identified limitations
- This report uses a range of information sources, both qualitative and quantitative.
- The numbers in this report come from multiple sources. While we believe the data are directionally correct, we recognise the limitations in what information is available. - In many cases different data sources disagree (e.g.
Statistics New Zealand vs. FAO* vs. UN Comtrade). - Many data sources incorporate estimates of industry
experts. - As one example, in many cases, the value and/or volume
recorded as exported by one country does not match the amount recorded as being received as imports by the counterparty [for understood reasons].
- In addition, in some places, we have made our own clearly noted estimates.
- Coriolis has not been asked to independently verify or audit the information or material provided to it by or on behalf of the Client or any of the data sources used in the project.- The information contained in the report and any
commentary has been compiled from information and material supplied by third party sources and publicly available information which may (in part) be inaccurate or incomplete.
- Coriolis makes no representation, warranty or guarantee, whether express or implied, as to the quality, accuracy, reliability, currency or completeness of the information provided in the report.
- All trade data analysed in all sections of the F&B Information project are calculated and displayed in US$. This is done for a range of reasons:1. It is the currency most used in international trade2. It allows for cross country comparisons (e.g. vs. Denmark)3. It removes the impact of NZD exchange rate variability4. It is more comprehensible to non‐NZ audiences (e.g. foreign
investors)5. It is the currency in which the United Nations collects and
tabulates global trade data
- The opinions expressed in this report represent those of the industry participants interviewed and the authors. These do not necessarily represent those of Coriolis Limited or the New Zealand Government.
- If you have any questions about the methodology, sources or accuracy of any part of this report, please contact Tim Morris, the report’s lead author at Coriolis, on +64 9 623 1848

SPECIFIC UN COMTRADE DATA LIMITATIONS
- The data presented is accurate to its source, but not necessarily to New Zealand data
- The data analysed in this report is based on data provided by member governments to the United Nations.
- However, in the data the reported exports of one country regularly do not agree with the reported imports of another (in both volume and value).
- As the UN says: “Imports reported by one country do not coincide with exports reported by its trading partner. Differences are due to various factors including valuation (imports CIF, exports FOB), differences in inclusions/ exclusions of particular commodities, timing etc.”
- As a simple example, New Zealand paperwork submitted to New Zealand customs says New Zealand sent NZ$202,569,027 worth of dairy to Sri Lanka in 2010 but Sri Lanka (the receiving country) says it only received US$63,365,322 in 2010. There are a wide range of reasons why this could be the case.
- Q: Why don’t you just use NZ data?- If we use only New Zealand data, we can not calculate New Zealand's share of
Sri Lanka's imports. Using the UN data we can then assess how well New Zealand is performing, determine the competition and see how much growth is available.
- The interesting/useful information is not that we send US$420m to Singapore, but rather than this amounts to $84/person and this is only 5% of all their F&B imports. France sends twice as much as us. None of that is visible if we work with New Zealand export stats rather than country import stats.
- Our customs data only shows where the person filling out the export documentation states it is going and approximates its worth. As New Zealand does not charge duties on exports, value is more important on import documentation than export. Value is an estimate 2+ months prior to sale in market and is close but almost inevitably wrong.
- In addition where product ends up, can in many cases be a different from where the ship is going.
- Sending/receiving data is generally very accurate for some markets (e.g.
Australia, Japan), with some slight variance based on what is measured (FOB, CIF, etc.) and timing (product sent in December, arrives January)
- Aggregate global received volume is close enough to New Zealand’s sent volume. Disagreement is on where it went and how much it was worth.
- New Zealand data is not always correct. For example, New Zealand kiwifruit and avocado export data to Australia is incorrect. The Australian data is more accurate.
- As another example, New Zealand appears to send a lot to countries with ports, but little to landlocked countries. However, many countries not on a coast believe they receive product from New Zealand that New Zealand Customs do not know was sent.
- If New Zealand is doing very well in Central Asia it isn't necessarily going to show up in New Zealand export paperwork. Many of these countries receive four times as much from New Zealand as New Zealand Customs thinks is sent to them.
- For more details on the issue, the dataset methodology is available here:- http://unstats.un.org/unsd/trade/methodology%20IMTS.htm
- There is extensive discussion of the issue in the UN International Trade Statistics Knowledgebase:
- http://unstats.un.org/unsd/tradekb/Knowledgebase/
- If you have a country level concern the explanatory notes by country are here:- http://comtrade.un.org/db/mr/daExpNotebyRepYear.aspx
PAGE 7
The United Nations Comtrade database has specific important limitations around data

Structure of the New Zealand Food & Beverage Information Project(2011)
F&B INFORMATION PROJECTThe New Zealand Food & Beverage Information Project is designed to be the foundation of facts and figures on which a range of audiences can build
PAGE 8 Note: Every year two subsectors are completed in more detail. Seafood and Nutraceuticals in 2011
Dairy Sector
Meat Sector
ProduceSector
Seafood Sector
NutraceuticalsSector
Processed Foods Sector
Beverages Sector
Investor’s Guide
Global Markets
Overview
Sectors
Industry Snapshot
Markets High Potential Market Profiles
FirmsInvestors Government
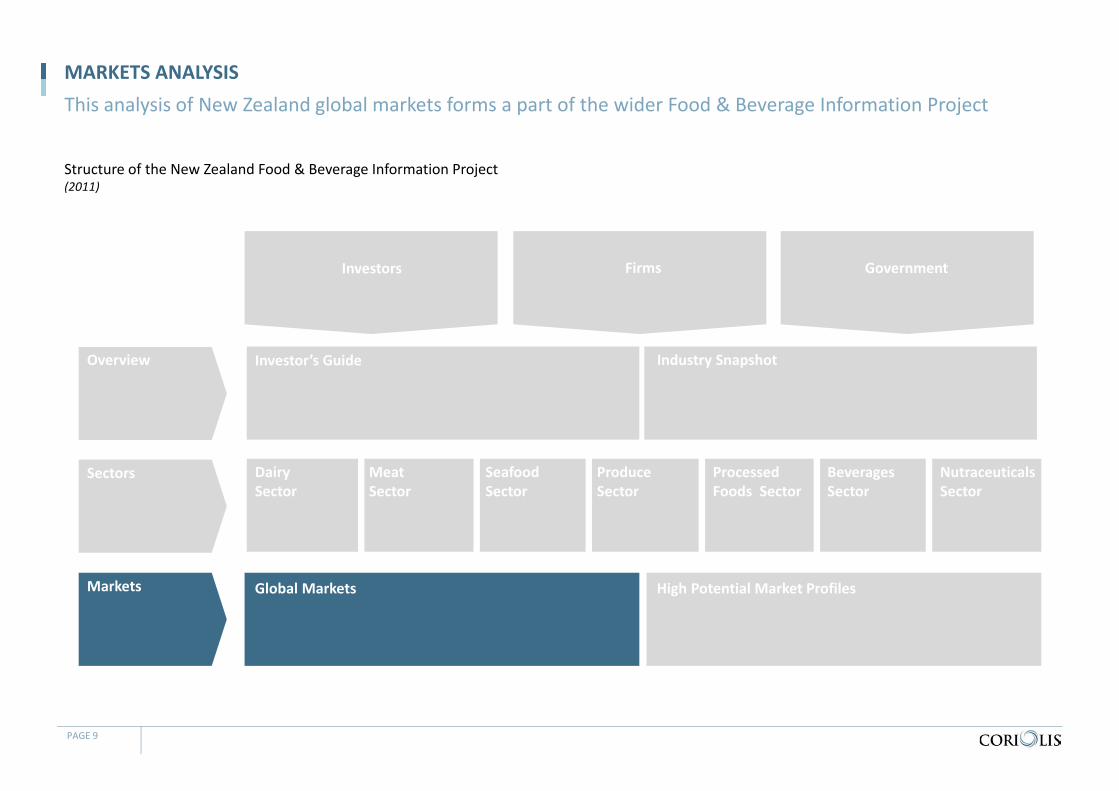
Structure of the New Zealand Food & Beverage Information Project(2011)
MARKETS ANALYSISThis analysis of New Zealand global markets forms a part of the wider Food & Beverage Information Project
PAGE 9
FirmsInvestors Government
Dairy Sector
ProduceSector
Seafood Sector
NutraceuticalsSector
Processed Foods Sector
Beverages Sector
Investor’s GuideOverview
Sectors Meat Sector
Industry Snapshot
High Potential Market ProfilesMarkets Global Markets

TABLE OF CONTENTS
Section Page
Contents 4
Glossary of terms 5
Methodology & data sources 6
F&B IP Overview 8
New Zealand F&B trade overview 10
New Zealand performance by region/market 16
a. High priority markets
1. Australia/Pacific Islands 23
2. South East Asia 33
3. East Asia 44
b. Secondary markets
1. South Asia 54
2. North Africa/Middle East/Central Asia 59
3. North America 64
4. Europe 70
c. Other markets 75

OVERVIEW – THE PATH FORWARD
Situation- In the early days of its founding New Zealand was, conceptually
speaking, Britain’s farm. The country was the same size at the United Kingdom, but with a fraction of the population. The country produced staples of the English diet such as lamb, beef, butter, cheese and apples. These were produced in large quantities on a counter‐seasonal basis for shipment to the “home country” and other rich Western markets.
- There is the perception by many today that this is still the case. If you were to ask the average person on the street in New Zealand today where the country’s food exports go, you would still get some form of the “Food to Britain” narrative. Many smaller food and beverage manufacturers, in our experience, would also articulate something similar.
- Reality is very different. New Zealand is in the middle of a fundamental transition from feeding Westerners to feeding the Asia‐Pacific region. This transition is driving rapid change in the New Zealand food industry in what is being produced and where it is being sold. Key exports today include:- Milk powder for Asian dairy factories, used to produce
yoghurt and other dairy products- Frozen french fries, frozen hamburgers, and processed
cheese for fast food restaurants in South East Asia - Gold kiwifruit for Asian consumers
- Imagine an alternative reality where New Zealand was colonised not by England, but rather Japan or China. In this reality, New Zealand would produce very different foods and beverages. This is what the future potentially looks like.
Potential future strategic direction
- The export strategy of the typical New Zealand food and beverage firm thirty years ago was simple: go to the UK and sell to Sainsbury and Tesco.
- This report presents a very different export growth pathway for the New Zealand food & beverage exporter of today:1. Ensure you are the #1 or #2 in your category in NZ before
considering export2. Start in Australia: focus on winning “next door” and
creating a business 5x the size of NZ; consider strategic acquisitions to achieve this goal
3. Take the Pacific Islands seriously; in aggregate a large market where New Zealand has a good share
4. SE Asia is the next logical market to target; start in Singapore and expand to the other countries in the region
5. In East Asia, start in Hong Kong and Taiwan, then expand to the larger economies
This report measures and benchmarks New Zealand’s food & beverage export performance across key global regions and countries; it also paints a picture of the path forward
PAGE 11

New Zealand F&B trade value: exports vs. imports(US$b; 1965‐2010)
NZ F&B TRADE BALANCENew Zealand has a strong and growing trade surplus in food and beverage
PAGE 12 Note: does not exactly match other data due to use of SITC codes (rather than HT codes, which are not available back this far) for understood reasons; Source: UN Comtrade; Coriolis analysis
‐$5.0
$‐
$5.0
$10.0
$15.0
‐$5.0
$‐
$5.0
$10.0
$15.0
1965196619671968196919701971197219731974197519761977197819791980198119821983198419851986198719881989199019911992199319941995199619971998199920002001200220032004200520062007200820092010
Exports
Imports
Net tradebalance

New Zealand F&B import value(US$b; 2010)
NZ F&B IMPORTSNew Zealand imports a wide range of food and beverages; processed foods and beverages account for more than 55% of these imports
PAGE 13 Source: UN Comtrade database; Coriolis analysis
Dairy$113 4%
Meat$145 5%
Seafood$117 4%
Produce$308 11%
Grains$184 6%
Other$430 15%
Processed$1,184 42%
Beverages$360 13%
Total = US$2.8b$26 $113 $55
$145 $48
$117
$117
$308
$61
$184
$179
$430
$378
$1,184
$158
$360
2000 2010
Dairy
10 year New Zealand F&B import value(US$b; 2000 vs. 2010)
$2.8
$1.0
Meat
Seafood
Produce
Grains
Other
Processed
Beverages
16%10%
9%
10%
12%
9%
12%
9%
CAGR(00‐10)11%
Processed foods and beverages
55%

New Zealand export value by F&B total and by key segment(US$b; 2010)
F&B IMPORTANT TO TOTAL EXPORT VALUEFood and beverages (F&B) represent 54% of the total value of New Zealand’s exports
PAGE 14 Note: totals may not add due to rounding; Source: UN Comtrade database; Coriolis analysis
F&B$16.7 54%
Other$14.3 46% Dairy $7.8 47%
Meat $3.7 22%
Seafood $1.0 6%
Produce $1.3 8%
Grains $0.0 0%
Other $0.3 2%Processed $1.5
9%
Beverages $1.0 6%
Total = US$30.9b
Total = US$16.7b

New Zealand export value by F&B and non‐F&B(US$b; non‐inflation adjusted; 1965‐2010)
F&B GROWINGNew Zealand’s F&B exports have been growing
PAGE 15 1. CAGR = Compound Annual Growth Rate; Note: totals may not add due to rounding; Source: UN Comtrade database; Coriolis analysis
$0.5 $2.4
$5.6
$16.7
$0.4
$3.0
$7.9
$14.3
1965 1980 1995 2010
$30.9
$13.6
$5.5
$1.0
10.6%
13.7%
F&B
Allother
Rate of growth (CAGR1) in New Zealand export value by F&B and non‐F&B(CAGR; by 15 year periods; 1965‐2010)
65‐80
5.7%
6.7%
F&B
Allother
80‐95
7.5%
4.0%
F&B
Allother
95‐10
F&B
All other

TABLE OF CONTENTS
Section Page
Contents 4
Glossary of terms 5
Methodology & data sources 6
F&B IP Overview 8
New Zealand F&B trade overview 10
New Zealand performance by region/market 16
a. High priority markets
1. Australia/Pacific Islands 23
2. South East Asia 33
3. East Asia 44
b. Secondary markets
1. South Asia 54
2. North Africa/Middle East/Central Asia 59
3. North America 64
4. Europe 70
c. Other markets 75

Map of global regions used in our analysis(as used)
DEFINED GLOBAL REGIONSOur market analysis uses the following nine defined global regions
PAGE 17 Source: map (Wikipedia; free usage); Coriolis (colour and definitions)
Sub‐Saharan (SS) Africa
AustraliaPacific Islands
Central & South (C&S) America
NorthAmerica
East Asia
South East Asia
South Asia
Europe/Russia
North Africa/ Middle East/ Central Asia
(NA/ME/CA)

Aggregate annual F&B export value by key markets(US$b; %; 2010)
NZ F&B EXPORT VALUE BY REGIONNew Zealand exports F&B to a wide range of destinations; interestingly Asia is worth a third more than Europe, Russia and North America combined
PAGE 18 Note: totals may not add due to rounding; Source: UN Comtrade database; Coriolis analysis
Europe/Russia $2.8 17%
North America $2.0 12%
Australia/Pacific $2.1 13%
SE Asia $2.3 13%
East Asia $4.3 26%
South Asia $0.4 2%NA/ME/CA $1.6 9%
SS Africa $0.4 3%
C&S America $0.9 5%
Traditional Western markets~30%
Asianmarkets~40%
Total = $16.7b
North Africa/Middle EastCentral Asia

F&B export value by region over time(US$b; 2000 vs. 2010)
NZ F&B EXPORT VALUE BY REGION OVER TIMEGrowth is bring driven by Australia and Asia
PAGE 19 Note: totals may not add due to rounding; Source: UN Comtrade database; Coriolis analysis
$1.5 $2.8
$1.3
$2.0 $0.6
$2.1
$0.7
$2.3
$1.3
$4.3
$0.1
$0.4
$0.3
$1.6
$0.0
$0.4
$0.4
$0.9
2000 2010
Sub‐Saharan Africa
AustraliaPacific Islands
C&S America
NorthAmerica
East Asia
South East Asia
South Asia
Europe/Russia
25.7%
14.3%
9.3%
4.4%
12.3%
11.7%
17.8%
6.7%
16.6%
CAGR (00‐10)
10.4%$16.7
$6.2
+$0.4
+$1.6
+$0.5
+$0.7
+$2.9
+$1.5
+$0.3
+$1.3
+$1.2
Absolute (00‐10)
+$10.5
North Africa/Middle East/Central Asia

76%
53%
44%
34%25%
30% 29%23% 23%
17%
10%
27%
20%
23%
23%22%
15%21% 18%
12%
3%
4%
5%
7%
8%7%
9% 9%11%
13%
7%
5%
9%
6%
7%8%
8% 8% 8%
10%
0%
0%
4%
10%15% 6%
5% 6% 7%
10%
2%
3%
8% 9%6%
8%
10% 12% 11%14%
3%7% 11% 12%
16% 19%24% 22% 23% 26%
1965 1970 1975 1980 1985 1990 1995 2000 2005 2010
NZ F&B EXPORT MARKETS
Total New Zealand F&B exports by region(US$m; non‐inflation adjusted; 1965‐2010)
New Zealand in the middle of a fundamental transition from feeding Westerners to feeding the Asia‐Pacific region
PAGE 20 Source: UN Comtrade database; Coriolis analysis
$540
45 yearchange in share
$692 $1,085 $2,429 $2,572 $4,037 $5,565 $6,200 $11,078 $16,676
Europe ‐59%
9%
Other
Australia/ Oceania
10%
E Asia
SE Asia
4%
22%
12%
N America 2%
North Africa/Middle EastCentral Asia

F&B export value growth matrix(2010)
NZ F&B EXPORT GROWTH MATRIXNew Zealand F&B exports have a range of opportunities for growth
PAGE 21 Source: UN Comtrade database; Coriolis analysis
10%
26%
24%
22%
18%
$2.8 $3.2$2.2 $2.4 $2.6$0.6 $0.8 $1.2 $1.4 $1.6
20%
$0.2 $0.4
C&S America
$0.0 $1.0 $2.0 $3.00%
Europe/Russia
North America
Australia/Pacific
SE AsiaEast Asia
South Asia
$1.8
SS Africa
28%
2%
4%
NA/ME/CA
8%
12%
14%
16%
6%
10 year value CAGR(00‐10)
10 year absolute value growth(US$b; 2010)
Size of bubble = export value (US$b; 2010)
Small but fast growing
Traditional markets but slow growing
Solid performers
!!!!

Share of New Zealand export value by region by sector(% of US$; 2010)
SECTOR VALUE MIX BY REGIONExport value mix varies by market; developing markets dominated by dairy and meat; traditional US/EU markets more weighted to meat; Australia is the most balanced
PAGE 22 Note: totals may not add due to rounding; Source: UN Comtrade database; Coriolis analysis
24%
76%
34%
93%
76%
62%
90%
22%30%
10%
7%
15%
1%
20%
15%
8%
47%
48%
16%
5%
21%
1%
6%
0%
7%
10%
11%
5%
16%
2%2%
10%
1%
19%
6%
1%2%
4%
3%1% 1%
24%
5%9%
1% 1%1% 1% 3%
13%
1% 1% 3% 4% 3%
Australia/Pacific SE Asia East Asia South Asia NA/ME/CA SS Africa C&S America Europe/Russia North America
Processed foods
Seafood
Beverages
Meat
Grains
Produce
Other
Dairy

TABLE OF CONTENTS
Section Page
Contents 4
Glossary of terms 5
Methodology & data sources 6
F&B IP Overview 8
New Zealand F&B trade overview 10
New Zealand performance by region/market 16
a. High priority markets
1. Australia/Pacific Islands 23
2. South East Asia 33
3. East Asia 44
b. Secondary markets
1. South Asia 54
2. North Africa/Middle East/Central Asia 59
3. North America 64
4. Europe 70
c. Other markets 75

AUSTRALASIA/PACIFIC – RECOMMENDATIONS
Situation
- In aggregate Australia and the Pacific Islands are a large and attractive market for New Zealand food and beverage exporters- Close physically and culturally- Population of 32m (Australia 22m; P.I. 10m); same GDP as
India (aggregate nominal)- Mixture of highly developed markets and lower income
countries
- Region is effectively New Zealand’s home market
- New Zealand has excellent market share in the region- F&B import share typically 15‐30%- Higher in associated countries (e.g. Cook Islands)
- Significant trade agreements in place (e.g. CER1 with Australia 1983; Protocol on Investment in the New Zealand and Australia CER Agreement, 2011)
- New Zealand achieving strong value growth to Australia in particular (see “Moving to the Centre” report for details)
Potential market development strategy
- Start in Australia - Focus on winning “next door” rather than across a small
volume of exports across a wide range of countries- With Woolworths operating across both markets, New
Zealand supply is regularly being compared with Australian- New Zealand F&B exports are achieving excellent success
in Australia across a wide range of sectors and firms- Use own salesforce rather than outsource; consider
targeted acquisitions to build an in‐market presence
- Take Pacific Island market seriously- Do not operate under out dated assumptions or second
hand advice about levels of market development- In aggregate a large market where NZ F&B has strong share- French territories in particular are high income and have
modern global retailers (e.g. Carrefour; global #2)- Build a relationship with Carrefour and Casino;
leverage this into other markets - A small effort should produce strong results (as it is a low
priority for others)
- Consider a wider “island”‐focused strategy - New Zealand F&B exports are disproportionally successful
per capita in islands worldwide (e.g. Caribbean)
PAGE 24 1. CER Australia New Zealand Closer Economic Relations Trade Agreement; AANZFTA = ASEAN‐Australia‐New Zealand Free Trade Agreement
As a result of globalisation, Australia and the Pacific Islands are now New Zealand’s “home market”; they should be treated as such

Map of countries in Australasia/Pacific region(2010)
AUSTRALASIA/PACIFIC – REGIONAL OVERVIEWThe Australasian/Pacific Island region is now effectively New Zealand’s home market
PAGE 25 Source: Wikimedia Commons; Coriolis
New Zealand
Papua New Guinea
Australia
Aus/ Pacific, 0.5%
Other, 99.5%
Aus/ Pacific2%Other
98%
% of global population(people; 2010)
% of global gross domestic product(% US$; nominal; 2010)
Solomon Islands
Fiji
TongaNew
Caledonia
French Polynesia
Vanuatu
Tuvalu
MarshallIslands
Hawaii
Samoa
Tokelau
CookIslands
Kiribati
Fed State of MicronesiaPalau
The region has the same GDP
as India

AUSTRALASIA/PACIFIC – MARKET CHARACTERISTICS
Source: Coriolis
Australasian/Pacific Island markets have similar cuisine to NZ with common building blocks; markets also face a similar set of issues
Overview of key characteristics of the Australia / Pacific food & beverage market environment(2011)
Cuisine and culture Distribution Competitive environment
Food building blocks Market characteristics Key imported temperate foods and beverages
AU/NZ Pacific Islands AU/NZ Pacific Islands AU/NZ Pacific Islands
‐ Bread‐ Temperate fruit &
vegetables‐ Beef, chicken, pork‐ Processed foods‐ Local beer and wine;
imported spirits
‐ Tropical fruit‐ Tropical vegetables‐ Chicken, seafood‐ Sauces (e.g. fish sauce)‐ Beer and imported
wine and spirits
‐ Supermarket sector consolidated Expenditure on foodservice/food away larger than retail food (i.e. “spend more in restaurants than in supermarkets”)
‐ Retailers generally small and fragmentedby market
‐ Strong independent sector
‐ Many distributors have strong market power
‐ Inter‐regional trade‐ Premium spirits
(Brandy, Whisky, Gin)‐ Processed foods
‐ Grains‐ Meat‐ Temperate fruit and
vegetables‐ Processed foods‐ Imported foods for
tourists
Cultural & regulatory characteristics Supply chain issues Key suppliers of temperate foods and beverages
AU/NZ Pacific Islands AU/NZ Pacific Islands AU/NZ Pacific Islands
‐ Common regional food standards/regulations across AU/NZ
‐ Variable standards by market; many accept standards of others
‐ Some have EU standards
‐ Highly efficient modern supply chain
‐ Large number of small markets leading to high cost and inefficient distribution
‐ Some exceptions, particularly in French territories
‐ Inter‐regional‐ China‐ United States‐ Europe
‐ Australia‐ New Zealand‐ France‐ Other Europe‐ China
PAGE 26

Major regional groups with multi‐country operationsStrong operators in single market in region
Australia 823 super1,208 liquor561 petrol
742 super766 liquor619 conv174 dept
New Zealand 158 super48 conv
12 dept
French Polynesia
1 hyper2 super
1 super
Papua NewGuinea
New Caledonia
1 1 super
Fiji
Vanuatu 1 discount
Key chain food retail operators by outlet type* across Australia and select Pacific Island markets(2011)
AUSTRALASIA/PACIFIC – KEY SUPERMARKETS BY MARKETAustralasian and Pacific Island food retailing is still relatively fragmented outside AU/NZ
PAGE 27 *Supermarket, convenience, liquor, department, hypermarket; discount, Source: various company websites; various company annual reports; various published articles; Coriolis analysis
24 super 23 super
RB Patel
8 super
181 super/446 conv/94 liquor
21 super4 super 2 hyper 6 super1 hyper5 super
1,300+ super250 super 3 hyper

GDP/capita(US$/person; 2010 or latest available)
AUSTRALASIA/PACIFIC – KEY INDICATORSThe Australasian/Pacific region is made up of two large economies and a large number of small islands; while Australia is the key opportunity, the aggregate size of the Pacific Island market should not be ignored
PAGE 28 1. 1993 data (latest available); obviously greater today as it would be difficult for a country to import more F&B per capita than its GDP; Source: CIA World Fact Book; UN Comtrade database; Coriolis analysis
$930 $110
$6.1 $2.8 $3.3 $0.2 $0.2 $0.2 $0.6 $0.5 $0.0 $0.0 $3.0 $0.6 $0.2 $0.3 $0.6 $0.2 $0.0 $0.7 $0.0 $8.2 $0.1
22.4 4.4
0.3 0.2 0.2 0.0 0.0 0.0 0.1 0.1 0.0 0.0 0.8 0.2 0.1 0.1 0.2 0.1 0.0 0.5 0.0
6.7 0.1
$41,531 $25,025 $23,106
$15,579 $13,253 $12,296 $9,160 $8,200 $7,280 $6,899 $6,673 $3,690 $3,590 $3,168 $2,608 $2,490 $2,308 $2,145 $1,494 $1,277 $1,250 $1,218 $1,163
AustraliaNew Zealand
French PolynesiaGuam
New CaledoniaWallis & Futuna
Cook IslandsPalau
Northern MarianaAmerican Samoa
NiueNauru
FijiSamoa
Marshall IslandsTonga
VanuatuFed. Micronesia
TuvaluSolomon Islands
TokelauPapua New Guinea
Kiribati
Population(people; m; 2010)
GDP(US$b; 2010)
$9,399 $2,840
$400 $66 $351 $11 $23 $11 $11 $22 $3 $6 $292 $75 $19 $46 $42 $28 $2 $55 $3 $486
$26
Total F&B Import value(US$m; 2010)
$420 $648
$1,515 $368
$1,411 $717 $1,154
$557 $126 $335
$2,220 $557 $344 $419 $308 $441
$173 $254 $225 $106
$1,945 $72 $265
F&B Import $/capita(US$/person; 2010)
9.8m $28b $2b
In aggregate the Pacific Islands import US$2b worth of F&B
1

Dairy $1.1 7%
Meat $1.1 8%
Seafood $1.5 10%
Produce $1.1 8%
Grains $0.6 4%Other $1.7
12%
Processed $4.9 35%
Beverages $2.3 16%
Aggregate Australasia/Pacific total F&B import value from all source countries(US$b; 2010)
AUSTRALASIA/PACIFIC – TOTAL IMPORT VALUEAustralia is the largest market; regional trade is across a wide range of sectors, however processed foods and beverages account for 50%
PAGE 29 Source: UN Comtrade database; Coriolis analysis
Australia $9.4 66%
New Zealand $2.8 20%
Pacific Islands $2.0 14%
US$14.2b US$14.2b
By receiving country By product

NZ share of regional cross‐border exports/imports of F&B by sector(% of value; 2010)
AUSTRALASIA/PACIFIC – NZ PERFORMANCENew Zealand performs well in the region, in terms of share and sales across most sectors
PAGE 30 Note: Calculation is sum of exports to the region (or cross‐border/inter‐country trade); therefor New Zealand regional share excludes New Zealand sales to itself; likewise Australia share excludes Australia itself; Source: UN Comtrade database; Coriolis analysis
54%
18%
19%
23%
2%
4%
17%
21%
9%
10%
1%
8%
34%
8%
17%
9%
37%
72%
81%
69%
64%
88%
66%
70%
54%
18%
19%
23%
2%
4%
17%
21%
Dairy
Meat
Seafood
Produce
Grains
Other
Processed
Beverages
NZ Australia Other
$443
$152
$212
$191
$10
$46
$661
$369
Value of NZ F&B imports to region by sector(US$m; 2010)
Share of regional cross‐border F&B exports/imports by sector: NZ vs. AU vs. all other(% of value; 2010)

Value of F&B imports from NZ by country(US$m; 2010)
AUSTRALASIA/PACIFIC – NZ PERFORMANCENew Zealand performs very well across much of the region and is particularly strong in countries with an association with New Zealand (i.e. Niue and the Cook Islands)
PAGE 31 Note: Some countries not shown due to lack of data; all data should be treated as directional due to data quality issues; data is reporter‐received by country not sent by New Zealand; Source: UN Comtrade database; Coriolis analysis
$1,789
$78
$5
$50
$3
$21
$0
$3
$9
$2
$79
$19
$0
$14
$0
$6
$47
$0
Australia
French Polynesia
Guam
New Caledonia
Wallis & Futuna
Cook Islands
Palau
Northern Mariana
American Samoa
Niue
Fiji
Samoa
Marshall Islands
Tonga
Tuvalu
Solomon Islands
Papua New Guinea
Kiribati
$80
$297
$30
$200
$185
$1,058
$1
$31
$141
$1,385
$93
$108
$3
$131
$34
$12
$7
$3
NZ F&B imports per capita by country(US$/person; 2010)
NZ share of total F&B import value by country(%; 2010)
19%
20%
8%
14%
26%
92%
0%
25%
42%
62%
27%
26%
1%
30%
15%
12%
10%
1%
US$338m
In aggregate the Pacific Islands import US$2b
worth of F&B; how do we get more
share?

NewZealand
Australia USA Canada Europe SouthAmerica
China Japan Other EAsea
Beverages
Processed
Other
Grain
Produce
Seafood
Meat
Dairy
Aggregate export value to Australia/Pacific Islands by sector: NZ vs. select temperate countries or regions(US$b; 2010)
AUSTRALASIA/PACIFIC – IMPORT VALUE INTO REGION ACROSS PEERSNew Zealand already performs well into our closest neighbours; however opportunities remain to take further share from temperate peers
PAGE 32 Note: Some countries not shown due to lack of data; all data should be treated as directional due to data quality issues; Source: UN Comtrade database; Coriolis analysis
Comments/Notes
‐ To triple F&B exports to Australia and the Pacific looks hard; we should, however be able to ”eat Europe’s lunch”
‐ Peers in similar temperate zones (temperate peers) will send similar products to Australia and the Pacific Islands
Note
‐ Data is as reported by sender; does not sync with data as reported by receiver (for understood methodological reasons)
$2.1
$0.4
$1.4
$0.2 $0.2$0.1 $0.1
$0.7
$2.2
Only AU exports to Pacific Islands
High cost Europe sends more than us; why aren’t
we supplying this?

TABLE OF CONTENTS
Section Page
Contents 4
Glossary of terms 5
Methodology & data sources 6
F&B IP Overview 8
New Zealand F&B trade overview 10
New Zealand performance by region/market 16
a. High priority markets
1. Australia/Pacific Islands 23
2. South East Asia 33
3. East Asia 44
b. Secondary markets
1. South Asia 54
2. North Africa/Middle East/Central Asia 59
3. North America 64
4. Europe 70
c. Other markets 75

SE ASIA – RECOMMENDATIONS
Situation
- South East Asia is a highly attractive market for New Zealand food and beverage exporters- Next closest market after Australia- Population of 583m (more than all of Central and South
America) - Increasing wealth leading to increased demand for
imported food and beverages
- South East Asia is a natural trading partner for New Zealand- Tropical environment unable to efficiently produce many
temperate foodstuffs
- New Zealand has a relatively strong presence in the region- Awareness by some consumers of New Zealand as a quality
supplier- Long term (100 year+) supply of dairy and meat- Particularly into former co‐members of the British Empire
- Significant trade agreements in place or in development- AANZFTA1, 2010 (12 member) linkage in development- Malaysia NZ FTA, 2010- Thailand NZ, CEP, 2005- Singapore NZ CEP, 2001
Recommended market entry strategy
- Start in Singapore - High income country with rule‐of‐law that speaks English- Only 5m people so “do‐able” for New Zealand
manufacturing to scale‐up to supply without major capital expenditure
- Modern supermarket sector consolidated into 3 chains- Commit to the market; treat as a “region of New Zealand”;
put salespeople in the market; regularly call on retailers; run promotions
- Central location that is a natural regional base and distribution hub
- Already imports proportionally a lot of F&B from New Zealand
- Expand into Malaysia- Slightly larger population than Australia (28m people)- Already imports proportionally a lot of F&B from New
Zealand- Easily serviced from Singapore
- Expand into other key markets in the region- Thailand, Indonesia, the Philippines and Viet Nam
PAGE 34 1. AANZFTA = ASEAN‐Australia‐New Zealand Free Trade Agreement; CEP = Closer Economic Partnership; FTA = Free Trade Agreement
South East Asia is the next logical market for New Zealand food & beverage exporters with a strong presence in their home market (New Zealand, Australia and the Pacific Islands)

Map of countries in South East Asia/ASEAN(2010)
SE ASIA – REGIONAL OVERVIEWSouth East Asia is the closest regional market to New Zealand after Australasia; it represents almost 10% of world population and 3% of world GDP
PAGE 35 Note: East Timor is not currently part of ASEAN; Source: Wikimedia Commons; Coriolis
Myanmar
Indonesia
Vietnam
Philippines
Malaysia
Thailand
Laos
Cambodia
East Timor
Singapore
Brunei
SE Asia9%Other
91%
SE Asia3%
Other97%
% of global population(people; 2010)
% of global gross domestic product(% US$; nominal; 2010)
ASEAN Flag
All countries here are ASEAN members

SE ASIA – MARKET CHARACTERISTICS
Source: Coriolis
South East Asian markets have similar cuisine with common building blocks; markets also face a similar set of issues
Overview of key characteristics of the South East Asian food & beverage market environment(2011)
Cuisine and culture Distribution Competitive environment
Food building blocks Market characteristics Key imported temperate foods and beverages
‐ Rice‐ Tropical fruit (rambutan, durian, etc.)‐ Tropical/Asian vegetables‐ Chicken, seafood‐ Sauces (e.g. fish sauce)‐ Beer and local spirits
‐ Continuing strong presence of wet markets and fresh specialists
‐ Supermarket sector consolidated within markets but less so across markets
‐ Expenditure on foodservice/food away larger than retail food (i.e. “spend more in restaurants than in supermarkets”)
‐ European spirits (Brandy, Whisky, Gin)‐ Ingredient milk powder for local manufacturers to turn
into consumer dairy items (e.g. yoghurt drinks, infant formula)
‐ Apples‐ Beef
Cultural & regulatory characteristics Supply chain issues Key suppliers of temperate foods and beverages
‐ Religious limitations on protein consumption (Muslimpeoples don’t eat pork and require meat to be halal)
‐ Multiple languages across region leading to requirement for packaging by country
‐ No common regional food standards or regulations‐ Muslim restrictions on alcohol consumption‐ Various degrees of alcohol intolerance (ALDH2
deficiency) within population (particularly those of East Asian origin)
‐ Markets somewhat bi‐polar with world‐class, best practice retailers (e.g. Tesco) alongside wet markets
‐ Modern supply chains developing in higher income countries with spread of chain supermarket operators
‐ Sophistication of supply chain more variable elsewhere‐ Convoluted supply chain to support continuing
significant role of numerous wet markets selling fresh meat, seafood, fruit and vegetables
‐ Australia‐ China‐ United States‐ Europe‐ New Zealand
PAGE 36

Major regional groups with multi‐country operationsStrong operators in single market in region
Singapore 7 hyper105 super
2 hyper
Malaysia 123+17+2 hyper/super
25 hyper14 conv
32 stores 23 dept4 super
Thailand 663 stores 13 super 16 hyper89 super
Indonesia 120 super38 hyper125 conv
67 hyper16 super
Philippines
Vietnam 3 super 14 hyper
Brunei 1 hyper2 super
1 hyper
Key chain food retail operators by outlet type* across higher income South East Asia(2011)
SE ASIA – KEY SUPERMARKETS BY MARKETSouth East Asian food retailing is a mixture of regional chains and strong local operators
PAGE 37 *Supermarket, convenience, liquor, department, hypermarket; discount, Source: various company websites; various company annual reports; various published articles; Coriolis analysis

GDP/capita(US$/person; 2010)
SE ASIA – KEY INDICATORSSouth East Asian countries range from very rich to very poor; the key opportunity for F&B exports is in the six major economies
PAGE 38 Source: CIA World Fact Book; UN Comtrade database; Coriolis analysis
$15
$163
$207
$266
$515
$159
$92
$6
$11
$34
$1
0.4
5.0
28.3
63.5
234.2
94.0
85.8
6.3
13.4
50.5
1.1
$36,750
$32,701
$7,327
$4,194
$2,199
$1,688
$1,070
$905
$814
$679
$528
Brunei
Singapore
Malaysia
Thailand
Indonesia
Philippines
Vietnam
Laos
Cambodia
Myanmar
East Timor
Population(people; m; 2010)
GDP(US$b; 2010)
$0.3
$9.1
$12.0
$7.3
$9.5
$6.1
$4.0
$0.2
$0.2
$0.0
Total F&B Import value(US$b; 2010)
$652
$1,826
$424
$114
$40
$65
$46
$‐
$13
$3
$14
F&B Import $/capita(US$; 2010)
N/A
Australia$9.4b
These six countries are the primary opportunity; 511m people, importing F&B worth $49b

Aggregate SE Asia total F&B import value from all source countries(US$b; 2010)
SE ASIA – TOTAL IMPORT VALUEThe six major markets account for 99% of F&B imports; F&B imports are spread across a range of sectors
PAGE 39 Source: UN Comtrade database; Coriolis analysis
Brunei $0.3 1%
Singapore $9.1 19%
Malaysia $12.0 25%
Thailand $7.3 15%
Indonesia $9.5 19%
Philippines $6.1 13%
Vietnam $4.0 8%Laos $0.0
0%
Cambodia $0.2 0%
Myanmar $0.2 0%
East Timor $0.0 0%
US$48.6b US$48.6b
By receiving country
Top 699%
Dairy $4.51 9% Meat $2.29 5%
Seafood $4.49 9%
Produce $4.24 9%
Grains $9.29 19%
Other $12.56 26%
Processed $8.03 17%
Beverages $3.13 6%
By product
e.g. palm oil, soy beans
(mostly inter‐regional)

Aggregate SE Asia total F&B import value from all source countries by mega‐region(US$b; 2010)
SE ASIA – IMPORT VALUE BY SOURCEOne third of F&B imports come from within the region, two thirds from outside the region
PAGE 40 Source: UN Comtrade database; Coriolis analysis
US$48.6b
SE Asia Inter‐Regional $15.5
32%
External $33.0 68%
By source By source by product
8%
4%
30%
21%
34%
51%
36%
17%
92%
96%
70%
79%
66%
49%
64%
83%
Dairy
Meat
Seafood
Produce
Grains
Other
Processed
Beverages
SE AsiaInter‐
Regional
External

Value of NZ F&B imports by country(US$b; 2010)
SE ASIA – NZ PERFORMANCENew Zealand performs very well in Singapore; Malaysia is strong and Thailand, Indonesia, the Philippines and Vietnam stand out as opportunities
PAGE 41 Source: UN Comtrade database; Coriolis analysis
$0.00
$0.42
$0.48
$0.34
$0.53
$0.38
$0.11
$‐
$0.002
$0.01
$0.000
Brunei
Singapore
Malaysia
Thailand
Indonesia
Philippines
Vietnam
Laos
Cambodia
Myanmar
East Timor
$6
$84
$17
$5
$2
$4
$1
$‐
$0
$0
$0
NZ F&B imports per capita by country(US$/person; 2010)
NZ share of total F&B import value by country(US$b; 2010)
1%
5%
4%
5%
6%
6%
3%
1%
0%
What is required to move these countries to
Australian levels of share (i.e. ~20%)

NZ share of regional F&B imports by sector(% of value; 2010)
SE ASIA – NZ PERFORMANCENew Zealand performs well in dairy and meat into SE Asia; processed foods also showing some success
PAGE 42 Source: UN Comtrade database; Coriolis analysis
36%
12%
1%
2%
0%
0%
2%
1%
Dairy
Meat
Seafood
Produce
Grains
Other
Processed
Beverages
$1.6
$0.3
$0.05
$0.1
$0
$0.02
$0.2
$0.03
Value of NZ F&B imports to region by sector(US$b; 2010)

Aggregate export value to South East Asia by sector: NZ vs. select temperate countries or regions(US$b; 2010)
SE ASIA – IMPORT VALUE INTO REGION ACROSS TEMPERATE PEERSTemperate country/region peer group suggest (1) there is more opportunity in dairy and (2) processed and beverages are opportunities
PAGE 43 Source: UN Comtrade database; Coriolis analysis
Comments/Notes
‐ To triple F&B exports to SE Asia New Zealand would need to export more than Europe to the region
‐ To grow NZ needs to either grow faster than the growth of the market or take sales from competitors
‐ Data here suggests there are further opportunities to take dairy sales from the US and Europe
‐ Data here suggests that there are further opportunities in processed foods and beverages; conceptually NZ should be able to take share from Europe and the US
Note
‐ While this analysis may look simple, the underlying dataset contained 103,807 data points
‐ Data is as reported by sender; does not sync with data as reported by receiver (for understood methodological reasons)
NewZealand
Australia USA Canada Europe S America China Japan Other EAsia
Beverages
Processed
Other
Grains
Produce
Seafood
Meat
Dairy
$2.3
$4.3
$4.9
$0.8
$6.2
$3.7
$4.3
$0.6
$1.2

TABLE OF CONTENTS
Section Page
Contents 4
Glossary of terms 5
Methodology & data sources 6
F&B IP Overview 8
New Zealand F&B trade overview 10
New Zealand performance by region/market 16
a. High priority markets
1. Australia/Pacific Islands 23
2. South East Asia 33
3. East Asia 44
b. Secondary markets
1. South Asia 54
2. North Africa/Middle East/Central Asia 59
3. North America 64
4. Europe 70
c. Other markets 75

EAST ASIA – RECOMMENDATIONS
Situation
- East Asia is a highly attractive market for New Zealand food and beverage exporters - Huge potential market (1.6b people)- Either sophisticated high wealth consumers or rapidly
becoming so, leading to increased demand for premium imported food and beverages
- A clear “once in a lifetime” opportunity to grow with China for the short‐medium term- Long run China will be a major competitor in F&B to New
Zealand (regions with similar climate but more scale and less cost)
- China should be self‐sufficient in dairy within a decade
- New Zealand has a relatively strong presence in the region- Strong position in dairy (38% of regional dairy imports)- Position in meat, produce and processed foods
- Significant trade agreements in place or in development- On‐going discussions with Japan- HK, China NZ CEP, 2011 (NZ China FTA, 2008)- Korea NZ FTA negotiations
- New Zealand currently poor at developing high status‐brands demanded by regions’ consumers
Recommended market entry strategy
- Start in Hong Kong (similar in many ways to Singapore)- High income country with rule‐of‐law that speaks English- Only 7m people so “do‐able” for New Zealand
manufacturing to scale‐up to supply without major capital expenditure
- Modern supermarket sector consolidated into 2 chains- Commit to the market; treat as a “region of New Zealand”;
put salespeople in the market; regularly call on retailers; run promotions
- Central location that is a natural regional base and distribution hub
- Already imports proportionally a lot of F&B from New Zealand
- Expand into Taiwan- Similar population to Australia (23m people)- Already imports proportionally a lot of F&B from New
Zealand- Can be ignored by others/competitors
- Expand into other key markets in the region- Japan, South Korea and China - Leave China to last; easy to do poorly, difficult to do well
PAGE 45 CEP = Closer Economic Partnership; FTA = Free Trade Agreement
East Asia is the current shining opportunity for New Zealand F&B exports

Map of countries in East Asia(2010)
EAST ASIA – REGIONAL OVERVIEWEast Asia represents 23% of world population and 20% of world GDP
PAGE 46 Source: Wikimedia Commons; Coriolis
Taiwan
East Asia23%
Other77%
East Asia20%
Other80%
% of global population(people; 2010)
% of global gross domestic product(% US$; nominal; 2010)
Japan
SouthKorea
NorthKorea
China
Mongolia
Hong KongMacao

EAST ASIA – MARKET CHARACTERISTICS
Source: Coriolis
While East Asia has three distinct major cultures (Chinese, Japanese and Korean), the markets have strong common characteristics
Overview of key characteristics of the East Asian food & beverage market environment(2011)
Cuisine and culture Distribution Competitive environment
Food building blocks Market characteristics Key imported temperate foods and beverages
‐ Rice and wheat (more in Northern regions)‐ Temperate and tropical fruit ‐ Asian vegetables‐ Pork, chicken, seafood, beef‐ Processed foods‐ Sauces (e.g. fish sauce)‐ Beer and local spirits
‐ Continuing strong presence of wet markets and fresh specialists
‐ Supermarket sector highly fragmented across most markets
‐ Expenditure on foodservice/food away larger than retail food (i.e. “spend more in restaurants than in supermarkets”)
‐ European spirits (Brandy, Whisky, Gin)‐ Ingredient milk powder for local manufacturers to turn
into consumer dairy items (e.g. yoghurt drinks, infant formula)
‐ Counter‐seasonal temperate fruit‐ Beef
Cultural & regulatory characteristics Supply chain issues Key suppliers of temperate foods and beverages
‐ Key languages predominantly Mandarin, Cantonese, Japanese & Korean leading to requirement for packaging by country
‐ No common regional food standards or regulations‐ Various degrees of alcohol intolerance (ALDH2
deficiency) within population (particularly those of East Asian origin)
‐ Convoluted supply chains involving multiple levels of distributors across all markets
‐ Markets somewhat bi‐polar with world‐class, best practice retailers (e.g. Tesco) alongside wet markets
‐ Continuing significant role of numerous specialists and wet markets selling fresh meat, seafood, fruit and vegetables (particularly in China)
‐ Inter‐regional‐ Australia‐ United States‐ Europe‐ New Zealand
PAGE 47

Major regional groups with multi‐country operationsStrong operators in single market in region
Japan Exited 142 super 321 super 8 hyper
South Korea
Exited 305 hyper Exited 7 hyper
Taiwan 294 super 421 hyper2 super
Exited 24 hyper 6 hyper
Hong Kong 282 super964 conv338 HBC
Exited Exited
China 551 conv163 HBC
1,416 hyper
57 discount
88 hyper 322 hyper 114 hyper
Key chain food retail operators by outlet type* across select East Asian countries(2011)
EAST ASIA – KEY SUPERMARKETS BY MARKETEast Asian food retailing is highly competitive with strong local chains battling many of the largest retailers in the world
PAGE 48 *Supermarket, convenience, liquor, department, hypermarket; discount, Source: various company websites; various company annual reports; various published articles; Coriolis analysis
240 super
… many more
… many more

GDP/capita(US$/person; 2010)
EAST ASIA – KEY INDICATORSEast Asian countries range from very rich to very poor; the key opportunity for future F&B exports to the region is China
PAGE 49 Source: CIA World Fact Book; UN Comtrade database; Coriolis analysis
$5,108
$22
$209
$810
$362
$4,814
$4
$28
127
1
7
50
23
1,339
3
24
$40,100
$40,022
$29,716
$16,268
$15,628
$3,596
$1,523
$1,172
Japan
Macao SAR
Hong KongSAR
South Korea
Taiwan
China
Mongolia
North Korea
Population(people; m; 2010)
GDP(US$b; 2010)
$59.3
$0.8
$17.2
$14.6
$9.4
$57.9
$0.2
$0.4
Total F&B Import value(US$b; 2010)
$466
$1,536
$2,447
$293
$407
$43
$82
$15
F&B Import $/capita(US$; 2010)
Australia$9.4b
In 2011 China moved into the #1 position in East Asia and #2 in the world after the USA

Dairy $5.3 3%
Meat $21.5 14%
Seafood $26.2 16%
Produce $13.3 8%
Grains $14.8 9%
Other $52.2 33%
Processed $17.3 11%
Beverages $9.1 6%
Aggregate East Asia total F&B import value from all source countries(US$b; 2010)
EAST ASIA – TOTAL IMPORT VALUEEast Asia imported US$160b worth of F&B in 2010 spread across the five key markets
PAGE 50 Source: UN Comtrade database; Coriolis analysis
Japan $59.3 37%
Macao SAR $0.8 1%
Hong Kong SAR $17.2 11%
South Korea $14.6 9%
Taiwan $9.4 6%China $57.9
36%
Mongolia $0.2 0%
North Korea $0.4 0%
US$160b US$160b
By receiving country
Top 699%
By product
e.g. palm oil, soy beans

NZ share of regional F&B imports by sector(% of value; 2010)
EAST ASIA – NZ PERFORMANCE BY SECTORNew Zealand performs well in dairy into East Asia; share is low otherwise with produce, meat and processed foods having limited presence
PAGE 51 Source: UN Comtrade database; Coriolis analysis
$2.0
$0.6
$0.4
$0.6
$0.0
$0.1
$0.5
$0.1
$3.3
$20.9
$25.9
$12.7
$14.8
$52.1
$16.9
$9.0
38%
3%
1%
4%
0%
0%
3%
1%
Dairy
Meat
Seafood
Produce
Grains
Other
Processed
Beverages
NZ Other
$2.0
$0.6
$0.4
$0.6
$0.0
$0.1
$0.5
$0.1
Value of NZ F&B imports to region by sector(US$b; 2010)
Value of total F&B imports to region by sector(US$b; 2010)

Value of NZ F&B imports by country(US$b; 2010)
EAST ASIA – NZ PERFORMANCE BY COUNTRYNew Zealand performs very well in Hong Kong; all other key countries appear to have opportunities for share growth
PAGE 52 Source: UN Comtrade database; Coriolis analysis
$1.2
$0.0
$0.3
$0.3
$0.5
$1.9
$0.0
$‐
Japan
Macao SAR
Hong KongSAR
South Korea
Taiwan
China
Mongolia
North Korea
$10
$18
$46
$6
$20
$1
$3
$‐
NZ F&B imports per capita by country(US$/person; 2010)
NZ share of total F&B import value by country(US$b; 2010)
2%
1%
2%
2%
5%
3%
4%
0%
What is required to move these countries to
Australian levels of share (i.e. ~20%)

NewZealand
Australia USA Canada Europe SouthAmerica
China Japan Other EastAsia
Beverages
Processed
Other
Grains
Produce
Seafood
Meat
Dairy
Aggregate export value to East Asia by sector: NZ vs. select temperate countries or regions(US$b; 2010)
EAST ASIA – IMPORT VALUE INTO REGION ACROSS PEERSWhile there are opportunities into temperate East Asia and growth is clearly possible, data suggests growth will come outside traditional raw ingredients
PAGE 53 Source: UN Comtrade database; Coriolis analysis
Comments/Notes
‐ Tripling F&B exports to East Asia would appear to be possible
‐ However, data suggests that a targeted approach is required
Note
‐ Data is as reported by sender; does not sync with data as reported by receiver (for understood methodological reasons)
$3.4
$6.2
$31.2
$6.9
$16.3
$25.8
$11.1
$1.5
$4.1

TABLE OF CONTENTS
Section Page
Contents 4
Glossary of terms 5
Methodology & data sources 6
F&B IP Overview 8
New Zealand F&B trade overview 10
New Zealand performance by region/market 16
a. High priority markets
1. Australia/Pacific Islands 23
2. South East Asia 33
3. East Asia 44
b. Secondary markets
1. South Asia 54
2. North Africa/Middle East/Central Asia 59
3. North America 64
4. Europe 70
c. Other markets 75

Map of countries in South Asia(2010)
SOUTH ASIAN – REGIONAL OVERVIEWThe South Asian region, encompassing the Indian Subcontinent, represents 23% of the world population but only 2% of world GDP
PAGE 55 Source: Wikimedia Commons; Coriolis
South Asia23%
Other77%
South Asia2%Other
98%
% of global population(people; 2010)
% of global gross domestic product(% US$; nominal; 2010)
India
Sri Lanka
Bangladesh
BhutanNepal
Pakistan
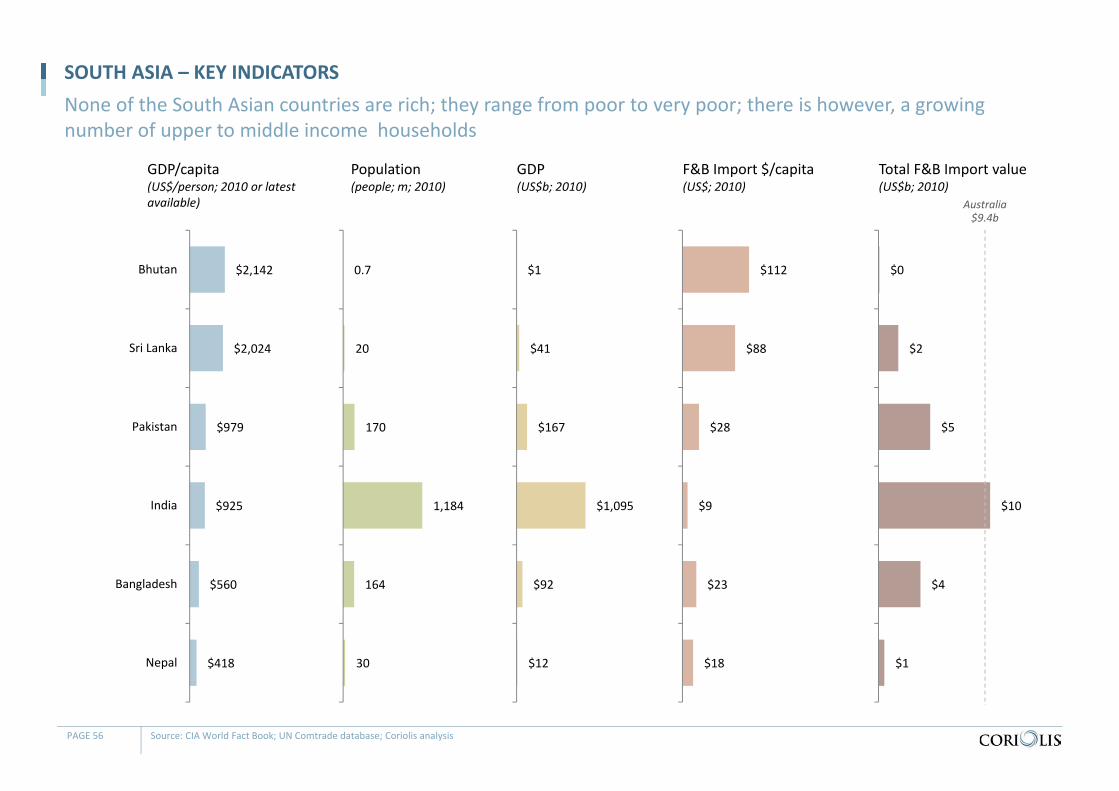
GDP/capita(US$/person; 2010 or latest available)
SOUTH ASIA – KEY INDICATORSNone of the South Asian countries are rich; they range from poor to very poor; there is however, a growing number of upper to middle income households
PAGE 56 Source: CIA World Fact Book; UN Comtrade database; Coriolis analysis
$1
$41
$167
$1,095
$92
$12
0.7
20
170
1,184
164
30
$2,142
$2,024
$979
$925
$560
$418
Bhutan
Sri Lanka
Pakistan
India
Bangladesh
Nepal
Population(people; m; 2010)
GDP(US$b; 2010)
$0
$2
$5
$10
$4
$1
Total F&B Import value(US$b; 2010)
$112
$88
$28
$9
$23
$18
F&B Import $/capita(US$; 2010)
Australia$9.4b

Dairy $0.6 3%
Meat $0.0 0%Seafood $0.2 1%
Produce $4.7 22%
Grains $1.6 7%
Other $12.8 61%
Processed $0.8 4%
Beverages $0.4 2%
Aggregate South Asia total F&B import value from all source countries(US$b; 2010)
SOUTH ASIA – TOTAL IMPORT VALUEIn aggregate South Asia imported US$21b worth of F&B in 2010 (about +23% more than Hong Kong); most imports are food basics rather than value‐added premium/processed F&B
PAGE 57 Source: UN Comtrade database; Coriolis analysis
Bhutan $0 0%
Sri Lanka $2 9%
Pakistan $5 22%
India $10 48%Bangladesh $4 18%
Nepal $1 3%
US$21b US$21b
By receiving country By product
e.g. sugar, oils & fat
India imports about as
much F&B as Singapore

Value of NZ F&B imports by country(US$m; 2010)
SOUTH ASIA – NZ PERFORMANCE BY COUNTRYNew Zealand achieves a respectable F&B import share in Sri Lanka and has opportunities for improvement elsewhere
PAGE 58 Source: UN Comtrade database; Coriolis analysis
$‐
$64
$36
$47
$28
$2
Bhutan
Sri Lanka
Pakistan
India
Bangladesh
Nepal
$‐
$3.12
$0.21
$0.04
$0.17
$0.07
NZ F&B imports per capita by country(US$/person; 2010)
NZ share of total F&B import value by country(US$b; 2010)
0.0%
3.5%
0.8%
0.5%
0.7%
0.4%
The 6 countries here (1.4b people) import about as much F&B from NZ as Fiji, Samoa
and French Polynesia combined (1.3m people)

TABLE OF CONTENTS
Section Page
Contents 4
Glossary of terms 5
Methodology & data sources 6
F&B IP Overview 8
New Zealand F&B trade overview 10
New Zealand performance by region/market 16
a. High priority markets
1. Australia/Pacific Islands 23
2. South East Asia 33
3. East Asia 44
b. Secondary markets
1. South Asia 54
2. North Africa/Middle East/Central Asia 59
3. North America 64
4. Europe 70
c. Other markets 75

Map of countries in South East Asia/ASEAN(2010)
NA/ME/CA – REGIONAL OVERVIEWThe North Africa/Middle East/Central Asia region is a predominantly Muslim region at the intersection of Africa, Asia and Europe; it accounts for 7% of world population and 4% of world GDP
PAGE 60 Source: Wikimedia Commons; Coriolis
NA/ME/CA7%
Other93%
NA/ME/CA4%
Other96%
% of global population(people; 2010)
% of global gross domestic product(% US$; nominal; 2010)
Mongolia
Morocco
TajikistanArmenia
Azerbaijan
Algeria
WesternSahara
Jordan
LibyaEgypt
SaudiArabia
Yemen
Oman
IranAfghanistan
Iraq
Syria
Kazakhstan
KyrgyzstanUzbekistan
Turkmenistan
LebanonIsrael
Georgia
UAE
KuwaitBahrainQatar

GDP/capita(US$/person; 2010 or latest available)
NA/ME/CA – KEY INDICATORSThe NA/ME/CA region is made up of a wide range of countries
PAGE 61 Source: CIA World Fact Book; UN Comtrade database; Coriolis analysis
$93 $229
$115 $216
$19 $52
$384 $61
$33 $107
$31 $43
$332 $135
$23 $91
$9 $11 $54
$188 $70
$30 $26 $5 $5 $13
1.7 4.6 3.0 7.6
0.8 2.8
26.2 6.4 4.2
16.2 5.1 9.0
75.1 35.4
6.3 31.9
3.2 4.4
22.5 78.7
31.5 27.8 24.3
5.5 7.0
29.1
$54,546 $49,706
$38,492 $28,373 $24,475 $18,397 $14,631 $9,441 $7,732 $6,606 $6,014 $4,725 $4,419 $3,805 $3,572 $2,849 $2,682 $2,475 $2,415 $2,388 $2,228 $1,091 $1,082 $854 $658 $457
QatarUnited Arab Emirates
KuwaitIsrael
BahrainOman
Saudi ArabiaLibya
LebanonKazakhstan
TurkmenistanAzerbaijan
IranAlgeriaJordan
MoroccoArmeniaGeorgia
SyriaEgyptIraq
UzbekistanYemen
KyrgyzstanTajikistan
Afghanistan
Population(people; m; 2010)
GDP(US$b; 2010)
$2 $5
$3 $4
$1 $2
$10 $2 $2 $2
$0.3 $1 $1
$6 $2
$4 $1 $1
$2 $9
$4 $1
$2 $1 $0.4 $1
Total F&B Import value(US$b; 2010)
$897 $1,167 $1,112
$513 $1,346
$695 $364 $303 $458
$133 $51 $109 $10 $169 $351
$119 $176 $185 $107 $118 $141
$22 $98 $92 $51 $21
F&B Import $/capita(US$; 2010)
1
Australia$9.4b

Dairy $6 9%
Meat $7 9%
Seafood $2 3%
Produce $7 10%
Grains $20 29%
Other $15 23%
Processed $9 13%
Beverages $3 4%
Aggregate NA/ME/CA total F&B import value from all source countries(US$b; 2010)
NA/ME/CA – TOTAL IMPORT VALUENorth Africa, the Middle East and Central Asia imported US$69b worth of F&B; the region requires significant imports of food “basics” (grains, sugar, oils & fats) due to it being (in general) quite dry
PAGE 62 Source: UN Comtrade database; Coriolis analysis
Qatar $2 2%
United Arab
Emirates $5 8%
Kuwait $3 5%
Israel $4 6%
Bahrain $1 2%
Oman $2 3%
Saudi Arabia $10 14%
Libya $2 3%
Lebanon $2 3%
Kazakhstan $2 3%
Turkmenistan $0.3 0%
Azerbaijan $1 1%
Iran $1 1%
Algeria $6 9%Jordan $2 3%
Morocco $4 6%
Armenia $1 1%
Georgia $1 1%
Syria $2 3%
Egypt $9 14%
Iraq $4 6%
Uzbekistan $1 1%
Yemen $2 3%
Kyrgyzstan $1 1%
Tajikistan $0.4 1%
Afghanistan $1 1%
US$69b US$69b
By receiving country By product
e.g. sugar, oils & fat

Value of NZ F&B imports by country(US$m; 2010)
NA/ME/CA – NZ PERFORMANCE BY COUNTRYNew Zealand performs well in a number of the richer countries, but there are opportunities across the region
PAGE 63 Source: UN Comtrade database; Coriolis analysis
$17 $7
$100 $2
$66 $29
$266 $15
$5 $0 $0 $18
$55 $188
$45 $67
$10 $8
$99 $132
$1 $5
$29 $0 $2 $0
QatarUnited Arab…
KuwaitIsrael
BahrainOman
Saudi ArabiaLibya
LebanonKazakhstan
TurkmenistanAzerbaijan
IranAlgeriaJordan
MoroccoArmeniaGeorgia
SyriaEgyptIraq
UzbekistanYemen
KyrgyzstanTajikistan
Afghanistan
$10 $1.42
$33 $0.28
$84 $10 $10
$2 $1.20 $0.02 $0.04 $2 $0.73 $5 $7
$2 $3 $2 $4 $2 $0.02 $0.18 $1 $0.05 $0.24 $0.00
NZ F&B imports per capita by country(US$/person; 2010)
NZ share of total F&B import value by country(US$b; 2010)
1%0%
3%0%
6%1%
3%1%
0%0%0%
2%8%
3%2%
2%2%
1%4%
1%0%
1%1%
0%0%
0%
What is required to move these countries to
Australian levels of share (i.e. ~20%)

TABLE OF CONTENTS
Section Page
Contents 4
Glossary of terms 5
Methodology & data sources 6
F&B IP Overview 8
New Zealand F&B trade overview 10
New Zealand performance by region/market 16
a. High priority markets
1. Australia/Pacific Islands 23
2. South East Asia 33
3. East Asia 44
b. Secondary markets
1. South Asia 54
2. North Africa/Middle East/Central Asia 59
3. North America 64
4. Europe 70
c. Other markets 75

Map of countries and regions in North America(2010)
NORTH AMERICA – REGIONAL OVERVIEWThe North American region, encompasses the United States (50 states) and Canada (13 provinces/territories), accounts for 5% of global population and 27% of global GDP
PAGE 65 Source: Wikimedia Commons; Coriolis
N. America
5%Other95%
N. America27%
Other73%
% of global population(people; 2010)
% of global gross domestic product(% US$; nominal; 2010)
Canada
UnitedStates
BritishColumbia Alberta
SaskatchewanManitoba
Ontario
Quebec
Newfoundland & Labrador
New BrunswickNova Scotia
Prince Edward I.
Yukon
Alaska
NunavutNorthwest Territories
Washington
Oregon
California
Arizona
Texas
Florida
Nevada
Idaho
MontanaN. Dakota
S. DakotaWyoming
Utah Colorado
NewMexico
GeorgiaS. Carolina
N. Carolina
Virginia
Oklahoma
Kansas
Nebraska
MN
Louisiana
MS AL
TN
KYMO
AR
IO
IL
WIMI
IN OHPA
NY
WV MarylandDelawareNew Jersey
MaineMassachusettsNH
VT
CT RI

GDP/capita(US$/person; 2010)
NORTH AMERICA – KEY INDICATORSThe United States and Canada are both rich countries that import a lot of food and beverages (F&B)
PAGE 66 Source: CIA World Fact Book; UN Comtrade database; Coriolis analysis
$46,582
$39,059
United States
Canada
Population(people; m; 2010)
GDP(US$b; 2010)
Total F&B Import value(US$b; 2009)
F&B Import $/capita(US$; 2009)
Australia$9.4b
309.8
34.2
$14,430
$1,335
$306
$804
$95
$27

Dairy $2.9 2%
Meat $7.5 6%
Seafood $17.5 14%
Produce $23.0 19%
Grains $4.0 3%
Other $20.8 17%
Processed $23.8 20%
Beverages $22.7 19%
Aggregate USA/Canada total F&B import value from all source countries(US$b; 2010)
NORTH AMERICA – TOTAL IMPORT VALUEIn aggregate North America imported US$122b worth of F&B in 2010; imports underperform in dairy and meat
PAGE 67 Source: UN Comtrade database; Coriolis analysis
United States 78%
Canada 22%
US$122b US$122b
By receiving country By product

Value of NZ F&B imports by country(US$m; 2010)
NORTH AMERICA – NZ PERFORMANCE BY COUNTRYNew Zealand is a relatively minor exporter to the United States and Canada
PAGE 68 Note: Some amount of the shipments to the Netherlands and Belgium (in particular) are for on shipment to the rest of Europe; unfortunately these are not effectively separable in the data; given what is here is the receiving countries report, there will therefore be some double counting; Source: UN Comtrade database; Coriolis analysis
NZ F&B imports per capita by country(US$/person; 2010)
NZ share of total F&B import value by country(US$b; 2010)
$1,817
$302
United States
Canada
$5.87
$8.83
1.9%
1.1%

NZ share of regional F&B imports by sector(% of value; 2010)
NORTH AMERICA – NZ PERFORMANCE BY SECTORNew Zealand performs well in dairy and meat into North America in terms of share; share is low otherwise
PAGE 69 Source: UN Comtrade database; Coriolis analysis
$0.5
$1.0
$0.2
$0.1
$0.0
$0.0
$0.1
$0.3
$2.5
$6.5
$17.3
$22.8
$4.0
$20.8
$23.7
$22.4
17%
13%
1%
1%
0%
0%
0%
1%
Dairy
Meat
Seafood
Produce
Grains
Other
Processed
Beverages
NZ Other
$0.5
$1.0
$0.2
$0.1
$0.0
$0.0
$0.1
$0.3
Value of NZ F&B imports to region by sector(US$b; 2010)
Value of total F&B imports to region by sector(US$b; 2010)

TABLE OF CONTENTS
Section Page
Contents 4
Glossary of terms 5
Methodology & data sources 6
F&B IP Overview 8
New Zealand F&B trade overview 10
New Zealand performance by region/market 16
a. High priority markets
1. Australia/Pacific Islands 23
2. South East Asia 33
3. East Asia 44
b. Secondary markets
1. South Asia 54
2. North Africa/Middle East/Central Asia 59
3. North America 64
4. Europe 70
c. Other markets 75

Map of countries in Europe(2010)
EUROPE – REGIONAL OVERVIEWThe European region (including Russia) accounts for 12% of global population and a third of global GDP
PAGE 71 Source: Wikimedia Commons; Coriolis
Europe/ Russia12%
Other88%
Europe/ Russia33%
Other67%
% of global population(people; 2010)
% of global gross domestic product(% US$; nominal; 2010)
Turkey
Belorussia
Portugal
Russia
Ukraine
Finland
PolandGermany
France
Spain
Iceland
IrelandU.K.
Italy
Sweden
Norway
Denmark
Estonia
Latvia
Lithuania
CzechSlovakia
Romania
Bulgaria
Greece
MoldovaSwiss Austria Hungary
Balkancountries
Netherlands
BelgiumLux
Slovenia

GDP/capita(US$/person; 2010 or latest available)
EUROPE – KEY INDICATORSEurope is made up of a wide range of countries ranging from very rich to poor
PAGE 72 Source: CIA World Fact Book; UN Comtrade database; Coriolis analysis
$47 $369 $484
$308 $227
$799 $242 $374 $462 $398
$2,666 $3,273
$12 $2,198 $2,090
$1,466 $338
$23 $50 $220
$8 $190 $88 $62 $18 $124 $423
$24 $36
$1,232 $608
$161 $4 $45 $49 $17 $9 $42 $12 $116 $11 $5
0.5 4.9 7.8 5.5 4.5
16.6 5.4 8.4 10.8 9.4
65.4 81.8
0.3 62.0 60.3
47.0 11.3
0.8 2.1 10.6
0.4 10.5 5.4 4.4 1.3 10.0
38.2 2.2 3.3
141.9 72.6
21.5 0.6 7.6 9.5 3.8 2.0 9.9
3.2 45.9
4.4 3.6
$92,611 $75,420
$62,200 $55,647
$50,860 $48,121 $45,168 $44,716 $42,623 $42,462 $40,735 $40,033 $37,056 $35,428 $34,637 $31,224 $29,922 $28,958
$24,037 $20,664 $18,528 $18,045 $16,277 $13,916 $13,470 $12,403 $11,083 $10,805 $10,801 $8,681 $8,385 $7,486 $7,122 $5,910 $5,177 $4,502 $4,308 $4,304 $3,671 $2,522 $2,475 $1,495
LuxembourgNorway
SwitzerlandDenmarkIreland
NetherlandsFinlandAustriaBelgiumSwedenFrance
GermanyIceland
United KingdomItalySpain
GreeceCyprus
SloveniaPortugal
MaltaCzech Republic
SlovakiaCroatiaEstoniaHungaryPolandLatvia
LithuaniaRussiaTurkey
RomaniaMontenegro
BulgariaBelarus
Bosnia HerzegovinaMacedonia
SerbiaAlbaniaUkraineGeorgiaMoldova
Population(people; m; 2010)
GDP(US$b; 2010)
$2 $6 $9 $10
$7 $38
$4 $10
$31 $12
$46 $74
$0 $50
$37 $29
$8 $1 $2
$9 $1
$6 $4 $2 $1 $4
$11 $1 $2
$25 $5 $4
$0 $2 $2 $1 $1 $1 $1 $4
$1 $‐
Total F&B Import value(US$b; 2009)
$3,954 $1,141 $1,179
$1,755 $1,504
$2,292 $829 $1,167
$2,818 $1,233
$706 $900 $1,232
$800 $614 $613 $675
$1,296 $896 $869
$1,406 $589 $673
$416 $1,048
$365 $276 $660 $708
$179 $73 $203
$793 $272 $206 $368 $310 $90 $202 $92 $152 $‐
F&B Import $/capita(US$; 2009)
Australia$9.4b

Dairy $35 8%
Meat $59 13%
Seafood $43 9%
Produce $73 16%
Grains $25 5%
Other $81 17%
Processed $96 21%
Beverages $51 11%
Aggregate European total F&B import value from all source countries(US$b; 2009)
EUROPE – TOTAL IMPORT VALUEIn aggregate Europe imported US$463b worth of F&B in 2009; imports were spread across all sectors
PAGE 73 Source: UN Comtrade database; Coriolis analysis
Luxembourg 0%
Norway 1%
Switzerland 2%
Denmark 2%
Ireland 1%
Netherlands 8%
Finland 1%Austria 2%
Belgium 7%
Sweden 2%
France 10%
Germany 16%
Iceland 0%
United Kingdom 11%
Italy 8%Spain 6%
Greece 2%Cyprus 0%
Slovenia 0%Portugal 2%
Malta 0%
Czech Republic 1%
Slovakia 1%
Croatia 0%Estonia 0%
Hungary 1%Poland 2%
Latvia 0%
Lithuania 1%
Russia 5%
Turkey 1%
Romania 1%
Montenegro 0%
Bulgaria 0%
Belarus 0%
Bosnia Herzegovina 0%Macedonia 0%
Serbia 0% Albania 0%Ukraine 1%
Georgia 0%
US$463b US$463b
By receiving country By product
e.g. coffee, cocoa, sugar, oils & fat

Value of NZ F&B imports by country(US$m; 2009)
EUROPE – NZ PERFORMANCE BY COUNTRYNew Zealand is a relatively minor player in European F&B imports
PAGE 74 Note: Some amount of the shipments to the Netherlands and Belgium (in particular) are for on shipment to the rest of Europe; unfortunately these are not effectively separable in the data; given what is here is the receiving countries report, there will therefore be some double counting; Source: UN Comtrade database; Coriolis analysis
$0 $18
$67 $69
$27 $320
$21 $31
$401 $39
$333 $549
$1 $905
$86 $138
$40 $14 $1 $19 $5 $3 $1 $4 $1 $0 $8 $0 $0
$109 $5 $0 $0 $2 $3 $1 $0 $1 $1 $5 $6
LuxembourgNorway
SwitzerlandDenmarkIreland
NetherlandsFinlandAustriaBelgiumSwedenFrance
GermanyIceland
United KingdomItalySpain
GreeceCyprus
SloveniaPortugal
MaltaCzech Republic
SlovakiaCroatiaEstoniaHungaryPolandLatvia
LithuaniaRussiaTurkey
RomaniaMontenegro
BulgariaBelarus
Bosnia HerzegovinaMacedonia
SerbiaAlbaniaUkraineGeorgia
NZ F&B imports per capita by country(US$/person; 2009)
NZ share of total F&B import value by country(US$b; 2009)
$0.00 $3.70
$8.60 $12.53
$6.04 $19.28
$3.89 $3.64
$37.04 $4.16 $5.08
$6.72 $2.08
$14.58 $1.43
$2.93 $3.56
$17.81 $0.41 $1.77
$11.46 $0.28 $0.11 $0.82 $1.02
$0.04 $0.20 $0.06 $0.09 $0.77 $0.07 $0.00 $0.64 $0.28 $0.33 $0.28 $0.07 $0.06 $0.34 $0.10 $1.34
0.0%0.3%
0.7%0.7%
0.4%0.8%
0.5%0.3%
1.3%0.3%
0.7%0.7%
0.2%1.8%
0.2%0.5%0.5%
1.4%0.0%
0.2%0.8%
0.0%0.0%
0.2%0.1%
0.0%0.1%
0.0%0.0%
0.4%0.1%
0.0%0.1%0.1%0.2%
0.1%0.0%0.1%
0.2%0.1%
0.9%

TABLE OF CONTENTS
Section Page
Contents 4
Glossary of terms 5
Methodology & data sources 6
F&B IP Overview 8
New Zealand F&B trade overview 10
New Zealand performance by region/market 16
a. High priority markets
1. Australia/Pacific Islands 23
2. South East Asia 33
3. East Asia 44
b. Secondary markets
1. South Asia 54
2. North Africa/Middle East/Central Asia 59
3. North America 64
4. Europe 70
c. Other markets 75

Map of countries in Sub‐Saharan Africa(2010)
SUB‐SAHARAN AFRICA – REGIONAL OVERVIEWSub‐Saharan Africa has the population of Europe/Russia and the GDP of Australia
PAGE 76 1. New Zealand has the same GDP as the 27 smallest economies in the region; Source: Wikimedia Commons; Coriolis
SS Africa12%
Other88%
SS Africa, 1.6%
Other, 98.4%
% of global population(people; 2010)
% of global gross domestic product(% US$; nominal; 2010)
MauritaniaMali Niger
Chad Sudan
Ethiopia
Eritrea
Somalia
Kenya
South Africa
Namibia
Angola
D.R.Congo
Botswana Madagascar
Mozambique
Tanzania
C.A.R.
Zimbabwe
Zambia
Gabon
IvoryCoast
SenegalGambiaG. Bissau Guinea
Sierra Leone
Liberia
BurkinaFasoGhana
Togo
Benin Nigeria
Cameroon
Congo
Uganda
RwandaBurundi
Malawi
LesothoSwaziland
Djibouti
Equatorial Guinea
Slightly less than Australia1

New Zealand F&B export value to Sub‐Saharan Africa by sector(US$m; 2010)
SUB‐SAHARAN AFRICA – NEW ZEALAND EXPORT OVERVIEW71% of New Zealand’s exports to sub‐Saharan Africa are dairy products
PAGE 77 Source: UN Comtrade database; Coriolis analysis
Dairy $274 71%
Meat $21 6%
Seafood $20 5%
Produce $5 1%
Other $1 0%Processed $65
17%
Beverages $1 0%
US$386m
Nigeria $136 35%
Sudan $81 21%
South Africa $57 15%
Ghana $41 10%
Other 26 $72 19%
US$386m
New Zealand F&B export value to Sub‐Saharan Africa by key countries(US$m; 2010)

Map of countries in Central/South America(2010)
CENTRAL/SOUTH AMERICA – REGIONAL OVERVIEWCentral and South America (effectively “Latin America”) represents 8% of world population and 7% of world GDP
PAGE 78 Source: Wikimedia Commons; Coriolis
C/S America
8%
Other92%
C/S America 7.0%
Other 93.0%
% of global population(people; 2010)
% of global gross domestic product(% US$; nominal; 2010)
Brazil
Uruguay
Argentina
Chile
Peru
Ecuador
Columbia
Bolivia
Venezuela
MexicoCuba
Belize

New Zealand F&B export value to C/S America by sector(US$m; 2010)
CENTRAL/SOUTH AMERICA – NEW ZEALAND EXPORT OVERVIEW90% of New Zealand’s exports to Central and South America are dairy products
PAGE 79 Source: UN Comtrade database; Coriolis analysis
Dairy $779 90%Meat $58 7%
Seafood $5 1%
Produce $7 1%
Other $0 0%Processed $9 1%
Beverages $5 0%
US$ 863m
Mexico $231 27%
Other Central America $71 8%
Caribbean $154 18%
Venezuela $326 38%
Other S. America $80 9%
US$ 863m
New Zealand F&B export value to C/S America by key countries(US$m; 2010)
All of Central and South America imports less
than Singapore
