food & beverage information project 2011 industry … · food & beverage information...
TRANSCRIPT

This information was prepared by Coriolis solely for the use of our client; it is not to be relied on by any third party without prior written consent.
Food & Beverage Information Project 2011 Industry Snapshot
Final Report February 2012; v1.0 0
www.foodandbeverage.govt.nz

Coriolis is a strategic management consulting and market research firm We work with organisations to help them grow. For corporations, that often means developing strategies for revenue growth. For governments, it means working on national economic development. For non-profits, it means helping to grow their social impact. We address all the problems that are involved in growth: strategy, marketing, pricing, innovation, new product development, new markets, organisation, leadership, economic competitiveness. We bring to our clients specialised industry and functional expertise. We invest significant resources in building knowledge. We see it as our mission to bring this knowledge to our clients and we publish much of it for the benefit of others. A hallmark of our work is rigorous, fact-based analysis, grounded in proven methodologies. We rely on data because it provides clarity and aligns people. However, we deliver results, not reports. To that end, we work side by side with our clients to create and implement practical solutions. The Coriolis name The coriolis force, named for French physicist Gaspard Coriolis (1792-1843), may be seen on a large scale in the movement of winds and ocean currents on the rotating earth. It dominates weather patterns, producing the counterclockwise flow observed around low-pressure zones in the Northern Hemisphere and the clockwise flow around such zones in the Southern Hemisphere. To us it means understanding the big picture before you get into the details. PO Box 90-509, Victoria Street West, Auckland 1142, New Zealand Tel: +64 9 623 1848 www.coriolisresearch.com

The objective of this report is to provide a factual source of high quality information on the current situation in the New Zealand Food and Beverage industry for four audiences:
- Investors (domestic or international) - Industry participants (firms & individuals) - Government (across all roles and responsibilities) - Scientific researchers (academic, government & firm)
It creates a common set of facts and figures on the current situation in the industry. It forms a part of the wider Food & Beverage Information Project. It does not attempt to duplicate the material present in the other modules - particularly the sector level analysis - instead it looks primarily at the big picture and meta-drivers of growth. It will be updated annually. For additional information visit: www.foodandbeverage.govt.nz

TABLE OF CONTENTS
Section Page
Contents 4
Glossary of terms 5
Methodology & data sources 6
F&B IP Overview 8
New Zealand F&B snapshot 10
1. Primary production 12
Land based 15
Water based 29
2. F&B manufacturing 34
3. Markets 48

GLOSSARY OF TERMS
PAGE 5
This report uses the following acronyms and abbreviations
A$/AUD Australian dollar NA/ME/CA North Africa / Middle East / Central Asia
ABS Absolute change NZ New Zealand
ANZSIC AU/NZ Standard Industry Classification NZ$/NZD New Zealand dollar
AU Australia R&D Research and Development
Australasia Australia and New Zealand S Asia South Asia (Indian Subcontinent)
b Billion SE Asia South East Asia
CIF Cost, Insurance and Freight S.H./N.H. Southern/Northern Hemisphere
CAGR Compound Annual Growth Rate SS Africa Sub-Saharan Africa
C/S America Central & South America (Latin America) T/O Turnover
CRI Crown Research Institute US/USA United States of America
CY Calendar year (ending Dec 21) US$/USD United States dollar
E Asia East Asia UK United Kingdom
EBITDA Earnings before interest, tax, depreciation and amortization
YE/YTD Year ending/Year to date
FOB Free on Board Sources
FY Financial year (of firm in question) AR Annual report
£/GBP British pounds Ce Coriolis estimate
HS Codes Harmonised System Codes for commodity classifications
Ci Coriolis interview
JV Joint venture K Kompass
m Million Ke Kompass estimate
n/a Not available/not applicable ws Website

METHODOLOGY & DATA SOURCES
PAGE 6 * Food and Agriculture Organisation of the United Nations
Data was from a variety of sources, and has a number of identified limitations
- This report uses a range of information sources, both qualitative and quantitative.
- The numbers in this report come from multiple sources. While we
believe the data are directionally correct, we recognise the limitations in what information is available.
- In many cases different data sources disagree (e.g. Statistics New Zealand vs. FAO* vs. UN Comtrade).
- Many data sources incorporate estimates of industry experts.
- As one example, in many cases, the value and/or volume recorded as exported by one country does not match the amount recorded as being received as imports by the counterparty [for understood reasons].
- In addition, in some places, we have made our own clearly noted
estimates.
- Coriolis has not been asked to independently verify or audit the information or material provided to it by or on behalf of the Client or any of the data sources used in the project. - The information contained in the report and any
commentary has been compiled from information and material supplied by third party sources and publicly available information which may (in part) be inaccurate or incomplete.
- Coriolis makes no representation, warranty or guarantee, whether express or implied, as to the quality, accuracy, reliability, currency or completeness of the information provided in the report.
- All trade data analysed in all sections of the F&B Information
project are calculated and displayed in US$. This is done for a range of reasons:
1. It is the currency most used in international trade 2. It allows for cross country comparisons (e.g. vs. Denmark) 3. It removes the impact of NZD exchange rate variability 4. It is more comprehensible to non-NZ audiences (e.g. foreign
investors) 5. It is the currency in which the United Nations collects and
tabulates global trade data
- The opinions expressed in this report represent those of the industry participants interviewed and the authors. These do not necessarily represent those of Coriolis Limited or the New Zealand Government.
- If you have any questions about the methodology, sources or accuracy of any part of this report, please contact Tim Morris, the report’s lead author at Coriolis, on +64 9 623 1848

Structure of the New Zealand Food & Beverage Information Project (2011)
F&B INFORMATION PROJECT The New Zealand Food & Beverage Information Project is designed to be the foundation of facts and figures on which a range of audiences can build
PAGE 7 Note: Every year two subsectors are completed in more detail. Seafood and Nutraceuticals in 2011
Dairy Sector
Meat Sector
Produce Sector
Seafood Sector
Nutraceuticals Sector
Processed Foods Sector
Beverages Sector
Investor’s Guide
Global Markets
Overview
Sectors
Industry Snapshot
Markets High Potential Market Profiles
Firms Investors Government

Structure of the New Zealand Food & Beverage Information Project (2011)
INDUSTRY SNAPSHOT This snapshot of New Zealand’s Food & Beverage industry forms a part of the wider Food & Beverage Information Project
PAGE 8
Firms Investors Government
Dairy Sector
Produce Sector
Seafood Sector
Nutraceuticals Sector
Processed Foods Sector
Beverages Sector
Investor’s Guide Overview
Sectors Meat Sector
Industry Snapshot
High Potential Market Profiles Markets Global Markets

TABLE OF CONTENTS
Section Page
Contents 4
Glossary of terms 5
Methodology & data sources 6
F&B IP Overview 8
New Zealand F&B snapshot 10
1. Primary production 12
Land based 15
Water based 29
2. F&B manufacturing 33
3. Markets 47
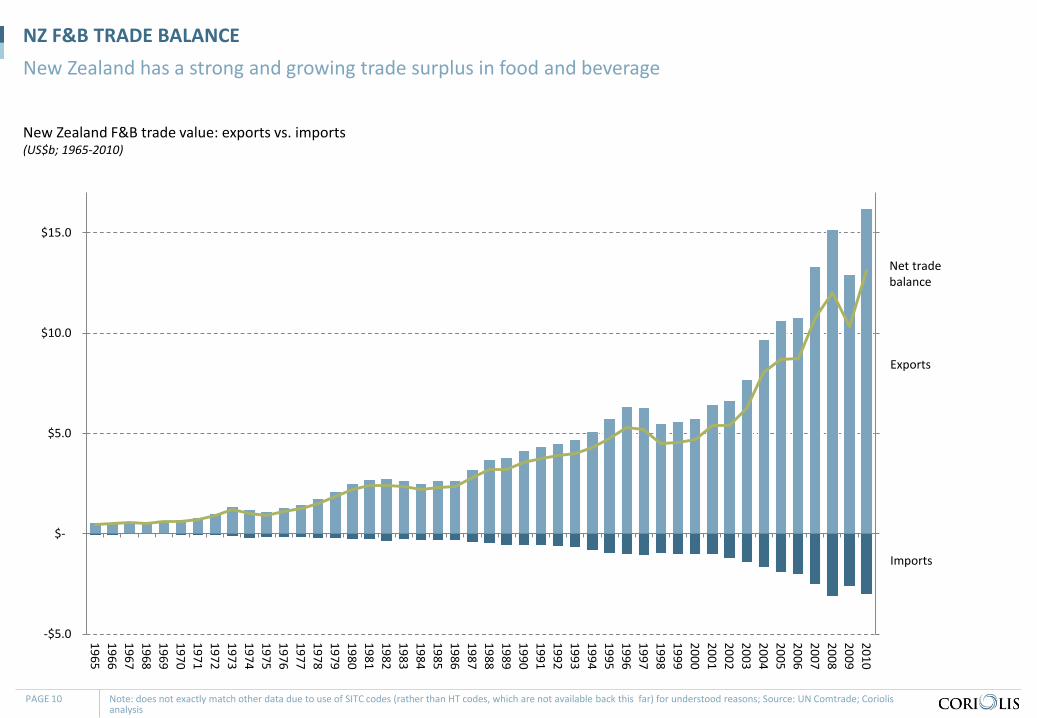
New Zealand F&B trade value: exports vs. imports (US$b; 1965-2010)
NZ F&B TRADE BALANCE New Zealand has a strong and growing trade surplus in food and beverage
PAGE 10 Note: does not exactly match other data due to use of SITC codes (rather than HT codes, which are not available back this far) for understood reasons; Source: UN Comtrade; Coriolis analysis
-$5.0
$-
$5.0
$10.0
$15.0
-$5.0
$-
$5.0
$10.0
$15.0
1965196619671968196919701971197219731974197519761977197819791980198119821983198419851986198719881989199019911992199319941995199619971998199920002001200220032004200520062007200820092010
Exports
Imports
Net trade balance

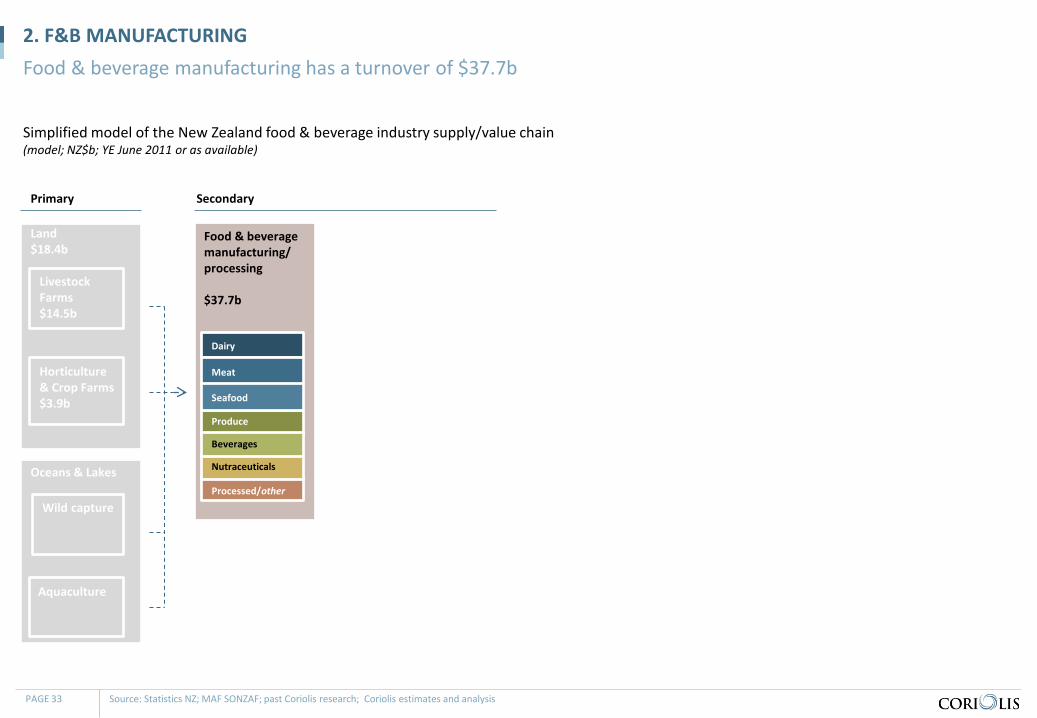
Food & beverage manufacturing/ processing $37.7b
Simplified model of the New Zealand food & beverage industry supply/value chain (model; NZ$b; YE June 2011 or as available)
NZ F&B INDUSTRY VALUE CHAIN MODEL We propose the following simplified model of the New Zealand food & beverage industry value chain; this model guides our work
PAGE 11 Source: Statistics NZ; MAF SONZAF; past Coriolis research; Coriolis estimates and analysis
Land $18.4b
Horticulture & Crop Farms $3.9b
Oceans & Lakes
Domestic Food Retailing $18.7b
Domestic Foodservice & Hospitality $6.5b
Value FOB of New Zealand F&B exports $25.3b
Primary Secondary Markets
Livestock Farms $14.5b
Aquaculture
Wild capture
Food & beverage wholesalers $25.3b
Expenditure by New Zealand consumers on F&B $22.5b
Expenditure by non-NZ consumers on F&B products primarily of NZ origin ~$140-200b
Global food manufacturers & wholesalers sales of F&B products primarily of NZ origin ~$100-150b
Global food retailing & foodservice sales of F&B products primarily of NZ origin ~$140-200b
Expenditure by tourists in NZ $2.7b
Consumers
Value of NZ F&B imports $4.0b
Dairy
Meat
Produce
Processed/other
Nutraceuticals
Seafood
Beverages
We consume domestically almost 50% of the food we produce

Simplified model of the New Zealand food & beverage industry supply/value chain (model; NZ$b; YE June 2011 or as available)
1. PRIMARY PRODUCTION The first section looks at primary production
PAGE 12 Source: Statistics NZ; MAF SONZAF; past Coriolis research; Coriolis estimates and analysis
Land $18.4b
Horticulture & Crop Farms $3.9b
Oceans & Lakes
Primary
Livestock Farms $14.5b
Aquaculture
Wild capture

SITUATION – PRIMARY PRODUCTION
Growing global need for food - The global population continues to increase and has just passed
the seven billion people mark. At the same time, the rising middle class in Asia has increasing disposable income leading to increasing demand for premium, high quality food and beverage. The world needs to significantly increase food production and New Zealand can play a part in that process.
New Zealand is currently low intensity - While New Zealand’s exports of food and beverage (F&B) are
significant, these account for just 2.5% of global trade in food. The country has considerable untapped capacity to export more. New Zealand is a country the size of Italy or the United Kingdom, but with the population of Singapore. However Italy feeds a domestic population of 60m people and exports twice as much F&B as New Zealand.
- The New Zealand Government has set a target of tripling the country’s food and beverage exports over the next 15 years. This will be achieved through both growth of existing major sectors and the newer emerging growth stars.
Multiple pressures - New Zealand has had a long period of bringing new – often
increasingly marginal - land into production. However, this easy growth appears to have come to an end. Multiple pressures are now coming to a head:
1. The growth of lifestyle blocks and “urban sprawl”
2. The drive to continue to increase primary production Intensification the path forward - As a result of these pressures, primary production is moving into
a phase of intensification. Examples of intensification include: - Conversion of sheep paddocks into wine grapes - Conversion of rain fed beef farms into irrigated dairy farms - Flat wild catch of seafood being supplemented by more
aquaculture - New Zealand can’t ignore these issues. As a country New
Zealand has a competitive advantage in pastoral agriculture. It also has strong agricultural science, and research capability in its Universities, private institutes and Crown Research Institutes. At the mega level New Zealand now needs to leverage these capabilities and build on its existing strengths to develop ways to increase production without degrading the land and water.
Learn from peers - There is nothing unique with the problems facing New Zealand,
other countries have had very similar pressures. The experience of high relevant global peers (e.g. Denmark, Ireland, Oregon) strongly suggests intensification will continue going forward and that strong increases in production are possible. These peers clearly have strong lessons available for New Zealand.
New Zealand’s historical low intensity farming model is under pressure; intensification appears to be the path forward
PAGE 13

More But…
More lifestyle blocks/urban area Less farm land
More irrigation… …used to grow grass (?)
More milk More cull dairy cows
Fewer sheep Fewer beef cattle
More urban areas More lifestyle blocks
Less fruit area (except grapes) Less vegetable area
More continuous improvement required Less relative competitiveness (e.g. No longer low cost dairy producer)
More aquatic parks Less ocean available
Slightly more aquaculture Less wild capture fish
PRIMARY SECTOR – CONCLUSIONS It is difficult to see production growth going forward driven by anything other than intensification
PAGE 14
Intensification the likely outcome, as it has been in other peer group countries and regions at a similar
point in their evolution

Simplified model of the New Zealand food & beverage industry supply/value chain (model; NZ$b; YE June 2011 or as available)
1. PRIMARY PRODUCTION – LAND BASED Land based primary production had a turnover of $18.4b
PAGE 15 Source: Statistics NZ; MAF SONZAF; past Coriolis research; Coriolis estimates and analysis
Land $18.4b
Horticulture & Crop Farms $3.9b
Primary
Livestock Farms $14.5b

14 6
26
12 8
14 7
22
8 10 12
23
45
32
34
122
19
13
23
24
25
62
31
37
41
43
70
49
3
NZ USA Europe
Total area: New Zealand vs. Select US East Coast states vs. select developed peer countries (km2; 2011)
HOW BIG IS NEW ZEALAND? New Zealand is not a small country; many regions of New Zealand are the size of major European countries or American states
PAGE 16 Source: Wikipedia; CIA World Fact Book; Coriolis analysis
Northland Auckand
Waikato
Bay of Plenty Gisborne
Hawke’s Bay Taranaki
Manawatu-Wanganui
Wellington Nelson/Tasman
Marlborough
West Coast
Canterbury
Otago
Southland
Belgium
Netherlands
Switzerland
Denmark
Ireland
Slovakia
Luxembourg
New York
New Jersey
Connecticut
New Hampshire
Vermont
Maryland
West Virginia
275
289
274

New Zealand land use (km2; 000; 2010)
LAND – TOTAL LAND USE Farming uses 47% of New Zealand’s land area, private forestry 6%, national parks & reserves 26% and all other uses 21%; New Zealand has more park and reserve relative to peers
PAGE 17 Source: Statistics New Zealand; World Database of Protected Areas (http://www.wdpa.org); Department of Conservation Annual Report 2010; Coriolis analysis and estimates
Farming 126 47%
Forestry (private) 16 6%
National parks & reserves 71
26%
Other DOC 14 5%
Other 41 16%
TOTAL = 268 (000) km2
% of terrestrial area which is park or other protected: NZ vs. peers (% of km2; 2010)
Lifestyle blocks Cities and towns
Idle lands Other government lands
Other
26%
14%
11%
9%
8%
5%
2%
0%
New Zealand
Belgium
Sweden
Finland
Portugal
Denmark
Ireland
Uruguay
31%
If we add DOC to other Government land (e.g. Defence,
Landcorp etc.), likely ~40% of country in Crown ownership

Total New Zealand area in farming and private forestry (sqkm; 000; 1891-2010)
LAND – FARM LAND USE The amount of farm land is declining rapidly such that New Zealand is now farming the same amount of land it did in 1900 (~120 years ago); growth of “other” appears to be prime driver since 1990
PAGE 18 Note: Missing data estimated from available data; Source: Statistics New Zealand; World Database of Protected Areas; Coriolis analysis
-
50
100
150
200
1891
1897
1903
1909
1915
1921
1927
1933
1939
1945
1951
1957
1963
1969
1975
1981
1987
1993
1999
2005
1900 2010
Future direction
?
Share of area by major use types (sqkm; 000; 1990-2010)
-
50
100
150
200
250
1990
1991
1992
1993
1994
1995
1996
1997
1998
1999
2000
2001
2002
2003
2004
2005
2006
2007
2008
2009
2010
All other
Park/ protected
Farming/ forestry

Percent of farm land by type (% of sqkm; 2010)
LAND – FARM LAND BY TYPE 84% of farm land is used for grazing; the amount of grazing and arable/fodder land has been falling at -1.0% per year for the past quarter century
PAGE 19 Source: Statistics New Zealand; Coriolis analysis
Tussock 2,691 21%
Pasture 7,986 63%
Arable 337 3%
Horticulture 149 1%
Onfarm native bush 957 8%
Other 463 4%
84% 14,386
13,536 11,967
11,014
87
104
110
149
2,229
1,479
1,685
1,421
1984 1994 2002 2010
Farm land by type (sqkm; 1984-2010)
Grazing & arable
Horticulture
On-farm native bush & other
16,702
15,119
13,762
12,584
CAGR (84-10) -1.1%
-1.0%
2.1%
-1.7%
Total = 12,584
# OF ANIMALS The combination of falling farm area and dairy conversions has led to a dramatic fall in the number of sheep and beef cattle
Number of sheep in New Zealand (#; m; 1851-2010)
Number of cattle in New Zealand (#; m; 1881-2010)
PAGE 20 Note: Missing data and missing years interpolated for available data; Source: NZ Handbook of Historical Statistics; Department of Statistics; Statistics New Zealand; DairyNZ; Coriolis analysis
-
10
20
30
40
50
60
70
18511858186518721879188618931900190719141921192819351942194919561963197019771984199119982005
-
1
2
3
4
5
6
18811886189118961901190619111916192119261931193619411946195119561961196619711976198119861991199620012006
Beef cattle
Other dairy cows
Dairy cows in milk
1937
2010
1977 price support for lambs introduced with guaranteed minimum pricing. Removed in
1984 as part of massive restructuring
Data is number of sheep (i.e. flock size) not kill. Production has not fallen proportionally due to:
(1) More meat/animal (yield improvements) (2) Greater lambing percentages
Leading to greater % of flock killed every year

Consented irrigation area by key region (ha; 000; 1999-2010)
LAND – IRRIGATION IN NZ New Zealand land under irrigation has been growing at 6% per annum, driven by the South Island; 76% of irrigated land grows grass
PAGE 21 Note: NZ data consented not actual; actual lower but no data available; Source: MfE (http://www.mfe.govt.nz/environmental-reporting/freshwater/demand/graph-data-trends.html); CIA World Fact Book; Wikipedia; University of Colorado; USGS; Coriolis analysis
86 109 143 15
25 31
6
44 55
85
122
168
400
643
680
1999 2006 2010
Canterbury
Otago
Marlborough Other S.I.
N. Island
592
943
1,077
CAGR (99-10)
6%
Percent of consented irrigation area by type (ha; 000; %; 2010)
Pasture 76%
Arable 4%
Horticulture 18%
Other 2%
Total = 1,077

Percent of total area which is irrigated: NZ vs. select identified peers (%; 2010)
LAND – IRRIGATION VS. PEERS New Zealand is now in the middle-of-the-range relative to peers in terms of share of land area irrigated
PAGE 22 Note: NZ data consented not actual; actual lower but no data available; Source: MfE (http://www.mfe.govt.nz/environmental-reporting/freshwater/demand/graph-data-trends.html); CIA World Fact Book; Wikipedia; University of Colorado; USGS; Coriolis analysis
Comments/Notes
- Unlike some industry commentary, this suggests NZ is already relatively well irrigated
- Based on experience and past work, we suggest that no other country on this list uses 76% of its irrigation growing grass
- Is irrigating grass to feed cows a halfway house to irrigating arable crops to feed to cows?
- Is irrigation being overused as it is not correctly priced?
0%
2%
4%
6%
8%
10%
12%
14%
16%
Nebraska
Netherlands
ArkansasDenm
arkCaliforniaIsraelIdahoPortugalKansasColoradoFloridaM
ississippiW
ashingtonFranceN
ew Zealand
GeorgiaTexasSlovakiaM
issouriO
regonO
regonLousianaW
yoming
ChileU
tahM
ontanaN
orth CarolinaO
klahoma
ArizonaN
ew M
exicoBelgiumSouth AfricaU
nited KingdomSw
itzerlandN
orway
AustraliaSw
edenFinlandW
alesIrelandScotland
4%

120 years of area in fruit and vegetables in New Zealand (ha; actual; 1890-2009)
HORTICULTURAL AREA Horticultural area experienced a strong surge in the mid 70’s through the mid 90’s; since then grapes have grown while the area for most other fruit has declined
PAGE 23 Note: Missing data and missing years interpolated for available data; Source: NZ Handbook of Historical Statistics; Department of Statistics; Statistics New Zealand; UN FAO; P&F FreshFacts; Coriolis analysis
Comments/Notes
- Historical data should be treated as directional due to adjustments made to data (discussed below)
- Historical vegetable data is “market gardens, nurseries, residences, private grounds and gardens” adjusted to remove non-commercial vegetable component
- Does not include nuts or olives
- Does not include non-food horticulture (e.g. nurseries, turf)
-
20,000
40,000
60,000
80,000
100,000
189018941898190219061910191419181922192619301934193819421946195019541958196219661970197419781982198619901994199820022006
Vegetables
Apples
Other fruit
Kiwifruit
Grapes
Avocados
Orchards

Total Grape area by country/region (ha; actual; 2009)
WINE – BENCHMARKING Cool climate peer group suggest opportunities for further wine area
PAGE 24 1. Brandys, cognac and other distilled wines (but not port or fortified fines which are under still); Source: UN FAO AgStat; Wikipedia; CIA World Fact Book; UN Comtrade database; Coriolis analysis
793,144
222,700
190,000
100,101
45,098
34,380
33,442
24,708
14,820
7,362
3,237
France
Portugal
Chile
Germany
Austria
Croatia
New Zealand
Washington
Switzerland
Oregon
British Columbia
% of total country/region planted in grapes (% of km2; 2009)
1.4%
2.4%
0.3%
0.3%
0.5%
0.6%
0.1%
0.1%
0.4%
0.0%
0.0%
Wine export value (US$m; 2009)
$9,819
$773
$1,386
$1,101
$167
$14
$638
N/A
$90
$19
N/A
Still wine Sparkling Brandy1

Farm gate gross agricultural revenue from food and beverage primary products (NZ$b; nominal/non-inflation adjusted; YE June; 1996-2011)
FARM GATE F&B REVENUE Farm gate F&B revenue has been growing, driven by dairy
PAGE 25 Note: totals may not add due to rounding; Source: MAF SONZAF (various years); Coriolis analysis
$0.4 $0.4 $0.3 $0.3 $0.3 $0.3 $0.4 $0.4 $0.4 $0.4 $0.3 $0.4 $0.5 $0.7 $0.6 $0.6 $0.2 $0.2 $0.2 $0.3 $0.3 $0.3 $0.3 $0.3 $0.3 $0.3 $0.3 $0.3 $0.3 $0.2 $0.2 $0.2 $0.6 $0.5 $0.6 $0.7 $0.6 $0.6 $0.7 $0.7 $0.9 $0.7 $0.7 $0.8 $1.0 $0.9 $1.0 $1.1 $0.7 $0.7 $0.7 $0.9 $0.9 $1.1 $1.2 $1.2 $1.4 $1.3 $1.4 $1.5 $1.8 $2.1 $1.9 $1.9
$0.4 $0.4 $0.4 $0.4 $0.4 $0.4
$0.5 $0.5 $0.5 $0.5 $0.5 $0.6
$0.6 $0.6 $0.6 $0.6
$1.0 $1.3 $1.4 $1.2 $1.3 $1.8
$1.9 $2.0 $1.8 $1.8 $1.7 $1.8 $1.7
$2.1 $2.1 $2.0
$1.2 $1.0 $1.3 $1.3 $1.5
$1.8 $2.1 $1.9 $2.1 $2.2 $2.1 $2.2 $1.7
$2.0 $1.8 $2.1
$3.2 $3.3 $3.3 $3.2 $3.6
$5.0
$6.2
$4.7 $5.3 $5.5
$4.6 $5.2
$10.1 $6.4 $7.9
$9.5
1996 1997 1998 1999 2000 2001 2002 2003 2004 2005 2006 2007 2008 2009 2010 2011
Dairy
Beef
Lamb
Other livestock
Fruit
Vegetables Other horticulture Crops & seeds
15 year CAGR
(96-11) 5.9%
7.4%
4.0%
4.8%
2.1%
7.2%
4.3% 0.6% 3.9%
$7.7 $7.9 $8.1 $8.2 $9.0
$11.4
$13.4
$11.6
$12.7 $12.8
$11.7
$12.7
$17.6
$15.2
$16.2
$18.1
15 year Absolute (96-11) +$10.5
+$6.3
+$1.0
+$1.0
+$0.2
+$1.2
+$0.5 +$0.0 +$0.3
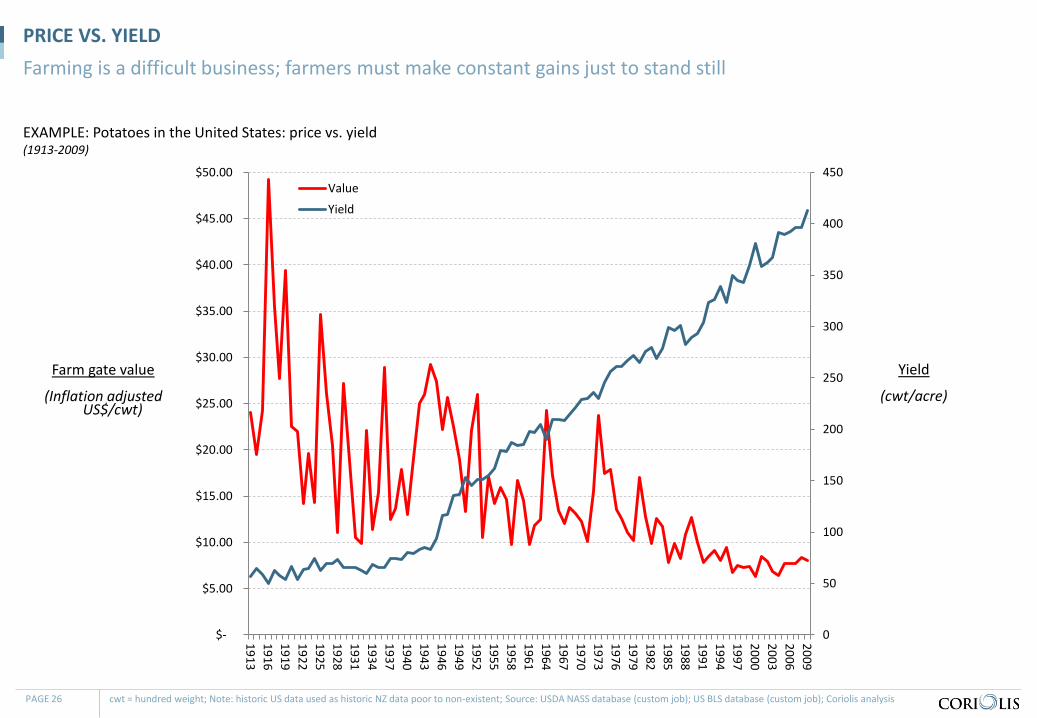
EXAMPLE: Potatoes in the United States: price vs. yield (1913-2009)
PRICE VS. YIELD Farming is a difficult business; farmers must make constant gains just to stand still
PAGE 26 cwt = hundred weight; Note: historic US data used as historic NZ data poor to non-existent; Source: USDA NASS database (custom job); US BLS database (custom job); Coriolis analysis
0
50
100
150
200
250
300
350
400
450
$-
$5.00
$10.00
$15.00
$20.00
$25.00
$30.00
$35.00
$40.00
$45.00
$50.00
191319161919192219251928193119341937194019431946194919521955195819611964196719701973197619791982198519881991199419972000200320062009
Value
Yield
Yield
(cwt/acre)
Farm gate value
(Inflation adjusted US$/cwt)

FARMING SYSTEM IMPROVEMENT EXAMPLE – DAIRY Any given farming system has an underlying rate of improvement, but competing systems may improve at different rates (e.g. pasture vs. feedlot), as this example from the dairy industry shows
93 years growth in New Zealand butterfat per cow (kg/cow; 1917-2010)
Milk per cow: NZ vs. select peers (t/cow; 1961-2009)
PAGE 27 Source: UN FAO AgStats; Statistics NZ; Department of Statistics; DairyNZ; Coriolis analysis
-
1.0
2.0
3.0
4.0
5.0
6.0
7.0
8.0
9.0
10.0
19611964196719701973197619791982198519881991199419972000200320062009
R² = 0.9444
-
20
40
60
80
100
120
140
160
180
200
1917192219271932193719421947195219571962196719721977198219871992199720022007
USA
Denmark
Australia
Ireland Argentina
New Zealand China
Brazil
CAGR (17-10)
0.8%
2.2%
1.8%
2.2%
1.8% 1.9%
0.4% 1.8%
1.3%
CAGR (61-09)
China Last 10 years
6.2%
All our science, all our research, all our investment
just keeps us on this line
When will others go to genetic modification? How
much will they gain?
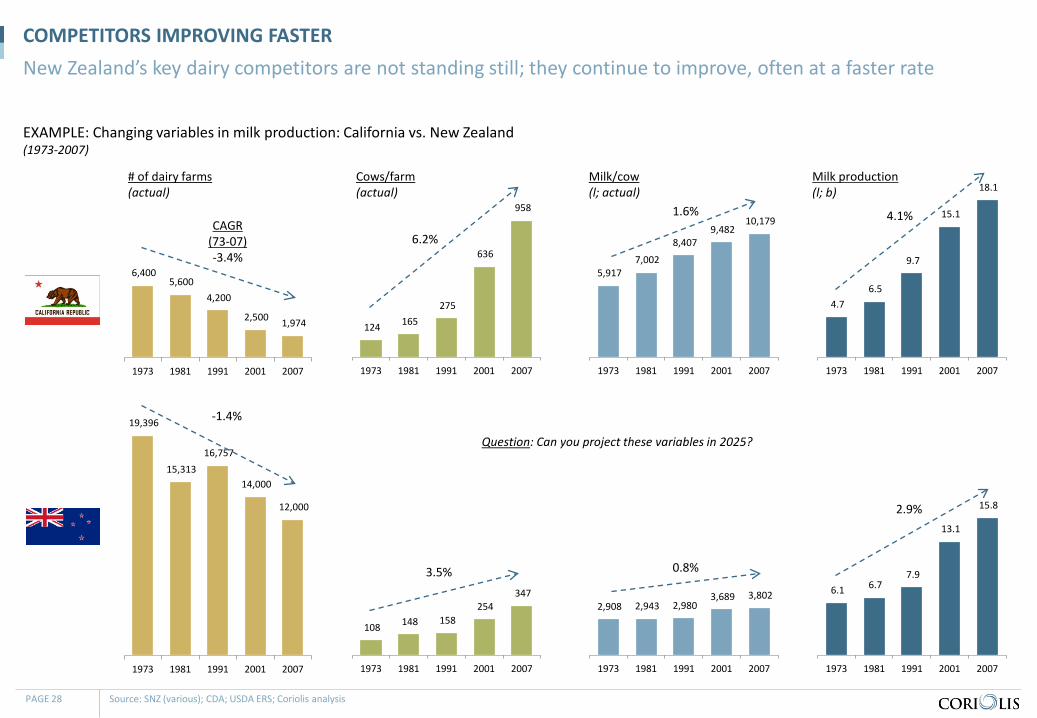
124 165 275
636
958
1973 1981 1991 2001 2007
19,396
15,313 16,757
14,000
12,000
1973 1981 1991 2001 2007
6,400 5,600
4,200
2,500 1,974
1973 1981 1991 2001 2007
5,917 7,002
8,407 9,482
10,179
1973 1981 1991 2001 2007
2,908 2,943 2,980 3,689 3,802
1973 1981 1991 2001 2007
6.1 6.7 7.9
13.1
15.8
1973 1981 1991 2001 2007
4.7 6.5
9.7
15.1
18.1
1973 1981 1991 2001 2007
EXAMPLE: Changing variables in milk production: California vs. New Zealand (1973-2007)
COMPETITORS IMPROVING FASTER New Zealand’s key dairy competitors are not standing still; they continue to improve, often at a faster rate
PAGE 28 Source: SNZ (various); CDA; USDA ERS; Coriolis analysis
# of dairy farms (actual)
108 148 158 254
347
1973 1981 1991 2001 2007
Cows/farm (actual)
Milk/cow (l; actual)
Milk production (l; b)
CAGR (73-07) -3.4%
-1.4%
3.5%
6.2%
0.8%
1.6%
2.9%
4.1%
Question: Can you project these variables in 2025?

Simplified model of the New Zealand food & beverage industry supply/value chain (model; NZ$b; YE June 2011 or as available)
1. PRIMARY PRODUCTION – WATER BASED Water based primary production incorporates wild capture and aquaculture
PAGE 29 Source: Statistics NZ; MAF SONZAF; past Coriolis research; Coriolis estimates and analysis
Oceans & Lakes
Primary
Aquaculture
Wild capture
Land $18.4b
Horticulture & Crop Farms $3.9b
Livestock Farms $14.5b

Defined as 200 nautical miles from coastline
Limit of Exclusive Economic Zone (EEZ) (area, depth, 2010)
WATER – FISHING AREA New Zealand has 6.7m square kilometres of controlled ocean space (15 times the land area); unfortunately much of this is relatively unproductive water over a kilometre deep
PAGE 30 Note: a nautical mile is 1,852 metres; Source: Wikipedia (http://en.wikipedia.org/wiki/Exclusive_Economic_Zone); Sealord; Coriolis analysis
Less than 200m 0.4 6%
200 to 1,000m 1.5 22%
1km+ 4.8 72%
Total = 6.7m km2
Area of EEZ by water depth (km2; % of area; 2010)

Wild capture production volume of fish/seafood in New Zealand waters (t; 000; 1950-2009
WATER – WILD CATCH Wild catch has fallen; direction over the next 15 years is unclear, but unlikely to be up
PAGE 31 Source: UN FAO FishStat FIGIS database; Coriolis analysis
Comments/notes
- Data is volume not value; crustaceans, particularly lobster/crayfish, are highly valuable but not large in volume
- One way to read the -21% is this is the amount that industry capacity (boats, employees, processing lines) has needed to shrink
- Opinions vary on whether wild capture has stabilised or will continue to fall; we were told it had stabilised 5 years ago, so we take stabilisation projections with a “grain of salt”
-
100
200
300
400
500
600
195019521954195619581960196219641966196819701972197419761978198019821984198619881990199219941996199820002002200420062008
Hoki
Orange Roughy
Other marine fish
Crustaceans Other Molluscs Squid/scampi Other
-21%

Latest available comprehensive New Zealand aquaculture metrics (2010)
SPACE – AGRICULTURE VS. AQUACULTURE Proportional to agricultural land use, the 6,250 hectares used in aquaculture in 2010 were relatively minimal, being slightly more than onions but less than oats
PAGE 32 Note: Domestic value and area is directional only; Source: MFish; Aquaculture NZ; Industry Estimations; MAF; UN FAO; Plant & Food Fresh Facts; Coriolis analysis
# of farms
Productive marine space
(ha)
Value
(NZ$m)
$/ha
Mussels 1,000
5,250 $206 $39,238
Salmon 16
100 $145 $1,450,000
Oysters 250
900 $26 $28,889
TOTAL
1,146 6,250 $377 $60,320
8,933,000
1,794,000
77,669
53,885
33,442
21,558
13,287
11,398
9,284
7,425
6,250
4,511
4,117
Sheep & beef
Dairy
Barley
Wheat
Wine grapes
Maize
Kiwifruit
Potatoes
Apples
Oats
Aquaculture
Onions
Avocados
Relative area usage (ha; actual; 2010 or as available)
Clearly, this is revenue only and does not reflect the cost of business, expenses , capital outlay etc. Figure should be taken as directional as varies depending on the figure used for productive space
Food & beverage manufacturing/ processing $37.7b
Simplified model of the New Zealand food & beverage industry supply/value chain (model; NZ$b; YE June 2011 or as available)
2. F&B MANUFACTURING Food & beverage manufacturing has a turnover of $37.7b
PAGE 33 Source: Statistics NZ; MAF SONZAF; past Coriolis research; Coriolis estimates and analysis
Land $18.4b
Horticulture & Crop Farms $3.9b
Oceans & Lakes
Primary Secondary
Livestock Farms $14.5b
Aquaculture
Wild capture
Dairy
Meat
Produce
Processed/other
Nutraceuticals
Seafood
Beverages
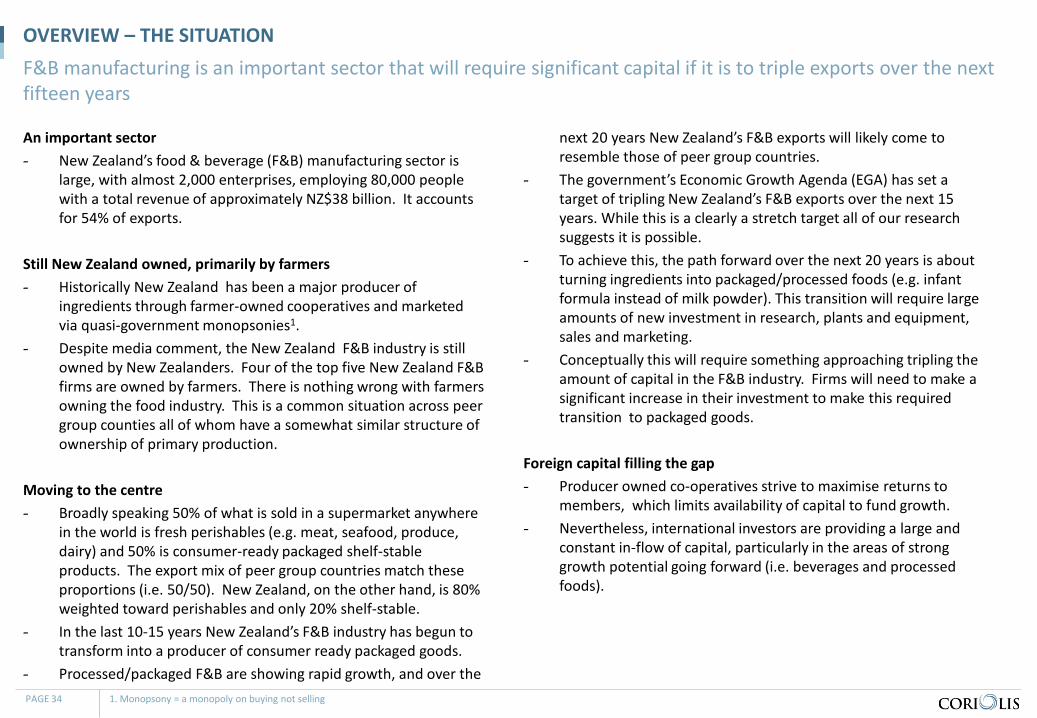
OVERVIEW – THE SITUATION
An important sector - New Zealand’s food & beverage (F&B) manufacturing sector is
large, with almost 2,000 enterprises, employing 80,000 people with a total revenue of approximately NZ$38 billion. It accounts for 54% of exports.
Still New Zealand owned, primarily by farmers - Historically New Zealand has been a major producer of
ingredients through farmer-owned cooperatives and marketed via quasi-government monopsonies1.
- Despite media comment, the New Zealand F&B industry is still owned by New Zealanders. Four of the top five New Zealand F&B firms are owned by farmers. There is nothing wrong with farmers owning the food industry. This is a common situation across peer group counties all of whom have a somewhat similar structure of ownership of primary production.
Moving to the centre - Broadly speaking 50% of what is sold in a supermarket anywhere
in the world is fresh perishables (e.g. meat, seafood, produce, dairy) and 50% is consumer-ready packaged shelf-stable products. The export mix of peer group countries match these proportions (i.e. 50/50). New Zealand, on the other hand, is 80% weighted toward perishables and only 20% shelf-stable.
- In the last 10-15 years New Zealand’s F&B industry has begun to transform into a producer of consumer ready packaged goods.
- Processed/packaged F&B are showing rapid growth, and over the
next 20 years New Zealand’s F&B exports will likely come to resemble those of peer group countries.
- The government’s Economic Growth Agenda (EGA) has set a target of tripling New Zealand’s F&B exports over the next 15 years. While this is a clearly a stretch target all of our research suggests it is possible.
- To achieve this, the path forward over the next 20 years is about turning ingredients into packaged/processed foods (e.g. infant formula instead of milk powder). This transition will require large amounts of new investment in research, plants and equipment, sales and marketing.
- Conceptually this will require something approaching tripling the amount of capital in the F&B industry. Firms will need to make a significant increase in their investment to make this required transition to packaged goods.
Foreign capital filling the gap - Producer owned co-operatives strive to maximise returns to
members, which limits availability of capital to fund growth. - Nevertheless, international investors are providing a large and
constant in-flow of capital, particularly in the areas of strong growth potential going forward (i.e. beverages and processed foods).
1. Monopsony = a monopoly on buying not selling
F&B manufacturing is an important sector that will require significant capital if it is to triple exports over the next fifteen years
PAGE 34

Capabilities required to succeed in exporting (2010)
CAPABILITY ASSESSMENT To truly succeed in the international market New Zealand needs to improve in some key areas
PAGE 35 Source: LSE, Centre for Economic Performance; Coriolis
NZ current capabilities
Deep experience in global management
International governance experience
Strategy focused
Information rich
Large, deep domestic pool of capital
Low cost production infrastructure
Successful innovations
Excellent technology
Market share leader
Global sales force
low medium high
Somewhat addressing this with Food and
Beverage Information Project

Number of F&B manufacturing enterprises by sector (#; actual; 2000-2010)
F&B MANUFACTURING – # OF ENTERPRISES
PAGE 36 Source: Statistics New Zealand (Detailed industry for enterprises (ANZSIC06)); Coriolis analysis
Comments/Notes
- Statistics NZ does not collect data on nutraceuticals and foods for health; we suspect much (but not all) of this sector is caught in “other” food
- New enterprise formation is a likely indicator of sectors/sub-sectors at the early stages of their lifecycle
58 57 53 51 56 57 57 57 58 72 78
265 260 261 258 266 254 266 256 267 270 279
147 138 134 133 129 128 121 112 115 104 97
102 107 115 119 125 124 121 120 121 118 108
287 297 308 331 354 369 406 436 441 470 519
704 696 697 744
795 838 859 879 899 905
917
2000 2001 2002 2003 2004 2005 2006 2007 2008 2009 2010
Dairy 3%
Meat 1%
Seafood -4%
F&V 1%
Beverages 6%
Processed/ Other 3%
1,563 1,555 1,568 1,636
1,725 1,770
1,830 1,860 1,901 1,939
1,998
CAGR (00-10)
2%
+20
+14
-50
+6
+232
+213
Absolute change (00-10)
+435
The number of F&B manufacturing enterprises in New Zealand is growing, driven by beverages and processed/other foods

Number of people employed in F&B manufacturing by sector (people; head count; 000; 2000-2010)
F&B MANUFACTURING – EMPLOYMENT
PAGE 37 Source: Statistics New Zealand (Detailed industry for enterprises (ANZSIC06)); Coriolis analysis
Comments/Notes
- Statistics NZ does not collect data on nutraceuticals and foods for health; we suspect much (but not all) of this sector is caught in “other” food
- Dairy clearly has higher productivity per employee than meat
- Head count is as of Feb of year in question; this will not catch some seasonal surges
9.4 10.2 9.9 10.9 11.6 11.9 12.5 10.8 9.9 10.3 10.7
28.2 29.1 30.6 30.5 31.7 32.1 30.9 31.1 31.7 31.0 30.5
6.9 8.0 8.5 8.1 7.5 7.6 7.3 7.3 6.7 7.0 6.9
6.4 5.5
5.5 5.2 5.3 5.3 5.2 5.1 4.9 4.7 4.2 6.5
7.3 7.3 7.7 8.0 8.2 8.5 8.8 9.1 9.3 8.9
16.2 16.0
16.5 17.1 17.6 18.4 18.4 20.4 20.5 19.6 18.9
2000 2001 2002 2003 2004 2005 2006 2007 2008 2009 2010
Dairy 1%
Meat 1%
Seafood -%
F&V -4%
Beverages 3%
Processed/ Other 2%
73.6 76.1
78.3 79.4 81.6
83.3 82.9 83.4 82.7 81.9 80.1
CAGR (00-10)
1%
+1
+2
-
-2
+2
+3
Absolute change (00-10)
+6
The number of people employed in F&B manufacturing was growing through 2005 and has been flat-to-down since then

Number of people employed in F&B manufacturing in New Zealand by key firm and by sector (people; head count; %; 2010)
F&B MANUFACTURING – EMPLOYMENT BY KEY FIRM Looking at total industry employment by key firms and sectors highlights that industry employment is spread across a wide range of firms
PAGE 38 Source: Statistics New Zealand (Detailed industry for enterprises (ANZSIC06)); various other sources (see module 2 sections for details); Coriolis analysis
Comments/Notes
- Results should be treated as partially directional as SNZ does not disclose actual firm sector classification (i.e. classifications are Coriolis assumptions)
- Interestingly Fonterra is not a large employer relative to its export volumes (high employee efficiencies)
- Classification of some firms overlaps multiple classifications (e.g. Heinz-Watties)
- Fonterra is domestic employees (excluding TipTop)
- Excludes wholesaling
Fonterra 11%
Meadow Fresh 1%
Other dairy 2%
Silver Fern Farms 9%
Alliance 9%
ANZCO 3%
AFFCO 4%
Tegel 2% Inghams
1%
Other meat 10%
Sanford 2%
Sealord 2%
Other seafood 4%
T&G 2%
Other F&V 3%
Lion 2%
Other beverages 9%
Goodman Fielder 2%
Heinz-Watties 2%
Griffins 1%
Other 17%
80,080 employees (head count)

F&B employment by industry by region (people; head count; 2010)
EMPLOYMENT BY INDUSTRY BY REGION Looking at industry by region we find farm-based products spread across the regions, but processed foods more concentrated in Auckland
PAGE 39 Note: UNI = Upper North Island; Source: Statistics New Zealand (Detailed industry for enterprises)
3%
15%
47%
Processed/other
20,469
11%
15%
16%
16%
26%
1%
19%
10%
Meat
29,451
29%
18%
18%
27%
8%
25%
37%
14%
Seafood
5,055
45%
Remainder SI
Canterbury
Produce
Remainder UNI
Auckland
Beverages
6,496
27%
8%
4,459
13%
43%
23%
3%
50%
11%
Dairy
10,391
13%
10%
Lower North Island

F&B manufacturing turnover growth (NZ$; b; 1999-2009)
F&B MANUFACTURING – TURNOVER Total F&B manufacturing turnover was $37.7b in 2009; manufacturing turnover has been growing at a 6.5% CAGR over the last decade
PAGE 40 Source: Statistics New Zealand (Annual Enterprise Survey; supplementary tables; various years); Coriolis analysis
Comments/Notes
- 2010 not yet available
- Data appears to be turnover of New Zealand operations, not global sales
- Beverages technically includes tobacco manufacturing, though we do not believe cigarettes are manufactured in this country
- The NZ Annual Enterprise Survey (AES) comes from IR10 tax data, a postal survey and other sources. “The data collected feeds into the calculation of the economy's GDP, through the current price annual industry accounts, which are compiled within an input-output framework.”
$16.9 $18.7
$22.2 $23.1 $22.5 $23.0 $23.0 $24.9
$26.8
$31.5 $33.0
$3.1
$3.4
$3.8 $4.1 $4.1 $4.1 $4.4
$4.8
$5.2
$4.3 $4.7
1999 2000 2001 2002 2003 2004 2005 2006 2007 2008 2009
$20.0
$22.1
$25.9 $27.2 $26.6 $27.1 $27.4
$29.7
$32.0
$35.7
$37.7
Food 6.9%
Beverage 4.1%
+$16.1
$1.5
CAGR (00-10)
6.5%
Absolute change (00-10) +$17.7

Turnover of top 64 New Zealand F&B firms by ownership type/country (% of NZ$m; 2010e)
TOP 64 NZ F&B BY OWNERSHIP Looking at the ownership of the turnover of the top 64 New Zealand F&B firms, we find ~60% owned by farmers, 75% owned by New Zealanders, 14% by other Anglo-Saxon countries, 3% by Europeans and 8% by Asia
PAGE 41 Source: Coriolis
Comments/Notes
- Companies with mixed ownership (e.g. Japan/Iwi) have had their turnover allocated proportionally
- The Anglo-Saxon four own as much as private individuals
- Data includes significant number of estimates
- Totals may not sum due to rounding
Farmers 59%
Private 14%
Iwi 1% Listed 1%
Charity 0%
Australia 8%
USA 5% Canada 1% United Kingdom 1%
Swiss 1% France 1%
Netherlands 1%
Russia 0% Japan 5%
Hong Kong 1%
Singapore 1%
China 0%
Malaysia 0%
Thailand 0%
75%
Anglo-Saxon 14%
Euro 3%
Asia 8%
TOTAL = NZ$38.9b

Turnover of top 64 New Zealand F&B companies (NZ$m; 2010)
F&B MANUFACTURING – FIRM TURNOVER New Zealand has one very large F&B firm (Fonterra), a handful of other large firms, and a long tail of smaller firms
PAGE 42 Source: Coriolis
$-
$2,000
$4,000
$6,000
$8,000
$10,000
$12,000
$14,000
$16,000
FonterraSFFZespriAllianceAN
ZCOAFFCOHeinz-W
attiesLionT&
GM
G Marketing
Ovation/other
Meadow
FreshGoodm
an Fielder NZ
SealordO
pen CountryCoca-Cola N
ZDB Brew
eriesN
estle NZ
Westland
SanfordInd. LiquorTegelFrucorPernod Ricard N
ZIngham
s NZ
GWF N
ZU
nilever NZ
GriffinsCadbury N
ZChelseaDelegat'sBrinksConstellationM
cCainFresh DirectScalesM
ars NZ
TalleysVitacoTatuaCerebos N
ZAotearoa Fish.HellersSynlaitFreshM
axBlurbirdVilla M
ariaLeader BrandsTaylor PrestonU
niversal BeefSeekaSanitariumLean M
eatsJack Link'sGardner Sm
ith NZ
NZ King Salm
onAotearoa Sea.GreenleaFern RidgeYarrow
'sTastiBakels N
ZHansellsN
ZDL
Substantial outward direct investment and ~40% of total F&B exports

Comparison of sales and ownership structure of top 10 food & beverage industry firms (domestic-residence only): Denmark vs. NZ (NZ$b; 2008)
TOP 10 RESIDENT FOOD & BEVERAGE COMPANIES: NZ VS. DENMARK Benchmarking the turnover of the top 10 domestic resident F&B firms in the New Zealand food industry with Denmark indicates there is a “missing middle” of large firms other than Fonterra
PAGE 43 Note: ANZCO is not listed on the NZX but has a range of domestic shareholders (plus NSK & Itoham); Sealord is NSK and various Maori interests; Source: Coriolis
$16.0
$2.0 $1.3 $1.2 $1.1 $1.1
$0.6 $0.6 $0.5 $0.3
$16.2
$13.4 $13.0
$3.3 $2.2
$1.2 $1.2 $1.0 $1.0 $0.4
Fonterra
Silver Fern Farms
Alliance
Zespri
ANZCO
Foods
AFFCO
Sealord
T&G
ENZA
Westland
MG
Marketing
Carlsberg
Arla Foods
Danish Crown
Danisco
Novozym
es
Royal Greenland
Royal Unibrew
Chr. Hansen
AAK
Kavli Holding
Coop/board Listed w/cornerstone Private Private w/foreign control Public
“The missing middle”

Comparison of sales and ownership structure of top 15 food & beverage industry firms: NZ vs. Canada (all ownership) (NZ$b; 2008)
TOP 15 FOOD & BEVERAGE COMPANIES: NZ VS. CANADA A similar message comes from a benchmarking of the top 15 F&B firms in the New Zealand food industry with Canada: there is a “missing middle” of large firms other than Fonterra
PAGE 44 Note: ANZCO is not listed on the NZX but has a range of domestic shareholders (plus NSK & Itoham); Sealord is NSK and various Maori interests; Source: Coriolis
$16.0
$2.0 $1.3 $1.2 $1.1 $1.1 $1.0 $0.7 $0.6 $0.6 $0.6 $0.5 $0.5 $0.4 $0.4
$11.5
$8.2 $8.1 $7.2 $6.9
$4.9 $3.9
$3.1 $3.0 $3.0 $2.8 $2.7 $2.4 $2.2 $1.3
Fonterra
Silver Fern Farms
Alliance
Zespri
ANZCO
Foods
AFFCO
Goodm
an Fielder
Heinz Wattie's
Sealord
Lion Nathan
T&G
ENZA
Westland
Coca-Cola Amatil
Tegel Foods
Frucor
Canadian Wheat Board
McCain Foods
Cargill Canada
Maple Leaf Foods
Saputo
La Coop fédérée
Agropur
PepsiCo Canada
Parmalat Canada
George W
eston
Olym
el
Molson Canada
Cott Corporation
Nestle Canada
Paterson GlobalFoods
Coop/board Listed w/foreign control Listed w/cornerstone Subsidiary of foreign Private Private w/foreign control Listed
“The missing middle”

Comparison of sales and ownership structure of top 17 resident food, beverage & agribusiness industry firms: NZ vs. Minnesota (NZ$b; 2008)
TOP 17 RESIDENT FOOD & BEVERAGE COMPANIES: NZ VS. MINNESOTA A similar message comes from a benchmarking of the top 17 resident F&B (+agribusiness) firms in the New Zealand food industry with the state of Minnesota (a major food producing state in the US)
PAGE 45 Note: ANZCO is not listed on the NZX but has a range of domestic shareholders (plus NSK & Itoham); Sealord is NSK and various Maori interests; Source: Coriolis
$16.0
$2.0 $1.3 $1.2 $1.1 $1.1 $0.9 $0.7 $0.6 $0.6 $0.5 $0.3 $0.3 $0.2 $0.2 $0.2 $0.2
$19.1
$12.5
$9.5 $7.4
$6.3
$3.3 $2.9 $2.4 $2.1 $1.7 $1.4 $0.8 $0.7 $0.7 $0.6
Fonterra
Silver Fern Farms
Alliance
Zespri
ANZCO
Foods
AFFCO
Ravensdown
Balance
Sealord
T&G
ENZA
Westland
Open Country
MG
Marketing
Tatua
Taylor Preston
Villa Maria
Scales/Mr Apple
Cargill
CHS
General M
ills
Land O'Lakes
Hormel Foods
Mosaic
PepsiAmericas
Rosen's
Schwan Food
Ass. Milk Prod.
Michael Foods
American Crystal Sugar
Davisco
Malt-O
-Meal
MN
Soybean
First District
Lakeside Foods
“The missing middle”
$168.6
$45.0
Coop/board Listed w/cornerstone Private Private w/foreign control Public
Population: 5.3m Population: 4.3m

Select financial ratios of top five food & beverage businesses: New Zealand vs. Denmark (NZ$m; FY09)
FINANCIAL RATIOS: NZ VS. DENMARK The New Zealand food & beverage sector is under-capitalised relative to peers; as a result, it is less profitable
PAGE 46 Note: Firms ranked by turnover; treat as directional due to differences in accounting practices, and business structures; 2 Danish firms are coop (1 meat, 1 dairy) so that can not be used as an excuse; Source: various company annual reports (Fonterra, SFF, Alliance, Zespri, ANZCO, Carlsberg, Arla, Danish Crown, Danisco, Novozymes); Coriolis analysis
$4,805
$14,788
$252
$2,613
$361
$1,126
$74
$3,018
$249
$1,452
New Zealand Denmark
$5,741
$22,997
Firm #1
Firm #2
Firm #3
Firm #4
Firm #5
Net assets (TA-TL)
$922
$2,334
$21
$351
$43
$407
$39
$307
$21
$420
New Zealand Denmark
$1,046
$3,819
Firm #1
Firm #2
Firm #3
Firm #4
Firm #5
Operating profit (EBIT)
4x
3.7x

Food & beverage manufacturing/ processing $37.7b
Simplified model of the New Zealand food & beverage industry supply/value chain (model; NZ$b; YE June 2011 or as available)
3. MARKETS New Zealand food & beverages are sold to domestic retail and foodservice outlets and into export markets
PAGE 47 Source: Statistics NZ; MAF SONZAF; past Coriolis research; Coriolis estimates and analysis
Land $18.4b
Horticulture & Crop Farms $3.9b
Oceans & Lakes
Domestic Food Retailing $18.7b
Domestic Foodservice & Hospitality $6.5b
Value FOB of New Zealand F&B exports $25.3b
Primary Secondary Markets
Livestock Farms $14.5b
Aquaculture
Wild capture
Food & beverage wholesalers $25.3b
Expenditure by New Zealand consumers on F&B $22.5b
Expenditure by non-NZ consumers on F&B products primarily of NZ origin ~$140-200b
Global food manufacturers & wholesalers sales of F&B products primarily of NZ origin ~$100-150b
Global food retailing & foodservice sales of F&B products primarily of NZ origin ~$140-200b
Expenditure by tourists in NZ $2.7b
Consumers
Value of NZ F&B imports $4.0b
Dairy
Meat
Produce
Processed/other
Nutraceuticals
Seafood
Beverages

OVERVIEW – THE SITUATION
Situation - In the early days of its founding New Zealand was, conceptually
speaking, Britain’s farm. The country produced staples of the English diet such as lamb, beef, butter, cheese and apples. These were produced in large quantities on a counter-seasonal basis for shipment to the “home country” and other rich Western markets.
- There is the perception by many today that this is still the case. If you were to ask the average person on the street in New Zealand today where the country’s food exports go, you would still get some form of the “Food to Britain” narrative. Many smaller food and beverage manufacturers, in our experience, would also articulate something similar.
- Reality is very different. New Zealand is in the middle of a fundamental transition from feeding Westerners to feeding the Asia-Pacific region. This transition is driving rapid change in the New Zealand food industry in what is being produced and where it is being sold. Key exports today include:
- Milk powder for Asian dairy factories, used to produce yoghurt and other dairy products
- Frozen french fries, frozen hamburgers, and processed cheese for fast food restaurants in South East Asia
- Gold kiwifruit for Asian consumers - Imagine an alternative reality where New Zealand was colonised
not by England, but rather Japan or China. In this reality, New Zealand would produce very different foods and beverages. This is what the future potentially looks like.
New Zealand - With a population of 4.4 million people, New Zealand has a
relatively small domestic market. This limits the scale of domestic producers – with many operating plants and equipment at the very small end of the scale globally. In addition, the domestic F&B retail scene is highly consolidated into two main players (Woolworths Australia and Foodstuffs). Foodservice, while less concentrated, has a relatively high cost to serve.
- As a result, New Zealand firms need to begin exporting at a much smaller relative scale and at a much earlier stage of their growth cycle than similar firms in other countries.
Australia - With CER1, FSANZ2 and the purchase of Progressive by
Woolworths Australia3, we have seen the effective emergence of a single trans-Tasman market for F&B.
- New Zealand F&B firms have reacted well to this shift and New Zealand F&B exports to Australia have been growing at double digit rates over the last decade.
- These F&B exports to Australia are dominated by packaged , consumer-ready, processed foods. Conceptually the path forward is to replicated this export profile to the rest of the world.
Asia - The emerging middle income consumers of Asia are signalling
quite strongly they want high quality, premium branded, high status products. New Zealand requires a new skill set and mentality to succeed in these markets. However, the wine industry shows that New Zealand can do premium with the best.
1. Australia New Zealand Closer Economic Relations Trade Agreement; 2. Food Standards Australia New Zealand; 3. in 2005 Woolworths Australia (the Number one supermarket chain in Australia purchased Progressive Enterprises (the number two supermarket chain in NZ);
New Zealand is in the middle of a fundamental transition from feeding Westerners to feeding the Asia-Pacific region; this transition is driving rapid change in what is being produced and where it is being sold
PAGE 48

Food & Beverages as a percent of New Zealand’s total export value (%; 2010)
MAJOR F&B EXPORTER Food and beverage exports are important to New Zealand and the country is a major F&B exporter
PAGE 49 Source: UN Comtrade database; Coriolis analysis
Food & Beverages
54%
Other products 46%
$59
$58
$56
$35
$34
$34
$24
$17
$17
$11
$11
$10
$9
$7
$7
$5
$4
$2
$2
$2
Germany
France
Netherlands
Spain
Italy
Belgium
United Kingdom
New Zealand
Denmark
Chile
Ireland
Austria
Norway
Sweden
Switzerland
Portugal
Japan
Iceland
Israel
Finland
Total F&B export value: New Zealand vs. peers (US$b; 2010)
NZ exports 4x as much food as
Japan!
Note: uses US$

Export value of key products in 2010 vs. 15 year CAGR of export value vs. 15 year absolute growth in exports (US$b; nominal; 1996v2010)
ENGINE OF EXPORTS The F&B sector has been the engine of New Zealand exports and export growth
PAGE 50 Source: UN Comtrade database (custom job); Coriolis analysis
Size Export value in 2010 in US$b
Growth CAGR of export
value (96-10)
Overall 5.2%
Size of bubble = 15 year absolute growth
(or shrink [red]) of exports in US$b
3%
2%
1%
0%
1%
2%
3%
4%
5%
6%
7%
8%
9%
10%
11%
12%
13%
$0 $1 $2 $3 $4 $5 $6 $7 $8 $9 $10 $11 $12 $13 $14 $15 $16 $17 $18 $19
F&B
Ores Wood & products
Oil
Wool
Aluminium
Other stones & metals
Plastics
Tools & machinery
Ships/other vehicles
Electrical equip
Biomedical
Other
Commodities NES

New Zealand F&B export value by major segment (US$b; 2010)
RANGE OF SECTORS New Zealand food exports are spread across a range of product sectors; while all are achieving export value growth, processed foods and beverages stand out as growth stars
PAGE 51 Source: UN Comtrade database; Coriolis analysis
Whole milk powder $3.1 18%
Skim milk powder $1.0 6%
Butter $1.5 9%
Cheese $1.0 6%
Other dairy $1.1 7%
Beef $1.4 8%
Lamb $1.9 12%
Other meat $0.4 2%
Wild seafood $0.8 5%
Aquaculture $0.2 1%
Kiwifruit $0.7 4%
Apples $0.2 1%
Other produce $0.4 3%
Other foods $0.3 2%
Processed foods $1.5 9%
Wine $0.8 5%
Other beverages $0.2 1%
Total = US$16.7b
Meat $3.7b 22%
Dairy $7.8b 47%
$2.1
$7.8
$1.8
$3.7
$0.8
$1.0
$0.8
$1.3
$0.2
$0.3
$0.3
$1.5
$0.1
$1.0
1995 2010
Dairy
New Zealand F&B export value by major segment (US$b; non-inflation adjusted; 1995 vs. 2010)
Meat
Seafood
Produce
Other
Processed
Beverages
$16.7
$6.1
9%
5%
2%
3%
4%
12%
17%
15 year CAGR
(95-10)
7%

LONG TERM SHIFTS F&B have been our largest single export for the last 100 years; however F&B export mix not “set in stone”; changes have occurred throughout history; shift currently underway towards processed
F&B as a % of total NZ export value for 130 years (% of export £ or NZ$; 1880-2009)
NZ F&B export value mix by type for 130 years (% of total F&B sales; given years)
PAGE 52 Source: Statistics of New Zealand 1880, 1990, 1920; New Zealand Trade & Shipping 1940; New Zealand Details of Exports 1960; UN Comtrade SITC1 1980, 2000, 2009; Coriolis analysis
0%
10%
20%
30%
40%
50%
60%
70%
80%
90%
100%
1880 1900 1920 1940 1960 1980 2000 2009
Beef
Lamb
Other meat
Seafood
Butter
Cheese
Milk powder
Other dairy Apples Kiwifruit
Grains, flour & pulses
Processed/other F&B
Wine
16%
34%
51%
67%
54%
45% 44%
54%
1880 1900 1920 1940 1960 1980 2000 2009

Share of food & beverage export value by sector: New Zealand vs. identified climatic peers (% of US$; 2010 or latest available)
F&B EXPORT VALUE Comparing export product mix by country highlights that New Zealand is overweighted to dairy and meat; peers highlight processed foods and beverages as opportunity
PAGE 53 Source: UN Comtrade database; project RFP; Coriolis analysis
Comments/Notes
- This suggests that there may be more growth potential in beverages
- Chile, Spain, Uruguay, Netherlands, Austria & Argentina use 2009 data
0% 10% 20% 30% 40% 50% 60% 70% 80% 90% 100%
SwitzerlandUnited Kingdom
AustriaItaly
FrancePortugal
GermanyIreland
BelgiumSweden
South AfricaNetherlands
FinlandSpainChile
DenmarkCanada
United StatesAustralia
New ZealandArgentina
IcelandNorway
Uruguay
Dairy
Meat
Seafood
Produce
Grains
Other
Processed
Beverages
Beverages Processed foods Dairy

Total food & beverage export value: New Zealand vs. identified climatic peers (US$b; 2010 or latest available)
F&B EXPORT VALUE Comparing New Zealand F&B exports by sector with peers we find peers achieving success across a wide range of products
PAGE 54 Source: UN Comtrade database; project RFP; Coriolis analysis
Comments/Notes
- This comparison with peers suggests it is difficult to see major F&B export growth coming from anything other than processed foods and beverages; we suggest a strong focus on these
- Clearly our production mix is not fixed and can change over time (for example: sheep to wine grapes in Marlborough)
- Chile, Spain, Uruguay, Netherlands, Austria & Argentina use 2009 data
$- $20.0 $40.0 $60.0 $80.0 $100.0
United States Germany
France Netherlands
Spain Italy
Belgium Canada
United Kingdom Australia
Argentina New Zealand
Denmark Chile
Ireland Norway Austria
Sweden Switzerland South Africa
Portugal Uruguay
Iceland Finland
Dairy
Meat
Seafood
Produce
Grains
Other
Processed
Beverages

Europe 11%
United Kingdom 5%
Russia 1%
USA 10%
Canada 2%
Mexico 1%
Australia 11%
Pacific Islands 2%
Japan 7%
China 11%
Hong Kong 2%
South Korea 2%
Taiwan 3%
SE Asia 14%
Saudi Arabia 2%
UAE 1%
Other NA/ME/CA
6%
Venezuela 2%
Other 7%
Aggregate annual food & beverage export value by key markets and total (US$b; 2010)
NZ F&B EXPORTS BY DESTINATION New Zealand exports F&B to a wide range of destinations; interestingly Australia now takes twice as much as the United Kingdom and Asia is worth +33% more than Europe, Russia and North America combined
PAGE 55 Source: UN Comtrade database (custom job); Coriolis analysis
Europe & Russia 17%
North America 13%
Asia 39%
Total = US$16.7b
Oceania 13%
North Africa Middle East Central Asia
17%

New Zealand export value matrix: NZ export value per capita vs. GDP/capita vs. total NZ export value (various; US$; 2009)
NZ EXPORT VALUE MATRIX Drilling in to country level data highlights a wide range of opportunities to sell more
PAGE 56 Source: UN Comtrade database (custom job); Wikipedia (population by country); CIA World Fact Book (GDP/capita nominal); Coriolis analysis
$5,000
$0
$5,000
$10,000
$15,000
$20,000
$25,000
$30,000
$35,000
$40,000
$45,000
$50,000
$55,000
$60,000
$65,000
$70,000
$5 $0 $5 $10 $15 $20 $25 $30 $35 $40 $45 $50 $55 $60 $65 $70
Mexico
China
Spain
Philippines
France
Greece
Algeria
United States
Switzerland
Czech Republic
South Korea
Italy
Trinidad and Tobago
Belgium
Tuvalu
UAE
Hong Kong
Cook Islands Barbados
Singapore
Bahrain
Japan
Venezuela
Saudi Arabia
Malaysia
United Kingdom
Taiwan
Vanuatu
Oman
Mauritius
Australia
Fiji
GDP/capita (US$; 09)
NZ F&B export value per capita (US$m; 09)
Relative size of bubble = total import value
Rich and good customers Rich and could
sell more
Poor and could sell more
Poor and good customers

www.foodandbeverage.govt.nz