fonterra annual results 2013 · global everyday nutrition brand portfolio crafted quality ......
TRANSCRIPT

© Fonterra Co-operative Group Ltd. 1 © Fonterra Co-operative Group Ltd.
© FONTERRA CO-OPERATIVE GROUP LIMITED
FONTERRA
ANNUAL RESULTS 2013

© Fonterra Co-operative Group Ltd. 2 © Fonterra Co-operative Group Ltd.
John Wilson – Chairman

© Fonterra Co-operative Group Ltd. 3 © Fonterra Co-operative Group Ltd.
Key highlights
FARMGATE MILK PRICE
$5.84kgMS
DIVIDEND
32 cps
EARNINGS PER SHARE
44 cps
DEBT TO DEBT PLUS EQUITY
39.6%
FINAL CASH PAYOUT
$6.16
NET PROFIT
$736m

© Fonterra Co-operative Group Ltd. 4 © Fonterra Co-operative Group Ltd.
Cash payout
(1) Cents per share
(2) $ per kgMS
(1)
6.10 7.60 6.08 5.84 8.30
0.27
0.30
0.32 0.32
0.32
6.37
7.90
6.40 6.16
8.62
2010 2011 2012 2013 2014F
Dividend Farmgate Milk Price (2) (1)
© Fonterra Co-operative Group Ltd. 5 © Fonterra Co-operative Group Ltd.
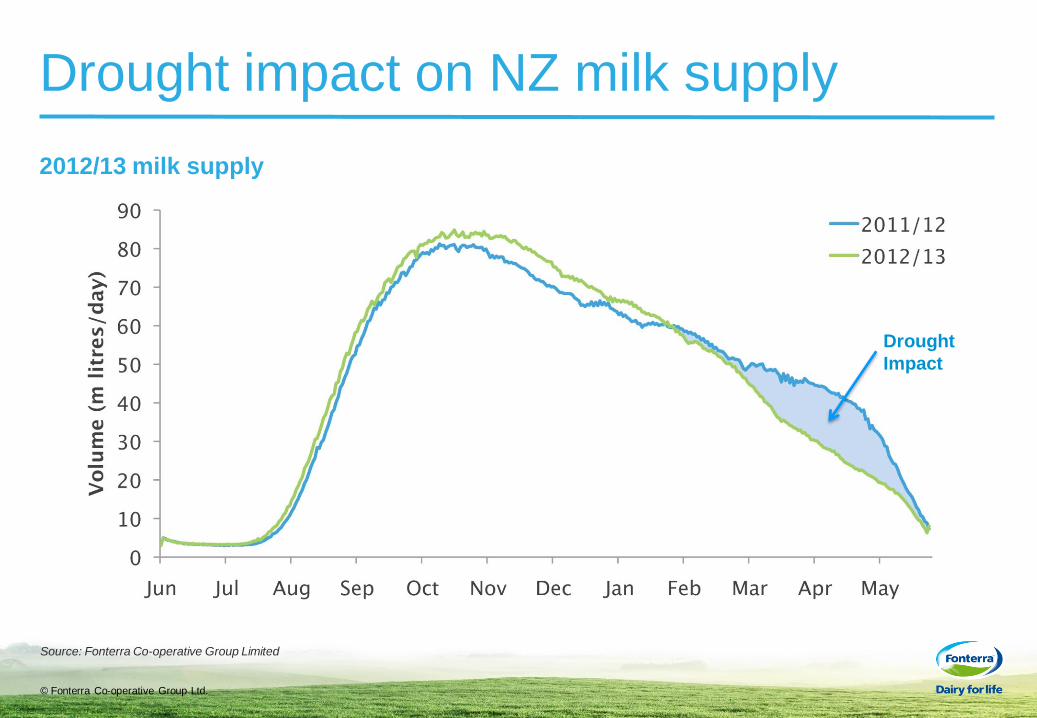
Drought impact on NZ milk supply
Source: Fonterra Co-operative Group Limited
2012/13 milk supply
Drought
Impact

© Fonterra Co-operative Group Ltd. 6 © Fonterra Co-operative Group Ltd.
Stronger Capital Structure
Nov 2012 Trading Among Farmers launched
Mar 2013 More flexible contracts for new
and growing, farmers
Apr 2013 1:40 Bonus Issue
May 2013 Second Supply Offer
No drought related capital outflows – confirming redemption risk has
been removed

© Fonterra Co-operative Group Ltd. 7 © Fonterra Co-operative Group Ltd.
Theo Spierings – CEO

© Fonterra Co-operative Group Ltd. 8 © Fonterra Co-operative Group Ltd.
Results highlights
Volume • Volume up in all segments, excluding ANZ
• Asia/Africa & Middle East - up 11%
• NZ Milk Products - up 1%
• Latin America - up 6%
• Australia/New Zealand - down 2% (excluding Norco)
Value • NPAT of $736m - up 18%
• Normalised EBIT - down 3%
• Normalised EPS of 471 cps
GROUP SALES VOLUME
4m MT
GROUP NORMALISED EBIT
$1BN
Note 1: Normalised EPS is calculated as net profit after tax attributed to equity holders of the Company, adjusted for normalisation adjustments, divided by the
weighted average number of Cooperative shares on issue. The normalisation adjustments are tax effected.
© Fonterra Co-operative Group Ltd. 9 © Fonterra Co-operative Group Ltd.
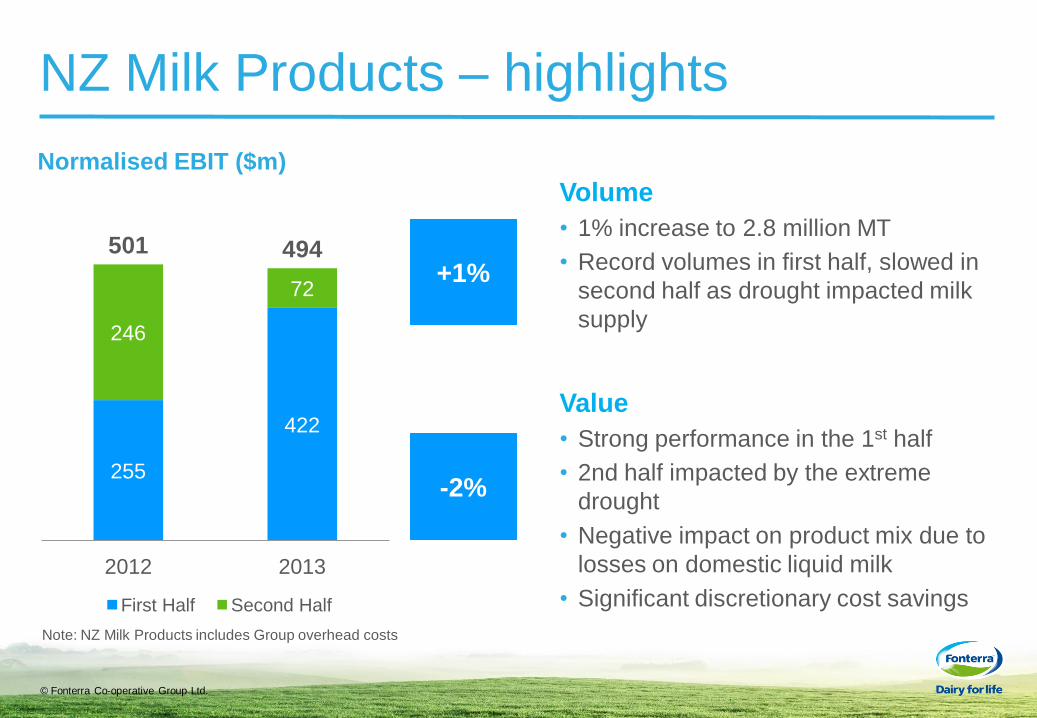
NZ Milk Products – highlights
-2%
+1%
Volume
• 1% increase to 2.8 million MT
• Record volumes in first half, slowed in
second half as drought impacted milk
supply
Value
• Strong performance in the 1st half
• 2nd half impacted by the extreme
drought
• Negative impact on product mix due to
losses on domestic liquid milk
• Significant discretionary cost savings
Normalised EBIT ($m)
255
422
246
72
501 494
2012 2013
First Half Second Half
Note: NZ Milk Products includes Group overhead costs

© Fonterra Co-operative Group Ltd. 10 © Fonterra Co-operative Group Ltd.
NZMP – key performance drivers
501
26
107
18 43
49
494
2012 Price Premiums
Product Mix
Quality Issues
Global Sourcing
Other/Cost Savings
2013
Normalised EBIT ($m)

© Fonterra Co-operative Group Ltd. 11 © Fonterra Co-operative Group Ltd.
Volatility in prices of powder and
non-powder products
-350
-300
-250
-200
-150
-100
-50
0
50
100
150
Aug-08 Feb-09 Aug-09 Feb-10 Aug-10 Feb-11 Aug-11 Feb-12 Aug-12 Feb-13 Aug-13
NZ Milk Products profit impact ($m)
© Fonterra Co-operative Group Ltd. 12 © Fonterra Co-operative Group Ltd.
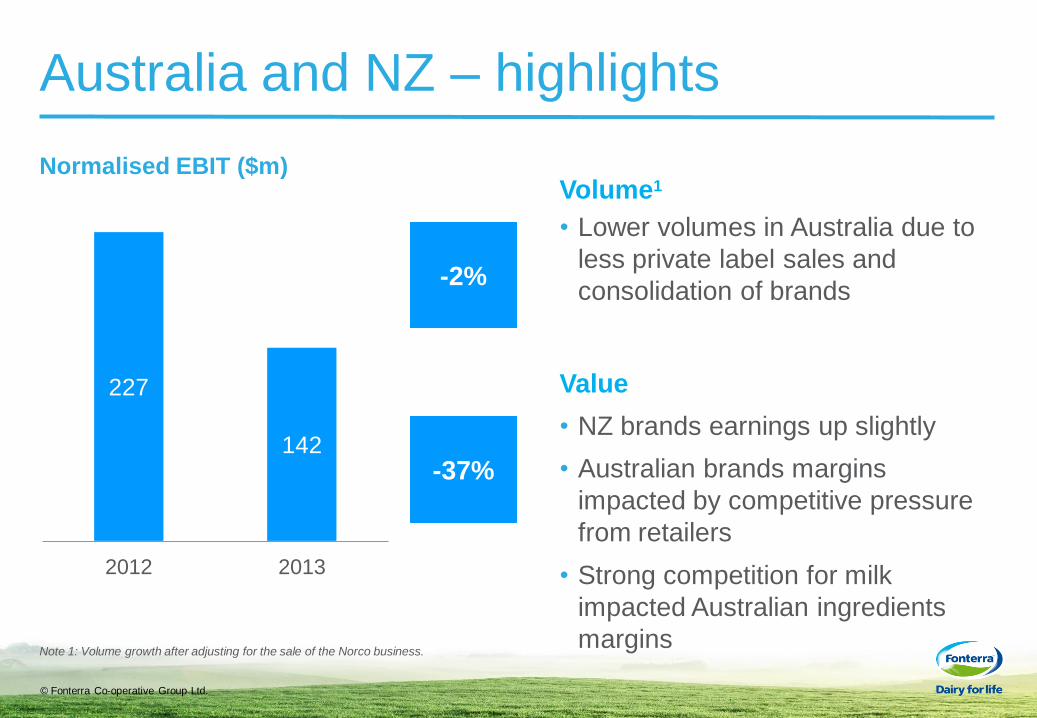
Australia and NZ – highlights
Volume1
• Lower volumes in Australia due to
less private label sales and
consolidation of brands
Value
• NZ brands earnings up slightly
• Australian brands margins
impacted by competitive pressure
from retailers
• Strong competition for milk
impacted Australian ingredients
margins
-37%
-2%
Note 1: Volume growth after adjusting for the sale of the Norco business.
Normalised EBIT ($m)
227
142
2012 2013
© Fonterra Co-operative Group Ltd. 13 © Fonterra Co-operative Group Ltd.
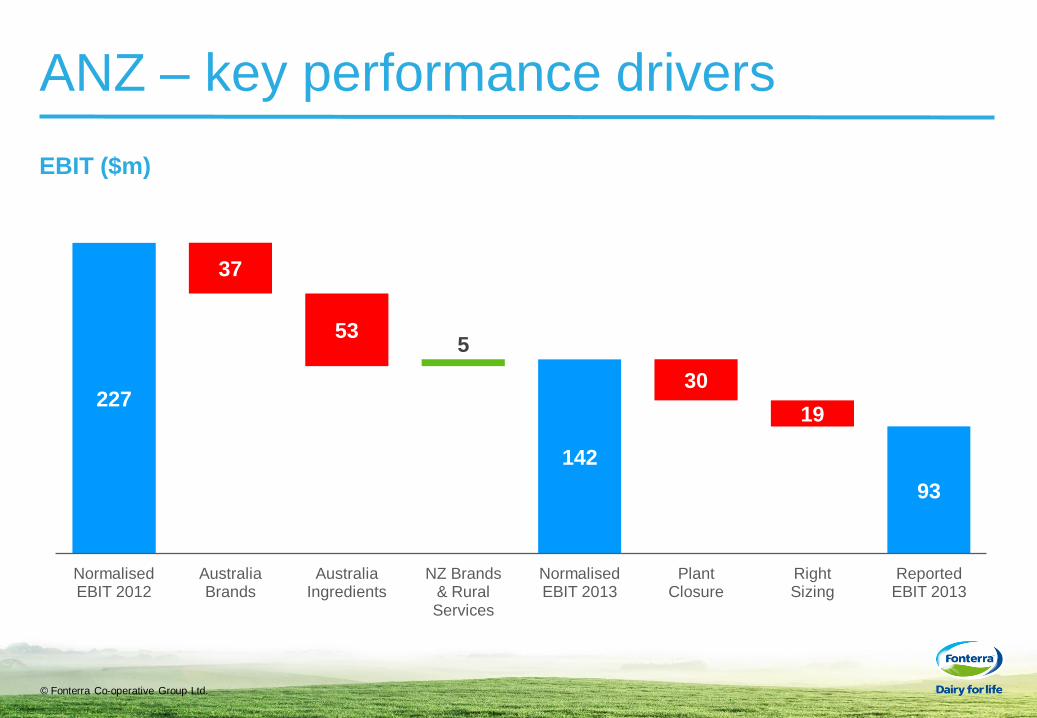
ANZ – key performance drivers
EBIT ($m)
227
37
53 5
142
30
19
93
Normalised EBIT 2012
Australia Brands
Australia Ingredients
NZ Brands & Rural Services
Normalised EBIT 2013
Plant Closure
Right Sizing
Reported EBIT 2013

© Fonterra Co-operative Group Ltd. 14 © Fonterra Co-operative Group Ltd.
Reshaping our Australian business
Tough environment
Retailers
Processors
Suppliers
Strong rivalry
Aggressive
competition for
milk supply
Intense retailer
pressure
1. Streamline brands portfolio
2. Grow everyday nutrition
3. Expand high-value nutritionals
4. Drive foodservice business
5. Reduce cost and complexity
Five key priorities

© Fonterra Co-operative Group Ltd. 15 © Fonterra Co-operative Group Ltd.
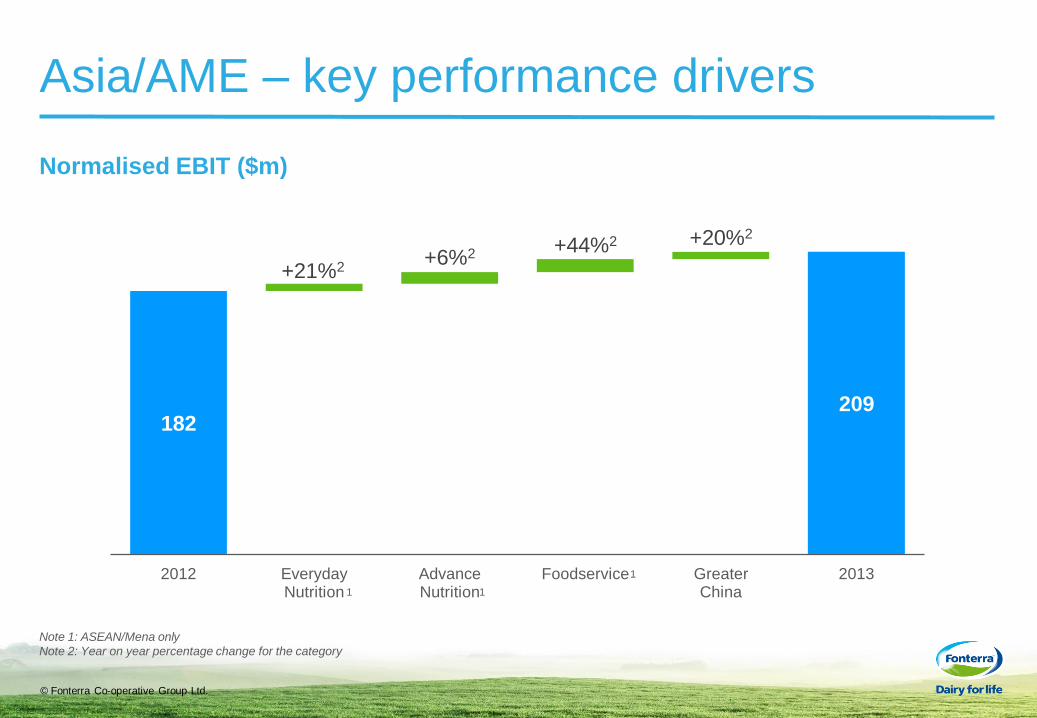
Asia/Africa/Middle East – highlights
Volume
• Growth driven by Greater China,
Indonesia, Malaysia and Vietnam
Value
• Asia/AME now our largest
consumer business
• Up 22% in ASEAN/MENA1
• Up 21% in Greater China1
+16%
+11%
Normalised EBIT ($m)
182 209
2012 2013
Note 1: Normalised EBIT measured by constant currency.
ASEAN/MENA means Fonterra’s business unit that operates in South East Asia, the Middle East and North Africa. There are some countries that fall within the
ASEAN/MENA business unit that are located outside these geographical regions such as Sri Lanka and Mauritius. It is part of the Asia/AME reportable segment.
© Fonterra Co-operative Group Ltd. 16 © Fonterra Co-operative Group Ltd.
Asia/AME – key performance drivers
Normalised EBIT ($m)
182
+21%2 +6%2 +44%2 +20%2
209
2012 Everyday Nutrition
Advance Nutrition
Foodservice Greater China
2013
Note 1: ASEAN/Mena only
Note 2: Year on year percentage change for the category
1 1
1
© Fonterra Co-operative Group Ltd. 17 © Fonterra Co-operative Group Ltd.
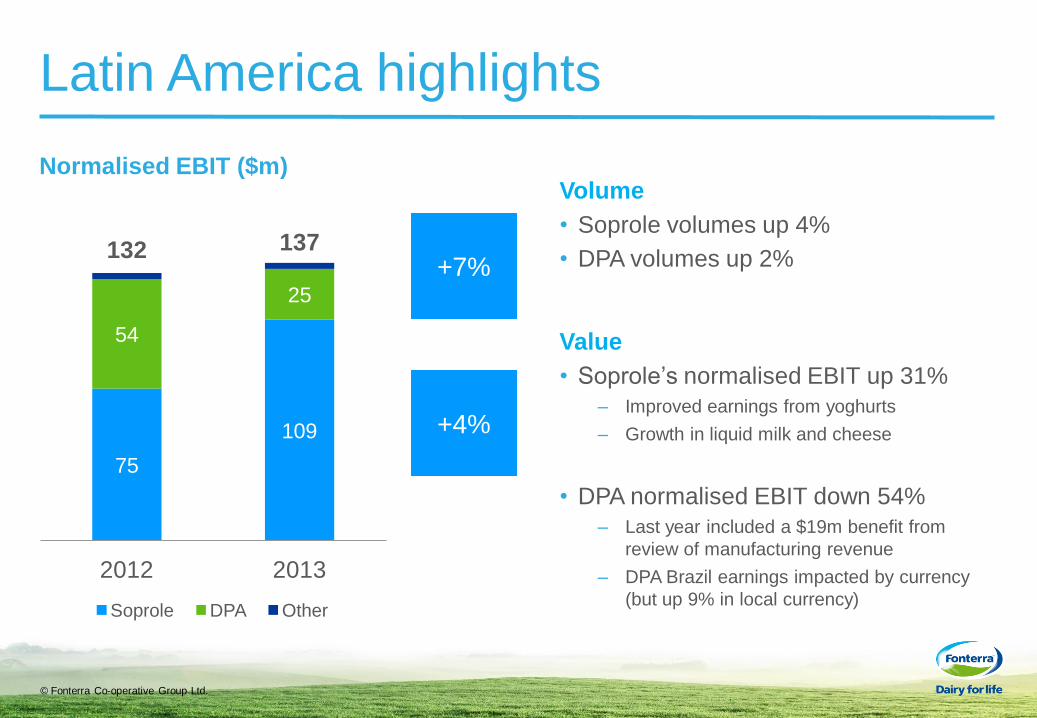
Latin America highlights
Volume
• Soprole volumes up 4%
• DPA volumes up 2%
Value
• Soprole’s normalised EBIT up 31%
– Improved earnings from yoghurts
– Growth in liquid milk and cheese
• DPA normalised EBIT down 54%
– Last year included a $19m benefit from
review of manufacturing revenue
– DPA Brazil earnings impacted by currency
(but up 9% in local currency)
+4%
+7%
Normalised EBIT ($m)
75
109
54
25
132 137
2012 2013
Soprole DPA Other

© Fonterra Co-operative Group Ltd. 18 © Fonterra Co-operative Group Ltd.
Latam – key performance drivers
Normalised EBIT ($m)
132
26 25 9
5
137
2012 Soprole DPA Southern Cone
Other 2013

© Fonterra Co-operative Group Ltd. 19 © Fonterra Co-operative Group Ltd.
Working Capital and Cash Flow
Note 1: excluding supplier payables
Working Capital Days1
Average working capital days improved by 8 days
to 98 days ($400m cash benefit)
105 106
98
2011 2012 2013
Operating & Investing Cash Flow
696
564
129
2011 2012 2013
688
Impact of advance rate change
© Fonterra Co-operative Group Ltd. 20 © Fonterra Co-operative Group Ltd.
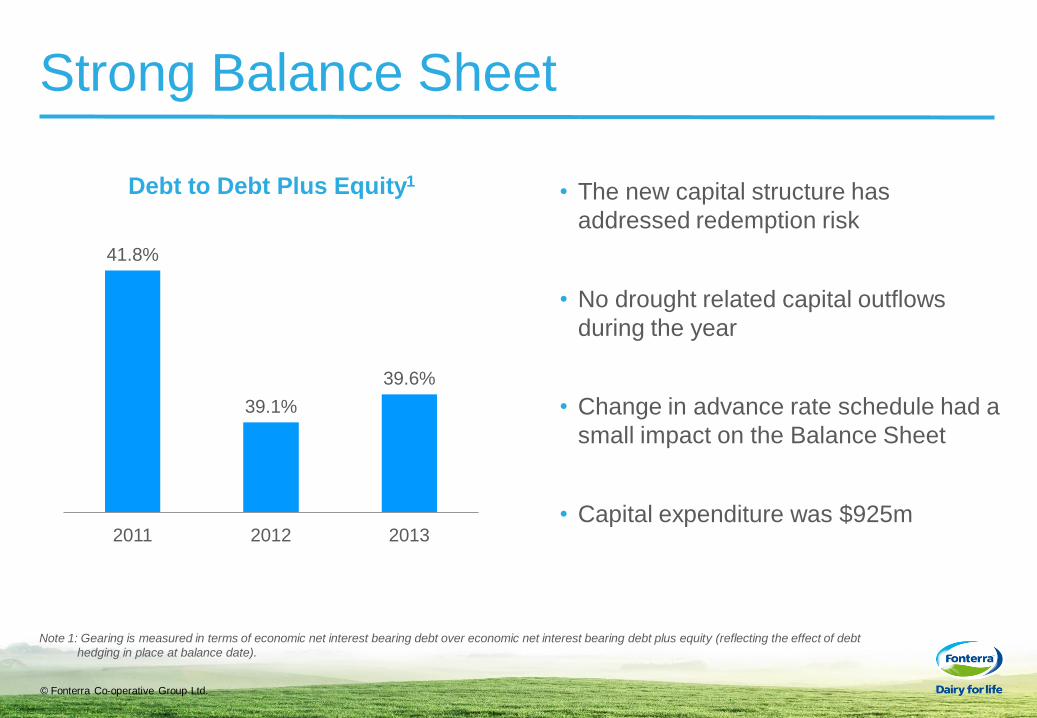
Strong Balance Sheet
Note 1: Gearing is measured in terms of economic net interest bearing debt over economic net interest bearing debt plus equity (reflecting the effect of debt
hedging in place at balance date).
Debt to Debt Plus Equity1
41.8%
39.1%
39.6%
2011 2012 2013
• The new capital structure has
addressed redemption risk
• No drought related capital outflows
during the year
• Change in advance rate schedule had a
small impact on the Balance Sheet
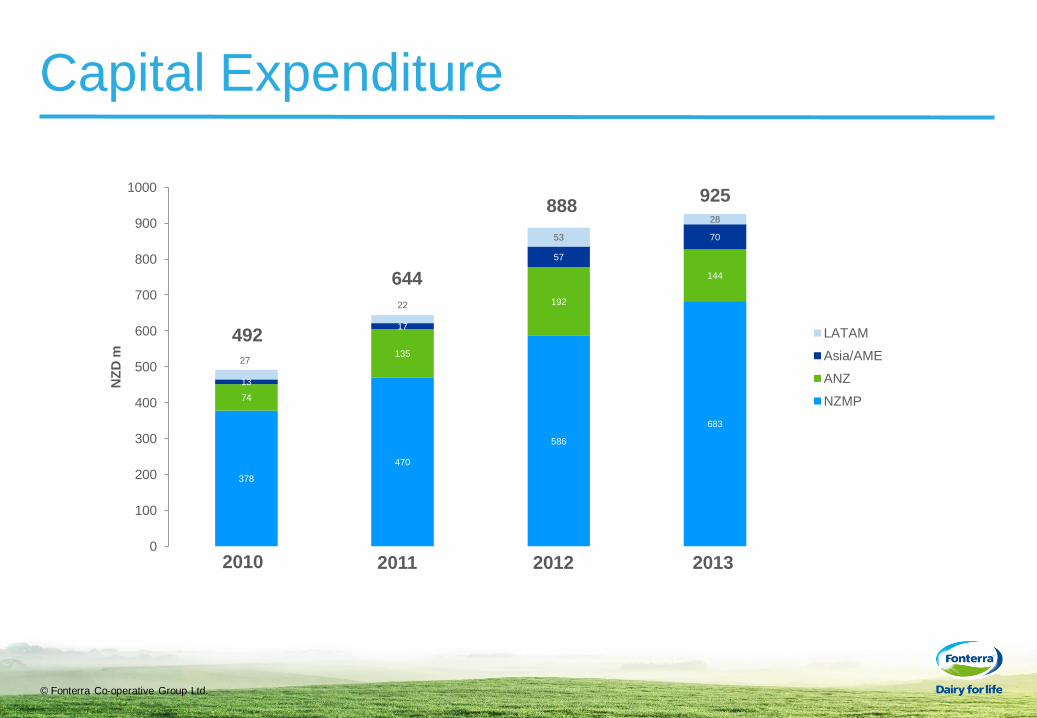
• Capital expenditure was $925m

© Fonterra Co-operative Group Ltd. 21 © Fonterra Co-operative Group Ltd.
Strategy Update & Outlook

© Fonterra Co-operative Group Ltd. 22 © Fonterra Co-operative Group Ltd.
Global trends driving demand for dairy
Continued
rise of
emerging
markets
Commodity
price
volatility
Nutrition for
the young
Nutrition for
the old
Sustainability
Disruption

© Fonterra Co-operative Group Ltd. 23 © Fonterra Co-operative Group Ltd.
Good progress on strategy STRATEGIC PATHS PROGRESS
Selectively
invest in milk pools
Alignment of
business and organisation
6
7
Develop selected leading
position in paediatrics &
maternal
Grow our
position in Anlene
Deliver on
foodservice potential
Build and grow beyond our
current consumer positions
Optimise NZ milk
1
2
3
4
5
EVERYDAY
NUTRITION
OUT-OF-HOME
ENABLERS
ADVANCED
NUTRITION
Darfield investment & Studholme acquisition
Optimise and drive value add products
Strong quality improvement and food safety focus
Reshape Australia brands
Launch of Anchor UHT in China
Asia and China roll-out tracking ahead of plan
$100m investment in UHT plant to remove supply
constraints
Growing Anlene in China and selected growth markets in
South East Asia
Pursue Anmum growth in China and Indonesia
Higher demand from emerging markets for paediatrics
third party manufacturing
Signed agreements to start second farming hub in China
Two farming hubs will produce 300m litres of milk
Support review completed in August
Australia rightsizing
Investing resources in China expansion

© Fonterra Co-operative Group Ltd. 24 © Fonterra Co-operative Group Ltd.
Adding value to our NZ milk pool

© Fonterra Co-operative Group Ltd. 25 © Fonterra Co-operative Group Ltd.
Everyday Nutrition
• Focus: Fewer, bigger brands
• Build from the core: butter and cheese
• Build more FMCG-oriented culture
Global Everyday Nutrition Brand Portfolio
Crafted Quality Natural Taste
Italian Culinary Taste
Enhancement Dairy Expert
Everyday Affordable & Accessible
Local Jewel Emerging Future
Global Power Brand
Global Power Brand Local Jewels

© Fonterra Co-operative Group Ltd. 26 © Fonterra Co-operative Group Ltd.
Foodservice
• Grow our leading positions in key target
markets
• Significant year-on-year growth
• Annual sales now over $1.3bn
• Continue to drive growth through:
– Greater investment in supply capacity
– Distinctive chef-led solution selling model
– Product/technology leadership

© Fonterra Co-operative Group Ltd. 27 © Fonterra Co-operative Group Ltd.
Advanced Nutrition
• Key focus to develop Anmum in selected markets
– Market leader in Malaysia
– Top 3 in Indonesia
– Build on Anmum’s success in Hong Kong and
extend further into China
• Continue to grow Anlene in high calcium category
• Expand Anlene in China and growth regions in
South East Asia

© Fonterra Co-operative Group Ltd. 28 © Fonterra Co-operative Group Ltd.
Strategy shifts portfolio to higher value add
ILLUSTRATIVE ONLY

© Fonterra Co-operative Group Ltd. 29 © Fonterra Co-operative Group Ltd.
Outlook
• 2014 Forecast Cash Payout of $8.62
– Forecast Farmgate Milk Price of $8.30
– Estimated dividend of 32 cps
• Headwinds for Fonterra
– Higher input costs make it harder to drive value growth in brands and foodservice in first half
– Negative impact on product mix margins as milk powder prices significantly outpace cheese and casein prices
– First half 2014 result will be significantly lower than first half 2013
– Prospects for second half look more positive for consumer businesses but remain uncertain for NZ Milk Products
• Estimated dividend of 32 cps unchanged
– Fonterra can draw on its Balance Sheet and Cash Flow strength to support estimated dividend, if required
• Confident in our Volume and Value strategy
– Difficult to predict when extreme price volatility on product mix will reverse, but expectations are that impact is likely to be short-term
– Future prospects for dairy and for Fonterra positive - our growth ambitions remain unchanged
© Fonterra Co-operative Group Ltd. 30 © Fonterra Co-operative Group Ltd.
Supplementary Information

© Fonterra Co-operative Group Ltd. 31 © Fonterra Co-operative Group Ltd.
Annual results summary
Million
Year ended
31 July 2013
Year ended
31 July 2012 Change
Total Sales Volume (million MT)
3.96
3.94
0%
Revenue
18,643
19,796
(6%)
Normalised EBIT (NZD million)
1,002
1,028
3%
Net Profit After Tax (NZD million)
736
624
18%
Earnings per share (cents)
44
41
7%
Dividends per share (cents)
32
32
0%

© Fonterra Co-operative Group Ltd. 32 © Fonterra Co-operative Group Ltd.
Normalisation adjustments
Million
Year ended
31 July 2013
Year ended
31 July
2012
Costs associated with planned closure of
Cororooke site (30) –
Costs associated with the Group’s Strategy Right-
sizing (38) –
Restructuring costs associated with the Group
Strategy Refresh – (30)
Other items 3 (3)
Impairment losses recorded in equity accounted
investees – (8)
Total normalised items (65) (41)

© Fonterra Co-operative Group Ltd. 33 © Fonterra Co-operative Group Ltd.
Reconciliation to Prospective Information
$ Million NZMP ANZ Asia/
AME
Latam Inter-
Segments
TOTAL
Prospective EBIT 517 201 223 125 (12) 1,054
Adjustments:
Changes in Org structure
17
12
(2)
6
1
-
Prospective EBIT –
adjusted
500 213 221 131 (11) 1,054
Prospective normalisation
adjustment
- 25 - - - 25
Prospective normalised
EBIT – adjusted
500 238 221 131 (11) 1,079
Actual EBIT 480 93 207 137 20 937
Actual normalisation
adjustments
14 49 2 - - 65
Actual normalised EBIT 494 142 209 137 20 1,002

© Fonterra Co-operative Group Ltd. 34 © Fonterra Co-operative Group Ltd.
NZMP contribution margin
$million Year ended
31 July 2013
Year ended
31 July 2012
Sales Volume (000MT) 2,824 2,790
Gross Margin 1,251 1,285
Selling, marketing and distribution expenses (277) (269)
Contribution margin 974 1,016
Contribution margin per MT ($) 345 364
Growth (5%)

© Fonterra Co-operative Group Ltd. 35 © Fonterra Co-operative Group Ltd.
Whole milk powder and cheese prices
2,500
2,800
3,100
3,400
3,700
4,000
4,300
4,600
4,900
5,200
Aug-11 Oct-11 Dec-11 Feb-12 Apr-12 Jun-12 Aug-12 Oct-12 Dec-12 Feb-13 Apr-13 Jun-13 Jul-13
Weighted Average USD GDT Cheese Prices vs WMP Prices
Cheese
WMP H1 2013
H2 2013

© Fonterra Co-operative Group Ltd. 36 © Fonterra Co-operative Group Ltd.
NZ Milk Products Sales Volume by Product
1,031 1030
489 464
469 477
309 301
72 66
454 452
2013 2012
Whole Milk Powder Skim Milk Powder Cream Cheese Casein Other
2,790 MT
2,824 MT

© Fonterra Co-operative Group Ltd. 37 © Fonterra Co-operative Group Ltd.
Balance sheet strength
Credit
Rating
S&P A+
(stable outlook)
Fitch AA-
(stable outlook)
Weighted
Average
Term to
Maturity
As at 31 July
2013
(Drawn debt)
3.41 years
Strong Fundamentals Diversified Funding Sources
Offshore DCM
30%
NZ DCM
20%
Bank Facilities
50%
Strong Liquidity
Undrawn Facilities
$3,289m
82%
Drawn Facilities
$715m
18%
0
500
1,000
1,500
2,000
2,500
3,000
3,500
Bank Facilities - Total Limits
Debt Capital Markets
NZ
D m
illio
ns
Debt Maturity Profile (Year Ending July)
© Fonterra Co-operative Group Ltd. 38 © Fonterra Co-operative Group Ltd.
Capital Expenditure
378
470
586
683
74
135
192
144
13
17
57
70
27
22
53
28
0
100
200
300
400
500
600
700
800
900
1000
NZ
D m
LATAM
Asia/AME
ANZ
NZMP
2012 2013 2011 2010
925 888
644
492
© Fonterra Co-operative Group Ltd. 39 © Fonterra Co-operative Group Ltd.
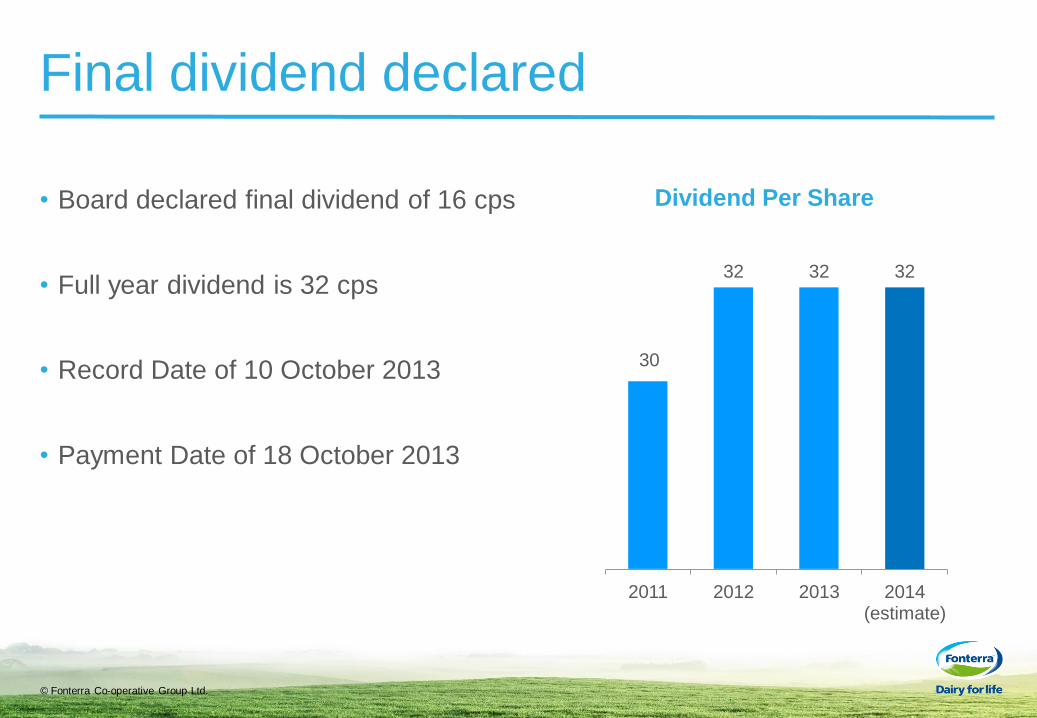
Final dividend declared
• Board declared final dividend of 16 cps
• Full year dividend is 32 cps
• Record Date of 10 October 2013
• Payment Date of 18 October 2013
30
32 32 32
2011 2012 2013 2014 (estimate)
Dividend Per Share