following logging of high elevation forest stands in sierra ... - fs.fed.us · vi acknowledgement...
TRANSCRIPT
Summer Evapotranspiration Trends as Related to Time Following Logging of High Elevation Forest Stands
in Sierra Nevada By
Robert Ruhl Ziemer
B.S. (University of California) 1959
THESIS
Submitted in partial satisfaction of the requirements for the degree of
MASTER OF SCIENCE in
Forestry
in the
GRADUATE DIVISION
of the
UNIVERSITY OF CALIFORNIA Approved:
Paul J. Zinke Rudy F. Grah Peter W. Birkeland
Committee in Charge Deposited in the University Library 1963 Date Librarian

ii TABLE OF CONTENTS
Page INTRODUCTION . . . . . . . . . . . . . . . . . . . 1 DESCRIPTION OF STUDY . . . . . . . . . . . . . . . 4 Location . . . . . . . . . . . . . . . . . . 4 Soils . . . . . . . . . . . . . . . . . . . . 4 Precipitation . . . . . . . . . . . . . . . . 6 Soil Moisture Sampling Sites . . . . . . . . . 6 Selection Criteria . . . . . . . . . . . . . . 6 Sampling Design . . . . . . . . . . . . . . . 6 Soil Moisture Measurement . . . . . . . . . . . 11 Neutron Soil Moisture Determination . . . . . 11 Calculation of Soil Moisture . . . . . . . . . 14 Correction for Summer Precipitation . . . . . 17 Weighting of Area Sampled . . . . . . . . . . 18 Correction to Comparable Periods of Measurement 19 Comparability of 1960 and 1961 Depletion . . 21 Seasons RESULTS AND DISCUSSION . . . . . . . . . . . . . . 24 Seasonal Trend of Soil Moisture Depletion . . . . 24 Effect of Field Capacity . . . . . . . . . . . 32 Effect of Soil Depth . . . . . . . . . . . . . 34 Effect of Ground Cover . . . . . . . . . . . . 35 Seasonal Soil Moisture Depletion in Logged . . 36 Openings Maximum Soil Moisture Depletion . . . . . . . . 38 Effect of Time Since Logging . . . . . . . . . 38 Effect of Canopy Cover . . . . . . . . . . . . 42 Soil Moisture Savings . . . . . . . . . . . . . 42 Seasonal Trends . . . . . . . . . . . . . . . 46 At Maximum Depletion . . . . . . . . . . . . . 46 SUMMARY AND CONCLUSIONS . . . . . . . . . . . . . . . 49 LITERATURE CITED . . . . . . . . . . . . . . . . . . 57 APPENDIX . . . . . . . . . . . . . . . . . . . . . . 57
iii LIST OF FIGURES
Figure Page
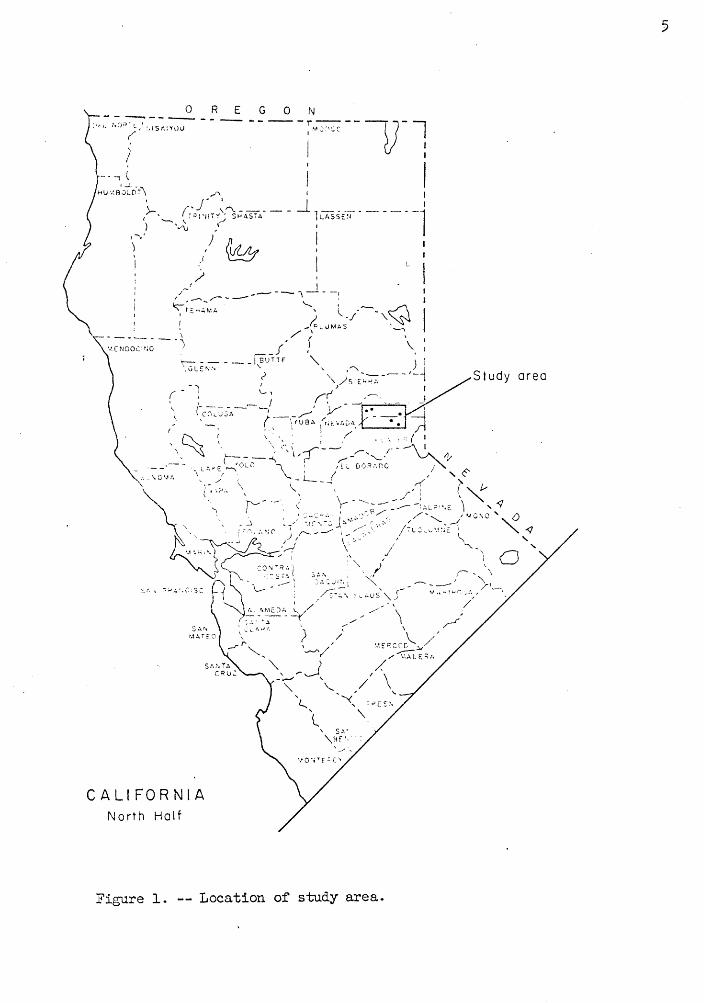
1. Location of study area. 5 2. Location of soil moisture sampling points within a typical 10 forest opening and a hypothetical profile of soil moisture content within that opening at maximum depletion. 3. Correction of observed soil moisture in percent by volume 15 for neutron loss to the atmosphere at the 6-inch soil depth. 4. Accumulation of relative day length times 2 p.m. vapor 22 pressure deficit index (�Dr x VPD 2 p.m.) from June 1 for 1960 and 1961. 5. Soil moisture in percent by volume at 0- to 42-inch soil 25 depth in plot L-1a logged in 1959, for various dates through the summer moisture depletion season and into the fall moisture recharge season, 1960 and 1961. 6. Plot L-1a, logged 1959. 26 7. Plot L-1b, logged 1959. 28 8. Plot L-3a, logged 1950. 29 9. Plot L-4a, logged 1946. 29 10. Plot L-5a, logged 1923, 1949 and 1955. Note snowmelt 30 pattern in southern edge of opening. Photo taken June 7, 1961. 11. Soil moisture depletion related to day length times vapor 33 pressure deficit from the forested portion of plots of various field capacities In inches per 4-foot soil depth, June to September, 1960 and 1961. 12. Soil moisture depletion in logged openings of various ages 37 within a field capacity range of 15.9 to 17.8 inches per 4-foot soil. 13. Soil moisture in percent by volume at 0- to 42-inch soil 40 depth at maximum moisture depletion for logged openings of various ages. 14. Seasonal pattern of soil moisture savings (moisture loss 48 from open minus moisture loss from forest), by Individual plots, logged in 1959, 1955, 1950, and 1948. 15. Effect of age of logged openings upon water savings at 48 maximum soil moisture depletion for two field capacity ranges.

iv
LIST OF TABLES Table Page 1.Characteristics of soil moisture sampling sites. 7 2.Plot soil moisture adjusted for 1 H opening size, by 44 year of logging, and time, 1960 - 1961. 3.Soil moisture data by plot number, sampling point 58 and soil depth.

v
ABSTRACT
The quantity of summer soil moisture loss from logged forest openings was related to the length of time since the creation of the opening in a study made in the subalpine forest zone of the Sierra Nevada west-side near the Central Sierra Snow Laboratory, California, within the elevational range of 6,000 to 7,000 feet. Soil moisture depletion was measured in logged forest openings which were created in 1959, 1955, 1950, and 1948, and in the forest surrounding these openings. At the period of maximum soil moisture depletion, openings 1 year old were found to have 6.9 inches more soil moisture per 4-foot soil than did the surrounding forest which is an expression of the quantity of moisture saved as a result of the logging operation. In openings 5 years old the savings has decreased to 2.9 inches, after 10 years to 1.2 inches and after 12 years to 0.7 inches. A projection of the regression in-dicates that the moisture savings at maximum depletion will reach zero 16 years after cutting. Soil moisture depletion is traced through two summer depletion seasons and into the fall moisture recharge periods. The effect of soil field capacity soil depth, ground cover, and summer precipitation upon soil moisture depletion trends also is discussed.

vi
ACKNOWLEDGEMENT
It is a pleasure to acknowledge my indebtedness to the many people who assisted in the field work and preparation of this thesis. I would first like to express thanks to Walter S. Hopkins and Henry W. Anderson for technical guidance throughout this project; to Donald Biagi and Herbert D. Thornton for assistance in the initial study installation; to Robert D. Briggs and Franklin R. Adams for assistance in data collection; and to Lucille G. Richards and Minnie E. Groshong for statistical assistance.
I would like to express my sincere gratitude to Henry W. Anderson, Leonard DeBano, Robert A, Muller, and Vincent Y. Dong for their critical review of the manuscript.
Finally, I would like to extend my appreciation to Jean Rumley, Adrienne Giles and Eleanor Johansen for typing; and to Audrey E. Kursinski for drafting the illustrations.

“The annual supply of rainfall . . . was received by the country, in all its abundance, into her bosom where she stored it in her impervious potter's earth and so was able to discharge the drainage of the heights into the hollows in the form of springs and rivers with an abundant volume and a wide territorial distribution.” PLATO, "Critias"

INTRODUCTION
The demand for fresh water in the United States will reach 600 billion
gallons per day by 1980, according to the U.S. Public Health Service (1958).
This amount equals the present fresh water supply. When the demand exceeds
the supply, as it has in many parts of California, efforts must be made to
satisfy that requirement, if the economic growth of an area is to continue.
Therefore it would be desirable if, in our timber management practices, we
could increase the quantity and the quality of the water flowing from
mountain watersheds as we commercially harvest the forest, and assure
delivery of this water to the consumer at the desired time. We need to
understand the basic principles of water disposition within a watershed
before we can effectively manage timber stands to augment or be compatible
with the existing water values of the area. Such information is the over-
all goal of the Cooperative Snow Management Research Program 1/ being con-
ducted by the Pacific Southwest Forest and Range Experiment Station, U. S.
Forest Service, in cooperation with the State of California Department of
Water Resources. This study is a portion of that program. 2/
Throughout history man has considered a forest and forest conser-
vation as synonymous with sufficient quantity and good quality supplies.
As populations increased and requirements for water became more critical,
man, in seeking methods to augment existing water supplies looked to the
forested areas for an answer.
1/ Anderson, H. W. Proposed program for cooperative snow manage- ment research. 1956. (Unpublished report on file at Pacific SW. Forest and Range Expt. Sta., U. S. Forest Serv., Berkeley, Calif.)
2/ Ziemer, R. R. Summer water loss as related to time following logging and associated vegetation recovery. 1960. (Unpublished report on file at Pacific SW. Forest and Range Expt. Sta., U. S. Forest Serv., Berkeley, Calif.)
2
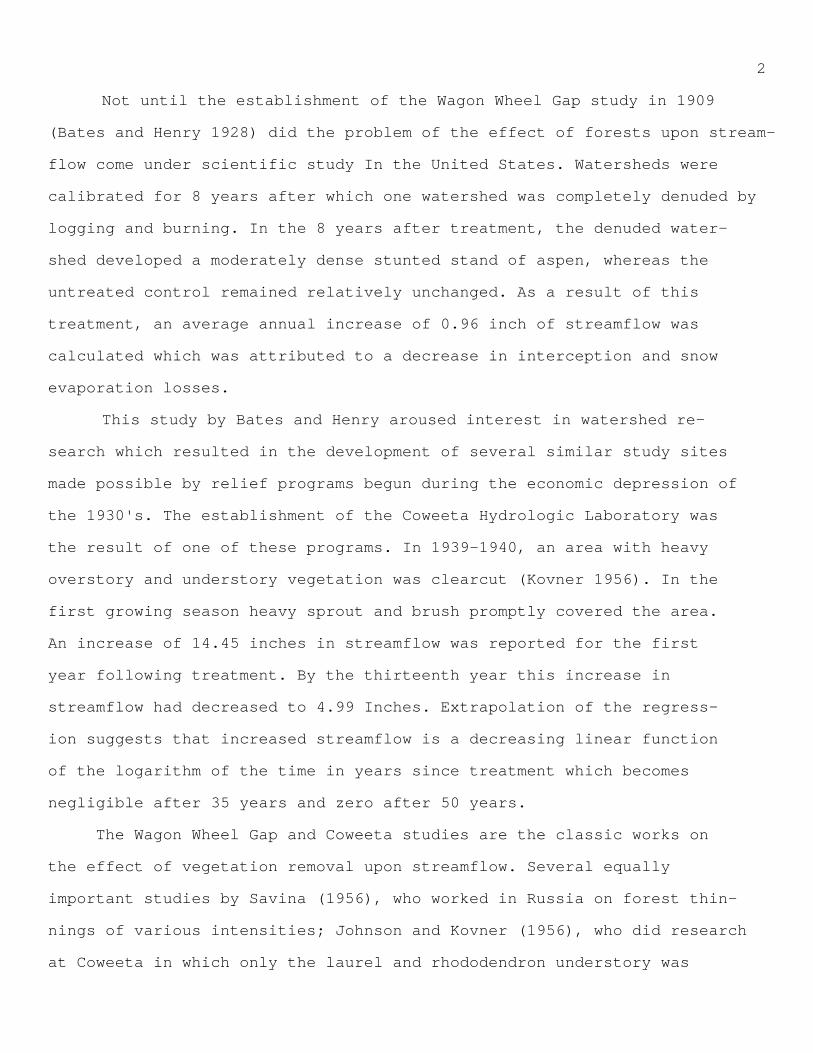
Not until the establishment of the Wagon Wheel Gap study in 1909
(Bates and Henry 1928) did the problem of the effect of forests upon stream-
flow come under scientific study In the United States. Watersheds were
calibrated for 8 years after which one watershed was completely denuded by
logging and burning. In the 8 years after treatment, the denuded water-
shed developed a moderately dense stunted stand of aspen, whereas the
untreated control remained relatively unchanged. As a result of this
treatment, an average annual increase of 0.96 inch of streamflow was
calculated which was attributed to a decrease in interception and snow
evaporation losses.
This study by Bates and Henry aroused interest in watershed re-
search which resulted in the development of several similar study sites
made possible by relief programs begun during the economic depression of
the 1930's. The establishment of the Coweeta Hydrologic Laboratory was
the result of one of these programs. In 1939-1940, an area with heavy
overstory and understory vegetation was clearcut (Kovner 1956). In the
first growing season heavy sprout and brush promptly covered the area.
An increase of 14.45 inches in streamflow was reported for the first
year following treatment. By the thirteenth year this increase in
streamflow had decreased to 4.99 Inches. Extrapolation of the regress-
ion suggests that increased streamflow is a decreasing linear function
of the logarithm of the time in years since treatment which becomes
negligible after 35 years and zero after 50 years.
The Wagon Wheel Gap and Coweeta studies are the classic works on
the effect of vegetation removal upon streamflow. Several equally
important studies by Savina (1956), who worked in Russia on forest thin-
nings of various intensities; Johnson and Kovner (1956), who did research
at Coweeta in which only the laurel and rhododendron understory was

3
removed; Kihlberg (1958), who worked on clearcut watersheds in Sweden; and
Johnson and Meginnis (1960), who reported on streamflow from watersheds in
Ohio after pine plantations were established, indicate an initial increase
in streamflow immediately after vegetation removal with streamflow subse-
quently decreasing as the vegetation becomes established.
If we are to manage our forests to increase water values, we must
understand the duration of diminishing water yields with time after treat-
ment so that we can effectively and rationally remove vegetation or
harvest timber at a period which will maximize the water value to be
derived.
The objective of this study was to relate soil moisture depletion
resulting from evapotranspiration occurring during the summer drying
period to time after logging. Soil moisture depletion was measured in
forest openings created by logging in 1959, 1955, 1950, and 1948, and in
the forest surrounding these openings. Soil moisture was determined at
monthly intervals through the 1960 and 1961 summer drying and fall re-
charge seasons. Depletion trends were related to the length of time
after the creation of the opening and the effect of soil field capacity,
soil depth, ground cover, and summer precipitation upon these trends.
4
DESCRIPTION OF THE STUDY
Location
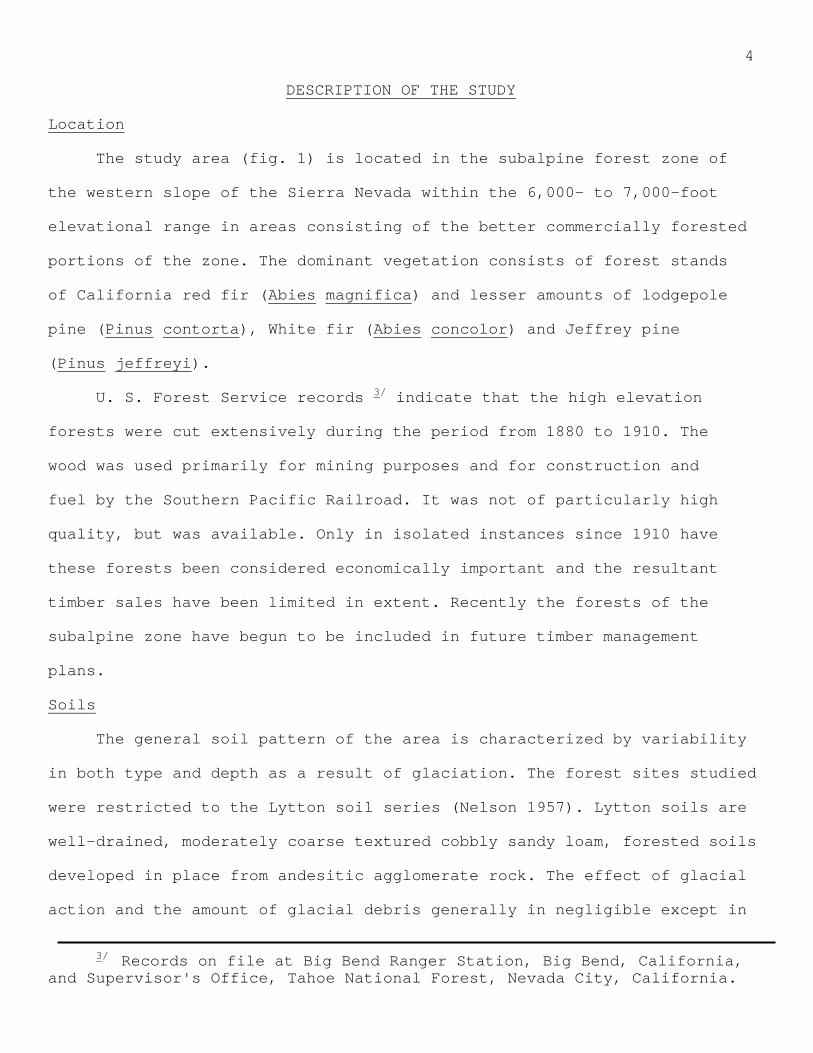
The study area (fig. 1) is located in the subalpine forest zone of
the western slope of the Sierra Nevada within the 6,000- to 7,000-foot
elevational range in areas consisting of the better commercially forested
portions of the zone. The dominant vegetation consists of forest stands
of California red fir (Abies magnifica) and lesser amounts of lodgepole
pine (Pinus contorta), White fir (Abies concolor) and Jeffrey pine
(Pinus jeffreyi).
U. S. Forest Service records 3/ indicate that the high elevation
forests were cut extensively during the period from 1880 to 1910. The
wood was used primarily for mining purposes and for construction and
fuel by the Southern Pacific Railroad. It was not of particularly high
quality, but was available. Only in isolated instances since 1910 have
these forests been considered economically important and the resultant
timber sales have been limited in extent. Recently the forests of the
subalpine zone have begun to be included in future timber management
plans.
Soils
The general soil pattern of the area is characterized by variability
in both type and depth as a result of glaciation. The forest sites studied
were restricted to the Lytton soil series (Nelson 1957). Lytton soils are
well-drained, moderately coarse textured cobbly sandy loam, forested soils
developed in place from andesitic agglomerate rock. The effect of glacial
action and the amount of glacial debris generally in negligible except in
3/ Records on file at Big Bend Ranger Station, Big Bend, California, and Supervisor's Office, Tahoe National Forest, Nevada City, California.

6
localized areas where the soil is c1assified by parent material phases.
The parent material phases comprise areas of Litton soils with numerous
morainal granitic erratics, basaltic rocks and rhyolitic rocks making up
a significant part of the parent rock. For purposes of this study the
sites have been grouped by field capacity characteristics for comparability
analysis.
Precipitation
The long term average annual precipitation for the area is 51 inches.
Of this amount 42 inches of water is present in the maximum snowpack which
occurs on or about April 1 (California Department of Water Resources 1962;
U.S. Army 1956). The summer soil moisture depletion period extends 4 to 5
months, from June into October, with a total average precipitation of about
3 inches. The summer precipitation generally occurs as light showers, but
with an occasional high intensity convection storm of short duration.
Consequently, this climate is ideal for a study of summer water loss by
measuring soil moisture depletion.
SOIL MOISTURE SAMPLING SITES
Selection Criteria
The location and characteristics of the individual sites may be
found in figure 1 and table 1. The criteria for selection of a soil
moisture sampling site require the site to be an opening created in an
originally forested stand which was comparable to the surrounding forest
before logging. The sites were located on well drained soils with no water
table in evidence. Generally, a stand of trees with little or no evidence
of logging and with a definite boundary surrounds the opening.
Sampling Design
A transect was placed from the forest into the opening and then
into the forest on the other side of the opening. In the case where no
definite forest boundary exists on the opposite side of the opening, the
transect extends from the forest into the approximate center of the
7
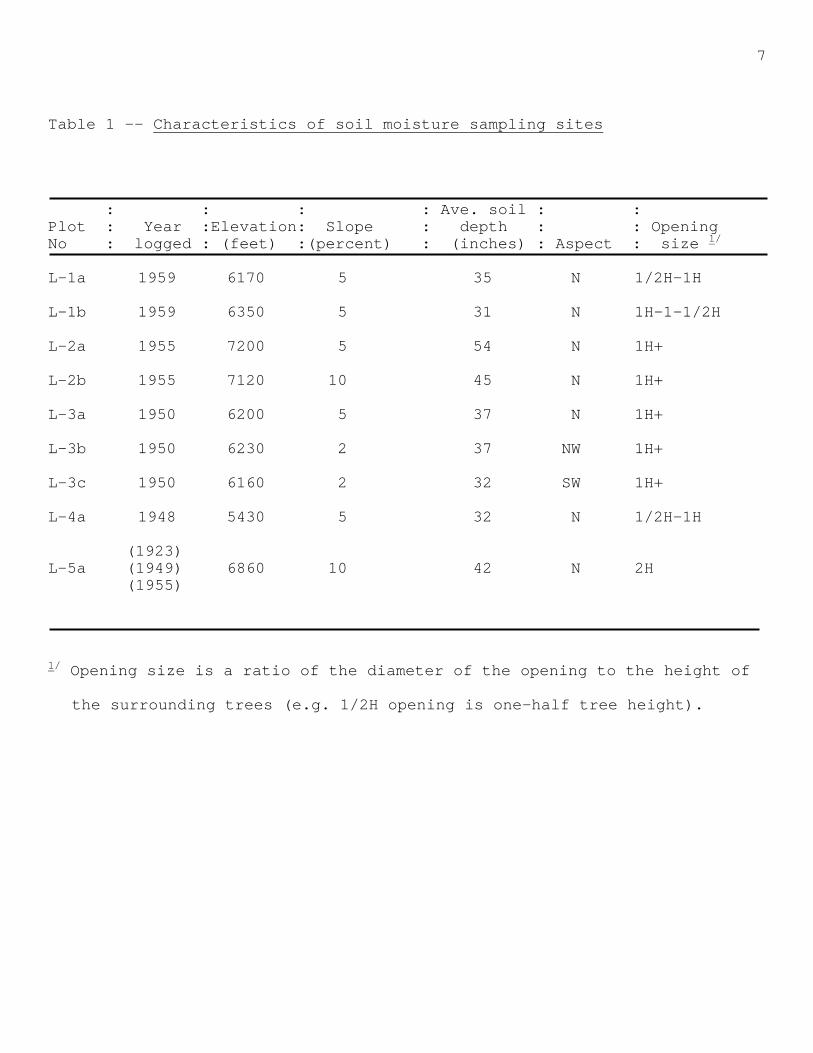
Table 1 -- Characteristics of soil moisture sampling sites
: : : : Ave. soil : : Plot : Year :Elevation: Slope : depth : : Opening No : logged : (feet) :(percent) : (inches) : Aspect : size 1/ L-1a 1959 6170 5 35 N 1/2H-1H
L-1b 1959 6350 5 31 N 1H-1-1/2H
L-2a 1955 7200 5 54 N 1H+
L-2b 1955 7120 10 45 N 1H+
L-3a 1950 6200 5 37 N 1H+
L-3b 1950 6230 2 37 NW 1H+
L-3c 1950 6160 2 32 SW 1H+
L-4a 1948 5430 5 32 N 1/2H-1H (1923) L-5a (1949) 6860 10 42 N 2H (1955)
1/ Opening size is a ratio of the diameter of the opening to the height of
the surrounding trees (e.g. 1/2H opening is one-half tree height).
8
opening. Spacing of sampling points along the transect is in terms of pro-
portions of the average height of the dominant and codominant trees
surrounding the plot, based on the assumption that the effect of trees upon
soil moisture loss is some function of the height of trees. The height of
trees and the angle of incidence of solar radiation determines the distance
shade extends into an opening and hence is related to the evaporation rate
at various distances into the opening.
Moulopoulos (1956) correlated seedling regeneration in openings of
various sizes and shapes with the heights of trees and the incidence of
solar radiation. He arrived at a general formula for determining regener-
ation opportunity for any opening and derived an "ideal" opening size and
shape by computing the amount of area within hypothetical openings being
shaded at selected times during a day, for selected dates during the
summer, at latitudes ranging from 35o to 41o N, for all exposures, and
for slopes ranging from level to 100 percent. Moulopoulos measured the
distribution of regeneration within natural openings and found that seed-
lings were concentrated in the southern or shaded portions of the opening.
This measurement was highly correlated with the pattern of available soil
moisture.
Anderson (1956) found that the height of trees determined the
"effective opening size" in snow accumulation and melt relationships. He
also found that the quantity of shade within an opening was a function of
slope, aspect, tree, height, and the incidence of solar radiation. The
combination of these factors determined the snow ablation rate.
Soil moisture sampling points proceed from the edge of the opening,
as represented by a vertical projection of the canopy, at distances increas-
ing logarithmically away from the forest and into the opening. That is,
points located at 0-H (the edge of the canopy), 1/8 H, 1/4 H, 1/2 H, 1 H,

9
etc., into the opening where H equals the average height of the dominant
and codominant trees. Two points were located within the forest at
distances of 1/4 H and 1/2 H. Therefore, an opening one tree height in
diameter was sampled at 11 points, beginning within one portion of the
forest at 1/2 H and 1/4 H in the forest; 0-H at the south canopy border;
1/8 H, 1/4 H, 1/2 H, 1/4 H, and 1/8 H in the opening; 0-H at the north
canopy border; and 1/4 H and 1/2 H in the forest. (fig. 2). The
sampling point 0-H was located at random along the south forest border
with the transect oriented perpendicular, north-south, to the border.
A transect based upon a logarithmic progression was used on the hypothesis
that the gradient of the soil moisture loss curve is greatest near the
canopy edge and will diminish with distance away from and into the forest.
(fig. 2).
Several authors support this hypothesis. Wyssotzky (1932) re-
ported on a study conducted in 1899, which used graphs of soil moisture
conditions extending from a stand of mature hardwoods into an adjacent
cutover area. In September 1899 the soil moisture content under the
forest was 10 to 15 percent less than that in the cutover, after
correcting for precipitation, with the moisture content gradient being
greatest near the tree canopy boundary.
Aaltonen (1926) found that in an opening about 20 years old, the
seedlings in the center of the opening were the tallest and became
relatively shorter as the edge of the mother stand was approached. This
he attributed to the lower competition for water in the opening.
Toomey and Kienholz (1931) observed that during the driest periods
from two to nine times as much moisture was available to plants in
trenched plots as in untrenched plots. This difference appeared to be
wholly due to the elimination of root competition.

11
Lunt (1934) found in practically all cases that the lowest soil
moisture content was found immediately beneath the tree crown, close
to the base of the trees. Moisture content increased ns distance from
the trees increased.
Kalashnikov (1955) working in an area having little snow observed
that forest strips caused considerable increase in soil moisture
content on fallow ground, in the order of 16 - 17 mm. in the top 2
meters of soil, which he attributed to a decrease in evaporation.
Coutts (1958) indicated soil moisture content under the canopy is
lower than that in the ride.
Giulimondi (1960) designed a study on the effects of Eucalyptus
shelterbelts, upon soil moisture in adjacent cultivated soils in which
he measured soil moisture at distances of 3, 5, 9, 17, and 25 meters
from the shelterbelt. The moisture lost from the soil at the 3-meter
sampling point was nearly twice that of the 5-meter sample, 3 times
that of the 9-meter sample, and 13 times that of the 17-meter and the
25-meter samples.
Douglass (1960) worked in a thinned loblolly pine plantation with
the remaining trees spaced 20 feet apart. He found that the moisture
content increased with distance from the tree and became greatest
midway between the trees. The differences in moisture content between
trees and under trees averaged 3 inches the first year and 2 inches in
the second year. He attributed this decrease to possible root
extension into the cleared area.
SOIL MOISTURE MEASUREMENT
Neutron Soil Moisture Determination
Soil moisture determination was made with the use of a Nuclear-
Chicago P19 neutron soil moisture probe and a model 2800 portable
12
scaler. Neutron scattering is becoming a widely acceptable method of
determining the soil moisture regime. The theory and methodology of
neutron scattering under a wide diversity of soil, vegetation, and
moisture conditions have been described by many workers.4/
The P-19 probe contains a 4- to 5- millicurie, radium-beryllium
source which emits approximately 6 x 10⁴ fast neutrons per second with
gamma rays (Nuclear-Chicago Corp., n.d.). When a fast neutron contacts
hydrogen atoms it becomes a slow neutron. The number of returning slow
neutrons is detected by a sensing tube within the probe. The chemical
content of inorganic soils is such that the primary hydrogen present
is in the soil moisture. The number of slow neutrons detected per unit
time can be related to the quantity or moisture in the soil in percent
by volume, because the rate of emitting fast neutrons is known. A
single calibration of the probe would apply to a wide range of
inorganic soils. Soils with high organic content would require a
calibration related to the content of organic matter. The sphere of
influence of the probe, or the effective volume of soil in which the
moisture measurement is made, is a variable which is inversely related
to the moisture content of the soil and can be computed by the
formula:
3 100 percent . Diameter (inches) = 12
percent H
2O (by volume) in soil
(Nuclear-Chicago Corp., n.d.).
Under the soil moisture conditions of this study, which range
from 50 percent by volume to 10 percent by volume, the diameter of the
sphere of influence of the probe would range from 15 to 26 inches,
4/ Burrows and Kirkham 1958; Davidson et al. 1958; Gardner and
Kirkham 1952; Goldberg, et al. 1955; Letey et al. 1961; Merriam 1959;
Mortier and de Boodt 1956; Preobrazhenskaya 1959; Van Bavel 1958; Van
Bavel et al. 1956.

13
respectively. Carlton (1957) indicates that moisture contents from a
single sample may be determined with an average accuracy of ± 1 pound
per cubic foot of soil or about ± 1.6 Pv (percent volume). For
repeated measurements, the relative accuracy increases to ± 0.4 to ±0.8
Pv, or 0.05 to 0.10 inches of water per cubic foot of soil in a
2-minute counting period (Merriam 1960).
To measure soil moisture we lowered the P-19 probe into an
aluminum access tube which had previously been placed in holes augured
at the desired sampling locations. The augured access holes were of
about 1-inch larger diameter than the aluminum access tube. The access
tube was then installed and the soil was back-filled around the tube in
the sequence it was removed and tamped to the approximate density of
the surrounding soil. The volume of the soil disturbed in relation to
the sphere of influence of the probe is quite small, hence the effect
of this disturbance upon the measured soil moisture would be
negligible. Hanks and Bowers (1960) found that the access tube had a
slight effect upon soil temperature adjacent to the tube, but no
measurable influence on soil moisture content. The access holes were
augured to bedrock or as deep as was possible after several attempts in
the stony soils encountered. In some cases it was probably not possible
to penetrate the rocky soil to actual bedrock.
Soil moisture measurements were made at depths of 6, 18 and 30
inches and at successive 1-foot intervals to bedrock. Following periods
of summer and fall precipitation measurements at the 3- and 9-inch
levels were also taken. Since the radius of the sphere of influence of
the probe ranges from 7 to 13 inches, depending upon moisture content
of the soil, a correction to the observed soil moisture reading at the
more shallow depths becomes necessary because of neutrons being lost to
14
the atmosphere when the calculated moisture content is less than the
actual moisture content. The magnitude of this correction has been a
matter of conjecture for several years. However, a correction based upon
relationships established by Anderson 5/ appears to be a more realistic
correction for the conditions of this study (fig. 3). The correction is
actually less important than one might anticipate in the range of soil
moisture of 20 to 50 Pv if the difference between samples from one
measuring period to another at the same site is used. For example, if
the soil moisture, corrected for shallow depth, varies from 44 Pv at one
measurement to 34.5 Pv a month later, for a loss of 9.5 Pv, the
uncorrected moisture content for the same measurement would be 40 Pv at
the first measurement and 30 Pv at the second for a loss of 10.0 Pv. The
error in the example would be 0.5 Pv or 0.06 inches of water in the top
foot of soil. If plots of equal moisture content were to be compared
there would be no error in the comparison with or without correction.
There would, however, be an error in the actual amount of water
contained in the soil without a correction, but in many instances we are
interested in simply comparing two plots or two measurements rather them
having a requirement to determine the precise account of water in the
profile.
Calculation of Soil Moisture
Soil moisture measurements for 1961 began early in June when the
soil was at field capacity. Measurements were taken at about monthly
intervals until late September when fall rains became frequent and soil
moisture recharge was initiated. Soil moisture measurement for 1960
5/ Anderson, H. W. Soil moisture probe. 1961. (unpublished report
on file at Pacific SW. Forest and Range Expt. Sta., U. S. Forest Serv., Berkeley, Calif.)


16
began in July, was taken at monthly intervals and terminated in
October. The field capacity measurement for 1961 was used as field
capacity for both seasons. Depletion of moisture below field capacity
for 1960 began in late May after a rain and snow storm of
approximately 2 inches of precipitation which was the culmination of
the spring storms for the year. A comparable storm from May 30 to
June 1 terminated the spring storms in 1961.
The amount of soil moisture present at each sampling point at
the measuring period was determined by taking the mean of the percent
volume moisture content at the 6-, 18-, 30-, and 42- inch levels,
which corresponds to a central measurement of the 1-, 2-, 3-, and
4-foot depths, and multiplying the mean by 46 inches, to obtain the
number of inches of water in a 4-foot soil. In cases when the soil at
a point was not 4 feet deep the moisture content at the deepest point
attained was lineally projected to give an estimate of the lower
depths. Since we are interested in the relationship of the change in
moisture content of the soil over the summer period, rather than the
absolute moisture value at any one time, this action is justifiable.
Without the projection to lower depths the point would be biased by
the upper levels which dry at a more rapid rate due to evaporation.
Light summer precipitation also is usually wholly confined to the
upper soil layers. Knoerr 6/ found that the wetting from summer
precipitation on natural sites in the Sierra Nevada was confined to
the surface foot of soil and no increase in soil moisture occurred
below 2 feet. Summer precipitation was also found to have little
influence upon the general rate of soil
6/ Knoerr, K. R. Exponential depletion of soil moisture by
evapotranspiration at forest sites in the Sierra Nevada, as related to available soil moisture and vapor pressure deficit. 1960. (Unpublished dissertation on file Yale Univ. Libr., New Haven, Conn.)

17
moisture depletion in that the water is rapidly used by an increase in
evapotranspiration with the result of a rapid return to the soil
moisture conditions before precipitation.
Correction for Summer Precipitation
In some cases plots were measured shortly after the area received
precipitation. The data indicated quite a variable pattern in the
effect of this precipitation upon the soil moisture regime of the
plot. Further analysis indicated in some cases all precipitation had
been intercepted by the tree crowns or had been otherwise evaporated
prior to measurement. In other cases where no interception resulted
owing to the open position of the point, the soil moisture in the
surface foot had increased to an amount comparable to the recorded
precipitation. In some cases where precipitation reached the ground,
under a canopy cover, the shade from the trees decreased the rate of
surface evaporation and allowed measurable amounts of moisture to
enter the soil. In several cases the moisture content at a point had
increased an amount which was greater than the amount of precipitation
received, which indicates probable surface runoff from some areas and
ponding in slight depressions near the sampling point. Douglass 7/
observed that on plots near Union, South Carolina, much of the high
intensity rainfall is lost as runoff which begins when as little as
0.3-inch of rain has fallen. Of the total rainfall between May and
September 1959, 53 percent ± 2 percent of the water ran off a nearly
level plot. These various processes cause the variable wetting pattern
observed on plots in the Sierra.
7/ Personal correspondence with J. E. Douglass, October 14, 1960.

18
The increase in measured soil moisture since the previous
moisture measurement is perhaps the best indication of the
amount of water received at a point and remaining in the soil as
a result of intervening precipitation, runoff, and interception.
Soil moisture data obtained following summer precipitation which
indicated a rise in moisture content in the upper layers alone,
while the lower depths decreased or remained constant, was
adjusted by the amount of increase to obtain the amount of water
received at that point since the last measurement. The amount
was then subtracted from the measured soil moisture at the point
to obtain a corrected moisture content had precipitation not
occurred. This was necessary so that comparison could be made
with plots which were measured before the precipitation.
Weighting of Area Sampled
To obtain a quantitative value for moisture content in the
opening to compare with the moisture content in the forest, it
became necessary to weight the data so the samples which
represented a greater area would have the greatest weight, and
the value obtained would be representative of the conditions of
the opening rather than of a logarithmically spaced transect.
The sample was weighted according to the distance between
sampling points. Moisture values between two points along the
transect were averaged to obtain the mean moisture content of
the intervening distance between samples. These values were then
weighted as follows: 0-H to 1/8 H and 1/3 H to 1/4 H equal a
distance of 1/8 H between samples and received a weight of 1;
1/4 H to 1/2 H equals a distance of 1/4 H and received a weight
of 2; 1/2 H to 1 H equals a distance of 1/2 H and was weighted
by 4.
19
Correction to Comparable Periods of Measurement
The soil moisture data for this study was collected over a
relatively large time range. The data was adjusted to comparable measuring
periods for purposes of plot comparison. Time alone has been proven to be
a poor determinant of evapotranspiration through a moisture depletion
season or in the comparison of different seasons. The climatic events
providing the opportunity for evapotranspiration are the more highly
correlated factors of moisture loss. Consequently a simple index for the
moisture loss opportunity was desirable. Several basic methods and many
specific applications of these methods have been proposed in the past for
estimating potential evapotranspiration.
Vapor flow methods are generally estimates of the turbulent
transfer of moisture in the air near the ground. Energy balance methods
evaluate the energy requirements for the evaporation process related to
the energy received from net radiation and advection. Temperature index
methods are probably related to the energy balance methods, in which
temperature becomes an index to net radiation and this in turn becomes
related to evapotranspiration. Evaporation pan index methods relate the
evaporation from standardized pans to evapotranspiration from vegetation.
Knoerr 8/ reviewed the methods of estimating potential
evapotranspiration as applicable to the Sierra Nevada. He found an index
of vapor pressure deficit, which is a portion of the vapor flow method, to
be closely correlated to the soil moisture loss rates experienced during
his 2-year study at the Central Sierra Snow Laboratory. Vapor pressure
deficit has been used as an index to moisture loss by a number of
8/ Knoerr, op. cit.

20
investigators in studies of evapotranspiration from seedlings
of western conifers (Bates 1923), from seedlings of oak and
pine in the Piedmont region (Kozlowski 1949), from scrub oak
forests in Pennsylvania (Bethlahmy 1953), from clear-cut
forested watersheds in Sweden (Kihlberg 1958), from forests in
Russia (Pogrebnaik et al. 1957), from grass and lupine (Porkka
1956 and Haude 1952), and evaporation from bare soil (Penman
and Schofield 1941 and Lowry 1956). Knoerr chose an index based
on those used by Halstead (1951) and Haude (1952).
Other investigators (Tucker 1956; Prescott 1938, 1949) used
essentially the same approach to evapotranspiration approximation.
Knoerr's application of the vapor pressure deficit index
for evapotranspiration was based on the vapor pressure deficit
at 2 p.m. adjusted for relative day length. Temperature and
relative humidity data was obtained from Blue Canyon Airways
Station which is a first-order U. S. Weather Bureau station
located at 5,280 feet on an exposed ridge. Observation at this
station would be representative of the air masses at ground
level passing over the Sierra. The 2 p.m. vapor pressure deficit
is generally the maximum deficit for the day. Temperature and
relative humidity observations at this time are more stable than
at other times during the day. Hence variability due to time of
the observation would be at a minimum during this period. The
day length correction was included on the assumption that the
period of active transpiration is correlated with the length of
day, in that this is the period in which solar energy is
available for evapotranspiration. Day length corrections have
been used by Halstead (1951), Haude (1952), Thornthwaite (1946),
Crowe (1957), and others. Knoerr's formula for potential
evapotranspiration then becomes:
E ~ Dr x VPD 2 p.m.
21
In which E is the evapotranspiration index for the day, Dr is the ratio
of day length of the particular day to the length of day on June 21, the
longest day of the year. VPD 2 p.m. is the vapor pressure deficit based on
the 2 p.m. observation.
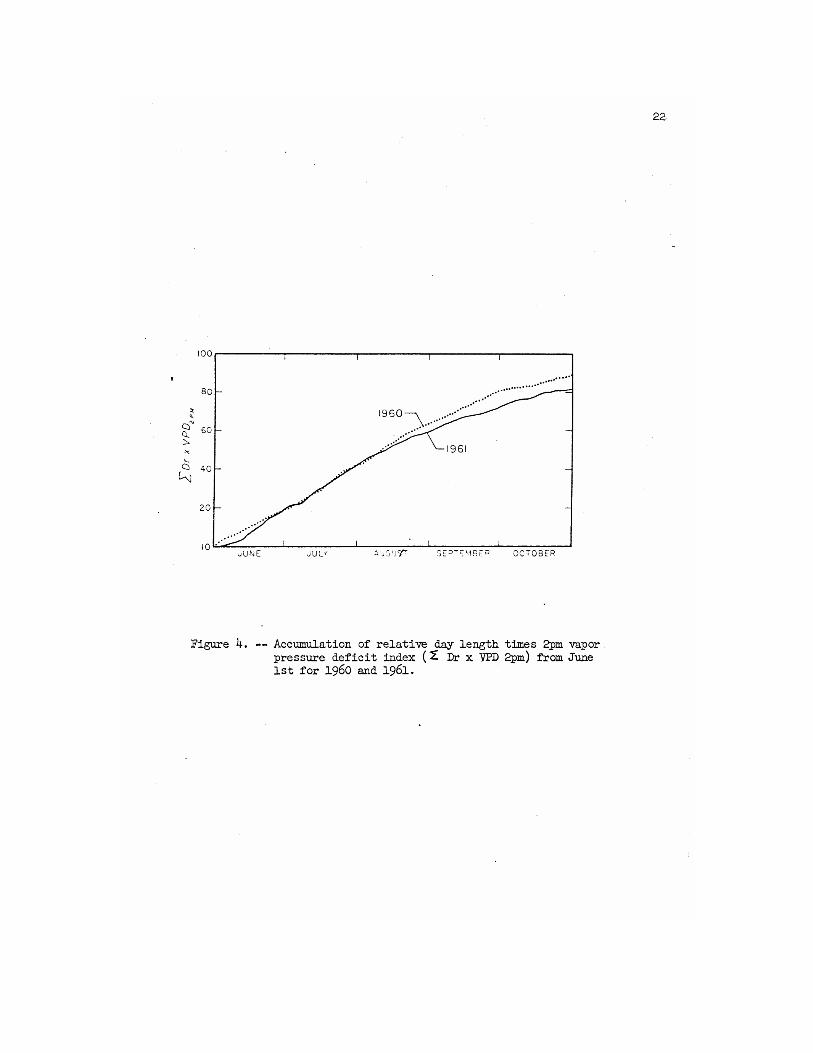
The index of vapor pressure deficit times day length was computed
for all days of the 1960 and 1961 summer soil moisture depletion seasons.
A summation of the index was then made for the two depletion seasons
(fig. 4) bringing the formulation of the index for accumulation of
evapotranspiration potential to:
Et ~ ΣDr x VPD 2 p.m.
in which Et is accumulated evapotranspiration over time t in days
initiated when the soil is at field capacity and terminated at the
conclusion of the summer depletion season.
Comparability of 1960 and 1961 Depletion Seasons
The climatic conditions of the two seasons were similar insofar as
the moisture contained in the air masses passing over the Sierra is
concerned. The 1960 season had the greater accumulated potential for
evapotranspiration owing to slightly drier air mass conditions toward the
end of the season, and a longer depletion season, extending until October
1 before the first precipitation of any significance. The 1961 depletion
season ended on September 15.
For purposes of comparing the two depletion seasons measured and
for comparing plots measured in the same season, but on different dates,
the soil moisture data were indexed and adjusted to periods of comparable
evapotranspiration potential in which Et was equal to 0 (field capacity
taken to June 1 in 1960 and 1961), 20 (approximately one-half of the soil
moisture depleted; July 1 in 1960 and 1961), 67 (end of the 1961
depletion season, September 14 in 1961 and September 6 in 1960), and 80
(end of the 1960 depletion season on September 30, 1960). The adjustment
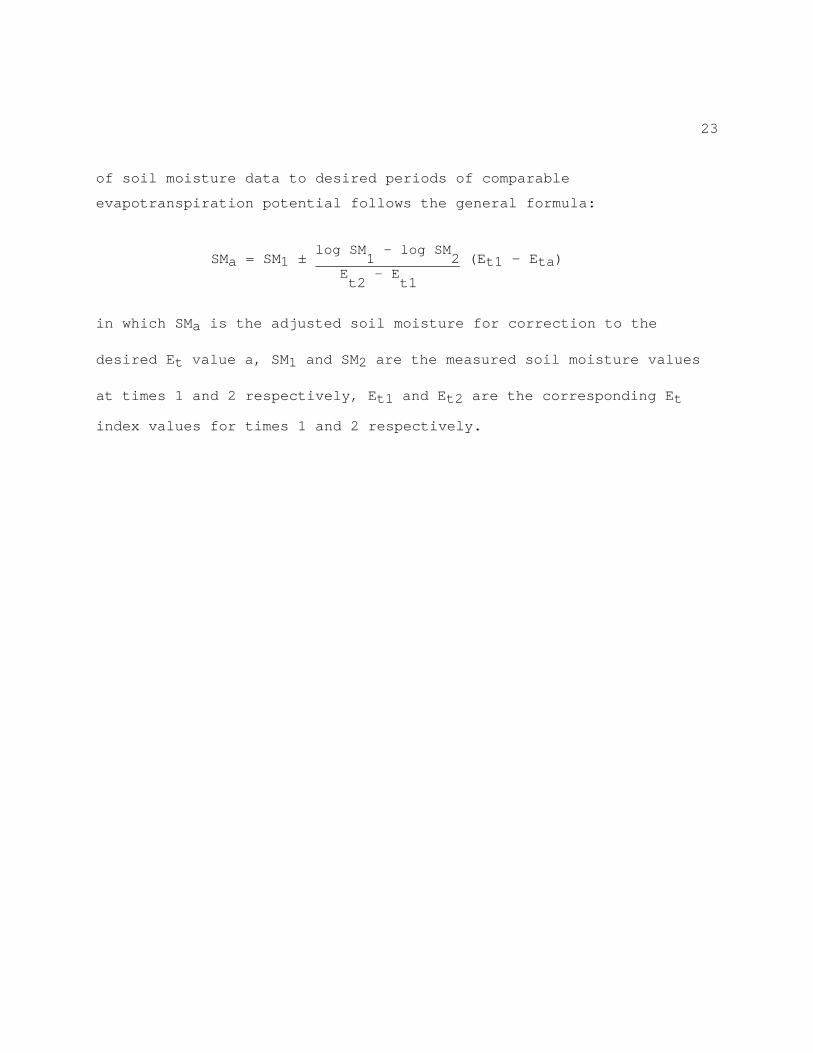
23
of soil moisture data to desired periods of comparable
evapotranspiration potential follows the general formula:
SMa = SM1 ± log SM
1 - log SM
2 (Et1 - Eta)
Et2
- Et1
in which SMa is the adjusted soil moisture for correction to the
desired Et value a, SM1 and SM2 are the measured soil moisture values
at times 1 and 2 respectively, Et1 and Et2 are the corresponding Et
index values for times 1 and 2 respectively.

24
RESULTS AND DISCUSSION
The primary purpose of this study was to relate the quantity
of summer soil moisture loss from logged forest openings to the
length of time since the creation of the opening. To understand this
general relationship it was necessary to determine the pattern of
soil moisture depletion occurring both within each plot at various
locations in the logged opening and in the adjacent unlogged forest.
The depletion pattern was determined for each plot at monthly
intervals throughout the summer moisture depletion season and into
the fall moisture recharge period. It then became necessary to
determine the effect of site variables, which we were unable to hold
constant, upon the pattern of soil moisture depletion. Finally it
was possible to subtract the quantity of moisture used by the forest
from that which was lost from openings of various ages to determine
the effect of opening age upon soil moisture loss throughout a
summer period. By use of regression analysis it was then possible to
determine the age at which the moisture loss in the logged area and
the loss in the unlogged forest would approach equality.
SEASONAL TREND OF SOIL MOISTURE DEPLETION
Figure 5 is a graphic representation of the moisture
conditions present in a recently created opening and within the
surrounding residual forest at monthly intervals throughout a summer
soil moisture depletion season. Figure 5 traces the change in
moisture conditions as the summer depletion season progresses to
termination and enters the fall soil moisture recharge season (see
also fig. 6 and Appendix, table 3.). The general pattern of the
disposition of soil moisture within the other plots studied during
the depletion season was consistent with the example presented and
only a graphic representation of the maximum depletion,

25
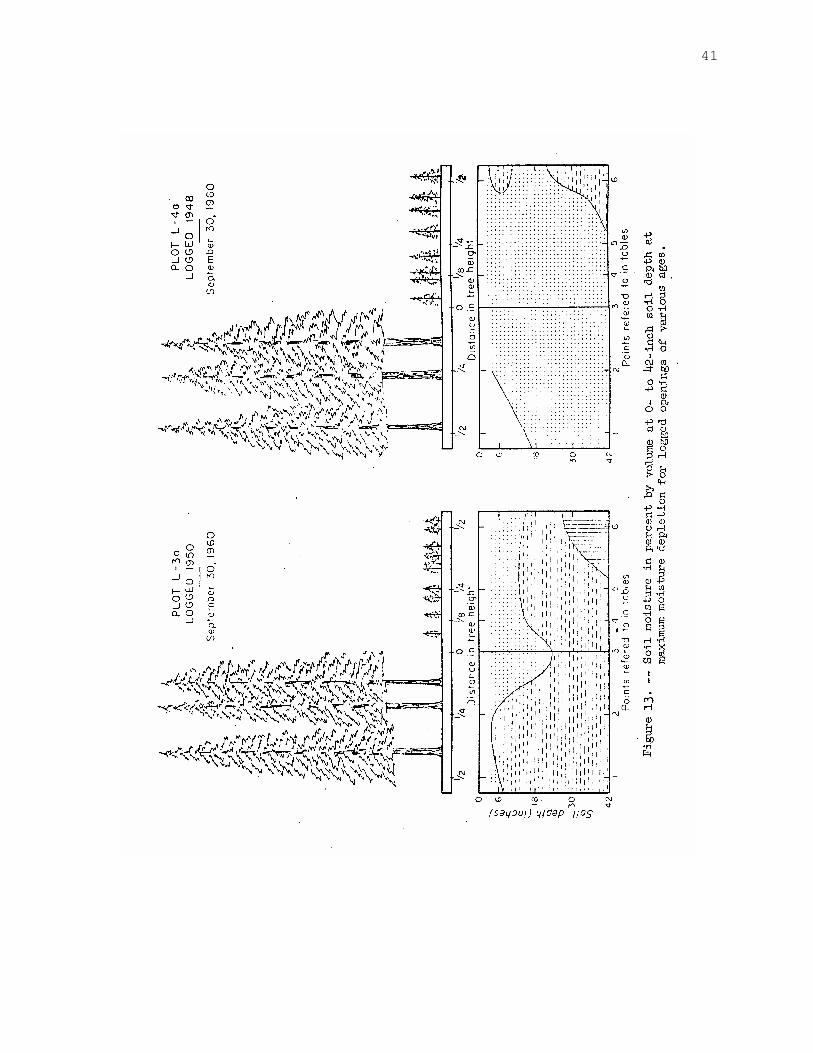
Figure 5. -- Soil moisture in percent by volume at 0- to 42-inch
soil depth in plot L-1a, logged in 1959, for various dates through the summer moisture depletion season and into the fall moisture recharge season, 1960 to 1961.
26
27
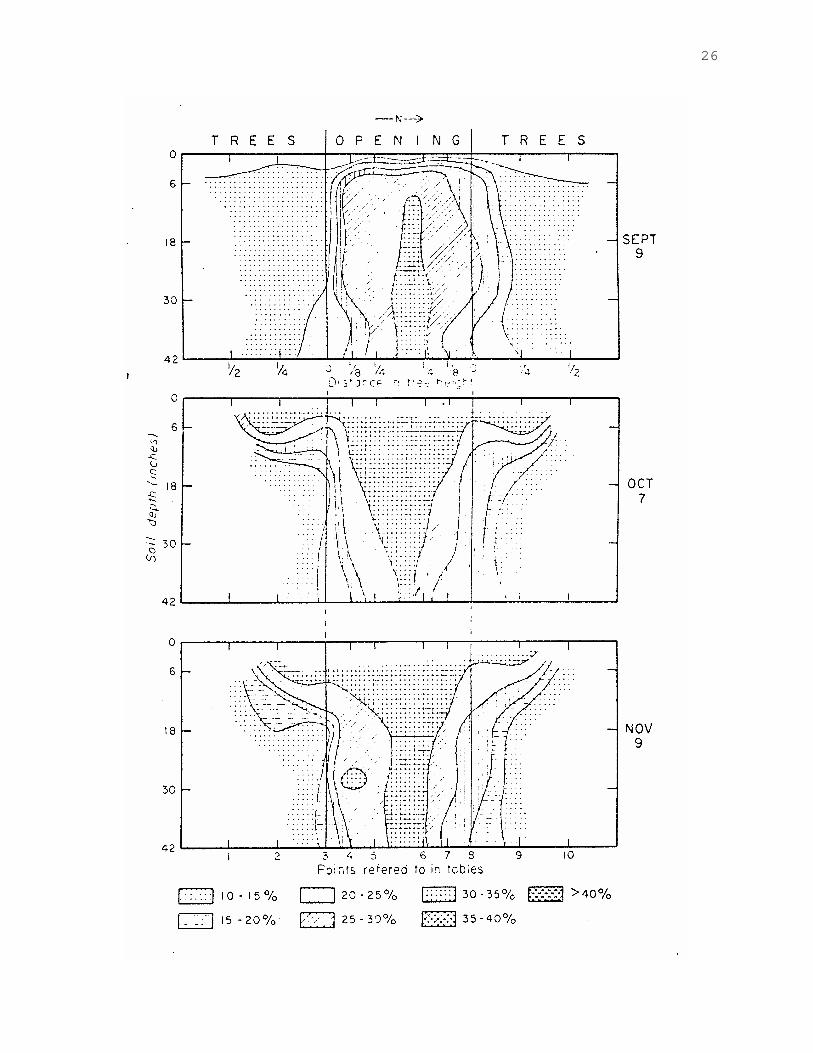
occurring on/or about September 9, will be presented for these plots.
However, a tabulation of the basic data for the entire series of
measurements may be found in table 3 in the Appendix. Early in the
summer season, June 22, 1961, moisture had been actively depleted in the
forest to the canopy border with isolated areas being present in the
open and forest in which the soil moisture was above field capacity when
measured. This is particularly evident near the south edge of the
opening. Within this portion of the plot, snow would have accumulated to
greater than average depth during the winter period. The subsequent melt
of snow from this area during the spring ablation period would be
delayed due to the increased snow depth and to the shading effect from
the forested area (Anderson 1956). Hence, the soil water within this
portion of the plot would reach field capacity at a later date than the
remainder of the plot because of the melting snow adding water to the
soil for a longer period of time (fig. 10). Toward the center of the
opening the soil remained at field capacity with evidence of moisture
depletion occurring only within the surface 6 inches of soil.
One month later, July 20, most of the available moisture within
the surface foot of soil has been lost to evapotranspiration from the
forest beyond a distance of 1/2 H from the edge of the opening, with
progressively more moisture being present as the center of the opening
is approached. Differences in soil moisture due to the delayed snow melt
at the south edge of the opening have disappeared by this date. About
half the available moisture has been depleted from the soil within the
forest at this date, with 10 to 20 percent of the available moisture
being lost from the opening.
Twenty-one days later, on August 10, only 10 percent of the avail-
able moisture remains within the forest. The gradient of soil moisture

28
Figure 6. – Plot L-1a, logged 1959.
Figure 7. – Plot L-1b, logged 1959.

29
Figure 8. – Plot L-3a, logged 1950.
Figure 9. – Plot L-4a, logged 1948.

30
Figure 10. –- Plot L-5a, logged 1923, 1949, and 1955.
Note the snowmelt pattern in southern edge of opening. Photo taken June 7, 1961.

31
near the south edge of the opening has become greatest at a point
located a distance of slightly less than 1/8 H or about 10 feet beyond
the canopy border into the opening. The gradient of soil moisture at
the north edge of the opening appears to have shifted slightly, being
greatest at a distance of 1/8 H into the forest. A more refined
sampling design would be necessary in order to determine the
explanation of this phenomenon with any degree of confidence.
By September 9, one month later, the maximum total seasonal soil
moisture depletion has occurred. Nearly all the available moisture has
been depleted from the forest with a rather definite and abrupt
increase in soil moisture content being evident as one moves toward
the center of the opening. Soil moisture loss within the opening
primarily occurs within the top 6 inches of soil. The central portion
of the opening is only slightly below field capacity. The shift to the
northern or downslope portion of the plot remains apparent with the
vertical gradient of soil moisture appearing less steep than in the
southern portion of the plot.
Soil moisture measurement taken after late September and early
October precipitation indicates that soil moisture recharge has
occurred in all but the lower depths of the opening, but remains
confined to the surface foot of soil within the forest. This
difference in the effect of the extent of moisture recharge is, of
course, explained by the quantity of water required to recharge the
dry forest soil being much greater than the quantity of water required
to recharge the more moist soil in the opening which was near field
capacity at the time of initiation of recharge. By November little
additional precipitation had fallen since the previous measurement,
with the result of an insignificant change in the soil moisture
pattern. However, a slight movement of moisture to lower depths in the
forest becomes apparent.

32
Effect of Field Capacity
The water holding capacity or field capacity of a soil
determines to a large extent the quantity of moisture which is
available for use by a plant. As the quantity of available moisture is
increased or decreased we would expect a corresponding change in the
pattern of moisture depletion by a given type of vegetation. The
quantity of water below field capacity used by the forested areas
sampled over time, as a function of the cumulative vapor pressure
deficit times day-length index, Et and adjusted to a comparable period
of initiation of moisture depletion below field capacity for three
ranges of field capacity in Lytton soil is shown in figure 11. Several
general relationships become apparent. First, the total quantity of
water used by the vegetation in soils of lower field capacities is
less than that used by the same vegetation in soils of higher field
capacities. This is to be expected since physically less water is
available for use. Second, the rate of water use decreases at an
earlier date in the low field capacity plots and at a later date in
the high field capacity plots. This is reasonable, since the rate of
water loss is a function of availability (Thornthwaite 1954; Halstead
1954; Zinke 1959). The sooner the water becomes unavailable the sooner
the rate of water loss will diminish. The initial rate of water loss
was comparable for all plots, but decreased as the availability of
water became limiting. Moisture became unavailable in the low field
capacity range, 13.6 to 14.5 inches per 4-foot soil, after 50 units of
Et had been attained on approximately August 11, 1961 with a total of
6.4 inches of water being used during the depletion season (fig. 11).
In the middle range of field capacity, 15.6 to 16.5 inches, moisture
became unavailable when 59 units of Et was attained on August 30, 1961
with a total of 9.4 inches of water being used during the depletion

33
Figure 11. -- Soil moisture depletion related to day length times vapor pressure deficit from forested portion of plots of various field capacities in inches per 4-foot soil depth, June to September, 1960 and 1961.
34
season. The moisture use pattern in the high field capacity range of 17.6
to 18.5 inches is of a more complex nature covering a greater range of
moisture depletion. However, it is apparent that water was still
available for use at the end of the summer depletion season and moisture
continued to be lost at a rate of 0.4 inch of water per week with an
average of 9.6 inches of water being used by the end of the 1961
depletion season on September 12. Knoerr 9/ found that total depletion in
his red fir sites ranged from 6.6 to 10.0 inches of moisture per 4-foot
soil. The range of depletion encountered during this study for a
comparable measuring period was 6.4 to 12.0 inches per 4-foot soil.
A greater quantity of water is being lost from a forest growing on
soils of high water holding capacity than on soils of low water holding
capacity. If the object of future treatment plans was to augment water
supplies in several areas, one of which had a soil of a high water
holding capacity and the others had soils of low water holding capacity
-- all other factors being equal -- the proposal would be to treat the
area with the higher water holding capacity or the higher potential for
water loss in the untreated condition. Treatment of this area would have
a potentially greater effect upon the quantity of water being used by the
forest. In the range of water holding capacity encountered in this study,
a difference of 3.0 inches of water per 4-foot soil exists between the
use of moisture by vegetation on a soil of low field capacity as compared
to use on a soil of high field capacity.
Effect on Soil Depth
The total depth of soil did not have a significant effect, upon
the depletion rate of soil moisture for the plots studied. As previously
9/ Knoerr, ibid.
35
stated, we were unable to ascertain the true depth of soil at any
given location -- only the depth to which the soil could be removed
with a hand auger. Owing to the rocky nature of soil encountered, many
of the sampling points probably do not represent the depth of the soil
to bedrock, but only the depth of soil to a concentration of morainal
material which we were unable to penetrate.
The soil moisture depletion rates at individual depths from the
soil surface to a depth of 4 feet produce significant effects which
can readily be observed in figures 5 and 13. Soil moisture was
depleted from the surface downward and was recharged with
precipitation from the surface downward. Several points in which
deeper sampling depths were attained indicated a continuation of this
relationship.
Effect of Ground Cover
It was difficult to separate the various ground cover
conditions into various components and to determine the influence of
these components upon soil moisture depletion. This is due primarily
to the nature of plots with which we are dealing and to the original
condition of the stand before and after logging. The original
selection of plots was designed to eliminate as many stand variables,
except age of the opening, as possible. Consequently, the conditions
of the remaining stand were fairly uniform in aspect, slope,
vegetation, soil, etc. The selection criteria would, in essence, be
effective in eliminating a great amount of variability of understory,
litter depth and composition, and general surface cover conditions
within the forest. Originally the openings were of a very uniform
cover condition, in that they were essentially composed of scarified
bare soil without any vegetation cover. Within a year or two, small
tree and brush seedlings germinated, but the soil was still
essentially bare. Within 5 years after logging there was at least a

36
partial cover of trees, brush, and grass over the opening. This cover
became more complete with time, with the trees and brush
predominating. Inspection of all plots concerned indicated this to be
the general pattern of events leading to the re-establishment of a
forest stand within the logged openings selected.
Seasonal Soil Moisture Depletion in Logged Openings
We have observed that the pattern of moisture conditions within
a recently logged forest opening changes as the depletion season
progresses. We now are interested in the effect of the age of the
opening upon the pattern of soil moisture depletion.
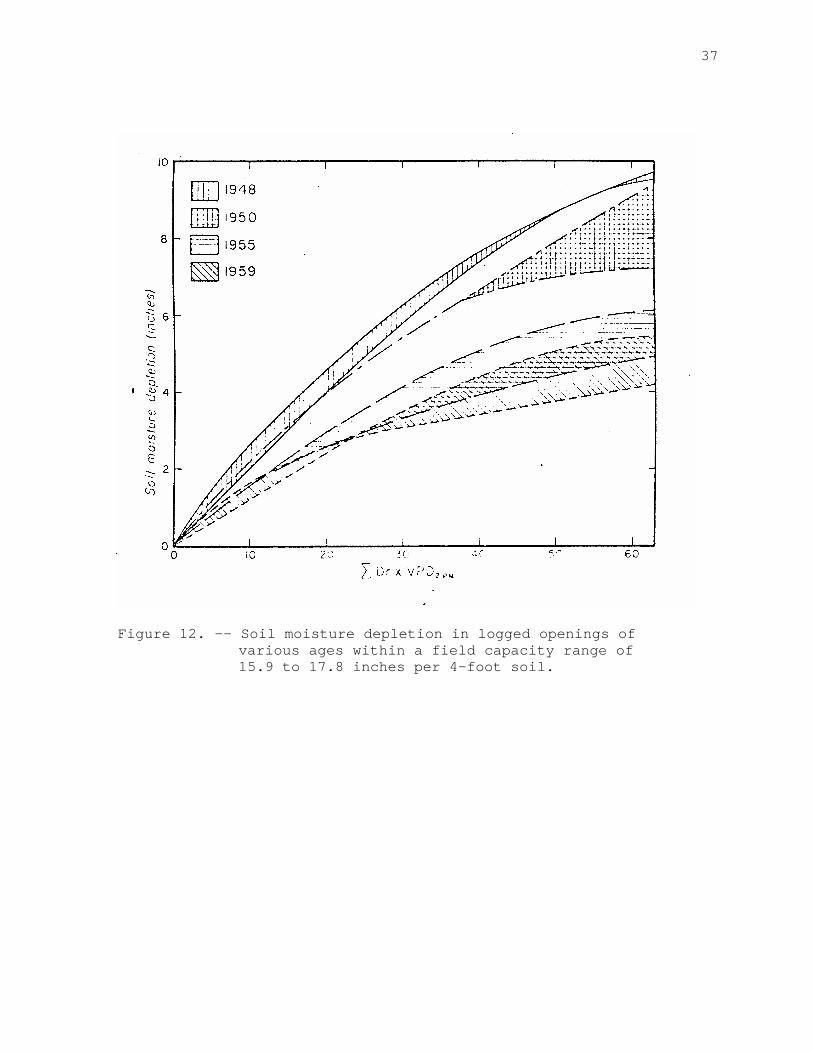
The soil moisture depletion in logged openings of various ages
within the soil field capacity range or 15.9 to 17.8 inches of
moisture per 4-foot soil, adjusted to a comparable period of the
initiation of moisture depletion below field capacity for the 1961
depletion season is illustrated in figure 12. It becomes apparent from
the figure that the loss of moisture from logged openings increases as
the age of the opening increases. The availability of moisture for
loss appears to be a limiting factor primarily in the more recently
logged openings with the limiting nature or moisture availability
becoming less as the age of the opening increases and reproduction
becomes established. The reason for this relationship may be found in
the method by which moisture is lost from these openings. In the more
recently created openings, moisture loss is due primarily to surface
evaporation from bare soil since very few seedlings have become
established by this time and the use of moisture by those few
seedlings do not as yet contribute to the moisture loss pattern.
Moisture loss by evaporation begins at the soil surface and proceeds
to subsequently lower depths with time, with the dry surface
acting as an insulator against further loss. In the older openings
37
Figure 12. -- Soil moisture depletion in logged openings of various ages within a field capacity range of 15.9 to 17.8 inches per 4-foot soil.
38
moisture is lost through both surface evaporation and transpiration of
the reproduction within the opening. The availability of moisture in the
older openings is limited only by the distribution of the roots of the
reproduction throughout the soil profile and does not limit moisture loss
until all the available moisture is tapped, as is found in the mature
forest, even through the total quantity of moisture which is lost is
greater than that of the bare, more recent openings.
The results of Knoerr 10/
which reported moisture depletion in
natural forest openings for the initial 20 units of VPD and also for
total June to September depletion agree closely with the quantity of loss
observed for the openings of this study which were created in 1950.
Knoerr found 4.3 inches of soil moisture had been lost in the initial 20
units of VPD, which in the 1950 logged areas of this study had lost 4.0
inches and in the 1948 logged areas had lost 4.5 inches. Total June to
September depletion was 8.4 inches per 4-foot soil. For a comparable
period the 1955 logged openings had lost an average of 8.1 inches of
moisture and the 1948 logged openings had lost 9.4 inches for each 4-foot
soil.
MAXIMUM SOIL MOISTURE DEPLETION
Effect of Time Since Logging
The soil moisture pattern at the period of maximum depletion would
be the best single indication of changes in soil moisture resulting from
the age of the opening because a measurement at this period would
represent the summation of the seasonal depletion within the plot.
Any differences in soil moisture depletion between plots would be
10/ Knoerr, ibid.

39
compounded by this time and subtle differences could be readily
ascertained.
We have described the soil moisture pattern in openings 1 year
old in a previous section. Within openings 5 years old (fig. 13) the
soil moisture content remains greatest toward the center of the
opening, with an abrupt change in moisture conditions occurring at 1/3
H, or about 30 feet from the canopy border. This represents about a 20
foot shift in the moisture depletion into the opening in the 5 years
since the opening was created. Moisture loss near the center of the
opening extends downward an additional 6 inches beyond that in the
year old logged opening. Vegetation in the 5 year old opening consists
of small and scattered Abies magnifica and Pinus contorta seedlings
and a smaller number of Ceanothus seedlings. The effect of this
reproduction upon soil moisture depletion is slight. The primary
change in moisture depletion within opening in the first 5 years since
logging is probably caused by extension of roots or the residual
forest into the opening. The determination of soil moisture at point 1
of this plot, located at 1/2 H in the forest, was influenced by the
presence of a large dead root at the 30-inch depth. The entire profile
at this point contained a large percentage of organic material which
not only contained a large quantity of moisture but also influenced
the number of modified neutrons returning to the soil moisture probe.
The neutrons are modified by any hydrogen atoms present in the medium
being measured. The value of moisture obtained is a value which would
require a special calibration curve based upon the organic content of
the soil. Consequently the point was not included in the analysis of
data. By the next five years the influence of the reproduction within
the opening had become apparent (fig. 8). Soil moisture still
increases toward the center of the opening but the gradient is much

40
41

42 less striking in this 10 year old opening. Reproduction within the
opening averages 6 feet in height and is composed of Abies magnifica
and an occasional Pinus contorta with a scattered understory of
Ceanothus cordulatus, Ceanothus cuneatus, Arctostaphylos nevadensis,
and Ribes roezlii. Moisture loss within the opening extends throughout
the entire 4-foot profile. Except in the center of the opening below
2 feet, all available moisture has been lost from the plot. The effect
of roots from the residual forest appears to extend a distance of
1/3 H into the opening, as was observed in the five year old opening.
In a 12 year old opening (fig. 9) all available moisture within
the plot has been, depleted except at the lowest depths near the
center of the plot. The roots of the reproduction have almost
completely occupied the site. The total moisture loss pattern of the
opening has essentially returned to the uncut condition with very
little moisture being saved as a result of the logging by the end of
the summer depletion season.
Effect of Canopy Cover
The effect of forest canopy density in the 10 percent of the
hemisphere above the soil moisture point was found to have no definite
correlation with maximum soil moisture depletion.
SOIL MOISTURE SAVINGS
Seasonal Trends
Soil moisture savings resulting from the creation of forest
openings vary with the seasons of the year as well as with the age of
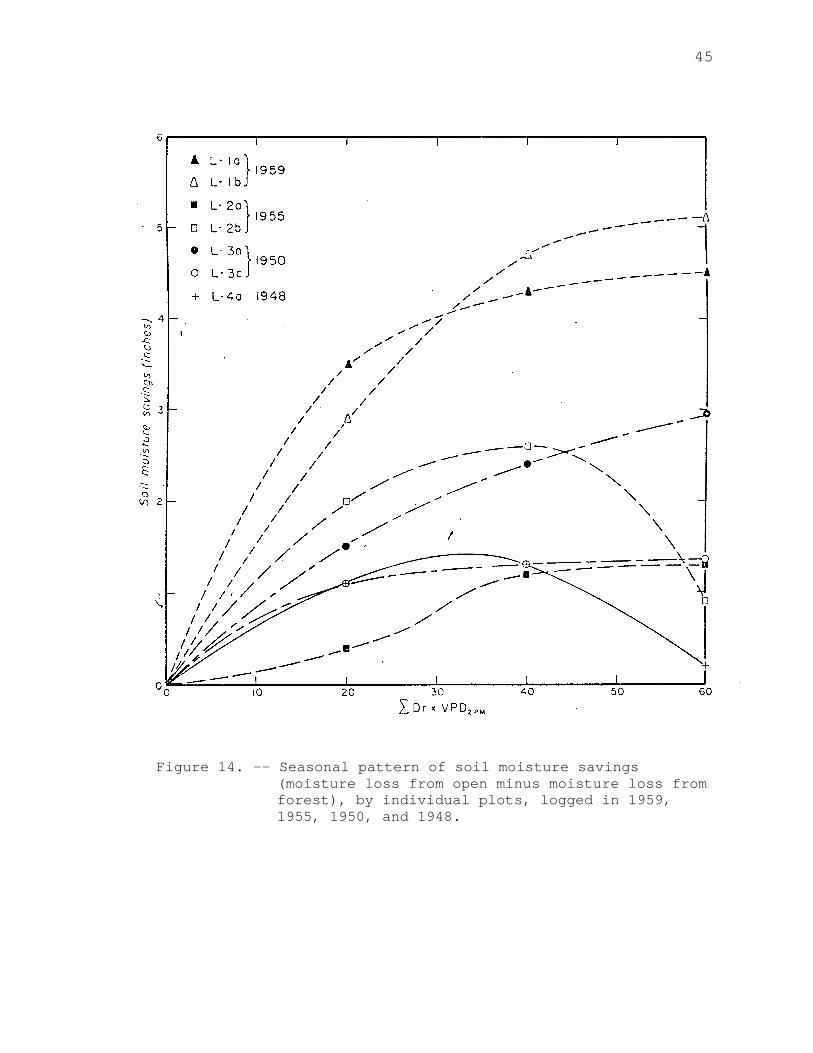
the opening (table 2). Figure 14 depicts differences in the quantity
of soil moisture between forest and opening as the depletion season
progresses. On the recently logged plots, where reproduction is
lacking, differences between the forest and the opening increase at a

43
rapid rate until the end of the depletion season is approached. At
that time moisture availability becomes limiting in the forest and the
rate of increase in savings begins to lessen. Moisture loss within the
opening in the recently logged plots is restricted to surface
evaporation and to use by the surrounding forest.
Differences in moisture loss within openings 5 years of age and
the surrounding forest follow the same general pattern as that of more
recently logged opening; that is, a consistent increase in the
difference occurs throughout the depletion season. The rate of
increase of this difference is less than in more recent openings due
to increased use of moisture within the opening by young seedlings and
by the adjacent residual forest.
The savings pattern becomes variable in the 10 years after logging
and is dependent upon the quantity of regeneration. However, a lag in
water use by the regeneration in the opening becomes apparent. Moisture is
generally depleted from the forest at a rapid rate owing to the complete
nature of root distribution within the forest and moisture becomes
unavailable before the end of the depletion season. Apparently, the root
distribution or the reproduction within the opening is more variable and
patchy in nature with some areas and depths lacking complete occupation.
As a result, the depletion of moisture from the opening is at a slower
rate but continues for a longer period because water is still available
for loss. The seasonal pattern of moisture depletion would then become one
in which differences between forest and opening are small early in the
depletion season, becoming greater by mid-season and then again becoming
smaller as the season progresses toward culmination when moisture use in
the forest has diminished due to availability and moisture use
by reproduction in the opening continues at the same relatively slow

44
Table 2. -- Plot soil moisture (inches per 4-foot soil), adjusted for 1 H opening size, by year of logging, plot number, and time - 1960-1961
Year logged
1959 1955 1950 1948 1949 Plot
L-1a L-1b(R)L-1b(T)L-2a L-2b L-3a L-3b L-3c L-4a L-5a 1/ (16.5)(16.5) (13.7)(17.8)(17.8)(15.9)(13.7)(16.7)(15.9)(17.8)
1961
2/ Et = 0 snow Forest 20.0 18.1 14.5 18.0covered 14.9 13.1 16.7 12.7 19.9 Open 17.9 16.7 13.1 19.8 18.0 15.0 14.6 16.7 15.2 20.8 Savings -2.1 -1.4 -1.2 1.8 -- 0.1 1.5 0.0 2.5 0.9
2/ Et = 20 Forest 14.4 11.8 11.3 13.6 15.8 10.7 8.8 10.7 10.7 13.8 Open 15.5 14.4 10.6 16.6 15.8 11.3 10.3 12.8 11.2 14.4 Savings 1.1 2.6 -0.7 3.0 0.0 0.6 1.5 2.1 0.5 0.6
2/ Et = 67 Forest 7.3 6.8 7.9 9.0 12.0 7.3 7.2 5.9 6.0 6.2 Open 12.8 12.3 8.4 12.0 12.9 8.5 7.2 6.9 6.0 7.5 Savings 5.5 5.5 0.5 3.0 0.9 1.2 0.0 1.0 0.0 1.3
1960
2/ Et = 67 Forest 6.4 6.6 7.8 8.2 9.6 7.7 7.1 6.8 6.5 6.1 Open 12.7 13.4 9.4 12.3 12.1 9.0 7.2 8.2 6.5 7.4 Savings 6.3 6.8 1.6 4.1 2.5 1.3 0.1 1.4 0.0 1.3
2/ Et = 81 Forest 6.4 6.2 7.8 8.2 9.6 7.5 7.0 6.5 6.2 6.0 Open 12.7 13.2 9.4 12.2 12.0 8.8 7.1 7.6 6.4 7.1 Savings 6.3 7.0 1.6 4.0 2.4 1.3 0.1 1.1 0.2 1.1 1/ Numbers in parentheses indicate plot field capacity.
2/ Et is a cumulative index of evapotranspiration computed as a function of vapor pressure deficit times a day length ratio.
45
Figure 14. -- Seasonal pattern of soil moisture savings
(moisture loss from open minus moisture loss from forest), by individual plots, logged in 1959, 1955, 1950, and 1948.

46
rate. The result of total moisture use in the forest and opening would
become nearly equal by the conclusion of the depletion season.
At Maximum Depletion
The uncut forest surrounding the logged opening was assumed to
be a representation of the soil moisture depletion pattern within the
opening before the logging operation. This assumption requires the
soil properties within the forest to be the same as those within the
opening and is probably a reasonable assumption for the openings
selected for this study. The difference between the quantity of
moisture used by the forest and the quantity of moisture lost in the
opening would be the amount of moisture which would be saved as a
result of the logging operation. When the quantity of moisture used by
the forest equals the quantity of moisture lost within the opening the
amount of moisture saved by the cutting would, of course, be
eliminated and the area must be cleared again if the function of the
cutting was to increase water yield from the area.
The depletion of soil moisture was computed for all plots for
the 1960 and 1961 depletion seasons and is tabulated for values of the
evapotranspiration index, Et of 0, 20, 67, and 81 (table 2). The
negative values of saving at Et = 0 indicate more moisture being
present in forest at the period taken as field capacity than in the
opening. This difference is due primarily to variations in snow melt
rate in the exposed open and within the shaded forest. Several plots
were above field capacity when the Et = 0 measurement was made. The
value of Et = 0 was useful to determine the point at which depletion of
soil moisture below field capacity began.
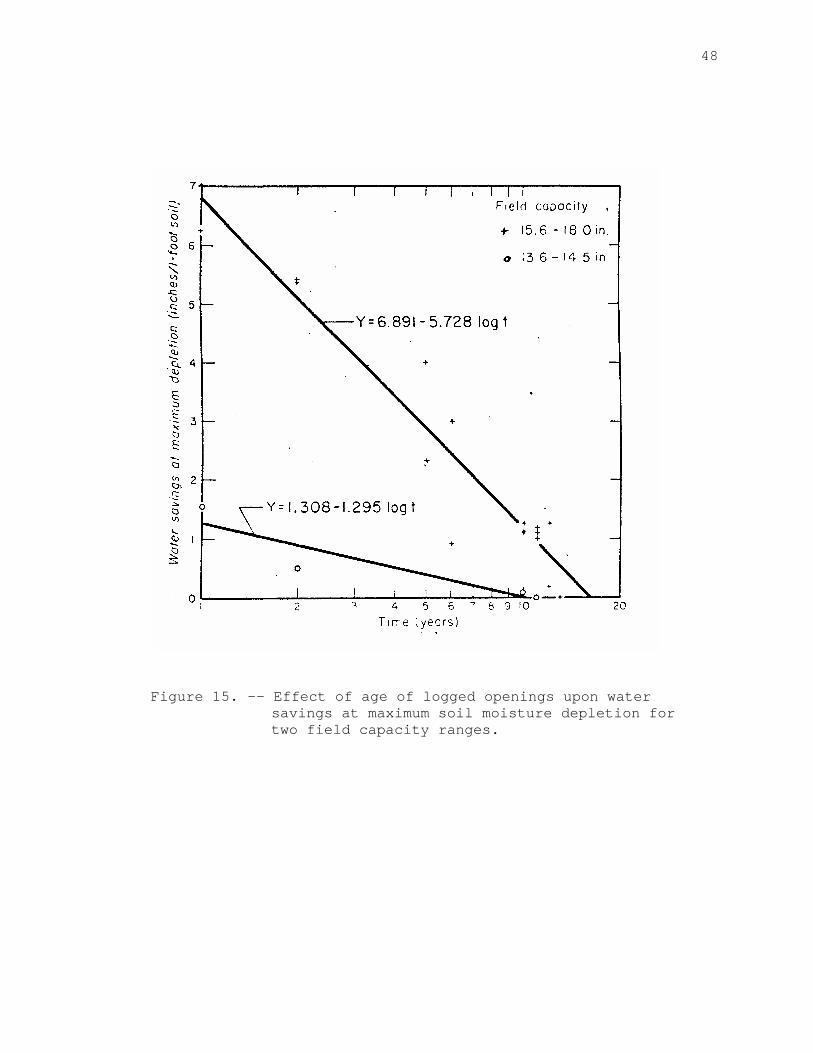
To determine the effect of the logging upon soil moisture loss, the
water savings at maximum depletion was plotted over the logarithm of the
age of the opening in years (fig. 15). The period of maximum depletion

47
was used because by this time of the season the rate of water loss has
decreased and the measured soil moisture is more stable at this time.
Hence, variability due to time of the observation would be at a
minimum during this period. It was observed previously that the two
plots with low field capacity reacted in a manner which was different
from the rest of the plots. Therefore these two plots were analyzed
separately. A regression was fit to the values of water saved in the
various plots with field capacities between 15.6 and 18.0 inches of
moisture per 4-foot soil as defined by the line:
Y = 6.891 - 5.728 log t,
in which Y is the water savings at maximum depletion in inches of
moisture per 4-foot soil, and log t is equal to the logarithm of age
of the opening in years. The fit of this line to the data was found to
have an explained variance (r2) of 0.928, or 93 percent of the
variation in the water savings at maximum depletion is explained by
the logarithm of the age of the opening. The standard deviation was
±0.6404, that is, 2/3 of the observations could be found within the
range of ±0.64 inches moisture content of this line. Soil moisture
savings resulting from logging became zero 16 years after cutting.
In plots with field capacities between 13.6 and 14.5 inches of
moisture the regression
Y = 1.304 - 1.295 log t,
fits the scatter of points with an explained variance of 0.8367 and a
standard deviation of ±0.364. Moisture savings become zero 11 years
after cutting.
The time between the 1960 and 1961 measurement seasons resulted in a
change in the quantity of savings for each particular age opening -- an
amount equal to a change of one year, indicated by the regression equation.
48
Figure 15. -- Effect of age of logged openings upon water savings at maximum soil moisture depletion for two field capacity ranges.
49
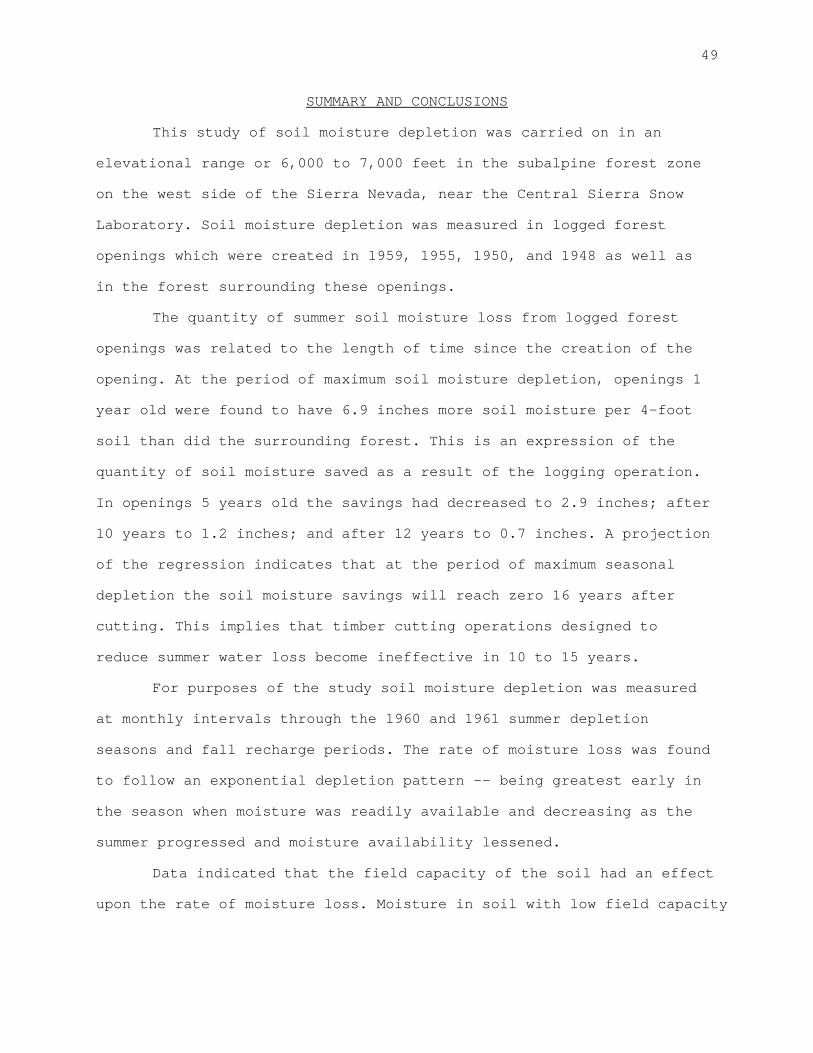
SUMMARY AND CONCLUSIONS
This study of soil moisture depletion was carried on in an
elevational range or 6,000 to 7,000 feet in the subalpine forest zone
on the west side of the Sierra Nevada, near the Central Sierra Snow
Laboratory. Soil moisture depletion was measured in logged forest
openings which were created in 1959, 1955, 1950, and 1948 as well as
in the forest surrounding these openings.
The quantity of summer soil moisture loss from logged forest
openings was related to the length of time since the creation of the
opening. At the period of maximum soil moisture depletion, openings 1
year old were found to have 6.9 inches more soil moisture per 4-foot
soil than did the surrounding forest. This is an expression of the
quantity of soil moisture saved as a result of the logging operation.
In openings 5 years old the savings had decreased to 2.9 inches; after
10 years to 1.2 inches; and after 12 years to 0.7 inches. A projection
of the regression indicates that at the period of maximum seasonal
depletion the soil moisture savings will reach zero 16 years after
cutting. This implies that timber cutting operations designed to
reduce summer water loss become ineffective in 10 to 15 years.
For purposes of the study soil moisture depletion was measured
at monthly intervals through the 1960 and 1961 summer depletion
seasons and fall recharge periods. The rate of moisture loss was found
to follow an exponential depletion pattern -- being greatest early in
the season when moisture was readily available and decreasing as the
summer progressed and moisture availability lessened.
Data indicated that the field capacity of the soil had an effect
upon the rate of moisture loss. Moisture in soil with low field capacity

50
became limiting to plant use early in the season and the rate of water
loss decreased. Active moisture loss in soils of higher field capacity
continued for a longer period of time resulting in a greater quantity
of moisture being lost during the summer depletion period.
51
LITERATURE CITED
Aaltonen, V. T. 1926. On the space arrangement of trees and root competition.
Jour. Forestry 24: 627-644. Anderson, H. 1956. Forest cover effects on snowpack accumulation and melt,
Central Sierra Snow Laboratory. Amer. Geophys. Union Trans. 37(3): 307-312
Bates, C. G. 1923. Physiological requirements of Rocky Mountain trees. Jour.
Agr. Res. 24: 97164. , and Henry, A. J. 1928. Forest and streamflow at Wagon wheel Gap, Colorado, final
report. Monthly Weather Rev. Suppl.: 1-79. Bethlahmy, N. 1953. Estimating summer evapotranspiration losses in a
Pennsylvania scrub oak forest. Soil Sci. Soc. Amer. Proc. 17: 295-297.
Burrows, W. C. and Kirkham, D. 1958. Measurement of field capacity with a neutron meter. Soil
Sci. Soc. Amer. Proc. 22: 103-105. California Department of Water Resources 1962 Water conditions in California, basic data supplement.
California Cooperative Snow Surveys, April 1, 1962. 51 pp. Carlton, P. F. 1957. The application of radioisotopes to the measurement of soil
moisture content and density. Amer. Soc. Mech. Engr. Second Nuclear Eng. and Sci. Conf. Paper 57-NESC-17.
Coutts, J. R. H. 1958. Moisture and temperature conditions in afforested areas in
Aberdeenshire. Forestry 31: 167-176. Crowe, P. R. 1957. Some further thoughts on evapotranspiration: a new
estimate. Geog. Studies 4: 56-75.
52 Dalton, J. 1802. Experimental essays. Manchester Lit. and Phil. Soc. Mem. 5:
535-602. Davidson, J. M., Nielsen, D. R., and Perrier, E. R. 1958. Influence of temperature on soil moisture neutron probes.
Appendix 3. Notes on Neutron Soil Moisture Meter Conf. U. S. Dept. Agr., Agr. Res. Serv.
Douglass, J. E. 1960 Soil moisture distribution between trees in a thinned
Loblolly pine plantation. Jour. Forestry 58(3): 221. Gardner, W. R. and Kirkham, D. 1952. Determination of soil moisture by neutron scattering. Soil
Sci. 73(5): 391-401. Giulimondi, G. 1960. Observations on cultivated soils adjacent to Eucalypt
windbreaks. Fourth Sess. Wkg. Party on Eucalypts F.A.0. J. T. Subcomm. Mediter. Forest. Prob. FAO/SCM/EV/ 60-10b. 3 pp.
Goldberg, I., Trescony, L. J., Campbell, J. S., Jr., and Whyte, G. J. 1955. Measurement of moisture content and density of soil masses
using radioactivity methods. Third Nat. Conf. on Clay and Clay Minerals Proc. Nat. Acad. Nat. Res. Coun. Pub. 395: 5l6-548.
Halstead, M. H. 1951. Theoretical derivation of an equation for potential
evapotranspiration. Johns Hopkins University Laboratory of Climatology Pubs. in Climatology 4(5): 10-12.
1956. The fluxes of momentum, heat, and water vapor in
micrometeorology. Johns Hopkins University Laboratory of Climatology Pubs. in Climatology 7(2): 326-361.
Hanks, R. J., and Bowers, S. A. 1960. Neutron meter access tube influences soil temperature. Soil
Sci. Soc. Amer. Proc. 24(1): 62-63. Haude, W. 1952. Zur Moglichkeit nachtraglicher Besimmung der
Wasserbeanspruchung durch die Luft und ihrer Nachprutung an Hand von Tropfversuchen und Abflussmessungen. Berich. des. Deut., Wett. (U. S. Zone) 32: 27-34.

53 Johnson, E. A., and Kovner, J. L. 1956. Effect on streamflow of cutting a forest understory. Forest
Sci. 2(2): 82-91. , and Meginnis, H. G. 1960. Effect of altering forest vegetation on low flows of small
streams. Int. Assn. Sci. Hydrol. Comm. of Surface Waters, Pub. 51: 257-266.
Kalashnikov, A. F. 1955. (The effect of forest strips on the moisture content of
Caucasian chernozems in the hot season.) Pochvovedenie 6: 74-82.
Kihlberg, S. 1958. Himmelsberget. En undersokning av skogsbestandets inverkan
pa nattenhushallningen. (Himmelsberget, a study of the influence of the forest cover on the water economy.) Grundforbattring 11:119-140, 175-200. (English summary pp. 197-199.)
Kovner, J. L. 1956. Evapotranspiration and water yield following forest cutting
and natural regrowth. Soc. Amer. Foresters Proc. 1956: 106-110.
Kozlowski, T. T. 1949. Light and water in relation to growth and competition of
Piedmont forest tree species. Ecol. Mon. 11: 207-231. Letey, J., Hsia, E., Pelishek, R. E., and Osborn, Jr.. 1961. Infiltration measurement with the neutron moisture probe.
Soil Sci. 91(2): 77-83. Lowry, W. P. 1956. Evaporation from forest soils near Donner Summit,
California, and proposed field method for estimating evaporation. Ecology 37: 419-430.
Lunt, H. A. 1934. Distribution of soil moisture under isolated forest trees.
Jour. Agr. Res. 49(8): 695703. Merriam, R. A. 1959. Nuclear probe compared with other soil moisture measurement
methods. California Forest and Range Expt. Sta. Res. Note 146, 5 pp.

54 Merriam, R. A. 1960. Moisture sampling in wildland soils with a neutron probe.
Iowa State Jour. Sci. 34: 641-648. Mortier, P., and de Boodt, M. 1956. Determination of soil moisture by neutron scattering.
Netherlands Jour. Agr. Sci. 4: 111-113. Moulopoulos, C. 1956. Regeneration naturelle des peuplements de sapin en Grece et
particulierement dans la foret de Pertouli (Thessalie). Scientific Yearbook, Aristotelion panepestimion Thessalonikes, Salonika, School of Agr. and Forestry, 1955-1956. (In Greek pp. 177-266. French resume p. 267-277.)
Nelson, R. E. 1957. Soil vegetation survey of a central Sierra snow zone
watershed. California Forest and Range Expt. Sta. Misc. Paper No. 21.
Nuclear-Chicago Corporation (n.d.) Instruction book, Model P-19 subsurface soil moisture
probe. 21 pp. Penman, H. L., and Schofield, R. K. 1941. Drainage and evaporation from fallow soil at Rothamsted.
Jour. Agr. Sci. 31: 74-109. Pogrebnaik, P. S., Illkun, G. M., and Solopko, A. A. 1957. (Calculation of the loss of moisture from forests by means
of the evaporation gradient.) Doklady 113: 454-457. Porkka, M. T. 1956. Results of measurements with Renquist's evaporation.
recorder in south Finland in summer 1950. Geophysica 5: 70-77.
Preobrazhenskaya, M. V. 1959. (Results using gamma radiation to measure changes in soil
moisture contents in the Pakhta-Aral sovkhoz.) Pochvovedenie 10: 1223-1227.
Prescott, J. A. 1938. Indicies in agricultural climatology. Jour. Austral. Inst.
Agri. Sci. 4: 33-40

55 Prescott, J. A. 1949. A climatic index for the leaching factor in soil formation.
Jour. Soil Sci. 1: 9-19. Savina, A. V. 1956. (The physiological justification for the thinning of
forests. Pub. for Natl. Sci. Found. and U.S. Dept. Agr., Israel Program for Sci. Transl., 91 pp.
Thornthwaite, C. W. 1948. An approach toward a rational classification of climate.
Geog. Rev. 38: 55-94. 1954. A re-evaluation of the concept and measurement of potential
evapotranspiration. Johns Hopkins University, Laboratory of Climatology Pubs. in Climatology 7: 200-209.
Toumey, J. W., and Kienholz, R. 1931. Trenched plots under forest canopies. Yale Univ. School of
Forestry Bull. 30. 31 p. Tucker, B. M. 1956. An alternative calculation for potential
evapotranspiration. Royal Soc. So. Austral. Trans. 19: 46-51.
U. S. Army 1956. Snow hydrology, a summary report of the snow
investigations. Portland, Ore., North Pac. Div., Corps of Engr. 437 pp.
U. S. Public Health Service 1958. The water polution control program of the U.S. Public
Health Service, 1957-1958. U.S. Dept. Health, Educ., and Welfare Publ. 631, 26 pp.
Van Bavel, C. H. M. 1958. Measurement of soil moisture content by the neutron method.
U. S. Dept. Agr., Agr. Ron. Serv. ARS 41-24 29 pp. 1956. Soil moisture measurement by neutron modification. Soil
Sci. 82: 2941.

56 Wyssotzky, von G. N. 1932. Bodenfeuchtigkeitsuntersuchungen in waldbestanden der
Ukrainiselen steppen und waldsteppenzone. Tharandter Forestliches Jahbuch 33: 521-534.
Zinke, P. J. 1959. The influence of a stand of Pinus coulteri on the soil
moisture regime of a large San Dimas lysimeter in southern California. Woodlands and Water- Lysimeters. Internatl. Assoc. Sci. Hydrol. Pub. 49 pp. 126-138.

57
APPENDIX

58 Table 3. -- Soil moisture data by plot number, sampling point,
and soil depth (Data in parentheses are estimates 1/) PLOT L-1a; opening created 1959; 8/10/60
Av. soil moisture in forest, 7.5 inches; in opening, 13.0 inches 2/ Soil moisture (Percent volume) Soil moisture(inches) Sampling at depth in inches of -- point 3/ 6 18 30 42 Total4/ Precip.5/ 1 13.0 14.5 14.5 (14.5) 6.8 - 2 16.5 15.5 12.5 (12.5) 6.8 - 3 15.0 13.0 17.0 19.0 7.7 - 4 26.5 27.5 29.5 (29.5) 13.6 - 5 26.5 27.0 28.0 25.5 12.9 - 6 30.5 31.0 31.0 (31.0) 14.8 - 7 24.5 27.5 29.0 24.5 12.7 - 8 28.0 27.5 27.0 (27.0) 13.2 - 9 12.0 14.0 14.5 (14.5) 6.6 - 10 10.0 11.5 11.5 (11.5) 5.3 -
PLOT L-1a; 9/9/60
Av. soil moisture in forest, 6.9; in opening, 12.6 inches2/
1 12.0 13.5 13.5 (13.5) 6.3 - 2 15.5 13.0 11.5 (11.5) (6.2) - 3 13.0 12.5 15.5 16.0 6.8 - 4 26.5 26.5 25.5 (25.5) 12.5 - 5 28.0 27.0 27.5 26.0 13.0 .2 6 29.5 30.0 30.0 (30.0) 14.7 - 7 25.0 26.5 28.5 27.0 12.9 .4 8 24.0 25.5 25.0 (25.0) 11.9 - 9 12.5 13.0 14.0 (14.0) 6.4 - 10 10.0 11.0 11.0 (11.0) 5.2 -
PLOT L-1a; 10/7/60
Av. soil moisture in forest, 6.8 inches; in opening, 12.5 inches2/
1 13.0 14.0 14.0 (14.0) 6.0 .3 2 32.5 13.5 12.0 (12.0) 8.4 2.2 3 25.0 13.5 15.5 15.5 8.4 1.6 4 33.5 29.5 29.5 (29.5) 14.6 2.1 5 34.0 30.5 29.5 29.0 14.8 2.0 6 32.5 30.5 30.5 (30.0) 14.8 .1 7 32.5 26.5 28.0 24.5 13.4 1.0 8 28.0 23.5 24.0 (24.0) 11.9 .5 9 31.0 13.5 13.5 (13.5) 8.9 2.7 10 12.0 11.5 11.5 (11.0) 5.6 .4
Footnotes located at end at table
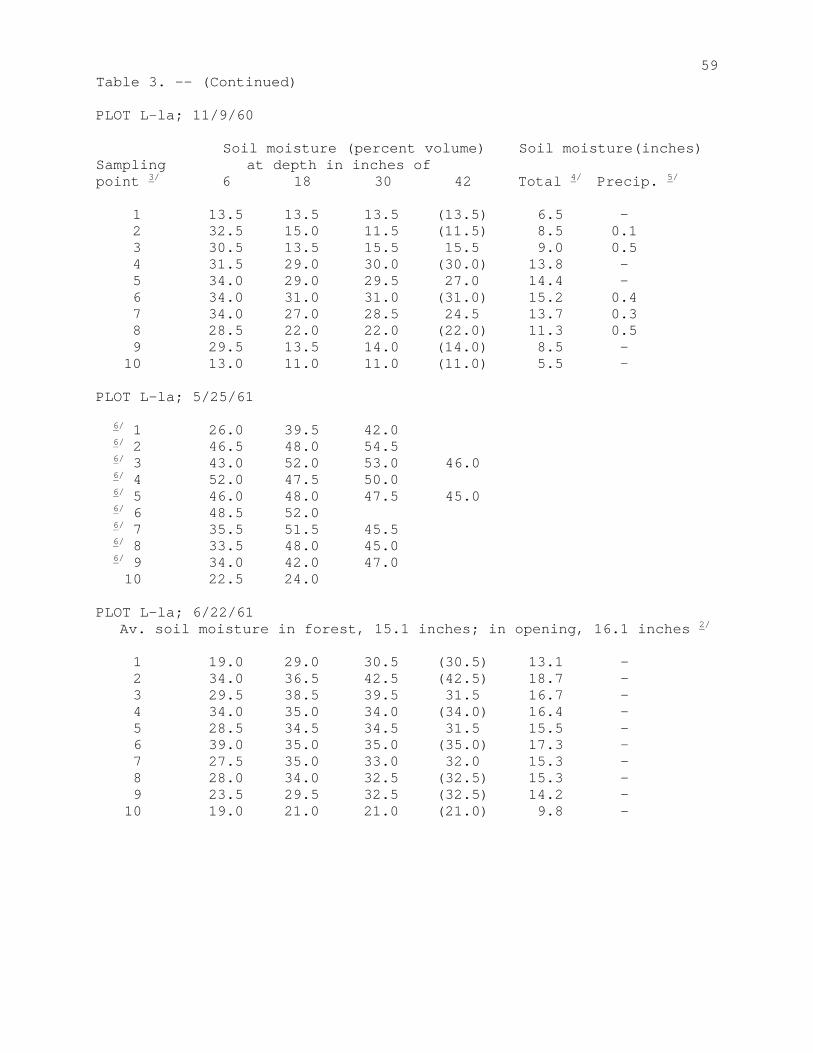
59 Table 3. -- (Continued) PLOT L-la; 11/9/60 Soil moisture (percent volume) Soil moisture(inches) Sampling at depth in inches of point 3/ 6 18 30 42 Total 4/ Precip. 5/ 1 13.5 13.5 13.5 (13.5) 6.5 - 2 32.5 15.0 11.5 (11.5) 8.5 0.1 3 30.5 13.5 15.5 15.5 9.0 0.5 4 31.5 29.0 30.0 (30.0) 13.8 - 5 34.0 29.0 29.5 27.0 14.4 - 6 34.0 31.0 31.0 (31.0) 15.2 0.4 7 34.0 27.0 28.5 24.5 13.7 0.3 8 28.5 22.0 22.0 (22.0) 11.3 0.5 9 29.5 13.5 14.0 (14.0) 8.5 - 10 13.0 11.0 11.0 (11.0) 5.5 - PLOT L-la; 5/25/61 6/ 1 26.0 39.5 42.0 6/ 2 46.5 48.0 54.5 6/ 3 43.0 52.0 53.0 46.0 6/ 4 52.0 47.5 50.0 6/ 5 46.0 48.0 47.5 45.0 6/ 6 48.5 52.0 6/ 7 35.5 51.5 45.5 6/ 8 33.5 48.0 45.0 6/ 9 34.0 42.0 47.0 10 22.5 24.0 PLOT L-la; 6/22/61 Av. soil moisture in forest, 15.1 inches; in opening, 16.1 inches 2/ 1 19.0 29.0 30.5 (30.5) 13.1 - 2 34.0 36.5 42.5 (42.5) 18.7 - 3 29.5 38.5 39.5 31.5 16.7 - 4 34.0 35.0 34.0 (34.0) 16.4 - 5 28.5 34.5 34.5 31.5 15.5 - 6 39.0 35.0 35.0 (35.0) 17.3 - 7 27.5 35.0 33.0 32.0 15.3 - 8 28.0 34.0 32.5 (32.5) 15.3 - 9 23.5 29.5 32.5 (32.5) 14.2 - 10 19.0 21.0 21.0 (21.0) 9.8 -
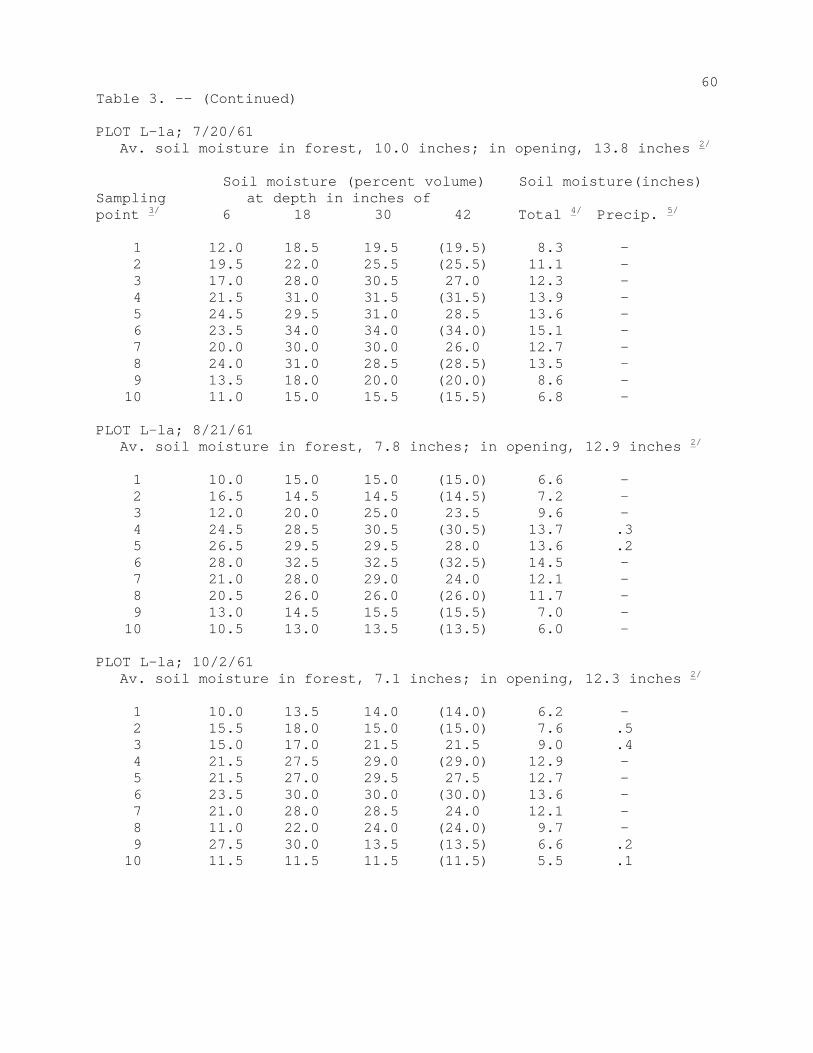
60 Table 3. -- (Continued) PLOT L-1a; 7/20/61 Av. soil moisture in forest, 10.0 inches; in opening, 13.8 inches 2/
Soil moisture (percent volume) Soil moisture(inches) Sampling at depth in inches of point 3/ 6 18 30 42 Total 4/ Precip. 5/ 1 12.0 18.5 19.5 (19.5) 8.3 - 2 19.5 22.0 25.5 (25.5) 11.1 - 3 17.0 28.0 30.5 27.0 12.3 - 4 21.5 31.0 31.5 (31.5) 13.9 - 5 24.5 29.5 31.0 28.5 13.6 - 6 23.5 34.0 34.0 (34.0) 15.1 - 7 20.0 30.0 30.0 26.0 12.7 - 8 24.0 31.0 28.5 (28.5) 13.5 - 9 13.5 18.0 20.0 (20.0) 8.6 - 10 11.0 15.0 15.5 (15.5) 6.8 - PLOT L-la; 8/21/61 Av. soil moisture in forest, 7.8 inches; in opening, 12.9 inches 2/ 1 10.0 15.0 15.0 (15.0) 6.6 - 2 16.5 14.5 14.5 (14.5) 7.2 - 3 12.0 20.0 25.0 23.5 9.6 - 4 24.5 28.5 30.5 (30.5) 13.7 .3 5 26.5 29.5 29.5 28.0 13.6 .2 6 28.0 32.5 32.5 (32.5) 14.5 - 7 21.0 28.0 29.0 24.0 12.1 - 8 20.5 26.0 26.0 (26.0) 11.7 - 9 13.0 14.5 15.5 (15.5) 7.0 - 10 10.5 13.0 13.5 (13.5) 6.0 - PLOT L-la; 10/2/61 Av. soil moisture in forest, 7.1 inches; in opening, 12.3 inches 2/ 1 10.0 13.5 14.0 (14.0) 6.2 - 2 15.5 18.0 15.0 (15.0) 7.6 .5 3 15.0 17.0 21.5 21.5 9.0 .4 4 21.5 27.5 29.0 (29.0) 12.9 - 5 21.5 27.0 29.5 27.5 12.7 - 6 23.5 30.0 30.0 (30.0) 13.6 - 7 21.0 28.0 28.5 24.0 12.1 - 8 11.0 22.0 24.0 (24.0) 9.7 - 9 27.5 30.0 13.5 (13.5) 6.6 .2 10 11.5 11.5 11.5 (11.5) 5.5 .1

61 Table 3. -- (Continued) PLOT L-1b(R); opening created 1959; 8/9/60 Av. soil moisture in forest, 7.2 inches; in opening, 12.3 inches 2/ Soil moisture (percent volume) Soil moisture(inches) Sampling at depth in inches of point 3/ 6 18 30 42 Total 4/ Precip. 5/ 1 15.5 15.5 15.5 (15.5) 7.4 - 2 12.0 12.5 13.0 15.0 6.3 - 3 13.0 19.0 23.0 (23.0) 9.4 - 4 31.0 21.0 26.5 (26.5) 12.6 - 5 30.0 27.5 31.0 (31.0) 14.4 - 6 30.5 29.5 (29.5) (29.5) 14.3 - 7 32.0 (32.0) (32.0) (32.0) 15.4 - 8 16.0 17.0 17.0 (17.0) 8.0 - 9 16.0 20.5 19.0 (19.0) 8.9 - 10 12.5 15.0 18.5 (18.5) 7.7 - 11 12.0 14.0 (14.0) (14.0) 6.5 - 12 17.5 15.5 17.0 (17.0) 7.9 - PLOT L-lb(R); 9/8/60 Av. soil moisture in forest, 6.7 inches; in opening, 11.9 inches 2/ 1 14.0 14.5 14.0 (14.0) 6.8 - 2 11.0 11.0 11.5 13.5 5.7 - 3 11.0 14.0 17.0 (17.0) 8.1 - 4 30.5 20.0 26.0 (26.0) 12.3 - 5 28.5 26.0 30.5 (30.5) 13.9 - 6 30.5 28.5 (28.5) (28.5) 13.9 - 7 33.0 (32.0) (32.0) (32.0) 15.5 .1 8 17.5 16.5 16.0 (16.0) 7.9 .2 9 16.0 19.0 16.5 (16.5) 8.2 - 10 12.5 14.5 17.0 (17.0) 7.3 - 11 12.0 13.5 (14.0) (14.0) 6.4 - 12 16.0 13.5 16.0 (16.0) 7.4 - PLOT L-1b(R); 10/7/60 Av. soil moisture in forest, 6.5 inches; in opening, 11.7 inches 2/ 1 25.5 15.0 14.5 (14.0) 8.3 1.5 2 22.0 12.0 12.0 13.0 7.1 1.5 3 18.0 19.0 16.0 (16.0) 10.0 3.2 4 41.0 24.0 30.0 (30.0) 15.0 2.7 5 32.0 27.5 30.0 (30.0) 14.4 0.6 6 51.0 40.5 (28.5) (28.5) 18.3 4.4 7 53.5 (45.5) (32.0) (32.0) 19.6 4.2 8 26.5 16.0 15.0 (15.0) 8.7 1.3 9 16.0 17.5 15.5 (15.5) 7.7 - 10 28.5 17.5 16.0 (16.0) 9.4 2.3 11 16.5 14 0 (14.0) (14.0) 7.4 1.0 12 30.5_ 19.5 16.0 (16.0) 9.8 2.4

62 Table 3. -- (Continued) PLOT L-lb(R); 11/9/60 Soil moisture (percent volume) Soil moisture(inches) Sampling at depth in inches of point 3/ 6 18 30 42 Total 4/ Precip. 5/ 1 25.5 15.0 14.0 (14.0) 8.2 - 2 24.5 12.5 11.5 13.0 7.4 .3 3 22.0 21.0 15.5 (15.5) 8.2 .7 4 42.0 23.5 27.0 (27.0) 14.3 5 33.5 27.5 31.0 (31.0) 14.8 .4 6 46.0 31.0 (31.0) (31.0) 16.7 - 7 Standing water in tube. 8 27.5 15.5 14.5 (14.5) 8.5 .1 9 16 5 17.0 15.0 (15.0) 7.6 - 10 28.5 17.5 16.0 (16.0) 9.4 - 11 16.5 14.0 (14.0) (14.0) 7.0 - 12 30.5 19.5 16.0 (16.0) 9.8 - PLOT L-lb(R); 5/25/61 6/ 1 6/ 2 6/ 3 25.5 6/ 4 6/ 5 6/ 6 49.5 39.5 6/ 7 8 28.0 24.0 25.0 9 17.5 26.5 27.0 10 23.5 24.5 30.0 11 25.5 34.5 12 29.5 26.5 29.5 PLOT L-lb(R); 6/22/61 Av. soil moisture in forest, 12.9 inches; in opening, 14.0 inches 2/ 1 24.0 24.5 25.0 (25.0) 17.3 - 2 17.0 27.0 31.0 32.0 12.9 - 3 13.0 19.5 35.5 (35.5) 12.4 - 4 27.5 22.5 29.5 (33.0) 13.5 - 5 25.0 28.0 34.0 (34.0) 14.5 - 6 36.0 34.0 (34.0) (34.0) 16.5 - 7 36.0 (34.0) (34.0) (34.0) 16.5 - 8 22.0 22.5 21.5 (21.5) 10.5 - 9 21.0 24.5 23.0 (23.0) 11.0 - 10 20.5 21.5 26.0 (26.0) 11.3 - 11 25.5 26.5 (26.5) (26.5) 12.6 - 12 22.5 20.0 25.5 (25.5) 12.0 -

63 Table 3. -- (Continued) PLOT L-lb(R); 7/20/61 Av. soil moisture in forest, 8.2 inches; in opening, 11.5 inches 2/
Soil moisture (percent volume) Soil moisture(inches) Sampling at depth in inches of point 3/ 6 18 30 42 Total 4/ Precip. 5/ 1 21.0 23.0 20.5 (20.5) 10.2 - 2 10.5 15.5 18.0 20.0 7.7 - 3 8.0 18.5 27.5 (27.5) 9.8 - 4 24.0 21.5 28.5 (30.0) 12.5 - 5 22.5 27.0 34.0 (34.0) 14.1 - 6 25.0 31.0 (31.0) (31.0) 14.2 - 7 18.5 (24.0) (24.0) (24.0) 10.9 - 8 17.0 19.5 18.5 (18.5) 8.8 - 9 14.0 20.0 19.5 (19.5) 8.8 - 10 13.5 18.0 21.5 (21.5) 8.9 - 11 9.0 15.5 (15.5) (15.5) 6.7 - 12 11.0 14.5 18 5 (18.5) 7.5 - PLOT L-lb(R); 8/21/61 Av. soil moisture in forest, 6.8 inches; in opening, 10.6 inches 2/ 1 17.0 22.0 18.5 (18.5) 9.1 - 2 9.5 12.0 14.0 14.5 6.0 - 3 6.5 13.0 18.5 (18.5) 6.8 - 4 24.5 21.0 27.0 (28.5) 12.1 - 5 25.0 25.5 32.0 (32.0) 13.7 .3 6 29.0 30.5 (30.5) (30.5) 14.5 .5 7 31.5 (22.0) (22.0) (22.0) 11.7 1.5 8 11.5 16.5 16.0 (16.0) 7.2 - 9 14.0 16.5 17.0 (17.0) 7.7 - 10 11.5 16.0 19.0 (19.0) 7.8 - ll 9.0 13.5 (13.5) (13.5) 5.9 - 12 11.0 13.5 16.5 (16.5) 6.9 - PLOT L-lb(R); l0/2/61 Av. soil moisture in forest, 6.6 inches; in opening, 10.4 inches 2/ 1 21.5 24.0 18.5 (18.5) 9.9 .8 2 11.5 11.0 13.0 13.0 5.8 .2 3 8.0 13.5 17.0 (17.0) 6.7 .3 4 28.5 21.5 28.0 (30.0) 12.5 .4 5 28.5 25.5 32.0 (32.0) 14.2 .8 6 31.0 31.0 (31.0) (31.0) 14.9 .9 7 36.0 (24.0) (24.0) (24.0) 11.0 .8 8 13.0 14.5 14.5 (14.5) 6.8 .2 9 11.0 15.5 15.0 (15.0) 6.8 - 10 16.0 16.0 17.0 (17.0) 7.9 .5 11 9.0 13.5 (13.5) (13.5) 5.9 - 12 12.0 12.5 15.5 (15.5) 6.7 .2

64 Table 3 -- (Continued) PLOT L-1b(T); opening created 1959; 8/9/60 Av. soil moisture in forest, 7.3 inches; in opening, 9.3 inches 2/ Soil moisture (percent volume) Soil moisture(inches) Sampling at depth in inches of point 3/ 6 18 30 42 Total 4/ Precip. 5/ 1 13.0 14.0 16.0 (16.0) 7.1 - 2 19.0 20.0 22.0 (22.0) 10.0 - 3 14.0 16.5 (16.5) (16.5) 7.6 - 4 24.0 19.5 19.0 (19.0) 9.9 - 5 24.0 23.0 22.0 (22.0) 10.9 - 6 22.5 19.0 21.5 (21.5) 10.7 - 7 16.0 17.0 17.0 (17.0) 8.0 - 8 15.5 15.5 16.5 (16.5) 7.7 - 9 12.5 13.5 13.5 13.5 6.3 - 10 10.0 12.5 13.0 13.0 5.8 - 11 9.5 11.5 12.5 13.0 5.6 - PLOT L-1b(T); 9/8/60 Av. soil moisture in forest, 6.8 inches; in opening, 8.8 inches 2/ 1 12.0 13.0 15.0 (15.0) 6.6 - 2 17.0 18.0 19.0 (19.0) 8.7 - 3 15.0 16.0 (16.0) (16.0) 7.6 .2 4 22.5 18.5 17.0 (17.0) 9.0 - 5 24.0 22.5 21.5 (21.5) 10.7 - 6 22.0 19.0 21.5 (21.5) 10.1 - 7 17.5 16.5 16.0 (16.0) 7.9 .2 8 14.0 14.5 15.5 (15.5) 7.1 - 9 12.5 13.5 14.0 13.0 6.3 - 10 11.0 12.0 13.0 13.0 5.9 .1 11 10.0 11.5 12.5 12.5 5.6 .1 PLOT L-1b(T); 10/7/60 Av. soil moisture in forest, 6.7 inches; in opening, 8.8 inches 2/ 1 16.0 13.5 16.0 (16.0) 7.4 .8 2 31.0 18.5 19.0 (19.0) 10.5 1.8 3 31.5 28.0 (20.0) (16.0) 11.8 4.4 4 22.5 18.0 17.0 (17.0) 8.9 - 5 29.0 25.0 24.0 (22.5) 12.0 1.3 6 34.0 23.0 24.5 (23.0) 12.5 2.4 7 26.5 16.0 15.0 (15.0) 8.7 1.2 8 26.0 15.5 15.5 (15.5) 8.8 1.6 9 22.5 22.5 13.5 14.5 8.7 2.4 10 20.5 27.5 24.0 15.5 10.5 4.7 11 22.0 13.0 12.5 12.5 7.2 1.7
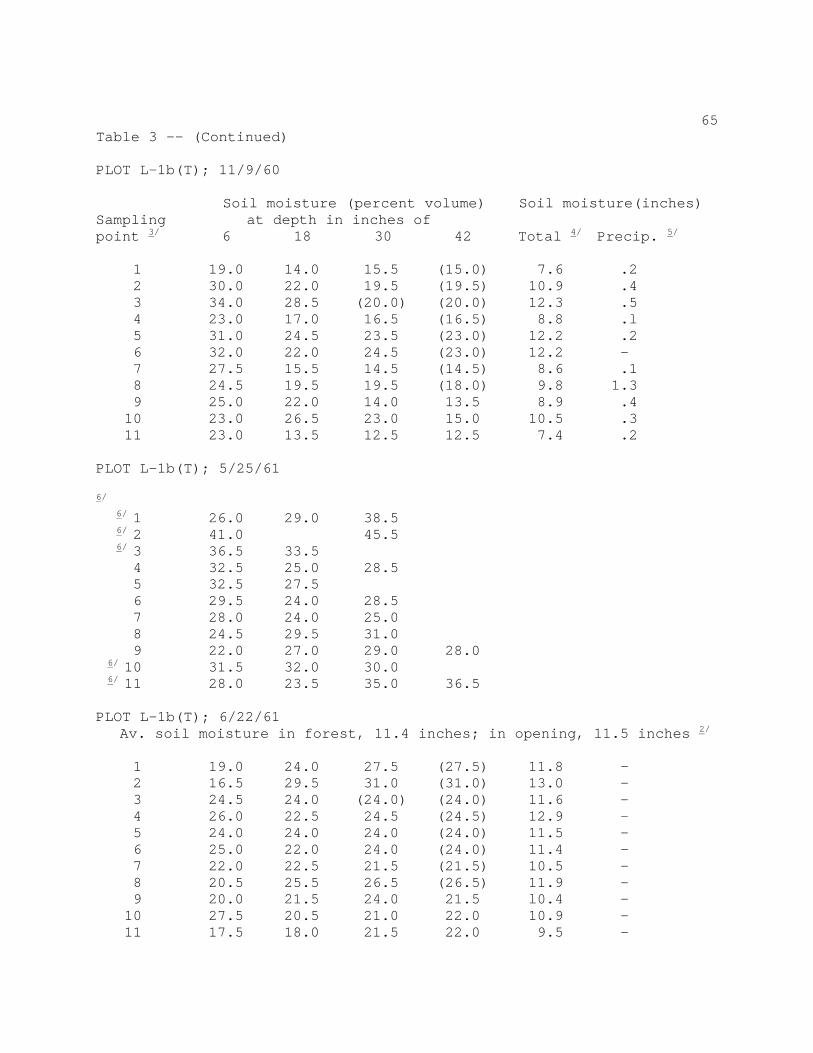
65 Table 3 -- (Continued) PLOT L-1b(T); 11/9/60 Soil moisture (percent volume) Soil moisture(inches) Sampling at depth in inches of point 3/ 6 18 30 42 Total 4/ Precip. 5/ 1 19.0 14.0 15.5 (15.0) 7.6 .2 2 30.0 22.0 19.5 (19.5) 10.9 .4 3 34.0 28.5 (20.0) (20.0) 12.3 .5 4 23.0 17.0 16.5 (16.5) 8.8 .l 5 31.0 24.5 23.5 (23.0) 12.2 .2 6 32.0 22.0 24.5 (23.0) 12.2 - 7 27.5 15.5 14.5 (14.5) 8.6 .1 8 24.5 19.5 19.5 (18.0) 9.8 1.3 9 25.0 22.0 14.0 13.5 8.9 .4 10 23.0 26.5 23.0 15.0 10.5 .3 11 23.0 13.5 12.5 12.5 7.4 .2 PLOT L-1b(T); 5/25/61 6/
6/ 1 26.0 29.0 38.5 6/ 2 41.0 45.5 6/ 3 36.5 33.5 4 32.5 25.0 28.5 5 32.5 27.5 6 29.5 24.0 28.5 7 28.0 24.0 25.0 8 24.5 29.5 31.0 9 22.0 27.0 29.0 28.0 6/ 10 31.5 32.0 30.0 6/ 11 28.0 23.5 35.0 36.5 PLOT L-1b(T); 6/22/61 Av. soil moisture in forest, 11.4 inches; in opening, 11.5 inches 2/ 1 19.0 24.0 27.5 (27.5) 11.8 - 2 16.5 29.5 31.0 (31.0) 13.0 - 3 24.5 24.0 (24.0) (24.0) 11.6 - 4 26.0 22.5 24.5 (24.5) 12.9 - 5 24.0 24.0 24.0 (24.0) 11.5 - 6 25.0 22.0 24.0 (24.0) 11.4 - 7 22.0 22.5 21.5 (21.5) 10.5 - 8 20.5 25.5 26.5 (26.5) 11.9 - 9 20.0 21.5 24.0 21.5 l0.4 - 10 27.5 20.5 21.0 22.0 10.9 - 11 17.5 18.0 21.5 22.0 9.5 -
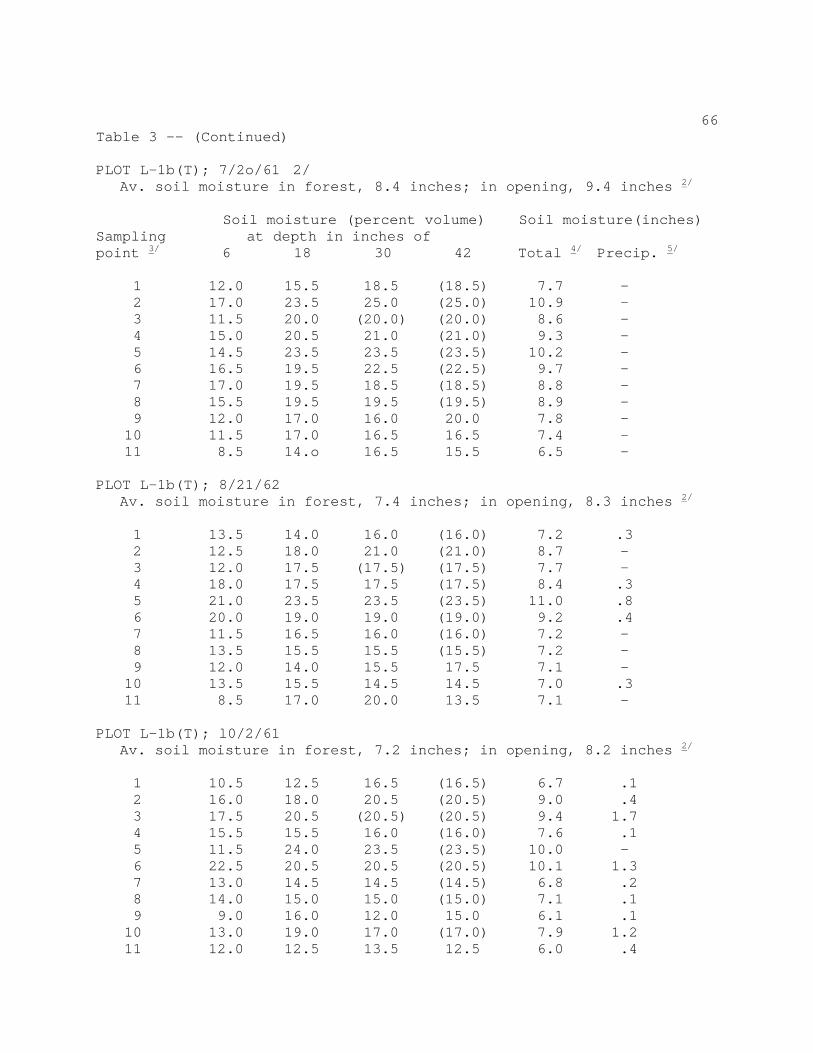
66 Table 3 -- (Continued) PLOT L-1b(T); 7/2o/61 2/ Av. soil moisture in forest, 8.4 inches; in opening, 9.4 inches 2/ Soil moisture (percent volume) Soil moisture(inches) Sampling at depth in inches of point 3/ 6 18 30 42 Total 4/ Precip. 5/ 1 12.0 15.5 18.5 (18.5) 7.7 - 2 17.0 23.5 25.0 (25.0) 10.9 - 3 11.5 20.0 (20.0) (20.0) 8.6 - 4 15.0 20.5 21.0 (21.0) 9.3 - 5 14.5 23.5 23.5 (23.5) 10.2 - 6 16.5 19.5 22.5 (22.5) 9.7 - 7 17.0 19.5 18.5 (18.5) 8.8 - 8 15.5 19.5 19.5 (19.5) 8.9 - 9 12.0 17.0 16.0 20.0 7.8 - 10 11.5 17.0 16.5 16.5 7.4 - 11 8.5 14.o 16.5 15.5 6.5 - PLOT L-1b(T); 8/21/62 Av. soil moisture in forest, 7.4 inches; in opening, 8.3 inches 2/ 1 13.5 14.0 16.0 (16.0) 7.2 .3 2 12.5 18.0 21.0 (21.0) 8.7 - 3 12.0 17.5 (17.5) (17.5) 7.7 - 4 18.0 17.5 17.5 (17.5) 8.4 .3 5 21.0 23.5 23.5 (23.5) 11.0 .8 6 20.0 19.0 19.0 (19.0) 9.2 .4 7 11.5 16.5 16.0 (16.0) 7.2 - 8 13.5 15.5 15.5 (15.5) 7.2 - 9 12.0 14.0 15.5 17.5 7.1 - 10 13.5 15.5 14.5 14.5 7.0 .3 11 8.5 17.0 20.0 13.5 7.1 - PLOT L-1b(T); l0/2/61 Av. soil moisture in forest, 7.2 inches; in opening, 8.2 inches 2/ 1 10.5 12.5 16.5 (16.5) 6.7 .1 2 16.0 18.0 20.5 (20.5) 9.0 .4 3 17.5 20.5 (20.5) (20.5) 9.4 1.7 4 15.5 15.5 16.0 (16.0) 7.6 .1 5 11.5 24.0 23.5 (23.5) 10.0 - 6 22.5 20.5 20.5 (20.5) 10.1 1.3 7 13.0 14.5 14.5 (14.5) 6.8 .2 8 14.0 15.0 15.0 (15.0) 7.1 .1 9 9.0 16.0 12.0 15.0 6.1 .1 10 13.0 19.0 17.0 (17.0) 7.9 1.2 11 12.0 12.5 13.5 12.5 6.0 .4
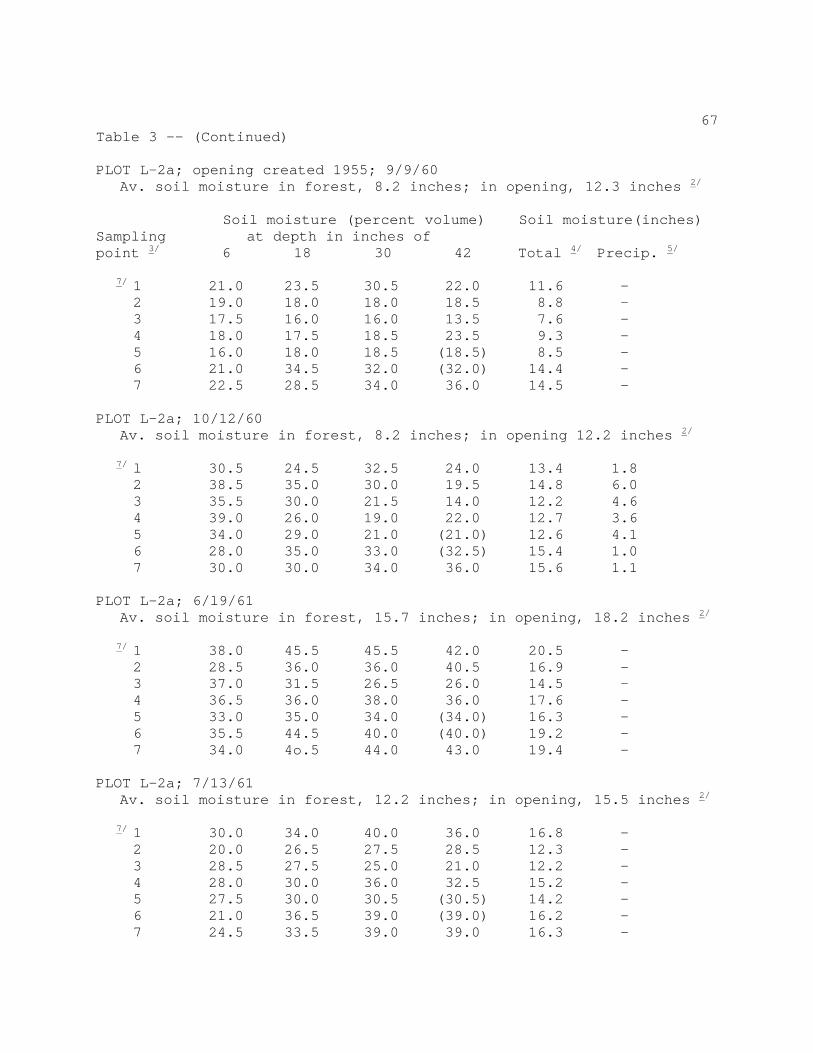
67 Table 3 -- (Continued) PLOT L-2a; opening created 1955; 9/9/60 Av. soil moisture in forest, 8.2 inches; in opening, 12.3 inches 2/ Soil moisture (percent volume) Soil moisture(inches) Sampling at depth in inches of point 3/ 6 18 30 42 Total 4/ Precip. 5/ 7/ 1 21.0 23.5 30.5 22.0 11.6 - 2 19.0 18.0 18.0 18.5 8.8 - 3 17.5 16.0 16.0 13.5 7.6 - 4 18.0 17.5 18.5 23.5 9.3 - 5 16.0 18.0 18.5 (18.5) 8.5 - 6 21.0 34.5 32.0 (32.0) 14.4 - 7 22.5 28.5 34.0 36.0 14.5 - PLOT L-2a; 10/12/60 Av. soil moisture in forest, 8.2 inches; in opening 12.2 inches 2/ 7/ l 30.5 24.5 32.5 24.0 13.4 1.8 2 38.5 35.0 30.0 19.5 14.8 6.0 3 35.5 30.0 21.5 14.0 12.2 4.6 4 39.0 26.0 19.0 22.0 12.7 3.6 5 34.0 29.0 21.0 (21.0) 12.6 4.1 6 28.0 35.0 33.0 (32.5) 15.4 1.0 7 30.0 30.0 34.0 36.0 15.6 1.1 PLOT L-2a; 6/l9/61 Av. soil moisture in forest, 15.7 inches; in opening, 18.2 inches 2/ 7/ 1 38.0 45.5 45.5 42.0 20.5 - 2 28.5 36.0 36.0 40.5 16.9 - 3 37.0 31.5 26.5 26.0 14.5 - 4 36.5 36.0 38.0 36.0 17.6 - 5 33.0 35.0 34.0 (34.0) 16.3 - 6 35.5 44.5 40.0 (40.0) 19.2 - 7 34.0 4o.5 44.0 43.0 19.4 - PLOT L-2a; 7/13/61 Av. soil moisture in forest, 12.2 inches; in opening, 15.5 inches 2/ 7/ 1 30.0 34.0 40.0 36.0 16.8 - 2 20.0 26.5 27.5 28.5 12.3 - 3 28.5 27.5 25.0 21.0 12.2 - 4 28.0 30.0 36.0 32.5 15.2 - 5 27.5 30.0 30.5 (30.5) 14.2 - 6 21.0 36.5 39.0 (39.0) 16.2 - 7 24.5 33.5 39.0 39.0 16.3 -

68 Table 3 -- (Continued) PLOT L-2a; 8/l0/61 Av. soil moisture in forest, 9.7 inches; in opening, 13.0 inches 2/ Soil moisture (percent volume) Soil moisture(inches) Sampling at depth in inches of point 3/ 6 18 30 42 Total 4/ Precip. 5/ 7/ 1 22.5 28.0 35.5 28.0 13.7 - 2 18.5 21.0 21.5 21.0 9.8 - 3 23.0 20.5 18.0 18.5 9.6 - 4 19.5 24.0 29.0 30.0 12.3 - 5 19.5 23.5 24.0 (24.0) 11.0 - 6 17.0 33.0 35.0 (35.0) 14.4 - 7 16.5 28.5 37.0 37.0 13.7 - PLOT L-2a; 10/2/61 Av. soil moisture in forest, 8.8 inches; in opening, 11.7 inches 2/ 7/ 1 23.0 25.0 32.0 23.0 12.4 - 2 18.0 21.0 19.5 18.5 9.2 - 3 23.0 17.5 15.5 14.5 8.3 - 4 17.5 18.5 20.5 21.5 9.4 - 5 21.0 20.0 18.0 (18.0) 9.2 .1 6 18.0 26.0 33.0 (33.0) 13.2 .1 7 17.5 27.5 34.0 35.0 13.7 .1 PLOT L-2b; opening created 1955; 9/12/60 Av. soil moisture in forest, 9.6 inches; in opening, 12.1 inches 2/ 1 24.0 20.5 28.5 (28.5) 12.2 .6 2 17.0 15.5 20.5 (20.5) 8.8 .2 3 25.0 20.5 20.5 (20.5) l0.4 .6 4 19.0 23.5 20.5 20.5 10.0 - 5 29.5 29.5 21.5 24.0 12.5 - 6 20.5 24.0 26.0 37.5 13.0 - 7 16.5 23.5 27.5 32.0 12.0 - PLOT L-2b; l0/12/60 Av. soil moisture in forest, 9.6 inches; in opening, 12.0 inches 2/ 1 31.5 20.5 29.0 (29.0) 13.2 1.6 2 28.5 16.5 20.5 (20.5) 10.3 1.7 3 22.5 20.5 22.0 (21.0) 10.3 .5 4 26.0 32.0 21.5 20.5 12.0 2.0 5 30.0 33.0 23.0 24.0 13.2 .7 6 29.5 25.5 26.5 39.0 14.4 1.4 7 26.0 25.0 27.O 32.5 13.2 1.3

69 Table 3 -- (Continued) PLOT L-2b; 6/19/61 Av. soil moisture in forest, --; in opening, 16.9 inches 2/ Soil moisture (percent volume) Soil moisture(inches) Sampling at depth in inches of point 3/ 6 18 30 42 Total 4/ Precip. 5/ 6/ 1 6/ 2 48.0 3 30.0 34.0 40.0 (40.0) 17.3 - 4 31.0 41.0 44.5 44.5 19.3 - 5 33.0 34.5 24.0 35.5 15.2 - 6 32.0 34.0 34.0 45.5 17.4 - 7 26.5 31.5 33.5 44.5 16.3 - PLOT L-2b; 7/13/61 Av. soil moisture in forest, 15.6 inches; in opening, 15.0 inches 2/ 1 30.5 29.0 37.5 (37.5) 16.1 - 2 26.5 29.5 37.0 (37.0) 15.6 - 3 28.0 29.5 35.0 (35.0) 15.3 - 4 29.5 40.5 40.5 40.5 18.2 - 5 29.0 34.0 23.5 29.5 13.9 - 6 24.5 30.5 31.0 43.5 15.6 - 7 14.0 28.0 31.0 37.5 13.3 - PLOT L-2b; 8/l0/61 Av. soil moisture in forest, 13.8 inches; in opening, 13.7 inches 2/ 1 23.5 21.5 33.5 (33.5) 13.4 - 2 21.5 25.5 33.5 (33.5) 13.7 - 3 25.5 29.0 33.0 (33.0) 14.5 - 4 27.5 37.0 40.5 38.0 17.2 - 5 26.5 30.0 21.5 31.5 13.5 - 6 18.0 26.5 30.0 42.5 14.0 - 7 11.0 21.5 28.0 34.5 11.4 - PMT L-2b; 10/2/61 Av. soil moisture in forest, 11.4 inches; in opening, 12.6 inches 2/ 1 17.0 18.5 27.5 (27.5) 10.9 - 2 19.5 18.5 24.0 (24.0) 10.3 - 3 25.0 28.0 32.0 (32.0) 14.1 - 4 28.5 35.5 36.5 37.5 16.6 .1 5 27.5 29.5 22.5 24.5 12.5 .1 6 17.5 21.0 26.5 39.0 12.5 - 7 12.0 20.0 25.0 30.0 10.4 .1
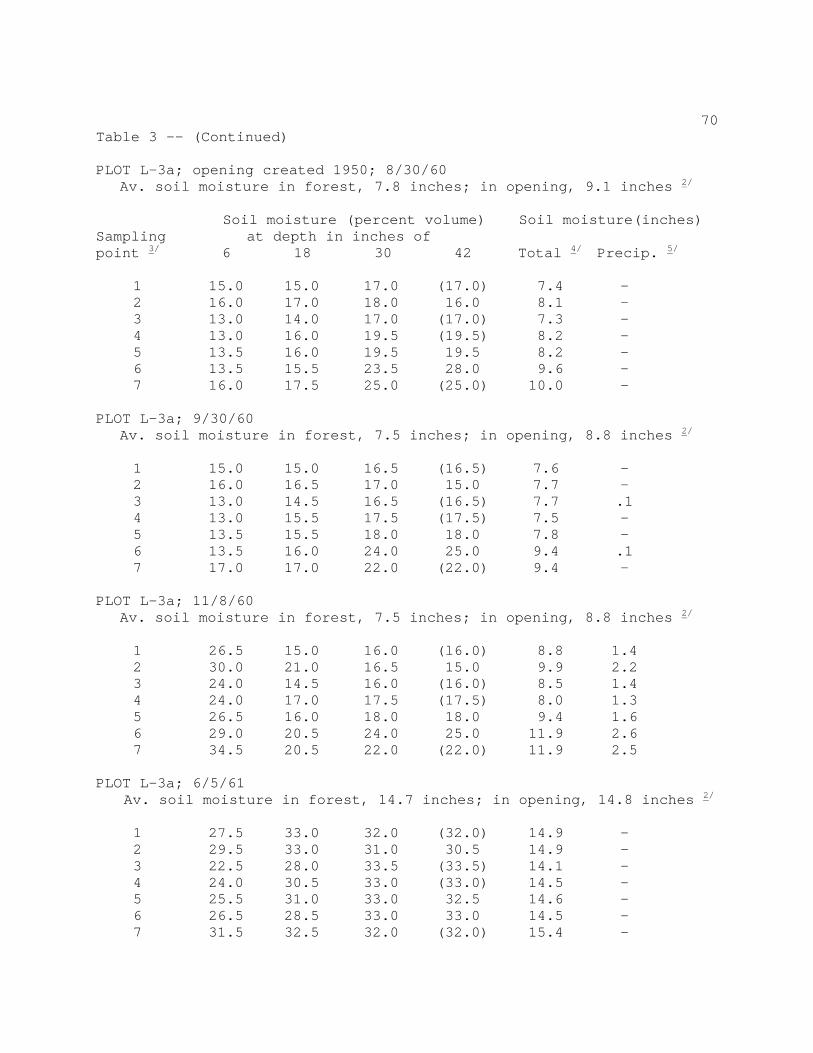
70 Table 3 -- (Continued) PLOT L-3a; opening created 1950; 8/30/60 Av. soil moisture in forest, 7.8 inches; in opening, 9.1 inches 2/ Soil moisture (percent volume) Soil moisture(inches) Sampling at depth in inches of point 3/ 6 18 30 42 Total 4/ Precip. 5/ 1 15.0 15.0 17.0 (17.0) 7.4 - 2 16.0 17.0 18.0 16.0 8.1 - 3 13.0 14.0 17.0 (17.0) 7.3 - 4 13.0 16.0 19.5 (19.5) 8.2 - 5 13.5 16.0 19.5 19.5 8.2 - 6 13.5 15.5 23.5 28.0 9.6 - 7 16.0 17.5 25.0 (25.0) 10.0 - PLOT L-3a; 9/30/60 Av. soil moisture in forest, 7.5 inches; in opening, 8.8 inches 2/ 1 15.0 15.0 16.5 (16.5) 7.6 - 2 16.0 16.5 17.0 15.0 7.7 - 3 13.0 14.5 16.5 (16.5) 7.7 .1 4 13.0 15.5 17.5 (17.5) 7.5 - 5 13.5 15.5 18.0 18.0 7.8 - 6 13.5 16.0 24.0 25.0 9.4 .1 7 17.0 17.0 22.0 (22.0) 9.4 - PLOT L-3a; 11/8/60 Av. soil moisture in forest, 7.5 inches; in opening, 8.8 inches 2/ 1 26.5 15.0 16.0 (l6.0) 8.8 1.4 2 30.0 21.0 16.5 15.0 9.9 2.2 3 24.0 14.5 16.0 (16.0) 8.5 1.4 4 24.0 17.0 17.5 (17.5) 8.0 1.3 5 26.5 16.0 18.0 18.0 9.4 1.6 6 29.0 20.5 24.0 25.0 11.9 2.6 7 34.5 20.5 22.0 (22.0) 11.9 2.5 PLOT L-3a; 6/5/61 Av. soil moisture in forest, 14.7 inches; in opening, 14.8 inches 2/ 1 27.5 33.0 32.0 (32.0) 14.9 - 2 29.5 33.0 31.0 30.5 14.9 - 3 22.5 28.0 33.5 (33.5) 14.1 - 4 24.0 30.5 33.0 (33.0) 14.5 - 5 25.5 31.0 33.0 32.5 14.6 - 6 26.5 28.5 33.0 33.0 14.5 - 7 31.5 32.5 32.0 (32.0) 15.4 -

71 Table 3 -- (Continued) PLOT L-3a; 7/5/61 Av. soil moisture in forest, 10.4 inches; in opening, 11.0 inches 2/ Soil moisture (percent volume) Soil moisture(inches) Sampling at depth in inches of point 3/ 6 18 30 42 Total 4/ Precip. 5/ 1 15.5 21.0 22.5 (22.5) 10.7 - 2 18.5 22.5 25.0 24.0 l0.8 - 3 11.5 19.5 23.0 (23.0) 9.3 - 4 17.0 24.0 25.5 (25.5) 11.1 - 5 16.0 23.5 26.5 27.5 11.2 - 6 16.0 12.5 29.5 30.0 10.6 - 7 21.0 24.0 26.5 (26.5) 11.8 - PLOT L-3a; 7/27/61 Av. soil moisture in forest, 7.9 inches; in opening, 9.2 inches 2/ 1 11.5 16.5 18.0 (18.0) 7.7 - 2 13.0 17.5 20.0 18.5 8.3 - 3 9.5 15.5 18.5 (18.5) 7.4 - 4 12.5 19.5 21.5 (21.5) 9.0 - 5 14.5 18.0 21.5 23.0 9.3 - 6 11.0 17.0 25.5 25.5 9.5 - 7 14.0 19.5 22.0 (22.0) 9.3 - PLOT L-3a; 9/5/61 Av. soil moisture in forest, 7.4 inches; in opening, 8.6 inches 2/ 1 12.5 15.0 16.5 (16.5) 7.2 .1 2 18.5 19.5 17.0 15.5 8.4 .8 3 10.5 15.5 17.0 (17.0) 7.2 .1 4 12.0 18.5 19.0 (19.0) 8.2 - 5 13.5 16.5 18.0 19.0 8.1 - 6 15.0 16.0 23.5 23.5 9.4 .5 7 18.0 18.0 20.0 (20.0) 9.1 .5 PLOT L-3b; opening created 1950; 8/31/60 Av. soil moisture in forest, 7.1 inches; in opening, 7.2 inches 2/ 1 12.0 15.0 16.5 (16.5) 7.2 - 2 11.0 14.0 17.5 (17.5) 7.2 - 3 11.0 14.5 16.0 (16.0) 6.9 - 8/ 4 5 13.5 17.5 23.0 (23.0) 9.2 - 6 13.0 14.5 12.5 14.0 6.5 - 7 10.5 13.5 15.5 (15.5) 6.6 -

72 Table 3 -- (Continued) PLOT L-3b; 9/30/60 Av. soil moisture in forest, 7.0 inches; in opening, 7.1 inches 2/ Soil moisture (percent volume) Soil moisture(inches) Sampling at depth in inches of point 3/ 6 18 30 42 Total 4/ Precip. 5/ 1 12.5 14.5 16.0 (16.0) 7.1 .1 2 11.0 14.5 17.5 (17.5) 7.3 .1 3 10.5 14.0 16.0 (16.0) 6.8 - 8/ 4 5 13.0 18.0 22.0 (22.0) 9.0 .1 6 13.5 14.0 13.0 14.0 6.5 .1 7 11.0 13.5 15.0 (15.0) 6.5 - PLOT L-3b; 11/8/60 Av. soil moisture in forest, 7.0 inches; in opening, 7.1 inches 2/ 1 26.0 22.5 16.5 (16.5) 9.8 2.8 2 25.0 20.0 17.5 (17.5) 9.6 2.4 3 25.0 14.5 16.0 (16.0) 8.6 1.8 8/ 4 5 37.0 21.5 22.5 (22.5) 12.5 3.6 6 31.0 13.5 12.5 14.0 8.5 2.1 7 24.5 14.0 15.0 (15.0) 8.2 1.7 PLOT L-3b; 6/5/61 Av. soil moisture in forest, 12.9 inches; in opening, 14.4 inches 2/ 1 29.0 27.0 26.0 (26.0) 13.0 - 2 22.5 27.5 27.5 (27.5) 12.6 - 3 25.0 26.5 29.0 (29.0) 13.2 - 8/ 4 5 30.0 29.0 27.0 (27.0) 13.6 - 6 32.5 40.5 33.5 25.0 15.8 - 7 25.5 30.5 29.5 (29.5) 13.8 - PLOT L-3b; 7/5/61 Av. soil moisture in forest, 8.5 inches; in opening, 10.0 inches 2/ 1 15.0 17.5 19.5 (19.5) 8.6 - 2 12.0 18.5 20.5 (20.5) 8.6 - 3 11.5 16.5 19.5 (19.5) 8.0 - 8/ 4 5 19.5 25.5 24.5 (24.5) 11.3 - 6 18.0 22.0 20.0 20.0 9.6 - 7 17.0 22.5 23.5 (23.5) l0.4 -
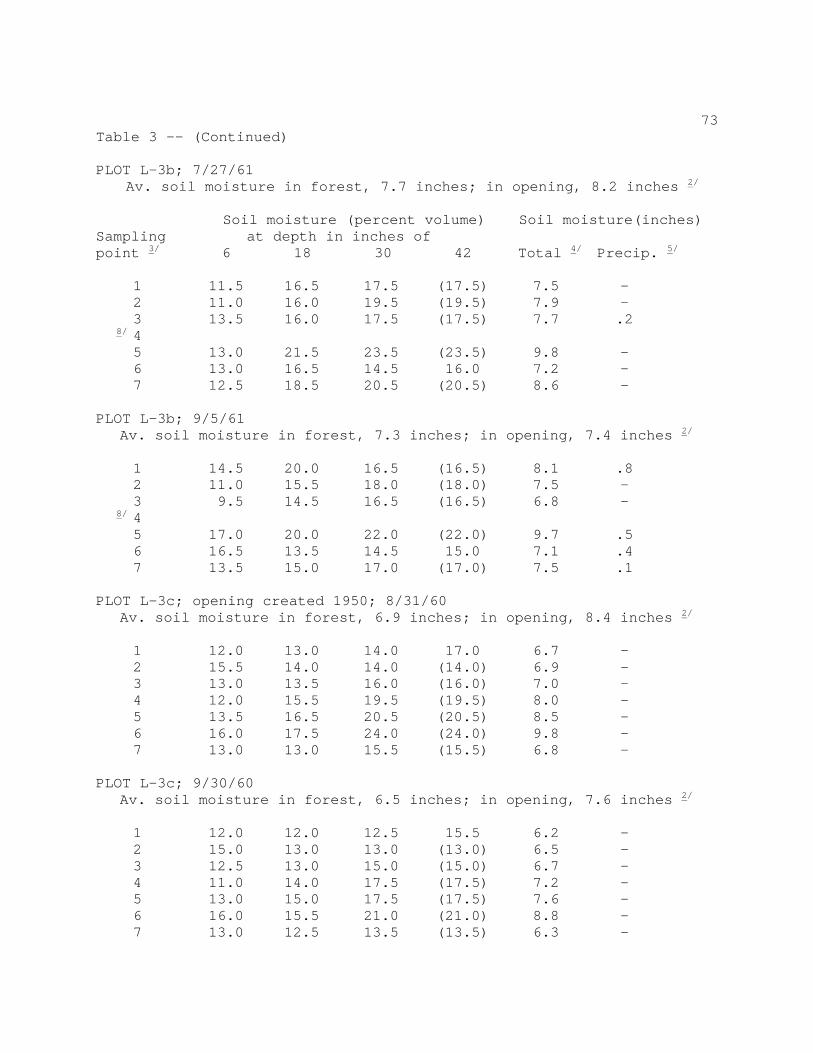
73 Table 3 -- (Continued) PLOT L-3b; 7/27/61 Av. soil moisture in forest, 7.7 inches; in opening, 8.2 inches 2/ Soil moisture (percent volume) Soil moisture(inches) Sampling at depth in inches of point 3/ 6 18 30 42 Total 4/ Precip. 5/ 1 11.5 16.5 17.5 (17.5) 7.5 - 2 11.0 16.0 19.5 (19.5) 7.9 - 3 13.5 16.0 17.5 (17.5) 7.7 .2 8/ 4 5 13.0 21.5 23.5 (23.5) 9.8 - 6 13.0 16.5 14.5 16.0 7.2 - 7 12.5 18.5 20.5 (20.5) 8.6 - PLOT L-3b; 9/5/61 Av. soil moisture in forest, 7.3 inches; in opening, 7.4 inches 2/ 1 14.5 20.0 16.5 (16.5) 8.1 .8 2 11.0 15.5 18.0 (18.0) 7.5 - 3 9.5 14.5 16.5 (16.5) 6.8 - 8/ 4 5 17.0 20.0 22.0 (22.0) 9.7 .5 6 16.5 13.5 14.5 15.0 7.1 .4 7 13.5 15.0 17.0 (17.0) 7.5 .1 PLOT L-3c; opening created 1950; 8/31/60 Av. soil moisture in forest, 6.9 inches; in opening, 8.4 inches 2/ 1 12.0 13.0 14.0 17.0 6.7 - 2 15.5 14.0 14.0 (14.0) 6.9 - 3 13.0 13.5 16.0 (16.0) 7.0 - 4 12.0 15.5 19.5 (19.5) 8.0 - 5 13.5 16.5 20.5 (20.5) 8.5 - 6 16.0 17.5 24.0 (24.0) 9.8 - 7 13.0 13.0 15.5 (15.5) 6.8 - PLOT L-3c; 9/30/60 Av. soil moisture in forest, 6.5 inches; in opening, 7.6 inches 2/ 1 12.0 12.0 12.5 15.5 6.2 - 2 15.0 13.0 13.0 (13.0) 6.5 - 3 12.5 13.0 15.0 (15.0) 6.7 - 4 11.0 14.0 17.5 (17.5) 7.2 - 5 13.0 15.0 17.5 (17.5) 7.6 - 6 16.0 15.5 21.0 (21.0) 8.8 - 7 13.0 12.5 13.5 (13.5) 6.3 -

74 Table 3 -- (Continued) PLOT L-3c; 11/8/60 Av. soil moisture in forest, 6.4 inches; in opening, 7.6 inches 2/ Soil moisture (percent volume) Soil moisture(inches) Sampling at depth in inches of point 3/ 6 18 30 42 Total 4/ Precip. 5/ 1 22.5 13.0 12.5 15.5 7.6 1.4 2 25.0 12.5 13.0 (13.0) 7.8 1.4 3 27.5 20.0 14.0 (14.0) 9.2 2.8 4 27.0 13.5 17.0 (17.0) 8.9 1.9 5 28.0 14.5 17.0 (17 0) 9.2 1.8 6 31.5 21.5 21.5 (21.5) 11.5 2.7 7 32.5 14.0 13.5 (13.5) 8.8 2.5 PLOT L-3c; 6/5/61 Av. soil moisture in forest, 16.4 inches; in opening, 16.5 inches 2/ 1 27.0 34.0 37.0 39.5 16.5 - 2 31.0 36.5 33.5 (33.5) 16.1 - 3 28.5 36.5 37.0 (37.0) 16.7 - 4 30.5 37.0 40.0 (40.0) 18.1 - 5 29.5 35.5 39.5 (39.5) 17.3 - 6 33.0 33.5 35.0 (35.0) 16.4 - 7 32.0 28.5 34.0 (34.0) 15.4 - PLOT L-3c; 7/6/61 Av. soil moisture in forest, 10.4 inches; in opening, 12.6 inches 2/ 1 13.5 23.5 26.5 28.0 11.0 - 2 15.0 21.0 23.0 (23.0) 9.8 - 3 15.0 23.5 27.0 (27.0) 11.1 - 4 19.5 27.0 28.5 (28.5) 12.5 - 5 17.0 28.5 30.0 (30.0) 12.7 - 6 17.0 25.5 29.0 (29.0) 12.1 - 7 20.5 22.5 25.0 (25.0) 11.1 - PLOT L-3c; 7/27/61 Av. soil moisture in forest, 7.6 inches; in opening, 10.1 inches 2/ 1 12.5 13.5 18.0 18.0 7.4 - 2 12.5 13.5 24.5 (24.5) 7.4 - 3 12.0 16.0 19.5 (19.5) 8.0 - 4 15.0 19.0 23.5 (23.5) 9.7 - 5 14.0 21.0 25.5 (25.5) 10.3 - 6 16.5 25.5 29.0 (29.0) l0.8 - 7 14.5 20.0 24.5 (24.5) 10.0 -

75 Table 3 -- (Continued) PLOT L-3c; 9/5/61 Av. soil moisture in forest, 6.2 inches; in opening, 7.4 inches 2/ Soil moisture (percent volume) Soil moisture(inches) Sampling at depth in inches of point 3/ 6 18 30 42 Total 4/ Precip. 5/ 1 10.0 12.0 13.0 15.5 6.0 - 2 12.5 13.5 14.0 (14.0) 6.5 - 3 9.0 12.5 14.0 (14.0) 6.0 - 4 11.5 14.5 17.0 (17.0) 7.2 - 5 12.0 15.0 18.0 (18.0) 7.6 - 6 15.0 16.5 18.5 (18.5) 8.2 - 7 13.5 14.0 13.5 (13.5) 6.5 - PLOT L-4a; opening created 1948; 8/31/60 Av. soil moisture in forest, 6.6 inches; in opening, 6.5 inches 2/ 1 9.5 12.5 13.5 (13.5) 5.9 - 2 12.5 14.0 14.5 (14.5) 6.7 - 3 14.0 14.5 14.5 (14.5) 6.9 - 4 12.5 12.5 14.0 (14.0) 6.4 - 5 10.5 13.0 13.5 13.5 6.1 - 6 15.0 14.5 15.5 (15.5) 7.2 - PLOT L-4a; 9/30/60 Av. soil moisture in forest, 6.2 inches; in opening, 6.4 inches 2/ 1 9.0 12.0 13.0 (13.0) 5.6 - 2 12.0 13.5 14.5 (14.5) 6.5 - 3 13.0 13.5 13.5 (13.5) 6.4 - 4 12.5 12.5 13.0 (13.0) 6.1 - 5 10.5 13.5 13.0 13.0 6.0 .1 6 15.0 14.0 15.5 (15.5) 7.2 - PLOT L-4a; 11/8/60 Av. soil moisture in forest, 6.2 inches; in opening, 6.4 inches 2/ 1 14.0 16.0 12.5 (12.5) 6.6 1.1 2 19.5 13.5 14.0 (14.0) 7.3 .9 3 28.0 14.5 13.5 (13.5) 8.3 1.9 4 27.0 12.5 13.5 (13.5) 8.0 1.9 5 23.0 13.5 13.0 13.0 7.5 1.6 6 31.5 14.0 15.5 (15.5) 9.2 2.0

76 Table 3 -- (Continued) PLOT L-4a; 6/5/61 Av. soil moisture in forest, 12.6 inches; in opening, 15.2 inches 2/ Soil moisture (percent volume) Soil moisture(inches) Sampling at depth in inches of point 3/ 6 18 30 42 Total 4/ Precip. 5/ 1 20.0 29.5 32.5 (32.5) 11.3 - 2 18.5 28.5 28.0 (28.0) 12.4 - 3 29.0 31.0 30.0 (30.0) 14.4 - 4 28.5 29.0 33.0 (33.0) 14.8 - 5 28.0 35.0 33.5 38.0 16.1 - 6 38.0 28.5 27.5 (27.5) 14.6 - PLOT L-4a; 7/6/61 Av. soil moisture in forest, 10.5 inches; in opening, -- 2/ 1 22.0 23.5 27.0 (27.0) 11.9 - 2 19.0 22.0 22.0 (22.0) 11.2 - 3 8.5 19.5 18.5 (18.5) 7.8 - 4 14.0 23.0 23.0 (23.0) 10.0 - 9/ 5 17.5 25.0 25.5 30.0 11.8 - 6 PLOT L-4a; 7/27/61 Av. soil moisture in forest, 7.3 inches; in opening, 8.3 inches 2/ 1 10.5 17.0 16.0 (16.0) 7.2 - 2 12.5 15.5 16.5 (16.5) 7.3 - 3 15.0 16.0 15.5 (15.5) 7.4 - 4 12.0 17.0 18.5 (18.5) 7.9 - 5 12.5 18.5 20.0 19.5 8.4 - 6 16.0 20.5 20.5 (20.5) 9.3 - PLOT L-4a; 9/5/61 Av. soil moisture in forest, 6.2 inches; in opening, 6.3 inches 2/ 1 8.5 13.5 13.5 (13.5) 5.9 - 2 11.0 13.0 14.5 (14.5) 6.3 - 3 10.5 13.5 14.0 (14.0) 6.2 - 4 9.0 13.0 14.0 (14.0) 6.0 - 5 11.0 13.5 12.5 14.0 6.1 - 6 12.5 14.5 16.0 (16.0) 7.1 -

77 Table 3 -- (Continued) PLOT L-5a; opening created 1949; 8/10/60 Av. soil moisture in forest, 7.6 inches; in opening, 9.3 inches 2/ Soil moisture (percent volume) Soil moisture(inches) Sampling at depth in inches of point 3/ 6 18 30 42 Total 4/ Precip. 5/ 1 12.0 12.5 13.5 16.0 6.5 - 2 19.5 15.0 15.0 24.0 8.8 - 10/ 3 16.0 20.0 28.0 30.0 11.3 - 11/ 4 12.5 23.5 32.0 29.5 11.7 - 5 12.5 17.0 19.5 28.5 9.3 - 6 11.0 16.5 25.0 (25.0) 9.4 - 7 12.0 18.5 20.0 23.0 8.9 - PLOT L-5a; 8/30/60 Av. soil moisture in forest, 6.3 inches; in opening, 7.6 inches 2/ 1 10.0 10.5 11.5 14.5 5.6 - 2 16.0 12.0 11.0 19.5 7.0 - 10/ 3 13.0 17.5 25.0 27.0 9.9 - 11/ 4 11.0 21.5 30.0 29.0 11.0 - 5 10.5 13.0 16.5 27.5 8.1 - 6 10.0 13.0 22.5 (22.5) 8.2 - 7 10.5 10.5 14.5 19.0 6.5 - PLOT L-5a; 9/12/60 Av. soil moisture in forest, 6.0 inches; in opening, 7.4 inches 2/ 1 9.0 10.5 11.5 14.5 5.5 - 2 14.0 11.5 11.0 18.5 6.6 - 10/ 3 13.0 16.0 24.5 26.5 9.6 - 11/ 4 12.0 21.5 28.0 30.0 11.0 .1 5 11.0 12.5 16.5 27.5 8.1 .1 6 11.0 13.0 23.0 (22.5) 8.3 .1 7 11.0 13.0 14.0 17.0 6.6 .4 PLOT L-5a; 10/17/60 Av. soil moisture in forest, 6.0 inches; in opening, 7.1 inches 2/ 1 10.5 10.5 11.5 14.5 5.7 .2 2 18.0 12.0 11.0 16.5 6.9 .5 10/ 3 22.0 15.5 24.5 25.5 10.5 1.1 11/ 4 19.0 22.5 28.5 29.0 11.9 1.2 5 19.5 13.0 16.0 26.0 8.9 1.1 6 24.0 13.5 21.5 (21.5) 9.6 1.7 7 22.0 13.0 13.0 14.5 7.5 1.7
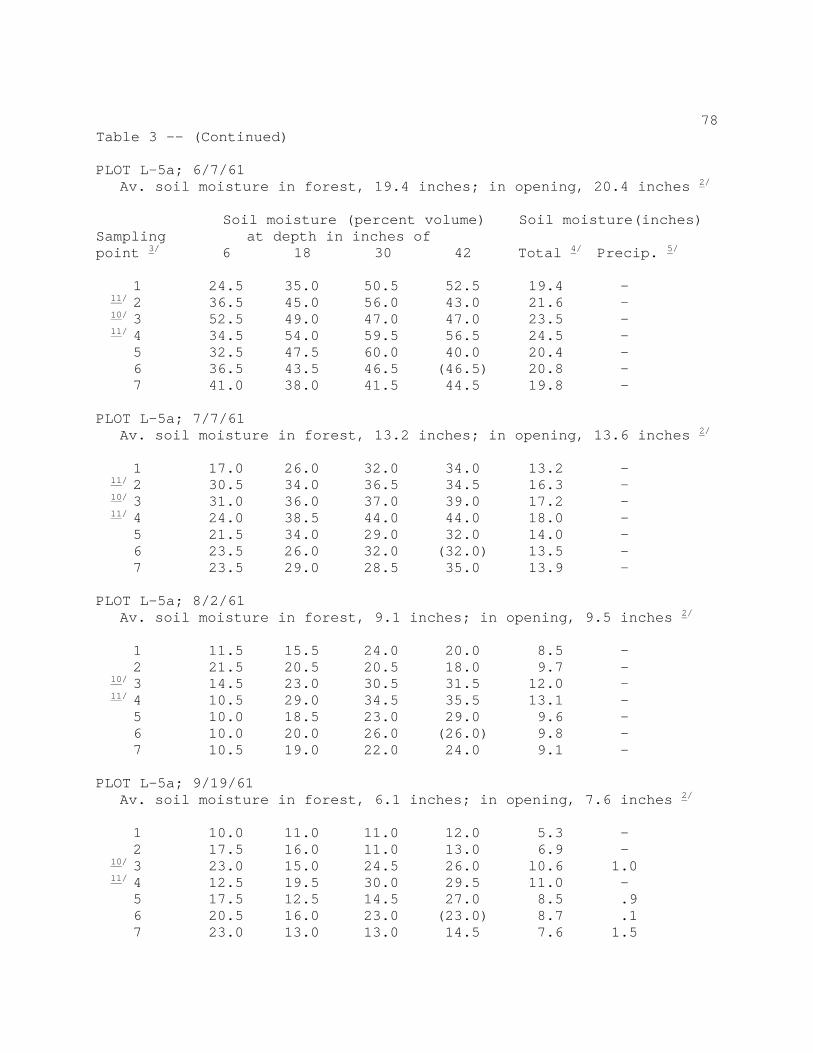
78 Table 3 -- (Continued) PLOT L-5a; 6/7/61 Av. soil moisture in forest, 19.4 inches; in opening, 20.4 inches 2/ Soil moisture (percent volume) Soil moisture(inches) Sampling at depth in inches of point 3/ 6 18 30 42 Total 4/ Precip. 5/ 1 24.5 35.0 50.5 52.5 19.4 - 11/ 2 36.5 45.0 56.0 43.0 21.6 - 10/ 3 52.5 49.0 47.0 47.0 23.5 - 11/ 4 34.5 54.0 59.5 56.5 24.5 - 5 32.5 47.5 60.0 40.0 20.4 - 6 36.5 43.5 46.5 (46.5) 20.8 - 7 41.0 38.0 41.5 44.5 19.8 - PLOT L-5a; 7/7/61 Av. soil moisture in forest, 13.2 inches; in opening, 13.6 inches 2/ 1 17.0 26.0 32.0 34.0 13.2 - 11/ 2 30.5 34.0 36.5 34.5 16.3 - 10/ 3 31.0 36.0 37.0 39.0 17.2 - 11/ 4 24.0 38.5 44.0 44.0 18.0 - 5 21.5 34.0 29.0 32.0 14.0 - 6 23.5 26.0 32.0 (32.0) 13.5 - 7 23.5 29.0 28.5 35.0 13.9 - PLOT L-5a; 8/2/61 Av. soil moisture in forest, 9.1 inches; in opening, 9.5 inches 2/ 1 11.5 15.5 24.0 20.0 8.5 - 2 21.5 20.5 20.5 18.0 9.7 - 10/ 3 14.5 23.0 30.5 31.5 12.0 - 11/ 4 10.5 29.0 34.5 35.5 13.1 - 5 10.0 18.5 23.0 29.0 9.6 - 6 10.0 20.0 26.0 (26.0) 9.8 - 7 10.5 19.0 22.0 24.0 9.1 - PLOT L-5a; 9/19/61 Av. soil moisture in forest, 6.1 inches; in opening, 7.6 inches 2/ 1 10.0 11.0 11.0 12.0 5.3 - 2 17.5 16.0 11.0 13.0 6.9 - 10/ 3 23.0 15.0 24.5 26.0 l0.6 1.0 11/ 4 12.5 19.5 30.0 29.5 11.0 - 5 17.5 12.5 14.5 27.0 8.5 .9 6 20.5 16.0 23.0 (23.0) 8.7 .1 7 23.0 13.0 13.0 14.5 7.6 1.5

79 Table 3. -- Footnotes 1/ Data estimated owing to shallow depth of sampling point and is a projection of the soil moisture measurement at the greatest depth attained at that point. 2/ Average soil moisture in the forested portions of the plot and in the opening, computed on the basis of a 4-foot soil depth, adjusted for precipitation, and weighted for equal distance sampling. 3/ Points 1 and 2 are located within the forest; all subsequent points are located within the opening, except that if a plot contains more than eight sampling points, the first two points (points 1 and 2) and the last two points listed are located within the forest and the intermediate points are located within the opening. 4/ Total of soil water present in the 4-foot soil at the point sampled and on the date measured. Computed from the mean of four 1foot increments times 48 inches. 5/ Soil moisture increase since the previous measurement owing to precipitation, surface runoff and ponding. 6/ Measurement made while the soil was above field capacity owing to snow being present on the plot. 7/ Point eliminated from analysis owing to effect of adjacent tree stump and large roots upon the neutron count. 8/ Point eliminated owing to position in road. 9/ Point not measured at this date. 10/ Point eliminated from analysis owing to surface and subsurface drainage. 11/ Point eliminated from analysis due to the effect of point (see footnote 10/).